The Olympic Winter Games in numbers – September 2017 Library/OlympicOrg... · 4.5 Food and...
86
The Olympic Winter Games in numbers – September 2017 Vancouver 2010, Sochi 2014 and PyeongChang 2018
Transcript of The Olympic Winter Games in numbers – September 2017 Library/OlympicOrg... · 4.5 Food and...

The Olympic Winter Games in numbers – September 2017
Vancouver 2010, Sochi 2014 and PyeongChang 2018

Contents
1 Introduction 3
2 Scale data 82.1 Stakeholders 92.2 Sport programme 122.3 Competition venues 132.4 Training venues 172.5 Key non-competition venues 18
3 Commercial revenues 263.1 Domestic sponsorship 273.2 Ticketing 273.3 Licensing (including merchandise,
coins and philately) 27
4 Cost drivers 294.1 Accommodation 304.2 Ceremonies 324.3 Energy 334.4 Finance 414.5 Food and beverage 424.6 Medical services 444.7 Olympic Torch Relay 464.8 People management 474.9 Technology 514.10 Test events management 574.11 Transport 594.12 Venue development and
general infrastructure 624.13 Venue management 64
Annexes 67Annex I: Vancouver 2010 budget 68Annex II: 2024 budget template 79Annex III: Sources 81Annex IV: Acronyms 82
Image credits 84
2
The Olympic Winter Games in numbers – September 2017
Content

1 Introduction Successful Olympic Games start with a vision focused on how the Games could advance local and regional development goals. Developing the right vision requires creative thinking, consensus building and big ideas. Reliable information can help transform those ideas into action that delivers desired outcomes. This document is intended to contribute to that process.
The information presented here has been compiled from previous Olympic Winter Games to help cities make informed decisions about the costs and benefits of hosting future Games. It offers data on key cost and revenue drivers at the two most recent Olympic Games (Vancouver 2010, Sochi 2014) and the forthcoming Games in PyeongChang 2018, as well as information on the number of venues and other factors that offer insights on Games requirements.
The data can be used to complement feasibility studies and to support the development of realistic Games operations budgets. However, it is important to bear in mind the local context in considering past experiences in other cities. There is no one-size-fits-all template for the Olympic Games. Cities should view the Games through their own unique context and develop plans that address local and regional needs. The International Olympic Committee (IOC) offers assistance at every stage to assist the organisation of Games that benefit local communities.
This document provides a snapshot of three very different cities that delivered Games that reflected their starting points and their goals.
Vancouver started its Olympic Games planning with several existing venues and a well-established ski resort in nearby Whistler. Sochi pursued a vision to transform a summer resort city into a year-round tourist destination with new world-class winter sports facilities. PyeongChang, now in the final stages of preparation, is also creating a new winter sport destination in its own unique context.
The Olympic Winter Games in numbers – September 2017
31 Introduction

Other important factors that all cities should consider in the local context include labour and construction costs; the availability of winter sports expertise; and the vibrancy of the domestic commercial sports market.
Changes in society and within the Olympic Movement will also have an impact on costs and revenue for future Games.
By almost any measure, the Olympic Winter Games are more popular than ever, reaching record global audiences via traditional television, digital platforms and social media. Exciting new events are helping to attract new audiences and new commercial partners.
The expansion of the sports programme — from 86 events in Vancouver, to 96 events in Sochi and the possibility of more events in the future — not only increases the appeal of the Games, it also increases the number of competition venues.
At the same time, sports organisations, including Organising Committees for the Olympic Games (OCOG), have responded to societal expectation for more accountability, more transparency, more social responsibility and more sustainability.
The IOC welcomes these changes and took action to address them with the implementation of Olympic Agenda 2020, the IOC’s strategic roadmap for the future of the Olympic Movement. Reducing the cost and complexity of the Games and the Candidature Process are among the primary objectives of Olympic Agenda 2020.
The Olympic Winter Games in numbers – September 2017
41 Introduction

As a result of the reforms, the Candidature Process has become an ongoing dialogue between the IOC and the cities, with expertise and support provided at every step to ensure that Games proposals align with local and regional long-term goals. This document is part of that ongoing dialogue and will be followed by additional information to assist cities considering a possible candidature to host the Olympic Winter Games.
Olympic Agenda 2020 also puts an even stronger emphasis on the importance of placing legacy and sustainability considerations at the core of every aspect of Games planning and delivery.
Cities have more flexibility to develop Games proposals that serve local needs and are strongly encouraged to make maximum use of existing, temporary and demountable venues, with new venues allowed only if they have a clear operational plan for legacy after the Games. The new flexibility includes the option of using venues outside the host city or even outside the host country.
Other changes directly benefit Candidate Cities. The IOC has assumed costs previously borne by the cities and continues to increase its collaboration with cities throughout the entire Candidature Process, starting well before cities make any commitment. The process provides numerous opportunities for the IOC, the International Federations (IFs) and other Olympic stakeholders to offer advice, support and feedback to help cities optimise their Games proposals.
Although the candidates seeking to host the Olympic Games 2024 were the first to receive the full benefits of Olympic Agenda 2020, other cities felt its positive impact almost as soon as it was adopted in December 2014. For example, the new flexibility and closer collaboration between the OCOG and the IOC helped achieve more than USD 2 billion in savings for the Olympic Games Tokyo 2020.
This process of reform and cost reduction continues through other initiatives that grew out of Olympic Agenda 2020. There are more significant changes to come.
The Olympic Winter Games in numbers – September 2017
51 Introduction

In July 2017, the IOC approved a new Candidature Process for the Olympic Winter Games 2026 that will further reduce costs, simplify procedures and provide more assistance to NOCs and Cities at every stage.
The changes expanded the Invitation Phase to a full year. This period is now referred to as the Dialogue Stage and will give NOCs and Cities more time and more help to develop their proposals. The changes also shortened the Candidature Stage from two years to one, significantly reducing the cost of a candidature. Cities will not be required to submit any formal proposals or make any presentations during the Dialogue Stage. Under the new approach, the IOC will take a more proactive role in assisting and supporting cities considering a candidature well before any commitment. The IOC will customise its approach to the needs of the cities to help them develop the best value proposition for their city and region.
The changes to the candidature process builds on the IOC’s approval in 2016 of a series of recommendations developed by a 26-member Olympic Winter Games Strategic Review Working Group. The working group was established to consider the application of Olympic Agenda 2020 in the unique context of the Olympic Winter Games. The result is even more flexibility for winter sport venues outside the host city/region and country, a stronger emphasis on the use of temporary and demountable venues and more support from the IOC and the IFs earlier in the Olympic Winter Games Candidature Process. The final objective of the recommendations is to reduce costs and complexity for candidate cities while celebrating the special attributes of the Olympic Winter Games, and their links to the natural environment and youth-focused events.
Another initiative, Games Management 2020, is examining ways to further reduce costs and optimise services by systematically reviewing technical requirements and service levels for Games preparations. The changes include eliminating minimum capacity requirements for competition venues, and providing more flexibility for venue master plans, the Olympic Village and the International Broadcast Centre (IBC).
Other Games Management 2020 initiatives are focused on increasing support to OCOGs from the IOC and the IFs. Changes in this regard include the provision of turnkey solutions in areas where sourcing from the IOC reduces risks and costs for OCOGs.
As a result of all these changes, and others that will emerge in the ongoing reform process, cost drivers for future Games may differ from those of previous Games.
Every host city infuses the Olympic Winter Games with its own unique character. That is part of the magic of the Games. The data provided offers a baseline for anyone considering whether to showcase their city’s unique character to a vast global audience by hosting the Olympic Winter Games. We trust you will find it useful.
Please do not hesitate to contact Olympic Games Candidature Coordination ([email protected]) if you have questions about this document or any other matter related to the Candidature Process or hosting the Olympic Games.
The Olympic Winter Games in numbers – September 2017
61 Introduction


2 Scale data
2.1 Stakeholders 92.1.1 Olympic Games 102.1.2 Paralympic Games 112.2 Sport programme 122.2.1 Olympic Games 122.2.2 Paralympic Games 122.3 Competition venues 132.3.1 Olympic Games 132.3.2 Paralympic Games 162.4 Training venues 172.4.1 Olympic Games 172.4.2 Paralympic Games 172.5 Key non-competition venues 182.5.1 Olympic Villages 182.5.2 Paralympic Villages 192.5.3 Olympic Games Media Centres 202.5.4 Paralympic Games
Media Centres 232.5.5 Olympic opening and closing
ceremonies venues 242.5.6 Paralympic opening and closing
ceremonies venues 24
The Olympic Winter Games in numbers – September 2017
8

2.1 StakeholdersThe number of athletes, team officials, International Federations (IFs) and National Olympic Committees (NOCs) reflects the evolution of the sport programme and the increase in universality of the Olympic Winter Games.
Initiatives are underway to optimise the number of broadcasters for future Games.
The number of participants impacts the scope of many OCOG Functional Areas (FAs) in that it represents the size (or part) of the population to which they provide services.
For example, for the Accreditation FA, it impacts the amount of accreditation card material stock, the size of accreditation centres, the quantity of technical equipment and the number of workforce. For the Food & Beverage FA, it impacts the size of kitchen and dining facilities and the amount of food and beverages to be prepared and served.
The Olympic Winter Games in numbers – September 2017
92 Scale data

2.1.1 Olympic GamesHCC – Operational Requirements
• ACR Annex I – Accreditation at the Olympic Games – Detailed specifications
Historical data
Stakeholder type Vancouver 2010 Sochi 2014*
Accredited
Athletes 2,616 2,839
Team officials (incl. Chef de Mission, Deputy Chef de Mission, Olympic Attaché, administrative personnel, technical and coaching personnel, medical personnel and additional officials, etc.)
2,715 3,213
Broadcasters(incl. Rights-Holding Broadcasters (RHBs), host broadcaster and IBC personnel)
9,715 10,971
Future and former Organising Committees (incl. Presidents, directors general of last preceding and future OCOGs and Youth Olympic Games Organising Committees (YOGOCs), Mayors of next host cities, executive members, observers, etc.)
371 436
Host Organising Committee (incl. President and Secretary General, Mayor of the host city, Heads of State and Government, guests and entourage, dignitaries, workforce, etc.)
57,526 150,536**
International Federations (incl. Presidents and Secretaries General, Board members, IF delegates, staff, technical officials, judges and jury members, equipment technicians, etc.)
1,365 1,727
International Olympic Committee (incl. members, guests, senior executives, RHBs’senior executives and guests, Court of Arbitration for Sport (CAS), staff, advisors, etc.)
1,942 1,744
National Olympic Committees (incl. Presidents and Secretaries General, governmental delegation, Candidate Cities’ executives, etc.)
853 1,178
National Partners (incl. Chairman, Chief Executive Officer (CEO), senior executives, guests, staff)
3,416 5,803
TOP Partners (incl. Chairman, CEO, senior executives, guests, staff)
2,563 3,579
Security 10,538 Not documented
Press and photographers (incl. journalists, photographers, technicians, Main Press Centre (MPC) staff and non-rights-holding media)
2,803 2,732
Sub-total 96,423 184,758
Non-accredited
Ticketed spectators*** 500,000 340,000
Grand total 596,423 524,758* As at 24 March 2014 ** Russian security personnel are included in the Host Organising Committee category *** Estimated number of ticketed spectators = number of tickets sold divided by three
The Olympic Winter Games in numbers – September 2017
102 Scale data

2.1.2 Paralympic GamesHCC – Operational Requirements
• ACR Annex II – Accreditation at the Paralympic Games – Detailed specifications
Historical data
Stakeholder type Vancouver 2010 Sochi 2014
Accredited
Athletes 502 542
Athlete competition partners 72 62
Team officials (incl. Chef de Mission, Deputy Chef de Mission, Chief Team Physician, Paralympic Attaché, Press Attachés, administrative personnel, technical and coaching personnel, medical personnel and additional officials, etc.)
632 745
Broadcasters (incl. Rights Holding Broadcasters, host broadcaster and IBC personnel)
1,136 1,944
Future Organising Committees (incl. Presidents, Directors General of future OCOGs, Mayors of next host cities, executive members, observers, etc.)
185 228
Host Organising Committee (incl. President and Secretary General, Mayor of the host city, Heads of State and Government, guests and entourage, dignitaries, workforce, etc.)
21,738 91,247*
International Federations (incl. Presidents and Secretaries General, Executive Board members, Committee members, IF delegates, staff, technical officials, judges and jury members, equipment technicians, etc.)
95 88
International Paralympic Committee (incl. President, Vice-President, Governing Board, Standing Committee members, guests, senior executives, staff, advisors, etc.)
550 371
National Paralympic Committees (incl. Presidents and Secretaries General, governmental delegation, official Candidate City executives and observers, etc.
318 298
Domestic Partners (incl. Chairman, CEO, senior executives, guests, staff)
Not documented 2,130
Paralympic Partners (incl. Chairman, CEO, senior executives, guests, staff)
207 411
Security 1,557 Not documented
Press and photographers (incl. journalists, photographers, technicians, Main Press Centre staff and non-rights-holding media)
485 549
Sub-total 27,477 98,615
Non-accredited
Ticketed spectators 230,000 Not documented
Grand total 257,477 414,815* Russian security personnel are included in the Host Organising Committee category ** Total number of tickets sold can be found in section 3.2 Ticketing
The Olympic Winter Games in numbers – September 2017
112 Scale data

2.2 Sport programme
2.2.1 Olympic GamesRequirementsOlympic Charter, Bye-laws 1.4.1 and 3.2 to Rule 45
Historical data
Vancouver 2010 Sochi 2014 PyeongChang 2018
Dates of the Olympic Games 12 – 28 February 2010 07 – 23 February 2014 09 – 25 February 2018
Sports 7 7 7
Disciplines 15 15 15
Events* 86 98 102
Ticketed sessions 171 189 203
* Unless agreed otherwise with the relevant OCOG, the number of events shall be approximately 100
2.2.2. Paralympic GamesRequirementsIPC Handbook, Chapter 3 – Paralympic Games Principles
Historical data
Vancouver 2010 Sochi 2014 PyeongChang 2018
Dates of the Paralympic Games 12 – 21 March 2010 07 – 16 March 2014 09 – 18 March 2018
Sports 5 5 6
Events 64 72 68
Ticketed sessions 64 66 58
The Olympic Winter Games in numbers – September 2017
122 Scale data

2.3 Competition venues
2.3.1 Olympic GamesSeveral significant steps have been taken within the framework of Games Management 2020 to maximise the use of existing venues and to ensure that any new venue has a well-defined legacy plan.
Since the 2024 Candidature Process, there has no longer been a minimum requirement for Olympic Games venue capacities; rather, venue capacity is to be adapted to local needs and context. When determining venue capacities, the following considerations are important:
• Capacity of any existing venue to be used;• Capacity of any new or renovated venue for legacy use post-Games;• Popularity of the sport in the host city, region and/or country;• Ability to sell tickets and fill seats/full stadiums;• Ability to increase capacity on a temporary basis for Games use;• Single or multiple sessions per day;• Terrain, venue footprint and layout (outdoor venues);• Loading and unloading at peak capacity;• Transport capacity – inbound and outbound; and• Precincts, clusters or stand-alone venues.
The Olympic Winter Games in numbers – September 2017
132 Scale data

Historical data
Vancouver 2010 Sochi 2014 PyeongChang 2018
Sport Discipline Competition days
Competition venue
Gross capacity
(seating and standing)
Competition days
Competition venue
Gross capacity
(seating and standing)
Competition days
Competition venue
Gross capacity
(seating and standing)
Biathlon– 7 Whistler Olympic Park
– Biathlon Stadium 12,000 11
Laura Cross-Country Ski & Biathlon
Centre
7,500 10 Alpensia Biathlon Centre 7,500
Bobsleighand skeleton
Bobsleigh 6 Whistler Sliding Centre 12,000 6 Sanki
Sliding Centre 5,000 6 Alpensia Sliding Centre 7,000
Skeleton 2 Whistler Sliding Centre 12,000 3 Sanki
Sliding Centre 5,000 3 Alpensia Sliding Centre 7,000
Curling – 12 Vancouver
Olympic Centre 5,600 12 Ice Cube Curling Centre 3,000 18 Gangneung
Curling Centre 2,982
Ice hockey
–
14 Canada Hockey Place 19,300 11 Bolshoy
Ice Dome 12,000 12 Gangneung Hockey Centre 9,310
10 UBC Thunderbird Arena 6,800 12 Shayba
Arena 7,000 11 Kwandong Hockey Centre 5,636
Luge– 5 Whistler
Sliding Centre 12,000 6 Sanki Sliding Centre 5,000 6 Alpensia
Sliding Centre 7,000
Skating Figure skating* 9 Pacific
Coliseum 14,200 12 Iceberg Skating Palace 12,000 11 Gangneung
Ice Arena 12,020
Short track speed skating
5 Pacific Coliseum 14,200 5 Iceberg
Skating Palace 12,000 5 Gangneung Ice Arena 12,020
Speed skating 12 Richmond
Olympic Oval 7,600 12 Adler Arena 8,000 12 Gangneung Oval 7,630
* Number of competition days excludes the gala
* Number of competition days excludes the gala
The Olympic Winter Games in numbers – September 2017
142 Scale data

Historical data
Vancouver 2010 Sochi 2014 PyeongChang 2018
Sport Discipline Competition days
Competition venue
Gross capacity
(seating and standing)
Competition days
Competition venue
Gross capacity
(seating and standing)
Competition days
Competition venue
Gross capacity
(seating and standing)
Skiing
Alpine 10 Whistler Creekside 7,500 10 Roza Khutor Alpine Centre 7,500
5 Yongpyong
Alpine Centre (technical events)***
6,000
6Jeongseon
Alpine Centre (speed events)****
6,500
Cross-country 9 Whistler Olympic Park – Cross-Country Stadium 12,000 10 Laura Cross-Country
Ski & Biathlon Centre 7,500 10 Alpensia Cross-Country Skiing Centre 7,500
Freestyle 8 Cypress Mountain 12,000* 10 Rosa Khutor Extreme Park
4,000 (HAM stadium)
6,250 (PSX stadium)
14 Bokwang Snow Park
6,000 (slopestyle)
6,000 (moguls & aerials)
6,000 (halfpipe & cross)
Nordic combined –
ski jump3 Whistler Olympic Park –
Ski Jumping Stadium 12,000 3 RusSki Gorki Jumping Centre 7,500 3 Alpensia
Ski Jumping Centre 10,994
Nordic combined – cross-country
3 Whistler Olympic Park – Cross-Country Stadium 12,000 3 RusSki Gorki
Jumping Centre 7,500 3Alpensia
Cross-Country Skiing Centre
7,500
Ski jumping 5 Whistler Olympic Park – Ski Jumping Stadium 12,000 6 RusSki Gorki
Jumping Centre 7,500 6 Alpensia Ski Jumping Centre 10,994
Snowboard 6 Cypress Mountain 12,000** 9 Rosa Khutor Extreme Park
4,000 (HAM stadium)
6,250 (PSX stadium)
4Alpensia
Ski Jumping Centre (big air)
8,638
10 Bokwang Snow Park
6,000 (parallel giant
slalom & slopestyle)
6,000 (halfpipe & cross)
** During the Olympic Winter Games Vancouver 2010, the venue capacity for the snowboard and freestyle events in Cypress Mountain was reduced from 12,000 to 4,000 as it was not possible to build the planned standing areas due to lack of snow
*** Technical events are giant slalom, slalom and team event**** Speed events are downhill, super-G and alpine combined
The Olympic Winter Games in numbers – September 2017
152 Scale data

2.3.2 Paralympic GamesHCC – Operational RequirementsNone
Historical data
Vancouver 2010 Sochi 2014 PyeongChang 2018
Sport Discipline Competition days
Competition venue
Gross capacity
(seating and standing)
Competition days
Competition venue
Gross capacity
(seating and standing)
Competition days
Competition venue
Gross capacity
(seating and standing)
Para biathlon – 2
Whistler Paralympic Park – Biathlon Stadium*
3,600 3Laura
Cross-Country Ski & Biathlon Centre
7,500 3 Alpensia Biathlon Centre 7,500
Wheelchair curling – 8 Vancouver
Paralympic Centre* 5,600 8 Ice Cube Curling Centre 3,000 8 Gangneug
Curling Centre 2,982
Para ice hockey – 7 UBC
Thunderbird Arena** 6,700 7 Shayba Arena 7,000 7 Gangneung
ockey Centre 9,310
Skiing Para alpine 8 Whistler
Creekside* 5,000 8Rosa Khutor
Alpine Centre – Alpine Skiing
7,500 7 Jeongseon Alpine Centre 6,500
Para cross-country 5
Whistler Paralympic Park – Cross-
Country Stadium*3,600 5
Laura Cross-Country Ski & Biathlon Centre
7,500 5 Alpensia Biathlon Centre 7,500
Para snowboard – – – 1 Rosa Khutor 7,500 2 Jeongseon
Alpine Centre 6,500
* Same as Olympic venue, but with reduced capacity ** Same as Olympic venue, but with reduced capacity (temporary seating removed)
The Olympic Winter Games in numbers – September 2017
162 Scale data

2.4 Training venues (in addition to the competition field of play)In the Olympic Winter Games, most training takes place on the competition field of play however, for some sports, additional training areas are needed. These are either stand-alone venues or additional training areas in competition venues.
2.4.1 Olympic Games HCC – Operational Requirements
• SPT 10 – Games-time training
Historical data
Vancouver 2010 Sochi 2014 PyeongChang 2018
Sport/Discipline
Short track speed skating Killarney Centre Skating Training Venue (Ice rink #2)
Gangneung Yeongdong Short Track Training Venue
Figure skating Trout Lake Centre Skating Training Venue (Ice rink #1)
Gangneung Ice Arena (Ice rink #2)
Ice hockey Britannia CentreUBC Thunderbird Arena
(Ice rink #2)
Hockey Training VenueBolshoy Ice Dome
(Ice rink #2)
Gangneung Hockey Centre (Ice rink #2)
Kwandong Hockey Centre (Ice rink #2)
2.4.2 Paralympic Games HCC – Operational Requirements
• SPT 11 – Paralympic training schedule projects
Historical data
Vancouver 2010 Sochi 2014 PyeongChang 2018
Sport/Discipline
Para ice hockeyNot applicable;
all training took place on the competition field of play
Hockey Training Venue Gangneung Hockey Centre(Ice rink #2)
The Olympic Winter Games in numbers – September 2017
172 Scale data

2.5 Key non-competition venues
2.5.1 Olympic VillagesSince the Vancouver and Sochi Games, the IOC has been working to reduce Games-related costs and optimise space needs through re-engineered and optimsed technical requirements and stricter requirements for additional permanent new venues. This includes more flexible operational requirements for the Olympic Village, allowing for more than one Olympic Village to reflect the local real estate demands and optimise legacy.
HCC – Operational Requirements• VIL 01 – Number of Olympic Villages• VIL 02 – Olympic Village accommodation and capacity requirements• VIL 03 – Services to residents within the Olympic Village• VIL 04 – Olympic Village period of operations• VIL 05 – Olympic Village measurements• VIL 10 – NOC office space, meeting rooms, doctor’s room and other spaces• VIL 17 – Commercial services in the Olympic Village Plaza• VEN 17 – Accessibility for all stakeholders with impairment
Historical data
Vancouver 2010 Sochi 2014 PyeongChang 2018*
Coastal Mountain Coastal Mountain Endurance Coastal Mountain
Size (hectares) 32 40 72 32 27 11 11
Planned number of residents
2,730 2,850 2,000 2,900 1,100 2,174 3,524
Exclusive use period
01/11/2009 – 06/04/2010
01/11/2009 – 31/05/2010
01/06/2013 – 01/06/2014
01/09/2013 – 01/06/2014
01/11/2013 – 15/05/2014
01/10/2017 – 30/04/2018
01/10/2017 – 10/04/2018
* Estimates at the time of publication; the OCOG will determine its own planning numbers according to the quotas
The Olympic Winter Games in numbers – September 2017
182 Scale data

2.5.2 Paralympic VillagesHCC – Operational Requirements
• VIL 35 – Paralympic Village• VIL 36 – Paralympic Village transition• VIL 37 – IF Games officials• VIL 38 – Paralympic Village resident quota• VIL 39 – Paralympic Village layout• VIL 42 – Equitable service levels in the Paralympic Village• VEN 17 – Accessibility for all stakeholders with impairment• SPT 50 – Classification Coordination Centre for the Paralympic Games• SPT 51 – Orthotic, prosthetic and wheelchair repair services• PRS 08 – Media services at Paralympic venues
Historical data
Vancouver 2010 Sochi 2014 PyeongChang 2018
Coastal Mountain Coastal Mountain Mountain
Size (hectares) 20 40 45 32 Not yet available
Number of residents* 350 1,200 350 700 1,476
Number of residents using a wheelchair
123 131 121 61 290*
Exclusive use periods
01/11/2009 – 06/04/2010
01/11/2009 – 31/05/2010
01/06/2013 – 01/06/2014
01/09/2013 – 01/06/2014 01/10/2017 – 10/04/2018
* Planned
For Sochi 2014, additional housing was available in the mountain area for Nordic skiing athletes (total number of residents: 400, including 53 using wheelchairs).
The Olympic Winter Games in numbers – September 2017
192 Scale data
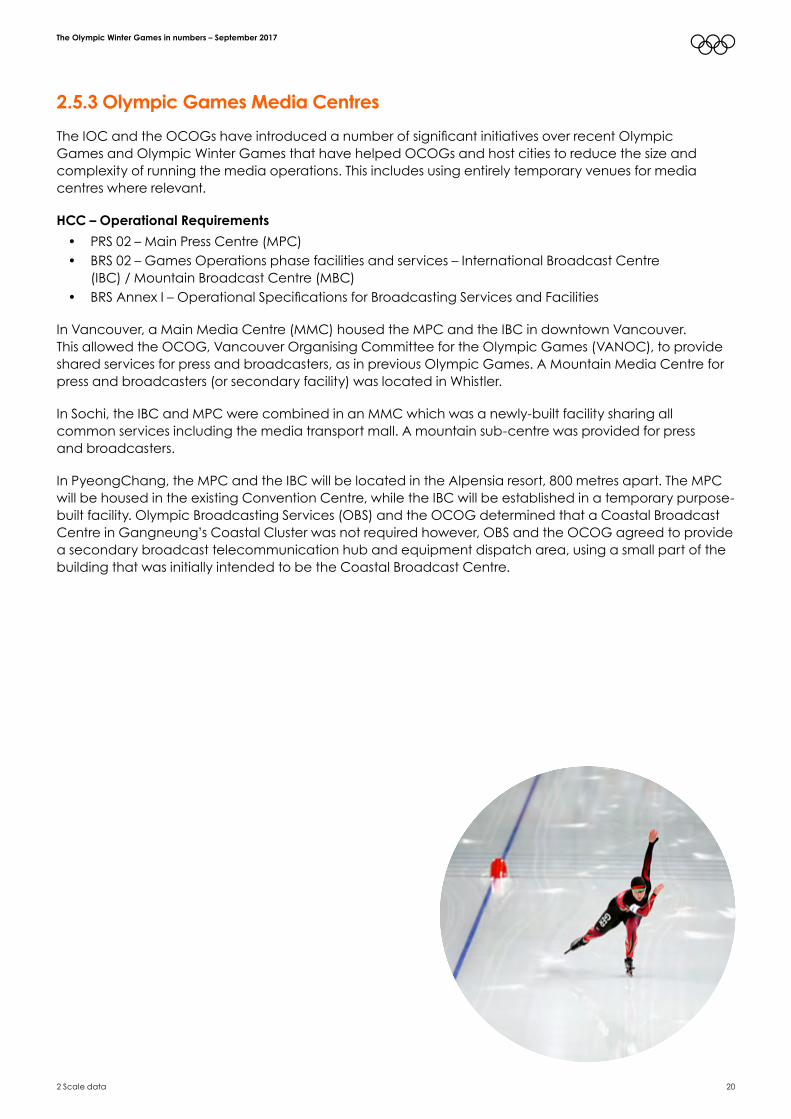
2.5.3 Olympic Games Media Centres The IOC and the OCOGs have introduced a number of significant initiatives over recent Olympic Games and Olympic Winter Games that have helped OCOGs and host cities to reduce the size and complexity of running the media operations. This includes using entirely temporary venues for media centres where relevant.
HCC – Operational Requirements• PRS 02 – Main Press Centre (MPC)• BRS 02 – Games Operations phase facilities and services – International Broadcast Centre
(IBC) / Mountain Broadcast Centre (MBC)• BRS Annex I – Operational Specifications for Broadcasting Services and Facilities
In Vancouver, a Main Media Centre (MMC) housed the MPC and the IBC in downtown Vancouver. This allowed the OCOG, Vancouver Organising Committee for the Olympic Games (VANOC), to provide shared services for press and broadcasters, as in previous Olympic Games. A Mountain Media Centre for press and broadcasters (or secondary facility) was located in Whistler.
In Sochi, the IBC and MPC were combined in an MMC which was a newly-built facility sharing all common services including the media transport mall. A mountain sub-centre was provided for press and broadcasters.
In PyeongChang, the MPC and the IBC will be located in the Alpensia resort, 800 metres apart. The MPC will be housed in the existing Convention Centre, while the IBC will be established in a temporary purpose-built facility. Olympic Broadcasting Services (OBS) and the OCOG determined that a Coastal Broadcast Centre in Gangneung’s Coastal Cluster was not required however, OBS and the OCOG agreed to provide a secondary broadcast telecommunication hub and equipment dispatch area, using a small part of the building that was initially intended to be the Coastal Broadcast Centre.
The Olympic Winter Games in numbers – September 2017
202 Scale data

Historical data
Broadcast centres
Vancouver 2010 Sochi 2014 PyeongChang 2018
International Broadcast
Centre
Mountain Media Centre (shared with
press)
International Broadcast Centre
Mountain sub-centre
(shared with press)
International Broadcast Centre
Functional net broadcast space (m2)
31,400 4,600 31,000 5,000 34,000
Fit-out and dismantling schedule
17/08/2009 – 31/03/2010
28/12/2009 – 31/03/2010
15/07/2013 – 15/05/2014
15/09/2013 – 18/04/2014
05/06/2017 – 31/05/2018
In some past Games, following a detailed review of the particular Games context, OBS and the OCOG have agreed to reduce the fit-out and dismantling period where conditions allowed (e.g. type of building, effectiveness of bump-in/bump-out logistics).
In Vancouver, the dismantling of the IBC was shorter than stated in the operational requirements due to the conditions of the particular building used for the IBC (easy access, existing operational logistics support, convenient building layout, etc.).
Similarly, the installation time for the MBC was shorter than stated due to the use of an external tent where nearly half the required equipment and facilities were installed. The tent supplemented an existing structure that was used as the base of the MBC. Using two independent but adjacent buildings simplified the overall installation and thus allowed this phase to be much shorter than usual.
In Sochi, the handover of the IBC to OBS was delayed two months while infrastructure issues were rectified. This forced OBS to employ additional resources to complete the fit-out on time and increased the costs for the OCOG.
In PyeongChang, the handover of the IBC to OBS was nearly on time. As OBS now uses new, modular pre-fabricated panels for the fit-out, OBS believes dismantling will finish earlier than planned.
The Olympic Winter Games in numbers – September 2017
212 Scale data

Press centres
Vancouver 2010 Sochi 2014 PyeongChang 2018
Main Press Centre
Mountain Media Centre (shared with
broadcasters)
Main Press Centre
Mountain sub-centre
(shared with broadcasters)
Main Press Centre*
Size (m2) 21,400 4,600 20,000 10,000 19,550
Fit-out and dismantling schedule
30/10/2009 – 30/03/2010
28/12/2009 – 31/03/2010
20/07/2013 – 15/05/2014
20/07/2013 – 15/05/2014 Not documented
* As the PyeongChang 2018 Main Press Centre is located in the alpine cluster, there is no need for an additional Mountain Media Centre
The use of established exhibition centres for the MPCs, rather than new buildings, has meant that the occupation dates can be reduced significantly. Vancouver 2010 was able to reduce occupation from three months to six weeks (prior to the Opening Ceremony).
Venue Media Centres (VMCs)Temporary infrastructure has been used significantly for VMCs since Vancouver 2010. This has been an important initiative as it reduces the need for permanent infrastructure and thus ensures the legacy left in the host city for the venues is aligned with future needs.
The introduction of “hybrid VMCs”, which combine both a media workroom and a press conference room into one space, has also saved significantly on overlay requirements. While Vancouver had one “hybrid VMC”, at the Olympic Games Rio 2016, there were 20. They cannot be used for all venues, but it is expected they will account for more than half the VMCs at future Olympic Games.
The Olympic Winter Games in numbers – September 2017
222 Scale data

2.5.4 Paralympic Games Media Centres HCC – Operational Requirements
• PRS 07 – Paralympic MPC• BRS 06 – General media facilities and services for the Paralympic Games
Press centresIn Vancouver, the MPC was not kept operational for the Paralympic Games. Instead, the VMCs at UBC Thunderbird Arena and Whistler Creekside were slightly enlarged; these were open four days prior to the start of the Paralympic Games.
In Sochi, the MPC was kept operational with reduced capacity scaled to the need of the Paralympic Games (reduction of approx. 50 per cent of the space used for the Olympic Games).
Broadcast centresFor the Paralympic Games in Vancouver, the IBC and the MBC were located in the same facilities as for the Olympic Games, with reduced operational space, scaled to needs of the Paralympic Games (25 per cent of the Olympic Games space requirements).
In Sochi, the IBC was also located in the same facilities as for the Olympic Games, with reduced operational space scaled to the need of the Paralympic Games. It was agreed not to keep a Mountain Broadcast Centre for the Paralympic Games.
In PyeongChang, broadcasters will operate from the same facilities as for the Olympic Games, with reduced operational space scaled to the need of the Paralympic Games.
Using the same building for both the Olympic and Paralympic Games has several advantages (e.g. cost savings related to overlay for one venue instead of two) and some challenges (e.g. longer dismantling period for the IBC due to the ongoing use for the Paralympic Games). Should the same building be used for both Games, the fit-out and dismantling schedule incorporates both Games.
The Olympic Winter Games in numbers – September 2017
232 Scale data

2.5.5 Olympic opening and closing ceremonies venues HCC – Operational Requirements
• CER 01 – Organisation and scope of Ceremonies
Historical data
Vancouver 2010 Sochi 2014 PyeongChang 2018
Opening and Closing Ceremonies
Opening and Closing Ceremonies
Opening and Closing Ceremonies
Venue BC Place Fisht Olympic Stadium Olympic Stadium
Gross capacity 60,000 40,000 35,000
Exclusive use period 07/11/2009 – 19/03/2010 07/01/2014 – 01/05/2014 01/10/2017 – 31/03/2018
2.5.6 Paralympic opening and closing ceremonies venuesHCC – Operational Requirements
• CER 20 – Paralympic Opening and Closing Ceremonies
Historical data
Vancouver 2010 Sochi 2014 PyeongChang 2018
Opening Ceremony Closing Ceremony Opening and Closing Ceremonies
Opening and Closing Ceremonies
Venue BC Place Whistler Celebration Site
Fisht Olympic Stadium Olympic Stadium
Gross capacity 60,000 5,000 40,000 35,000
Exclusive use period 07/11/2009 – 19/03/2010 Not documented 07/01/2014 – 01/05/2014 01/10/2017 – 31/03/2018
The Olympic Winter Games in numbers – September 2017
242 Scale data

3 Commercial revenues
3.1 Domestic sponsorship 273.2 Ticketing 273.3 Licensing 27
The Olympic Winter Games in numbers – September 2017
26

3 Commercial revenuesData below refers to both Olympic and Paralympic Winter Games. Revenues are shown in values of the year of each Games.
3.1 Domestic sponsorship The domestic sponsorship revenues are dependent on the local market, including the size and growth of the local economy.
Vancouver 2010 Sochi 2014
Number of partners Revenue Number of partners Revenue
Games sponsorship * 57 CAD 697 million 46 RUB 38.8 billion
Torch Relay sponsorship
4 (incl. 2 presenting
partners)CAD 32 million
7 (incl. 3 presenting
partners)RUB 1.6 billion
* Domestic OCOG sponsorship programmes usually include several tiers of partnership, which may include sponsors, suppliers and providers. The figures in this row represent the total number of marketing partners from all tiers of the domestic programme
3.2 Ticketing
Vancouver 2010 Sochi 2014
Olympic Games Paralympic Games Olympic Games Paralympic Games
Number of tickets available 1.54 million 274,300 1.14 million 330,400
Number of tickets sold 1.49 million (97%)
230,000(84%)
1.02 million (90%)
316,200(96%)
Ticket sales revenue CAD 276 million RUB 7.1 billion
Note: the figures above exclude tickets sold for cultural events and test events.
3.3 Licensing (including merchandise, coins and philately)
Vancouver 2010 Sochi 2014
Number of official licensees 48 49
Number of Olympic stores 8 5
Number of product categories 20 45
Licensing products revenue CAD 76 million RUB 1.8 billion
Note: revenues were also raised from other sources, such as lotteries (where applicable), donations, asset disposal, test events income, sponsor hospitality centre, food and beverage commission, etc., These revenues could represent 5-10% of the total.
27
The Olympic Winter Games in numbers – September 2017
3 Commercial revenues


4 Cost drivers
4.1 Accommodation 314.1.1 Accommodation for workforce 314.2 Ceremonies 324.2.1 Opening ceremony
creative element 324.3 Energy 334.3.1 Energy supply for the venues 334.4 Finance 414.4.1 Financial services 414.5 Food and beverage 424.5.1 Workforce food and beverage 424.5.2 Olympic Village food and
beverage 434.6 Medical services 444.6.1 Polyclinics 444.7 Olympic Torch Relay 464.7.1 Olympic Torch Relay operations 464.8 People management 474.8.1 Long-term OCOG staff 474.8.2 Games-time workforce 484.8.3 Uniforms 494.8.4 Headquarters office space 50
4.9 Technology 514.9.1 Telecom services 534.9.2 Integration services and
information systems 544.9.3 Information
Technology operations 554.9.4 Audio-visual equipment 564.10 Test events management 574.10.1 Test events 574.11 Transport 594.11.1 Rolling stock 594.11.2 Space needs 614.12 Venue development and
general infrastructure 624.12.1 Land acquisition, temporary
venues, tents and trailers, site adaptation, temporary seating and temporary lighting 62
4.13 Venue management 644.13.1 Venue Use Agreements 64
The Olympic Winter Games in numbers – September 2017
29

4 Cost drivers
Introduction
This chapter focuses on key cost drivers that impact the OCOG’s operational budget; it does not address cost drivers such as law enforcement and capital works that impact the non-OCOG budget.
Data is provided for the two most recent Olympic Winter Games – Vancouver 2010 and Sochi 2014 – and also for PyeongChang 2018 where it is already available. Each Games has its own unique context and specificities and, at times, its own way of presenting data. Such differences are apparent in the data offered in this document, for example in the Host Organising Committee accreditation numbers (see section 2.1.1 Olympic Games) where Sochi’s total includes Russian security personnel.
As part of Olympic Agenda 2020, the IOC has been working to reduce the cost and complexity of the Games.
Games Management 2020 explores the development of various turnkey solutions to decrease the risk of the Games, to ensure cost efficiency for the OCOGs and the IOC, and to ensure flexibility in the delivery. Currently, turnkey solutions are being considered in the following areas:
• Technology; • Venues;• Ticketing;• Hospitality;• Digital; and• Games services.
The first turnkey solution to be delivered at a Games by the IOC is the Olympic Information Service (OIS) at PyeongChang 2018. The OIS is a professional sports reporting and information service designed to keep the accredited media informed and to help them achieve the best possible coverage of the Games. To provide the OIS, the IOC will set up and run a professional editorial team that will produce Games news content to be published in the Info system.
Listed below are the delivery models that the IOC is exploring, all of which would be further studied considering the marketing, commercial, financial context of cities:
• Scoping and/or documentation in the planning phase;• Assisting in the planning and delivery of solutions; and• Contracting a provider to deliver in part or full a service or product.
Further initiatives include optimisation of space needs through re-engineered and optimised technical requirements, stricter requirements for additional permanent new venues and optimised concepts and service levels for key Games services.
As a result of all these changes, and others that will emerge in the ongoing reform process, cost drivers for future Games may differ from those of previous Games.
30
The Olympic Winter Games in numbers – September 2017
4 Cost drivers

4.1 AccommodationAccommodation costs for future Games may be impacted by the various Olympic Agenda 2020 initiatives to reduce cost and complexity, as described in the introduction to this chapter.
4.1.1 Accommodation for workforce (mainly volunteers and temporary staff)Accommodation needs for an OCOG workforce can vary greatly from Games to Games, depending on factors such as:
• availability of the local population to participate in the organisation of the Games;• need for specialised skills not available within acceptable geographical boundaries; and• the location of Games venues in relation to the accommodation capacity in those areas.
In addition, the OCOG is required to provide 23,885 rooms for the stakeholder groups who hold various official roles at the Games. Most of these rooms are managed and paid for by the respective stakeholder groups.
Applicable section of current budget template (2024)• 2.1 – Accommodation
HCC – Operational Requirements• ACM 05 – Stakeholder group accommodation requirements table
Historical data
Vancouver 2010* Sochi 2014** PyeongChang 2018***
Number of paid staff accommodated 2,486 Approx. 5,000 13,400
Number of contractors accommodated****
Included in number of paid staff above
22,268 (90% were from outside Sochi
and needed accommodation; not managed/paid by
the OCOG)
11,500 (not managed/paid by
the OCOG)
Number of volunteers accommodated
2,461 13,934 (housed in 4 villages) 13,500
* Mainly mountain rooms as the demand in the city was relatively low** Both mountain and city rooms*** Expected**** Contractor accommodation is not typically paid by the OCOG
31
The Olympic Winter Games in numbers – September 2017
4 Cost drivers

4.2 CeremoniesThe scope and costs of the opening ceremony depend mainly on the creative concept and the venue chosen by the OCOG. In line with the recommendations of the Olympic Winter Games Strategic Review Working Group, existing sports or other venues shall be used to host both the opening and closing ceremonies.
The use of an existing venue (stadium or other venue type) helps to reduce the need for temporary overlay (especially seating).
Finally, the choice of venue for the opening ceremony (and partly also the closing ceremony) is influenced by some key operational aspects, such as security (greatest level of any Olympic venue).
The key for ceremonies is the concept (not the technical means). This was demonstrated by Rio 2016’s highly creative but low-cost ceremony, which avoided costly technology – one of the main costs of previous ceremonies.
4.2.1 Opening ceremony creative elementApplicable section of current budget template (2024)
• 5.1 – Opening and Closing Ceremonies/Ceremonies creative and production
HCC – Operational Requirements• CER 01 – Organisation and scope of Ceremonies
Historical data
Vancouver 2010 Sochi 2014
Parade participants 3,040 3,521
Ceremony performers 3,125 3,405
Ceremony volunteers 665 1,000
Production staff 190 650
32
The Olympic Winter Games in numbers – September 2017
4 Cost drivers

4.3 EnergyEnergy costs for future Games may be impacted by the various Olympic Agenda 2020 initiatives to reduce cost and complexity, as described in the introduction to this chapter.
4.3.1 Energy supply for the venuesApplicable section of current budget template (2024)
• 1.4 – Energy
HCC – Operational Requirements• NRG 03 – Host City and energy agencies• NRG 07 – Supply resilience and reliability at Olympic sites• NRG 08 – Event continuation
Historical dataThe data refers to the High Voltage (HV) and Medium Voltage (MV) supply requirements of the venues.
The load requirements are estimates of the respective OCOGs, not the actual peak demand registered during the respective Winter Games. The actual registered peak loads were considerably lower than the estimates, principally due to extreme warm weather experienced in both Vancouver and Sochi.
This data must be read in conjunction with the Energy Supply TOK Reports for Vancouver and Sochi, which include detailed data and explanations for the in-venue power supply.
The temporary power provider data is also Games-specific and does not apply as such for future Games. Where temporary data is given, these refer to the total temporary MV load estimated to be supplied by the network.
33
The Olympic Winter Games in numbers – September 2017
4 Cost drivers

Olympic Winter Games additional demand impact on the overall city/regional load or capacity: 100 — 150 Mega Volt Amp (MVA) (including accommodation and transport)
Mountain venues
Vancouver 2010
Venue Substation Distribution line type Capacity (MVA)
Running Standby Running Standby Existing New Temporary Total
Luge/Bobsleigh/ Skeleton Sub1 Sub1 1 OHL*
(Dedicated)1 OHL
(Shared) n/a n/a n/a 5.5
Ski Jumping n/a n/a n/a n/a n/a n/a n/a 12.4
Biathlon/ Cross-Country n/a n/a n/a n/a n/a n/a n/a 12.4
Alpine (technical and speed events)
n/a n/a n/a n/a n/a n/a n/a 3.7
Snowboard/ Freestyle Sub 1 GEN***
1 Underground
(Shared)n/a n/a n/a n/a 10.9
Mountain Olympic Village Sub1 Sub1 n/a n/a n/a n/a n/a 6.7
Media Village ** ** ** ** ** ** ** **
IBC/MPC**** Sub 2 Sub 1 1 (Dedicated)
1 (Shared) n/a n/a 1.0 3.9
Olympic Stadium ** ** ** ** ** ** ** **
Medals Plaza Sub 2 Sub 11
Underground (Shared)
1 Underground
(Shared)n/a n/a n/a 3.5
n/a Data has not been documented* Overhead line** Not applicable*** Temporary generation**** The data for UPSs in the Energy Supply TOK Reports for Vancouver and Sochi must be considered Games-specific. The trend is to use more UPS
with less capacity
34
The Olympic Winter Games in numbers – September 2017
4 Cost drivers

Mountain venues
Sochi 2014
Venue Substation Distribution line type Capacity (MVA)
Running Standby Running Standby Existing New Temporary Total
Luge/Bobsleigh/ Skeleton Laura Roza
KhutorUnderground (Dedicated)
Underground (Dedicated) 0.0 5.6 3.0 8.6
Ski Jumping Laura Poselk- ovaya
Underground (Dedicated)
Underground (Dedicated) 0.0 3.17 3.46 6.6
Biathlon/ Cross-Country Psehako Laura Underground
(Dedicated)Underground (Dedicated) 0.0 27.0 5.0 32.0
Alpine (technical and speed events)
Roza Khutor Mzymta Underground
(Dedicated)Underground (Dedicated) 0.0 12.4 8.4 20.8
Snowboard/ Freestyle
Roza Khutor Mzymta Underground
(Dedicated)Underground (Dedicated) 0.0 4.0 5.0 9.0
Mountain Olympic Village Psehako Laura Underground
(Dedicated)Underground (Detected) n/a n/a n/a n/a
Media Village Laura Poselk- ovaya
Underground (Dedicated)
Underground (Dedicated) n/a n/a n/a n/a
IBC/MPC**** ** ** ** ** ** ** ** **
Olympic Stadium ** ** ** ** ** ** ** **
Medals Plaza ** ** ** ** ** ** ** **
n/a Data has not been documented** Not applicable**** The data for UPSs in the Energy Supply TOK Reports for Vancouver and Sochi must be considered Games-specific. The trend is to use more UPS
with less capacity
35
The Olympic Winter Games in numbers – September 2017
4 Cost drivers

Mountain venues
PyeongChang 2018
Venue Substation Distribution line type Capacity (MVA)
Running Standby Running Standby Existing New Temporary Total
Luge/Bobsleigh/ Skeleton Temporary Hoenggye Underground
(Dedicated) Mixed
(Shared) 0.0 4.6 2.8 7.4
Ski Jumping/ Biathlon/ Cross-Country
Hoenggye Temporary Underground (Dedicated)
Overhead (Dedicated) 5.5 7.5 10.0 23.0
Alpine/Technical Hoenggye GEN*** Underground
(Dedicated) GEN LV 20.0 2.0 4.0 26.0
Alpine/Speed GEN PyeongChang GEN MV Mixed (Dedicated) 0.0 12.0 4.3 16.3
Snowboard/ Freestyle GEN PyeongChang GEN MV Mixed
(Dedicated) 18.0 0.0 3.0 21.0
Mountain Olympic Village Hoenggye GEN Underground
(Dedicated) GEN LV 0.0 2.5 4.0 6.5
Media Village Hoenggye Temporary Underground (Dedicated)
Overhead (Dedicated) 13.0 0.0 2.1 15.1
IBC/MPC**** Hoenggye Temporary Underground (Dedicated)
Underground (Dedicated) 0.0 16.7 1.7 17.6
Olympic Stadium
GEN & Hoengye GEN
GEN & Underground (Dedicated)
GEN 0.0 2.0 7.4 12.4
Medals Plaza ** ** ** ** ** ** ** **
n/a Data has not been documented** Not applicable*** Temporary generation**** The data for UPSs in the Energy Supply TOK Reports for Vancouver and Sochi must be considered Games-specific. The trend is to use more UPS
with less capacity
36
The Olympic Winter Games in numbers – September 2017
4 Cost drivers

City venues
Vancouver 2010
Venue Substation Distribution line type Capacity (MVA)
Running Standby Running Standby Existing New Temporary Total
Ice Hockey 1 Sub1 Sub2 1
Underground (Dedicated)
1 Underground (Dedicated)
n/a n/a n/a 10.8
Ice Hockey 2 Sub1 n/a
1 Temporary
Underground (Dedicated)
1 Underground
(Shared)n/a n/a n/a n/a
Curling Sub1 n/a1
Running (Dedicated)
1 Standby
(Dedicated)n/a n/a n/a 3.9
Coastal Olympic Village Sub1 Sub 2
1 Underground (Dedicated)
1 Underground
(Shared)n/a n/a n/a 11.6
Speed skating Sub1 Sub2 1
Standby (Dedicated)
1 Running
(Dedicated)n/a n/a n/a 5.6
Figure Skating Sub1 n/a2
Underground (Dedicated)
1 Underground
(Shared)n/a n/a n/a 7.2
Olympic Stadium Sub1 Sub2
2 Underground (Dedicated)
1 Underground (Dedicated)
n/a n/a GEN*** 11,250 9.3
IBC n/a n/a2
Underground (Dedicated)
2 Underground (Dedicated)
n/a n/a n/a 14.0
MPC Sub1 Sub 21
Underground (Dedicated)
1 Underground (Dedicated)
n/a n/a n/a 7.0
Olympic Media Village ** ** ** ** ** ** ** **
n/a Data has not been documented*** Temporary generation** Not applicable
37
The Olympic Winter Games in numbers – September 2017
4 Cost drivers
City venues
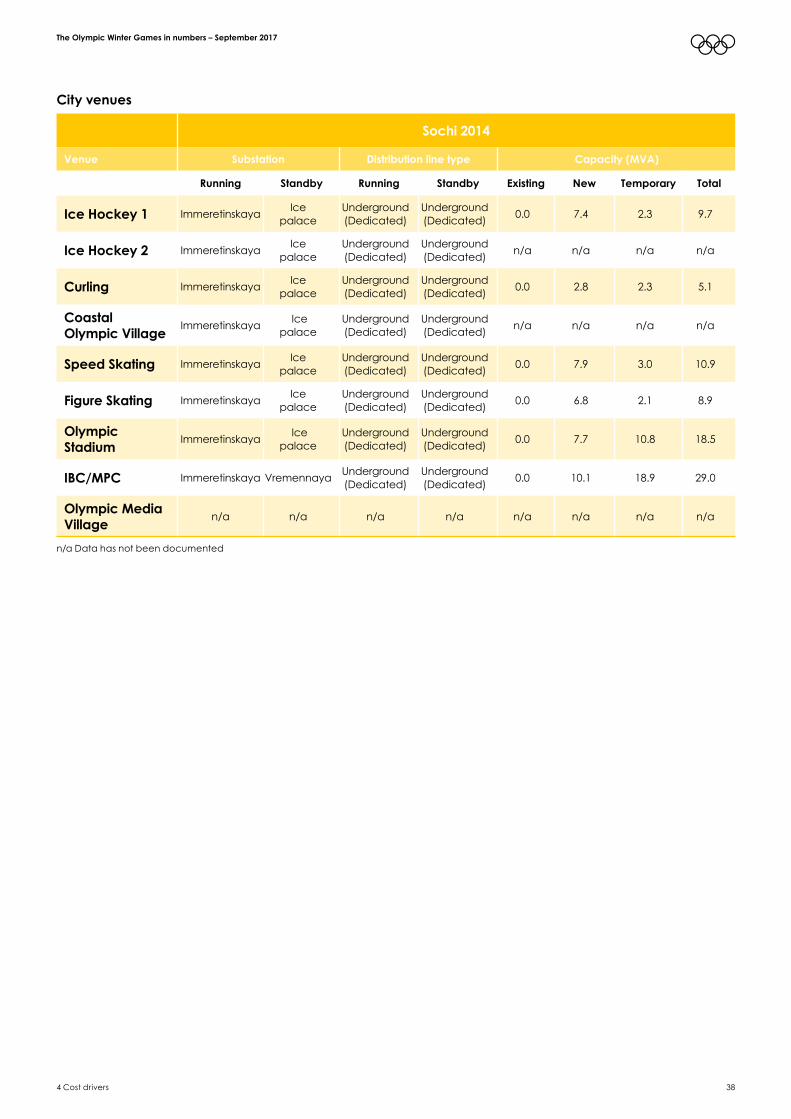
Sochi 2014
Venue Substation Distribution line type Capacity (MVA)
Running Standby Running Standby Existing New Temporary Total
Ice Hockey 1 Immeretinskaya Ice palace
Underground (Dedicated)
Underground (Dedicated) 0.0 7.4 2.3 9.7
Ice Hockey 2 Immeretinskaya Ice palace
Underground (Dedicated)
Underground (Dedicated) n/a n/a n/a n/a
Curling Immeretinskaya Ice palace
Underground (Dedicated)
Underground (Dedicated) 0.0 2.8 2.3 5.1
Coastal Olympic Village Immeretinskaya Ice
palace Underground (Dedicated)
Underground (Dedicated) n/a n/a n/a n/a
Speed Skating Immeretinskaya Ice palace
Underground (Dedicated)
Underground (Dedicated) 0.0 7.9 3.0 10.9
Figure Skating Immeretinskaya Ice palace
Underground (Dedicated)
Underground (Dedicated) 0.0 6.8 2.1 8.9
Olympic Stadium Immeretinskaya Ice
palace Underground (Dedicated)
Underground (Dedicated) 0.0 7.7 10.8 18.5
IBC/MPC Immeretinskaya Vremennaya Underground (Dedicated)
Underground (Dedicated) 0.0 10.1 18.9 29.0
Olympic Media Village n/a n/a n/a n/a n/a n/a n/a n/a
n/a Data has not been documented
38
The Olympic Winter Games in numbers – September 2017
4 Cost drivers

City venues
PyeongChang 2018
Venue Substation Distribution line type Capacity (MVA)
Running Standby Running Running Standby Running Running Standby
Ice Hockey 1 Buk Gangneung Gangneung Underground
(Dedicated) Underground (Dedicated) 0.0 5.0 2.6 7.6
Ice Hockey 2 Gangneung Yongdong Overhead(Dedicated)
Mixed(Shared) 0.0 4.5 2.0 6.5
Curling Buk Gangneung Gangneung Underground
(Dedicated)Mixed
(Shared) 0.0 4.5 2.3 6.8
Coastal Olympic Village Gangneung GEN*** Mixed
(Dedicated) GEN LV 0.0 10.4 8.1 18.5
Speed Skating Buk Gangneung Gangneung Underground
(Dedicated)Underground (Dedicated) 0.0 6.3 1.4 7.7
Figure Skating Buk Gangneung Gangneung Underground
(Dedicated) Underground (Dedicated) 0.0 6.3 2.4 8.7
Olympic Stadium ** ** ** ** ** ** ** **
IBC ** ** ** ** ** ** ** **
MPC ** ** ** ** ** ** ** **
Olympic Media Village Gangneung GEN Mixed
(Dedicated) GEN LV 0.0 10.0 0.0 10.0
n/a Data has not been documented** Not applicable*** Temporary generation
39
The Olympic Winter Games in numbers – September 2017
4 Cost drivers

Feeding stations
Sochi 2014 PyeongChang 2018
Laura SS 110/10 KV 2 X 40 MVA TRS new Honggye SS 154/22.9 KV 2 x 45/60 MVA TRS + 1 X 45/60 MVA TRS new
Rosa Khutor SS 110/10 KV 2 X 40 MVA TRS new Temporary SS 154/22.9 KV 2 X 45/60 MVA new
Mzymta SS 110/10 KV 2 X 40 MVA TRS new Buk Gangneung SS 154/22.9 KV 2 X 45/60 MVA TRS + 1 X 45/60 MVA TRS new
Psehako SS 110/10 KV 2 X 25 MVA TRS new Gangneung SS 154/22.9 KV 3 X 45/60 MVA TRS + 1 45/60 MVA TRS new
Poselkovaya SS 220/110/10 KV 2 X 140 MVA + 2 X 25 MVA TRS new
PyeongChang SS 154/22.9 KV 2 X 45/60 MVA TRS + 1 X 40 MVA TRS
Immeretiskaya SS 110/10 KV 2 X 80 MVA new Jeongsun SS 154/22.9 KV 3 X 45/60 MVA TRS
Ledovy Dvorets (Ice Palace) SS 2 X 80 MVA new Yondong SS 154/22.9 KV 2 X 45/60 MVA TRS
Vremennaya SS 1 X 40 MVA new
Sportisnkaya (back-up substation for Roza Khutor and Mzymta) SS 110/10 KV 2 X 40 MVA
Note: Vancouver 2010 data has not been documented.
40
The Olympic Winter Games in numbers – September 2017
4 Cost drivers

4.4 Finance
4.4.1 Financial servicesApplicable section of current budget template (2024)
• 7.1 – Administration and Governance• 7.3 – Other Corporate Administration expenses
Financial services may vary widely depending on the OCOG’s strategy, circumstance and legal structure. They may include interest, insurance, hedging, foreign exchange losses, audits, professional advice (i.e. taxation), bad debts and others.
Foreign exchange
IOC revenues are primarily denominated in USD.
The OCOG’s approach to managing the foreign exchange risk could involve:a) eliminating the risk of disadvantageous changes in exchange rates through the use of options;b) managing the risk through the use of forward exchange contracts;c) accepting the risk; ord) using alternate forms of financial tools to transfer risk to others.
Following alternative a) requires an upfront cost that should be budgeted.
Alternatives b) and c) have little or no upfront cost to be budgeted, but leave some risk with the OCOG. A budget provision to reflect the possibility of losses would be prudent for any non-US OCOG. Although an OCOG might benefit from favourable exchange rate fluctuations, in the absence of a partner such as a government that is willing to accept currency risk, the OCOG should expect a cost for currency management.
A second factor impacting foreign currency gains/losses involves the OCOG deciding whether fluctuations are absorbed at the functional level by recognising gains or losses within functional budgets or whether a central function such as Finance absorbs all gains and losses.
Interest
Interest costs are dependent on managing cash flows, especially in the early years. Costs depend on whether a need for borrowing is anticipated (depends on the timing of spending and the timing of sponsorship and other cash receipts). One solution that can reduce interest costs is to seek any government contributions early in the planning phase, before commercial revenues are available.
Insurance
Insurance costs are highly dependent on the extent of the proposed risk management strategy, especially as it relates to cancellation and other revenue protection coverage. The higher degree of risk aversion results in higher insurance costs. An OCOG closely tied to government may be able to take advantage of government insurance or self-insurance while OCOGs operating on a private model are left to address requirements on their own.
Financial services
Financial services costs are generally more related to organisational and governance matters than operational requirements.
41
The Olympic Winter Games in numbers – September 2017
4 Cost drivers

4.5 Food and beverageFood and beverage costs for future Games may be impacted by the various Olympic Agenda 2020 initiatives to reduce cost and complexity, as described in the introduction to this chapter.
4.5.1 Workforce food and beverage Applicable section of current budget template (2024)
• 2.2 – Food and beverage
HCC – Operational Requirements• FNB 01 – Service principles for stakeholder groups
Historical data
Vancouver 2010 Sochi 2014
Number of venues served and related type of meal
• 10 competition venues (with full services, i.e. breakfast, lunch, dinner and late night dinner, where needed): – 7 city venues – 3 mountain venues
• 3 training venues (with full services, i.e. breakfast, lunch, dinner and overnight meal, where needed).
• 2 Olympic Villages*
• Other sites, including: – Main Media Centre – Whistler Media Centre – Main Distribution Centre – Uniform and Accreditation Centre – Whistler Games Centre – Vancouver 2010 headquarters (Vancouver and Whistler) – Whistler Celebration Plaza – Olympic Family Hotels – Squamish Volunteer Centre – Transport facilities – Vancouver International Airport
• 10 competition venues (with full services, i.e. breakfast, lunch, dinner and late night dinner, where needed): – 5 city venues: – 5 mountain venues
• 3 Olympic villages*
• Other sites, including: – Olympic Park – Main Media Centre – Mountain Media Centre – Fisht Olympic Stadium – Transport Hubs, Transport Depot – Main Distribution Centre
Number of obligatory workforce meals** 688,019 (ordered) 1,617,000*** (delivered)
* See cost driver 4.5.2 Olympic Village food and beverage for details** Obligatory workforce meals exclude meals for contractors*** Includes workforce at villages, competition venues, Olympic Park and transport hubs. Note that the Sochi 2014 OCOG provided three meals/day
to workforce (rather than 1-2 meals/shift as for previous Games) due to the lack of other sources of food around the venues, particularly in the mountains and to the fact that most of the volunteers came from other regions
42
The Olympic Winter Games in numbers – September 2017
4 Cost drivers

4.5.2 Olympic Village food and beverageApplicable section of current budget template (2024)
• 2.2 – Food and beverage
HCC – Operational Requirements• FNB 01 – Service principles for stakeholder groups• VIL 05 – Olympic Village measurements• VIL 11 – Dining hall(s) services and menus
Historical data
Vancouver 2010 Sochi 2014
Coastal Mountain Coastal Mountain Endurance
Number of athletes and officials’ meals*
137,000 162,000 120,000 180,000 80,000
Number of workforce meals*
59,000 125,000 170,000 130,000 70,000
Size of main dining hall (m2) 3,800 4,275 6,000 5,250 3,000
Number of seats for residents
850 900 720 960 360
Number of seats for workforce
300 300 Not documented Not documented Not documented
* These figures do not include McDonald’s meals served in the dining hall
In addition to the data shown above, another cost related to this service is the Olympic Villages’ kitchen equipment.
43
The Olympic Winter Games in numbers – September 2017
4 Cost drivers

4.6 Medical servicesMedical services costs for future Games may be impacted by the various Olympic Agenda 2020 initiatives to reduce cost and complexity, as described in the introduction to this chapter.
The level of equipment and services is impacted by factors such as local medical teams and facilities, and the localisation of venues (mainly villages and competition venues).
4.6.1 Polyclinics (equipment and services)Applicable section of current budget template (2024)
• 2.3.1 – Medical Services (incl. anti-doping) – Medical
HCC – Operational Requirements• MED 06 – Olympic Village Polyclinic
44
The Olympic Winter Games in numbers – September 2017
4 Cost drivers
Historical data
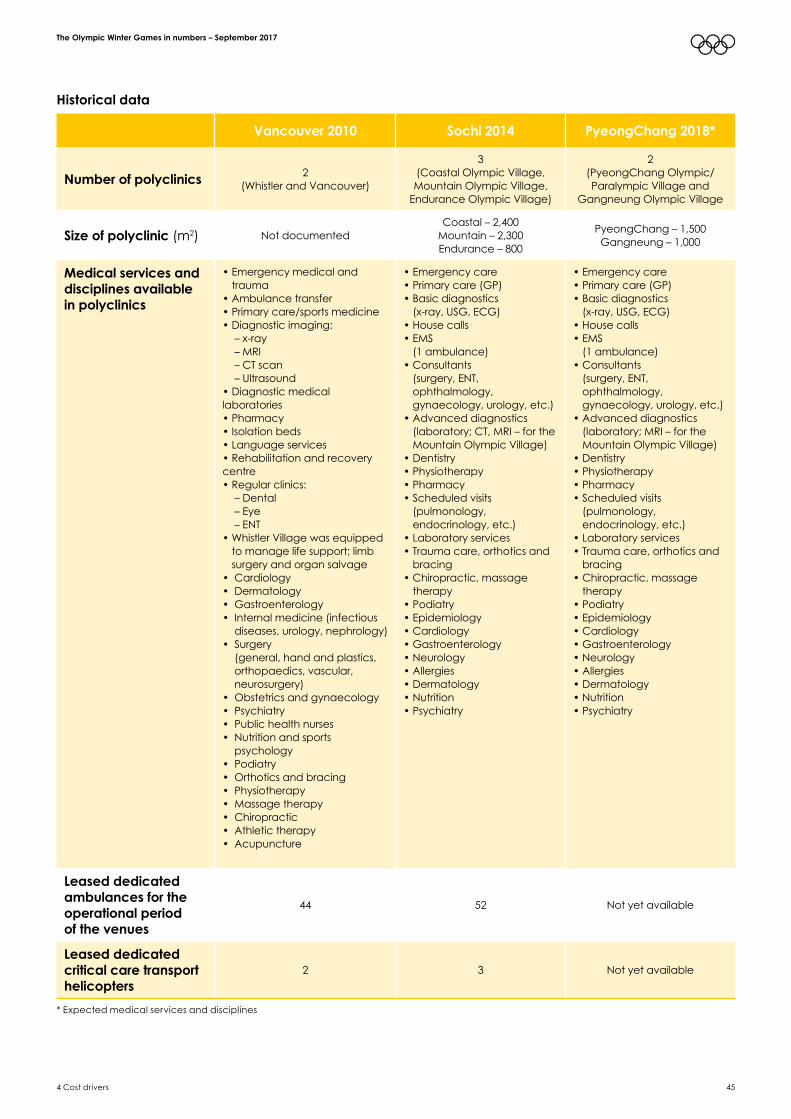
Vancouver 2010 Sochi 2014 PyeongChang 2018*
Number of polyclinics 2 (Whistler and Vancouver)
3 (Coastal Olympic Village, Mountain Olympic Village,
Endurance Olympic Village)
2 (PyeongChang Olympic/Paralympic Village and
Gangneung Olympic Village
Size of polyclinic (m2) Not documentedCoastal – 2,400
Mountain – 2,300Endurance – 800
PyeongChang – 1,500Gangneung – 1,000
Medical services and disciplines available in polyclinics
• Emergency medical and trauma
• Ambulance transfer• Primary care/sports medicine• Diagnostic imaging: – x-ray – MRI – CT scan – Ultrasound• Diagnostic medical laboratories• Pharmacy• Isolation beds• Language services• Rehabilitation and recovery centre• Regular clinics: – Dental – Eye – ENT• Whistler Village was equipped
to manage life support; limb surgery and organ salvage
• Cardiology• Dermatology• Gastroenterology• Internal medicine (infectious
diseases, urology, nephrology)• Surgery
(general, hand and plastics, orthopaedics, vascular, neurosurgery)
• Obstetrics and gynaecology• Psychiatry• Public health nurses• Nutrition and sports psychology• Podiatry• Orthotics and bracing• Physiotherapy• Massage therapy• Chiropractic• Athletic therapy• Acupuncture
• Emergency care • Primary care (GP)• Basic diagnostics
(x-ray, USG, ECG)• House calls • EMS
(1 ambulance)• Consultants
(surgery, ENT, ophthalmology, gynaecology, urology, etc.)
• Advanced diagnostics (laboratory; CT, MRI – for the Mountain Olympic Village)
• Dentistry• Physiotherapy • Pharmacy• Scheduled visits
(pulmonology, endocrinology, etc.)
• Laboratory services• Trauma care, orthotics and
bracing• Chiropractic, massage
therapy• Podiatry• Epidemiology• Cardiology• Gastroenterology• Neurology• Allergies• Dermatology• Nutrition• Psychiatry
• Emergency care • Primary care (GP)• Basic diagnostics
(x-ray, USG, ECG)• House calls • EMS
(1 ambulance)• Consultants
(surgery, ENT, ophthalmology, gynaecology, urology, etc.)
• Advanced diagnostics (laboratory; MRI – for the Mountain Olympic Village)
• Dentistry• Physiotherapy • Pharmacy• Scheduled visits
(pulmonology, endocrinology, etc.)
• Laboratory services• Trauma care, orthotics and
bracing• Chiropractic, massage
therapy• Podiatry• Epidemiology• Cardiology• Gastroenterology• Neurology• Allergies• Dermatology• Nutrition• Psychiatry
Leased dedicated ambulances for the operational period of the venues
44 52 Not yet available
Leased dedicated critical care transport helicopters
2 3 Not yet available
* Expected medical services and disciplines
45
The Olympic Winter Games in numbers – September 2017
4 Cost drivers

4.7 Olympic Torch Relay (OTR)The scope and cost of the Olympic Torch Relay (OTR) can vary greatly from Games to Games depending on factors including:
• the OCOG’s engagement strategy (national and international);• the geographical size of the host territory;• the population dispersion in the host territory; and• the design and manufacture of the torches (sometimes up to 30 per cent of the total OTR budget).
Most OCOGs can secure all or the majority of the costs back in rights revenue from OTR Presenting Partners.
4.7.1 Olympic Torch Relay (OTR) operationsApplicable section of current budget template (2024)
• 5.2 – Torch Relay
HCC – Operational Requirements• OTR 01 – Approval of OTR vision, scope and plans
Historical data
Vancouver 2010 Sochi 2014 PyeongChang 2018
Total distance (km) 45,000 65,000 Not yet available
Number of days 106* 120** 101
Number of communities visited 1,036 129 152
Number of torch bearers >12,000 14,000 7,500
Dedicated staff140 OCOG paid and contractors***
100 presenting partner staff 20,000 volunteers
303 (13 paid and 290 contractors
incl. presenting partner)90 security staff
30,000 volunteers
Not yet available
Number of presenting partners 2 3 3
Number of community celebrations**** 189 129 87
Sets of uniforms 14,000 14,000 Not yet available
Convoy vehicles (full-scale operations) 108 110 Not yet available
Hotels >300 132 Not yet available
Bed nights 26,000 27,000 Not yet available
* 90 days with full-scale operations + 16 days remote with reduced crew** 60 days with full-scale operations + 30 days remote on plane and 30 days remote on train*** The OCOG paid staff and contractors for the Olympic Torch Relay Functional Area are included in the OCOG workforce numbers that can be
found in sections 4.8.1 Long-term OCOG staff and 4.8.2 Games-time workforce**** Where the day’s final torchbearer runs into the celebration site and lights a cauldron
46
The Olympic Winter Games in numbers – September 2017
4 Cost drivers

4.8 People Management
4.8.1 Long-term OCOG staffThe rate at which an OCOG evolves in terms of organisational structures and staff varies from Games to Games and is impacted by factors such as cultural norms, arrangements (if any) with host city/nation governments as a source of staff, outsourcing decisions, skills and event experience available in the labour market, test event plans and timing, the planning lifecycle and the OCOG’s budget. Costs are also affected by organisational hierarchy, compensation philosophy, statutory costs (e.g. taxes and social contributions) and other employment-related conditions in the host city.
For future Games, it is anticipated that a range of IOC initiatives under Olympic Agenda 2020 and Games Management 2020, including turnkey solutions and streamlining of planning processes, may allow for some later staff recruitment dates by the OCOG in impacted areas.
Applicable section of current budget template (2024)• 4.1 – Salaries and benefits
HCC – Operational Requirements• PEM 03 – OCOG organisation evolution
Historical dataLifetime headcount evolution (OCOG employees and other full-time staff, e.g. secondees)
Games – x months Vancouver 2010 Sochi 2014 PyeongChang 2018
72 25 130 50
60 51 230 118
48 158 365 240
36 340 450 341
24 758 645 509
18 1,078 1,000 876
12 1,320 1,378 1,100
6 1,537 1,708 *
* Not known at the time of publication
47
The Olympic Winter Games in numbers – September 2017
4 Cost drivers

4.8.2 Games-time workforceThe size of an OCOG’s Games-time workforce – comprising short-term staff, volunteers and contractors (in addition to the long-term OCOG staff covered in item 4.8.1 above) – varies from Games to Games, impacted by factors such as the venue masterplan, competition schedule and events, service levels, outsourcing decisions, labour laws, host nation labour market capability and cultural attitudes regarding roles appropriate for volunteers versus other types of paid workforce.
Applicable section of current budget template (2024)• 4.1 – Salaries and benefits
HCC – Operational RequirementsNone
Historical data
Workforce type Vancouver 2010 Sochi 2014 PyeongChang 2018**
Paid staff 8,138 10,025 14,601
Volunteers 17,273 19,213 13,503
Contractors 32,239* 24,742 23,026
Total 57,650 53,980 51,130
* Vancouver 2010 accredited large numbers of security workforce and ceremonies team members in the contractor category compared to other recent Olympic Winter Games
** Planned
48
The Olympic Winter Games in numbers – September 2017
4 Cost drivers

4.8.3 UniformsAn OCOG provides uniforms for Games-time staff and volunteers as an important work tool, assisting with easy workforce identification and supporting appropriate health and safety in extreme weather conditions. It is also a valuable keepsake of the Games, particularly for volunteers. The OCOG sets guidelines for uniforming the contractor workforce, but typically does not provide uniforms directly.
Applicable section of current budget template (2024)• 4.2 – Workforce uniforms
HCC – Operational Requirements• PEM 07 – Workforce uniforms programme
Historical dataThe data does not include speciality uniforms, such as those needed in various sports/disciplines or for medical care providers.
Vancouver 2010 Sochi 2014 PyeongChang 2018
Number of staff and volunteer uniforms initially planned
30,000 33,000 34,408
Games workforce uniform components
• Jacket• Vest/gilet• Long-sleeved tee (x2)• Pants/trousers • Toque (beanie)
• Jacket• Pants/trousers • Fleece jacket or hoodie
(according to role)• Long-sleeved polo (x3)• Cap (beanie) • Hat• Gloves • Shoes• Thermo suit (for some roles)• Backpack• Bag• Belt bag (hip bag)• Raincoat (for some roles)
• Jacket• Pants/Trousers• Mid-weight jacket• Long-sleeved tee• Toque (beanie)• Gloves• Boots• Backpack
49
The Olympic Winter Games in numbers – September 2017
4 Cost drivers

4.8.4 Headquarters office space (peak – G-6 months)Office space needs are driven by the size of the OCOG, workforce numbers and evolution, local market practices and whether or not contractors and partners are embedded within the OCOG offices. There can be significant other space needs in the lead up to Games (such as for the ceremonies production team, etc.), but those are not typically included in headquarters office space planning.
The government partners (delivery authorities and dedicated government offices), except for secondees who were embedded in the OCOG, are excluded from the historical data provided below.
Applicable section of current budget template (2024)• 7.1.1 Administration and governance costs – Office administration costs
HCC – Operational RequirementsNone
Historical dataHeadquarters office space needs reflect the lifetime headcount evolution (see section 4.8.1 Long-term OCOG staff), reaching a peak six months before the Games.
Vancouver 2010 Sochi 2014 PyeongChang 2018
Metres squared 16,722 26,400* 12,403**
* The Sochi 2014 headquarters included 18,400m2 in offices and 8,000m2 in other spaces (cafeteria, coordination centres, etc.) in Sochi** At June 2017
50
The Olympic Winter Games in numbers – September 2017
4 Cost drivers
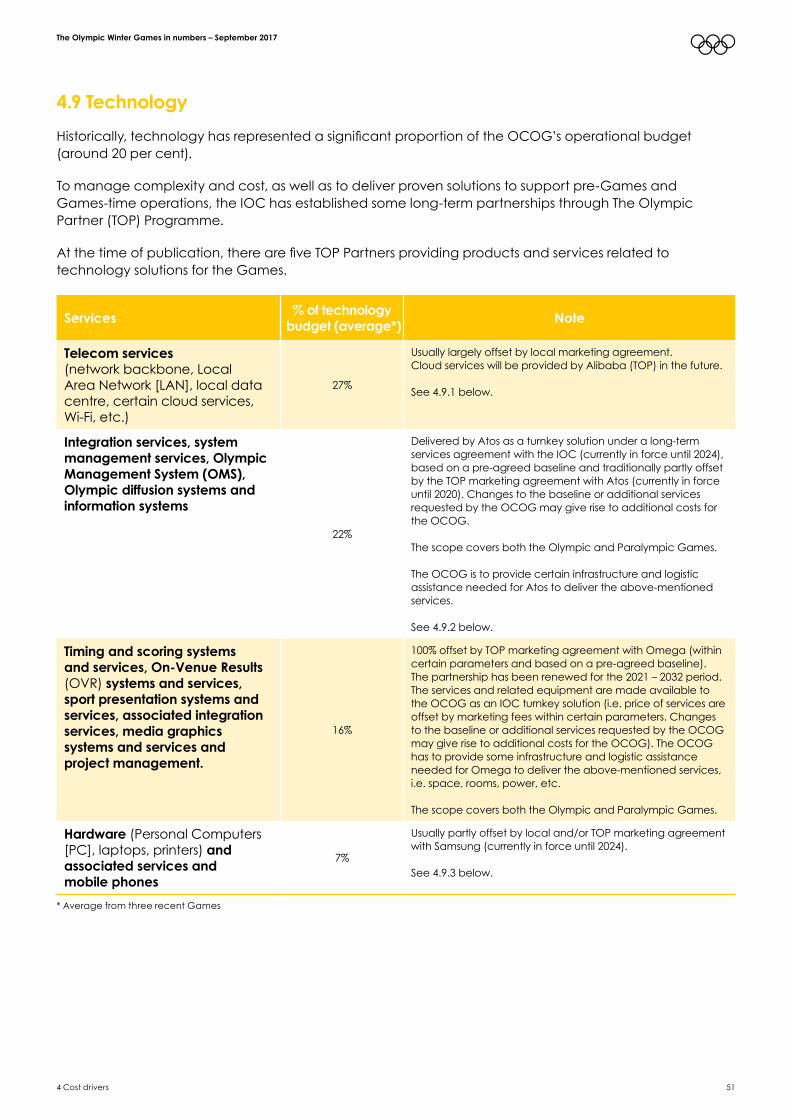
4.9 TechnologyHistorically, technology has represented a significant proportion of the OCOG’s operational budget (around 20 per cent).
To manage complexity and cost, as well as to deliver proven solutions to support pre-Games and Games-time operations, the IOC has established some long-term partnerships through The Olympic Partner (TOP) Programme.
At the time of publication, there are five TOP Partners providing products and services related to technology solutions for the Games.
Services % of technology budget (average*) Note
Telecom services (network backbone, Local Area Network [LAN], local data centre, certain cloud services, Wi-Fi, etc.)
27%
Usually largely offset by local marketing agreement.Cloud services will be provided by Alibaba (TOP) in the future.
See 4.9.1 below.
Integration services, system management services, Olympic Management System (OMS), Olympic diffusion systems and information systems
22%
Delivered by Atos as a turnkey solution under a long-term services agreement with the IOC (currently in force until 2024), based on a pre-agreed baseline and traditionally partly offset by the TOP marketing agreement with Atos (currently in force until 2020). Changes to the baseline or additional services requested by the OCOG may give rise to additional costs for the OCOG.
The scope covers both the Olympic and Paralympic Games.
The OCOG is to provide certain infrastructure and logistic assistance needed for Atos to deliver the above-mentioned services.
See 4.9.2 below.
Timing and scoring systems and services, On-Venue Results (OVR) systems and services, sport presentation systems and services, associated integration services, media graphics systems and services and project management.
16%
100% offset by TOP marketing agreement with Omega (within certain parameters and based on a pre-agreed baseline). The partnership has been renewed for the 2021 – 2032 period. The services and related equipment are made available to the OCOG as an IOC turnkey solution (i.e. price of services are offset by marketing fees within certain parameters. Changes to the baseline or additional services requested by the OCOG may give rise to additional costs for the OCOG). The OCOG has to provide some infrastructure and logistic assistance needed for Omega to deliver the above-mentioned services, i.e. space, rooms, power, etc.
The scope covers both the Olympic and Paralympic Games.
Hardware (Personal Computers [PC], laptops, printers) and associated services and mobile phones
7%
Usually partly offset by local and/or TOP marketing agreement with Samsung (currently in force until 2024).
See 4.9.3 below.
* Average from three recent Games
51
The Olympic Winter Games in numbers – September 2017
4 Cost drivers

Services % of technology budget (average*) Note
Audio-visual equipment, professional displays and video boards systems, public announcement systems, television units, projectors, cameras, video surveillance equipment, car navigation, some multi-media products and associated services
5%
Traditionally partly offset by TOP marketing agreement with Panasonic (at the date of publication,currently in place until 2024).
See 4.9.4 below.
Design and development of OCOG website 5% Usually partly offset by local marketing agreement.
IT security 3% Usually partly offset by local marketing agreement.
Miscellaneous (internal IT, Games Management Systems [GMS], radios, software licenses, etc.)
15% Many different projects each representing 2% or less of the overall Technology budget.
* Average from three recent Games
The OCOG paid staff costs are not considered in the above table as they are typically included in a centralised OCOG People Management budget.
The data below reflects the situation at the times of each Games. As technology evolves so rapidly and new ways of using technology constantly emerge, this data should be considered in the context of these times.
Additionally, technology costs for future Games may be impacted by the various Olympic Agenda 2020 initiatives to reduce cost and complexity, as described in the introduction to this chapter.
52
The Olympic Winter Games in numbers – September 2017
4 Cost drivers

4.9.1 Telecom services (network backbone, Local Area Network [LAN], local data centre, cloud services, Wi-Fi, etc.)
Costs are driven by operational and broadcast requirements. The total cost is impacted by venue configuration (especially outdoor/mountain venues) and the current state of telecommunications infrastructure in the host country.
Applicable section of current budget template (2024)• 3.2 – Telecom and other technologies
HCC – Operational Requirements• TEC 02 – Telecommunications • TEC 03 – Internet infrastructure• TEC 04 – Telecommunications infrastructure• TEC 06 – Deployment of the telecommunications solution
Historical dataIt should be noted that staffing and services represent a major part of this cost driver.
Vancouver 2010 Sochi 2014 PyeongChang 2018
Spectrum management
Spectrum licences requests Not documented 5,000 9,481*
Spectrum frequencies assigned 2,768 12,500 Not yet available
Wireless devices
Devices (usage subject to specific OCOG authorisation) 56,300 Not documented Not yet available
Including personal mobile radios 7,650 10,234 Not yet available
Fixed and wireless telecommunications
Access switches 800 1,500 2,111**
Routers (core and distribution) 55 84 240**
Wi-Fi access points Not documented >1,100 6,000
Telephones 7,000 4,246 7,000**
Ethernet ports active 31,464 54,270 29,308**
Kilometres of overlay cabling placed 700 Not documented Optical fibre: 487**
UTP: 395**
Route kilometres of optical fibre cable required 285 260 363**
Fibre-based venues 21 31 75**
Mobile phones
9,454 18,166 12,000**
Data centres
Primary Data Centre 1 1 2
Secondary Data Centre 1 1 2
* In progress at the time of publication ** Planned
53
The Olympic Winter Games in numbers – September 2017
4 Cost drivers

4.9.2 Integration services and information systemsUnder the current agreements with Atos, Atos services for the Olympic and the Paralympic Winter Games acquired by the OCOG are partially covered by marketing rights until 2020. The net remaining balance to be paid in euros by the OCOG to Atos is ultimately covered by the IOC contribution (a portion of which is paid in euros to naturally hedge the next expenditure). Beyond 2020, the above is subject to further discussions with Atos and IOC’s internal consideration, The IOC will communicate further information in due course.
Staffing represents the main cost of the integration services.
Applicable section of current budget template (2024)• 3.1 – Information technology
HCC – Operational RequirementsNone
Historical data
Games technology systemsThe data below represents the current information systems model that has been recently defined.
Systems Applications
Olympic Management System (OMS*) • Accreditation• Competition schedule • Sports Entries and Qualification (SEQ)• Workforce management
Business systems • Computer-aided Design (CAD)• Contracts management• Finance• Information and documentation management• Intranet• People management/payroll• Procurement• Etc.
Games Management Systems (GMS) (collection of applications and tools needed by the OCOG FAs to manage planning, delivery and operations for the Games, as well as test events, the Olympic Torch Relay and other pre-Games activities)
• Arrivals and departures• Accommodation • Logistics• Protocol• Rate card management• Space management• Ticketing• Transport• Etc.
* Provided by Atos
54
The Olympic Winter Games in numbers – September 2017
4 Cost drivers
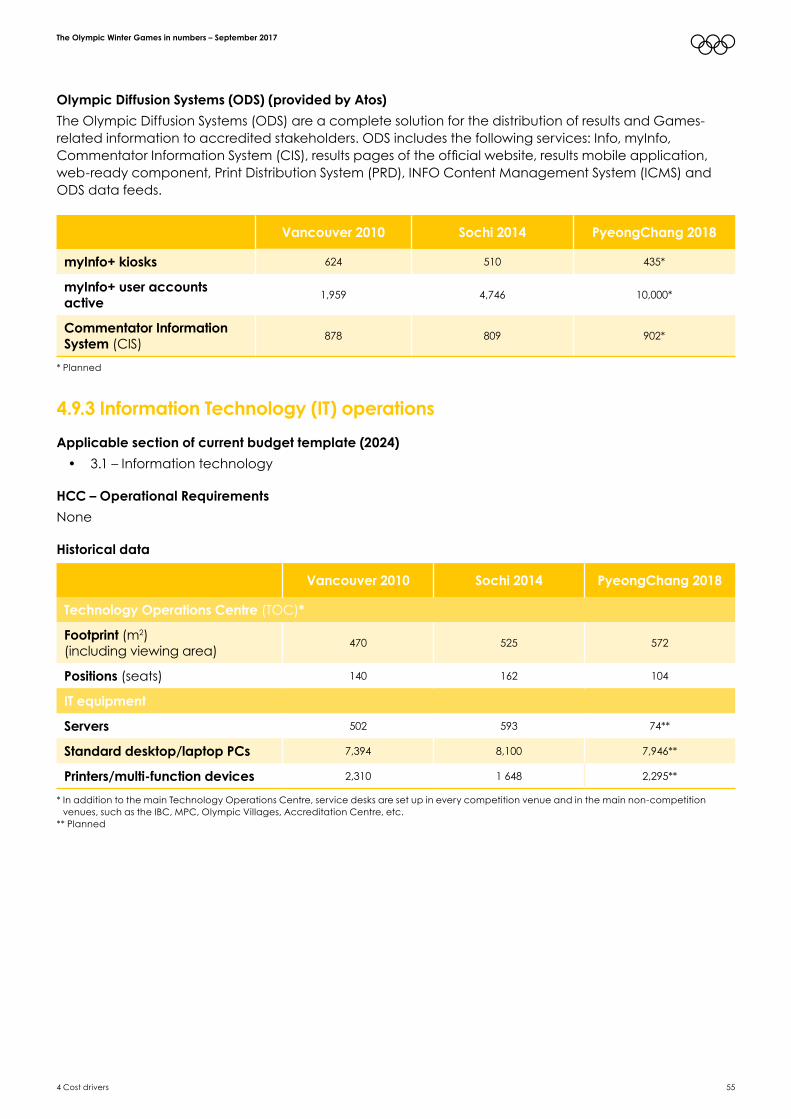
Olympic Diffusion Systems (ODS) (provided by Atos)The Olympic Diffusion Systems (ODS) are a complete solution for the distribution of results and Games-related information to accredited stakeholders. ODS includes the following services: Info, myInfo, Commentator Information System (CIS), results pages of the official website, results mobile application, web-ready component, Print Distribution System (PRD), INFO Content Management System (ICMS) and ODS data feeds.
Vancouver 2010 Sochi 2014 PyeongChang 2018
myInfo+ kiosks 624 510 435*
myInfo+ user accounts active 1,959 4,746 10,000*
Commentator Information System (CIS) 878 809 902*
* Planned
4.9.3 Information Technology (IT) operationsApplicable section of current budget template (2024)
• 3.1 – Information technology
HCC – Operational RequirementsNone
Historical data
Vancouver 2010 Sochi 2014 PyeongChang 2018
Technology Operations Centre (TOC)*
Footprint (m2) (including viewing area) 470 525 572
Positions (seats) 140 162 104
IT equipment
Servers 502 593 74**
Standard desktop/laptop PCs 7,394 8,100 7,946**
Printers/multi-function devices 2,310 1 648 2,295**
* In addition to the main Technology Operations Centre, service desks are set up in every competition venue and in the main non-competition venues, such as the IBC, MPC, Olympic Villages, Accreditation Centre, etc.
** Planned
55
The Olympic Winter Games in numbers – September 2017
4 Cost drivers

4.9.4 Audio-visual (AV) equipmentThe scope of AV equipment depends on the venue concept and existing facilities. It is impacted by equipment provided by the TOP Partner.
Applicable section of current budget template (2024)• 3.2 – Telecoms and other technologies
HCC – Operational RequirementsNone
Historical data
Vancouver 2010 Sochi 2014 PyeongChang 2018
Televisions 4,200 2,610 6,500*
Light-emitting Diodes (LEDs) (large screen display system)
12 venues, 25 screens,
805m228 screens
15 venues, 22 screens,
858m2*
Monitoring and surveillance cameras 1,300 11,909 810*
Professional audio system 17 venues, 91 systems 96 16 venues,
89 systems*
Digital Light Processing (DLP) projectors 17 202 150*
* Planned
The above data does not include broadcasting deck equipment, cameras or monitors.
56
The Olympic Winter Games in numbers – September 2017
4 Cost drivers

4.10 Test events managementSince the Vancouver and Sochi Olympic Winter Games, the IOC and IFs have been working together to make requirements related to test events even more flexible, which could lead to significant savings in the test event programme. Organising Committees are encouraged, based on each OCOG’s specific context, to assess the number and level of test events needed. This includes hosting invitational events, maximising use of existing events and/or observing events to fulfil testing needs and carefully assessing the scope of each test event the OCOG will stage.
4.10.1 Test eventsApplicable section of current budget template (2024)
• 2.12 – Test events
HCC – Operational Requirements• GAM 05 – Test events
Historical data
Vancouver 2010 Sochi 2014
Number of test events organised 14 14
Number of participating athletes* 2,213 3,034
* Planned
57
The Olympic Winter Games in numbers – September 2017
4 Cost drivers

Vancouver 2010 Sochi 2014
Sport/Discipline Name Test event type
Number of athletes* Name Test event type Number of
athletes
Biathlon Biathlon World Cup Test Event International 200 IBU World Cup
Biathlon International 230
Bobsleigh/ Bobsleigh and Skeleton
FIBT Bobsleigh and Skeleton
World Cup TourInternational 225
FIBT Bobsleigh and Skeleton
World Cup FinalInternational 200
CurlingWorld Junior
Curling Championships
Tournament
International 100 World Junior Curling Championships International 100
Ice Hockey
Women’s Four Nations and Men’s Four Team
Tournament
International 88 Junior World Championships International 220
Luge Luge World Cup International 125 Luge World Cup Final Stage International 130
Skating/ Figure Skating
ISU Four Continents
Figure Skating Championships
International 110 ISU Grand Prix of Figure Skating Final International 72
Skating/ Speed Skating
ISU World Single Distances
Speed Skating Championships
International 170
ISU World Single Distances Speed Skating Championships
International 134
Skating/ Short Track Speed Skating
ISU Short Track Speed Skating
World Cup International 170 ISU World Cup
Short Track International 179
Skiing/ Alpine Skiing
FIS Alpine World Cup International 350 FIS Alpine Skiing
European Cup Finals International 120
Skiing/ Cross-Country
FIS Cross-Country World
CupInternational Not
documentedFIS Cross-Country
World Cup International 277
Skiing/ Freestyle Skiing
FIS Freestyle World Cup International 250
FIS Snowboard and Freestyle Skiing
World Cup stagesInternational 700
Skiing/ Nordic Combined
FIS Nordic Combined World Cup
International 55FIS Nordic
Combined World Cup
International 65
Skiing/ Ski Jumping
FIS Ski Jump World Cup International 70 FIS Ski Jumping
World Cup stages International 116
Skiing/ Snowboard
FIS Snowboard World Cup International 300
FIS Snowboard and Freestyle Skiing
World Cup stagesInternational 700
* Planned
58
The Olympic Winter Games in numbers – September 2017
4 Cost drivers

4.11 TransportEach Games’ transport strategy has a cost impact. For example:
• The Vancouver 2010 transport strategy was to focus on (i) bussing spectators from Vancouver by establishing city park and ride services, and (ii) allowing cars within close proximity to Whistler (at Squamish) to provide mountain park and ride services; and
• The Sochi 2014 transport strategy was to construct a combined road and rail transport connection which required significant infrastructure.
The Winter Games are often confronted with the challenge of moving large numbers of stakeholders to/from mountain venues, using separated systems where road capacity is limited, public transport is limited or non-existent, venue space is limited and there are often difficult weather conditions.
The distance between the mountains and the city/coastal venues and the dispersed accommodation locations affects the numbers of people that need to be moved and the distances they need to travel.
It is important to ensure that venue capacity can be supported by the transport capacity of existing and/or temporary services.
Transport costs for future Games may be impacted by the various Olympic Agenda 2020 initiatives to reduce cost and complexity, as described in the introduction to this chapter.
4.11.1 Rolling stock (buses and fleet vehicles)The total number of buses (and their drivers) and fleet vehicles needed to deliver agreed services is determined by a range of factors including:
• agreed detailed service levels, with accommodation locations as a key input into service requirements;
• travel times;• vehicle capacity (some mountain roads will not accommodate high capacity buses thus requiring
a larger quantity of smaller vehicles is required);• venue population model; and• indirect costs that can include the need to increase existing public transport operations (buses)
with more fleet needed to provide an adequate level of public transport.
Applicable section of current budget template (2024)• 2.8 – Transport
59
The Olympic Winter Games in numbers – September 2017
4 Cost drivers

HCC – Operational Requirements• TRA 06 – Transport provisions and priorities• TRA 10 – Other Olympic cities• TRA 11 – Ceremonies services• TRA 12 – Road event vehicles• TRA 13 – Athletes’ and team officials’ transport system• TRA 15 – Team sport vehicles• TRA 17 – Victory Ceremony transport for medallists• TRA 18 – NOC dedicated vehicles• TRA 20 – NOC/NPC equipment vehicles• TRA 22 – Car pool of accessible vehicles• TRA 26 – IF Transport System• TRA 27 – IF allocated vehicles• TRA 28 – Media Transport System• TRA 29 – OBS transport services• TRA 30 – Accommodation and IBC/MPC transport service• TRA 32 – Photo pool allocated vehicles• TRA 36 – Marketing partner transport services• TRA 39 – Marketing partner allocated vehicles and drivers• TRA 46 – Observer programme• TRA 47 – Medical Commission allocated vehicles• TRA 48 – Court of Arbitration for Sport (CAS) allocated vehicles• TRA 49 – World Anti-Doping Agency (WADA) allocated vehicles• TRA 50 – IOC administration allocated vehicles and VAPPs• TRA 58 – Fleet operations – fuel
Historical data
Vancouver 2010 Sochi 2014 Pyeongchang 2018
Number of buses 1,672 998 1,199
Number of vans 700 264 770
Number of fleet vehicles* 4,629 3,700 3,189
Fuel used by OCOG Transport-operated buses (litres)
6,238,242 (from 2005-2010)
1,986,800 (estimate for
Games-time period based on 100 litres per day/bus)
2,550,000 (estimate for Games-time
operational period based on 100 litres per day/bus)
Fuel used by OCOG Transport-operated fleet vehicles (litres)
3,466,295 (2005-2010)
185,200 diesel371,453 unleaded gasoline
(Games-time period)
306,700 diesel460,100 gasoline
(estimate for Games-time period based on 60 litre fuel tanks and a 40% diesel/60%
gasoline split filled every third day over Games-time
period)
*The number of fleet vehicles is impacted by the sponsorship contract structure
60
The Olympic Winter Games in numbers – September 2017
4 Cost drivers

4.11.2 Space needs (bus depots, fleet depots, venue transport and parking spaces)
The amount of space needed will depend on a range of factors generally associated with the final service level agreements, the final venue population model, the road network and associated travel times (longer travel times can increase bus and fleet requirements).
Finding existing sites large enough to park and operate large numbers of buses and fleet vehicles is often challenging; in many instances the OCOG has to find and acquire land and carry out earth (civil engineering) works.
Parking, operational and access requirements and stakeholder expectations are key drivers of venue transport space needs.
Applicable section of current budget template (2024)• 2.8 – Transport
HCC – Operational RequirementsNone
Historical data
Vancouver 2010 Sochi 2014 PyeongChang 2018
Number of bus depots 3 4 4
Bus depots’ total bus capacity 1,122 998 1,043
Bus depots’ total area (hectares) 31 18 19
Number of fleet depots 3 4 5
Fleet depots’ total fleet vehicle capacity 2,944 3,058 1,352
Fleet depots’ total area (hectares) 18 17 18
Total number of venue parking spaces – fleet
11,500 (for 20 competition and
non-competition venues)
9,426 (for 29 competition and
non-competition venues)
4,182 (for 24 comp and
non-comp venues)
Number of park and ride lots 6 4 10*
Park and ride lots’ vehicle capacity 9,400 Not documented 11,165*
* Estimate
Note: the number of buses and fleet vehicles is shown in 4.11.1 Rolling stock.
61
The Olympic Winter Games in numbers – September 2017
4 Cost drivers

4.12 Venue development and general infrastructure
4.12.1 Land acquisition, temporary venues, tents and trailers, site adaptation, temporary seating and temporary lighting
Cost related to venue development and general infrastructure, including temporary venues, are very contextual and thus vary greatly from Games to Games.
Contextual differences for Vancouver and Sochi are reflected in the table below. The main varying factors related to these differences are:
• Land acquisition costs: the degree to which land needed is included in Venue Use Agreements and the contractual arrangements between the land owners and the OCOG. For example, for some Games, publicly-owned land has been made available to an OCOG for minimal or even zero cost, whereas privately-owned land typically has a rental cost and/or business loss compensation fees;
• Tents and cabins/trailers/prefabricated buildings’ costs: the extent to which existing or newly-built venues can accommodate Games spatial needs, the extent to which the legacy needs of newly-built venues aligns with Games needs and the number of temporary venues;
• Site adaptation costs: the use of the land prior to it being used for the Games, the type of temporary installation needed for the Games, the split of responsibilities between the OCOG and venue owners for site adaptation and remote locations of mountain venues;
• Temporary seating structure costs: the extent to which existing or newly-built venues can accommodate the Games’ seating capacity needs;
• Temporary lighting costs: the extent to which the lighting in existing or newly-built venues meets Games’ needs for both competition and broadcast purposes.
Venue development and general infrastructure costs may be impacted by the various Olympic Agenda 2020 initiatives to reduce cost and complexity, as described in the introduction of this chapter. These initiatives include:
• A requirement that there be no new permanent venues unless there is a clear post-Games need substantiated by a financially viable legacy plan;
• More flexibility for the venue master plan, allowing maximum use of existing venues, including those outside the host city/country;
• No minimum venue capacity requirements for competition venues; rather, venue capacity is to be adapted to local needs and context;
• Optimised Games-specific venue requirements such as roofing, ceiling heights, vertical drop or other technical aspects.
To assist cities with alternative venue proposals according to their context, the IOC is developing generic Olympic Venue Briefs, which will provide cities with clear, comprehensive and ratified definition of all IF and FA requirements and key elements needed in venues.
The various types of turnkey solutions currently being explored by the IOC related to venues are: • Assisting in venue planning, design, scoping and operational planning;• Assisting in venue integrated planning and schedules; and/or• Assisting in venue infrastructure cost planning.
62
The Olympic Winter Games in numbers – September 2017
4 Cost drivers

Applicable section of current budget template (2024)• 1.3.1 – Temporary infrastructure – overlay – competition venues• 1.3.2 – Olympic/Paralympic Village• 1.3.3 – IBC/MPC• 1.3.4 – Other Key Olympic Venues• 1.3.5 – Other venues/sites • 2.8 – Transport (as site adaptation and land acquisition include Transport sites)• 2.10 – Venue operations management
HCC – Operational Requirements• VEN 02 – Sites and Master List of Sites• VEN 05 – Division of responsibilities for venue development• VEN 12 – Construction typology (permanent vs. temporary)• BRS 03 – Games Operations Phase – facilities and services – Venues• BRS Annex 1 – Operational Specifications for Broadcasting Services and Facilities • BRS Annex 3 – Specifications on Broadcast Lighting
Percentage of OCOG Venues and Infrastructure budget
Vancouver 2010 Sochi 2014**
Land acquisition (beyond land covered by Venue Use Agreements)
27* Not documented
Tents/trailers 26 30***
Site adaptation (major site works at all venues to prepare venues for temporary installations)
19**** 1
Temporary seating 8 1
Temporary lighting 5 2
* Vancouver 2010’s costs for land acquisition were primarily caused by the cost of renting one area of land that was essential to the Games** The Sochi 2014 Venues and Infrastructure budget included costs for temporary power (bas 0.4 kV and 10 kV) and percentages were calculated
accordingly *** Excludes temporary toilets **** Includes transport sites
63
The Olympic Winter Games in numbers – September 2017
4 Cost drivers
4.13 Venue management
4.13.1 Venue Use Agreements (VUA)Venue Use Agreements (VUA) are the contracts agreed between the OCOG and venue owners/operators for the OCOG’s use of competition, non-competition venues and support facilities for the Games and test events. The cost of VUAs can vary widely depending on the nature of the agreements, the duration of OCOG non-exclusive and exclusive use of the different areas of the venue (use areas and time periods), the extent of what is provided by the venue owner (e.g. existing staff, existing equipment, provision of services, …), the usual use of the venue (e.g. commercial rental) and who owns the venue.
Venue management costs for future Games may be impacted by a number of Olympic Agenda 2020 initiatives to reduce cost and complexity, as described in the introduction to this chapter. Initiatives include adjustment of venue use periods to optimise the fit-out phase (the period of temporary installations) and subsequently to reduce rental costs.
Applicable section of current budget template (2024)• 2.1.10 – Venue Operations Management
HCC – Operational Requirements• VEN 14 – Venue Use Agreements (VUA)
64
The Olympic Winter Games in numbers – September 2017
4 Cost drivers

Historical data
Vancouver 2010 Sochi 2014 PyeongChang 2018
Sport Venue name
Games-time venue owner
Games exclusive use period
Venue name
Games-time venue owner
Games exclusive use period
Venue name
Games exclusive
use period*
Biathlon Whistler Olympic Park VANOC 01/09/2009 –
30/04/2010
Laura Cross-Country
Ski & Biathlon CentreGazprom 01/12/2013 –
31/04/2013Alpensia
Biathlon Centre01/11/2017 – 31/03/2018
Bobsleigh/ Skeleton and Luge
Whistler Sliding Centre VANOC 01/09/2009 –
31/03/2010Sanki
Sliding Centre SC Olympstroy 07/01/2013–24/03/2014
Alpensia Sliding Centre
01/01/2018 – 30/04/2018
Curling Vancouver Olympic Centre
Vancouver Board of Parks and Recreation
01/12/2009 – 01/04/2010
Ice Cube Curling Centre OOO Mostovik 07/01/2014 –
07/04/2014Gangneung
Curling Centre01/09/2017 – 31/03/2018
Ice hockey 1 Canada Hockey Place
Aquilini Investment Group
28/01/2010 – 04/03/2010
Bolshoy Ice Dome SC Olympstroy 01/07/2013 –
15/05/2014Gangneung
Hockey Centre20/03/2017 – 30/04/2018
Ice hockey 2 UBC Thunderbird Arena
University of British Columbia
13/12/2009 – 30/04/2010
Shayba Arena UGMK – Holding 07/01/2014 –
24/03/2014Kwandong Hockey
Centre02/03/2017 – 30/06/2018
Skating (figure skating and short track speed skating)
Pacific Coliseum
Provincial Government entity
04/01/2010 – 31/03/2010
Iceberg Skating Palace SC Olympstroy 07/01/2014 –
23/02/2014Gangneung
Ice Arena01/09/2017 – 31/03/2018
Skating (speed skating)
Richmond Olympic Oval
City of Richmond
01/12/2009 – 31/03/2010
Adler Arena Skating Centre Centre Omega OJSC 07/01/2014 –
06/03/2014Gangneung
Oval01/09/2017 – 31/03/2018
Skiing (alpine skiing)
Whistler Creekside
Intrawest 01/02/2010 – 22/03/2010
Rosa Khutor Alpine Centre
Rosa Khutor LLC 07/01/2014 – 01/05/2014
Yongpyong Alpine Centre
(for technical events)**
01/11/2017 – 01/03/2018
Jeongseon Alpine Centre
(for speed events)***
01/11/2017 – 31/05/2018
Skiing (cross-country and nordic combined)
Whistler Olympic Park – Cross-Country
Stadium
VANOC 01/09/2009 – 30/04/2010
Laura Cross-Country
Ski & Biathlon CentreGazprom 01/12/2013 –
31/04/2013Alpensia Cross-Country
Skiing Centre01/11/2017 – 31/03/2018
Whistler Olympic Park –
Ski Jumping Stadium
VANOC 01/09/2009 – 30/04/2010
RusSki Gorki Jumping Centre Krasnaya Polyana 07/01/2014 –
20/03/2014Alpensia
Ski Jumping Centre01/11/2017 – 31/03/2018
Snowboard and Freestyle
Cypress Mountain Boyne Resorts 01/02/2010 –
08/03/2010Rosa Khutor Extreme Park Rosa Khutor LLC 07/01/2014 –
31/03/2014
Bokwang Snow Park
01/12/2017 – 01/05/2018
Alpensia Ski Jumping Centre
(for snowboard big air)
01/11/2017 – 31/03/2018
* Unconfirmed
The Olympic Winter Games in numbers – September 2017
654 Cost drivers


Annexes
Annex I: Vancouver 2010 budget 68Annex II: 2024 budget template 79Annex III: Sources 81Annex IV: Acronyms 82
The Olympic Winter Games in numbers – September 2017
67

Annex I: Vancouver 2010 budget
Vancouver 2010 Lifetime Budget for Olympic and Paralympic Games in 2010/2017 values
Summary budget (rounded)***
Revenues (in millions) 2010 CAD 2010 USD* 2017 USD** %
1 IOC Contribution 426 347 390 20%
2 TOP Programme (gross) 175 143 160 8%
3 Domestic Sponsorship (gross) 729 594 668 35%
4 Ticket Sales 282 230 258 14%
4.1 Ticket Sales Revenue 272 222 250
4.2 Additional Ticketing products (incl. Hospitality) 10 8 9
5 Licensing & Merchandising 77 62 70 4%
5.1 Licensing products 77 62 70
5.2 Philatelic – – –
5.3 Coins – – –
6 Government contribution 190 155 174 9%
6.1 Olympic Games 138 112 126
6.1.1 National Government 48 39 44
6.1.2 Regional Government 82 67 75
6.1.3 Local Government 8 7 7
6.2 Paralympic Games 52 42 48
6.2.1 National Government 32 26 29
6.2.2 Regional Government 20 16 18
6.2.3 Local Government – – –
7 Lotteries – – –
8 Other Revenues 203 166 186 10%
8.1 Donations 8 6 7 0
8.2 Asset Disposal 15 12 14
8.3 Other Revenues 180 147 165
9 Total Revenues 2,082 1,695 1,908 100%* 2010 CAD to USD: Purchasing-Power-Parities (PPP) adjusted International Monetary Fund (IMF) data ** USA Gross Domestic Product (GDP) deflator (IMF indicators) *** Numbers might not sum up due to rounding
68
The Olympic Winter Games in numbers – September 2017
Annexes

Expenditures (in millions) 2010 CAD
2010 USD*
2017 USD** %
1 Venue Infrastructure 215 175 197 10% 1.1 Capital Investment – – – 1.2 Temporary-Demountable Infrastructure – – – 1.2.1 Competition venues – – – 1.2.2 Non-Competition venues – – – 1.3 Temporary Infrastructure (incl.
maintenance costs) 129 105 118
1.3.1 Competition venues 112 91 102 1.3.2 Olympic/Paralympic Village 12 10 11 1.3.3 IBC/MPC – – – 1.3.4 Other Key Olympic Venues – – – 1.3.5 Other venues/sites 5 4 5 1.4 Energy 83 67 76 1.5 Other Venue Infrastructure expenses 4 3 4 2 Sport, Games Services & Operations 631 513 578 30% 2.1 Accommodation 52 42 47 2.2 Food and Beverage 47 38 43 2.3 Medical Services (incl. Anti-Doping) 31 25 28 2.4 Logistics 35 29 32 2.5 Stakeholder Services 13 11 12 2.6 Security 10 8 9 2.7 Sports 57 47 53 2.8 Transport 161 131 147 2.9 Events Services 15 12 14 2.10 Venue Operations Management 147 120 135 2.11 Villages Operations 10 8 10 2.11.1 Olympic/Paralympic Village
Operations 10 8 10
2.11.2 Media Village(s) Operations – – – 2.11.3 Other Villages operations – – – 2.12 Test Events 20 17 192.13 Other Games Services & Operations expenses 31 25 29
Expenditures (in millions) 2010 CAD
2010 USD*
2017 USD** %
3 Technology 345 281 316 17% 3.1 Information Technology 236 192 216 3.2 Telecoms 100 81 91 3.3 Internet Infrastructure 9 8 9 3.4 Other Technology expenses – – – 4 People Management 339 276 311 16%5 Ceremonies & Culture 130 106 119 6% 5.1 Opening & Closing Ceremonies 78 63 71 5.2 Torch Relay 29 23 26 5.3 Culture and Education 24 20 22 5.4 Other Ceremonies & Culture expenses – – – 6 Communications, Marketing and Look 107 87 98 5% 6.1 Communication, Community Relations
& PR 15 12 13
6.2 Look of the Games 22 18 20 6.3 Marketing and Commercial Programme 70 57 64 6.4 Other Comms, Marketing and Look
expenses – – –
7 Corporate Administration and Legacy 127 104 117 6% 7.1 Administration and Governance 123 100 113 7.2 Environment, Sustainability and Legacy 4 3 4 7.3 Other Corporate Administration
expenses – – –
8 Other Expenses (incl. Marketing right) 187 152 171 9%9 Contingency – – –
10 Total Expenditures 2,081 1,694 1,907 100%
Net Financial Result (in millions) 2010 CAD
2010 USD*
2017 USD**
Surplus/Shortfall (Rev – Exp) 0 0 0
* 2010 CAD to USD: PPP adjusted (IMF data) ** USA GDP deflator (IMF indicators) *** Numbers might not sum up due to rounding
Summary budget (rounded)***The Olympic Winter Games in numbers – September 2017
69Annexes

Revenues (in millions) 2010 CAD 2010 USD* 2017 USD**
1 IOC Contribution 426 347 390 2 TOP Programme (gross) 175 143 160 3 Domestic Sponsorship (gross) 729 594 668 3.1 Olympic Games Sponsorship 697 567 638 3.1.1 Tier 1 453 369 415 3.1.2 Tier 2 131 107 120 3.1.3 Tier 3 113 92 103 3.2 Torch Relay Sponsorship 32 26 29 Sponsorship 32 26 29 3.3 Paralympic Games Sponsorship – – – 4 Ticket Sales 282 230 258 4.1 Ticket Sales Revenue 272 222 250 4.1.1 Olympic Games 252 205 231 4.1.2 Paralympic Games 5 4 5 4.1.3 Test Events 6 5 6 4.1.4 Ceremonies and Cultural events – – – 4.1.5 Other – Ticketing service recoveries 9 8 8 4.2 Additional Ticketing products
(inc. Hospitality, packages, etc.) 10 8 9
CLUB 2010 – premium ticket packages 10 8 95 Licensing & Merchandising 77 62 70 5.1 Licensing products 77 62 70 2010 Store 14 12 13 Advertising fund 1 1 1 Licensing program 61 50 56 5.2 Philatelic – – – 5.3 Coins – – –
Revenues (in millions) 2010 CAD 2010 USD* 2017 USD**
6 Government contribution 190 155 174 6.1 Olympic Games 127 103 116 6.1.1 National Government 37 30 34 Medical services contribution 1 1 1 Official languages contribution 1 1 1 Ceremonies contribution 20 16 18 Torch relay 15 12 14 6.1.2 Regional Government 82 67 75 Medical services contribution 13 11 12 Sustainability programs – – – Olympic programs 69 56 63 6.1.3 Local Government 8 7 7 Whistler celebration plaza 3 2 3 Traffic management contribution 5 4 5 6.2 Paralympic Games 52 42 48 6.2.1 National Government 32 26 29 6.2.2 Regional Government 20 16 18 6.2.3 Local Government – – – 6.3 Other Gov’t contributions 11 9 10 Cultural Programs 11 9 107 Lotteries – – – 8 Other Revenues 203 166 186 8.1 Donations 8 6 7 Donations 1 1 1 Friends of the Games 6 5 6 8.2 Asset Disposal 15 12 14 8.3 Other Revenues 180 147 165
Totals 2,082 1,695 1,908* 2010 CAD to USD: PPP adjusted (IMF data) ** USA GDP deflator (IMF indicators) *** Numbers might not sum up due to rounding
Annexes
Detailed budget (rounded)***The Olympic Winter Games in numbers – September 2017
70

Expenditures (in millions) 2010 CAD as spent
2010 USD*
2017 USD**
1 Venue Infrastructure 215 175 197 1.1 Capital Investment – – – 1.1.1 Competition Venues – – – 1.1.2 Non-Competition Venues – – – 1.2 Temporary-Demountable Infrastructure – – – 1.2.1 Competition Venues – – – 1.2.2 Non-Competition Venues – – – 1.3 Temporary Infrastructure – Overlay –
(incl. set-up, maintenance and disposal costs) 129 105 118
1.3.1 Competition Venues (please list all competition venues) 112 91 102
Planning and coordination 2 1 2 Design and Engineering 4 3 4 Permits and Fees 1 1 1 Containers 2 2 2 Temporary Lighting 9 7 8 Temporary Seating 13 11 12 Tents 28 23 26 Trailers 12 10 11 Fencing 4 3 4 Cable Management 2 2 2 Rigging 2 2 2 Scafhold Structures 5 4 5 Site adaptation 26 21 24 1.3.2 Olympic/Paralympic Village(s) 12 10 11 Site adaptation 12 10 11 1.3.3 IBC/MPC – – – 1.3.4 Other Key Olympic Venues – – – Training Venues – – – Ceremony Venues – – – Olympic Family Hotel(s) – – – Media Village(s)
(where applicable) – – –
Expenditures (in millions) 2010 CAD as spent
2010 USD*
2017 USD**
Olympic Park(s) and major Common Domain(s) – – –
Airport(s) and other Port(s) of Entry when relevant – – –
1.3.5 Other venues/sites 5 4 5 Transportation Facilities
(Overlay) 5 4 5
Other non-competition Venues (warehouses, accreditation center, depos, bus hubs, etc.)
– – –
1.4 Energy 83 67 76 Temporary Power and distribution
(incl. cabling) 46 37 42
Power from the Grid 19 15 17 Venue utilities 6 5 5 Site works 12 10 11 Air Conditioning and heating – – – Sports Lighting – – – 1.5 Other Venue Infrastructure expenses 4 3 4 1.5.1 Signage and Wayfinding 3 3 3 1.5.2 Others – – – Construction Project Management
(if applicable) – – –
Venue engineering, design and studies – – – Permits – – – Travel etc. 1 1 1
* 2010 CAD to USD: PPP adjusted (IMF data) ** USA GDP deflator (IMF indicators) *** Numbers might not sum up due to rounding
Detailed budget (rounded)***
Annexes
The Olympic Winter Games in numbers – September 2017
71

Annexes
Detailed budget (rounded)***
Expenditures (in millions) 2010 CAD as spent
2010 USD*
2017 USD**
2 Sport, Games Services & Operations 631 513 578 2.1 Accommodation 52 42 47 Clients Accommodation
(media, sponsors, IFs, NOCs, Head of States, IOC/IPC, etc.)
6 5 5
OCOG's Workforce Accommodation (incl. volunteers & drivers) 34 27 31
Contractors – – – Accommodation subsidies to
constituent groups/Cancelled rooms – – –
Homestay/Private housing programme 1 1 1 Cruise Ship costs
(where applicable) 11 9 10
Planning and coordination 1 1 1 2.2 Food and Beverage 47 38 43 OLV(s)/PLV(s) Kitchen outfit 5 4 5 OLV(s)/PLV(s) F&B Services 13 10 12 MEV(s) F&B Services – – – MEV(s) Kitchen outfit – – – IBC/MPC or MMC F&B Service – – – IBC/MPC or MMC Kitchen outfit – – – Rest Venues
(comp venues, common domains, warehouses, depots, ports of entry, etc.)
29 23 26
Others – – – 2.3 Medical Services
(incl. Anti-Doping) 31 25 28
2.3.1 Medical 17 14 15 Polyclinic equipment and operations – – – Medical services & equipment
(all rest venues) 14 11 13
Medical supplies & consumables (all venues) – – –
Other medical services (eg. Ambulance services, First Aid, Veterinary services, etc.)
3 3 3
Expenditures (in millions) 2010 CAD as spent
2010 USD*
2017 USD**
2.3.2 Anti-Doping 14 12 13 Doping laboratory 5 4 5 Doping laboratory operations 7 6 6 ADP games time operations 1 1 1 Planning and coordination 2 1 2 Doping technical/scientific staff
(contractors) – – –
Doping supplies & consumables – – – 2.4 Logistics 35 29 32 Warehousing
(rentals, operations) 17 14 15
Traffic, Distribution 1 1 1 Venue Logistics
(incl. Villages Logistics) 1 1 1
Warehouse equipment (forklifts, racking, etc.) – – –
Logistics vehicles and drivers 1 1 1 Customs & Freight Forwarding Services 1 1 1 Furniture, Fixtures & Equipment
(all competition, training, non-competition venues and other sites)
14 11 12
- Villages FFE & supplies 7 6 7 - Venues FFE 6 5 6 2.5 Stakeholder services 13 11 12 2.5.1 International Relations & Meetings 7 6 6 Organization of Meetings & Events 5 4 5 Protocol 2 1 1 Dignitary Programmes – – – IOC/IPC hotels operations – – –
* 2010 CAD to USD: PPP adjusted (IMF data) ** USA GDP deflator (IMF indicators) *** Numbers might not sum up due to rounding
The Olympic Winter Games in numbers – September 2017
72

Expenditures (in millions) 2010 CAD as spent
2010 USD*
2017 USD**
2.5.2 NOC/NPC Services 5 4 5 Support Grant 5 4 4 NOCs/NPCs meetings and seminars 1 – – 2.5.3 Press Operations 1 1 1 Olympic News Service (ONS) incl.
Biographies 1 1 1
Planning and coordination 1 1 1 Shops & Services in MPC / MMC – – – 2.6 Security 10 8 9 Security Equipment – – – Private Security / Asset protection
(contractors) 10 8 9
Planning, coordination and training – – – 2.7 Sports 57 47 53 Sports Competition, Management and
Relations with IF 35 28 32
Expert Workforce (per diems, benefits, etc.) – – –
Sport Equipment 7 6 6 Meteorology Services 3 2 3 Sports Presentation
(incl. sport galas if applicable) 12 10 11
Paralympic planning 1 1 1 2.8 Transport 161 131 147 Automobile Fleet System & Operations
vehicles incl. maintenance 36 30 33
Bus System & Operations (incl. Coaches) 87 71 80
All fuel needs (incl. registered and non-registered vehicles and energy generators)
13 11 12
Public Transport for accredited people where required 12 10 11
Spectators transport (if applicable) – – –
Expenditures (in millions) 2010 CAD as spent
2010 USD*
2017 USD**
Transportation Facilities rentals & operations (eg. Depots, parking lots) 12 10 11
Transport vehicles support services (maintenance, equipment, tolls, road assistance, etc.)
– – –
Drivers support costs (accommodation, per-diems, uniforms, training, etc.) if applicable
– – –
Departures & Arrivals specific costs – – – 2.9 Events Services 15 12 14 Events Services – – – Crowd management
(contractors and operations) 15 12 14
2.10 Venue Operations Management 147 120 135 2.10.1 Venue use (rent) agreements 135 110 124 Pre Games Operations 17 14 16 Test Event Delivery – – – Games Time Delivery 81 66 75 Property and land rental 36 29 33 2.10.2 Facility Management &
Maintenance (excl. Temporary that is in 1.3)
– – –
Pre games Operations – – – Test event Delivery – – – Games time Delivery – – –
* 2010 CAD to USD: PPP adjusted (IMF data) ** USA GDP deflator (IMF indicators) *** Numbers might not sum up due to rounding
Annexes
Detailed budget (rounded)***The Olympic Winter Games in numbers – September 2017
73

Expenditures (in millions) 2010 CAD as spent
2010 USD*
2017 USD**
2.10.4 Other Venue Operations Management 10 8 9
Rest non-competition venues rentals and operations – – –
IBC/MPC or MMC – – – Celebration Plazza(s) 4 3 4 Other sites/facilities
(eg. Airport, UAC, etc.) 2 2 2
C3 Operations – – – Planning and coordination 1 1 1 City services and planning 3 2 2 2.10.5 Venue remediation 3 2 2 2.11 Villages Operation 10 8 10 2.11.1 Olympic/Paralympic Village
Operation 10 8 10
OLV(s)/PLV(s) Rentals, additional land leasing – – –
Site adaptation/conversion – – – Village Services/Retail Services
(dry cleaning, post office, etc.) 3 3 3
House keeping/Laundry services 7 5 6 Furnishings, supplies – – – Site Management/Key Management/
Consumables & Utilities – – –
Co-host cities Village(s) rentals & operations – – –
2.11.2 Media Villages Operations – – – MEV(s) Rentals/additional land leasing – – – MEV(s) Services/Retail services
(if applicable) – – –
MEV(s) site management/consumables – – –
2.11.3 Other Villages operations – – – Grooms Villages, TOs, OF hotels, etc. – – –
Expenditures (in millions) 2010 CAD as spent
2010 USD*
2017 USD**
2.12 Test Events 20 17 19 2.13 Other Games Services & Operations
expenses 31 25 29
2.13.1 Accreditation 1 1 1 Printing Material
(badges, lanyards, etc.) 1 1 1
Supplementary means of accreditations (armbands, wristbands, stickers, etc.)
– – –
2.13.2 Language Service – – – Specific technology solutions
and infrastructure (if not under Technology)
– – –
Interpretation – – – Translation – – – 2.13.3 Cleaning & Waste Management,
Snow Removal 30 25 28
CWM Services (including Snow Removal & anti-icing) – – –
Competition Venues & Training sites 13 11 12 OLV(s) & PLV(s) 4 3 3 MEV(s) – – – Other non-competition Venues 4 3 3 Specialized snow management 4 3 4 Waste Pumping & containers 5 4 5 Planning and coordination – – – 2.13.4 Others – – – If needed please clarify the nature of
any other expenses – – –
* 2010 CAD to USD: PPP adjusted (IMF data) ** USA GDP deflator (IMF indicators) *** Numbers might not sum up due to rounding
Annexes
Detailed budget (rounded)***The Olympic Winter Games in numbers – September 2017
74

Expenditures (in millions) 2010 CAD as spent
2010 USD*
2017 USD**
3 Technology 345 281 316 3.1 Information Technology 236 192 216 Timing & Scoring, Results 67 55 62 Core Games Management System
(ATOS) 103 84 95
Other OCOG Games Management Systems (e.g. transportation, accommodation, rate card, etc.)
2 1 1
Back-office and administration systems (e.g. Enterprise Resources Planning (ERP) system, Project Management, etc.)
1 1 1
System hardware 45 37 41 TOC, Data centers expenses – – – Photocopying & Printing Services 14 12 13 Network Cabling – – – Office technology 3 2 3 3.2 Telecoms and other technologies 100 81 91 Fixed Telephony infrastructure & System 14 11 13
Mobile Telecoms (equipment & services) – – –
Wired/wireless communications/ intercom systems (incl. cabling & equipment)
34 27 31
Radio frequency communications 21 17 20 A/V Equipment, network & Services
(incl Venue A/V) 20 16 18
Rate card services 9 7 8 Other telecom 2 1 2 3.3 Internet Infrastructure 9 8 9 Technical infrastructure and
management 4 3 4
Internet hosting 5 4 5
Expenditures (in millions) 2010 CAD as spent
2010 USD*
2017 USD**
3.4 Other Technology expenses – – – 3.4.1 Other – – – Technology design, studies, etc. – – – If needed please clarify the nature of
any other expenses – – –
4 People Management 339 276 311 4.1 Salaries and benefits
(paid + temporary staff) 284 231 260
4.2 Games Workforce Uniform (staff, volunteers, torch bearers, etc.) 20 16 18
4.3 Games Workforce Training (staff, volunteers, contractors) – – –
4.4 Other People Management Costs 35 29 32 4.4.1 Other – – – Staff Recruitment & Selection
(paid/temp/volunteers) 10 8 9
Staff Development and Training 2 2 2 Secondment programmes – – – Staff retention plans 22 18 20 Volunteer centre 2 1 15 Ceremonies & Culture 130 106 119 5.1 Opening & Closing Ceremonies 78 63 71 Ceremonies Creative & Production 76 62 70 Handover Ceremonies 2 1 2
* 2010 CAD to USD: PPP adjusted (IMF data) ** USA GDP deflator (IMF indicators) *** Numbers might not sum up due to rounding
Annexes
Detailed budget (rounded)***The Olympic Winter Games in numbers – September 2017
75
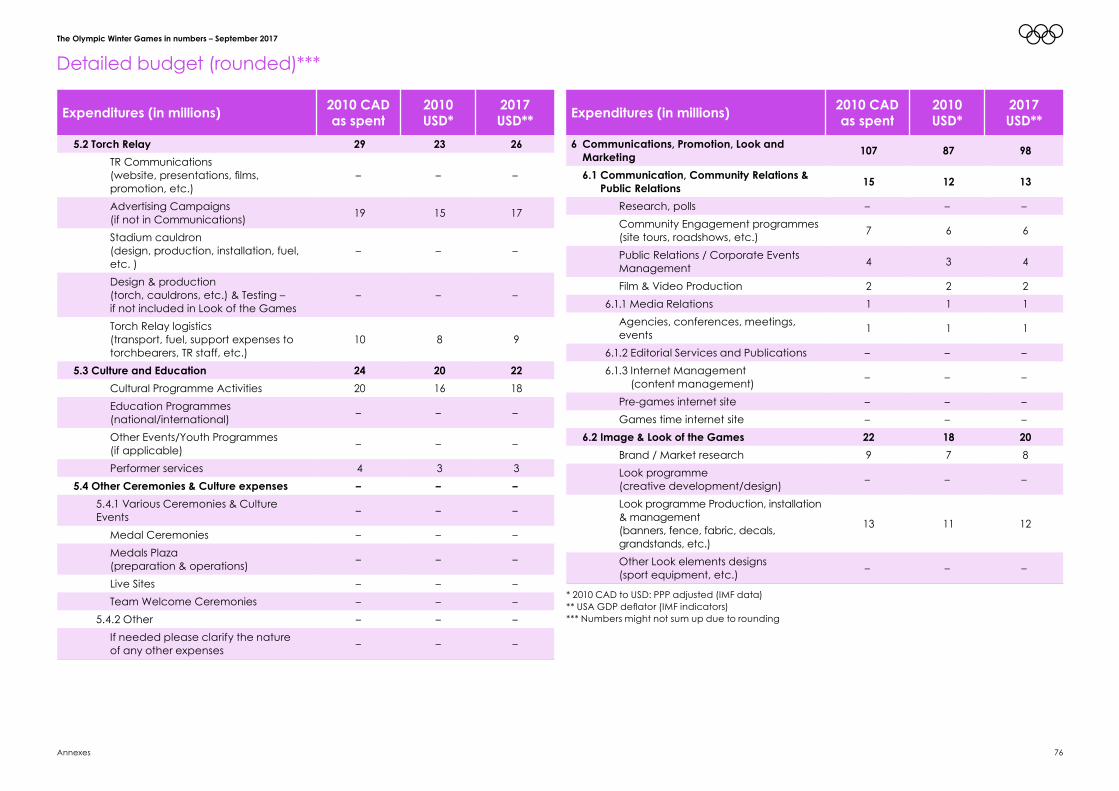
Expenditures (in millions) 2010 CAD as spent
2010 USD*
2017 USD**
5.2 Torch Relay 29 23 26 TR Communications
(website, presentations, films, promotion, etc.)
– – –
Advertising Campaigns (if not in Communications) 19 15 17
Stadium cauldron (design, production, installation, fuel, etc. )
– – –
Design & production (torch, cauldrons, etc.) & Testing – if not included in Look of the Games
– – –
Torch Relay logistics (transport, fuel, support expenses to torchbearers, TR staff, etc.)
10 8 9
5.3 Culture and Education 24 20 22 Cultural Programme Activities 20 16 18 Education Programmes
(national/international) – – –
Other Events/Youth Programmes (if applicable) – – –
Performer services 4 3 3 5.4 Other Ceremonies & Culture expenses – – – 5.4.1 Various Ceremonies & Culture
Events – – –
Medal Ceremonies – – – Medals Plaza
(preparation & operations) – – –
Live Sites – – – Team Welcome Ceremonies – – – 5.4.2 Other – – – If needed please clarify the nature
of any other expenses – – –
Expenditures (in millions) 2010 CAD as spent
2010 USD*
2017 USD**
6 Communications, Promotion, Look and Marketing 107 87 98
6.1 Communication, Community Relations & Public Relations 15 12 13
Research, polls – – – Community Engagement programmes
(site tours, roadshows, etc.) 7 6 6
Public Relations / Corporate Events Management 4 3 4
Film & Video Production 2 2 2 6.1.1 Media Relations 1 1 1 Agencies, conferences, meetings,
events 1 1 1
6.1.2 Editorial Services and Publications – – – 6.1.3 Internet Management
(content management) – – –
Pre-games internet site – – – Games time internet site – – – 6.2 Image & Look of the Games 22 18 20 Brand / Market research 9 7 8 Look programme
(creative development/design) – – –
Look programme Production, installation & management (banners, fence, fabric, decals, grandstands, etc.)
13 11 12
Other Look elements designs (sport equipment, etc.) – – –
* 2010 CAD to USD: PPP adjusted (IMF data) ** USA GDP deflator (IMF indicators) *** Numbers might not sum up due to rounding
Detailed budget (rounded)***The Olympic Winter Games in numbers – September 2017
76Annexes

Expenditures (in millions) 2010 CAD as spent
2010 USD*
2017 USD**
6.3 Marketing and Commercial Programme 70 57 64 6.3.1 Sponsorship Marketing & Services 51 41 46 TOP Programme management – – – Sponsors recognition & marketing 8 7 7 Brand Management/commercial
Right Management 43 35 39
6.3.2 Licensing & Merchandise 6 5 6 Licensing & Merchandise Marketing 6 5 6 Olympic Store(s) – – – 6.3.3 Ticketing Marketing & Operations 13 11 12 Ticketing sales, Fulfillment & Distribution 12 10 11 Ticket Printing, Packaging – – – Ticketing Marketing / Advertising 1 1 1 6.4 Other Communications, Promotion and
Marketing expenses – – –
6.4.1 Other – – – If needed please clarify the nature
of any other expenses – – –
7 Corporate Administration and Legacy – – – 7.1 Administration and Governance Costs 127 104 117 7.1.1 Office administration costs 34 28 31 Office Rentals/fit out/special FFE 22 18 20 Management costs
(maintenance, utilities, courier service, supplies, consumables, etc.)
11 9 10
Executive Office (salaries in People Management) 1 1 1
7.1.2 Finance (incl. Rate Card) 46 38 42
Other FNC costs 6 5 6 Interest & Banking Fees/expenses 8 6 7 Hedging/Foreign exchange losses 11 9 10 External auditors/tax advisors/
consultants etc. 4 3 3
CFO Contingency 9 8 9
Expenditures (in millions) 2010 CAD as spent
2010 USD*
2017 USD**
Financial IT Systems (if not included in Technology) – – –
Dissolution & Post Games Financial Report 8 6 7
Rate Card – – – 7.1.3 Risk Management (incl. Insurance) 12 9 11 Insurance premiums 12 9 11 Insurance brokers/advisors – – – Health & Safety – – – 7.1.4 Procurement – – – 7.1.5 Legal Services 8 7 7 Legal services 7 6 6 Board governance 1 1 1 7.1.6 Programme Planning &
Project Management 3 2 3
Information Management Services & System 3 2 3
Official report/TOK/Observer Programme/debrief – – –
7.1.7 Government Relations, Services & Coordination 14 12 13
City Operations & Permits – – – City-Municipal Service Agreements/
Traffic control 6 5 5
First Nations relations 7 6 7 Official languages requirements 1 1 1 Other communities relations &
participation – – –
7.1.8 Broadcast Integration 6 5 5 Others
(briefings, kits, etc.) – – –
IBC Operations 1 1 1 Paralympic Host Broadcast 4 4 4
* 2010 CAD to USD: PPP adjusted (IMF data) ** USA GDP deflator (IMF indicators) *** Numbers might not sum up due to rounding
Detailed budget (rounded)***
Annexes
The Olympic Winter Games in numbers – September 2017
77

Expenditures (in millions) 2010 CAD as spent
2010 USD*
2017 USD**
7.2 Environment, Sustainability and Legacy 4 3 4 Environmental Studies / Consulting 2 2 2 Environment awareness programmes/
events – – –
Venue restoration/remediation costs – – – Legacy activities 2 2 2 7.3 Other Corporate Administration expenses – – – 7.3.1 Other – – – Misc – – –8 Other Expenses
(eg. Marketing rights, payments to IOC/IPC/NOC, etc.)
187 152 171
JMPA 110 90 101 Marketing rights to IOC 74 60 67 IPC Revenue guarantee 3 3 3 Please clearly list the nature of any
other expenses – – –
9 Contingency
Totals: 2,081 1,695 1,908
Detailed budget (rounded)***
Annexes
The Olympic Winter Games in numbers – September 2017
78

Annex II: 2024 budget template
2024 Lifetime Budget for Olympic and Paralympic Games in 2014 values
Revenues (000s) Local USD %
1 IOC Contribution
2 TOP Programme (gross)
3 Domestic Sponsorship (gross)
4 Ticket Sales
4.1 Ticket Sales Revenue
4.2 Additional Ticketing products (incl. Hospitality)
5 Licensing & Merchandising
5.1 Licensing products
5.2 Philatelic
5.3 Coins
6 Government contribution
6.1 Olympic Games
6.1.1 National Government
6.1.2 Regional Government
6.1.3 Local Government
6.2 Paralympic Games
6.2.1 National Government
6.2.2 Regional Government
6.2.3 Local Government
7 Lotteries
8 Other Revenues
8.1 Donations
8.2 Asset Disposal
8.3 Other Revenues
9 Total Revenues
79
The Olympic Winter Games in numbers – September 2017
Annexes

2024 Lifetime Budget for Olympic and Paralympic Games
Expenditures (000s) Local USD %
1 Venue Infrastructure 1.1 Capital Investment
1.2 Temporary-Demountable Infrastructure 1.2.1 Competition venues
1.2.2 Non-Competition venues
1.3 Temporary Infrastructure (incl. maintenance costs) 1.3.1 Competition venues
1.3.2 Olympic/Paralympic Village
1.3.3 IBC/MPC
1.3.4 Other Key Olympic Venues
1.3.5 Other venues/sites
1.4 Energy
1.5 Other Venue Infrastructure expenses
2 Sport, Games Services & Operations 2.1 Accommodation
2.2 Food and Beverage
2.3 Medical Services (incl. Anti-Doping)
2.4 Logistics
2.5 Stakeholder Services
2.6 Security
2.7 Sports
2.8 Transport
2.9 Events Services
2.10 Venue Operations Management
2.11 Villages Operations 2.11.1 Olympic/Paralympic Village Operations
2.11.2 Media Village(s) Operations
2.11.3 Other Villages operations
2.12 Test Events
2.13 Other Games Services & Operations expenses
Expenditures (000s) Local USD %
3 Technology 3.1 Information Technology
3.2 Telecoms
3.3 Internet Infrastructure
3.4 Other Technology expenses
4 People Management 5 Ceremonies & Culture 5.1 Opening & Closing Ceremonies
5.2 Torch Relay
5.3 Culture and Education
5.4 Other Ceremonies & Culture expenses
6 Communications, Marketing and Look 6.1 Communication, Community Relations & PR
6.2 Look of the Games
6.3 Marketing and Commercial Programme
6.4 Other Comms, Marketing and Look expenses
7 Corporate Administration and Legacy 7.1 Administration and Governance
7.2 Environment, Sustainability and Legacy
7.3 Other Corporate Administration expenses
8 Other Expenses (incl. Marketing right) 9 Contingency 10 Total Expenditures
Net Financial Result Local USD %
Surplus / Shortfall (Rev – Exp) Accumulated inflation until 2024Exchange rate used 1 USD =
The Olympic Winter Games in numbers – September 2017
80Annexes
Annex III: Sources• https://www.olympic.org/vancouver-2010• https://www.paralympic.org/sochi-2014• https://www.paralympic.org/vancouver-2010• IPC Handbook• IPC accreditation reports• IOC Energy TOK Report – Sochi 2014• IOC Energy TOK report – Vancouver 2010• IOC Marketing Fact File – 2016• IOC Marketing Report – Sochi 2014• IOC Marketing Report – Vancouver 2010• Olympic Games Guide on Ceremonies• Olympic Games Guide on People Management • Olympic Games Guide on Technology• PyeongChang 2018 transfer of knowledge• Sochi 2014 Debrief• Sochi 2014 Observer Programme • Sochi 2014 Olympic and Paralympic Winter Games – Accreditation database• Sochi 2014 Olympic Winter Games competition schedule • Sochi 2014 Sport and IF Services – explanatory books• Sochi 2014 Test Events booklet• Sochi 2014 transfer of knowledge• The Olympic Winter Games Framework 2026• Vancouver 2010 Debrief• Vancouver 2010 Media Handbook• Vancouver 2010 Olympic and Paralympic Winter Games – Accreditation database • Vancouver 2010 Press Operations, Final report to the IOC Press Commission, July 2010• Vancouver 2010 Press Services and Facilities Guide• Vancouver 2010 transfer of knowledge• Vancouver 2010, Health Care Guide
81
The Olympic Winter Games in numbers – September 2017
Annexes

Acronym Term
AV Audio-visual
CAD Computer-aided Design
CAS Court of Arbitration for Sport
CEO Chief Executive Officer
CIS Commentator Information System
DLP Digital Light Processing
FA Functional Area
GDP Gross Domestic Product
GMS Games Management System
HV High Voltage
IBC International Broadcast Centre
ICMS INFO Content Management System
IF International Federation
IMF International Monetary Fund
IOC International Olympic Committee
IPC International Paralympic Committee
IT Information Technology
LAN Local Area Network
LED Light-emitting Diode
MBC Mountain Broadcast Centre
MMC Main Media Centre
MPC Main Press Centre
MV Medium Voltage
Acronym Term
MVA Mega Volt Amp
NOC National Olympic Comittee
OBS Olympic Broadcasting Services
OCOG Organising Committee for the Olympic Games
ODS Olympic Diffusion System
OIS Olympic Information Service
OMS Olympic Management System
OTR Olympic Torch Relay
OVR On-Venue Results
PC Personal Computer
PPP Purchasing-Power-Parities
PRD Print Distribution System
RHB Rights-Holding Broadcaster
SEQ Sports Entries and Qualification
TOC Technology Operations Centre
TOP The Olympic Programme
VANOC Vancouver Organising Committee for the Olympic Games
VAPP Venue Access and/or Parking Permit
VMC Venue Media Centre
VUA Venue Use Agreement
WADA World Anti-Doping Agency
YOGOC Youth Olympic Games Organising Committee
Annex IV: AcronymsThe Olympic Winter Games in numbers – September 2017
82Annexes


Image credits
The Olympic Winter Games in numbers – September 2017
84
Introduction
Page 01 Sochi 2014, Freestyle Skiing – Markus Eder (ITA), ©2014/IOC/John HuetPage 03 Sochi 2014, Alpine Skiing, Women – Alexandra Coletti (MON), ©2014/IOC/Mine KasapogluPage 04 Vancouver 2010, Bobsleigh, Four Man – Kwang-Bae Kang, Donghyun Kim, Jung-Su Kim and
Jinhee Lee (KOR), ©2010/IOC/John HuetPage 05 Sochi 2014, Figure Skating, Individual Women – Natalia Popova (UKR), ©2014/IOC/Jason EvansPage 06 Sochi 2014, Snowboard Half-pipe, Men – Arthur Longo (FRA), ©2014/IOC/Jason EvansPage 07 Sochi 2014, Ice Hockey, Men, Qualification – Tomas Kaberle (7), Ales Hemsky (83),
Jakub Voracek (89) (CZE), ©2014/IOC/Chris Graythen
Scale dataPage 12 Sochi 2014, Luge, Singles Women – Summer Britcher (USA), ©2014/IOC/Anna KonovalovaPage 13 Vancouver 2010, Curling, Women – Yan Zhou, Qingshuang Yue, Bingyu Wang and Yin Liu –
(CHN), ©2010/IOC/Jason EvansPage 19 Sochi 2014, Ski Jumping, Women – Julia Clair (FRA), ©2014/IOC/John HuetPage 20 Sochi 2014, Speed Skating, Women – Monique Angermueller (GER), ©2014/IOC/Chris GraythenPage 22 Vancouver 2010, Biathlon, Men – Tim Burke (USA), ©2010/IOC/Christopher FurlongPage 25 Sochi 2014, Cross Country Skiing, team classic sprint, Women, Semifinal – Yelena Kolomina (KAZ) Page 28 Sochi 2014, Figure Skating Gala, Women – Gracie Gold (USA), ©2014/IOC/Chris GraythenPage 33 Sochi 2014, Snowboard Half-pipe, Women – Ella Suitiala (FIN), ©2014/IOC/Mine KasapogluPage 40 Vancouver 2010, Curling, Women – Nicole Joraanstad (USA), ©2010/IOC/Mine KasapogluPage 44 Sochi 2014, Skeleton, Men – John Farrow (AUS), ©2014/IOC/Mine KasapogluPage 48 Vancouver 2010, Bobsleigh, Four Man – Dawid Kupczyk, Michal Zblewski, Pawel Mroz and
Marcin Piotr Niewiara (POL), ©2010/IOC/KishimotoPage 50 Vancouver 2010, Ice Hockey, Women – Noora Raty (FIN), ©2010/IOC/Mine KasapogluPage 52 Sochi 2014, Short Track Speed Skating, 3000m Relay Semifinal Women – Yui SAKAI (JPN)
©2014/Getty Images/Robert Cianflone Page 56 Sochi 2014, Luge, Men – Tucker West (USA), ©2014/IOC/John Huet
Commercial RevenuesPage 57 Vancouver 2010, Figure Skating, Women – Mirai Nagasu (USA), ©2010/IOC/John Huet
Cost driversPage 64 Sochi 2014, Opening Ceremony, ©2014/IOC/Ian JonesPage 66 Sochi 2014, Curling, Men – Rui Liu (CHN), ©2014/IOC/Jason EvansPage 82 Vancouver 2010, Biathlon, Men – Andriy Deryzemlya (UKR), ©2010/IOC/Christopher Furlong
Image CreditsPage 85 Vancouver 2010, Alpine Skiing, Giant slalom Men – Kjetil Jansrud (NOR) 2nd
85
The Olympic Winter Games in numbers – September 2017
Image credits