The observed distribution of spectroscopic binaries from ...
19
MNRAS 453, 1439–1457 (2015) doi:10.1093/mnras/stv1596 The observed distribution of spectroscopic binaries from the Anglo-Australian Planet Search J. S. Jenkins, 1‹ M. D´ ıaz, 1 H. R. A. Jones, 2 R. P. Butler, 3 C. G. Tinney, 4, 5 S. J. O’Toole, 6 B. D. Carter, 7 R. A. Wittenmyer 4 , 5 and D. J. Pinfield 2 1 Departamento de Astronom´ ıa, Universidad de Chile, Casilla 36-D, Las Condes, Santiago, Chile 2 Centre for Astrophysics Research, University of Hertfordshire, College Lane, Hatfield, Herts AL10 9AB, UK 3 Carnegie Institution of Washington, DTM, 5241 Broad Branch Road NW, Washington, DC 20015-1305, USA 4 Exoplanetary Science at UNSW, School of Physics, UNSW Australia, Sydney, NSW 2052, Australia 5 Australian Centre for Astrobiology, UNSW Australia, Sydney, NSW 2052, Australia 6 Australian Astronomical Observatory, PO Box 915, North Ryde, NSW 1670, Australia 7 Computational Engineering and Science Research Centre, University of Southern Queensland, Springfield, QLD 4300, Australia Accepted 2015 July 14. Received 2015 July 10; in original form 2015 January 25 ABSTRACT We report the detection of sixteen binary systems from the Anglo-Australian Planet Search. Solutions to the radial velocity data indicate that the stars have companions orbiting with a wide range of masses, eccentricities and periods. Three of the systems potentially contain brown-dwarf companions while another two have eccentricities that place them in the extreme upper tail of the eccentricity distribution for binaries with periods less than 1000 d. For periods up to 12 years, the distribution of our stellar companion masses is fairly flat, mirroring that seen in other radial velocity surveys, and contrasts sharply with the current distribution of candidate planetary masses, which rises strongly below 10 M J . When looking at a larger sample of binaries that have FGK star primaries as a function of the primary star metallicity, we find that the distribution maintains a binary fraction of ∼43 ± 4 per cent between −1.0 and +0.6 dex in metallicity. This is in stark contrast to the giant exoplanet distribution. This result is in good agreement with binary formation models that invoke fragmentation of a collapsing giant molecular cloud, suggesting that this is the dominant formation mechanism for close binaries and not fragmentation of the primary star’s remnant protoplanetary disc. Key words: catalogues – binaries: spectroscopic – brown dwarfs – stars: fundamental parameters – stars: solar-type. 1 INTRODUCTION Binary systems, in their various guises, yield vital measures for a range of fundamental parameters – mass, radius, luminosity – for the component stars. Studies of the binary population distribution, correlation of orbital elements, and the frequencies of the various forms of multiplicity, can be used to shed light on star formation processes and evolutionary mechanisms. Systems comprising two or more stars are common. Surveys suggest the incidence of multi- plicity is around 45 per cent (Raghavan et al. 2010), perhaps higher than 70 per cent among the more massive stars (Abt, Gomez & Levy 1990; Mason et al. 1998; Preibisch et al. 1999), and somewhat lower (∼30–40 per cent) for M dwarfs (Fischer & Marcy 1992). Doppler searches for extrasolar planets have refined the art of single-lined spectroscopic binary analysis to the point where rela- E-mail: [email protected] tive radial velocities (RVs) of the primaries can be measured with precisions at the ∼1ms −1 level using both the absorption cell and spectrograph stabilization methods (e.g. Vogt et al. 2010; Jenkins et al. 2013b; Anglada-Escud´ e et al. 2014; Jenkins & Tuomi 2014; Wittenmyer et al. 2014). RV measurements that are not tied to an absolute zero-point can achieve high internal precision by explicitly removing the need to quantify such effects as convective blueshift and stellar gravitational redshift; a clear account of these and other effects is given in Nidever et al. (2002). The target stars for such planetary searches are generally solar-type and are selected to be chromospherically ‘quiet’ in order to minimize the potential for ‘noise’ in any velocity measurement due to star-spot activity (see Jenkins et al. 2006). They are also selected to have no resolvable companions to avoid flux contamination. The Anglo-Australian Planet Search (AAPS) selection criteria for its initial group of stars are discussed in Jones et al. (2002b). The sample considered here comprises 178 F, G, and K dwarf stars with declinations south of ∼−20 ◦ and is complete to V < 7.5. There C 2015 The Authors Published by Oxford University Press on behalf of the Royal Astronomical Society at Universidad de Chile on November 26, 2015 http://mnras.oxfordjournals.org/ Downloaded from
Transcript of The observed distribution of spectroscopic binaries from ...

MNRAS 453, 1439–1457 (2015) doi:10.1093/mnras/stv1596
The observed distribution of spectroscopic binaries from theAnglo-Australian Planet Search
J. S. Jenkins,1‹ M. Dıaz,1 H. R. A. Jones,2 R. P. Butler,3 C. G. Tinney,4,5
S. J. O’Toole,6 B. D. Carter,7 R. A. Wittenmyer4,5 and D. J. Pinfield2
1Departamento de Astronomıa, Universidad de Chile, Casilla 36-D, Las Condes, Santiago, Chile2Centre for Astrophysics Research, University of Hertfordshire, College Lane, Hatfield, Herts AL10 9AB, UK3Carnegie Institution of Washington, DTM, 5241 Broad Branch Road NW, Washington, DC 20015-1305, USA4Exoplanetary Science at UNSW, School of Physics, UNSW Australia, Sydney, NSW 2052, Australia5Australian Centre for Astrobiology, UNSW Australia, Sydney, NSW 2052, Australia6Australian Astronomical Observatory, PO Box 915, North Ryde, NSW 1670, Australia7Computational Engineering and Science Research Centre, University of Southern Queensland, Springfield, QLD 4300, Australia
Accepted 2015 July 14. Received 2015 July 10; in original form 2015 January 25
ABSTRACTWe report the detection of sixteen binary systems from the Anglo-Australian Planet Search.Solutions to the radial velocity data indicate that the stars have companions orbiting with awide range of masses, eccentricities and periods. Three of the systems potentially containbrown-dwarf companions while another two have eccentricities that place them in the extremeupper tail of the eccentricity distribution for binaries with periods less than 1000 d. For periodsup to 12 years, the distribution of our stellar companion masses is fairly flat, mirroring thatseen in other radial velocity surveys, and contrasts sharply with the current distribution ofcandidate planetary masses, which rises strongly below 10 MJ. When looking at a largersample of binaries that have FGK star primaries as a function of the primary star metallicity,we find that the distribution maintains a binary fraction of ∼43 ± 4 per cent between −1.0 and+0.6 dex in metallicity. This is in stark contrast to the giant exoplanet distribution. This resultis in good agreement with binary formation models that invoke fragmentation of a collapsinggiant molecular cloud, suggesting that this is the dominant formation mechanism for closebinaries and not fragmentation of the primary star’s remnant protoplanetary disc.
Key words: catalogues – binaries: spectroscopic – brown dwarfs – stars: fundamentalparameters – stars: solar-type.
1 IN T RO D U C T I O N
Binary systems, in their various guises, yield vital measures for arange of fundamental parameters – mass, radius, luminosity – forthe component stars. Studies of the binary population distribution,correlation of orbital elements, and the frequencies of the variousforms of multiplicity, can be used to shed light on star formationprocesses and evolutionary mechanisms. Systems comprising twoor more stars are common. Surveys suggest the incidence of multi-plicity is around 45 per cent (Raghavan et al. 2010), perhaps higherthan 70 per cent among the more massive stars (Abt, Gomez & Levy1990; Mason et al. 1998; Preibisch et al. 1999), and somewhat lower(∼30–40 per cent) for M dwarfs (Fischer & Marcy 1992).
Doppler searches for extrasolar planets have refined the art ofsingle-lined spectroscopic binary analysis to the point where rela-
� E-mail: [email protected]
tive radial velocities (RVs) of the primaries can be measured withprecisions at the ∼1 m s−1 level using both the absorption cell andspectrograph stabilization methods (e.g. Vogt et al. 2010; Jenkinset al. 2013b; Anglada-Escude et al. 2014; Jenkins & Tuomi 2014;Wittenmyer et al. 2014). RV measurements that are not tied to anabsolute zero-point can achieve high internal precision by explicitlyremoving the need to quantify such effects as convective blueshiftand stellar gravitational redshift; a clear account of these and othereffects is given in Nidever et al. (2002). The target stars for suchplanetary searches are generally solar-type and are selected to bechromospherically ‘quiet’ in order to minimize the potential for‘noise’ in any velocity measurement due to star-spot activity (seeJenkins et al. 2006). They are also selected to have no resolvablecompanions to avoid flux contamination.
The Anglo-Australian Planet Search (AAPS) selection criteriafor its initial group of stars are discussed in Jones et al. (2002b).The sample considered here comprises 178 F, G, and K dwarf starswith declinations south of ∼ −20◦ and is complete to V < 7.5. There
C© 2015 The AuthorsPublished by Oxford University Press on behalf of the Royal Astronomical Society
at Universidad de C
hile on Novem
ber 26, 2015http://m
nras.oxfordjournals.org/D
ownloaded from

1440 J. S. Jenkins et al.
Table 1. The primaries: stellar characteristics.
Star B − V V Parallax MV Spectral [Fe/H] [Fe/H] logR′HK Mass
(mas) type Casa Bond (M�)
1 HD 18907 0.79 5.9 31.1 3.4 K2V −0.46 −0.50 ± 0.07 −5.11 1.05 ± 0.152 HD 25874 0.67 6.7 38.6 4.6 G2V −0.02 – −4.95 1.00 ± 0.053 HD 26491 0.64 6.4 42.3 4.5 G1V −0.11 −0.08 ± 0.07 −4.95 0.97 ± 0.054 HD 39213 0.81 9.0 16.3 5.1 K0V – 0.20 ± 0.07 −5.10 0.93 ± 0.055 HD 42024 0.55 7.2 18.2 3.5 F7V 0.19 – – 1.30 ± 0.056 HD 64184 0.68 7.5 30.0 4.9 G3V −0.18 −0.23 ± 0.07 −4.88 0.93 ± 0.057 HD 120690 0.70 6.4 51.4 5.0 G5+V −0.08 −0.10 ± 0.06 −4.78 0.98 ± 0.058 HD 121384 0.78 6.0 25.8 3.1 G8V −0.39 −0.40 ± 0.07 −5.22 0.98 ± 0.109 HD 131923 0.71 6.3 41.9 4.4 G4V 0.06 −0.05 ± 0.08 −4.90 1.05 ± 0.0510 HD 145825 0.65 6.6 46.4 4.9 G3V 0.12 −0.04 ± 0.07 −4.74 1.03 ± 0.0511 HD 150248 0.65 7.0 37.5 4.9 G3V −0.13 −0.11 ± 0.07 −4.88 0.93 ± 0.0512 HD 156274B 0.76 5.5 113.6 5.8 G8V −0.40 – −4.95 0.83 ± 0.0613 HD 158783 0.67 7.1 23.7 4.0 G4V 0.05 −0.05 ± 0.07 −4.91 1.04 ± 0.0514 HD 162255 0.66 7.2 24.9 4.2 G3V 0.17 −0.01 ± 0.08 – 1.12 ± 0.0815 HD 169586 0.55 6.8 21.4 3.5 G0V 0.32 – −4.92 1.25 ± 0.0516 HD 175345 0.57 7.4 21.3 4.0 G0V −0.16 – – 1.05 ± 0.05
is a requirement that the activity seen in Ca II H&K absorption lineshas an index (measured by log R′
HK – hereafter referred to as R′HK;
for details see Jenkins et al. 2006, 2008, 2011) of less than −4.5,and for there to be no known companions within 2 arcsec. Thespectroscopic binaries presented in this paper are drawn from thissample.
2 O B S E RVAT I O N S A N D DATA R E D U C T I O N
2.1 The primaries: stellar characteristics
A summary of the characteristics and masses for the primariesare given in Table 1. Spectral types, B − V colours, magnitudes,and parallaxes for all the stars are taken from the SIMBAD andHIPPARCOS data bases. Metallicities for the stars in this sample aredrawn from two sources; spectroscopic metallicities were extractedfrom Bond et al. (2006) and photometric values were taken fromthe catalogue of Casagrande et al. (2011). For five of the binarystars we report there are no Bond et al. (2006) spectroscopic values;however, these have Casagrande et al. (2011) metallicities. In fact,all but one of the primaries, HD 39213, have Casagrande et al.(2011) measurements, allowing for a uniform and self-consistentset of [Fe/H] estimates to be generated for the sample.
R′HK data are used with the activity–age relation given in
Soderblom, Duncan & Johnson (1991) to provide secondary ageestimates for the stars. Note that since our stars were preselectedto have R′
HK values below −4.5, the Soderblom et al. relationsare quantitatively the same in this regime to the updated work ofMamajek & Hillenbrand (2008) due to the sparse activity–age datafor older dwarf stars. The activity values have been drawn fromthe studies of Henry et al. (1996), Tinney et al. (2002), Jenkinset al. (2006), and Jenkins et al. (2011), yet even considering thesefour works, there are still three stars with unknown activities, high-lighting the lack of chromospheric activity studies in the Southernhemisphere compared to the north. The primary stellar ages, alongwith the stellar masses, are determined through interpolation ofthe Yonsei–Yale isochrones (Yi et al. 2001) and uncertainties canbe found to reach 100 per cent for the ages of these types of oldand Sun-like dwarf stars. Given the ∼0.06–0.10 dex uncertainty inmetallicities, natural variations in stellar activity (for example solarR′
HK activity variation between –4.75 and –5.10 translates to an age
variation from 2.2 and 8.0 Gyr; Henry et al. 1996), uncertainty inthe precise form of the age–activity relationship, along with thepossibility of flux contamination from the secondary, a number ofisochronal mass/age/metallicity points can equally account for astar’s colour and magnitude. In fact, an offset is found between agesderived from the activity indices and those measured from isochronefitting, whereby the activity derived ages are generally significantlyyounger than those measured from fitting the isochrones. This re-sult highlights that more work is needed to make ages derived fromstellar activity relations, or gyrochronology, and those derived fromevolutionary models, more consistent for old field stars. A consid-eration of these uncertainties enables us to determine a consistentmass range for each star.
2.2 Determination of RVs
2.2.1 UCLES data
Observations were made at the 3.9m Anglo-Australian Tele-scope using the University College London Echelle Spectro-graph (UCLES), operated in its 31 lines/mm mode. High-precisionDoppler measurements are made possible by the use of an iodineabsorption cell that permits detailed modelling of the spectrographpoint spread function (PSF). The reader is referred to Butler et al.(1996, 2001) for a detailed description, however, the procedure isoutlined below.
Multi-epoch spectra at a resolution of R ∼ 45 000 are obtainedfor each star with the I2 cell mounted behind the UCLES, imprint-ing the stellar spectra with thousands of iodine absorption lines inthe 5000–6200 Å region. Each spectrum can be synthesized from aproduct of a Doppler-shifted copy of a pure stellar spectrum for thestar in question (a higher resolution stellar template spectrum fromwhich the spectrograph PSF has been removed) and an iodine ab-sorption spectrum, all of which is convolved with the spectrograph’sPSF at the time of the observation. A least-squares fitting processmatches this synthetic spectrum with the observed spectrum, anddetermines up to 14 free parameters (one being the Doppler shift,one the wavelength dispersion, and the remainder associated withthe detailed PSF profile). This fitting process is carried out on 2 Åchunks of the spectrum between 5000 and 6200 Å and the result-ing velocities are weighted by the gradient (∂F/∂λ) of the spectral
MNRAS 453, 1439–1457 (2015)
at Universidad de C
hile on Novem
ber 26, 2015http://m
nras.oxfordjournals.org/D
ownloaded from

Spectroscopic binaries from the AAPS 1441
profile for each chunk. The mean of these weighted velocities, cor-rected for the Earth’s motion relative to the Solar system barycen-tre (McCarthy 1995), represents the RV for that observation. Abarycentric correction is also applied to the Julian dates. The inter-nal uncertainty is obtained from the standard deviation of the ve-locities. This technique has demonstrated consistently that 3 m s−1
precision is achievable down to the V = 7.5 mag limit of the surveyfor suitably inactive stars over the long term (Jones et al. 2002a).The barycentric Julian dates and RV data of our sources are givenin Table 3.
2.2.2 HARPS data
In order to supplement the velocities measured using the UCLESspectrograph, we performed a search of the ESO Archive Facilityto determine if any of these stars had high-precision ESO-HARPSmeasurements that could be used to increase the phase coverage ofour orbits. The search revealed that six of targets had been observedwith HARPS multiple times, such that the inclusion of the velocitiesyielded much better constraints on the binary orbits. The HARPSRV data are also shown in Table 3.
At this point it is worth briefly discussing the HARPS strategyfor measuring precision RVs from high-resolution and high S/Nechelle spectra. The HARPS data are automatically processed bythe HARPS-DRS version 3.5, with the reduced and analysis qualitydata on the Advanced Data Products page of the ESO Archivewebsite. The actual reduction and analysis method itself is based ingeneral on the procedure explained in Baranne et al. (1996). Unlikethe method employed by the AAPS using UCLES, no iodine cellis used by HARPS, but instead, precision RVs are measured bymaintaining the highest stability possible over the long term, butplacing the spectrograph in a vacuum tank to maintain the pressureand temperature as stable as possible, and feeding the light to thespectrograph using optical fibres.
The actual RV measurements are not performed in chunks likethey are using UCLES, but each entire echelle order is used tomeasure the RV. A weighted binary mask is constructed that syn-thetically mimics the position of an absorption line in the star (Pepeet al. 2002), and a weighted cross-correlation between the stellarspectrum and the binary mask gives the RV. The mean of the RVfor each order gives rise to the final absolute RV measurement fromthe star, with the uncertainty measured following the procedure inBouchy, Pepe & Queloz (2001). The stability of the spectrographis maintained by using a calibration Thorium–Argon lamp, that isalso simultaneously fed to the spectrograph using another fibre, al-lowing any drifts in the wavelength solution to be measured at the0.1 m s−1 level (Lovis & Pepe 2007). The drift is then removed fromthe measured RV to get the most precise value; however, a stabilityof less than 1 m s−1 has been found for HARPS data over the longterm (e.g. Lo Curto et al. 2010).
2.3 Orbital parameters
For the analysis of spectroscopic binaries the task is to provide a setof orbital parameters (period, P, eccentricity, e, periastron angle, ω,time of periastron passage, Tp, and the projected semimajor axis ofthe primary, ap sin i) – and a velocity offset, zo, that optimize the fitof the equation
z = 2πap sin i
P√
1 − e2(cos(υ + ω) + e cos ω) + zo (1)
to the n observations of line-of sight RV, z, at true anomalies υ
(derived from the observed times, t, through iteration of Kepler’sequation). A least-squares minimization procedure, invoking sev-eral IDL routines, is used to fit the equation.
In the search for an orbital solution, periods are initially identi-fied via Lomb–Scargle periodogram analysis (Lomb 1976; Scargle1982). Orbital solutions are plotted in Fig. 1 and summarized inTable 2 (i and ii). Where the RV data have a monotonic variation,or only one extremum occurs without any clear inflection in the RVvariation to constrain a second extremum (HD 18907, HD 25874,HD 26491, HD 131923, HD 156274B), convergence is reached fora number of different periods. In these cases, where the period isclearly greater than the duration of the observations, and where pe-riodogram analysis is least effective, we consider only the minimumorbital period in our solutions. Periodograms are shown (Fig. 2) forall the targets where the RV phase coverage is nearly a cycle or more.Where the sampling is sparse, aliasing introduces spectral powerover a range of frequencies and is particularly marked for HD 64184which has just eight RV observations and for HD 121384 due tothe highly eccentric nature of the orbit (see O’Toole et al. 2009).This is perhaps a reminder that data sets should comprise more thana dozen observations for the periodogram technique to be prop-erly effective (Horne & Baliunas 1986). The period inferred fromthe orbital solution in each case is marked with a vertical dashedline. Identification of periods is least effective for HD 131923 andHD 156274B, where the phase coverage is less than one cycle.Nevertheless, the inflections in the RV variation enable a robustKeplerian period to be found.
3 D I SCUSSI ON
3.1 The binary stars
HD 18907: A high proper-motion star classed as K2 V (Gray et al.2006) though consistently classified as a G5 IV prior to this (e.g.Evans, Menzies & Stoy 1957), its colour and magnitude confirmthat it is evolving away from the main sequence. Chromosphericallyquiet (R′
HK= −5.11, Jenkins et al. 2006), HD 18907 is most likelyan old star with an age in excess of 12 Gyr which agrees withisochrone fits based on metallicities derived through spectral andphotometric analysis – for example [Fe/H] = −0.50 dex from Bondet al. (2006) and −0.46 dex from Casagrande et al. (2011). Thisage/metallicity scenario translates to a stellar mass estimated to be1.05 M�. Limited phase coverage of the RV data means that theperiod is not well constrained so the orbital solution converges toa number of fits with periods upwards of 10 000 d. The shortestperiod orbit translates to a secondary minimum mass (Ms sin i) of0.42 ± 0.10 M�.
HD 25874: Classified as a G2V by Gray et al. (2006) and listedby (Dommanget & Nys 1994) in the Catalogue of Components ofDouble and Multiple Stars, it is identified along with a V = 12companion (position angle 225◦, separation 29 arcsec, 1941) as acommon proper-motion pair. Jenkins et al. derive an R′
HK index of−4.95, suggesting an age of about 4 Gyr, while Casagrande et al.(2011) find a metallicity of [Fe/H] = −0.02 dex, suggesting an ageof 9.2 Gyr, in agreement with the sub-giant designation. Given theage–metallicity range, a mass of 1.00 ± 0.05 M� is inferred for theprimary. Since the phase coverage from both the AAPS and HARPSis limited, a variety of solutions exist; however, we find that the bestsolution to the data gives rise to a very long-period low-mass stellarcompanion, with a period of nearly 200 years and a minimum massof 0.33 ± 0.07 M�.
MNRAS 453, 1439–1457 (2015)
at Universidad de C
hile on Novem
ber 26, 2015http://m
nras.oxfordjournals.org/D
ownloaded from

1442 J. S. Jenkins et al.
Figure 1. RV curves for our stars, with filled circles representing data from the AAPS and filled squared data from HARPS. From top left to bottom rightwe show the stars in catalogue order, HD 18907, HD 25874, HD 26491, HD 39213, HD 42024, HD 64184, HD 120690, HD 121384, respectively. From topleft to bottom right we show the stars in catalogue order, HD 131923, HD 145825, HD 150248, HD 156274B, HD 158783, HD 162255, HD 169586, and HD175345, respectively.
MNRAS 453, 1439–1457 (2015)
at Universidad de C
hile on Novem
ber 26, 2015http://m
nras.oxfordjournals.org/D
ownloaded from

Spectroscopic binaries from the AAPS 1443
Figure 1 – continued
HD 26491: This is classified as a G1V by Gray et al. (2006), andpreviously consistently classified as a G3 (Houk & Cowley 1975;Evans 1964), and is identified by Decin et al. (2000) as having aVega-like IR excess. Bond et al. (2006) derive a spectroscopic metal-licity of [Fe/H] = −0.08 dex, which is larger than the Casagrande
et al. (2011) value of −0.11 dex. An age of 10.5 Gyr is indicated bythe isochrone fit which is somewhat older than the 5 Gyr inferredfrom an R′
HK index of −4.95 (Henry et al. 1996). Accordingly amass of 0.97 ± 0.05 M� is assigned to this high proper-motionstar. Given the nature of the RV variation (Fig. 1), orbital solutions
MNRAS 453, 1439–1457 (2015)
at Universidad de C
hile on Novem
ber 26, 2015http://m
nras.oxfordjournals.org/D
ownloaded from
1444 J. S. Jenkins et al.
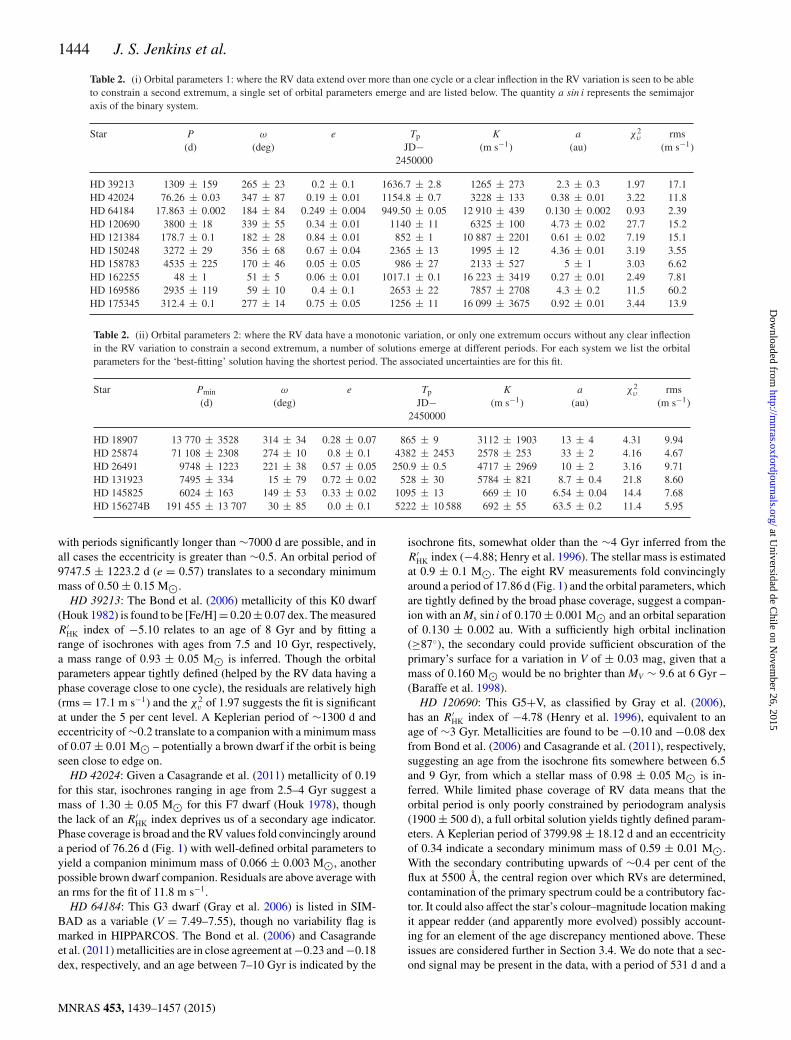
Table 2. (i) Orbital parameters 1: where the RV data extend over more than one cycle or a clear inflection in the RV variation is seen to be ableto constrain a second extremum, a single set of orbital parameters emerge and are listed below. The quantity a sin i represents the semimajoraxis of the binary system.
Star P ω e Tp K a χ2υ rms
(d) (deg) JD− (m s−1) (au) (m s−1)2450000
HD 39213 1309 ± 159 265 ± 23 0.2 ± 0.1 1636.7 ± 2.8 1265 ± 273 2.3 ± 0.3 1.97 17.1HD 42024 76.26 ± 0.03 347 ± 87 0.19 ± 0.01 1154.8 ± 0.7 3228 ± 133 0.38 ± 0.01 3.22 11.8HD 64184 17.863 ± 0.002 184 ± 84 0.249 ± 0.004 949.50 ± 0.05 12 910 ± 439 0.130 ± 0.002 0.93 2.39HD 120690 3800 ± 18 339 ± 55 0.34 ± 0.01 1140 ± 11 6325 ± 100 4.73 ± 0.02 27.7 15.2HD 121384 178.7 ± 0.1 182 ± 28 0.84 ± 0.01 852 ± 1 10 887 ± 2201 0.61 ± 0.02 7.19 15.1HD 150248 3272 ± 29 356 ± 68 0.67 ± 0.04 2365 ± 13 1995 ± 12 4.36 ± 0.01 3.19 3.55HD 158783 4535 ± 225 170 ± 46 0.05 ± 0.05 986 ± 27 2133 ± 527 5 ± 1 3.03 6.62HD 162255 48 ± 1 51 ± 5 0.06 ± 0.01 1017.1 ± 0.1 16 223 ± 3419 0.27 ± 0.01 2.49 7.81HD 169586 2935 ± 119 59 ± 10 0.4 ± 0.1 2653 ± 22 7857 ± 2708 4.3 ± 0.2 11.5 60.2HD 175345 312.4 ± 0.1 277 ± 14 0.75 ± 0.05 1256 ± 11 16 099 ± 3675 0.92 ± 0.01 3.44 13.9
Table 2. (ii) Orbital parameters 2: where the RV data have a monotonic variation, or only one extremum occurs without any clear inflectionin the RV variation to constrain a second extremum, a number of solutions emerge at different periods. For each system we list the orbitalparameters for the ‘best-fitting’ solution having the shortest period. The associated uncertainties are for this fit.
Star Pmin ω e Tp K a χ2υ rms
(d) (deg) JD− (m s−1) (au) (m s−1)2450000
HD 18907 13 770 ± 3528 314 ± 34 0.28 ± 0.07 865 ± 9 3112 ± 1903 13 ± 4 4.31 9.94HD 25874 71 108 ± 2308 274 ± 10 0.8 ± 0.1 4382 ± 2453 2578 ± 253 33 ± 2 4.16 4.67HD 26491 9748 ± 1223 221 ± 38 0.57 ± 0.05 250.9 ± 0.5 4717 ± 2969 10 ± 2 3.16 9.71HD 131923 7495 ± 334 15 ± 79 0.72 ± 0.02 528 ± 30 5784 ± 821 8.7 ± 0.4 21.8 8.60HD 145825 6024 ± 163 149 ± 53 0.33 ± 0.02 1095 ± 13 669 ± 10 6.54 ± 0.04 14.4 7.68HD 156274B 191 455 ± 13 707 30 ± 85 0.0 ± 0.1 5222 ± 10 588 692 ± 55 63.5 ± 0.2 11.4 5.95
with periods significantly longer than ∼7000 d are possible, and inall cases the eccentricity is greater than ∼0.5. An orbital period of9747.5 ± 1223.2 d (e = 0.57) translates to a secondary minimummass of 0.50 ± 0.15 M�.
HD 39213: The Bond et al. (2006) metallicity of this K0 dwarf(Houk 1982) is found to be [Fe/H] = 0.20 ± 0.07 dex. The measuredR′
HK index of −5.10 relates to an age of 8 Gyr and by fitting arange of isochrones with ages from 7.5 and 10 Gyr, respectively,a mass range of 0.93 ± 0.05 M� is inferred. Though the orbitalparameters appear tightly defined (helped by the RV data having aphase coverage close to one cycle), the residuals are relatively high(rms = 17.1 m s−1) and the χ2
v of 1.97 suggests the fit is significantat under the 5 per cent level. A Keplerian period of ∼1300 d andeccentricity of ∼0.2 translate to a companion with a minimum massof 0.07 ± 0.01 M� – potentially a brown dwarf if the orbit is beingseen close to edge on.
HD 42024: Given a Casagrande et al. (2011) metallicity of 0.19for this star, isochrones ranging in age from 2.5–4 Gyr suggest amass of 1.30 ± 0.05 M� for this F7 dwarf (Houk 1978), thoughthe lack of an R′
HK index deprives us of a secondary age indicator.Phase coverage is broad and the RV values fold convincingly arounda period of 76.26 d (Fig. 1) with well-defined orbital parameters toyield a companion minimum mass of 0.066 ± 0.003 M�, anotherpossible brown dwarf companion. Residuals are above average withan rms for the fit of 11.8 m s−1.
HD 64184: This G3 dwarf (Gray et al. 2006) is listed in SIM-BAD as a variable (V = 7.49–7.55), though no variability flag ismarked in HIPPARCOS. The Bond et al. (2006) and Casagrandeet al. (2011) metallicities are in close agreement at −0.23 and −0.18dex, respectively, and an age between 7–10 Gyr is indicated by the
isochrone fits, somewhat older than the ∼4 Gyr inferred from theR′
HK index (−4.88; Henry et al. 1996). The stellar mass is estimatedat 0.9 ± 0.1 M�. The eight RV measurements fold convincinglyaround a period of 17.86 d (Fig. 1) and the orbital parameters, whichare tightly defined by the broad phase coverage, suggest a compan-ion with an Ms sin i of 0.170 ± 0.001 M� and an orbital separationof 0.130 ± 0.002 au. With a sufficiently high orbital inclination(≥87◦), the secondary could provide sufficient obscuration of theprimary’s surface for a variation in V of ± 0.03 mag, given that amass of 0.160 M� would be no brighter than MV ∼ 9.6 at 6 Gyr –(Baraffe et al. 1998).
HD 120690: This G5+V, as classified by Gray et al. (2006),has an R′
HK index of −4.78 (Henry et al. 1996), equivalent to anage of ∼3 Gyr. Metallicities are found to be −0.10 and −0.08 dexfrom Bond et al. (2006) and Casagrande et al. (2011), respectively,suggesting an age from the isochrone fits somewhere between 6.5and 9 Gyr, from which a stellar mass of 0.98 ± 0.05 M� is in-ferred. While limited phase coverage of RV data means that theorbital period is only poorly constrained by periodogram analysis(1900 ± 500 d), a full orbital solution yields tightly defined param-eters. A Keplerian period of 3799.98 ± 18.12 d and an eccentricityof 0.34 indicate a secondary minimum mass of 0.59 ± 0.01 M�.With the secondary contributing upwards of ∼0.4 per cent of theflux at 5500 Å, the central region over which RVs are determined,contamination of the primary spectrum could be a contributory fac-tor. It could also affect the star’s colour–magnitude location makingit appear redder (and apparently more evolved) possibly account-ing for an element of the age discrepancy mentioned above. Theseissues are considered further in Section 3.4. We do note that a sec-ond signal may be present in the data, with a period of 531 d and a
MNRAS 453, 1439–1457 (2015)
at Universidad de C
hile on Novem
ber 26, 2015http://m
nras.oxfordjournals.org/D
ownloaded from

Spectroscopic binaries from the AAPS 1445
Table 3. UCLES and HARPS RV data for all stars discussed in this work.
HD 18907 Instrument Date RV RV error(JD − 2450000) (m s−1) (m s−1)
UCLES 831.050 35 −616.2 1.81035.325 46 −245.1 1.41211.969 92 0.00 2.31236.912 35 36.6 2.11383.332 60 203.4 1.41745.299 74 393.0 1.61828.116 60 383.8 2.61856.113 91 393.7 2.62092.289 43 353.0 1.62127.248 66 350.0 2.52710.886 87 −101.4 2.15101.255 80 −2772.4 1.35374.327 32 −3044.1 1.2
HD 25874 Instrument Date RV RV error(JD − 2450000) (m s−1) (m s−1)
UCLES 1118.122 18 −1005.7 1.51473.261 27 −551.9 1.91526.013 61 −499.2 1.61630.876 12 −353.4 1.71830.117 89 −105.3 2.11920.037 98 0.0 2.02189.176 94 352.8 3.02511.239 25 773.4 4.32594.080 90 882.2 2.82654.061 84 950.8 2.22710.891 86 1024.2 2.46746.883 41 11860.0 5.2
HARPS 5846.822 36 2700.0 2.15846.827 32 2701.3 2.15850.828 95 2699.5 2.15850.833 81 2698.9 2.15851.815 10 2698.4 2.15851.820 11 2698.8 2.15852.814 06 2697.6 2.15852.818 97 2697.2 2.15984.509 42 2669.3 2.05984.514 41 2669.2 2.15986.535 69 2668.6 2.05986.540 65 2668.6 2.06298.598 13 2585.0 2.16298.603 23 2585.8 2.16301.617 64 2587.3 2.16301.622 50 2585.5 2.16746.880 00 2453.6 5.2
HD 26491 Instrument Date RV RV error(JD − 2450000) (m s−1) (m s−1)
UCLES 831.076 78 −2115.6 1.51118.136 48 −784.2 1.61473.264 23 0.0 2.01525.977 09 70.9 1.81527.062 95 65.8 1.81745.328 14 274.1 1.91920.043 74 349.3 3.32127.302 80 439.6 3.02710.897 27 413.5 1.85101.202 38 −697.0 1.35845.248 38 −1236.9 2.95899.071 15 −1278.6 2.3
Table 3 – continued
HD 39213 Instrument Date RV RV error(JD − 2450000) (m s−1) (m s−1)
UCLES 1118.212 33 13.2 5.91121.176 19 12.6 7.61157.150 34 −122.2 8.11212.990 66 −361.0 8.01214.091 91 −381.4 7.51274.869 86 −553.7 7.51275.870 68 −545.8 8.21387.334 31 −809.0 10.91683.855 61 772.0 10.61828.198 55 1638.4 9.11830.045 17 1657.9 12.61856.2322 1681.6 9.5
2127.333 54 1238.2 19.12751.876 83 −777.0 6.8
HD 42024 Instrument Date RV RV error(JD − 2450000) (m s−1) (m s−1)
UCLES 1118.2294 −2859.2 8.01157.166 31 3573.5 2.91213.023 11 −1299.5 2.81214.100 00 −1052.7 2.71275.878 45 −2848.1 3.51411.312 72 −1804.3 5.81414.300 77 −2188.3 2.51473.239 53 1382.8 2.81530.150 77 2200.9 3.11630.952 38 0.0 3.21920.069 37 3570.0 3.31983.931 73 964.8 3.42060.844 24 1201.9 2.9
HD 64184 Instrument Date RV RV error(JD − 2450000) (m s−1) (m s−1)
UCLES 946.852 78 0.0 2.71236.063 03 −8217.3 2.81630.998 29 2005.9 2.01683.888 73 −1894.8 1.91920.111 22 13 652.9 2.81983.994 41 −5721.9 3.52009.048 58 12 902.0 2.92751.988 69 −5134.5 2.4
HD 120690 Instrument Date RV RV error(JD − 2450000) (m s−1) (m s−1)
UCLES 917.110 28 81.0 3.71236.243 32 −4831.4 3.11275.124 58 −4967.8 4.01382.948 87 −4855.0 2.51630.263 44 −2914.8 2.71683.064 32 −2373.5 2.91717.961 27 −2028.6 2.81743.009 61 −1771.8 2.81920.243 38 0.0 3.31984.148 82 580.2 4.22060.968 53 1224.4 3.42092.974 58 1483.7 3.12748.218 44 5322.1 5.56793.066 82 6289.8 3.2
HARPS 5983.859 98 −897.3 2.05983.864 40 −898.1 2.15984.842 68 −896.4 2.15984.847 27 −893.5 2.1
MNRAS 453, 1439–1457 (2015)
at Universidad de C
hile on Novem
ber 26, 2015http://m
nras.oxfordjournals.org/D
ownloaded from

1446 J. S. Jenkins et al.
Table 3 – continued
HD 120690 Instrument Date RV RV error(JD − 2450000) (m s−1) (m s−1)
5985.835 24 −889.2 2.15985.839 71 −889.3 2.15986.857 72 −877.0 2.15986.862 06 −876.2 2.16042.612 45 −472.6 2.16042.616 87 −473.0 2.16042.769 14 −472.1 2.16042.773 48 −473.0 2.16046.734 67 −446.5 2.16046.738 70 −443.9 2.16047.754 28 −439.1 2.16047.758 62 −438.9 2.16048.780 13 −435.9 2.16048.784 67 −434.6 2.16300.851 04 1104.6 2.16300.855 51 1105.5 2.16375.784 22 1515.5 2.06375.788 65 1516.6 2.06376.807 60 1515.1 2.16376.812 02 1515.6 2.1
HD 121384 Instrument Date RV RV error(JD − 2450000) (m s−1) (m s−1)
UCLES 831.232 38 −761.1 1.2915.112 84 1173.1 2.2
1002.942 45 −119.4 2.31212.283 29 −9052.3 3.61236.254 93 289.7 2.81383.960 12 −9086.6 2.11385.851 81 −14 785.4 2.31386.864 23 −19 043.8 2.21410.871 19 0.0 3.91413.856 41 211.3 3.51631.267 48 1160.1 2.41682.991 33 992.2 3.01684.068 55 980.7 2.81706.076 67 451.6 3.31717.833 28 −155.9 3.11742.889 68 −13 609.7 2.81743.881 68 −17 735.1 2.71919.259 71 −7795.4 5.31984.161 57 1114.1 2.32010.266 83 1205.2 1.82061.011 49 535.1 2.72091.913 15 −2958.7 3.62127.898 69 145.3 2.42129.923 47 270.0 2.32752.114 88 1007.9 1.15669.184 15 −5277.9 0.8
HD 131923 Instrument Date RV RV error(JD − 2450000) (m s−1) (m s−1)
UCLES 831.266 15 8714.9 1.8915.141 55 8120.8 1.9
1236.259 51 6268.9 2.51383.980 96 5644.7 2.81683.018 96 4640.8 2.31718.057 74 4541.6 3.21984.191 27 3894.3 2.22187.864 19 3481.1 2.82711.316 97 2566.7 3.52748.221 62 2505.1 3.05013.859 13 20.8 1.2
Table 3 – continued
HD 131923 Instrument Date RV RV error(JD − 2450000) (m s−1) (m s−1)
5017.879 36 18.0 1.15018.990 94 13.0 1.05019.966 96 14.7 1.15020.908 13 6.1 1.45021.912 60 7.3 1.45023.906 83 −0.0 1.55029.895 93 −3.4 1.25030.850 82 −11.1 1.45031.965 01 −2.9 1.15032.995 08 −1.5 1.35036.890 32 −13.7 1.35037.888 30 −17.3 1.65043.928 13 −24.9 1.35044.875 81 −29.0 1.35045.894 27 −25.5 1.15048.903 80 −23.05 1.25049.880 25 −26.0 1.76793.098 17 −1791.3 2.5
HARPS 5983.916 73 −1033.9 2.15983.919 76 −1033.0 2.15983.923 22 −1036.3 2.05984.896 57 −1022.5 2.15984.899 80 −1023.3 2.15984.903 05 −1023.6 2.15985.892 76 −1023.4 2.05985.896 03 −1026.9 2.05985.899 26 −1024.6 2.06042.695 51 −1005.8 2.16042.698 89 −1006.0 2.16042.702 04 −1007.8 2.16042.706 10 −1007.7 2.16042.709 44 −1004.9 2.16042.712 59 −1008.4 2.16046.775 64 −1006.8 2.16046.778 88 −1005.3 2.16046.782 19 −1006.6 2.16047.804 34 −1005.1 2.16047.807 58 −1006.9 2.16047.810 77 −1005.2 2.16048.829 39 −1011.2 2.16048.832 65 −1010.8 2.16048.835 86 −1009.0 2.16165.480 87 −961.2 2.06165.484 09 −960.8 2.06165.487 24 −960.9 2.06299.841 38 −939.4 2.16299.844 56 −940.9 2.16300.875 69 −930.3 2.16300.878 92 −931.1 2.16300.882 22 −929.2 2.16301.863 54 −927.0 2.16301.866 87 −925.0 2.16301.870 07 −926.2 2.16375.838 88 −927.1 2.06375.842 14 −926.0 2.06375.845 38 −927.2 2.06376.867 79 −928.7 2.16376.871 02 −927.8 2.16376.874 31 −928.3 2.16377.794 62 −932.6 2.16377.797 98 −930.0 2.16377.801 19 −930.7 2.1
MNRAS 453, 1439–1457 (2015)
at Universidad de C
hile on Novem
ber 26, 2015http://m
nras.oxfordjournals.org/D
ownloaded from

Spectroscopic binaries from the AAPS 1447
Table 3 – continued
HD 145825 Instrument Date RV RV error(JD − 2450000) (m s−1) (m s−1)
UCLES 915.181 78 −348.0 2.21002.045 74 −448.0 3.01382.973 83 −534.0 1.91630.279 76 −375.7 2.01683.046 91 −330.1 2.11718.096 32 −310.8 2.21742.997 28 −287.7 2.11766.897 25 −269.1 1.81984.223 96 −79.4 2.32060.981 94 0.0 2.02091.944 91 35.1 2.12126.927 35 56.7 2.42711.314 79 544.4 3.02748.214 70 564.8 2.75669.194 03 1646.1 1.86088.207 21 1610.5 2.66765.202 19 1103.0 1.2
HARPS 6042.719 40 277.4 2.16042.724 34 278.2 2.16046.828 52 271.8 2.16046.833 81 271.3 2.16047.874 75 275.3 2.16047.879 65 275.6 2.16048.880 54 276.2 2.16048.885 48 276.7 2.16164.537 42 208.8 2.16164.542 16 208.7 2.16165.519 08 207.6 2.16165.523 94 206.5 2.16375.907 68 36.4 2.06375.912 45 36.6 2.06376.891 08 35.6 2.16376.895 85 36.1 2.16377.863 16 34.3 2.16377.867 88 34.4 2.16557.503 61 −128.5 2.46557.508 34 −130.6 2.46558.481 09 −131.0 2.16558.485 82 −130.1 2.16559.491 01 −128.4 2.16559.495 73 −129.1 2.16560.488 28 −126.6 2.16560.493 00 −127.6 2.1
HD 150248 Instrument Date RV RV error(JD − 2450000) (m s−1) (m s−1)
UCLES 917.262 97 −506.1 3.01384.036 61 −413.2 2.21683.074 65 −229.2 2.31684.123 07 −232.1 2.31743.030 57 −164.5 2.11766.914 99 −142.2 2.21767.948 21 −134.0 2.41827.890 80 −62.5 2.51828.878 61 −54.9 2.21984.239 53 259.2 2.72061.090 80 541.6 2.32091.963 33 670.8 2.02126.951 64 865.5 2.02389.211 41 3448.5 1.02711.311 86 612.6 2.22748.224 95 499.7 3.1
Table 3 – continued
HD 150248 Instrument Date RV RV error(JD − 2450000) (m s−1) (m s−1)
HARPS 6042.744 97 244.9 2.06046.864 31 231.2 2.06047.900 16 228.8 2.06048.893 60 226.6 2.06164.574 97 −24.5 2.16165.555 98 −26.3 2.0
HD 156274B Instrument Date RV RV error(JD − 2450000) (m s−1) (m s−1)
UCLES 915.251 03 −100.2 1.81236.290 45 −93.6 1.91631.312 56 −75.6 1.41683.081 90 −77.1 1.91684.130 26 −74.9 1.91718.109 16 −69.6 1.61743.972 23 −69.9 1.51766.929 42 −72.9 1.71767.963 59 −73.8 1.61984.254 59 −66.3 1.82061.105 43 −58.2 1.72093.068 73 −64.4 1.72127.965 61 −68.4 1.92151.966 53 −62.5 1.82186.906 47 −57.3 1.42189.906 68 −58.9 1.32359.213 66 −51.1 1.42387.160 82 −54.1 1.42388.202 99 −55.3 1.52422.142 28 −48.9 1.32455.031 40 −50.8 1.62509.954 69 −49.0 1.72510.921 82 −54.4 1.52745.250 45 −47.2 1.62746.306 57 −46.1 1.42752.165 29 −45.4 1.62784.118 07 −48.4 1.52858.944 18 −47.6 1.62942.923 55 −40.3 1.63041.278 89 −38.1 1.73042.290 99 −45.0 1.73214.976 64 −26.2 1.53245.006 97 −31.9 1.73280.905 84 −36.0 1.53483.235 36 −25.1 0.93486.155 07 −24.5 0.73507.146 09 −26.5 0.83516.113 59 −32.2 1.03517.152 45 −28.0 0.93520.201 39 −22.4 0.93521.183 10 −24.9 0.83523.113 61 −21.8 0.83569.028 20 −23.7 0.83627.883 88 −32.6 1.13628.915 53 −25.2 0.83631.881 50 −25.8 0.73842.226 56 −20.6 0.93938.051 95 −12.5 0.84010.912 05 −20.1 0.74226.206 07 −7.9 1.04255.005 36 −8.0 0.94336.018 44 −9.2 1.14550.263 95 −3.0 1.85013.934 67 1.4 0.9
MNRAS 453, 1439–1457 (2015)
at Universidad de C
hile on Novem
ber 26, 2015http://m
nras.oxfordjournals.org/D
ownloaded from

1448 J. S. Jenkins et al.
Table 3 – continued
HD 156274B Instrument Date RV RV error(JD − 2450000) (m s−1) (m s−1)
5014.991 59 1.8 2.05017.913 53 2.3 1.05019.049 22 2.4 1.05020.073 29 5.4 1.05020.862 56 −0.2 1.05021.996 21 4.5 0.95023.004 47 1.6 1.15024.008 43 7.2 0.95027.068 74 6.2 0.95029.961 15 3.1 1.05030.129 74 5.3 0.95030.915 09 1.8 0.85032.045 41 4.7 0.95032.967 09 5.4 0.95036.969 46 9.2 0.85039.019 74 13.0 0.85040.006 08 10.5 1.45043.971 42 8.1 0.75044.969 94 5.0 0.95046.867 56 5.4 0.65047.971 02 3.8 0.95049.064 88 1.7 0.75049.949 76 1.6 0.95050.945 61 −3.0 0.95051.916 15 −1.7 0.95052.940 01 −2.1 1.65053.944 17 2.9 1.35054.946 08 3.2 0.95056.035 35 4.0 0.85056.996 12 6.4 0.85057.996 25 4.9 0.85058.988 84 6.5 0.85076.036 18 −0.7 1.15100.895 70 −1.3 1.65110.926 24 2.0 1.15310.159 13 13.1 0.95374.083 25 16.5 2.05403.077 87 16.4 1.15996.201 04 34.9 1.16088.213 96 40.8 1.76767.153 56 52.1 1.0
HARPS 3039.896 53 −124.3 2.13039.899 01 −125.4 2.13039.901 42 −131.1 2.13306.481 42 −118.9 2.03306.483 46 −120.3 2.03306.485 57 −119.5 2.03429.788 50 −115.1 2.03429.792 10 −115.3 2.03429.795 77 −116.8 2.03429.856 97 −116.4 2.03429.860 64 −116.5 2.03429.864 43 −116.5 2.03521.771 04 −114.7 2.03521.774 80 −116.0 2.03521.778 80 −115.5 2.03523.110 00 −107.5 0.83537.783 18 −115.9 2.03537.787 00 −114.8 2.13537.790 85 −115.5 2.13600.475 66 −111.7 2.03600.479 31 −112.5 2.0
Table 3 – continued
HD 156274B Instrument Date RV RV error(JD − 2450000) (m s−1) (m s−1)
3600.483 26 −112.0 2.03808.762 99 −108.9 2.03808.764 86 −109.5 2.03808.766 69 −109.3 2.03808.784 37 −109.1 2.13808.786 15 −108.3 2.13808.787 93 −108.9 2.03808.805 20 −109.3 2.03808.807 03 −109.1 2.03808.808 86 −107.5 2.03828.813 48 −107.0 2.03828.815 29 −106.9 2.03828.817 03 −107.1 2.03873.657 16 −107.2 2.03873.658 94 −108.3 2.03873.660 69 −107.3 2.03877.676 21 −108.4 2.03877.678 07 −108.8 2.03877.679 83 −107.9 2.03896.757 31 −103.2 2.13896.759 08 −103.0 2.13896.760 77 −103.7 2.13915.849 89 −106.3 2.03915.851 69 −107.8 2.03915.853 43 −105.5 2.03988.627 57 −104.6 2.13988.629 34 −103.3 2.13988.631 17 −104.7 2.04161.801 81 −100.4 2.14161.803 56 −99.6 2.14161.805 31 −98.8 2.14192.865 33 −100.3 2.04192.867 08 −100.0 2.04192.868 83 −99.5 2.04203.893 16 −100.0 2.04203.894 89 −102.0 2.04203.896 65 −101.3 2.04246.683 53 −96.1 2.14246.685 28 −96.7 2.14246.687 03 −96.7 2.14290.697 83 −97.1 2.24290.699 97 −96.3 2.24290.701 67 −96.7 2.34312.595 89 −95.0 2.04312.597 65 −96.1 2.14312.599 44 −95.8 2.04339.531 13 −94.1 2.04339.532 88 −95.0 2.04339.534 66 −94.9 2.04350.552 36 −96.1 2.04350.554 12 −94.4 2.14350.555 87 −95.8 2.1
HD 158783 Instrument Date RV RV error(JD − 2450000) (m s−1) (m s−1)
UCLES 915.258 87 −1160.7 5.31384.060 35 −891.6 1.81386.870 73 −871.0 1.81410.891 83 −828.4 2.21413.892 04 −821.8 1.71630.308 34 −320.9 2.01683.089 59 −182.0 2.21684.135 87 −185.8 2.2
MNRAS 453, 1439–1457 (2015)
at Universidad de C
hile on Novem
ber 26, 2015http://m
nras.oxfordjournals.org/D
ownloaded from

Spectroscopic binaries from the AAPS 1449
Table 3 – continued
HD 158783 Instrument Date RV RV error(JD − 2450000) (m s−1) (m s−1)
1706.102 37 −107.5 2.11718.114 25 −82.0 2.01742.905 40 −6.2 2.01743.919 51 −9.8 2.41745.050 91 0.8 2.11827.908 31 251.1 2.21828.882 93 246.5 2.51829.885 74 251.8 2.81984.258 18 725.0 3.02009.185 80 826.7 2.72061.109 05 985.6 2.32091.974 55 1090.1 2.12126.969 48 1188.2 1.92711.308 21 2693.2 1.46793.238 33 1587.9 1.26794.204 68 1598.6 1.0
HD 162255 Instrument Date RV RV error(JD − 2450000) (m s−1) (m s−1)
UCLES 1002.052 44 6218.0 4.71382.996 01 1036.8 2.01410.969 27 −11 071.1 2.91630.294 29 13 912.1 2.11684.174 16 16 122.8 2.61718.137 92 0.0 1.91742.940 71 −3974.7 2.21744.027 28 −6307.1 1.91766.962 37 1667.6 2.11827.926 94 16 187.1 2.41984.282 28 −7283.5 2.92061.138 15 12 969.8 2.02091.995 01 −14 472.3 2.32127.032 19 −4974.4 1.6
HD 169586 Instrument Date RV RV error(JD − 2450000) (m s−1) (m s−1)
UCLES 917.303 25 −6740.6 6.51120.892 31 −5470.6 4.61683.110 45 −892.4 5.01744.018 38 −152.0 5.31745.089 61 −160.5 5.01766.966 49 0.0 5.42061.142 42 3385.1 7.12711.319 87 863.5 11.22748.209 56 −508.7 10.25374.134 37 6244.4 7.2
HD 175345 Instrument Date RV RV error(JD − 2450000) (m s−1) (m s−1)
UCLES 1119.922 72 −57.5 3.01387.197 87 3319.5 3.01410.950 38 1550.7 3.51472.912 36 −3628.9 3.21683.129 96 4575.2 4.31706.157 76 2859.0 8.91718.144 93 1940.2 3.31742.956 21 73.7 4.11743.996 65 0.0 3.81745.095 75 −78.5 4.41827.949 94 −9067.6 3.51984.290 80 5441.5 5.12061.156 04 −367.2 5.02092.015 01 −3053.1 4.12127.060 57 −7052.3 3.12748.205 73 −6569.9 5.3
semi-amplitude of 32 m s−1, which if it were a genuine Dopplersignal, would give rise to a planet with mass around 1 MJ. Theaddition of this signal can serve to decrease the rms by a factor 2.
HD 121384: Classified as G8V (Gray et al. 2006), and listed inDommanget & Nys (1994) along with a common V = 13 proper-motion companion (position angle 45◦, separation 31 arcsec, 1941),this star is identified by Oudmaijer et al. (1992) and by Aumann &Probst (1991) as having a Vega-like IR excess. Bond et al. (2006)find an [Fe/H] value of −0.40 ± 0.07 dex, in excellent agreementwith the value found by Casagrande et al. (2011) of −0.39 dex, yetin good agreement within the uncertainties with Bond et al. (2006).The colour and magnitude are well fit by 7–10 Gyr isochronesindicating that the primary component is indeed evolving away fromthe main sequence – a view further evidenced by the low level ofR′
HK activity (−5.22; Henry et al. 1996). Accordingly its stellar massis estimated at 0.98 ± 0.10 M�. The 179-d period is sharply definedby the broad phase coverage and the Keplerian solution, albeit witha relatively large rms of 15.1 m s−1. The data indicate that there is a0.17 ± 0.01 M� companion orbiting with an eccentricity of 0.84.An eccentricity of this magnitude (Fig. 4) places this binary in theextreme upper tail of the eccentricity distribution for systems withperiods <1000 d (Duquennoy & Mayor 1991, fig. 6a) and whencombined with the window function, makes the detection of thissignal from periodogram analysis alone very difficult (see Fig. 2).
HD 131923: The colour–magnitude location is well fit by 9–12 Gyr isochrones with metallicities of −0.05 and 0.06 dex forBond et al. (2006) and Casagrande et al. (2011), respectively. Theseclose to solar values suggest that this high proper-motion G4V star(Gray et al. 2006) is starting to evolve away from the main se-quence; by contrast, the age inferred from its R′
HK index (−4.90;Henry et al. 1996) is only ∼4 Gyr. Given the monotonic variationin RV measurements, the period is poorly defined, though a 7496-dKeplerian solution emerges with an eccentricity of 0.72. The rmsfor the fit is above average (∼9 m s−1) and this is reflected in a χ2
υ
of 21.8. With an inferred mass for the primary of 1.05 ± 0.05 M�,the orbital parameters translate to a secondary minimum mass of∼0.52 ± 0.06 M�. The star is identified in the HIPPARCOS cata-logue as a ‘suspected non-single’ object.
HD 145825: This G3 dwarf (Torres et al. 2006) again appears tohave a metallicity consistent with solar ([Fe/H] = −0.04 and 0.12dex from Bond et al. 2006 and Casagrande et al. 2011) and isochronefitting suggests an age under 3 Gyr, which is consistent with therelatively high level of R′
HK activity (−4.74; Henry et al. 1996).Consequently, the stellar mass is estimated at 1.03 ± 0.05 M�. Re-cent RV measurements have improved the phase coverage, leadingto a more sharply defined period of 6024 ± 163 d. With a mini-mum mass of 0.06 ± 0.01 M�, this adds to the list of brown dwarfcandidate companions in our sample.
HD 150248: Consistently classified as a G3V (Evans et al.1957; Houk 1978; Gray et al. 2006), the sub-solar metallicity of[Fe/H] = −0.11 dex from Bond et al. (2006) and −0.13 dexfrom Casagrande et al. (2011) suggest an age from isochronefits of ∼7 Gyr, which contrasts with an activity-inferred age of∼ 4 Gyr (R′
HK activity of −4.88 from Henry et al. 1996). A massof 0.93 ± 0.05 M� is estimated for the star. The orbital parame-ters are fairly well defined, with a period of 3272.4 ± 28.7 d andeccentricity of 0.67, relating to a companion with a minimum massof 0.10 ± 0.02 MJ.
HD 156274B: Listed as a multiple-star system in Dommanget& Nys (1994), comprising four known components: Gl 666A, aG8V (Eggl et al. 2013), Gl666B, an M0 dwarf (separation 7.5 arc-sec, 1880), a V = 12.5 companion, and a 14.0 companion (respec-tively, 279◦, 41.8 arcsec, 1900; 30◦, 47 arcsec, no year). Our RV
MNRAS 453, 1439–1457 (2015)
at Universidad de C
hile on Novem
ber 26, 2015http://m
nras.oxfordjournals.org/D
ownloaded from

1450 J. S. Jenkins et al.
measurements indicate that Gl666A is itself a spectroscopic binary.No spectral metallicity was determined but Casagrande et al. (2011)find a metal-poor value of [Fe/H] = −0.40 dex. Such a value de-mands isochrones of 9–10 Gyr, though the star would appear to beno older than ∼6 Gyr judging from its R′
HK index (−4.95; Jenkinset al.) in which case isochrones with metallicities of 0.1–0.2 dexprovide complementary fits. These two scenarios translate to a stel-lar mass estimated at 0.83 ± 0.06M�. The best-fitting period isfound to be 524 years, implying a secondary minimum mass of
0.20 ± 0.03 MJ, the fit has an rms of 5.95 m s−1, however we notethat the uncertainties on the measured quantities from the boot-strap are formal to the solution presented. It is clear that this is theminimum best fit to the data and so the true solution could be verydifferent and therefore properties like the time of periastron passageare essentially unconstrained.
HD 158783: This G3/G5 dwarf (Houk & Cowley 1975) appearsto have a metallicity slightly under solar (−0.05 dex from Bond et al.(2006) and 0.05 dex from Casagrande et al. 2011) and isochrone
Figure 2. Lomb–Scargle periodograms. These are plots of spectral power against log period and are shown for all the stars where the phase coverage of theRV data is nearly a cycle or more. Where the sampling is sparse, aliasing introduces spectral power over a range of frequencies and is particularly marked forHD 64184. The period inferred from the orbital solution in each case is marked with a vertical dashed line.
MNRAS 453, 1439–1457 (2015)
at Universidad de C
hile on Novem
ber 26, 2015http://m
nras.oxfordjournals.org/D
ownloaded from

Spectroscopic binaries from the AAPS 1451
Figure 2 – continued
fits demand an age of 8–10 Gyr, significantly above the 4 Gyr ageinferred from the star’s R′
HK index (−4.91; Henry et al. 1996). Astellar mass of 1.04 ± 0.05 M� is inferred. Orbital parametersare tightly defined given the limited phase coverage of the RVmeasurements and the Keplerian fit is significant at the 20 per centlevel. A period of 4534.78 ± 224.92 d and zero eccentricity translateto a secondary minimum mass of 0.20 ± 0.02 M�.
HD 162255: Though no R′HK index is given for this G3 dwarf
(Houk & Smith-Moore 1988), isochrone fits based on ∼−0.01 dex(Bond et al. 2006) and 0.17 dex (Casagrande et al. 2011) metal-licities suggest an age ranging from 5 to 9 Gyr, translating to astellar mass of 1.12 ± 0.08 M�. The eleven RV measurementsfold convincingly around a 47.95-d period, indicating a companionminimum mass of 0.333 ± 0.001 M�.
HD 169586: This G0V star Houk (1982) appears metal rich([Fe/H] = 0.32 dex; Casagrande et al. 2011) suggesting an agearound 2–4 Gyr, which is in agreement with that derived from theR′
HK index (−4.92; Henry et al. 1996); the stellar mass is estimatedat 1.25 ± 0.05M�. The acquisition of two of the most recent RVmeasurements has defined a relatively sharp extremum in what wasoriginally a monotonic RV variation so that a 2935-d orbit with aneccentricity of 0.35 appears well constrained. Given that the sec-ondary has a minimum mass of 0.68 ± 0.22 M� (equivalent toan MV = 9.4 companion) contamination of the primary’s spectrumhas almost certainly taken place, and is possibly a reason why therms for the fit (60.2 m s−1) is so large, along with the large χ2
υ .
Nevertheless, the existing RV measurements clearly indicate thatthe primary has one or more companions.
HD 175345: Listed in Dommanget & Nys (1994) as having aV = 14.2 proper-motion companion (B 413: 252◦, 5.4 arcsec, 1927),our measurements indicate that this G0 dwarf (Houk & Smith-Moore 1988) is itself a spectroscopic binary. There is no R′
HK indexfor this star and the isochrone fits based on its Casagrande et al.(2011) metallicity of [Fe/H] = −0.16 dex gives an age range of4–9 Gyr along with an inferred mass of 1.05 ± 0.05 M�. There is aclear fold of the RV data around a 312-d period so orbital parametersare tightly constrained; however, the residuals are relatively large(rms = 14 m s−1) making the fit statistically poor, even though theχ2
υ is fairly low (3.44). With a minimum mass of 0.48 ± 0.08 M�,(equivalent to MV = 9.5 or brighter) the secondary is again a sourceof spectral contamination.
The locations of these stars on a HIPPARCOS-based HR diagram,along with a summary of the isochrone fits, are shown in Figs 3(a)and (b), respectively. We also show the distribution of eccentricityversus period in Fig. 4. We find that the companions to HD 121384and HD 175345 have very high eccentricities for companions withorbital periods below 1000 d, placing them in the extreme uppertail of the distribution in this parameter space. We also find a few ofthe longer period companions that have not been fully constrainedyet due to the limited baseline of the data have moderate to higheccentricity. Although the periods of the orbits could be significantlylonger, the eccentricities are rather well constrained with the current
MNRAS 453, 1439–1457 (2015)
at Universidad de C
hile on Novem
ber 26, 2015http://m
nras.oxfordjournals.org/D
ownloaded from

1452 J. S. Jenkins et al.
Figure 3. (a) The AAPS binaries are indicated on a colour–magnitude diagram constructed using HIPPARCOS data for solar-neighbourhood stars.(b) Best-fitting isochrones for each star; the numbers assigned to the stars are given in Table 1.
Figure 4. A plot of eccentricity versus period for the AAPS binaries. Thebinaries represented by filled circles are from Table 2 (i) and have wellconstrained Keplerian periods; open circles are used for binaries with poorlyconstrained periods – given in Table 2 (ii).
data in hand, assuming a single Keplerian fit. The one obviousexception is HD 156274B which currently only exhibits a lineartrend with velocity over time, and although we fit this will a circularmodel, this could very well be highly eccentric.
3.2 High-contrast observations
A number of the binaries we have discovered in this work havebeen followed up using adaptive optics systems to search for directconfirmation of the companions. Obtaining orbital motion fromdirect images of low-mass companions to bright Sun-like stars,especially when coupled with RV information, can yield dynamicalmasses for the companions (Liu, Leggett & Chiu 2007). Combiningdynamical masses with photometric colours and spectra can allowevolutionary and atmospheric properties to be well constrained andmodels to be tested (e.g. Dupuy, Liu & Ireland 2009).
In Jenkins et al. (2010) we observed two of the host stars wereport new binaries for in this work, HD 25874 and HD 145825.In that work we found contrast ratios of greater than 11 mag at
Figure 5. An example astrometric plot of the positional residuals and as-sociated errors for HD 175345.
separations of only 0.5 arcsec using the VLT NAOS CONICA in-strument (Rousset et al. 2003) in Simultaneous Differential Imagingmode. Although a tentative detection of the companion around HD25874 was discussed, further analysis revealed this to be a proba-ble artefact of the reduction and analysis procedure, and thereforeno companion detection was conclusively made for either of thesestars with mid-T dwarf masses of around 50 MJ or so. Some of theother stars we report companions for are included in our ongoingNACO/NICI imaging campaign.
3.3 HIPPARCOS astrometry
Out of these 16 binaries, 4 (HD 39213, HD 120690, HD 121384, andHD 175345) have well constrained periods in the range 0.5–6 yr,making them suitable candidates for analysis of their HIPPARCOSastrometry. In order to determine if there are any astrometric sig-natures that would allow us to place additional constraints on ourorbital parameters, we extracted the astrometric data from the HIP-PARCOS data base (van Leeuwen 2007) and derived positionalresiduals (αcos δ, δ). In Fig. 5 we show these with associated errorsfor HD 175345.
There are no significant variations obvious in the plots for the fourcandidates, though in the case of HD 175345, periodogram analysisreveals significant power at around 320 d (cf. a 312-d period fromRV analysis). Failure, however, of these data to fold around either
MNRAS 453, 1439–1457 (2015)
at Universidad de C
hile on Novem
ber 26, 2015http://m
nras.oxfordjournals.org/D
ownloaded from

Spectroscopic binaries from the AAPS 1453
Figure 6. Quality of orbital fit (in terms of the statistical significance attributed to the χ2v value) versus (a) the number of observations per star (b) the minimum
mass ratio of the system.
period suggests that the spectral power owes more to sampling ofthe data (which have a strong 300-d element) than to any possibleastrometric signature. The significance of the astrometric variationsis clearly low and we do not attempt further to constrain our orbitalparameters using these data.
3.4 Secondary flux contamination
In those cases where the orbits are fully constrained and thesecondary minimum mass is ∼0.5M� (HD 18907, HD 26491,HD 120690, HD 131923, HD 169586, and HD 175345), the con-tribution of the secondary to the overall flux is at least 1 per centand the signature of this contribution is found in the quality of theorbital solutions: the rms scatter of these stars is generally muchhigher than the internal measurement uncertainty. The reason forthis is that flux from the secondary, which is contaminating the pri-mary’s spectrum, will be associated with a different RV at each ofthe subsequent observations from that when the template spectrumwas acquired. The RV fitting process relies on the assumption thatthe primary’s spectrum is modified only by the Doppler shift of theprimary and the spectrograph PSF variation. Consequently, less thanoptimal solutions can be expected when a faint secondary contribu-tion to the primary’s spectrum is present at variable Doppler shifts.In essence, the fitting process matching the observed and syntheticspectra would be expected to generate larger measurement errors,and this is the case particularly for HD 169586. Fig. 6 shows howthe quality of the orbital solutions – measured by the significanceof the fit – varies with the number of observations (plot a) and thebinary minimum-mass ratio (plot b). While no correlation appearsto be evident between the reduced chi-squared and companion massratio, in general, the statistical significance of the fits appear to in-dicate a marked deterioration as the number of data points increase.This could reflect the fact that these are the systems exhibiting themost stellar flux contamination and therefore they required moreobservations in order to better constrain their orbits, or, anotherpossibility is that these systems also contain additional compan-ions, either brown dwarfs or planets, that are giving rise to mixed
signals that are being manifest once enough RV measurements havebeen acquired.
Given the precision with which RVs can be obtained by the AAPS,we could speculate that where low M sin i values yield statisticallypoor fits (HD 39213, HD 121384), the orbital inclinations are lowand that the companions have masses high enough for spectralcontamination to be taking place. The large errors in RV measure-ments for HD 39213 and HD 156274 lend credence to this scenario,though this is not the only explanation. It is also possible that theseare multiple systems for which a double-star solution simply is notappropriate. Moreover, enhanced activity in any of these stars (bear-ing in mind that the R′
HK index is merely a ‘snapshot’ measurement)would mean that the internal errors would not properly reflect theuncertainty in the RV measurements. This is why it is pragmaticto use relatively inactive stars in Doppler searches. For the targetsconsidered here, enhanced activity is unlikely to be the cause: Henryet al. (1996) estimate that 90 per cent of the time a single R′
HK mea-surement for a solar-type star is sufficient to identify correctly if ithas an activity greater, or less, than R′
HK = −4.75, and all but oneof the stars have R′
HK indices lower than this. Where the measure-ment errors are low but the orbital solutions are statistically weak(HD 121384 and HD 162255), the most convincing explanation isthat these systems comprise more than a single companion.
The effect of binarity on the colour and magnitude of a pri-mary of any age and metallicity can be modelled easily using theYonsei–Yale isochrone data. Fig. 7 shows the variation in colourand magnitude for a 5.5 Gyr, solar metallicity isochrone ranging inmass from 0.88 to 1.20 M� (solid curve). The effect of adding asecondary is marked by the dotted curves at various mass intervals,with each point representing a secondary companion that increasesin mass from 0.5 to 1.0 Mp in steps of 0.05 Mp.
For companions below 0.55 Mp the effect of binarity on thecolour–magnitude location of the primary is negligible. The effectof a 0.70 Mp companion is to make the primary appear redder andbrighter by around 0.05 and 0.3 mag, respectively, for a solar-massstar, with slighter larger and smaller values for less massive andmore massive primary stars, respectively. Such an effect generallymakes the unresolved pair appear older and/or more metal rich;
MNRAS 453, 1439–1457 (2015)
at Universidad de C
hile on Novem
ber 26, 2015http://m
nras.oxfordjournals.org/D
ownloaded from

1454 J. S. Jenkins et al.
Figure 7. Effect of binarity on the colour and magnitude at 5.5 Gyr for solarmetallicity primaries ranging in mass from 0.88 to 1.20 M�. Secondarymass values increase in 0.05 Mp increments from 0.5 to 1.0 Mp.
however, if the primary itself is evolving away from the main se-quence, the companion will make the pair appear ‘bluer’. Theseeffects will complicate the process of mass estimation. For exam-ple, the presence of a 0.70Mp companion translates effectively to asystematic error of ∼ 0.04M� in the mass of the primary. This isof the order of the error in mass due to the age–metallicity uncer-tainties. The orbital solutions indicate binary mass ratios generallysignificantly less than unity (HD 169586 being the exception) sothat the effect of binarity on the determination of the primary mass(and by extension the secondary mass) is negligible. Clearly, formany of the binaries in our sample, the uncertainty in secondarymass is due principally to poorly constrained orbital parameters.
3.5 Mass distribution
The binaries and planetary companions to solar-type stars reportedby the AAPS provide an opportunity to examine, from a single RVsurvey, the distribution of M sin i values for a mass regime extendingfrom Jovian through brown dwarf to sub-solar in value.
In order to derive a more meaningful distribution of minimum-mass ratios, we need to impose a period cut-off on both the planetaryand binary companions so that we count only those companionswithin a certain distance of the primary stars. As a rule, planetarycandidates are announced when the phase coverage of the RV dataare close to one orbital period. For the AAPS, which has beenoperating since 1998, we can say that the inventory of exoplanetcandidates orbiting with periods up to 12 years (i.e. out to aroundthe orbit of Jupiter in the Solar system) is reasonably completedown to the level permitted by a Doppler precision of ∼3 m s−1,i.e. complete for Jupiter-mass objects and above. Brown dwarf andlow-mass stellar companions induce larger reflex velocities makingthem easier to detect over a greater range of distances and periods.In order to compare directly with Duquennoy & Mayor (1991), 6out of the 16 binaries have periods greater than 12 years and theseneed to be excluded from our count.
10 remaining binaries out of a sample of 178 stars is aroundhalf of that expected from the period distribution given in fig. 13of Raghavan et al. (2010), when normalized by the multiplicityfraction, though there are several reasons for this. First, our sampleexcludes all known short-period spectroscopic binaries with sepa-
Figure 8. The raw distribution of companion minimum masses uncoveredby the AAPS with periods less than 12 years.
rations less than 2 arcsec; secondly, all binaries beyond 2 arcsecdetected using HIPPARCOS data are excluded from our sample;thirdly, ‘double-lined’ spectrum binaries are immediately removedas soon as they are recognized; fourthly, our requirement for theAAPS target stars to have an R′
HK index below −4.5 has the ef-fect of filtering out some short-period, chromospherically activebinaries – RS CVn/W UMa types for example – though admittedlythese are few in number. The observed distribution in minimummasses, corrected for completeness for periods up to 12 years, isshown in Fig. 8.
The main features seen in this P < 12 yr distribution are (i) asub-stellar companion mass function rising strongly below 10 MJ,(ii) a comparatively flat distribution of stellar companions, and (iii)a region from ∼20 to 70 MJ (corresponding to the brown dwarfregime) where relatively few objects are found despite a selectionbias in the observations making them easier to detect than planets.Note that although objects do exist in this part of the parameterspace (e.g. Jenkins et al. 2009), the term brown dwarf desert wasgiven to highlight the relative paucity in comparison to planets andstellar objects (Marcy & Butler 2000). Such features accord withRV observations elsewhere: the CORALIE, Keck, and Lick surveysall report the same form of sub-stellar function while the ‘flat’ stellardistribution mirrors that seen in Duquennoy & Mayor (1991, fig.11). This similarity comes about despite the fact that the variousRV surveys work with different samples and operating strategies.The form of the distribution of planetary and stellar companions isconsidered to reflect the different formation mechanisms for thesetwo populations (respectively accretion in dissipative circumstellardiscs and gravitational instabilities in collapsing cloud fragments)and their consequent evolution. The relatively small number ofbrown dwarf companions has been noted elsewhere (for exampleHalbwachs et al. 2000; Butler et al. 2001; McCarthy 2001) and maybe a reflection of a formation mechanism different again from thatof stars or planets, though Armitage & Bonnell (2002) argue thatits existence is a consequence of orbital migration of brown dwarfswithin an evolving protostellar disc.
The question arises as to what effect a correction for inclinationwould have on the observed distribution. The simplest (crudest)correction is to scale masses up by a factor of 1/〈sin i〉. This doesnot alter the form of the distribution, nor in this case the total
MNRAS 453, 1439–1457 (2015)
at Universidad de C
hile on Novem
ber 26, 2015http://m
nras.oxfordjournals.org/D
ownloaded from

Spectroscopic binaries from the AAPS 1455
Figure 9. Metallicity–mass distribution. Filled circles correspond to ex-oplanets with 1.5 MJ < M < 5.0 MJ, discovered using the RV technique,open triangles correspond to binary stars from Halbwachs, Mayor & Udry(2012) and Duquennoy & Mayor (1991), filled triangles show our AAPScandidates, and open circles show the distribution for doubles reported byTokovinin (2014). The metallicities were obtained from Casagrande et al.(2011). The horizontal and vertical lines mark the approximate planet–brown dwarf boundary and the extreme lower tail of the Tokovinin binarydistribution, respectively. The cross-hairs mark the sample medians for theplanets, AAPS candidates, and the Tokovinin (2014) binaries, increasing inmass, respectively.
number of objects that can be regarded as brown dwarf candidates– just those objects out of the survey that can be regarded as such.Clearly, a knowledge of the precise form of the mass distributionfor this (or any) RV survey is precluded until inclinations can bedetermined accurately via sub-milliarcsecond astrometric surveyssuch as GAIA (Sozzetti et al. 2001) and SIM (Sozzetti et al. 2002),though it would take a remarkable confluence of inclinations for theobjects uncovered by the AAPS to alter the underlying distributionof masses. Indeed, recent attempts have been made to recover the‘true’ mass distribution (Lopez & Jenkins 2012), with very few ofthe sub-10 MJ objects moving above this mass limit.
3.6 Metallicity–mass distribution
One of the most interesting features to emerge from the early studyof exoplanets is the dependence of gas giants to be found orbit-ing stars with supersolar metallicities (Gonzalez 1997; Fischer &Valenti 2005; Sousa et al. 2011). This result is a key prediction ofthe core accretion scenario for planet formation (Ida & Lin 2004;Mordasini et al. 2012). However, it seems that this bias towards themost metal-rich stars is only found for gas giants and not lowermass rocky planets (Udry et al. 2007; Buchhave et al. 2012; Jenkinset al. 2013a). Therefore, given there is a clear mass dependence asa function of metallicity, it is interesting to test what the metallic-ity distribution looks like for binaries drawn from a representativesample.
In Fig. 9 we show the distribution in the metallicity–mass plane ofplanets, brown dwarfs, and stellar binaries that have been detectedmostly by the RV method, with a large clutch of the stellar binariesbeing drawn from the sample of F, G, and K stars from Tokovinin(2014). The iron abundances used in this plot were taken fromhigh-resolution spectral analysis where possible, generally from
Figure 10. The metallicity distribution of exoplanet (upper panel) and bi-nary (lower panel) companions. The best-fitting model distributions are alsoshown in the plots, where a power law is used for the exoplanet sample, anda linear function is used to model the binary distribution.
the published papers for the detected exoplanets, with the Tokovinin(2014) primary star metallicities being drawn from Casagrande et al.(2011). The giant planet metallicity bias discussed above is evidenthere, where the sample mean cross-hairs are clearly offset fromthe sample means at higher masses (i.e. above the horizontal dot–dashed line). The brown dwarf and stellar binaries have mean valuesin good agreement with each other, both with sub-solar values,in comparison to the exoplanet primary mean distribution that issignificantly above the solar value.
In Fig. 10 we show the distribution of exoplanets and binaries asa function of primary star metallicity. We used the large sample ofFischer & Valenti (2005) for the exoplanet distribution and againthe Tokovinin (2014) sample for the binary population. The biasesin both of these samples are discussed in each of the works, yet theyare large enough and have been examined well enough that they canbe thought of as good representations of their respective field pop-ulations. The full Tokovinin (2014) sample was not included sincewe wanted to maintain metallicity homogeneity and also we aimedfor a direct overlap in orbital separation with the exoplanet sample,meaning we only included binary companions with orbital periodsout to 4 years. For metallicity homogeneity, we cross-matched thesub-4 year sample with the Casagrande et al. (2011) catalogue ofmetallicities, leaving a total of 874 binaries or multiple stars, out ofthe complete 3936 sample.
As was shown in Fischer & Valenti (2005), the distribution ofexoplanets follows a power law where the percentage of stars withgiant planets increases as a function of metallicity. After construct-ing a similar histogram of values to that in Fischer & Valenti (2005),we find a power law described by an amplitude of 0.028 ± 0.002and an index of 2.23 ± 0.09, which we represent by the dashed blackcurve in the plot. Beyond around a solar metallicity, the increase inplanet hosting fraction rises steeply, possibly accelerating beyond avalue of +0.2 dex in metallicity (Sousa et al. 2011).
The distribution of binaries on the other hand is extremely flatacross all the metallicity range, within the uncertainties, with thefraction found to be 43 ± 4 per cent, in excellent agreement withRaghavan et al. (2010). The best-fit-weighted linear function isshown in the figure and has values for the gradient (b) and offset
MNRAS 453, 1439–1457 (2015)
at Universidad de C
hile on Novem
ber 26, 2015http://m
nras.oxfordjournals.org/D
ownloaded from

1456 J. S. Jenkins et al.
Figure 11. The cumulative fraction of the binary fraction distribution (solidcurve) and the exoplanet fraction distribution (dashed curve).
(a) of 0.286 ± 0.011 and −0.099 ± 0.044, respectively. Theseparameters are fairly insensitive to different bin widths, therefore,it is clear that the binarity fraction as a function of metallicity issignificantly different to the planetary system fraction.
We investigated if there is any dependence on the binary fractionwith orbital separation by constructing the same distribution on thesample of binaries with orbital periods longer than 4 years, and onthe full sample regardless of orbital period. We found no significantdifferences between the distributions; however, we do note a smalldrop in the fraction of binaries in the metal-poor regime (−0.8≤[Fe/H] ≤ −0.5) for the longer period sample. Although it still agreeswith a flat distribution within the uncertainties, in future it may beworthwhile to revisit this regime with more binaries in these bins tosee if this drop in fraction becomes significant, which would indicatethat there is a dependence of the binary fraction with separation asa function of metallicity.
In Fig. 11 we show the cumulative fraction between the binaryfraction and the exoplanet fraction as a function of metallicity. Theearly rise at low metallicities in the binary fraction is apparent, alongwith the rapid rise at the high-metallicity end for the exoplanet frac-tion. We find that the largest disparity between the two populationsoccurs around 0.15 dex in metallicity, a little over solar metallic-ity, where the planet fraction begins to significantly increase. AKolmogorov–Smirnov test yields a D-statistic of 0.733 here, relat-ing to a probability of the null hypothesis of 2.377× 10⁻² per cent.
Gao et al. (2014) show that the fraction of binaries with orbital pe-riods of less than 1000 d dramatically falls in the metal-rich regimewhen they split their Sloan Digital Sky Survey and LAMOST FGKstar samples up into three different metallicity bins. They find atotal binary fraction of 43 ± 2 per cent, again in excellent agree-ment with what we find here, but they calculate binary fractions of56 ± 5 per cent, 56 ± 3 per cent, and 30 ± 5.7 per cent for metallic-ities ([Fe/H]) of <−1.1, −1.1 to <−0.6, and ≥−0.6, respectively,indicating a drop in the fraction of binaries in the most metal-richregion. Although this is an indication of a higher fraction of bina-ries near our metallicity lower limit, within the uncertainties thedistribution is still flat (similar to the result reported in Raghavanet al. 2010). Therefore, we cannot confirm if such a binary fractionchange exists, a change that is also recovered by some models (e.g.Machida et al. 2009).
Bate (2014) studied the effects of changes of the metallicity ontheir star formation models, assuming the dust opacity scales lin-early with metallicity across a range of metallicities from 1/3rd solarto three times solar metallicity. He finds no significant changes inthe multiplicity fraction with metallicity, suggesting gas opacitydoes not overtly change the large-scale properties of star formationfrom the fragmentation of giant molecular clouds. Furthermore, healso finds no dependence with metallicity on the orbital separationof binaries and higher order multiples, as we find here. Given thatrecent works have shown that the cooling times in protoplanetarydiscs increase as a function of metallicity, meaning suppressionof disc fragmentation in the super metal-rich regime (e.g. Cai et al.2006), we might expect that if FGK star secondaries formed primar-ily through fragmentation of the protoplanetary disc, there wouldbe a strong dependence of the binary fraction with metallicity. Asthis does not appear to be the case, then a flat distribution of binaryfraction with metallicity suggests that these close binaries predom-inantly form through fragmentation of the giant molecular cloudthat also formed the primary star.
3.7 Summary
Our target sample of 178 solar-type stars has revealed that ∼10 percent are spectroscopic binaries. Orbital solutions indicate that twosystems potentially have brown dwarf companions and another twocould have eccentricities that place them in the extreme upper tailof the eccentricity distribution for binaries with periods less than1000 d. The systems with the largest quantity of data points appearto generate the least robust orbital solutions, which could owe tosecondary flux contamination of the template spectra, and hence thenecessity to garner more data to constrain their solutions. When theRV measurement errors are low, yet the Keplerian solutions havelow significance, the most likely scenario is a multiple-star system.HIPPARCOS astrometry was examined in an attempt to constrainour orbital parameters; however, no significant astrometric variationcould be discerned in the positional residuals. The distribution ofcompanion masses was examined for both the binaries and candi-date exoplanets detected by the AAPS. For periods up to 12 yearsthe ‘steep’ planetary and ‘flat’ binary mass distributions mirrorthose seen by other surveys. Over a time-scale equivalent to oneorbital period of Jupiter, upwards of 30 exoplanet detections can beexpected from our original sample of 178 stars. The discovery ofthese 16 AAPS binaries from a sample of solar-type stars selectedto have no resolvable or known SB companions is a reminder thatthe data for even the relatively bright southern stars remain far fromcomplete.
Finally, analysis of the metallicity–mass plane from planetarycompanions all the way up to stellar companions reveals a stark dif-ference in the mean metallicities of these populations, with planetsorbiting stars more metal-rich than stellar companions, in general.The fraction that host these companions as a function of metallic-ity is also different, with the binary fraction being found to be flat(43 ± 4 per cent) in the metallicity range between −1.0 and 0.6 dex.This is in contrast to the fraction of stars hosting giant planetarysystems, which has a very low fraction until around a solar metal-licity, at which point the fraction rises steeply following a powerlaw. The flat binary fraction across this wide range of metallici-ties is in agreement with recent hydrodynamical simulations of starformation through fragmentation of giant molecular clouds. Such aresult suggests that this is the dominant formation mechanism forFGK-type binaries and not fragmentation of the protoplanetary discthat was left over from the formation of the primary star.
MNRAS 453, 1439–1457 (2015)
at Universidad de C
hile on Novem
ber 26, 2015http://m
nras.oxfordjournals.org/D
ownloaded from

Spectroscopic binaries from the AAPS 1457
AC K N OW L E D G E M E N T S
We acknowledge funding by CATA-Basal grant (PB06, Coni-cyt), from Fondecyt through grant 3110004, and partial sup-port from Centro de Astrofısica FONDAP 15010003, theGEMINI-CONICYT FUND and from the Comite Mixto ESO-GOBIERNO DE CHILE. (JSJ). We thank the support of CONICYT-PFCHA/Doctorado Nacional-Chile (MD). We further acknowledgeAustralian governmental support of the Anglo-Australian Telescopeas part of the Department of Industry and Science (CGT, BC) andNSF grant AST-9988087 (RPB). We also thank David Soderblomfor granting the use of Ca II H&K spectra taken at CTIO. Thisresearch has made use of the SIMBAD data base, operated at CDS,Strasbourg, France.
R E F E R E N C E S
Abt H. A., Gomez A. E., Levy S. G., 1990, ApJS, 74, 551Anglada-Escude G. et al., 2014, MNRAS, 443, 89Armitage P. J., Bonnell I. A., 2002, MNRAS, 330, L11Aumann H. H., Probst R. G., 1991, ApJ, 368, 264Baraffe I., Chabrier G., Allard F., Hauschildt P. H., 1998, A&A, 337, 403Baranne A. et al., 1996, A&A, 119, 373Bate M., 2014, MNRAS, 442, 285Bond J. C., Tinney C. G., Butler R. P., Jones H. R. A., Marcy G. W., Penny
A. J., Carter B. D., 2006, MNRAS, 370, 163Bouchy F., Pepe F., Queloz D., 2001, A&A, 374, 733Buchhave L. A. et al., 2012, Nature, 486, 375Butler R. P., Marcy G. W., Williams E., McCarthy C., Dosanjh P., Vogt S. S.,
1996, PASP, 108, 500Butler R. P., Tinney C. G., Marcy G. W., Jones H. R. A., Penny A. J., Apps
K., 2001, ApJ, 555, 410Cai K., Durisen R. H., Michael S., Boley A. C., Mejıa A. C., Pickett M. K.,
D’Alessio P., 2006, ApJ, 636, 149Casagrande L., Schonrich R., Asplund M., Cassisi S., Ramırez I., Melendez
J., Bensby T., Feltzing S., 2011, A&A, 530, 138Decin G., Dominik C., Malfait K., Mayor M., Waelkens C., 2000, A&A,
357, 533Dommanget J., Nys O., 1994, Commun. Obser. R. Belg., 115, 1Dupuy T. J., Liu M. C., Ireland M. J., 2009, ApJ, 692, 729Duquennoy A., Mayor M., 1991, A&A, 248, 485Eggl S., Pilat-Lohinger E., Funk B., Georgakarakos N., Haghighipour N.,
2013, MNRAS, 428, 3104Evans D. S., 1964, R. Greenwich Obser. Bull., 85, 207Evans D. S., Menzies A., Stoy R. H., 1957, MNRAS, 117, 534Fischer D. A., Marcy G. W., 1992, ApJ, 396, 178Fischer D. A., Valenti J., 2005, ApJ, 622, 1102Gao S., Liu C., Zhang X., Justham S., Deng L., Yang M., 2014, ApJ, 788,
37Gonzalez G., 1997, MNRAS, 285, 403Gray R. O., Corbally C. J., Garrison R. F., McFadden M. T., Bubar E. J.,
McGahee C. E., O’Donoghue A. A., Knox E. R., 2006, AJ, 132, 161GHalbwachs J. L., Arenou F., Mayor M., Udry S., Queloz D., 2000, A&A,
355, 581Halbwachs J. L., Mayor M., Udry S., 2003, MNRAS, 422, 14Henry T. J., Soderblom D. R., Donahue R. A., Baliunas S. L., 1996, AJ,
111, 439Horne J. H., Baliunas S. L., 1986, ApJ, 302, 757Houk N., 1978, Michigan Catalogue of Two-dimensional Spectral Types for
the HD Stars, Volume 2. Department of Astronomy, Univ. Michigan,Ann Arbor, MI
Houk N., 1982, Michigan Catalogue of Two-dimensional Spectral Types forthe HD Stars, Volume 3. Department of Astronomy, Univ. Michigan,Ann Arbor, MI
Houk N., Cowley A. P., 1975, Michigan Catalogue of Two-dimensionalSpectral Types for the HD Stars, Volume 1. Department of Astronomy,Univ. Michigan, Ann Arbor, MI
Houk N., Smith-Moore M., 1988, Michigan Catalogue of Two-dimensionalSpectral Types for the HD Stars, Volume 4. Department of Astronomy,Univ. Michigan, Ann Arbor, MI
Ida S., Lin D. N. C., 2004, ApJ, 616, 567Jenkins J. S., Tuomi M., 2014, ApJ, 794, 110Jenkins J. S. et al., 2006, MNRAS, 372, 163Jenkins J. S., Jones H. R. A., Pavlenko Y., Pinfield D. J., Barnes J. R.,
Lyubchik Y., 2008, A&A, 485, 571Jenkins J. S. et al., 2009, MNRAS, 398, 911Jenkins J. S. et al., 2010, MNRAS, 372, 163Jenkins J. S. et al., 2011, A&A, 531, 8Jenkins J. S. et al., 2013a, ApJ, 766, 67Jenkins J. S., Tuomi M., Brasser R., Ivanyuk O., Murgas F., 2013b, ApJ,
771, 41Jones H. R. A., Paul Butler R., Tinney C. G., Marcy G. W., Penny A. J.,
McCarthy C., Carter B. D., Pourbaix D., 2002a, MNRAS, 333, 871Jones H. R. A., Paul Butler R., Marcy G. W., Tinney C. G., Penny A. J.,
McCarthy C., Carter B. D., 2002b, MNRAS, 337, 1170Liu M. C., Leggett S. K., Chiu K., 2007, ApJ, 660, 1507Lo Curto G. et al., 2010, A&A, 512, A48Lomb N. R., 1976, Ap&SS, 39, 447Lopez S., Jenkins J. S., 2012, ApJ, 756, 177Lovis C., Pepe F., 2007, A&A, 468, 1115McCarthy C., 1995, M.S. thesis, San Francisco State Univ.McCarthy C., 2001, PhD thesis, Univ. California Los AngelesMachida M. N., Omukai K., Matsumoto T, Inutsuka I., 2009, MNRAS, 399,
1255Mamajek E. E., Hillenbrand L. A., 2008, ApJ, 687, 1264Marcy G. W., Butler R. P., 2000, PASP, 112, 137Mason B. D., Gies D. R., Hartkopf W. I., Bagnuolo W. G., Brummelaar
T. T., McAlister H. A., 1998, AJ, 115, 821Mordasini C., Alibert Y., Benz W., Klahr H., Henning T., 2012, A&A, 541,
97Nidever D. L., Marcy G. W., Butler R. P., Fischer D. A., Vogt S. S., 2002,
ApJS, 141, 503O’Toole S. J., Tinney C. G., Jones H. R. A., Butler R. P., Marcy G. W.,
Carter B., Bailey J., 2009, MNRAS, 392, 641Oudmaijer R. D., van der Veen W. E. C. J., Waters L. B. F. M., Trams N. R.,
Waelkens C., Engelsman E., 1992, A&AS, 96, 625Pepe F., Mayor M., Galland F., Naef D., Queloz D., Santos N. C., Udry S.,
Burnet M., 2002, A&A, 388, 632Perrin M.-N., Cayrel de Strobel G., Dennefeld M., 1988, A&A, 191, 237Preibisch T., Balega Y., Hofmann K., Weigelt G., Zinnecker H., 1999, New
Astron., 4, 531Raghavan D. et al., 1999, ApJS, 190, 1Rousset G. et al., 2003, SPIE, 4839, 140Scargle J. D., 1982, ApJ, 263, 835Soderblom D. R., Duncan D. K., Johnson D. R. H., 1991, ApJ, 375, 722Sousa S., Santos N. C., Israelian G., Mayor M., Udry S., 2011, A&A, 533,
141Sozzetti A., Casertano S., Lattanzi M. G., Spagna A., 2001, A&A, 373, L21Sozzetti A., Casertano S., Brown R. A., Lattanzi M. G., 2002, PASP, 114,
1173Tinney C. G., McCarthy C., Jones H. R. A., Butler R. P., Carter B. D., Marcy
G. W., Penny A. J., 2001, MNRAS, 332, 759Tokovinin A., 2014, AJ, 147, 86Torres C. A. O., Quast G. R., Da Silva L., De La Reza R., Melo C. H. F.,
Sterzik M., 2006, A&A, 460, 695Udry S. et al., 2007, A&A, 469, L43van Leeuwen F., 2007, A&A, 474, 653Vogt S. S., Butler R. P., Rivera E. J., Highighipour N., Henry G. W.,
Williamson M. H., 2010, ApJ, 723, 954Wittenmyer R. A. et al., 2014, ApJ, 791, 114Yi S., Demarque P., Kim Y., Lee Y., Ree C. H., Lejeune T., Barnes S., 2001,
ApJS, 136, 417
This paper has been typeset from a TEX/LATEX file prepared by the author.
MNRAS 453, 1439–1457 (2015)
at Universidad de C
hile on Novem
ber 26, 2015http://m
nras.oxfordjournals.org/D
ownloaded from