The OASIS Leadership Forum - Fazzi Associates · The OASIS Leadership Forum February 28 –March 2,...
53
The OASIS Leadership Forum The OASIS Leadership Forum February 28 – March 2, 2011 San Antonio, Texas
Transcript of The OASIS Leadership Forum - Fazzi Associates · The OASIS Leadership Forum February 28 –March 2,...
The OASIS Leadership ForumThe OASIS Leadership Forum
February 28 – March 2, 2011San Antonio, Texas

©2011
The Management of Flow
Scenario Analysis of Problems That Emerge Each Day of the Process
Directed by:
Kay Wright
©2011
• Referral source satisfaction
• Patient care issues
• Patient satisfaction issues
• Marketing department frustrations
• Role clarifications
©2011
• Patient satisfaction
• Scheduling issues
• Patient error� Reporting
• Inappropriate use of Per Diem
• Do nurses work only until 3:00 PM?
• Productivity

©2011
• Late paperwork
• Accountability
• Cash flow
©2011
• Accountability
• OASIS done in the home to assure accuracy
• Communication
• Interdisciplinary coordination
• Role clarification
©2011
• Patient care
• Patient satisfaction
• Accountability
©2011
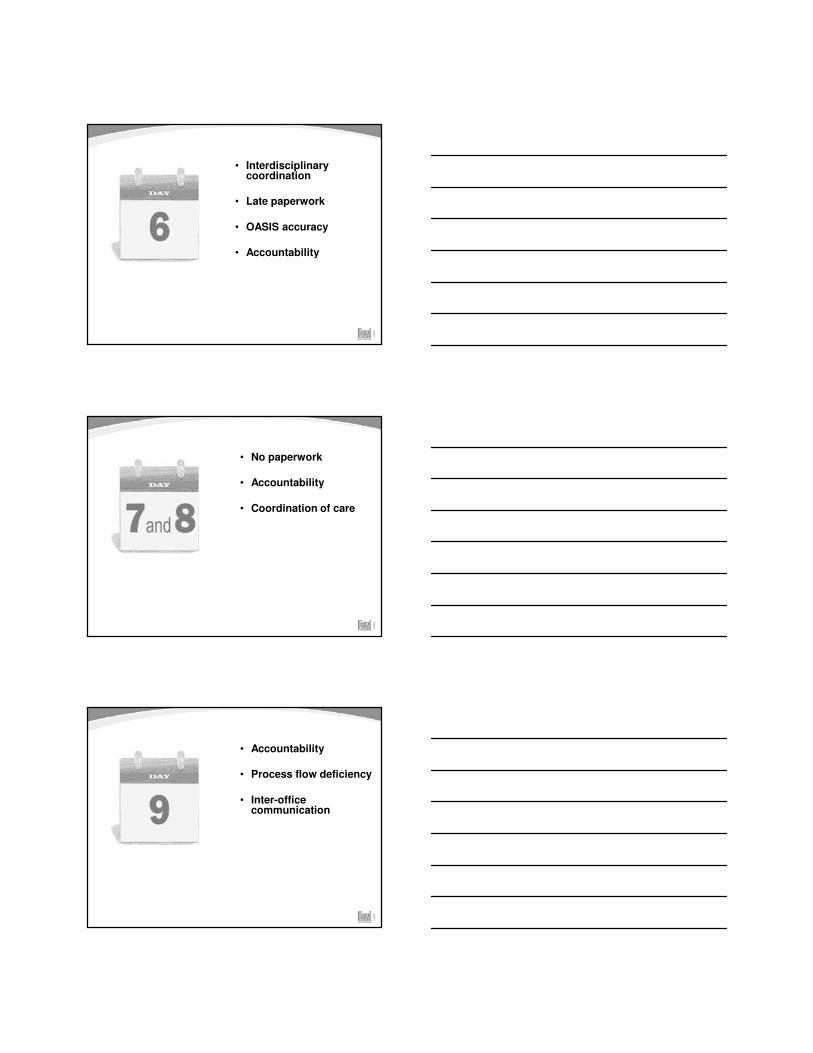
• Interdisciplinary coordination
• Late paperwork
• OASIS accuracy
• Accountability
©2011
• No paperwork
• Accountability
• Coordination of care
©2011
• Accountability
• Process flow deficiency
• Inter-office communication

©2011
• Role clarification
• Who is accountable?
• Assessment done in the home
• Coordination between disciplines
• Compromises we make
©2011
• Accountability
• Interpersonal relations
• Processes
• Education
• OASIS outcomes
©2011
• Corrections not back
• Accountability

©2011
M Item Nurse Therapist
1610 0 1
1820 1 0
1830 1 2
1860 2 3
1242 1 --
1400 -- 2
Difference in OASIS Scoring by Nurse and Therapist
©2011
• Coordination of care
• OASIS outcomes
• Accountability
• Corrections complete
©2011
• Backlogs
• Processes
• Outcomes
• Accountability

©2011
• Processes
• Accountability
• Outcomes
©2011
• Accountability
• Cash Flow
• Processes
©2011
• Processes
• Accountability
• Role clarification
• Lost revenue
• Cash Flow
©2011
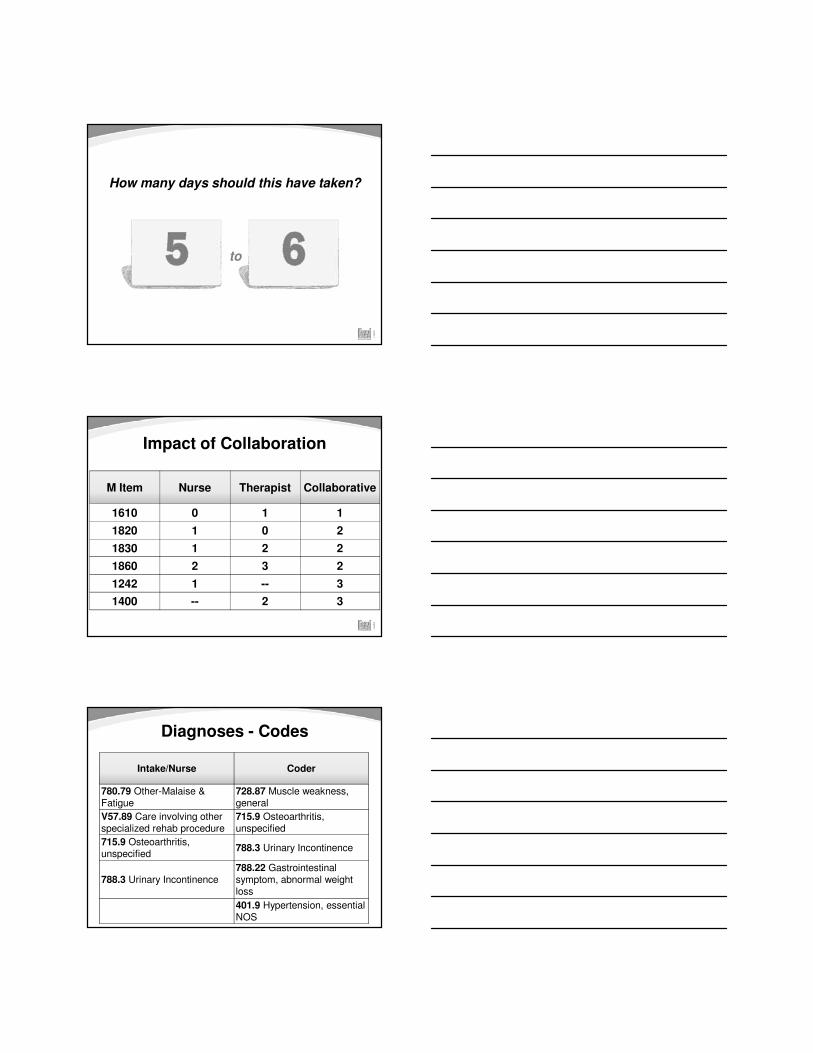
How many days should this have taken?
to
©2011
Impact of Collaboration
M Item Nurse Therapist Collaborative
1610 0 1 1
1820 1 0 2
1830 1 2 2
1860 2 3 2
1242 1 -- 3
1400 -- 2 3
©2011
Intake/Nurse Coder
780.79 Other-Malaise & Fatigue
728.87 Muscle weakness, general
V57.89 Care involving other specialized rehab procedure
715.9 Osteoarthritis, unspecified
715.9 Osteoarthritis, unspecified
788.3 Urinary Incontinence
788.3 Urinary Incontinence788.22 Gastrointestinal symptom, abnormal weight loss
401.9 Hypertension, essential NOS
Diagnoses - Codes

©2011
Changes in M Items Only
PPS Payment Data
1st ResponseCollaborative
Response
Case Mix Weight 0.85 1.17
HHRG C1F1S2 C2F3S2
PPS Estimated Payment
$2,313.55 $3,186.79
100 SOC: $87,324Note: These are hypothetical numbers only.
©2011
Changes in M Items and Coding,
No Change in Therapy
PPS Payment Data
1st ResponseCollaborative
Response
Case Mix Weight 0.85 1.34
HHRG C1F1S2 C3F3S2
PPS Estimated Payment
$2,313.55 $3,639.76
100 SOC: $132,621Note: These are hypothetical numbers only.
©2011
Changes in M Items, plus 2 Therapy Visits,
No Change in Coding
PPS Payment Data
1st ResponseCollaborative
Response
Case Mix Weight 0.85 1.38
HHRG C1F1S2 C2F3S3
PPS Estimated Payment
$2,313.55 $3,752.19
100 SOC: $143,900Note: These are hypothetical numbers only.

©2011
Changes in M Items, plus 2 Therapy Visits,
Plus Diagnoses Selection and Coding
PPS Payment Data
1st ResponseCollaborative
Response
Case Mix Weight 0.85 1.55
HHRG C1F1S2 C3F3S3
PPS Estimated Payment
$2,313.55 $4,205.16
100 SOC: $189,200Note: These are hypothetical numbers only.

An Insider’s View of OASIS
Angela A. Richard, MS, RNUniversity of Colorado
©2011
University of Colorado

Context
� In mid 1900’s, interest in assessing quality of care began; conceptual approaches were developed (Donabedian)
� Increased costs led payers to question how to evaluate the quality of the services they were purchasing
� Consumers (patients, etc.) began to request quality information for use in decision making
� As a result, measurement of performance data, including outcomes as a way to assess quality of care is now required to some extent for most care settings
Early OASIS Development and Testing
� OASIS was created as a method for reporting patient level outcomes for the purpose of QI
� OASIS is intended to measure outcomes of home health care regardless of the specific disciplines involved
� Many experts including therapists were involved in development and many rounds of testing
� Started with hundreds of data items!
� Items not used to measure outcomes were used for risk adjustment
OASIS History
� Implemented in 1999 for Medicare and Medicaid patients
� Original purpose was for agency quality improvement purposes
� Over the years, OASIS has come to be used for other purposes including payment (PPS), consumer reporting (HH Compare) and to aid in surveyor pre-survey prep
� Revised multiple times

OASIS-C
� Addressed industry concerns where possible on specific questions
� Expanded domains of quality that can be measured to include timeliness and process
� Harmonized several items with other care setting measures
� Eliminated items not used for outcome measurement and risk adjustment
Keep in Mind…
It is important to understand that OASIS was designed for assessing outcomes (and now
processes of care) in the aggregate
The Future of OASIS
� Continued evolution
� Ongoing emphasis on harmonization across care settings (CARE, etc.)
� Potential role in new payment systems
– Quality-based purchasing

Recommendation of Challenges and Recommendation of Challenges and Issues to Address by Members of the
2011 OASIS Leadership Forum

©2011
Management of Coding
1. How to ensure that there is enough information provided to Coders? (44)
2. How to improve clinician collaboration and communication? (39)
3. How to identify and improve accuracy of co-morbidity? (32)
4. How to ensure sufficient skill level of Coders? (31)
©2011
Management of OASIS Integrity
1. How to get buy-in from everyone? (77)
2. How to ensure accountability on all levels? (67)
3. How to ensure that staff do the actual documentation in the home? (50)
4. How to ensure effective interdisciplinary communication? (44)
©2011
Management of Rehab Services
1. How to ensure new regulations and documentation requires our out to staff by April 1. (61)
2. How to balance patient need with scheduling and availability. (46)
3. How to have the “team” own the OASIS assessment. (34)
4. How to reduce or eliminate assessment differences between nurse and therapist. (28)

©2011
Management of the Review Process
1. How to timeliness of documentation. (113)
2. How to establish and maintain staff competency. (91)
3. How to develop strategies and tactics for clinical manager effectiveness. (55)
4. How to motivate clinical staff. (24)

Analyzing Your Key Analyzing Your Key Performance Measures

Quality and Financial Matrix
©2011
• Home Health Compare
• Hospitalization Rate
• Home Health Process Measures
• Patient Satisfactions Measures
Quality Performance Measures ©2011
81%
82%
85%
85%
89%
Likelihood of
Recommending
Specific Care Issues
Communications Btwn
Providers and Patients
Overall Rating of Care
Care of Patients
Fazzi National Database
HHCAHPS: Initial Results

©2011
• Medicare Profit Margin: 11.61%
• CMW RAP: 1.25
• CMW Settled: 1.20
• Average Total Visits/Episode: 16
• LUPA Episodes: 12%
Key Financial Performance Measures
©2011
• Nursing Cost/Visit: $156
• PT Cost/Visit: $141
• Nursing Visits/Day: 4.2 billable
• PT Visits/Day: 5 billable
• Time in Home for SOC: 90 min
Key Financial Performance Measures

The “Lean Method” Approach to Performance Improvement
©2011
Tim Ashe, RN, MS, MBA

©2011
Your Operating Model
• The way work is done from Referral to Billing and Collections.
• Structure - Roles and Responsibilities.
• Measures of Success.
• Process Metrics – control.
• Standardization.
©2011
Culture eats everything else!
©2011
How have you done it?

©2011
What are we trying to do?
• Provide great care?
• Produce financial results that allow us to invest in our staff, infrastructure, mission?
• Grow market share?
• Develop our staff?
• Achieve great patient satisfaction?
• All the above?
©2011
Why Lean Thinking and Lean Process Engineering?
• The heart of how an organization produces great results.
• Financial pressure.
• Quality pressure.
• Strategic position.
• Competitive differentiation.
©2011
Our workflows are efficient…Really?
In 1996 we lost Mrs. Jones….

©2011
Lean Programs Were Developed From TPS (Toyota Production System)
Order Cash
(Reduce by removing non-value-added wastes)
Simple, very clear focus
“All we are doing is looking at the time line; from the moment the customer gives us an order to the point when we collect cash. And we are reducing that time line by removing the non-value-added wastes.” Taiichi Ohno
©2011
There is nothing so useless as doing efficiently that which should
not be done at all.
~Peter F. Drucker
©2011
Lean Methodology
A + B + C = D
A + B = D

©2011
Well, clearly Technology is the solution…right?
©2011
The first rule of any technology used in a business is that
automation applied to an efficient operation will magnify the
efficiency. The second is that automation applied to an inefficient
operation will magnify the inefficiency.
~Bill Gates
©2011
Lean Methodology
• A lean program is a way of thinking.
• Lean is a way of doing more with less. Less human effort, less equipment, less material, less time, and less space.
• Lean Programs strive to provide customers with exactly what they want, when they want it.
• At the heart of Lean Programs are flexible, motivated, invested team.
• Visual Management and Measurement.

©2011
The House of Lean Methods
GoalCustomer Focus
Highest quality, lowest cost, shortest lead time
by continually eliminating muda
Just-in-time Jidoka
Involvement
Flexible, motivated team
members continually
seeking a better way
Standardization
Stability
©2011
Jidoka
• Intelligent workers identifying errors and taking quick counter measures.
• Defect free processes by continually strengthening:
• Process capability
• Defects are quickly identified and contained in the area
• Feedback, so quick countermeasures can be taken
©2011
Maintaining Flow
• To deliver just what patients need when they need it, everything must flow.
• Whether it is the:
• Flow of Information…
• Flow of Product…
• Flow of People…
• All things must work together to create satisfied and loyal customers.
©2011
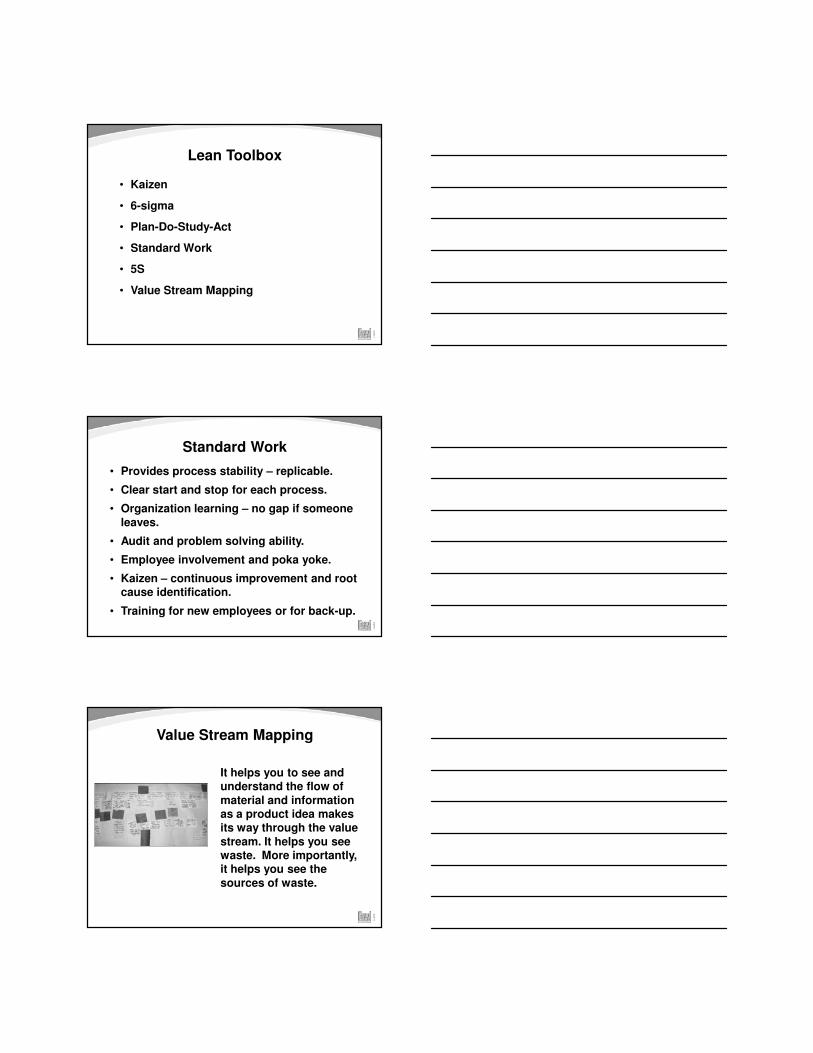
Lean Toolbox
• Kaizen
• 6-sigma
• Plan-Do-Study-Act
• Standard Work
• 5S
• Value Stream Mapping
©2011
Standard Work
• Provides process stability – replicable.
• Clear start and stop for each process.
• Organization learning – no gap if someone leaves.
• Audit and problem solving ability.
• Employee involvement and poka yoke.
• Kaizen – continuous improvement and root cause identification.
• Training for new employees or for back-up.
©2011
Value Stream Mapping
It helps you to see and understand the flow of material and informationas a product idea makes its way through the value stream. It helps you see waste. More importantly, it helps you see the sources of waste.
©2011
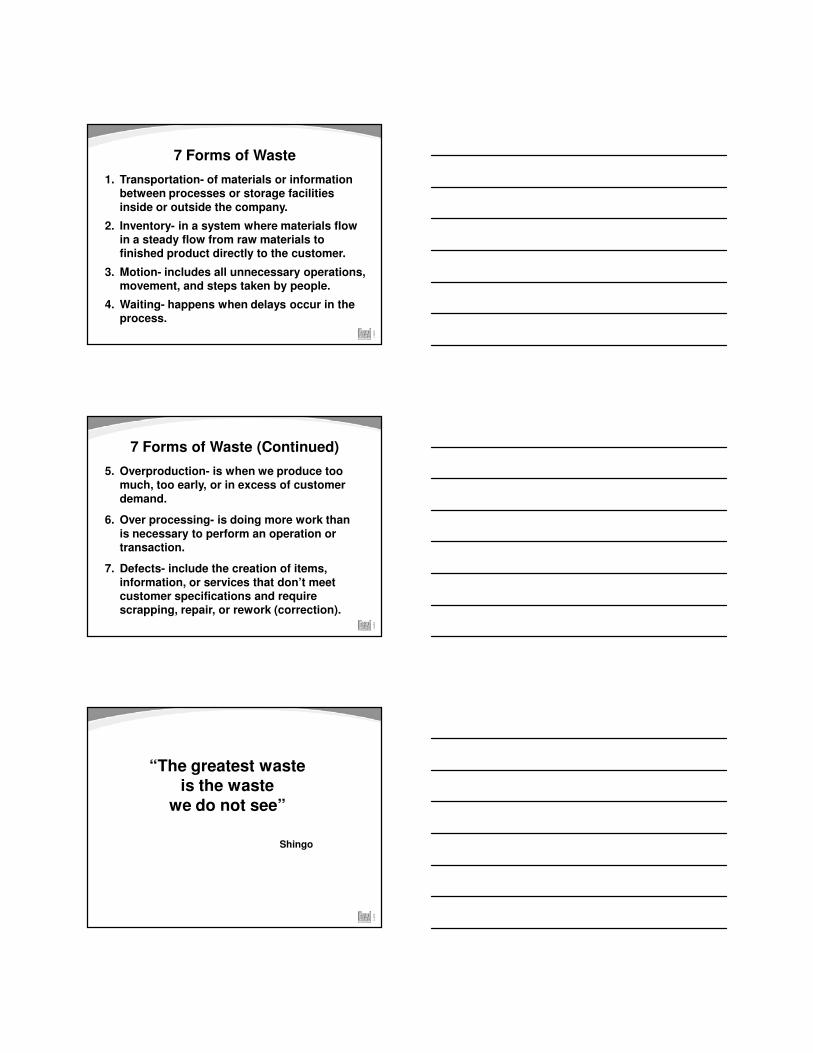
7 Forms of Waste
1. Transportation- of materials or information between processes or storage facilities inside or outside the company.
2. Inventory- in a system where materials flow in a steady flow from raw materials to finished product directly to the customer.
3. Motion- includes all unnecessary operations, movement, and steps taken by people.
4. Waiting- happens when delays occur in the process.
©2011
7 Forms of Waste (Continued)
5. Overproduction- is when we produce too much, too early, or in excess of customer demand.
6. Over processing- is doing more work than is necessary to perform an operation or transaction.
7. Defects- include the creation of items, information, or services that don’t meet customer specifications and require scrapping, repair, or rework (correction).
©2011
“The greatest waste is the waste
we do not see”
Shingo

©2011
Kaizen WorkshopsKaizen (KI-zen)
“Kai” to take apart, “Zen” to improve so as to help others
Kaizen
PlanCounter-measures
RealityCheck
MakeChanges
Celebrate!
MeasureResults
Make Thisthe Standard
DocumentReality
VerifyChange
Start here
Identify Waste
Do It Again
©2011
How to conduct a Lean Project
1. Obtain Management Sponsorship
2. Define the scope and scale of the
project
3. Define the Project Team
4. Do the work!
©2011
Management Sponsorship for the Kaizen
• Preparing:
• Allocating the time and resources for training
• Establishing precise project scope, scale, targets
• Providing clear incentives for team’s success
• Executing:
• Constantly communicating with the team and monitoring progress
• Maintaining flexibility as the team learns more
• Removing roadblocks and allocating funds
• Following up:
• Staying engaged throughout the process
©2011
Project Team Selection and Training
• Team Selection:
• Involve representative employees from the department with at least one person from each functional area
• Maximum 12 people
• Bring in a pair of “Outside Eyes”
• Facilitator(s)
• Team Leader – focused and influential
• Team Training:
• Lean principles
• Understanding how to use the Project Profile and Target Sheet
©2011
Lean Process Project Agenda
• Understand the current state Value Stream:
• Gemba (go to where the work is)
• Identify waste and areas of opportunity
• Try-storm ideas to address waste:
• Break and “go to work”
• Regroup and report back on how things went
• Try-storm new ideas if initial ideas didn’t work, or if more is learned
• Document Future State Value Stream
©2011
Role of Lean Facilitator
• Fostering trust.
• Gemba:
• Outside eyes extreme
• Ask the 5 whys
• Driving team success:
• Monitoring and tracking progress
• Managing team meetings
• Managing “fear”

©2011
GembaGo to where the work is
“The place where something is done”
• Go to the place where the work is done and observe to understand the process and issues.
• Develop “Eyes for Waste”
• Understand the production, materials, and information flow.
• Comprehension!!!
• What is really happening? Why?
©2011
A real world example
• Event Description.
• Value Stream Mapping - Current State.
• Value Stream Mapping - Future State.
• Try-storming.
• Progress towards targets.
©2011
Event Description
Improve Referral to Admission Process and eliminate non-value-added work.

©2011
Preliminary Objectives
• $150K cost reduction.
• Appropriate use of resources – match skill set to the task.
• Reduce the cycle time of data transfer (minimize walking distance).
• Right equipment for the staff.
• Real time access to vital information.
©2011
Value Stream Mapping
Current State
©2011
Pilot Future State Ideas
• Trials:
• Clerical Person addition in hospital setting
• Wireless trial
• Admission planning consolidation after 5 pm
• Eliminate Access database (duplicate to McKesson):
• Worked with McKesson to get reports (removed)
©2011
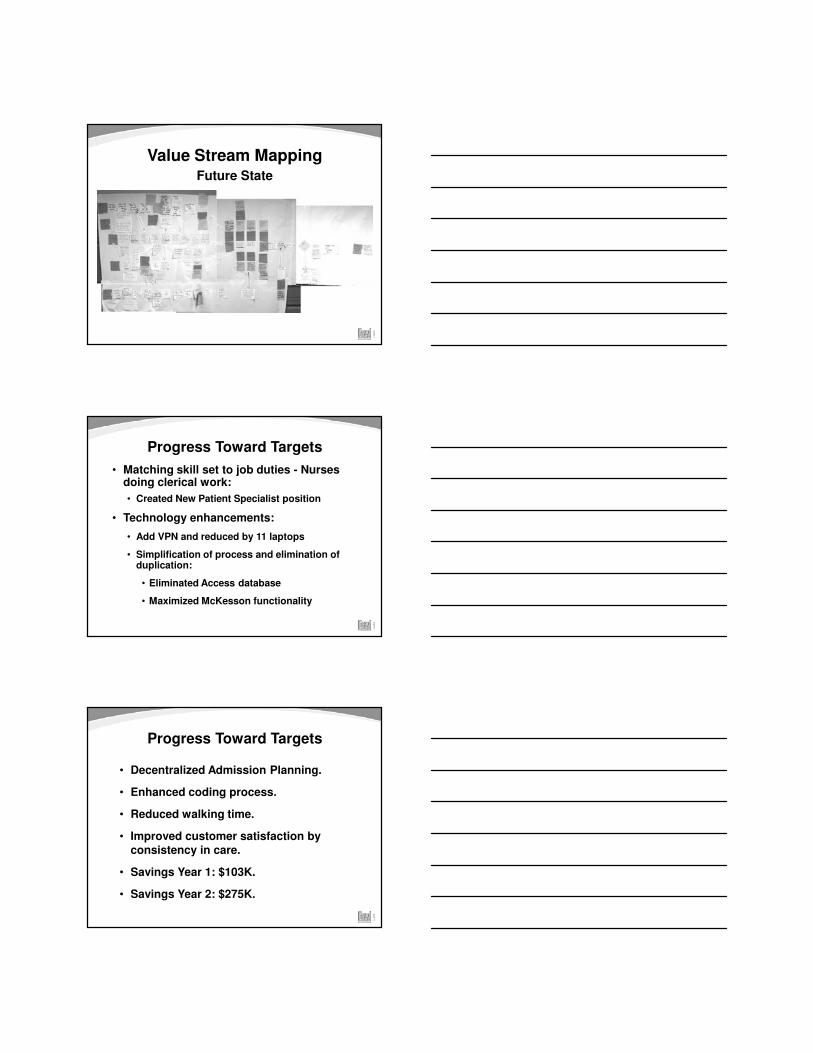
Value Stream MappingFuture State
©2011
Progress Toward Targets
• Matching skill set to job duties - Nurses doing clerical work:
• Created New Patient Specialist position
• Technology enhancements:
• Add VPN and reduced by 11 laptops
• Simplification of process and elimination of duplication:
• Eliminated Access database
• Maximized McKesson functionality
©2011
Progress Toward Targets
• Decentralized Admission Planning.
• Enhanced coding process.
• Reduced walking time.
• Improved customer satisfaction by consistency in care.
• Savings Year 1: $103K.
• Savings Year 2: $275K.

©2011
References
• Dennis, Pascal. 2002, Lean Production Simplified: A Plan Language Guide to the World’s Most Powerful Production System, Productivity Press, Portland.
• Ohno, Taiichi. 1978, Toyota Production System Beyond Large-Scale Production, Diamond Inc, Toyko.
• Shingo, Shigeo. 1985, The Sayings of Shigeo Shingo: Key Strategies for Plant Improvement, Productivity Press, Portland.
• Tapping, D, Shuker, T. 2003, Value Stream Management for the Lean Office, Productivity Press, New York.
©2011
Setting the Stage for AccountabilityStart With the Measures of Success
1. Job Expectation Rule: Make sure staff know what they are expected to do. Measures of Success.
2. Skill Development Rule: Make sure staff person is trained and has the skills to succeed.
3. Accountability Rule: Hold staff person accountable for meeting the job expectations you know they can do.
©2011
Seven Goals of Supervision
1. To clarify job expectations, i.e. how success will be measured – Measures of Success.
2. To assess the competency levels of your staff and train them to meet job expectations.
3. To delegate responsibilities to your staff based on their proven competency levels and hold them accountable.
4. To support your staff on the job.
5. To build the confidence of your staff.
6. To increase staff satisfaction and retention.
7. To help your staff grow personally and professionally.

©2011
The Supervisory ProcessClarify Job Expectations
+Provide Training/Skill Development
+Provide Direction and Support
+Hold Staff Accountable
They Come Through
They Don’t Come Through
RewardsPraise
Recognition
Acknowledgement
Greater Authority/Control
ConsequencesReprimand
Tighter Monitoring
Shorten Time Lines
Less Authority/Control
©2011
Outcome Management SystemHow Does the Agency Make Their Goals?
• CEO must be held accountable for achieving the agency’’’’s measurable goals.
• Department leaders must be held accountable for achieving the department’’’’s operational goals that support the organization’’’’s goals.
• Supervisors, managers and staff must have performance or measurable work outcomes that help ensure their department meets their operational goals.

Don’t Let the Challenges and Barriers Get You Down
©2011
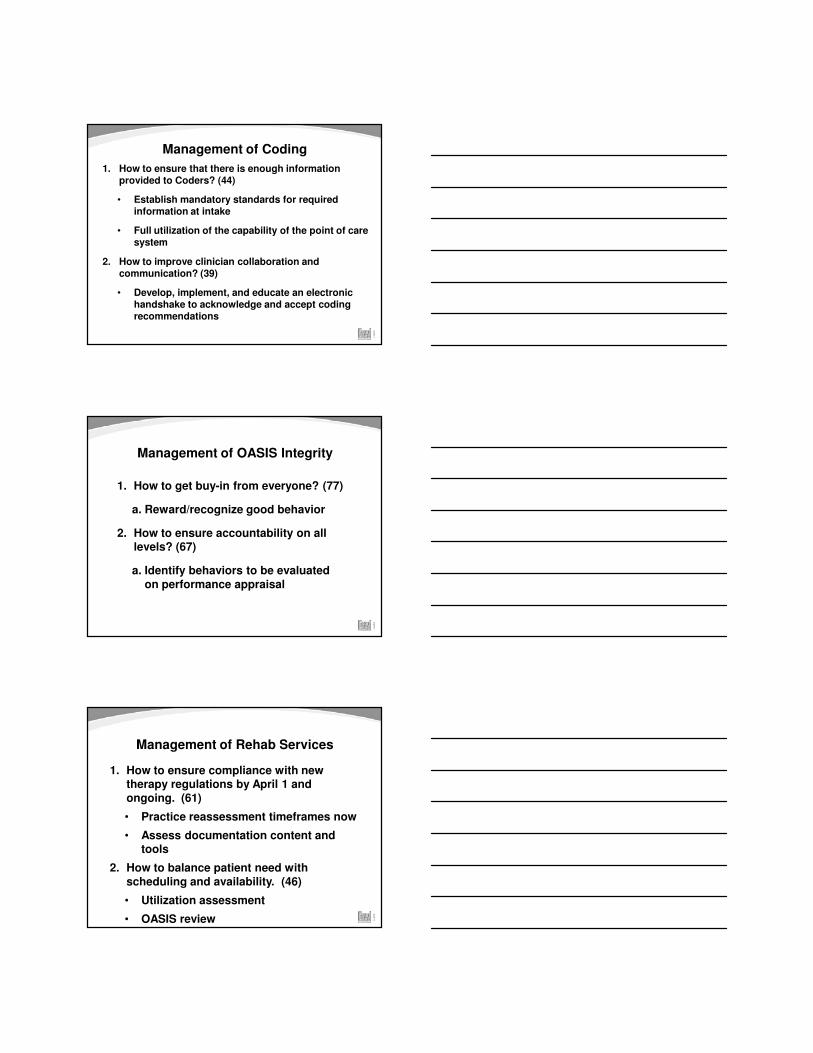
Management of Coding
1. How to ensure that there is enough information provided to Coders? (44)
• Establish mandatory standards for required information at intake
• Full utilization of the capability of the point of care system
2. How to improve clinician collaboration and communication? (39)
• Develop, implement, and educate an electronic handshake to acknowledge and accept coding recommendations
©2011
Management of OASIS Integrity
1. How to get buy-in from everyone? (77)
a. Reward/recognize good behavior
2. How to ensure accountability on all levels? (67)
a. Identify behaviors to be evaluated on performance appraisal
©2011
Management of Rehab Services
1. How to ensure compliance with new therapy regulations by April 1 and ongoing. (61)
• Practice reassessment timeframes now
• Assess documentation content and tools
2. How to balance patient need with scheduling and availability. (46)
• Utilization assessment
• OASIS review

©2011
Management of the Review Process
1. How to improve timeliness of the OASIS flow. (113)
• Ensure the process and expectations are clear and standardized and staff are accountable.
• Ensure that staff conducting OASIS are deemed competent.
2. How to establish and maintain staff competency. (91)
• Establish your OASIS competency using a combination of co-visits and record audits using competency tool & skills testing
• Consistent training and testing
• Receive Referral
• Register Patient
• Verify Insurance
• Obtain Initial Visit
Authorization PRN
• Obtain Referral
from Intake
• Assign Patient by
District
• Complete Admit
Log (in system)
• Notify Other
Disciplines PRN
• Admit Visit within
24 hours
• Complete Admit
and OASIS within
24 hours of Visit
• Log Admission
Paperwork
• Notify Clinical
Manager of Late
Paperwork
• Admission Review
485
• OASIS Review
• Care Manager
• Approves POC
• Visits/Disciplines
• ICD-9 Coding
• Enters OASIS
(PRN) and 485
data, Print 485
• Send RAP from Billing
Community
Referrals
Hospital Referrals
ERRORS
NO ERRORS
• Corrects Errors
Immediately
ClinicianM.R. / Data Entry
Clinical ManagerOASIS Reviewer /
Care Manager ERROR• Review 485 and Signs (in
absence of electronic
signature)
NO ERRORS
M.R.
Intake T.A. Clinical Staff T.A.
• Mail / Fax / Portal 485 to MD
• 485 Document Tracking
Day 1 Day 2
Day 2 Day 3 - 4
Day 5 - 6
Fazzi Associates Recommended Admission Flow
March 2011

Why Won’t They Just DO it?
Strategies for Getting Buy-in for Changes
National Home Care Leaders Forum
San Antonio, TX
March 2, 2011

Your most challenging employee
• Turn to your table members and discuss for 3
minutes, your most challenging
employee...the one that just won’t DO it!
Copyright Amber Mayes Consulting, 2011, All rights reserved.
Don’t let it get you down...
You will walk away with...
• Strategies for engaging resistance and building
energy for change.
• Tangible things YOU can do when you walk out
the door to implement change successfully.
Copyright Amber Mayes Consulting, 2011, All rights reserved.
Moral of the stories...
The answer to
“how can I change them” starts with...
YOU
Copyright Amber Mayes Consulting, 2011, All rights reserved.

ENGAGE
• Explore the root
• Name your own part in the resistance
• Get on the same page
• Ask the resistors for input
• Gather allies by building the case for change
• Energize the system for forward-movement
Copyright Amber Mayes Consulting, 2011, All rights reserved.
Common reasons people resist
• Lack of understanding of the “why” or the
urgency for change
• They don’t like or they disagree with the
change being proposed
• Emotional reaction...fear of how the change
will impact them
• They don’t trust you
Adapted from Beyond the Wall of Resistance. 2011. Rick Maurer.
Copyright Amber Mayes Consulting, 2011, All rights reserved.
Tips: Building the case for change
• Address all levels of resistance – communicate
the why, address the emotional impact, build
trust
• Generate urgency by addressing what people
care about in their current context
• Build the plan or the “how” with stakeholders
• Reinforce and model the importance of the
change positively and consistently
Copyright Amber Mayes Consulting, 2011, All rights reserved.

Questions?
• At your tables, come up with one question you
have about managing resistance or getting
buy-in for change.
• Choose one person who will be ready to ask
the question should your table be selected.
Copyright Amber Mayes Consulting, 2011, All rights reserved.
Remember...Begin with YOU
• Think about that original resistant employee
or your change situation in general...
What is one new thing YOU can do when you
walk out of this room to positively engage
people in the changes you are implementing?
• Share this with one other person at your table.
Copyright Amber Mayes Consulting, 2011, All rights reserved.
Resources
• Maurer, R. 2010. Beyond the Wall of Resistance: Why 70% of Changes Still Fail –
and what you can do about it. Austin: Bard Press. (The most common reference
on managing resistance to change. Recently revised.)
• Lencioni, P. 1995. The Five Dysfunctions of a Team: A Leadership Fable. San
Francisco: Jossey-Bass. (A framework for dealing with the common dysfunctions of
a team written in fable form)
• Covery, S. 2006. The Speed of Trust: The One Thing that Changes Everything. New
York: Free Press. (A great guide to nurturing trust as a leader)
• Tuckman’s Stages of Team Development Model (This is the team development
model I referenced. It has been around and consistently used since the 60’s.
Google references. There are many.)
Please feel free to email me for more information or resources:
Copyright Amber Mayes Consulting, 2011, All rights reserved.

New Realities
Dr. Barbara Balik

New Realities – 1
Patient Centered Medical Homes Accountable Care Organizations
Barbara Balik RN, EdD
March 2, 2011
Barbara Balik [email protected]
• Identify:
– Emerging healthcare system initiatives that will shape home care’s future (or that home care can shape)
– Characteristics of the changes
– Opportunities for Home Care action/Risks of inaction
– What actions to take next
What We Will Accomplish
Barbara Balik [email protected]
New Realities – Key Points
• Co-creation: Patient/family partnerships
• It Takes a Village: Strong, meaningful community partnerships
• Beyond the Usual: Care management for navigation, seamless transitions, and self-management support
• Useful Data: clinical information systems that integrate useful data
Barbara Balik [email protected]

Scenarios for Home Care
• Where:– Medicare FFS is not the model
– Medicaid post-acute model is replaced by patient-centered, chronic care self-management
– Different customers/partners exist
– Therapy based home care visits are replaced by value creating partnerships
– People and their healthcare needs (populations) are described to aid in care delivery, not by site of care
Barbara Balik [email protected]
Triple Aim
• Institute for Healthcare Improvement work – intent:
–Optimize the health system taking into account three dimensions:
• the experience of the individual; the health of a defined population; per capita cost for the population
Barbara Balik [email protected]
Value in Healthcare
Value should always be defined around the customer . . . Value depends on results . . . And is measured by achieving outcomes
What is Value in Health Care?
Michael Porter, PhD
New England Journal of Medicine
363:2477-2481; December 23, 2010
Barbara Balik [email protected]

Patient Centered Medical Home
• NCQA Criteria – see resources– A program to improve primary care
– A PCMH is a health care setting that facilitates partnerships between individual patients, and their personal physicians, and the patient’s family
– Care is facilitated by registries, information technology, health information exchange and other means to assure that patients get the indicated care when and where they need and want it in a culturally and linguistically manner
Barbara Balik [email protected]
Patient Centered Medical Home
• NCQA Criteria – see resources– The criteria intends to give practices information about organizing care around patients, working in teams and coordinating and tracking care over time
– 6 Standards, 27 Elements, 149 Factors
• Enhance Access and Continuity
• Identify and Manage Patient Populations
• Plan and Manage Care
• Provide Self-Care and Community Support
• Track and Coordinate Care
• Measure and Improve Performance
Barbara Balik [email protected]
Accountable Care Organizations
• What would accountable care organizations be accountable for and what would they do differently? Harold Miller
• Payments for outcomes
– Value not volume
• Assumes the ability to understand population and individual needs; to measure, improve, coordinate, and deliver value
• Options:
– To support accountable acute care
– To support accountable medical homes and specialty care
– To support accountable cross-continuum care
Barbara Balik [email protected]

Accountable Care Organizations
• Relationships not structure
• Focus:
– Affecting large numbers
– Evidence of high cost over-use
– Low-cost high-impact interventions
– Effective clinical leaders
• Examples:
– Avoidable rehospitalizations & ED use
– Appropriate use of drugs & diagnostics (e.g. imaging)
Barbara Balik [email protected]
Lessons from the Field
Your learnings
What you can do
Barbara Balik [email protected]
Resources
Center for Healthcare Quality and Payment Reform
http://www.chqpr.org/
How To Create an Accountable Care Organization
http://www.chqpr.org/downloads/HowtoCreateAccountableCareOrganizations.pdf
Transitioning to Accountable Care
http://www.chqpr.org/downloads/TransitioningtoAccountableCare.pdf
Network for Regional Healthcare Improvement
http://www.nrhi.org/
Collaboratives
http://www.nrhi.org/downloads/RegionalHealthImprovementCollaboratives.pdf
Barbara Balik [email protected]

Center for Medical Home Improvementhttp://www.medicalhomeimprovement.org/
NCQA Patient Centered Medical Home http://www.ncqa.org/tabid/631/Default.aspx
Triple Aimhttp://www.ihi.org/IHI/Programs/StrategicInitiatives/TripleAim.htm
Barbara Balik [email protected]
Resources
New Realities – 2
Chronic Care Model
Care Transitions Program Naylor Model
STAAR and Hospitalization Reduction Initiatives
Barbara Balik RN, EdD
March 2, 2011
Barbara Balik [email protected]
Informed,ActivatedPatient
ProductiveInteractions
Prepared,ProactivePractice Team
Improved Outcomes
DeliverySystemDesign
DecisionSupport
ClinicalInformation
Systems
Self-Management
Support
Health System
Resources and Policies
Community
Health Care Organization
Chronic Care Model
E. Wagner; MacColl Institute

Care Transitions Program
• Developed by Dr. Eric Coleman• A self-management model• During a 4-week program, patients with complex care needs receive specific tools, are supported by a Transitions CoachTM, and learn self-management skills to ensure their needs are met during the transition from hospital to home
• Value Proposition:– Reducing rehospitalization helps contain costs for complex patients and improves hospital bed capacity for patients admitted with more favorable DRGs.
– The program is self-sustaining.– The program is consistent with both Medicare Advantage and Medicare fee-for-service financial incentives.
– The program promotes better performance on new JCAHO initiatives aimed at post-hospital care.
Barbara Balik [email protected]
Care Transitions (cont)
• Care Transitions Program Interventions
– Medication self-management
– Use of a dynamic patient-centered record, the Personal Health Record
– Timely primary care/specialty care follow up
– Knowledge of red flags that indicate a worsening in their condition and how to respond
http://www.caretransitions.org
Barbara Balik [email protected]
Naylor Model
Transitional Care Model includes ten essential elements:
1. The Transitional Care Nurse (TCN) as the primary coordinator of care to assure consistency of provider across the entire episode of care
2. In-hospital assessment, preparation, and development of an evidenced-based plan of care
3. Regular home visits by the TCN with available, ongoing telephone support (seven days per week) through an average of two months post-discharge
4. Continuity of medical care between hospital and primary care physicians facilitated by the TCN accompanying patients to first follow-up visits
5. Comprehensive, holistic focus on each patient's needs including the reason for the primary hospitalization as well as other complicating or coexisting events
Barbara Balik [email protected]

Naylor Model (cont)
Transitional Care Model includes ten essential elements:
6. Active engagement of patients and their family and informal caregivers including education and support
7. Emphasis on early identification and response to health care risks and symptoms to achieve longer term positive outcomes and avoid adverse and untoward events that lead to readmissions
8. Multidisciplinary approach that includes the patient, family, informal and formal caregivers are part of a team
9. Physician-nurse collaboration
10. Communication to, between, and among the patient, family and informal caregivers, and health care providers and professionals
Barbara Balik [email protected]
Naylor Model (cont)
Key Components
• Focus on Patient and Caregiver Understanding
• Helping Patients Manage Health Issues and Prevent Decline
• Medication Reconciliation and Management
• Transitional Care, Not Ongoing Case Management
Barbara Balik [email protected]
STAAR
State Action on Avoidable Rehospitalizations
• Institute for Healthcare Improvement
• Funded by the Commonwealth Fund
• Multi-state project to reduce avoidable
• Rehospitalizations focusing on two components:
– A multi-state learning community to improve transitions of care; and
– Targeted technical assistance to address systemic barriers to reducing avoidable re-hospitalizations
Barbara Balik [email protected]
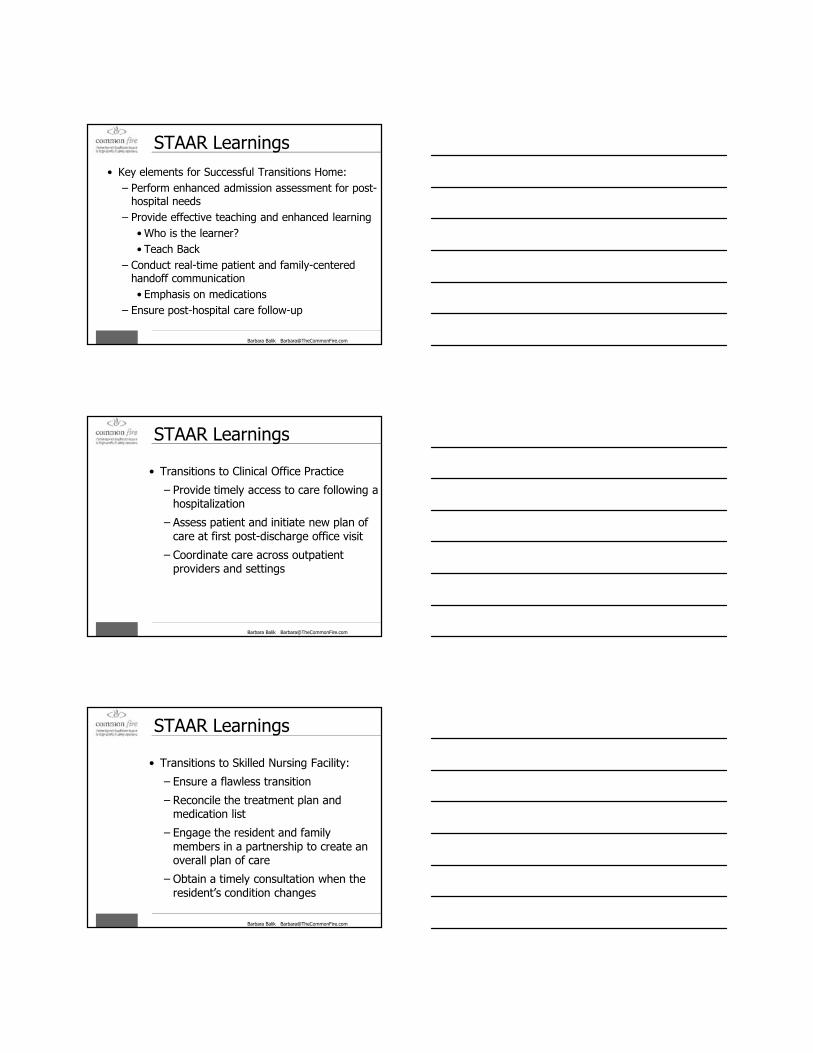
STAAR Learnings
• Key elements for Successful Transitions Home:
– Perform enhanced admission assessment for post-hospital needs
– Provide effective teaching and enhanced learning
• Who is the learner?
• Teach Back
– Conduct real-time patient and family-centered handoff communication
• Emphasis on medications
– Ensure post-hospital care follow-up
Barbara Balik [email protected]
STAAR Learnings
• Transitions to Clinical Office Practice
– Provide timely access to care following a hospitalization
– Assess patient and initiate new plan of care at first post-discharge office visit
– Coordinate care across outpatient providers and settings
Barbara Balik [email protected]
STAAR Learnings
• Transitions to Skilled Nursing Facility:
– Ensure a flawless transition
– Reconcile the treatment plan and medication list
– Engage the resident and family members in a partnership to create an overall plan of care
– Obtain a timely consultation when the resident’s condition changes
Barbara Balik [email protected]
Lessons from the Field
Your learnings
What you can do
Barbara Balik [email protected]
Resources
Chronic Care Model – MacColl Institute for Healthcare Innovation
http://www.grouphealthresearch.org/maccoll/maccoll.html
Care Transitions Program – Dr. Eric Coleman
http://www.caretransitions.org/
Transitional Care Model – Dr. Mary Naylor
http://www.transitionalcare.info/
STAAR and How-To Guides
http://www.ihi.org/IHI/Programs/StrategicInitiatives/STateActiononAvoidableRehospitalizationsSTAAR.htm?TabId=4
Barbara Balik [email protected]

Strategic Management Model
What have we
learned?
What should weWhat should we
do about it?
What does it mean
to our agency?
©2011

• Receive Referral
• Register Patient
• Verify Insurance
• Obtain Initial Visit
Authorization PRN
• Obtain Referral
from Intake
• Assign Patient by
District
• Complete Admit
Log (in system)
• Notify Other
Disciplines PRN
• Admit Visit within
24 hours
• Complete Admit
and OASIS within
24 hours of Visit
• Log Admission
Paperwork
• Notify Clinical
Manager of Late
PaperworkCommunity
Referrals
Hospital Referrals
Clinical ManagerOASIS Reviewer /
Intake T.A. Clinical Staff T.A.
Day 1 Day 2
Fazzi Associates Recommended Admission Flow
• Admission Review
485
• OASIS Review
• Care Manager
• Approves POC
• Visits/Disciplines
• ICD-9 Coding
• Enters OASIS
(PRN) and 485
data, Print 485
• Send RAP from Billing
ERRORS
NO ERRORS
• Corrects Errors
Immediately
ClinicianM.R. / Data Entry
OASIS Reviewer / Care Manager ERROR• Review 485 and Signs (in
absence of electronic
signature)
NO ERRORS
M.R.
• Mail / Fax / Portal 485 to MD
• 485 Document TrackingDay 2 Day 3 - 4
Day 5 - 6
March 2011