THE MONETARIST EXPERIMENT IN CHILE: A …€¦ · The most orthodox and comprehensive ... * Based...
30
12/11/01 (11,035w) CHAPTER II THE NEOLIBERAL EXPERIMENT IN 1973-82: A CRITICAL SUMMARY * During the 1970s, the Southern Cone of Latin America witnessed the pioneering implementation of broad neoliberal economic reforms. The most orthodox and comprehensive neoliberal example is that of the model imposed in Chile between 1973 and 1982. 1 Subsequently, the second half of Pinochet’s regime includes heterodox changes that differentiate it from the pure neoliberal model analyzed in this chapter. There are four reasons for the particular relevance of the Chilean experiment. First, Chile was noted for its long democratic tradition and the broad pluralism characteristic of its institutions and citizens. After the military coup in 1973, an authoritarian regime was established during which the neoliberal model was developed. Under the aegis of this regime, the executors of the economic model enjoyed exceptional autonomy in the design, implementation, and adjustment of their policies. Second, the Chilean experiment is an outstanding example of the contemporary application of monetarist orthodoxy, because of its “purity”, depth, and extensive coverage. Third, its prolonged survival, nearly one decade, provides a broad field for the assessment of its effects. Fourth, the case has been widely publicized as a “success”, with support of some international institutions, financial agents, and “neoliberal” circles, which tend to give absolute priority to “economic freedom” over any other dimension of human activity. The experiment has frequently been cited by these media as a model for other developing countries. Hence, an understanding of its real features and the results it has provoked has a significance that goes beyond the particular case of Chile. * Based on "The monetarist experiment in Chile: a critical survey", World Development, vol. 11, Nº 11, pp. 905-36, Elsevier Science, 1983. The author acknowledges the comments of Eduardo García, Ricardo Lagos, Joseph Ramos, Jaime Ruiz-Tagle, Roberto Zahler and researchers at CIEPLAN, particularly José Pablo Arellano, René Cortázar, Alejandro Foxley and Patricio Meller. Reproduced in Economic reforms in Chile, first edition, 2002; deleted from the second edition. 1 The model imposed in Chile has also been named as orthodox or global monetarism. The authorities referred to it as a social market economy model. The latter denomination leads to misinterpretation when confused with approaches such as that of the Federal Republic of Germany and those which give priority to social aspects and their interaction with the economic dimension. These are humanistic approaches as opposed to the "economicistic" approach of neoliberalism.
Transcript of THE MONETARIST EXPERIMENT IN CHILE: A …€¦ · The most orthodox and comprehensive ... * Based...

12/11/01 (11,035w)
CHAPTER II
THE NEOLIBERAL EXPERIMENT IN 1973-82: A CRITICAL SUMMARY*
During the 1970s, the Southern Cone of Latin America witnessed the pioneering
implementation of broad neoliberal economic reforms. The most orthodox and comprehensive
neoliberal example is that of the model imposed in Chile between 1973 and 1982.1
Subsequently,
the second half of Pinochet’s regime includes heterodox changes that differentiate it from the
pure neoliberal model analyzed in this chapter.
There are four reasons for the particular relevance of the Chilean experiment. First, Chile
was noted for its long democratic tradition and the broad pluralism characteristic of its
institutions and citizens. After the military coup in 1973, an authoritarian regime was established
during which the neoliberal model was developed. Under the aegis of this regime, the executors
of the economic model enjoyed exceptional autonomy in the design, implementation, and
adjustment of their policies. Second, the Chilean experiment is an outstanding example of the
contemporary application of monetarist orthodoxy, because of its “purity”, depth, and extensive
coverage. Third, its prolonged survival, nearly one decade, provides a broad field for the
assessment of its effects. Fourth, the case has been widely publicized as a “success”, with
support of some international institutions, financial agents, and “neoliberal” circles, which tend
to give absolute priority to “economic freedom” over any other dimension of human activity.
The experiment has frequently been cited by these media as a model for other developing
countries. Hence, an understanding of its real features and the results it has provoked has a
significance that goes beyond the particular case of Chile.
* Based on "The monetarist experiment in Chile: a critical survey", World Development, vol. 11, Nº 11, pp. 905-36, Elsevier Science, 1983. The author acknowledges the comments of Eduardo García, Ricardo Lagos, Joseph Ramos, Jaime Ruiz-Tagle, Roberto Zahler and researchers at CIEPLAN, particularly José Pablo Arellano, René Cortázar, Alejandro Foxley and Patricio Meller. Reproduced in Economic reforms in Chile, first edition, 2002; deleted from the second edition. 1 The model imposed in Chile has also been named as orthodox or global monetarism. The authorities referred to it as a social market economy model. The latter denomination leads to misinterpretation when confused with approaches such as that of the Federal Republic of Germany and those which give priority to social aspects and their interaction with the economic dimension. These are humanistic approaches as opposed to the "economicistic" approach of neoliberalism.
2
In this chapter, we shall study, first, the most outstanding features of the economic model
(section 1). Then, the policies implemented in three strategic areas of the model are analyzed;
that is, the anti-inflationary program and the financial and trade reforms (section 2). It follows a
discussion on the main results related to domestic output, income and wealth distribution, and
their implications for future potential growth, especially with regard to the investment-saving
process (section 3). The chapter closes with a brief recapitulation of the lessons provided by this
orthodox neoliberal experiment.
My assessment shows the failures of neoliberalism in three strategic areas, which prevent
it from working efficiently in developing economies. First, the heterogeneity of productive
structures, sectoral and regional problems, and persistent market segmentation implies
demanding challenges to the efficacy of global economic policies. A growing but minor segment
of increased productivity coexisted with numerous bankruptcies and a deterioration of income
and employment quality in most areas of the economy. Second, the initial inequality among
economic agents, which are indiscriminately thrown into competition among themselves, in a
context of overall liberalization, privatization and “neutral” policies, causes an increasing
concentration of economic power. Third, in the macroeconomic framework created by neo-
liberalism, the presence of destabilizing and asymmetrical trends in the adjustment processes has
made them notably pro-cyclical and exceptionally costly from a social and economic point of
view. The macroeconomic environment tended to encourage speculative forces at the expense of
real capital formation and productive development.
1. Core features of the model
In Latin America, there have been many attempts to establish economic policies that
allow a larger role to markets than it had before.2
This, however, can involve a wide variety of
intensities of market action, the role of the state, the ownership of the means of production, and
2 Chilean experiences in 1952-70 are analyzed in Ffrench-Davis (1973). A comprehensive analysis on the economic reforms in Latin America under the “Washington Consensus” approach can be found in Ffrench-Davis (2005a).

3
the participation of different social forces in decision making and the distribution of the benefits
of development.
It is undeniable that in 1973 there were substantial macroeconomic imbalances that had
to be corrected. Likewise, the economy was over-intervened, with excessive “microeconomic”
controls over private and public enterprises. Evidence of this appears in the self-criticism during
1972-73 by various spokesmen of Popular Unity, the governing coalition under President
Allende (Bitar, 1979, chap. V).
The size of imbalances and the open inconsistency of public interventionism facilitated
the introduction of the orthodox neoliberal approach after September 1973.3
Thus, as a contrast
to other authoritarian regimes in Latin America, an extreme version of global monetarism was
imposed in Chile (Foxley, 1983, chap. 2). The model under discussion is an extreme case
because of the amplitude of the role granted to the market, the intensive privatization of the
means of production, and the change imposed on social organizations. Various channels of social
participation and development, which had arisen in the continuing process of democratization in
Chile during the preceding decades, were suppressed or controlled after 1973.
The implementation of the model gave rise to substantial changes in the economic role
played by the public sector. It implied a general withdrawal, gradual or abrupt, from the broad
field of action covered by the state. This embraced public ownership,4
the role of the state in
development, and the orientation of indirect economic policies, which it was stated should
become absolutely neutral. The principle of a “subsidiary state” was applied within markedly
narrow limits and on the premise that private markets could take over numerous functions, which
in fact it could not perform satisfactorily.
3 The more extreme aspects of the model were not fully apparent at the outset. The economic team was taking shape and consolidating its hegemony between 1973 and 1975, and at the same time imposing its neoliberal approach. The peak of orthodoxy was reached in the early 1980s. 4 Notwithstanding the intensity of privatization, public ownership was still more significant in Chile than in several other Latin American countries in 1982. The norm, however, was the passivity imposed on public enterprises. The case of the state-owned copper enterprise, which is described later, is an example of this.
4
The government carried out the structural transformations without having resolved the
severe distortions and macroeconomic disequilibria confronting the Chilean economy. This
procedure was due in part to the priority assigned to structural transformations; it was thought
then that a delay in initiating them might mean the loss of the opportunity provided by the
authoritarian political framework and the widespread anti-interventionist views prevailing in
large social segments that had been traumatized by supply shortages and bureaucracy, among
other things, in 1973. Additionally, the proponents of the model claimed that the existing
problems had resulted from interventionistic public policies applied both during the regime of
President Allende and in the four preceding decades, which included governments that covered
the entire political spectrum.5
The main economic transformations took place on fiscal, financial, and labor issues,
international economic relations, and public ownership of means of production; later, a profound
social security reform was also introduced. In all of these areas, economic action by the public
sector was persistently reduced throughout this period (Vergara, 1981).
Fiscal policy comprised a tax reform and a restructuring and reduction of most public
expenditure. The tax reform included the elimination of taxes on wealth and capital gains and a
reduction of the burden on profits. On the other hand, the adoption of a value-added tax was
completed and the existing exemptions for basic consumer goods were in general suppressed.
The target was to reduce the tax burden, concentrating it in taxes that, in the opinion of the
economic team, were “neutral”. The official speech claimed that any differentiation was
inefficient and “distorted” resource allocation (DIPRES, 1978).
Public expenditure recorded, as a share of GDP, was reduced by over a quarter from the
levels it had reached by the late 1960s,6
5 See statements by public officials in DIPRES (1978) and in Moulián and Vergara (1979).
after having resulted in sizable expenditures and budget
deficits in 1972-73. There was a dramatic decline in government investment, which diminished
6 There are severe problems of comparability in the figures on public expenditure. Due to changes in definition and erroneous deflators, the official figures for social spending were overestimated. Homogenized figures for the period 1969-79 and an analysis of the main components appear in Marshall (1981). All figures in the text come from that source.

5
by more than half, as a share of GDP, between 1970 and 1979. Public expenditure also decreased
in the productive sectors, in activities to support the private sector, in subsidies to public
enterprises, and in infrastructure. Social expenditure, mainly on education, health, social
security, and housing, increased its share in public expenditure. This was repeatedly proclaimed
by the dictatorship to be an indicator of the “social” character of the model. However, it was a
larger share of a smaller total. In fact, real per capita expenditure decreased, and it also declined
as a share of GDP (see chap. VIII, table VIII.1). As will be shown, the drop in per capita public
social expenditure took place in the context of a marked increase in unemployment and
deterioration in the real income of the middle and low-income brackets. Therefore, the
socioeconomic frame required, in contrast, a compensatory increase in fiscal expenditure.
In the financial field, a drastic reform was introduced in 1975. The banks that had been
nationalized under the previous regime were returned to private ownership. Interest rates were
left totally free, regulations respect to the terms and allocation of credit were eliminated, new
financial entities were authorized with few restrictions, and easy access was given to foreign
banks. Finally, there was a gradual relaxation of restrictions on capital flows. Also, the exchange
rate policy was modified sharply, from a multiple exchange rates scheme in 1973 to a unique rate
in August 1975, which was finally pegged in June 1979. The transition took place under a
crawling peg system until 1979, a scheme that Chile already introduced –in a pioneering way– in
1965-70 (see chap. IV, box IV.1; Williamson, 1981).
With regard to international trade, practically all restrictions other than tariffs were
removed, and these were rapidly reduced from the high level predominant in 1973 (a simple
mean rate of 94%) to a uniform tariff of 10% for all goods, since 1979. Likewise, trade
liberalization resulted in the suppression of the price bands and public purchasing mechanisms
designed to attenuate the transmission of external instability to the domestic economy. In line
with the objective of the unilateral and across-the-board market opening, Chile withdrew from
the Andean Pact in 1976.
Privatization was not limited to transferring businesses expropriated during the regime of
President Allende. It was also extended to enterprises created during successive governments
6
after the establishment of the national Development Corporation (CORFO) in 1939. In 1970,
CORFO controlled the ownership of forty-six enterprises, a number that rose to around three
hundred in 1973.7
In 1980 there were only twenty-four enterprises left in the hands of this
institution, half of which were in the process of being sold. There were also some dozen public
enterprises dependent on other governmental departments. Among these were the Copper
Corporation (CODELCO) and the National Oil Enterprise (ENAP).
The sale of enterprises was largely conducted in periods of domestic recession and very
high interest rates. Hence, very few agents were able to participate as purchasers. This was one
of the causes for the acute concentration of ownership during those years.8
In this process, there
was weak direct participation by transnational corporations, in contrast with the official
expectations of a vigorous flow of foreign direct investment (FDI). However, a massive increase
in loans from international commercial banks provided a substantial proportion of the financing
required by the national economic groups acquiring the enterprises being privatized.
In the agricultural sector, the transfer of ownership had dramatic significance. The
agrarian reform that had taken place during the governments of Presidents Frei and Allende came
to an abrupt end. After 1973, around 30% of the expropriated land was returned to its former
owners and about one quarter was auctioned to non-rural dwellers. Barely one-third of the area
was assigned to peasant farmers. Given the curtailment of one of the former functions of the
state, that is, the provision of credit and technical support to peasants and cooperatives, these
were some of the principal victims of the restructuring of public expenditure. It is estimated that
as early as 1979 about half of the peasants who had been assigned land had been forced to sell or
rent out their farms.9
At the same time, a massive expelling of peasants from the farms on which
they had been living before and during the agrarian reform took place.
7 This figure does not include about 220 enterprises subject to intervention in 1973. See Vergara (1981); Bitar (1979, chap. X) examines the social property area program, its deviations, and resulting problems. 8 Additionally, it is estimated that the transfer was made at prices lower than normal market values. See Dahse (1979); Foxley (1983); Marcel (1989). 9 Two financial factors that contributed to the pressure on peasants to sell or lease their allotted land were the high cost of credit in the domestic capital market and the lack of prior relations between the peasants and commercial banks. It seems to have been assumed that they would “compete” on equal terms with the other users. On the agricultural and peasant situation, see Foxley (1983); Ortega (1987).
7
The dismantling of state participation in economic life was also extended to other areas.
In brief and by no means exhaustive terms, two such cases are the agricultural “infrastructure”
network (such as cold storage plants, supply centers for seeds and inputs, purchasing power, and
technical assistance to medium and small farmers) and the mining network (mineral-processing
plants).
In 1980, another major step in the process of privatization was taken in the social security
system. The pension scheme, hitherto financed through a pay as you go system, was replaced
with a system based on individual capitalization in private social security financing societies
(AFP) created by the new system.10
Existing pensions and those of workers who would retire
within five years continued to be the responsibility of the public sector; the rest of the workers
could choose between remaining in the old system or transferring to an AFP. For merely making
the transfer, the worker benefited from an automatic take-home pay increase of 11%. The choice
between financing societies was to be made by the worker based on quality of service and an
assessment of the expected return in each social security financing society during the length of
time before his or her retirement. The expected return to the worker was determined by the
various commissions he or she had to pay, which could be freely modified by each society, and
the return obtained from the investments of each AFP.
One enterprise of great importance that resisted privatization was CODELCO. It
underwent powerful onslaughts from the economic team but succeeded in warding them off.
Even so, it suffered budgetary restrictions and systematic constraints on its expansion imposed
by the Ministry of Finance, despite the substantial profits it contributed to the Treasury. It was
only permitted to make investments that allowed maintaining the production level reached in
1977. Within the contradictions produced by the privatization dogma, the government
encouraged, unsuccessfully hitherto, the development of other copper deposits to be operated by
foreign companies.11
10 The features of the pay as you go system, the new dispositions, and a comparative analysis with other options are discussed in Arellano (1985). 11 See Vignolo (1982). The main foreign investment, made by Exxon through the purchase of a deposit in exploitation, is discussed in Tironi and Barría (1978). Also see Bande and Ffrench-Davis (1989).
8
One feature of the official anti-state approach was the persistence of the privatization
process, even during the severe 1982 crisis. The government constituted a commission to sell
assets as part of an “economic recovery program”.
Parallel with the changes in the economic field were structural reforms in social
organization. According to the official rhetoric, these were part of the project to create a
competitive society of “free men”. This involved changes in the university system, in the
organization and dependence of elementary schools, in health services, professional associations,
and student and labor organizations.12
The latter case was undoubtedly functional in imposing a
policy that caused average real wages in 1981 to be even lower than in 1970.
2. Neoliberalism in three strategic areas
One of the distinctive features of neoliberalism is its globalism: that is, its neglect of
problems of a sectoral nature, of the heterogeneity of the productive structures and access to
power of different sectors, of the significance of market segmentations, and of the difficulty of
transmitting information to economic agents so that they can contribute to fulfilling the
expectations of policy-makers. Ultimately, it underestimates the frequent presence of
destabilizing adjustment processes, lags and overshooting, and the incompleteness of markets
and institutions in developing nations. These elements represent inescapable obstacles that
prevent “neutral” and indirect global economic policies alone from being effective in emergent
economies in the process of deep transformation like Chile was.
In this section, we consider three “'neutral” policy reforms to which the government
assigned a crucial role. First, we cover the anti-inflationary policy, initially applied under an
extreme closed economy monetarism until 1976, and then shifted to an extreme open economy
monetarism between 1979 and 1982. Second, the domestic financial reform introduced in 1975 is
analyzed. Finally, a brief discussion on trade and capital account reforms is presented.
12 See Brunner (1981); Campero and Valenzuela (1981); Moulián and Vergara (1979); Vergara (1981) and various articles in Revista Mensaje, especially Ruiz-Tagle (1979; 1980; 1981) and Zañartu (1980).

9
a) The anti-inflationary policy13
Until 1976, anti-inflationary action was based solely on monetary policy. From May to
August of 1973 the inflation rate had averaged 19% per month (an annualized rate of 700%).
14
The fiscal deficit climbed to 12% of GDP in 1972-73, financed principally with Central Bank
money printing. The huge deficit was strongly influenced by price controls on the goods and
services sold by public enterprises (Larraín, 1991).
Price controls, which extended to broad areas of the private sector, involved heavily
repressed inflationary pressures and an extensive black market (Bitar, 1979). A few days after
the coup, most of the controlled prices were freed within a context of high uncertainty. The
foreseeable result was a dramatic upsurge of inflation, which soared to 88% in one month and
reached 590% in the course of the first year of application of the model. Undoubtedly, there was
an overshooting of market prices, which exceeded by far the inflationary pressures previously
repressed. As the fiscal situation was being brought under control, monetary policy became
effectively restrictive in the course of 1974. The official line was that the new price fixers, the
private entrepreneurs, had to take money supply behavior into account in order to define the
price of their products. It was claimed that in their best interest they would restrict price
increases in order to maintain their market share. And this they would promptly do as soon as
they observed a reduction in the expansion rate of money supply.
The concrete fact is that the information on money supply became widely available with
a delay of some months and with various divergent indicators, and that prices, given the high
inflation, were often adjusted even more frequently than once a month. Under these
circumstances, the main point of reference for each economic agent became the actual behavior
of entrepreneurs as a whole, measured through changes in the official consumer price index
(CPI), the only easily available and up-to-date indicator. This indicator was published early in
each month referring to the preceding period. The consequence was that annual inflation rates
exceeding 300% persisted until far into the third year of application of the model, despite
monetary restrictions, a fiscal budget already under control in 1975, and a large output gap (20%
13 Anti-inflationary policy is discussed in greater depth in Corbo (1985); Foxley (1983); Ramos (1975, 1986). 14 All the inflation figures used here refer to the consumer price index as corrected in Cortázar and Marshall (1980).

10
in 1975-76).
The monetary restrictions, rather than influencing prices, had a greater impact on
economic activity: during 1975 industrial production fell by 28%, GDP declined by 17%,15 and
open unemployment (including emergency programs) peaked at 20%.16
The “price”, which was
in fact adjusted swiftly downward, was wages: by 1975 they had lost about 40% of their
purchasing power owing to the legal readjustment based on an underestimated CPI and the
drastic repression of unions.
The monetarist recipe for controlling inflation did not function in the way predicted by
the supporters of the model. On the contrary, it multiplied the effects deriving from the
international recession and involved a notably high cost, both socially and in terms of economic
activity (see Foxley, 1983; Ramos, 1986).
As late as mid-1976, the economic team recognized –implicitly– that monetary control
was proving to be incapable of restraining inflation on its own. Then a second variable was
incorporated into the anti-inflationary policy: the management of the exchange rate was
conditioned to that objective. Thus began a long process in which this rate was used to slow
inflation by reducing the cost of imported goods and attempting to influence inflationary
expectations: analytically, it was a transition from closed to open monetarism. In June 1976 and
March 1977, exchange rate revaluations were made (a reduction in the number of pesos per U.S.
dollar), which were accompanied by a systematic mass media campaign.17 The measure had a
significant effect, since inflation rapidly fell to levels below 100% annually after the first
revaluation and below 60% after the second.18
The official index significantly underestimated the actual rise in prices, mainly in 1973 and in 1976-78.
There was a belated understanding that inflation
15 In the course of 1975 a severe balance of payments problem arose. This was associated with a sharp fall in the terms of trade, which the government tackled by intensifying the restriction on money supply, curtailing fiscal expenditure, and imposing a devaluation. The impact of the terms of trade deterioration was multiplied by three in the domestic economy. Naturally, the direct impact of the deterioration in the terms of trade observed in 1975 is not included in the figure of GDP decline. GDP measures real output; the terms of trade impact affects real income. 16 The severe shortcomings of the official employment figures are examined by Jadresic (1986), who provides a revised series for the period 1970-85. 17 After the publicized revaluations, daily minidevaluations were applied. Exchange rate policy is analyzed in chap. IV and in Ffrench-Davis (1981). 18 As Cortázar and Marshall (1980) document, in that period there was a systematic, month after month, underestimation of the CPI; the official CPI was used as reference for wage and pension readjustments.

11
was not being generated by an excess of demand and monetary expansion; it is evident that
misinterpretation of the workings of markets involved huge social and productive costs for Chile.
The belated realization was, moreover, incomplete, since only one additional policy instrument
was applied; that is, the exchange rate. This implied its excessive conditioning to the anti-
inflationary policy, thereby sacrificing external equilibrium and the production of tradables.
The evolution of anti-inflationary policy finished in 1979 with the freezing of the
exchange rate, once again supported by the weight of publicity in the mass media. The new
official version was that, with a fixed exchange rate in an economy with free imports, as the
Chilean economy was then, domestic prices could not rise more rapidly than international
inflation. At this late stage, therefore, they had adopted the “monetary approach to the balance of
payments” then in fashion in several academic and orthodox financial circles. Thus, the
implementers switched from a closed economy monetary approach, the official doctrine up to
1976, to an open economy model. In the former case, domestic inflation was considered to be the
exclusive result of monetary expansion. In the latter case, domestic inflation was assumed to be
due to international price changes plus exchange rate variations; with the nominal exchange rate
peg, there should be rapid equalization of domestic and external inflation (see chap. IV).
When the exchange rate was pegged (June 1979), domestic annual inflation was above
30%, while international inflation was near 12%. The convergence between the two rates
occurred, but only gradually; consequently, for a year and a half, domestic inflation was
markedly higher than the external rate, so that the exchange rate lost purchasing power.19
Notwithstanding, even the corrected CPI shows a gradual drop in the rate of inflation.
Hence,
the regime of free imports and an appreciated exchange rate caused a flood on the domestic
market and an unsustainable disequilibrium in the current account during 1981. To face the
external deficit, the official policy relied on an “automatic adjustment” in the style of the gold
standard in force before the world crisis of 1929: it claimed that the real exchange rate would
automatically adjust with the contraction of monetary liquidity associated with the current loss of
international reserves in the Central Bank. This contraction should have provoked a drastic fall in
19 It is relevant that external inflation (measured in US dollars) also decreased in these years, due to the sharp appreciation of the U.S. dollar with respect to the currencies of the remaining industrialized countries: in the 12 months before June of 1982, it reached an annualized average of -2%.

12
domestic prices and nominal wages. However, a detail apparently overlooked was the fact that
the exchange rate between 1979 and 1981 had accumulated a 30% appreciation (besides the
lagged effect of import liberalization, as analyzed in chap. III). The actual adjustment worked in
the right direction, but with a lag, and then only in a small proportion of that 30%, when negative
inflation rates were achieved in some months of 1982. At the same time, however, there was a
drastic fall in sales, production and employment, and a progressive strangulation of business
firms through increasing indebtedness at extremely high real interest rates. We will return to this
issue later.
Despite numerous tough restrictions on labor union activities and a real wage that
remained below the average level of 1970, the authorities blamed salaries for their failure to
achieve a fluent and rapid automatic adjustment.20
In mid-1982, they tried to establish a general
reduction of nominal wages, but the economic team was unable to impose such a measure.
Consequently, they turned to exchange rate devaluation, but with unsustainable disturbances in
the productive and financial systems: between June and October of 1982, the nominal exchange
rate was devalued by more than 70% amidst a general crisis. The corresponding inflationary
impact implied that the CPI increase in the following twelve months jumped to 32%, in contrast
with the 4% recorded in the previous period (that had included months with price deflation).
b) Reform of the financial system21
By 1974, the commercial banks were mainly in the hands of the state as a result of
nationalization by the previous government. During 1975, most banks were auctioned back to the
private sector. The larger commercial bank, the Banco del Estado, founded in 1953, remained
public, but its market share fell from about 50% at the beginning of the decade to 14% of
outstanding loans in 1981. Earlier in 1974, authorization had been given for the creation of
20 The lower limit for the adjustment in wages was determined by the official CPI of the preceding period. Various authors blame this rule for the costly recessive adjustment. Nonetheless, there was no knowledge of cases of massive deflation that had resulted from restriction of the money supply, which had operated fluently, at the required intensity, and without causing severe problems for debtors or economic activity. The sticky prices model continued to be a reality around the world in addition to legal readjustment norms. A recent example is Argentina in 1995, and since 1998. In fact, the Argentinean crisis that peaked in 2002, has strong similarities with the 1982 Chilean crisis. 21 Financial reforms are examined in chapter IV.
13
private financing societies that could receive and lend resources at a freely determined interest
rate. Meanwhile, banks remained subject to a low legal maximum interest rate until April 1975.
This and other measures that discriminated against banks while they remained public contributed
to the boom of the new financing societies. Discrimination was also directed against the savings
and loan cooperative system (SINAP), which was linked to the acquisition of housing. The
notorious discrimination against this organization caused the funds received by SINAP to
decrease from 28% of total financial loans in 1973 to 7% in 1977.
In addition to freeing the interest rate, in 1975 the government eliminated the norms
relating to the quantitative control of credit in domestic currency and the selectivity of bank
reserve regulations, which were largely intended to channel funds into production rather than
consumption. Moreover, restrictions relating to maturity terms were removed (except for a
general restriction of thirty days minimum). Next a gradual uniformity was imposed on the
different financing institutions for both the operations permitted and their conditions. Within this
trend toward uniform treatment came the deregulation for foreign banks.
The economic team expected that liberalization of the domestic financial market,
accompanied by the gradual opening of the capital account, would lead to an increase in national
savings and the quality of investment, in response to the suppression of former subsidies and the
removal of discrimination between credit users. The result was strikingly different and placed the
financial reform and the handling of the external sector at the core of the economic crisis that
surfaced in 1982.
The two most outstanding features of the working of the domestic capital market were the
maturity terms and the interest rates that prevailed during the seven years between 1975 and
1982. The most common term for deposits and loans was thirty days, with a sharp drop in long-
term funding. The average real interest rate (discounting inflation) was 38% annually during
1975-82, covering in those years a range varying from 12% to 120% (see chap. IV, table IV.5).
In other words, real interest rates in the domestic market, apart from a markedly high average
level, varied enormously throughout the period.
Medium-term lending available at international rates were mostly those related to
14
external loans. These were mainly at the disposal of enterprises connected with banks and to
“economic groups” (principally the so-called “Piranhas”), which grew like wildfire during the
period under discussion (see Dahse, 1979). The notable market segmentation to which this gave
rise was partially recognized only shortly after the emergence of the crisis. In mid-1982, it
became public knowledge that the principal bank of the largest economic group had 42% of its
total loans (financed with domestic and external funds) in companies related to its directors or
owners (stockholders in control).
Repeatedly, advocates of the model predicted decreases in real interest rates.
Exceptionally, during 1980 there was a significant drop in the real financial cost, which lasted
for nine months. This was associated, on the one hand, with the freezing of the exchange rate
during the whole year and with average domestic inflation still above 30% annually. Hence, the
real cost of foreign loans was negative (-8%) for national debtors. On the other hand, the volume
of external financing rose rapidly. Thus, external credit came to represent 40% of total bank
financing (of domestic and foreign origin). Its high volume and negative real cost, despite the
persistent segmentation of the domestic and external markets, brought down the cost of credit of
domestic origin to 12%, twenty points higher than the rate applied to the large enterprises and
banks, which had access to funds from international commercial banks.
Policymakers throughout the seven years anticipated that the market, once freed from
public intervention, would achieve equalization of domestic and external interest rates, an
integrated financial market, and increased investment and efficiency. The outcome was different:
(i) there were persistent gaps, even in 1980-81, between domestic and external rates of up to over
twenty points annually; (ii) in the domestic market, the spread between active rates (loans) and
passive rates (deposits) was around fifteen points; (iii) the nominal and real rates were very
unstable, as were the spreads mentioned; (iv) consumer credit expanded, predominantly for
imported consumer goods; and (v) the high cost of credit, its instability, and the short maturities
(mainly thirty days) discouraged productive investment. What non-speculative investment could
pay real interest rates with annual averages of 38%?

15
In fact, the rate of capital formation (gross fixed domestic investment as a share of GDP)
during the implementation of this neoliberal model was lower than the historical figures, and the
performance of savings was even more deficient. We shall return to this in section 3.
c) Across-the-board trade opening22
The main feature of trade policy was the rapid reduction of protection to import
substitutes (protection was clearly excessive in 1973). The target of liberalization underwent
major changes during the course of its implementation. In 1974, it was stated that in 1977 there
would be no tariff higher than 60%. Then in 1975 it was announced that the tariff range would be
between 10 and 35% and, through gradual adjustments, it would be reached in the first half of
1978. Nevertheless, these reductions were completed earlier, in August 1977. Finally, three
months later a program of monthly adjustments was announced, which resulted in a uniform
tariff of 10% for (almost) all imports since June 1979.
It was repeatedly stated that the real exchange rate would devalue spontaneously as actual
tariff protection decreased. Nevertheless, as noted earlier, shortly afterward the exchange rate
began to be used to reduce inflationary expectations and compensate for the monetary effects of
massive capital inflows. The result was that advanced phases of tariff liberalization were
accompanied by intensive exchange rate revaluations, reinforcing the negative effects on
domestic importables and contributing to a growing deficit on the current account. In practice,
therefore, especially with the presence of voluminous capital surges, significant deviations
occurred with respect to the supposed compensation between tariff reductions and the exchange
rate.
Total imports, measured in constant purchasing power, considerably expanded in relation
to domestic economic activity. This was mainly observable in consumer goods, particularly
nonfood products, where the greater part of new imports was concentrated (see chap. III, table
III.3).
22 For more on trade opening in this period, see chapter III.

16
Nontraditional exports showed vigorous growth and diversification by both products and
destination. Their share in GDP rose by around four points between 1970 and 1980. This brought
total exports up to 20% of GDP in the latter year. Even so, there was an evident break in the
expansive trend toward the end of the period, particularly in 1981. Additionally, the diversifying
process showed a tendency to retract; in fact, those exports that continued to expand by the late
1970s were mostly natural resource intensive (Ffrench-Davis, 1979; 1983b).
Just as import substitution has an “easy” stage, so there is an initial easy stage in the
promotion of exports in emerging economies. The increase in nontraditional exports in the 1970s
relates in general to this stage. In fact, it relied on rich natural resources and underutilized
installed capacities. The underutilization characteristic of overprotected import substitution and
exchange-rate appreciation in 1971-73 was intensified by the great depression in domestic
demand in 1975-76 and its subsequent slow recovery. This situation initially enabled exports to
expand without major investments. The increase in exports was spurred by four additional
factors. First, a crawling peg exchange rate policy of mini-devaluations was applied, which,
despite contradictory movements since 1976, in combination with the sharp drop in labor costs
initially encouraged exports. Second, the presence of Chile in the Andean Pact until 1976
provided an enlarged market for more than one-third of the increase in new exports (Ffrench-
Davis, 1979). Third, there was a reduction in the cost of imported inputs to those exporters who
had not benefited from tariff exemptions previously. Finally, together with the above factors, the
privileged position assigned to export promotion in the official rhetoric gave a significant
impetus to the hitherto incipient export mentality of entrepreneurs.23
The gap between imports and exports widened persistently after 1977. Several factors
account for the external deficit and the poor performance of the production of tradables. Shortly,
the most painful part of trade liberalization was carried out abruptly and saw its negative impact
reinforced by exchange rate revaluation (see chap. III, table III.2). To make matters worse, this
policy was applied in the context of very depressed domestic demand and notoriously high, open
23 The official policy included active promotion through a public institution (PRO-CHILE). This involved a deviation with respect to orthodoxy, which claimed to base the promotion of exports exclusively on the liberalization of imports and the supposed compensatory exchange rate devaluation. As the orthodox approach gained control in public action, PRO-CHILE rapidly lost importance.

17
unemployment. Consequently, the existence of high unemployment and the abnormal low level
of investment implied that the possibility of achieving an effective resource reallocation was
scarce; this way, the released resources were frequently left unemployed. Therefore, the
opportunity cost of the resources affected negatively by openness tended to be inferior to its
market cost. That generated a great gap between market and social comparative advantages.
Consequently, the corresponding import de-substitution was inefficient in many cases: it
crowded-out domestic output that, in normal conditions (for example with respect to interest and
exchange rates) could have competed with imports.
Thus, underutilization of labor and capital, outlier macroprices (interest and exchange
rates), and depressed domestic demand generated a framework quite different from the
theoretical one on which the arguments in favor of free trade were based. The numerous changes
made in the Chilean economy and the neutrality (passivity) of the public sector made it difficult,
during the transition to a new equilibrium, to identify “comparative advantages”.24
Not
surprisingly, the resulting low domestic investment was concentrated mainly on resource
intensive items and scarcely at all on activities intensive in value-added over the natural
component and in “acquirable comparative advantages”.
There is no doubt that the phenomenon was aggravated by the freezing of the exchange
rate in 1979 and its sizable real appreciation in the following years. The unqualified adoption of
the “monetary approach to the “balance of payments” and the belief in an “automatic
adjustment” were prejudicial even to exports, that is, one of the successes that economic policy
could exhibit in its nine years of implementation.
As a consequence, the reallocative message provided by trade liberalization was clearer
for the sectors that should have contracted than for those to be expanded. The more rapid growth
of imports than of exports was a decisive factor in the deterioration of the current account. The
deficit was covered by increasing capital inflows.
24 Neutrality was an obstacle to the much needed efforts to complete markets, which are required for a vigorous acquisition of systemic competitiveness. See ECLAC (1998, chaps. VII and VIII) and Ffrench-Davis (2005a, chap. I).

18
The government expected a vigorous inflow of foreign direct investment (FDI) in
response to the “economic and political system” offered and to the favorable norms established
for investors by the new statute for foreign investment (Decree 600). It was hoped that FDI
would exploit the “comparative advantages” previously repressed, which the model was
liberating, and that it would make a decisive contribution to rapid development. However, the
response of FDI dashed the hopes of the economic team. There were promises of considerable
amounts, but their realization was slow (see Lahera, 1981; Vignolo, 1980). On the other hand, a
significant share of actual inflows corresponded to two components that do not involve direct
creation of productive capacity. One corresponds to financial capital contributed by transnational
banking branches and the other to the purchase of productive assets or packages of actions.
In contrast, access to financial capital in private international markets represented the
main source of financing for the growing current account deficit. Its main destination in Chile
was the private sector. The fact that during a good part of the 1970s real interest rates in
international capital markets were low or negative (averaging -2.3% in 1976-81) and access to
private funds was expeditious, led the economic team, and many policymakers and economists
throughout the world, to believe that it was “good business” to borrow and that if the debtor was
the private sector the funds would be invested efficiently (see Devlin and Ffrench-Davis, 1995).
Once again the facts belied the expectations of the supporters of the model. A significant
share of foreign credit was devoted to consumption. The massive net inflows, in its turn, helped
to promote the excessive exchange appreciation and to maintain it for several years. In fact, if
foreign credit had been less accessible, the government would have been forced to moderate the
tariff liberalization and/or the exchange rate appreciation. Indeed, the loans available to Chile
were larger than what could be absorbed productively. After only a moderate increase in
1977-79, the level of debt accelerated in 1980 and grew spectacularly in 1981. In contrast to
other countries, which channeled external financing into investment, Chile, instead of having a
“debt-led economic growth” (as in Brazil), incurred a “debt-led deficit on current account”, with
a crowding-out of savings and domestic output by imports and the discouragement of exports.
Finally, external conditions worsened toward the end of the period: international real interest
rates rose abruptly, access to funds became progressively more difficult in 1981, and experienced

19
a sudden stop in 1982.
The experiment in this area culminated in mid-1982, with an abrupt exchange rate
devaluation after several months of costly and inefficient “automatic adjustment”, a bank crisis
and a deep recession.
3. Output, investment, and income distribution
In this section, I will make an assessment of the results obtained in growth and equity.
First, what happened with GDP and its main components? Second, to what extent was the
performance of the economy generating new productive capacity and new sources of savings?
And, third, how were the benefits and costs of the implementation of the model distributed? The
background data show that (i) “growth” was largely fictitious, (ii) the capital formation ratio was
notably lower than in the 1960s, and (iii) the limited benefits went to a minority while high costs
burdened the majority implying a sharp worsening of income and wealth distribution.
a) Global production and its composition
National accounts, both official and corrected (Marcel and Meller, 1986), show high
“growth” between 1976 and 1981. However, in the first place, the model was not initially put in
motion in 1976 but (in partial form) in 1973. Second, in 1975 there was a sharp recession, which
multiplied threefold the depressive effect of external shocks. The overall result was a fall of 17%
in GDP. Hence, to measure economic evolution from the low point implies measuring as
“growth” what in fact simply is a recovery of former levels. Whereas 1976-81 gives a per capita
annual GDP increase of 4.7%, the period 1974-81 merely averages 1.4%. It is obvious that the
greater the recession of 1975 the greater could have been the subsequent recovery. Thus, the
greater the loss of production as a result of the recession (a true social and private cost) the
higher will appear the “growth” if the period of recession is not taken into account and the
measurement begins at the lowest point. This is an extremely gross error, but it is quite frequent.
Paradoxically, then, in several ways the domestic recession was useful for the promotion
of the model. First, the model was able to show “growth” for several years, a circumstance that

20
attracted extensive publicity in the national and foreign mass media; the degree of
shortsightedness was impressive. This gave rise to the mistaken impression that Chile was
growing vigorously and would continue to do so at rates in the order of 8% per year,25
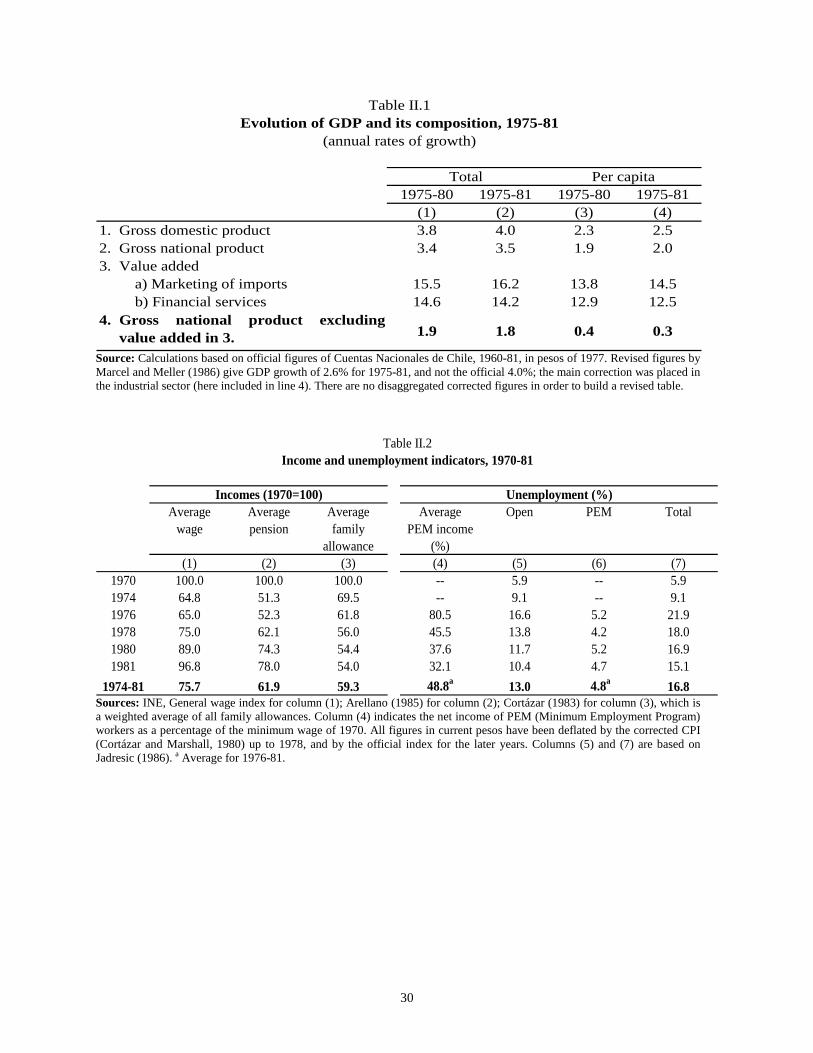
The weaknesses of the model are highlighted when the composition of GDP is
disaggregated. Unfortunately, because there are no revised figures to follow this analysis, I use
the official data in table II.1. First, there was a rise in external indebtedness and of its cost.
Around one fifth of per capita GDP “growth” recorded between 1974 and 1981 corresponded to
interest and profit payments accrued to foreigners, which meant that the rate of expansion of the
national product was lower than that of GDP. Second, the value-added in (i) the marketing of
imported products and (ii) financial services contributed a high share to GDP “dynamism”; these
two sectors, which were linked with the essence of the model, exhibited a dramatic cumulative
expansion of 13% annually.
irrespective of what might happen in the rest of the world. Second, economists were able to show
that employment was increasing (though only after the unemployment rate had risen from 6 to
22% and again ignoring the starting point). Third, on a more political level, after an intense
recession –underestimated or ignored by the media under a strong dictatorial regime– the
subsequent gradual recovery brought a sensation of relief to both entrepreneurs and workers,
while consumers were making use, directly or indirectly, of voluminous foreign loans.
The first sector expanded as a result of an unsustainable rapid growth of imports of
consumer and intermediate goods. As was discussed earlier, most of these imports were financed
not by higher exports but by an increase in private foreign debt. This source of “dynamism”,
value-added in the marketing of imports, was unsustainable in an economy that lacked vigorous
real productive support and that was experiencing a notably high external deficit. The second
source of “dynamism” was associated with the financial reform and responded in large measure
to the spread between the rates of interest on deposits and loans and to the transfer of foreign
credits in Chile. Thus, these two sources of dynamism depended on outlier values of imports and
financial spreads, both of which were prejudicial to productive activity and investment.
(Table II.1)
25 See, for example, the illustrative statements quoted in Foxley (1980, pp. 5-6).

21
There can be no doubt that, owing to the distortion produced by both sectors in the
Chilean economy, the overall performance contained a sizable share of artificiality. Hence, it is
very significant that the rest of the value-added per capita, which in 1974 amounted to 91% of
gross national product, remained virtually stationary, as can be seen in column 4 of table II.1.26
Over and above this poor performance, GDP fell by 14% in 1982-83, while Latin American GDP
diminished only 3.2% in the same biennium.
b) The nexus with the future
The link with the future relates to national savings and productive investment.27
The
supporters of the model claimed that it would achieve a substantial increase in savings,
investment, and efficiency, all crucial sources of economic growth. The foregoing analysis has
shown that the results were negative with respect to production. However, this could be
consistent with a vigorous process of slow maturing investment. Unfortunately, in each of the
years between 1974 and 1980, the gross fixed investment ratio was lower than that of each year
in the 1960s; only 1981 registered a ratio comparable with that decade. In 1974-81, the average
rate was 15.7%, in contrast with 20.2% in the sixties. In parallel, national savings financed a
lower share of investment; in 1970, around 90% was covered by national savings, whereas in
1978-81 scarcely half came from this source. The sharp increase in inequalities of wealth and
income observed in these years apparently expressed itself in a notorious differentiation in
lifestyles rather than in higher savings directed to finance productive investment; this is attested
by the sharp fall in the rate of national savings with respect to both 1970 and 1973.
26 As mentioned earlier, production of exportables also grew at a significant pace. Therefore, a contraction in the rest of the economy –the non-exporting sectors– occurred. Within this subset, the industry, which accounted for the major share of economic activity, suffered the negative pulls of the recession in 1975, trade liberalization, and then exchange rate appreciation. See chapter III and Marcel and Meller (1986). 27 There are many other connections to the future that are not considered here. These include the impact that the model may have had on the capacity for technological absorption and adaptation; the degree of creativity of the technical and university education systems; national cultural development; the channels of participation and social capital that could serve for development strategies, based on a national consensus; and the dynamism and efficiency of the function of the state as the activator of development.
22
c) Concentration of income and wealth
Here we shall take a brief look at the indicators of wages and pensions, employment,
consumption, and wealth. A comprehensive set of indicators is discussed in chapter VIII.
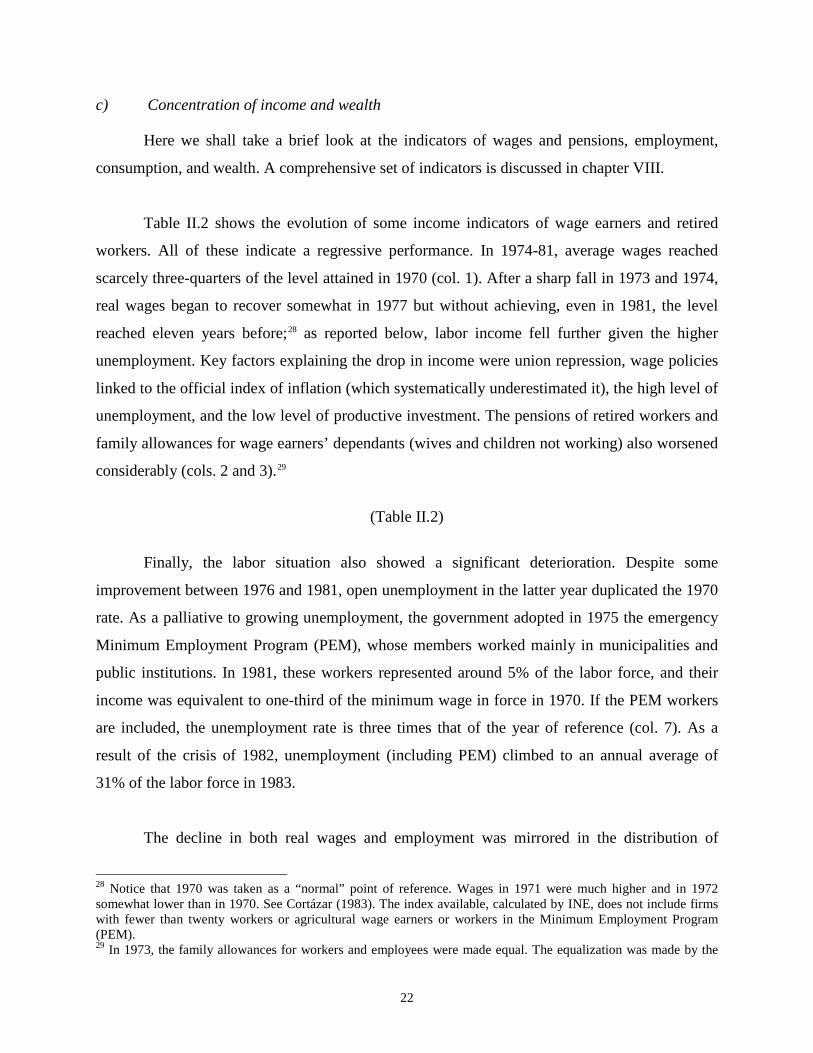
Table II.2 shows the evolution of some income indicators of wage earners and retired
workers. All of these indicate a regressive performance. In 1974-81, average wages reached
scarcely three-quarters of the level attained in 1970 (col. 1). After a sharp fall in 1973 and 1974,
real wages began to recover somewhat in 1977 but without achieving, even in 1981, the level
reached eleven years before;28 as reported below, labor income fell further given the higher
unemployment. Key factors explaining the drop in income were union repression, wage policies
linked to the official index of inflation (which systematically underestimated it), the high level of
unemployment, and the low level of productive investment. The pensions of retired workers and
family allowances for wage earners’ dependants (wives and children not working) also worsened
considerably (cols. 2 and 3).29
(Table II.2)
Finally, the labor situation also showed a significant deterioration. Despite some
improvement between 1976 and 1981, open unemployment in the latter year duplicated the 1970
rate. As a palliative to growing unemployment, the government adopted in 1975 the emergency
Minimum Employment Program (PEM), whose members worked mainly in municipalities and
public institutions. In 1981, these workers represented around 5% of the labor force, and their
income was equivalent to one-third of the minimum wage in force in 1970. If the PEM workers
are included, the unemployment rate is three times that of the year of reference (col. 7). As a
result of the crisis of 1982, unemployment (including PEM) climbed to an annual average of
31% of the labor force in 1983.
The decline in both real wages and employment was mirrored in the distribution of
28 Notice that 1970 was taken as a “normal” point of reference. Wages in 1971 were much higher and in 1972 somewhat lower than in 1970. See Cortázar (1983). The index available, calculated by INE, does not include firms with fewer than twenty workers or agricultural wage earners or workers in the Minimum Employment Program (PEM). 29 In 1973, the family allowances for workers and employees were made equal. The equalization was made by the

23
income and consumption expenditures. Data on income distribution for Santiago indicates that
the ratio between the richest and the poorest quintile of population deteriorated from 13 times in
the sixties to 15 times in 1974-81 (see chap. VIII, figure VIII.3). Available data on the
distribution of expenditure refer to surveys conducted in 1969 and 1978. They show that the
poorest quintile reduced its consumption by 31% between the two years of reference, and the
second and third quintiles lost 20 and 12%, respectively. In contrast, the richest quintile was the
only one that increased its consumption share (see table VIII.2).
There is one important indicator that showed significant improvement during this period.
This is the infant mortality rate, which improved from 66‰ in 1973 to 33‰ in 1980, despite the
drop in per capita social expenditure and the worsening of employment and income distribution.
The main compensating factor for the negative impact of the economic environment for the
majority of people was associated with the emphasis placed by the National Health Service on
the maternal and child areas and nutrition programs directed toward breast-fed and
undernourished infants (Raczynski and Oyarzo, 1981; Monckeberg, 1998). In contrast to this
specific area, per capita public social expenditure diminished 17% between 1970 and 1981, in
education, health, and housing.
There is no doubt that deteriorating employment and income among workers influenced
the distribution of expenditures and wealth. Additionally, there was a striking improvement in
the income of the highest paid workers, which increased the distributive gap. But the
concentration was fostered by other components of the economic model as well. As mentioned,
numerous enterprises in the public sector were rapidly privatized. This took place in an economy
in recession and with high interest rates. Only a small segment of the private sector was able to
take them over and at prices very favorable to the purchasers. Finally, the recession hit many
private businessmen (small and medium sized firms) who lacked privileged access to domestic
or external credit. Hence, many of these entrepreneurs went bankrupt or were forced to sell their
businesses to the same economic groups that had acquired the former public enterprises.
Differential access to foreign loans was another source of concentration. It implied, apart from
bottom, so all allowances diminished, though less in the case of blue-collar workers.

24
the purchasing power it conceded, a capital gain corresponding to the large spread between the
domestic and external interest rates (see chap. V, table V.5; and Zahler, 1980, table 14).
The available data show the marked concentration of wealth, with two groups well ahead
of the rest. By 1978, the two main economic groups controlled enterprises representing around
one half of the wealth of the corporations registered in the stock exchanges of Santiago and
Valparaiso, a figure notably higher than in 1970. Data on the 250 largest national and foreign
private firms in Chile indicate that the two aforesaid groups controlled at least 37% of the capital
of these firms in 1978 (Dahse, 1979). The process of concentration continued in subsequent
years; between 1978 and 1980, the capital of firms controlled by the two main groups doubled in
real terms (Dahse, 1982). Data provided by the Stock Exchange of Santiago in June 1982 on
distribution of the shares of 177 open private companies indicated that the ten main shareholders
of each firm had direct control, on average, of 72% of equity capital.
4. Lessons from the neoliberal experiment
In the 1970s, neoliberalism came to the forefront in various countries and achieved a
leading position in many academic centers in industrialized and developing countries.
Nonetheless, its practical implementation in the postwar period had been generally limited and
for brief periods. The case of Chile is particularly significant because of the depth, coverage, and
continuity with which the orthodox neoliberal model was applied. The dictatorial political
environment, that gave free way to its imposition, provided great autonomy to its advocates,
which invests this case, properly speaking, with the character of an “experiment”.
The external situation prevailing during these years involved some negative shocks for
the Chilean economy, which affected the success of the model. A case in point was the low price
of copper, which persisted during most of the nine years considered. Even so, the external
situation also contained features that facilitated the operation and duration of the model. One of
the main features was that from 1977 on Chile had expeditious access to external financial loans,
which, up to 1981, enabled it to more than offset the income loss caused by worsening terms of
trade.
25
The increasing adherence to orthodoxy from 1974 onward met its first severe obstacle in
1981, and in 1982 it suffered several notable “step backs” (see chap. V). These were associated
with the domestic crisis that erupted in 1981-82 with unusual virulence and spread to practically
all sectors and groups in the domestic economy. During 1982, GDP and manufacturing output
fell by 14 and 21%, respectively; construction was cut by one-half, and open unemployment was
affecting one of every three workers in 1983.
The problems developing in the productive apparatus were closely linked to the
functioning of the financial system and the indiscriminate trade opening. The model conceded a
leading role to the financial reform. In fact, the financial system was transformed into the
dominant decision-making center in the Chilean economy. In 1982, it became clear that
indebtedness of firms and individuals was strangling economic activity and was growing rapidly
owing to the prevailing high interest rates, while the revenue of enterprises was declining as a
result of the domestic recession. The domestic financial reform and the opening to capital flows
constituted at first a determinant factor in the concentration of wealth and in the crowding-out of
productive investment. Then, toward the end of the period, it revealed the additional
vulnerability that it had introduced into the national economy and the distortion of economic
development created by the unbridled financierism to which it gave rise.
The results observed were actually the result of both intrinsic features of the model and
errors in its implementation. For example, the freezing of the exchange rate at thirty-nine pesos
per dollar is not an intrinsic element of the model, which was consistent with a more devalued
fixed rate and/or a free rate.30
However, given the model, the absence of an appreciated exchange
rate would have prevented the reduction in inflation achieved in 1981, and this was the priority
of the economic team when the exchange rate was frozen in 1979.
The intrinsic components of the model are observable in three areas, which form the
pillars of orthodox neo-liberalism (see Ffrench-Davis, 2005a, chap. II). These are the assumption
30 Evidently, with a free exchange rate the appreciation would have been even higher, which would have led to a worse crisis. See Harberger (1985) for a similar argument.
26
(i) that privatization and the suppression of state intervention rapidly result in integrated,
flexible, and well-informed markets, and spontaneously generate dynamic development; (ii) that
adjustment processes are stabilizing and characteristically speedy; and (iii) that “competition”,
even among unequal competitors, leads to greater well-being for the majority. All three
assumptions proved to be false in the Chilean experiment.
First, the indirect and “neutral” economic policies were introduced in a context of
“competition” between unequals, which intensified the differences. Furthermore, the neutrality
was broken in several decisive instances, so that institutions such as the cooperatives and a
semipublic system of savings (SINAP) were discriminated against. The restraint on union
activity accentuated the inequality between “suppliers” and “demanders”. As has been shown,
The concentration of income and wealth was dramatic. Second, the slowness of adjustment
processes involves substantial costs because of the inefficient underutilization of resources and
the disincentive it implies for capital formation. The neoliberal approach fails to take into
account the fact that to reach the long-term objective it is necessary to go through a succession of
short-term effects that influence the final outcome and the quality of the transition (the so-called
hysteresis in modern literature). Third, although a mistaken interventionism also severely
accentuates the structural segmentation and heterogeneity of markets, the extreme alternative
option, consisting of a passive state and the indiscriminate privatization of the means of
production as fast as possible, disregarding the conjuncture and balance of benefits and costs,
does not lead to the rapid integration and flexibility of markets (these failures are characteristic
of underdevelopment). The solution to these failures demands an active state that is subject to
strict norms of efficiency and accountability.
In summary, the neoliberal experiment produced a society with increased inequality on
many fronts and a predominance of financieristic economicism over other human activities. Its
lack of understanding of the strong structural heterogeneity existing in the economy was a severe
obstacle for the essential task of completing markets. As a consequence, a highly productive
segment coexisted with large impoverished segments of the economy. It markedly deepened the
unemployment problem, discouraged investment, and in general favored speculative and
financieristic trends at expense of other activities likely to increase overall productivity and
capital formation. Finally, it intensified external vulnerability, as attested by the greater impact of
the 1982 recession on the Chilean economy compared to the rest of Latin America.

27
References Agosin, M. R. (1998), “Capital inflows and investment performance: Chile in the 1990s”, in
Ffrench-Davis and Reisen (1998). Arellano, J. P. (1985), Políticas sociales y desarrollo, 1924-84, Ediciones CIEPLAN, Santiago. and R. Cortázar (1982), “Del milagro a la crisis: algunas reflexiones sobre el momento
económico”, Colección Estudios CIEPLAN 8, July. Bande, J. and R. Ffrench-Davis (1989), “Copper Policies and the Chilean Economy: 1973-88”,
Notas Técnicas CIEPLAN 131, June; and Institute for Developing Economies, Tokyo. Bitar, S. (1979), Transición, socialismo y democracia: la experiencia chilena, Siglo XXI, México. Brunner, J. J. (1981), La cultura autoritaria en Chile, FLACSO, Santiago. Cabezas, M. (1988), “Revisión metodológica y estadística del gasto social en Chile: 1970-86”,
Notas Técnicas CIEPLAN 114, May. Campero, G. and J. Valenzuela (1981), “El movimiento sindical chileno en el capitalismo
autoritario”, ILT-Academia de Humanismo Cristiano/IPET, Santiago, December. Corbo, V. (1985), “Reforms and macroeconomic adjustments in Chile during 1974-84”, in V.
Corbo and J. de Melo, eds., Liberalization with Stabilization in the Southern Cone of Latin America, World Development, vol. 13, Nº 8, August.
Cortázar, R. (1983), “Chile: resultados distributivos, 1973-82”, Notas Técnicas CIEPLAN 57, June. and J. Marshall (1980), “Indice de precios al consumidor en Chile: 1970-78”, Colección
Estudios CIEPLAN 4, November. Dahse, F. (1979), Mapa de la extrema riqueza. Los grupos económicos y el proceso de
concentración de capitales, Editorial Aconcagua, Santiago. (1982), “El poder de los grupos económicos nacionales”, mimeo, Santiago, June. DIPRES (1978), Somos realmente independientes gracias al esfuerzo de todos los chilenos,
Ministerio de Hacienda, Santiago. ECLAC (1998), Policies to Improve Linkages with the Global Economy, 1995; second updated
edition published in Spanish by Fondo de Cultura Económica, Santiago. Ffrench-Davis, R. (1973), Políticas económicas en Chile: 1952-70, Ediciones Nueva Universidad,
Santiago.
28
(1979), “Exports and industrialization in an orthodox model: Chile, 1973-78”, CEPAL
Review N° 9, December. (2000), Reforming the Reforms in Latin America: Macroeconomics, Trade, Finance,
Macmillan Press, London; and St. Martin’s Press, New York. and D. Raczynski (1990), “The impact of global recession and national policies on living
standards: Chile, 1973-89”, Notas Técnicas CIEPLAN 97, third edition, Santiago, November.
and H. Reisen (1998), eds., Capital Flows and Investment Performance: Lessons from
Latin America, OECD Development Centre/ECLAC, Paris. Foxley, A. (1980), “Hacia una economía de libre mercado: Chile 1974-78”, Colección Estudios
CIEPLAN 4. (1983), Latin American Experiments in Neoconservative Economics, University of California
Press, Berkeley. , E. Aninat and J. P. Arellano (1980), Las desigualdades económicas y la acción del Estado,
Fondo de Cultura Económica, México. Harberger, A. (1985), “Observations on the Chilean economy, 1973-83”, Economic Development
and Cultural Change 33, April. Jadresic, E. (1986), “Evolución del empleo y desempleo en Chile: 1970-85, Series anuales y
trimestrales”, Colección Estudios CIEPLAN 20, Santiago, December. Lahera, E. (1981), “The transnational corporation in the Chilean economy”, CEPAL Review N°14,
August. Marcel, M. (1989), “Privatización y finanzas públicas: el caso de Chile, 1985-88”, Colección
Estudios CIEPLAN 26, Santiago, June. and P. Meller (1986), “Empalme de las cuentas nacionales de Chile, 1960-85: métodos
alternativos y resultados”, Colección Estudios CIEPLAN 20, Santiago, December. Marshall, J. (1981), “El gasto público en Chile: 1969-1979”, Colección Estudios CIEPLAN 5, July. Monckeberg, F. (1998), Jaque al Subdesarrollo Ahora, Dolmen Ediciones, Santiago. Moulián, T. and P. Vergara (1979), “Coyuntura económica y reacciones sociales: las fases de la
política económica en Chile, 1973-78”, Apuntes CIEPLAN 22, November.

29
and (1980), “Estado, ideología y políticas económicas en Chile: 1973-78”, Colección Estudios CIEPLAN 3, June.
Ortega, E. (1987), Transformaciones agrarias y campesinado: de la participación a la exclusión,
CIEPLAN, Santiago. Raczynski, D. and C. Oyarzo (1981), “¿Por qué cae la tasa de mortalidad infantil en Chile?”,
Colección Estudios CIEPLAN 6, December. Ramos, J. (1975), “El costo social: hechos e interpretaciones”, Estudios de Economía, Santiago,
second semester. (1986), Neoconservative Economics in the Southern Cone of Latin America, 1973-83,
Johns Hopkins University Press, Baltimore. Ruiz-Tagle, J. (1979), “Seis años de política social: una revolución en marcha”, Revista Mensaje N°
282. (1980), “Desarticulación de la educación”, Revista Mensaje N° 291. (1981), “Reformas en la educación superior”, Revista Mensaje N° 297. Tironi, E. and J. Barría (1978), “La Disputada: de la Enami a la Exxon”, Revista Mensaje N° 271. Vergara, P. (1981), “Las transformaciones de las funciones económicas del Estado de Chile bajo el
régimen militar”, Colección Estudios CIEPLAN 5, July. Vignolo, C. (1980), “Inversión extranjera en Chile, 1974-79”, Revista Mensaje N° 286. (1982), “El cobre en el desarrollo nacional: evolución reciente, perspectivas y estrategias”,
Centro de Estudios del Desarrollo, Santiago, August. Zahler, R. (1980), “Monetary and real repercusions of financial opening–up to the exterior: the case
of Chile, 1975-78”, CEPAL Review N° 10, April. Zañartu, M. (1980), “Gasto social en los pobres”, Revista Mensaje N° 290.
30
1975-80 1975-81 1975-80 1975-81(1) (2) (3) (4)
1. Gross domestic product 3.8 4.0 2.3 2.52. Gross national product 3.4 3.5 1.9 2.03. Value added
a) Marketing of imports 15.5 16.2 13.8 14.5b) Financial services 14.6 14.2 12.9 12.5
4.1.9 1.8 0.4 0.3
Table II.1Evolution of GDP and its composition, 1975-81
(annual rates of growth)
Total Per capita
Gross national product excludingvalue added in 3.
Source: Calculations based on official figures of Cuentas Nacionales de Chile, 1960-81, in pesos of 1977. Revised figures by Marcel and Meller (1986) give GDP growth of 2.6% for 1975-81, and not the official 4.0%; the main correction was placed in the industrial sector (here included in line 4). There are no disaggregated corrected figures in order to build a revised table.
Average Average Average Average Open PEM Totalwage pension family PEM income
allowance (%)(1) (2) (3) (4) (5) (6) (7)
1970 100.0 100.0 100.0 -- 5.9 -- 5.91974 64.8 51.3 69.5 -- 9.1 -- 9.11976 65.0 52.3 61.8 80.5 16.6 5.2 21.91978 75.0 62.1 56.0 45.5 13.8 4.2 18.01980 89.0 74.3 54.4 37.6 11.7 5.2 16.91981 96.8 78.0 54.0 32.1 10.4 4.7 15.1
1974-81 75.7 61.9 59.3 48.8a 13.0 4.8a 16.8
Table II.2Income and unemployment indicators, 1970-81
Incomes (1970=100) Unemployment (%)
Sources: INE, General wage index for column (1); Arellano (1985) for column (2); Cortázar (1983) for column (3), which is a weighted average of all family allowances. Column (4) indicates the net income of PEM (Minimum Employment Program) workers as a percentage of the minimum wage of 1970. All figures in current pesos have been deflated by the corrected CPI (Cortázar and Marshall, 1980) up to 1978, and by the official index for the later years. Columns (5) and (7) are based on Jadresic (1986). a Average for 1976-81.