THE MIXOLAB PROFILER
33
- A White Paper - Arnaud DUBAT, Jayne BOCK THE MIXOLAB PROFILER Good practices in the milling and baking industries and mistakes to avoid.
Transcript of THE MIXOLAB PROFILER

- A White Paper -Arnaud DUBAT, Jayne BOCK
THE MIXOL AB PROFILERGood practices in the milling and baking industries and mistakes to avoid.
CHOPIN Technologies - THE MIXOLAB PROFILER - 2
1. WHAT IS THE PROFILER ?.............................................................5a. Profiler genesis and objectives................................................................................5b. Profiler description........................................................................................................6
i. The Absorption Index....................................................................................7ii. The Mixing Index..............................................................................................7iii. The Gluten+ Index............................................................................................8iv. The Viscosity Index..............................................................................................9v. The Amylase Index.............................................................................................10vi. The Retrogradation Index.................................................................................11
2. HOW TO USE THE PROFILER ?....................................................15a. How to create a new Profile ?..........................................................................15b. How to use an existing Profile ?.........................................................................17c. Adapting the Profile over time..............................................................................20
3. DIFFERENT INTERFACES: DIFFERENT PROFILERS............................22a. The baker/miller interface...........................................................................................22b. Best strategic use of the Profiler for Millers....................................................25
4. GOOD USES and BAD USES OF THE PROFILER..............................29a. Good uses..................................................................................................................29b. Bad Uses.....................................................................................................................29
5. CONCLUSION............................................................................32
INDEX............................................................................33
S U M M A R Y
3 - THE MIXOLAB PROFILER - CHOPIN Technologies
M I X I N G
A B S O R P T I O N
R E T R O G R A D AT I O N
A M Y L A S E
V I S C O S I T Y
G L U T E N +

CHOPIN Technologies - THE MIXOLAB PROFILER - 4
a. Profiler genesis and objectives
The Profiler is a tool specifically developed for quality control purposes and conceived to simplify the reading and communication of the extensive information obtained from a standard Mixolab test. Developed in 2012, the Profiler is a solution for Mixolab users who only want to know if a flour is “good” or “bad”. It is not a research tool, nor is it a tool for improving or correcting potential flour deficiencies (this is done using the raw curve measurements), but it is a unique translator that converts complex technical/scientific information into simple quality indices.
These indices were determined by the CHOPIN Technologies Application Laboratory based on an analysis of more than 500 flours samples collected from all around the world in order to capture the maximum variation in quality.
Different appropriate curve indicators have been selected (including the characteristic torques C1-C5) and mathematical models1 have been developed to present them under the form of a single number, an index, ranging from “0” to “9”.
When a test is performed, 6 indices are automatically calculated by the Mixolab Profiler tool:
• Absorption • Mixing
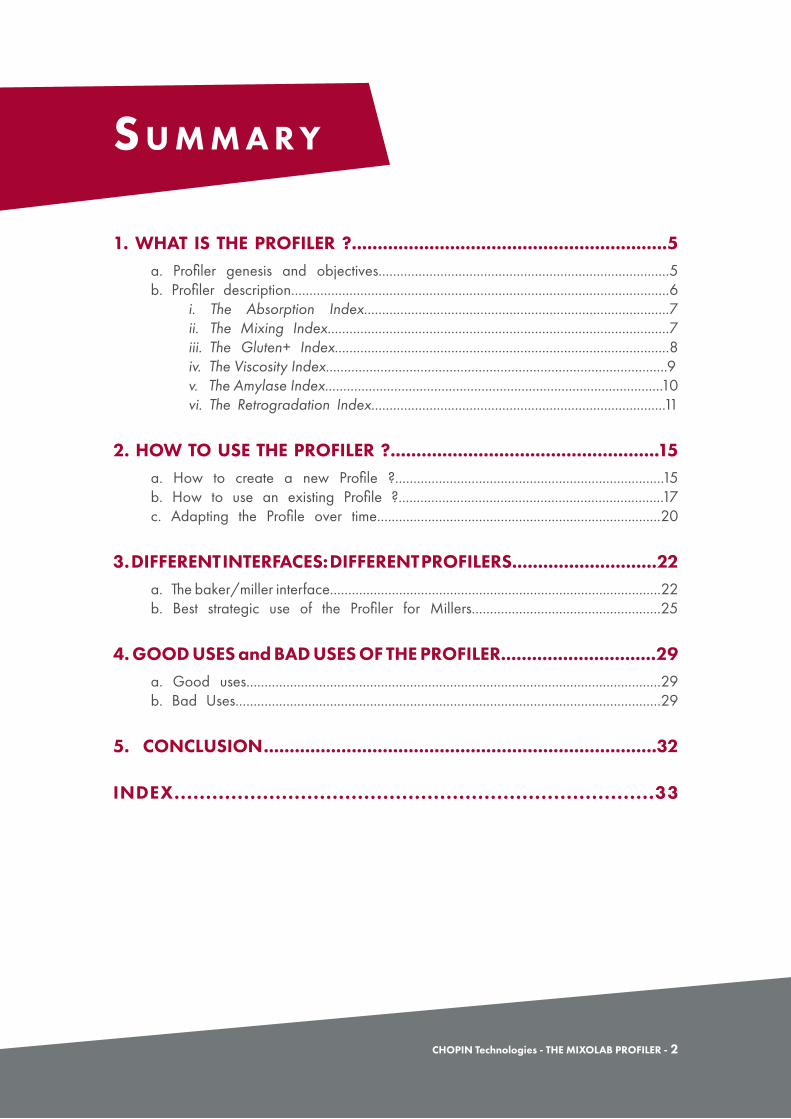
In order to offer users a visual rendering of the indices, the results are reported on a 6 axes graph that many users refer to as the “the spider web”.
When properly used, the Profiler has proven to be a very efficient tool for ensuring consistency. Nevertheless, there are also, unfortunately, cases where the Profiler is used for purposes outside of its scope. This has the potential to be strongly misleading. This document aims to clarify good practices for working with the Mixolab.
• Gluten+• Viscosity
• Amylase• Retrogradation
1 These formulas remain proprietary CHOPIN Technologies properties.
1. WHAT IS THE PROFILER?
5 - THE MIXOLAB PROFILER - CHOPIN Technologies
Understanding the 6 Profiler indices is critical to its proper use as well as the ability to fully harness its potential as a QC tool. The following is a brief explanation of each Profiler index.
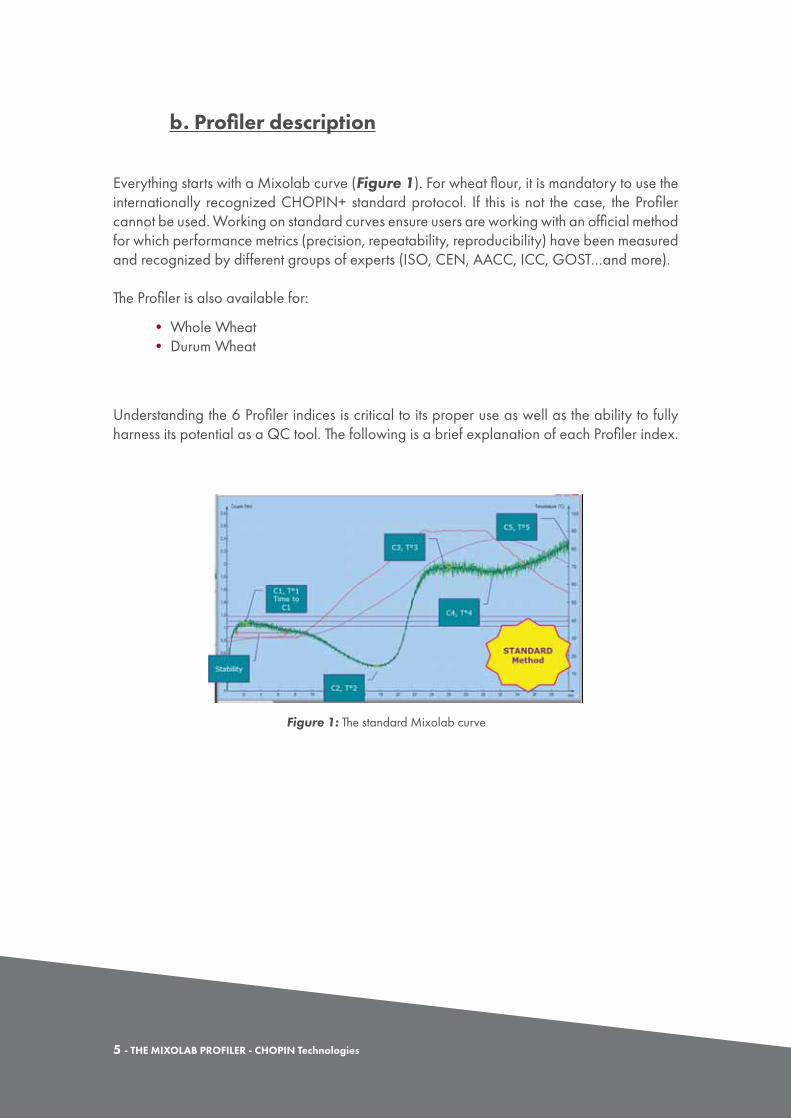
Figure 1: The standard Mixolab curve
b. Profiler description
Everything starts with a Mixolab curve (Figure 1). For wheat flour, it is mandatory to use the internationally recognized CHOPIN+ standard protocol. If this is not the case, the Profiler cannot be used. Working on standard curves ensure users are working with an official method for which performance metrics (precision, repeatability, reproducibility) have been measured and recognized by different groups of experts (ISO, CEN, AACC, ICC, GOST…and more).
The Profiler is also available for:
• Whole Wheat• Durum Wheat
CHOPIN Technologies - THE MIXOLAB PROFILER - 6
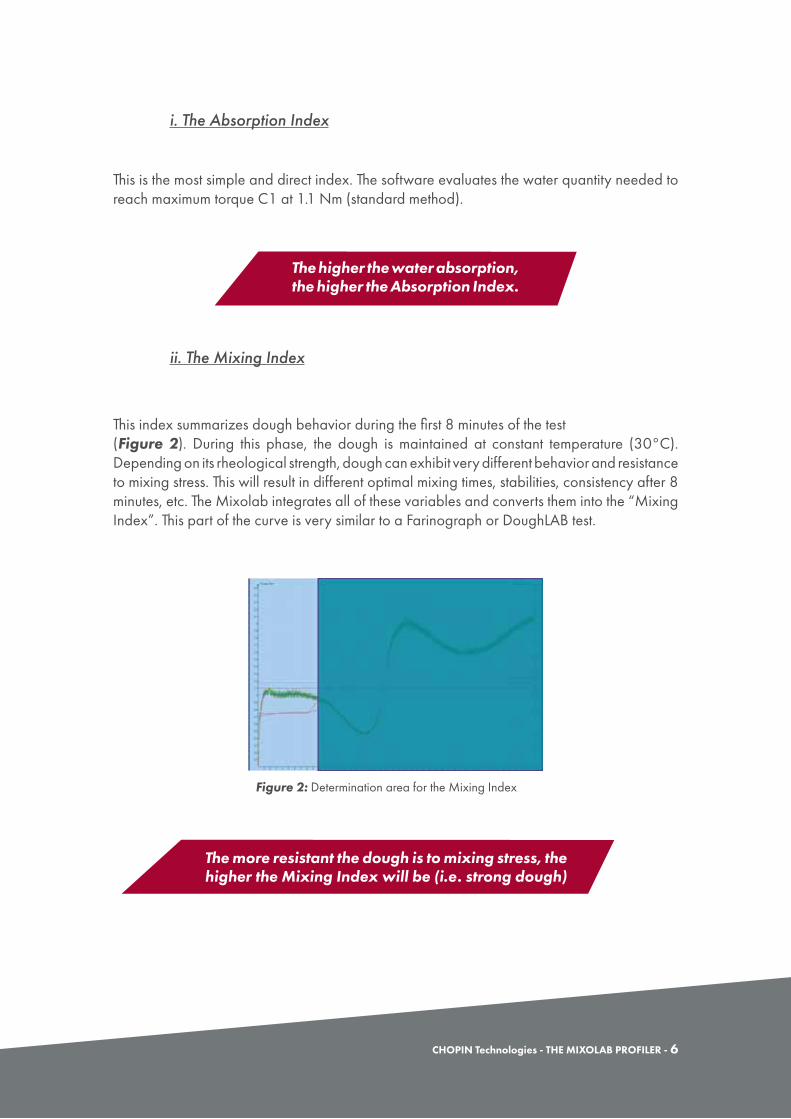
Figure 2: Determination area for the Mixing Index
ii. The Mixing Index
This index summarizes dough behavior during the first 8 minutes of the test (Figure 2). During this phase, the dough is maintained at constant temperature (30°C). Depending on its rheological strength, dough can exhibit very different behavior and resistance to mixing stress. This will result in different optimal mixing times, stabilities, consistency after 8 minutes, etc. The Mixolab integrates all of these variables and converts them into the “Mixing Index”. This part of the curve is very similar to a Farinograph or DoughLAB test.
i. The Absorption Index
This is the most simple and direct index. The software evaluates the water quantity needed to reach maximum torque C1 at 1.1 Nm (standard method).
The higher the water absorption,the higher the Absorption Index.
The more resistant the dough is to mixing stress, the higher the Mixing Index will be (i.e. strong dough)

7 - THE MIXOLAB PROFILER - CHOPIN Technologies
iii. The Gluten+ Index
The Gluten+ Index is calculated from the point when the Mixolab starts heating the dough (Cs at 8 minutes) and the point when C2 is reached (Figure 3).
During this phase, the dough is subjected to 2 concurrent stresses: continued mixing (mechanical stress) and a temperature increase (30 60°C; thermal stress). The decrease in the slope is the resulting effect of the heat-induced weakening of gluten proteins. The phenomenon is thermo-reversible and is predicated solely on the protein as starch gelatinization has not yet commenced.
This provides the user with gluten strength information beyond basic mixing properties and is the reason the index is named Gluten+. Nevertheless, it must be emphasized that the gluten behavior observed during this phase is totally different from other tests such as the Glutomatic Gluten Index, Farinograph or Alveograph as these devices test the gluten under “cold” conditions (~20-30°C).
The Mixolab analyzes the overall behavior of the dough during this phase (torques, slope, etc.).
Figure 3: Determination area for the Gluten+ Index
The greater the drop between Cs and C2, the lower the Gluten+ Index (less stability to heating).
CHOPIN Technologies - THE MIXOLAB PROFILER - 8
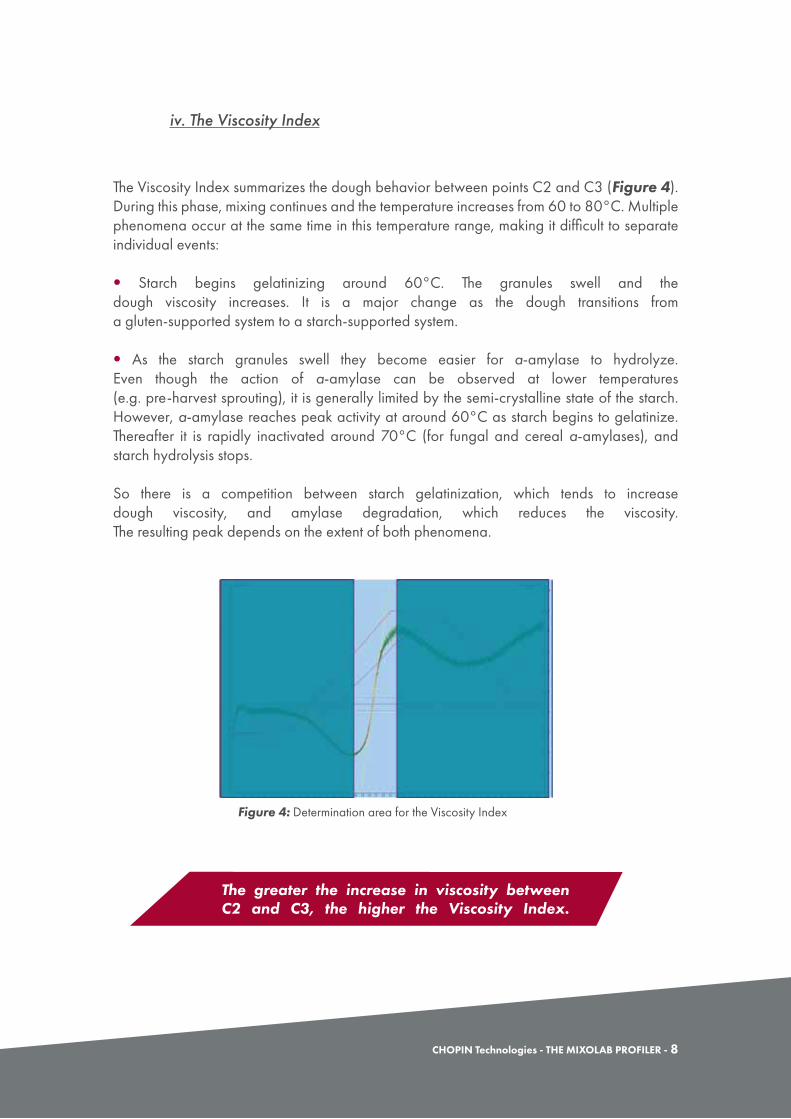
iv. The Viscosity Index
The Viscosity Index summarizes the dough behavior between points C2 and C3 (Figure 4). During this phase, mixing continues and the temperature increases from 60 to 80°C. Multiple phenomena occur at the same time in this temperature range, making it difficult to separate individual events:
• Starch begins gelatinizing around 60°C. The granules swell and the dough viscosity increases. It is a major change as the dough transitions from a gluten-supported system to a starch-supported system.
• As the starch granules swell they become easier for a-amylase to hydrolyze. Even though the action of a-amylase can be observed at lower temperatures (e.g. pre-harvest sprouting), it is generally limited by the semi-crystalline state of the starch. However, a-amylase reaches peak activity at around 60°C as starch begins to gelatinize. Thereafter it is rapidly inactivated around 70°C (for fungal and cereal a-amylases), and starch hydrolysis stops.
So there is a competition between starch gelatinization, which tends to increase dough viscosity, and amylase degradation, which reduces the viscosity. The resulting peak depends on the extent of both phenomena.
Figure 4: Determination area for the Viscosity Index
The greater the increase in viscosity between C2 and C3, the higher the Viscosity Index.
9 - THE MIXOLAB PROFILER - CHOPIN Technologies
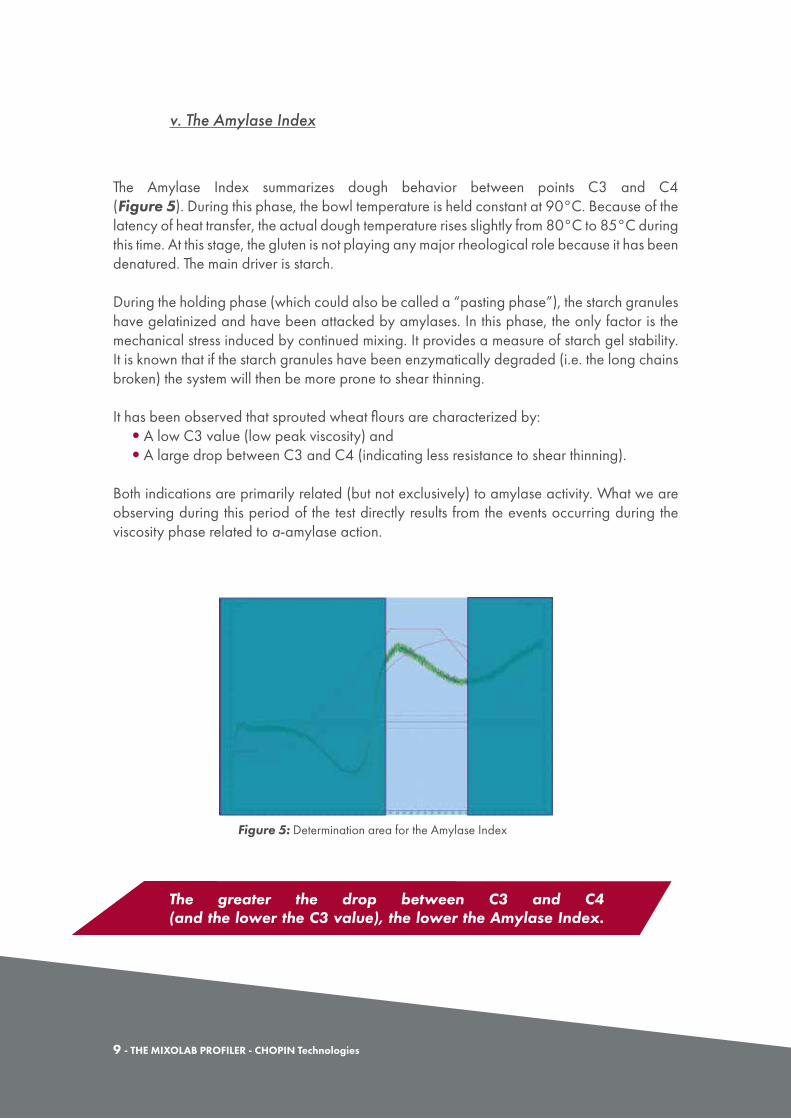
v. The Amylase Index
The Amylase Index summarizes dough behavior between points C3 and C4 (Figure 5). During this phase, the bowl temperature is held constant at 90°C. Because of the latency of heat transfer, the actual dough temperature rises slightly from 80°C to 85°C during this time. At this stage, the gluten is not playing any major rheological role because it has been denatured. The main driver is starch. During the holding phase (which could also be called a “pasting phase”), the starch granules have gelatinized and have been attacked by amylases. In this phase, the only factor is the mechanical stress induced by continued mixing. It provides a measure of starch gel stability. It is known that if the starch granules have been enzymatically degraded (i.e. the long chains broken) the system will then be more prone to shear thinning.
It has been observed that sprouted wheat flours are characterized by:• A low C3 value (low peak viscosity) and• A large drop between C3 and C4 (indicating less resistance to shear thinning).
Both indications are primarily related (but not exclusively) to amylase activity. What we are observing during this period of the test directly results from the events occurring during the viscosity phase related to a-amylase action.
Figure 5: Determination area for the Amylase Index
The greater the drop between C3 and C4 (and the lower the C3 value), the lower the Amylase Index.

CHOPIN Technologies - THE MIXOLAB PROFILER - 10
vi. The Retrogradation Index
The Retrogradation Index summarizes dough behavior between points C4 and C5 (Figure 6). During this phase, the dough is cooled to reach a temperature of ~60°C. As soon as the cooling process starts, we can observe an increase in the dough consistency.
We know from the literature that when gelatinized starch is cooled down, the swollen and/or disrupted starch granules and molecules tend to rapidly re-form a crystalline structure. This mechanism is known as starch retrogradation and is directly related to product shelf life.
Of course, retrogradation is a long process, otherwise all bread would stale very rapidly. Of the two main starch components (i.e. amylose and amylopectin), it is generally agreed that recrystallization of amylose occurs rapidly after cooling of gelatinized starch, while amylopectin recrystallization is a considerably slower process.
In this phase, we observe the initial stage of amylose retrogradation, which is a good indicator of overall starch recrystallization (for wheat within the standard range of amylose/amylopectin ratios).
Figure 6: Determination area for the Retrogradation Index
The greater the increase between C4 and C5, the higher the Retrogradation Index.

11 - THE MIXOLAB PROFILER - CHOPIN Technologies
Figure 7: The complete Mixolab curve and its associated Profiler chart
The Amylase Index summarizes dough behavior between points C3 and C4 Figure 7 shows the result of a standard Chopin+ test using the Profiler. It gives users a simplified interpretation of the standard Mixolab curve.
In this example:
• Absorption Index is high (7)• Mixing Index is average (5)• Gluten+ Index is average (5)
Even if the temptation is great, these indices are not made to analyze the curve and draw direct conclusions. For instance, it is not designed to predict or estimate what the Hagberg value of this flour would be based on the Amylase Index. Other tools exist within the Mixolab software for performing these tasks. The Profiler is only designed to convert a curve into a series of numbers for expedited QC screening.
• Viscosity Index is high (8)• Amylase Index is high (7)• Retrogradation Index is high (7)
The Profiler quickly describes a Mixolab curve using only 6 indices. It greatly simplifies a QC operator’s routine.

CHOPIN Technologies - THE MIXOLAB PROFILER - 12
Figure 8: Examples of different Profiles for different products

13 - THE MIXOLAB PROFILER - CHOPIN Technologies
Figure 8 shows examples of different “ideal” Profiles (green areas) for different products.
Some observations from these examples are:
• It is clear that different products have different Profiles.
• Although not shown here, there is evidence that the same product processed in different plants will also require different Profiles.
• For certain products the “ideal” Profile is not a fixed number but an area. This makes sense as it is well known that all processes have tolerances. The Profiler includes, and shows, this tolerance.
The Profiler introduces a powerful tool for improving quality control routines by:
• Simplifying the interpretation of a curve rich in information.
• Setting the acceptance limits based on a “what works” observation rather than on figures not necessarily related to actual process needs.
Let’s now take a look at how the Profiler works in practice.

CHOPIN Technologies - THE MIXOLAB PROFILER - 14
a. How to create a new Profile?
Creating a Profile is extremely easy, it only consists of analyzing 20 (or more, 20 is a minimum) “good” flours (i.e. well performing flours) for the product and processing line in question.
What is a good flour?
It is a flour that runs through the process without difficulty and that yields the desired final product characteristics.
How can I know if a flour is performing well?
By talking to the end user. He knows!
The main idea behind the Profiler is based on the observation that no one except the person baking the flour knows exactly which flour satisfies the demands of the process as well as the final product. So the idea is to work in synergy and analyze flours that satisfy the end user.
When analyzing 20 good flours on the Mixolab with the Profiler, it is likely that the samples will not all have exactly the same characteristics. Yet, they have proven to perform satisfactorily on line. This is logical because a process has tolerances – it requires a consistent flour that fits within a certain range of characteristics as opposed to a flour with the same exact characteristics every time.
By analyzing 20+ flours the Profiler will provide a range of values corresponding to the acceptable variation for good process and product performance. These minimum/maximum values, coming from the observation of what is good for the end user, can easily be identified and introduced in the Mixolab software (Figure 9).
2. HOW TO USE THE PROFILER?

15 - THE MIXOLAB PROFILER - CHOPIN Technologies
Figure 9: Illustration of the acceptance zone on a "spider chart"
Figure 10: Setting the Profiler limits
These data will be represented in a graphical model called the “spider web” by Profiler users. The graph clearly identifies the “ideal zone” (green area) which corresponds to good flour. The assumption is that any new flour fitting the green zone will also correspond to a well performing flour.
The concept of the Profiler is based on real life observations. It creates a customized acceptance zone for a
specific end user/process. The Profiler can then be used to ensure that any new flour fits into the defined area and is thus
suitable for this specific end user/process.
CHOPIN Technologies - THE MIXOLAB PROFILER - 16
b. How to use an existing Profile?
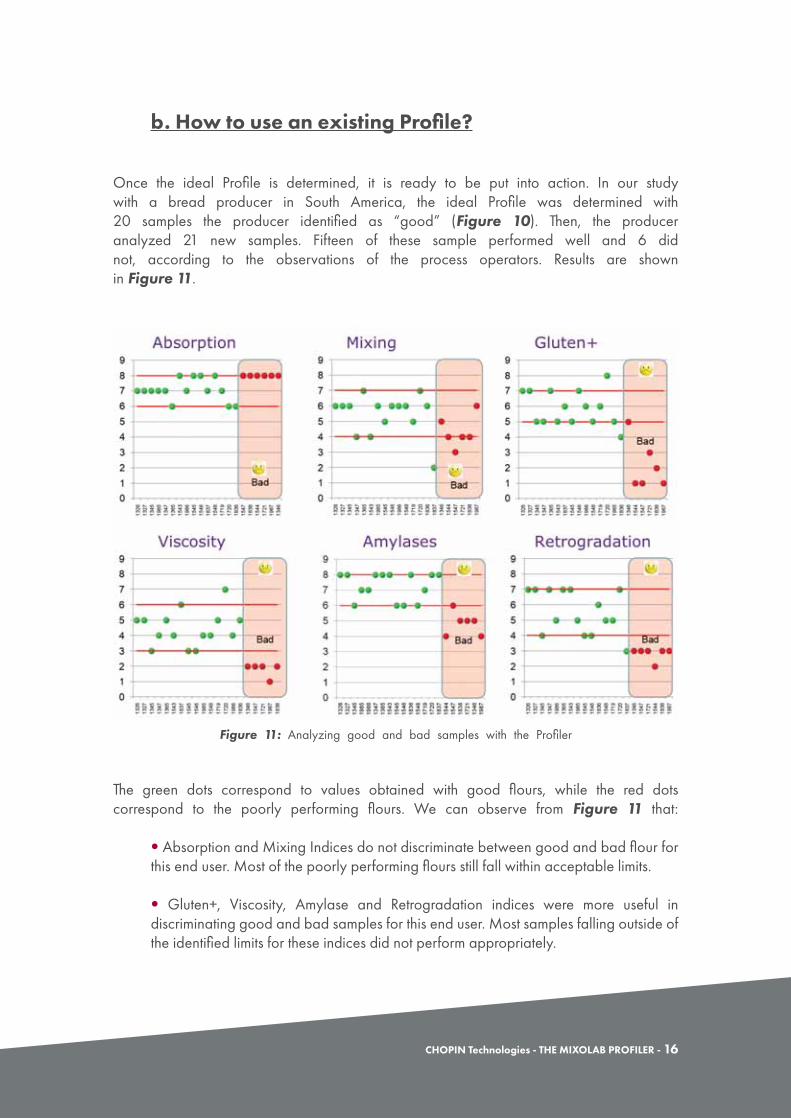
Once the ideal Profile is determined, it is ready to be put into action. In our study with a bread producer in South America, the ideal Profile was determined with 20 samples the producer identified as “good” (Figure 10). Then, the producer analyzed 21 new samples. Fifteen of these sample performed well and 6 did not, according to the observations of the process operators. Results are shown in Figure 11.
The green dots correspond to values obtained with good flours, while the red dots correspond to the poorly performing flours. We can observe from Figure 11 that:
• Absorption and Mixing Indices do not discriminate between good and bad flour for this end user. Most of the poorly performing flours still fall within acceptable limits.
• Gluten+, Viscosity, Amylase and Retrogradation indices were more useful in discriminating good and bad samples for this end user. Most samples falling outside of the identified limits for these indices did not perform appropriately.
Figure 11: Analyzing good and bad samples with the Profiler

17 - THE MIXOLAB PROFILER - CHOPIN Technologies
However, it appears that some good flours show indices that are outside of the limits identified as acceptable. Figure 12 illustrates how to deal with such apparent contradictions.
The sample numbers (N° Ech) in black correspond to the well performing flours, while the numbers in red correspond to the poorly performing samples. For each index the green “IN” means that measured index fits within acceptable limits (the green area determined previously with the “spider web”) whereas the red “OUT” means that the measured index was outside of the acceptable limits.
Figure 12: Setting up comprehensive specification based on process observations
CHOPIN Technologies - THE MIXOLAB PROFILER - 18
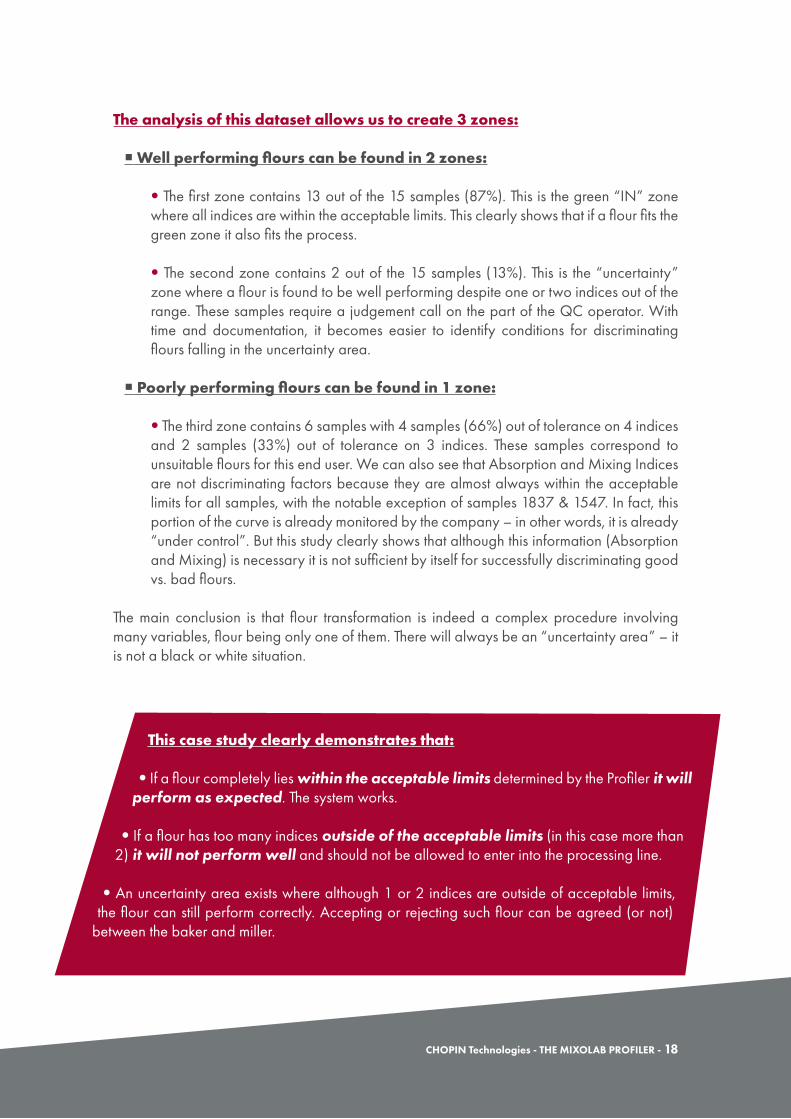
The analysis of this dataset allows us to create 3 zones:
Well performing flours can be found in 2 zones:
• The first zone contains 13 out of the 15 samples (87%). This is the green “IN” zone where all indices are within the acceptable limits. This clearly shows that if a flour fits the green zone it also fits the process.
• The second zone contains 2 out of the 15 samples (13%). This is the “uncertainty” zone where a flour is found to be well performing despite one or two indices out of the range. These samples require a judgement call on the part of the QC operator. With time and documentation, it becomes easier to identify conditions for discriminating flours falling in the uncertainty area.
Poorly performing flours can be found in 1 zone:
• The third zone contains 6 samples with 4 samples (66%) out of tolerance on 4 indices and 2 samples (33%) out of tolerance on 3 indices. These samples correspond to unsuitable flours for this end user. We can also see that Absorption and Mixing Indices are not discriminating factors because they are almost always within the acceptable limits for all samples, with the notable exception of samples 1837 & 1547. In fact, this portion of the curve is already monitored by the company – in other words, it is already “under control”. But this study clearly shows that although this information (Absorption and Mixing) is necessary it is not sufficient by itself for successfully discriminating good vs. bad flours.
The main conclusion is that flour transformation is indeed a complex procedure involving many variables, flour being only one of them. There will always be an “uncertainty area” – it is not a black or white situation.
This case study clearly demonstrates that:
• If a flour completely lies within the acceptable limits determined by the Profiler it will perform as expected. The system works.
• If a flour has too many indices outside of the acceptable limits (in this case more than 2) it will not perform well and should not be allowed to enter into the processing line.
• An uncertainty area exists where although 1 or 2 indices are outside of acceptable limits, the flour can still perform correctly. Accepting or rejecting such flour can be agreed (or not)
between the baker and miller.

19 - THE MIXOLAB PROFILER - CHOPIN Technologies
c. Adapting the Profile over time.
The Profile gives an image of what is good at a certain time. Users have to take into consideration that it is an evolving situation. It is hard to make an exhaustive list of everything that can happen, but we can mention some of the major changes making it mandatory to verify if existing Profiles are still reflective of actual conditions or need to be adapted.
i. New Crop, new flour formulation
Every new crop is a new challenge because it never exhibits the exact same quality as the previous year. Let’s take as an example a new crop showing a low protein content. This will certainly impact different Profile indices such as Absorption and Mixing that are partially influenced by protein quantity. The initial consequence is that if a Profile was created based on a certain wheat quality with higher protein content (see section 4.b) the new wheat will certainly not fit into the existing Profile.
It would therefore make no sense to keep this Profile (except if “good” wheat could be found elsewhere on the market at an acceptable price). The solution will be to correct wheat protein deficiencies with additives such as enzymes, gluten, conditioners, etc. (A more in-depth explanation of this can be found in section 3.a.) The appropriate action for the baker then will be to create a new Profile that is adapted to the new crop and sharing it with the miller.
By doing so, the miller can:
• Check that the quality of the incoming wheat corresponds to the end user’s desired quality requirements.
• Determine the optimum additive mix for correcting any wheat defects.
• Ensure that the final flour (a function of wheat quality + additive mix) is consistently meeting the end user’s requirements.

CHOPIN Technologies - THE MIXOLAB PROFILER - 20
ii. Changes in the baking process
Similarly, any change in the baking process requires an update to the Profile because it will most likely give rise to the need for a different flour.
Let’s take the example of a baker already successfully using a Profile to ensure product consistency. His spiral mixer is getting old and he decides to buy a new mixer and takes this opportunity to implement a continuous mixer. It would not be unexpected that the flour required to fit this new/improved process condition has different quality requirements, rendering the existing Profile obsolete. The new Profile would need to be created in the same way as the obsolete Profile: namely by analyzing 20+ well performing flours for the new process (see section 2.a.).
We would add that the Profile needs to be evaluated every time a change is made on the production line, even if it is “just a replacement” of an existing piece of equipment. A careful follow up of the Profile efficiency is required and, if needed, the Profile should be adapted to reflect the new conditions of the process.
iii. Change in the baking formula or baking ingredients
Changes in processing equipment are not the only ones to have an impact on flour performance. The same applies if there is a change to the formulation.
Let’s take another example of a baker who wants to reduce the amount of salt (sodium chloride) in a formula. This will have an influence on the process and (potentially) the flour required to perform satisfactorily during the process. The same exists when other ingredient changes are made.
For example, it is known that the efficiency of enzymatic reactions depends on the enzyme/substrate selectivity, among other parameters. If an enzyme is changed (different source or activity) and the substrate (flour) remains the same, the resulting product characteristics might be different. This certainly would involve the need to reconsider the associated Profile.

21 - THE MIXOLAB PROFILER - CHOPIN Technologies
a. The baker/miller interface
We have already seen that everything starts from bakery process observations (section 2.a). The aim of the Profiler is to ensure consistency of the process by controlling the consistency of the flour.
Figure 13 illustrates that a consistent product depends at least on:
• The flour consistency.
• The process consistency.
Often when there is an issue with the final product, the tendency is to blame the flour. But is flour always the origin of the problem? Of course not. There are many variables that enter into consideration when problems arise, and the 5M rule illustrates a good approach for taking as many of those variables as possible into consideration.
The 5M rule describes the main areas that need to be kept under control to ensure a satisfactorily functioning process:
Measurement - Improper or poorly chosen measurements
In our case the typical error would be to base final product assessment on improper measurements. For example, measurements such as bread taste or smell will not be easily achievable or relatable to the source flour, whereas measurements such as volume, dimensions, color, etc. can easily be linked back to tangible flour characteristics and actionable corrections.
3. DIFFERENT INTERFACES: DIFFERENT PROFILERS
CONSISTENTFLOUR
CONSISTENTPROCESS
C O N S I S T E N TFINAL PRODUCT
Figure 13: The consistency tryptic

CHOPIN Technologies - THE MIXOLAB PROFILER - 22
Another common mistake is to assess these measurements in empirical ways. Qualifying the color of bread crust as “more or less dark or red” is insufficient. Bread volume is not simply “good or bad” – it must be quantified. Many devices exist today to objectively and precisely measure color, volume, dimension, hardness, crispiness, etc. These tools must be used to determine what a “good product” is instead of subjective measurements.
Machines - Equipment, such as machinery, computers, tools, instruments, technology
As discussed in section 2.c.ii, any change or dysfunction in a device alters the process consistency. Of course, skilled operators are able to make the process work most of the time despite these alterations. But the situation might be that a part of the system changes so gradually that over time it leads to non-satisfactory products. In such a case the Profile will continue defining some flours as “well performing” but the product will not be satisfactory, not because of the flour quality (still consistent) but because the process has evolved.
This also includes changes in temperatures (ambient, water, dough…) or hygrometry that can affect flour/dough performance during the process. Conditions around the process must also be under control.
Methods - Rules, regulations, laws or standards
An example of such a situation was alluded to in section 2.c.III. In the case of mandatory salt reduction, dough characteristics (stickiness, strength, etc.) will be substantially modified. This can be overcome by changing the process, the formulation, or the type of flour required. All of these may create a logical need to change the Profile.
Manpower - Human error, personnel changes
To err is part of the human condition, as well as the genius to fix those errors. The more mechanized a process is the more limited are any human interactions in the process, and this reduces errors. Skilled operators can react and correct an issue online before it is too late. But this means that, especially for those companies operating multiple shifts, all operators must be skilled enough to respect the process and notify the appropriate personnel if any adjustments were made.

23 - THE MIXOLAB PROFILER - CHOPIN Technologies
Materials - Defects or improper material properties
By material we mean ingredients. Let’s take a simplified example of a baker using a basic formula including flour, water, yeast, salt and an enzyme mix.
• Flour: Under control due to use of the Profiler. Its characteristics are consistent and fitted to the process.
• Water: The main variation in water is its temperature with a subsequent concern being its hardness. Both of these can be controlled.
• Yeast: Yeast activity can change depending on age and storage conditions, and this can have a significant impact on product quality (volume, texture, color, etc.). Yeast can be controlled by testing it regularly with a device such as the RheoF4.
• Salt: Sodium chloride quality is well controlled and its influence during processing will be consistent. If salt replacers are to be used, they should be tested to confirm their effect on dough rheology relative to sodium chloride.
• Enzyme Mix: If it is a “ready to use” mix, the user needs to make sure that the quality and mode of action is consistent. This can be easily assessed with the Mixolab (outside of the scope of the Profiler; see section 3.b.).
And if the formula incorporates other ingredients (sugar, fat, eggs, other flours, etc.) it is important to make sure that all these ingredients, which will interact with the flour to give the final product, are also consistent and under control.
This means that, in a perfectly mastered process where everything is under control, the final product consistency will depend almost solely on the incoming flour properties. Under these conditions the relationship between Profile Final Product is more direct. The closer we are to this ideal situation the thinner the “green area” becomes and the more useful the Profile becomes in selecting well performing flours. If the ideal conditions are not met, the primary result will be a wider green area (less discrimination), making it difficult to establish a clear relationship between Profile Final Product.
One of the most critical points is communication between the QC lab and the production line. Too often, unfortunately, relevant information does not flow freely between these two groups. However, there are significant benefits to facilitating lateral communication between the production line and the QC laboratory. Reductions in down time, lost production, rework and overall waste can be achieved when the right information is shared in real time between production and QC.

CHOPIN Technologies - THE MIXOLAB PROFILER - 24
b. Best strategic use of the Profiler for Millers
The miller has the challenging task of sourcing and transforming wheat into flour that will satisfy each customer. Again, a system based on a good communication between the miller and each end user is necessary to define a flour Profile corresponding to well performing flour.
It is important to note that the Profiler that is used to communicate with the baker is based on flour with additives (e.g. enzymes, fortification, etc.).
Figure 14 shows the main points of control (so as not to be confused with HACCP critical control points) that the miller has available to create a flour filling the baker’s requirements.
Good wheat is the basis of good flour. Of course, milling is a very complex process and an experienced miller has many options available to get the best out of a given lot of wheat (blending, tempering, milling, etc.), and, if needed, correct the remaining deficiencies with the use of additives such as enzymes.
Let’s go back to the wheat. The closer the non-corrected flour quality is to the target Profile, the better it is for the baker. Selecting suitable wheat that will produce flour as close as possible to the final target is also cheaper than correcting the flour post-milling with enzymes or other additives.
WHEAT PROCESS ADDTIVESFINAL FLOUR QUALITY
Figure 14: Miller's points of control to ensure flour quality
This is goal for the miller.

25 - THE MIXOLAB PROFILER - CHOPIN Technologies
There is a need to take a pragmatic view of the situation; let’s consider an example to illustrate a logical strategy:
- A perfect “ready to use” flour Profile has been determined courtesy of good communication between the miller and baker. The miller wants to reproduce a flour that fits the Profile again and again to ensure his customer has perfect flour consistency.
- There is a need to understand that this “ready to use” flour depends (at least) on the 3 drivers mentioned in Figure 14:
• The process consistency (the same 5M rules apply to the milling process; see section 3.a).
• The additive/enzyme mix consistency.
• The non-corrected flour consistency.
In an ideal situation, the possibility exists to test the industrially milled flour before adding any additives so that the miller knows how far he is from his target. Figure 15 represents a case where the non-corrected flour (blue line) does not fit in the ideal Profile (green area).
The Profiler proves to be useful here as it clearly shows 2 weaknesses corresponding to:
• A low Absorption Index• A low Mixing Index
Figure 15: Example of a flour not fitting the target Profile
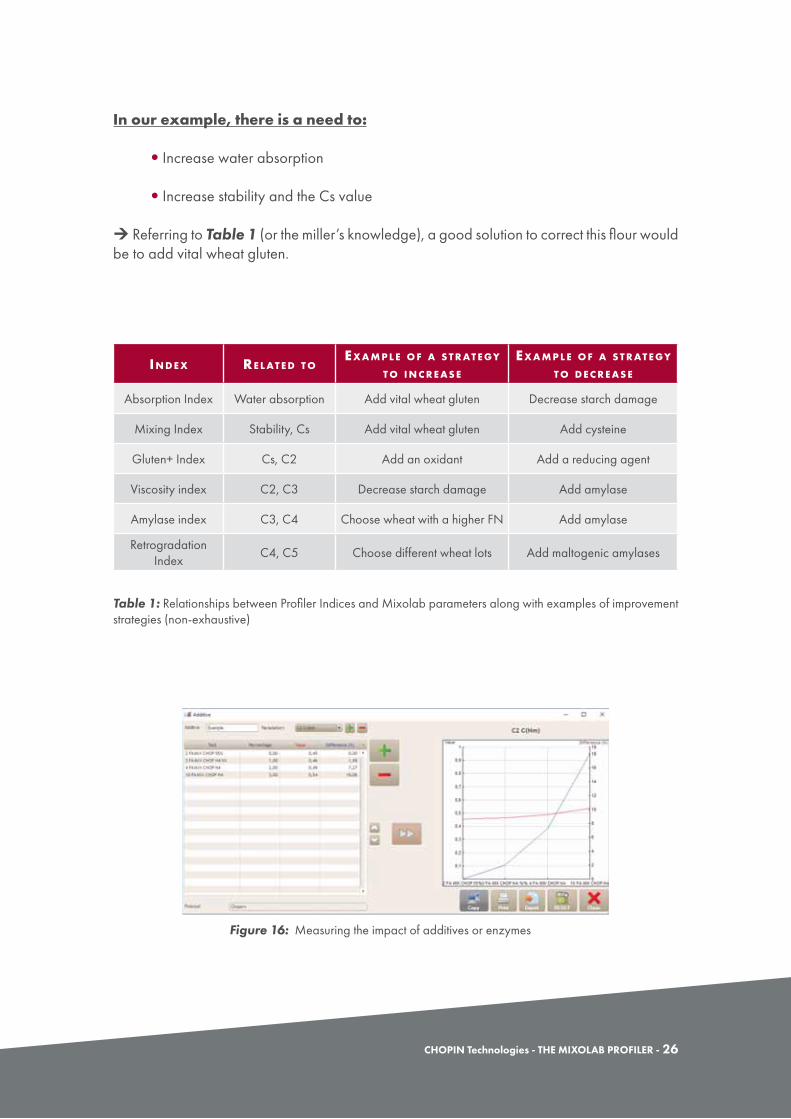
Table 1 shows the relationships between the Profiler Indices and the characteristic points of the standard Mixolab curve. For every action to correct/improve flour, it is strongly advised not to work with the Profiler, but rather to directly use the characteristic points of the original Mixolab curve for the flour in question.
CHOPIN Technologies - THE MIXOLAB PROFILER - 26
In our example, there is a need to:
• Increase water absorption
• Increase stability and the Cs value
Referring to Table 1 (or the miller’s knowledge), a good solution to correct this flour would be to add vital wheat gluten.
I N D E X R E L AT E D T OE X A M P L E O F A S T R AT E GY
T O I N C R E A S E
E X A M P L E O F A S T R AT E GY T O D E C R E A S E
Absorption Index Water absorption Add vital wheat gluten Decrease starch damage
Mixing Index Stability, Cs Add vital wheat gluten Add cysteine
Gluten+ Index Cs, C2 Add an oxidant Add a reducing agent
Viscosity index C2, C3 Decrease starch damage Add amylase
Amylase index C3, C4 Choose wheat with a higher FN Add amylase
Retrogradation Index
C4, C5 Choose different wheat lots Add maltogenic amylases
Table 1: Relationships between Profiler Indices and Mixolab parameters along with examples of improvement strategies (non-exhaustive)
Figure 16: Measuring the impact of additives or enzymes

27 - THE MIXOLAB PROFILER - CHOPIN Technologies
Another strategy is to optimally blend flours (or wheat lots) to achieve a final flour as close as possible to the target. The Mixolab is equipped with a blending tool that calculates the results of a blend of several flours according to selected % (Figure 17).
This creates a “virtual curve”, similar to the example shown in Figure 18, which will be very close to the actual Mixolab curve of the (at this point) virtual flour blend. The virtual curve also allows users to calculate a Profile and make sure the hypothetical flour blend fits the optimal “green zone” before blending ever occurs.
Figure 17: Blending tool - Selection of the 2 flours to blend
Figure 18: Blending tool – Virtual curve of the resulting flour blend
Figure 16 represents the effect of an additive on the C2 value. This built-in feature of the Mixolab allows the user to visualize the impact of the additive on all the characteristic points of the curve and considerably helps operators in deciding on the type and quantity of additives/enzymes to use.

CHOPIN Technologies - THE MIXOLAB PROFILER - 28
a. Good uses
The best use of the Mixolab Profiler is to set specifications between the miller and the baker for “ready to use” flours based on observations of actual flour performance on the end use processing line.
This determines the acceptance limits, and the miller can then produce consistent flour with a commonly agreed upon “green zone” as the target.
b. Bad Uses
For instance, trying to predict final bread volume based on one single index (for instance the Gluten+ Index) starting from the wheat will not work for many reasons including:
• All indices are discrete values (1, 2, 3, 4, 5, 6 or 7) as opposed to a truly continuous scale. The sample will be placed as one value or another, and this dramatically reduces the possibility to extract satisfactory prediction data unless one goes back to the original curve.
• There is no single analytical parameter or index alone that can explain something as complex as e.g. bread volume. Objectively, even if we wanted to simplify the discussion, bread volume depends on flour quality, ingredients and interactions, yeast activity, temperature, times, hygrometry, mixer type, equipment comprising the process, etc. It is impossible for a single parameter to explain such complex interactions.
• It is even more difficult to do this from laboratory milled flour samples because 1/ there is a difference between experimentally milled flour and industrially milled flour, and 2/ testing a flour without additives will not be predictive of its performance with additives.
4. GOOD USES AND BAD USES OF THE PROFILER
Do not use the Profiler for predicting final product attributes.
29 - THE MIXOLAB PROFILER - CHOPIN Technologies
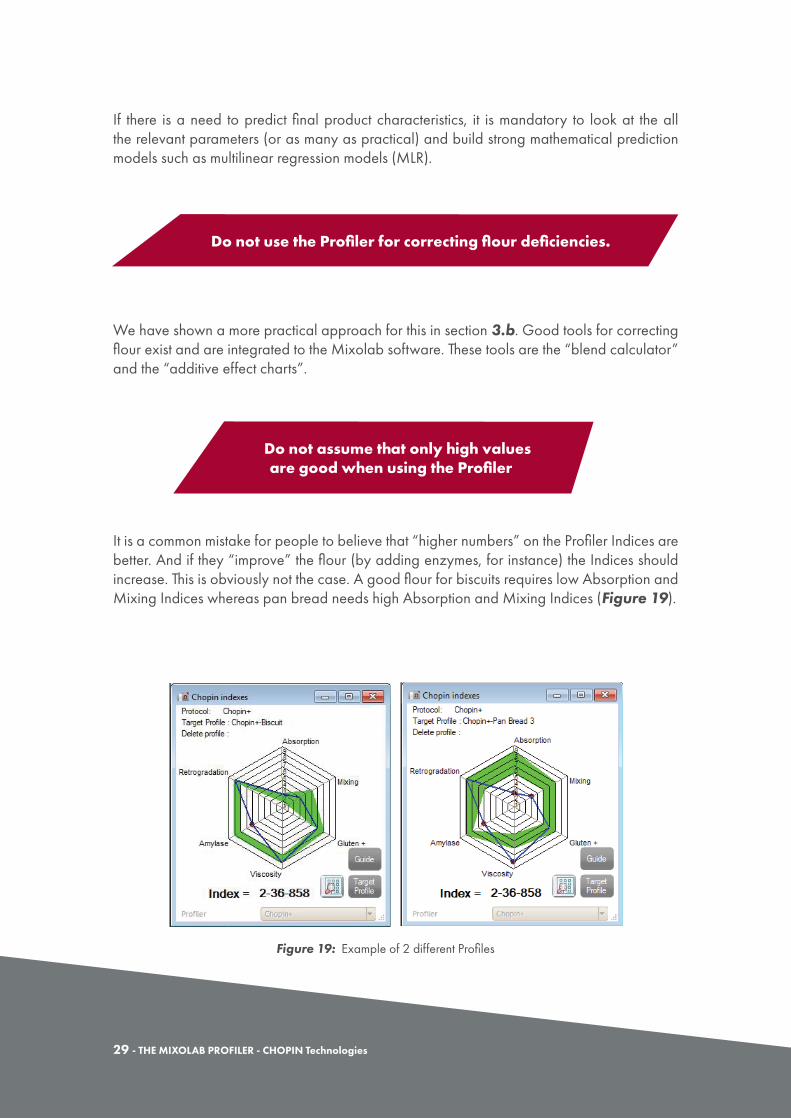
If there is a need to predict final product characteristics, it is mandatory to look at the all the relevant parameters (or as many as practical) and build strong mathematical prediction models such as multilinear regression models (MLR).
We have shown a more practical approach for this in section 3.b. Good tools for correcting flour exist and are integrated to the Mixolab software. These tools are the “blend calculator” and the “additive effect charts”.
It is a common mistake for people to believe that “higher numbers” on the Profiler Indices are better. And if they “improve” the flour (by adding enzymes, for instance) the Indices should increase. This is obviously not the case. A good flour for biscuits requires low Absorption and Mixing Indices whereas pan bread needs high Absorption and Mixing Indices (Figure 19).
Do not use the Profiler for correcting flour deficiencies.
Do not assume that only high values are good when using the Profiler
Figure 19: Example of 2 different Profiles
CHOPIN Technologies - THE MIXOLAB PROFILER - 30
The Mixolab Profile is based on good communication, primarily between the baking process line and the bakery QC lab. If there is no ability to determine internally what a “good” flour is…there is little chance to build an efficient QC program for evaluating flour performance potential before it hits the processing line.
The aim is not to remove expertise from the line but to make sure that the flour quality will be consistent. This yields benefits for the entire company.
Secondly, the communication between miller and baker based on the Profiler must also be seamless. If there are changes on one side or the other, this must be taken into consideration and communicated to the other party.
It might ultimately have no impact, but setting up a comprehensive quality control program requires this level of proactive communication.
Do not use the Profiler if good communication is not in place.
31 - THE MIXOLAB PROFILER - CHOPIN Technologies
The Profiler is a tool designed for quality control at the baker/miller interface. Its concept is based on the observation of “what is good” for the baker. This information allows for the creation of quality acceptance ranges that give the miller a good target to replicate and ensure consistent flour for the end user.
The Profiler breaks the cycle of the “do always” rule where specifications are based on habits more than on real measurement of what works. Because the Profiler is based on the standard Chopin+ Mixolab curve, it includes information concerning gluten quality, starch properties and their interactions, and the Profile Indices can be used to simply QC decisions on acceptable lots of flour.
When properly used, the Profiler is a powerful quality control tool, but it is not a R&D tool. People wanting to improve flour quality or to predict final product characteristics need to use data from the raw Mixolab curves and the integrated features built in the Mixolab software.
5. CONCLUSION
CHOPIN Technologies - THE MIXOLAB PROFILER - 32
I N D E X
Figure 1: The standard Mixolab curve...............................................................................6
Figure 2: Determination area for the Mixing Index.......................................................7
Figure 3: Determination area for the Gluten+ Index....................................................8
Figure 4: Determination area for the Viscosity Index....................................................9
Figure 5: Determination area for the Amylase Index..................................................10
Figure 6: Determination area for the Retrogradation Index........................................11
Figure 7: The complete Mixolab curve and its associated Profiler chart..............12
Figure 8: Examples of different Profiles for different products..................................13
Figure 9: Illustration of the acceptance zone on a "spider chart"........................16
Figure 10: Setting the Profiler limits........................................................................................16
Figure 11: Analyzing good and bad samples with the Profiler......................................17
Figure 12: Setting up comprehensive specification based on process observations.........................................................................................18
Figure 13: The consistency tryptic..........................................................................................22
Figure 14: Miller's points of control to ensure flour quality..............................................25
Figure 15: Example of a flour not fitting the target Profile................................................26
Figure 16: Measuring the impact of additives or enzymes................................................27
Figure 17: Blending tool - Selection of the 2 flours to blend.........................................28
Figure 18: Blending tool – Virtual curve of the resulting flour blend..............................28
Figure 19: Example of 2 different Profiles..............................................................................30

33 - THE MIXOLAB PROFILER - CHOPIN Technologies
20 Avenue Marcellin Berthelot92390 Villeneuve-le-Garenne, FRANCE