The Memphis Model: CHN as Community Investment · The Memphis Model The Memphis Model “maps”...
42
The Memphis Model: CHN as Community Investment Health Services Learning Group Loma Linda Regional Meeting June 28, 2012 Teresa Cutts, Ph.D. Director of Research for Innovation [email protected], 901.516.0593
-
Upload
hoangthien -
Category
Documents
-
view
214 -
download
0
Transcript of The Memphis Model: CHN as Community Investment · The Memphis Model The Memphis Model “maps”...

The Memphis Model: CHN as Community Investment Health Services Learning Group Loma Linda Regional Meeting
June 28, 2012 Teresa Cutts, Ph.D.
Director of Research for Innovation [email protected], 901.516.0593

The Memphis Model The Memphis Model “maps” (aligns and leverages) existing
assets — integrating congregational and community caregiving with traditional healthcare to create a system of health built on webs of trust
• WHAT WE HAVE: • IRHAPian logic and theory; ASSETS:church, faith,
spiritual capacities or RHAs; BLUES; poor and marginalized and INTELLIGENT people; Humble leaders that care and allow for emergent leadership

2005: CEO Gary Shorb brings Rev. Dr. Gunderson Who sees Memphis with Fresh Eyes for Assets
ARHAP

Congregational Health Network
What we Know: How to build, nurture, protect and sustain webs of trust
MLH partners with congregations & community organizations to improve access and health status for all.
Dir. Faith & Community Partnerships, Rev. Bobby Baker

Person-Centered Journey of Health
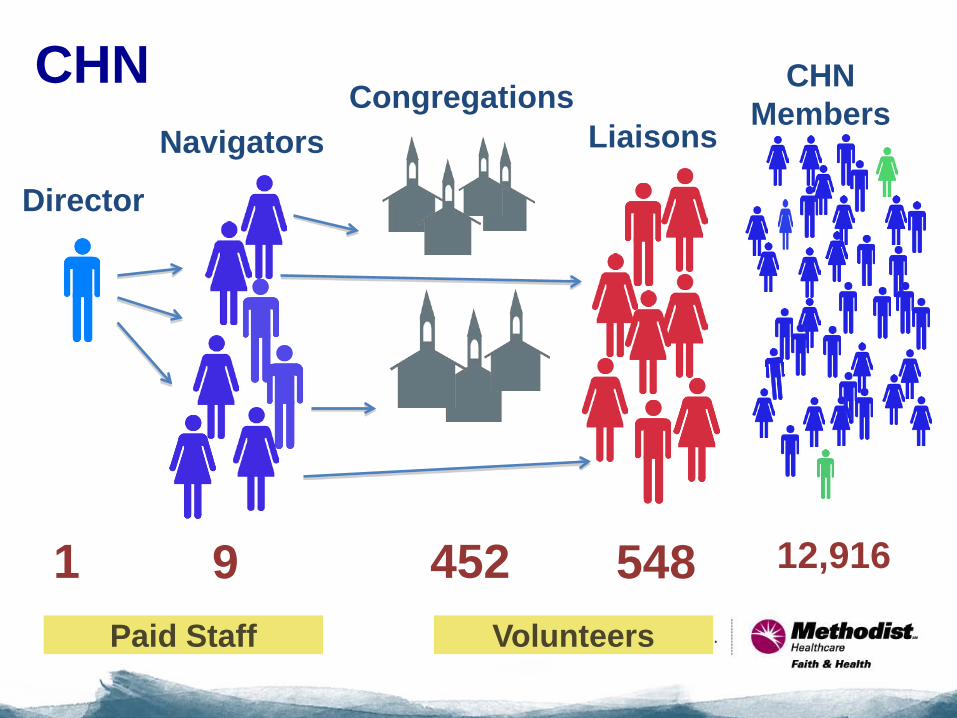
452 9 548 1 12,916
Liaisons Congregations
Navigators
CHN Members
Director
CHN
Paid Staff Volunteers

Memphis Model: What we DO…
Honor blended intelligence, by partnering and co-creating with community/congregations to transform our world and share that with other leaders. DISTINCTIONS:
• Eye for Assets • Build webs of trust (relational vs. hospital-centric)
that supports the person’s journey of health • Grounded on intelligence of the Black Church

Memphis Model: Distinctions in What we Do
• GIS, data, technical and quality hospital initiatives (e.g., prevent re-admissions) support and serve the network’s relational and connectional quality
• Community scale change rather than specific cases of disease intervention
• Community transformation through partnership and open sharing of results — invitation and transparency

Gross Working Hypothesis
CHN as INTERVENTION: (not research per se) • All patients in MLH system receive standard
clinical practice (inpatient care) • CHN members who are patients receive
standard clinical practice (inpatient care) PLUS community caregiving delivered by unpaid, volunteer staff (CHN liaisons)
• Preliminary data was a cross-sectional snapshot at 25 months into the work of CHN
• Concurrent build out and development of CHN, while tracking, determining evaluation/methodology, for ascertaining impact

0
5
10
15
20
25
30
35
40
45
LOS total Readmits
0.00%
0.50%
1.00%
1.50%
2.00%
2.50%
3.00%
Mortality Rate CHN
Non-CHN
CHN vs. Non-CHN Patient Data
LOS-No Differences
Readmits and Mortality
Rates Differ

$0.00$20,000.00$40,000.00$60,000.00$80,000.00
$100,000.00$120,000.00$140,000.00$160,000.00
CHF RenalFailure
Stroke DM OtherCardiac
$0
$5,000,000
$10,000,000
$15,000,000
$20,000,000
$25,000,000
Sum ofCharges
Aggregate savings of charges for the CHN
patients that accrue to both payers and
hospital.
CHN vs. Non-CHN Charges: DRG and Total Sum

SUBSET N=50 Pre-Post Within Subject Cohort Comparison
Hospital Metrics Pre-CHN Post-CHN
Total admissions 159 101
Admits/patient 3.2 2.0
Total readmits 37 17
Readmits/patient 0.74 0.34
Total patient days 1,268 772
Days/admit 8.0 7.6
Days/patient 25.4 15.4
Total charges $6,396,111 $3,740,973
Average charge/admit $40,277 $37,409
Average charge/patient $127,922 $74,819
ER admissions 84.9% 80.2%

Archived Data for CHN and the General Population
•Pulled all MLH patient discharges from October 2005 to December 31, 2011 for archived database
•Compare annually the CHN to total
population
•Develop Predictive Modeling methodology for time to
readmission
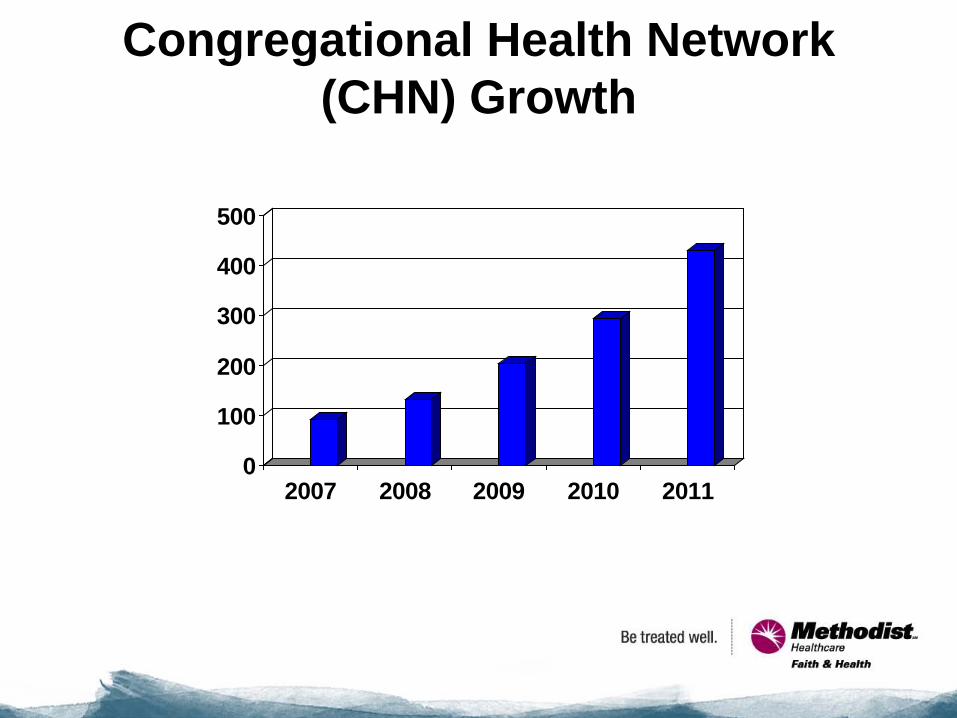
Congregational Health Network (CHN) Growth
0
100
200
300
400
500
2007 2008 2009 2010 2011


CHN Population in 2011 Total Enrolled through EMR=12, 916 Number coming through our system=2306 Gender & Ethnicity • 67% Female; 33% Male • 87% African-American; 11% European-
American; .7% Mixed;.3% Hispanic, <.1% Asian or American Indian
Top Diagnosis: CHF Mean age=58 years; Age over 65: 36%

Of the CHN members admitted between 2008 and 2011, 87% were African-American and 13% were Caucasian.
Race/Ethnicity 2008-2011

Race/Ethnicity, CHN vs General Population (2011)
• General Population • CHN

The majority of CHN members admitted from 2008-2011 were female (66%).
GENDER 2008-2011

Gender, CHN vs General Population (2011)
• General Population • CHN

CHN members admitted to the hospital were significantly older than the general population.
AGE

Medicare Enrollment in CHN and General Population (2008-2011)
• General Population • CHN

Medicare Enrollment in CHN and General
Population (2011) • General Population • CHN

Significantly lower mortality rates, on average, for CHN
vs the general population. [Odds ratio=.78,p=0.04]
Mortality Rate
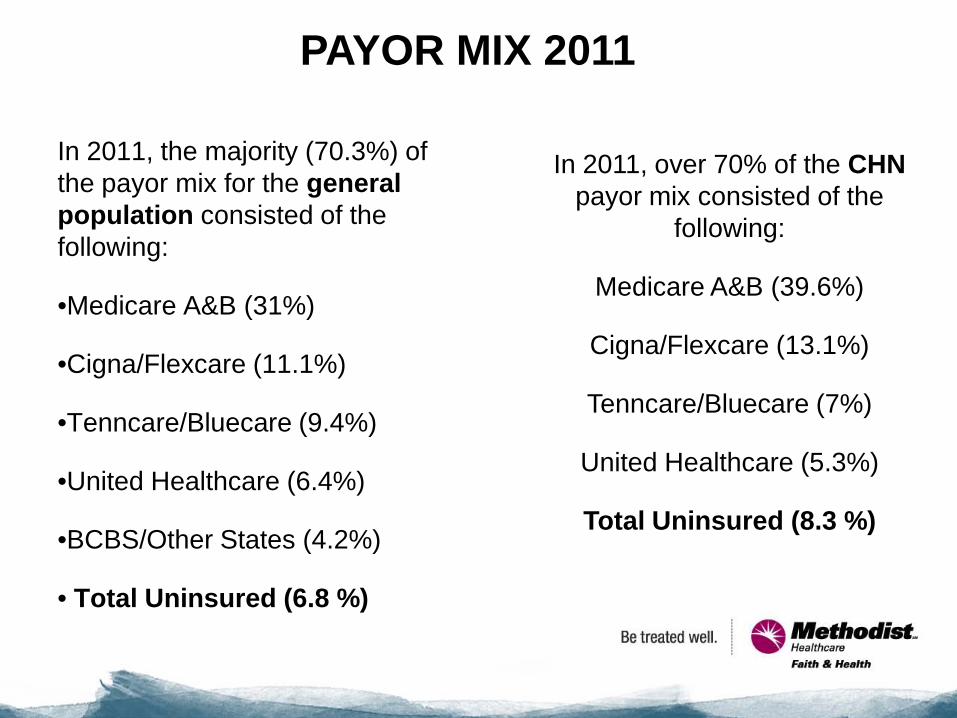
In 2011, the majority (70.3%) of the payor mix for the general population consisted of the following:
•Medicare A&B (31%)
•Cigna/Flexcare (11.1%)
•Tenncare/Bluecare (9.4%)
•United Healthcare (6.4%)
•BCBS/Other States (4.2%)
• Total Uninsured (6.8 %)
In 2011, over 70% of the CHN payor mix consisted of the
following:
Medicare A&B (39.6%)
Cigna/Flexcare (13.1%)
Tenncare/Bluecare (7%)
United Healthcare (5.3%)
Total Uninsured (8.3 %)
PAYOR MIX 2011

0
1
2
3
4
5
6
7
8
9
2008 2009 2010 2011
% U
nins
ured
CHN
General Population
% Uninsured, 2008-2011

CHN members are more likely
than the general population to be discharged from the hospital to home health services [F(1,9)=65.113; p<.001]
0
2
4
6
8
10
12
14
16
18
2005 2006 2007 2008 2009 2010 2011
% U
sing
Hom
e He
alth
Ser
vice
s
CHN
Non-CHN
Home Health

The same hold true for recommendations to post-discharge rehabilitation [F(1,9)=11.423; p=.008].
CHN vs. Non-CHN: Rehabilitation

CHN members are more likely than the general population to be discharged to hospice services [F(1,9)=121.721; p<.001].
HOSPICE
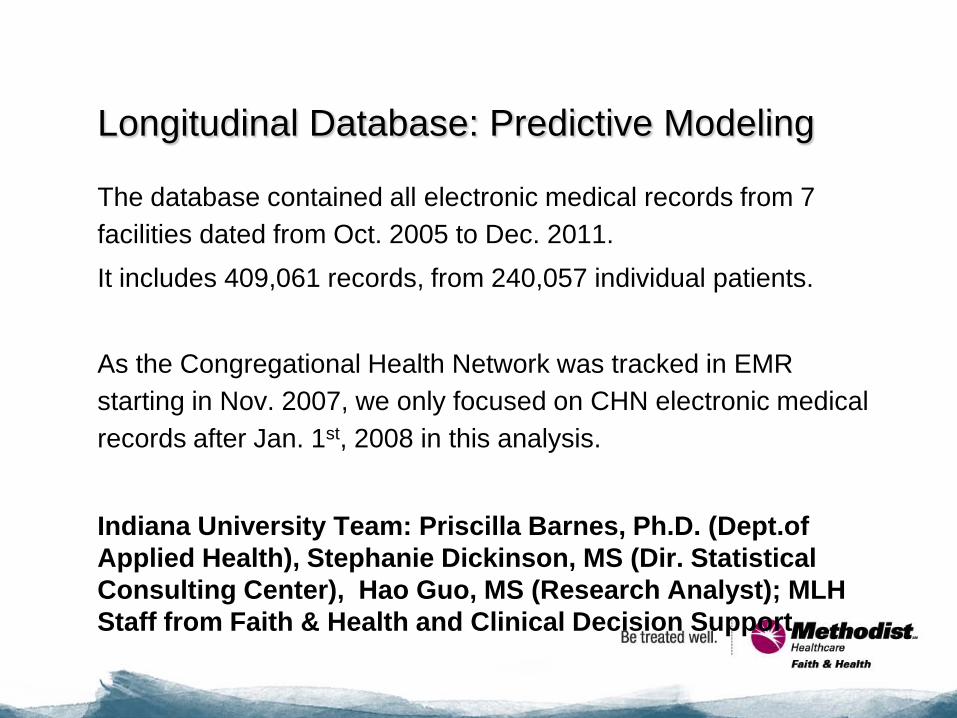
Longitudinal Database: Predictive Modeling
The database contained all electronic medical records from 7 facilities dated from Oct. 2005 to Dec. 2011. It includes 409,061 records, from 240,057 individual patients. As the Congregational Health Network was tracked in EMR starting in Nov. 2007, we only focused on CHN electronic medical records after Jan. 1st, 2008 in this analysis.
Indiana University Team: Priscilla Barnes, Ph.D. (Dept.of Applied Health), Stephanie Dickinson, MS (Dir. Statistical Consulting Center), Hao Guo, MS (Research Analyst); MLH Staff from Faith & Health and Clinical Decision Support

Methods
Propensity score matching was applied to remove selection bias. The Kaplan-Meier method was used to estimate distributions for time-to-readmission. •Cox’s proportional hazard regression model stratified on the matched pairs and included possible covariates was applied to determine whether patients in the Congregational Health Network had longer time-to-readmission.
Time-to-Readmission was defined as the time from the discharge date of patient’s one hospital visit to the admission date of the patient’s next hospital visit.
Patients without documented second hospital visits were censored at the end date of the observation (Dec. 31, 2011).

Logistic Regression
* Dependent variable: Treatment group
(1=CHN, 0=Non-CHN) *Conditioning
variables: sex, age, race,
insurance type, facility, zip code, admit date,
length of stay, and charges in hospital
*Estimated propensity score: Predicted probability
Matching The propensity-score-matched
sets (1:2 matching) were formed using
calipers of width 0.01
Propensity Score Matching Patients were matched on their first visit after Jan 1st,
2008.

The estimated hazard for patients in the Congregational Health Network is
significantly lower than the estimated hazard for the patients out of the network (hazard ratio for readmission, 0.82; 95%
confidence interval, 0.73 to 0.93; p<0.01). CHN days=426 vs. non-CHN=306
Cox’s proportional hazards regression model
stratified on the matched pairs

Figure 1. Kaplan-Meier Survival Curves depicting time to readmission for patients in the Congregational Health Network (CHN) and out of the network (Non-CHN)
Surv
ival
Dist
ribut
ion
Func
tion
0.00
0.25
0.50
0.75
1.00
Time to Readmission (Days)
0 250 500 750 1000 1250 1500
STRATA: group=CHN Censored group=CHNgroup=NON-CHN Censored group=NON-CHN

The estimated hazard for chronic heart failure patients in the Congregational Health Network is NS different from times the estimated hazard for the patients out of the network (hazard ratio for readmission, 1.27; 95% confidence interval,
0.75 to 2.14; p=0.38). CHN patients’ days=347 vs. Non-CHN=206
Cox’s proportional hazards regression model stratified on the matched pairs (Chronic Heart Failure
Patients)

Figure 2. Kaplan-Meier Survival Curves depicting time to readmission for chronic heart failure patients in the Congregational Health Network (CHN) and out of the network (Non-CHN)
Surv
ival D
istrib
ution
Fun
ction
0.00
0.25
0.50
0.75
1.00
time
0 250 500 750 1000 1250 1500
STRATA: group=CHN Censored group=CHNgroup=NON-CHN Censored group=NON-CHN
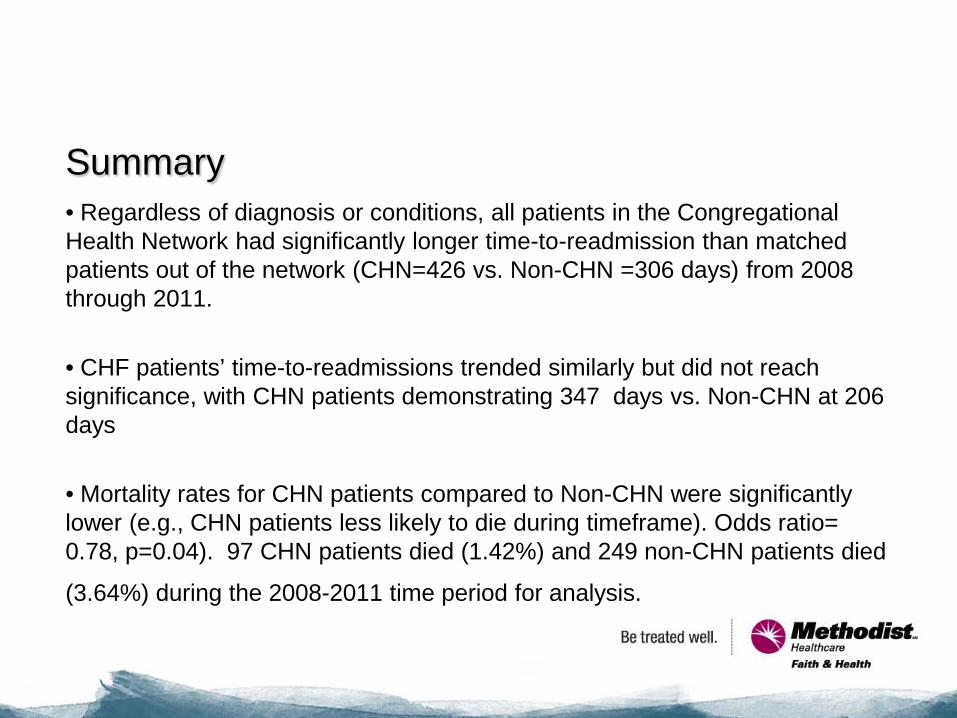
Summary • Regardless of diagnosis or conditions, all patients in the Congregational Health Network had significantly longer time-to-readmission than matched patients out of the network (CHN=426 vs. Non-CHN =306 days) from 2008 through 2011.
• CHF patients’ time-to-readmissions trended similarly but did not reach significance, with CHN patients demonstrating 347 days vs. Non-CHN at 206 days
• Mortality rates for CHN patients compared to Non-CHN were significantly lower (e.g., CHN patients less likely to die during timeframe). Odds ratio= 0.78, p=0.04). 97 CHN patients died (1.42%) and 249 non-CHN patients died
(3.64%) during the 2008-2011 time period for analysis.

NEXT STEPS for the Memphis Model...
• More intentional and strategic Population Health Management (PHM)
• Target education toward enrolling those eligible for TennCare • Focus in on areas of education and training that can enhance the
already established uptake of more appropriate level of care post-discharge
• Build out the Ambulatory Care aspect of the CHN members’ journey of health (e.g., MACH1), starting with hospital discharge leg of journey
• Partner with third party payors for focused PHM • Enhance and reward our volunteer workforce by stipending their
work (e.g., funds for mileage, pay for malpractice, training, supplies, etc.)
• Build more foundational skills in our liaison workforce with CHA training of all liaisons (already 225 trained)

NEXT STEPS for the Memphis Model...
• Participatory community efforts to maximize blended intelligence: share findings, resources, celebration and credit for positive events, mutual problem solving for negative events in a model that promotes transparency and shared co-creation and ownership and nurtures trust
• Continue digging into the archived data; explore “dose response” model comparing outcomes of members from highly engaged congregations to minimally engaged. Focus on participatory hotspotting in target zips.
• Qualitative research conducted to define “core competencies” of navigators, liaisons, as well as clergy. Document members’ journey of health stories.
• LASTLY, sharpen our focus and learn from all of your intelligence, as we develop better ways to measure impact and ROI that is comprehensive and integrated….
The Memphis Model: Building a community of justice, compassion, trust and wholeness…while
demonstrating potential ROI...