The Mechanisms of the Fuel Cell Oxygen Reduction Reaction...
168
The Mechanisms of the Fuel Cell Oxygen Reduction Reaction on Pt and Other 8–11 Column Metal Surfaces Thesis by Yao Sha In Partial Fulfillment of the Requirements For the Degree of Doctor of Philosophy CALIFORNIA INSTITUTE OF TECHNOLOGY Pasadena, California April 2011 Defended April 22 nd , 2011
-
Upload
nguyennhan -
Category
Documents
-
view
222 -
download
0
Transcript of The Mechanisms of the Fuel Cell Oxygen Reduction Reaction...

The Mechanisms of the Fuel Cell Oxygen
Reduction Reaction on Pt and Other 8–11 Column
Metal Surfaces
Thesis by
Yao Sha
In Partial Fulfillment of the Requirements
For the Degree of
Doctor of Philosophy
CALIFORNIA INSTITUTE OF TECHNOLOGY
Pasadena, California
April 2011
Defended April 22nd, 2011

ii
© 2011
Yao Sha
All Rights Reserved
iii
Acknowledgements
I owe my deepest gratitude to my advisor Professor William A Goddard III for his
guidance throughout my six years here at Caltech. He has been supportive in showing me
the way to do theoretical research gracefully and effectively. I learned from him how to
choose a promising approach to tackle my research projects and how to generalize solid
and useful implications that matter to the understanding of the science behind the subject.
His enthusiasm and immense knowledge make the PhD study an enjoyable and
stimulating experience.
I would like to thank my other committee members—Professor Aron Kuppermann,
Professor Jack Beauchamp, and Professor Sosinna Haile—for advice. It is a great honor
to have such a group of brilliant scientists on my committee. I appreciate their comments
and advice on my exams.
I would like to acknowledge my colleges at the Materials and Process Simulation Center
for the discussions and help that made this thesis possible. Dr Boris Merinov has been a
great manager in keeping my research on the right track. I appreciate Ted Yu for the
valuable time we spend together in all the beneficial discussions about fuel cells. De Yuki
Matsuda taught me how to carry out density functional theory calculations on periodic
systems and made it possible for me to get a good start on my research. Many thanks to
Mu-jeng Cheng, Adri van Duin, Seung Soon Jiang, Julius Su, Dan Fisher, Amos
Anderson, and many other members for the help on my research projects.

iv
Thanks for Dr. Peter A. Schultz at Sandia National Laboratories for the instant responses
whenever I had problems with the calculations. Thanks for my collaborators Debbie
Myers at Argonne National Laboratory, John R. Regalbuto at University of Illinois-
Chicago, Clemens Heske at University of Nevada-Las Vegas, Karren More at Oak Ridge
National Laboratory, and Piotr Zelenay at Los Alamos National Laboratory for the
discussions and help.
Last but not least, I would like to thank my family and friends. I would like to thank my
parents and my wife for their love and support in my down times. Many thanks to Tao
Liu, Bolin Lin, and Jigang Wu for helping me get accustomed to the life here at Caltech.
My life here would be a lot more difficult without your help. Thanks to Mulin Cheng,
Yuebin Liu, and Yan Xia for the fun we had together. Thanks to Jiaqi Jin, Yizhou Liu
and Jie Cheng for giving me inspiration and support to keep improving myself. Thanks to
Tong Chen, Jinghao Huang, Xin Hu, and all my other friends here for making my six
years here a joyful experience.

v
Abstract
To better understand and improve the cathode process for low-temperature (85°C)
hydrogen fuel cells, we have used quantum mechanical (QM) calculations aimed at
discovering the mechanism of oxygen reduction reaction on group 8–11 metals and their
alloys. Our first principles QM used the PBE flavor of density functional theory (DFT) to
study the binding site preference, unit reaction pathways, and overall mechanisms on the
closest packed surface of various metal surfaces.
In order to describe the reaction kinetics in aqueous solution we developed a practical
implicit solvation model based on the Poisson-Boltzmann equation. We also carried out
the QM calculations for a vacuum, which we consider approximates the situation in
which the O2 accesses the Pt surface through the Teflon part of the Nafion membrane.
We find that without solvation, Pd would have better performance than Pt, but Pt is a
much better catalyst for solvation. With solvation, direct formation of OHad from Oad and
Had becomes prohibitive on Pt surface. In addition to the two previously discussed ORR
mechanisms, we discovered three novel mechanisms that could be important for ORR
under various conditions, especially in solvent.
Particularly important is that that hydrolysis of Oad by H2Oad to form two OHad is
much more favorable than the direct process, Oad + Had OHad, for Pt and other metals.
We showed that without solvation, the dissociation of O2 into adsorbed atoms on Pt
goes through a mechanism in which Had reacts with O2ad to form OOHad, which
subsequently decomposes to form Oad and OHad. However in solvent, the direct
dissociation of O2ad into Oad + Oad becomes the dominant mechanism.
vi
We also developed a method to determine how the electron transfer affects the barrier
for (H3O)+ to react with surface species. These calculations show that H3O+ attack on Oad
does not compete with Oad hydration for Pt.
Using the same approach we studied the ORR on eleven metals in 8–11 column
including Pt, Pd, Co, Ni, Au, Ag, Cu, Os, Ir, Ru, and Rh (Fe was excluded because the
bulk phase is ferromagnetic BCC). We examined binding site preferences, reaction
barriers, and the preferred ORR mechanisms. We showed that for all the metals except
for Au and Pt, H2O formation via OHad + Had is the step with highest barrier and hence is
the RDS. For Au the major problem is weak binding Oad leading to a high barrier for
dissociating O2. Among these eleven metals, only Au, Ir, Os, Pd, and Pt have a H2O
formation barrier lower than 0.80eV. This suggests two approaches for improved ORR
catalyst: one possible solution is to combine a metal with strong OH binding with another
with weaker OH binding to shift the OH binding energy to a better range. Another
approach is to develop systems that lead to an inhomogeneous catalyst on which different
ORR steps can occur on different metals. This might be possible since OH generally has
large mobility.
We also studied the ORR on Pt3Ni alloy surface at the atomic level and found for the
first time that the sublayer Ni dramatically changed the property surface. The (111)
surface becomes inhomogeneous and leads to a coverage dependence in binding energies,
reaction barriers, and mechanisms. We find that the Pt3Ni alloy is less active than pure Pt
at low coverage. At steady state we expect higher coverage, where we find that Pt3Ni
becomes a better catalyst than Pt, as observed in experiments.
vii
We also demonstrated a general way for handling new alloying system. Taking the
Pd-Cu system as an example, we studied the structural preference of the PdCu alloy at
various atomic concentrations. We found that for the 1:1 PdCu alloy, the B2 (CsCl type)
structure is preferred to FCC types, as known experimentally. We then developed an
approach to predict the preferred surface for an alloy by calculating the surface energy.
We found that the (110) surface is the most stable surface for the B2 phase of PdCu alloy.
We then studied the ORR property for five possible surfaces that the PdCu alloy could
possess. We found out that the layered L11 variation of FCC leads to a surface showing
the best performance in catalyzing ORR among the five surfaces studied. This implies
that one should try to maximize layered L11 surface in PdCu alloy catalyst. This agrees
with the experimental observations that acid and heat treatment gives the best catalyst.

viii
Table of Contents
Acknowledgements ............................................................................................................ iii
Abstract ............................................................................................................................... v
Table of Contents ............................................................................................................. viii
List of Tables .................................................................................................................... xii
List of Figures .................................................................................................................. xiv
Abbreviations ................................................................................................................. xviii
Chapter 1 Overview ............................................................................................................ 1
Chapter 2 Theoretical Study of Solvent Effects on the Platinum Catalyzed Oxygen
Reduction Reaction ............................................................................................................. 3
Abstract ................................................................................................................... 3
Introduction ............................................................................................................. 3
Methodology ........................................................................................................... 5
Results and Discussion ........................................................................................... 7
Conclusion ............................................................................................................ 12
Tables and Figures ................................................................................................ 14
Chapter 3 The Oxygen Hydration Mechanism for the Oxygen Reduction Reaction at Pt
and Pd Fuel Cell Catalysts ................................................................................................ 18
Abstract ................................................................................................................. 18
Introduction ........................................................................................................... 19
Methodology ......................................................................................................... 20
Results and Discussion ......................................................................................... 21
ix
Conclusion ............................................................................................................ 27
Tables and Figures ................................................................................................ 28
Chapter 4 Prediction of Optimum Operating Voltage for the Fuel Cell Oxygen Reduction
Reaction from DFT Calculations ...................................................................................... 31
Abstract ................................................................................................................. 31
Introduction ........................................................................................................... 31
Methodology ......................................................................................................... 33
Results and Discussion ......................................................................................... 35
Conclusion ............................................................................................................ 42
Tables and Figures ................................................................................................ 44
Chapter 5 Density Functional Studies of the Fuel Cell Oxygen Reduction Reaction on Co
and Ni Surfaces ................................................................................................................. 51
Abstract ................................................................................................................. 51
Introduction ........................................................................................................... 51
Methodology ......................................................................................................... 52
Results and Discussion ......................................................................................... 53
Conclusion ............................................................................................................ 61
Tables and Figures ................................................................................................ 62
Chapter 6 Density Functional Studies on Oxygen Reduction Reaction on Cu, Ag, and Au
Surfaces ............................................................................................................................. 65
Abstract ................................................................................................................. 65
Introduction ........................................................................................................... 65
Methodology ......................................................................................................... 66

x
Results and Discussion ......................................................................................... 67
Conclusion ............................................................................................................ 74
Tables and Figures ................................................................................................ 75
Chapter 7 Density Functional Studies on Oxygen Reduction Reaction on Pd, Rh, and Ru
Surfaces ............................................................................................................................. 78
Abstract ................................................................................................................. 78
Introduction ........................................................................................................... 78
Methodology ......................................................................................................... 79
Results and Discussion ......................................................................................... 80
Conclusion ............................................................................................................ 86
Tables and Figures ................................................................................................ 87
Chapter 8 Density Functional Studies of the Fuel Cell Oxygen Reduction Reaction on Os
and Ir Surfaces .................................................................................................................. 90
Abstract ................................................................................................................. 90
Introduction ........................................................................................................... 90
Methodology ......................................................................................................... 91
Results and Discussion ......................................................................................... 92
Conclusion ............................................................................................................ 97
Tables and Figures ................................................................................................ 99
Chapter 9 Mechanism for the Oxygen Reduction Reaction on Pt3Ni Alloy Fuel Cell
Cathodes .......................................................................................................................... 102
Abstract ............................................................................................................... 102
Introduction ......................................................................................................... 102

xi
Methodology ....................................................................................................... 103
Results and Discussion ....................................................................................... 104
Conclusion .......................................................................................................... 114
Tables and Figures .............................................................................................. 115
Chapter 10 Predictions of the Oxygen Reduction Reaction on Copper-Palladium Alloys
......................................................................................................................................... 123
Abstract ............................................................................................................... 123
Introduction ......................................................................................................... 123
Methodology ....................................................................................................... 124
Results and Discussion ....................................................................................... 125
Conclusion .......................................................................................................... 132
Tables and Figures .............................................................................................. 134
References ....................................................................................................................... 143

xii
List of Tables
Table 2-1. Binding energies without solvent (Ebind), slab charge (Qslab), solvation energy
(Esolv), and binding energy with solvation (E solvbind ) for all intermediates. Ebind is calculated
as ESlab-adsorbate-ESlab-Eadsorbate. Qslab(e) is the net charge of the slab. Esolv(eV) is the
solvation energy calculated using the continuum model. E solvbind (eV) is the sum of Ebind
and E solvbind (eV). Both OOH configurations are atop sites. The only difference is the
orientation of OOH. .......................................................................................................... 15
Table 2-2. Reaction barriers without solvent (Ea) and in water-solvated phase (E solva ) for
five steps involved in the O2-dissociation and OOH-association pathways. .................... 15
Table 3-1. Enthalpies and barriers (eV) for steps possibly important for ORR on Pt ...... 28
Table 3-2. Enthalpies and barriers (eV) for steps possibly important for ORR on Pd ..... 29
Table 5-1. Binding energies (eV) of various ORR species on Pt, Co, and Ni .................. 63
Table 5-2. Reaction barriers for various steps involved in ORR ...................................... 63
Table 5-3. Overall barriers for each step .......................................................................... 64
Table 6-1. Binding energy for Ir and Os as compared with Pt, both with and without
solvent. .............................................................................................................................. 76
Table 6-2. Reaction barriers for various steps involved in ORR. ..................................... 76
Table 6-3. Overall barriers for each step. ......................................................................... 77
Table 7-1. Binding energy for Ir and Os as compared with Pt, both with and without
solvent ............................................................................................................................... 88
Table 7-2. Reaction barriers for various steps involved in ORR ...................................... 88

xiii
Table 7-3. Overall barriers for each step .......................................................................... 89
Table 8-1. Binding energy for Ir and Os as compared with Pt, both with and without
solvent effect ................................................................................................................... 100
Table 8-2. Reaction barriers for various steps involved in ORR .................................... 100
Table 8-3. Overall barriers for each step ........................................................................ 101
Table 9-1. Binding energies of various species on various sites on Pt3Ni and Pt without
solvation .......................................................................................................................... 116
Table 9-2. Binding energies of various species on various sites on Pt3Ni and Pt with
solvation .......................................................................................................................... 117
Table 9-3. Reaction barriers for Pt3Ni in gas phase ........................................................ 117
Table 9-4. Reaction barriers on Pt3Ni with solvation ..................................................... 118
Table 10-1. Calculated lattice parameter as compared to experimental value ............... 134
Table 10-2. Six most table surfaces of B2 PdCu ............................................................ 135
Table 10-3. Binding energies for the intermediates involved in ORR on Pt, Pd, Cu, and
PdCu alloys ..................................................................................................................... 137
Table 10-4. Binding energies for intermediates involved in ORR on Pt, Pd, Cu, and PdCu
alloys with solvent effect ................................................................................................ 138
Table 10-5. Barriers for the reaction steps involved in ORR without solvation ............. 138
Table 10-6. Barriers for the reaction steps involved in ORR with solvation .................. 139

xiv
List of Figures
Figure 2-1. The super slab used to calculate the solvent effect. Only the center cell has
adsorbate attached. All cells surrounding the center cell contain neutral platinum atoms.
Three additional layers of platinum are added to the bulk side to eliminate extraneous
solvent effects. .................................................................................................................. 16
Figure 2-2. Important binding sites on the closest packed Pt (111) surface ..................... 16
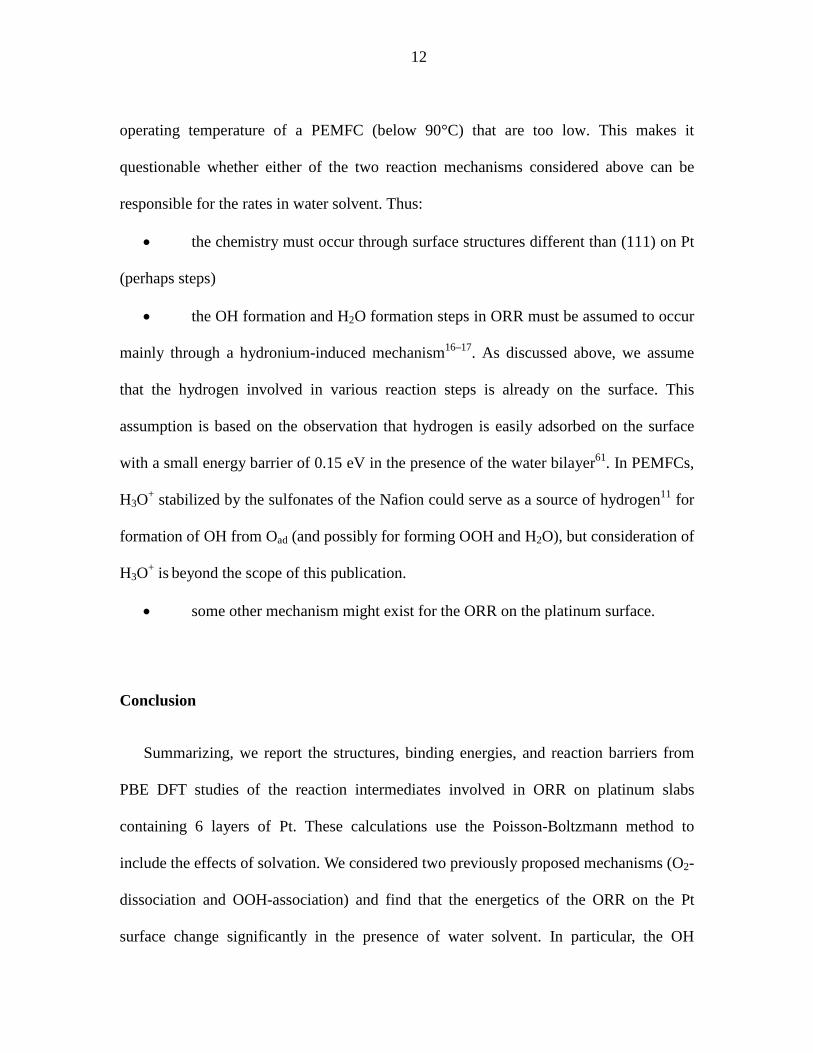
Figure 2-3. Potential energy surface of the O2-dissociation mechanism without and with
water solvent ..................................................................................................................... 17
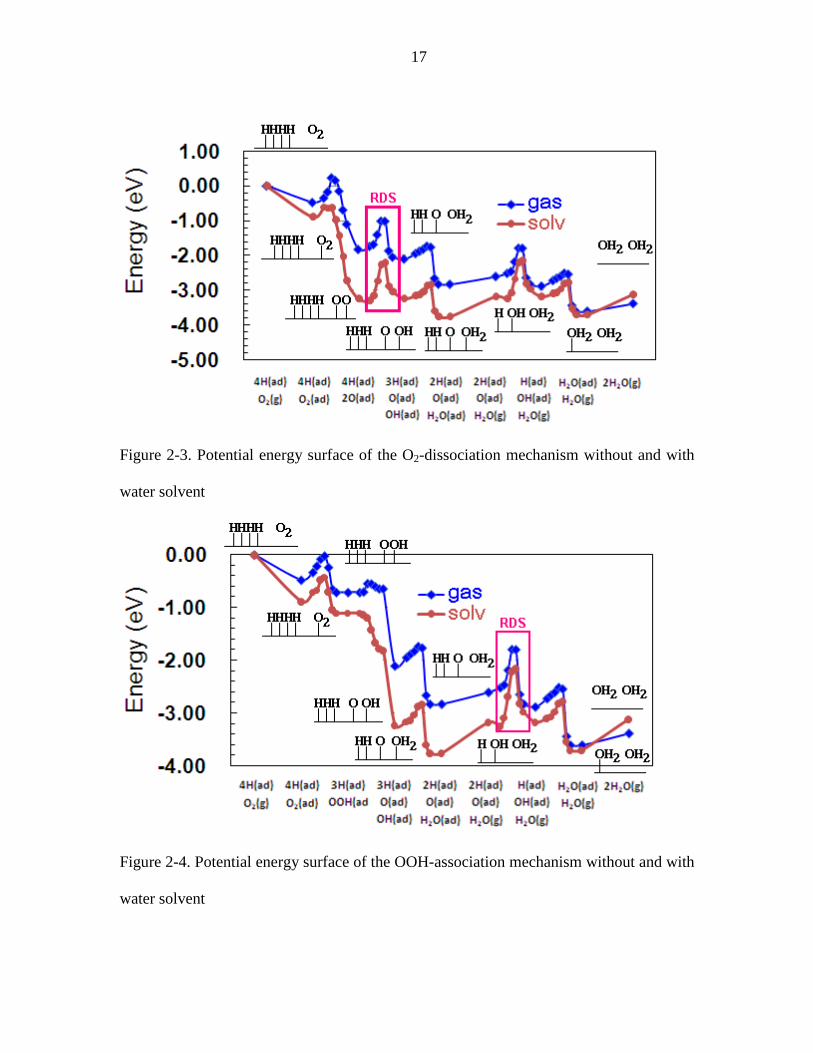
Figure 2-4. Potential energy surface of the OOH-association mechanism without and with
water solvent ..................................................................................................................... 17
Figure 3-1. Illustration of the sulfonic acid lined hydrophilic water channels and
hydrophobic (Teflon-like) regions in Nafion (from references 64-65) showing the likely
locations of the O2g 2Oad, Oad + H2Oad 2OHad, and OHad + Had H2Oad steps in
the hydrophobic channels, but H+ Had at the boundary with the water phase. For the
gas phase process we assume that the proton is chemisorbed on the surface, Had. For Pt in
water at pH = 1 (typical for a fuel cell), this occurs at a potential of -0.06 eV (relative to
the Standard Hydrogen Electrode [SHE])......................................................................... 30
Figure 3-2. Potential energy surface (eV) for the Oad hydration step of ORR. ................ 30
Figure 4-1. Reaction path for Oad + H+ + e OHad in which the electrode potential is
kept fixed. The bright green line shows the optimal path. ................................................ 44

xv
Figure 4-2. Contour plot for the energy surface for the reaction Oad + H+ + e OHad in
which charge and OH formation are considered as two independent coordinates. The
green curve gives an optimal reaction path at +1.0 electrode potential. ........................... 45
Figure 4-3. The optimal reaction PES at electrode potential of +1.0V versus NHE where
at each point the charge is indicated ................................................................................. 45
Figure 4-4. Optimal PES of H+ + Oad OHad for various electrode potentials. Each line
in this plot represents the “green” line selected from Figure 4-1, Figure 4-2, and Figure
4-3. In the NHE line, the reaction starts with Had because that is below the reversible
potential of H+ Had and hence Had is the preferred form (see the corresponding section
for details). For simplicity, here we show only the three typical cases and an imaginary
line supposing reaction from H+. ...................................................................................... 46
Figure 4-5. Potential dependent barrier for H+ + Oad OHad. Each point in the barrier
line represents the TS point (highest energy point in Figure 4-4), while each point in the
enthalpy curve represents the difference between the starting and ending point in Figure
4-4. .................................................................................................................................... 47
Figure 4-6. Barriers of reaction (1)–(4), the four steps involved in the ORR. In general,
all barriers increase as electrode potential increases. OH formation dominates the ORR
reaction. ............................................................................................................................. 48
Figure 4-7. Potential dependent PES for H+ Had ......................................................... 48
Figure 4-8. Potential dependent barriers for H+ Had .................................................... 49
Figure 4-9. Potential dependent PES for H2O formation .................................................. 49
Figure 4-10. Potential dependent barrier for H2O formation ............................................ 50

xvi
Figure 4-11. The power output as a function of the electrode potential. Here we also
consider the impact of small changes in the energetics. ................................................... 50
Figure 5-1. Binding sites on FCC closed packing surface (111 surface).......................... 64
Figure 6-1. Steps involved in ORR. .................................................................................. 77
Figure 7-1. Steps involved in ORR ................................................................................... 89
Figure 8-1. Steps involved in ORR ................................................................................. 101
Figure 9-1. Binding sites on Pt3Ni surface. The blue and orange stripes indicate the
partitioning of the Pt surface into two regions induced by the sublayer Ni. The O2, O, H,
OH, and OOH species prefer to move only within the blue stripes. ............................... 119
Figure 9-2. Illustration of various binding sites on Pt3Ni surface. For top sites t1 and t2,
the triangle indicates the sublayer atoms. t1 has one Ni atom beneath it, while t2 has two.
For bridge sites, the bridge itself is shown as the thick black line while the two termini of
the black line connect the two surface atoms forming the bridge site. The trapezoid
beneath are sublayer atoms. b0-b3 has 0-3 Ni atoms in this sublayer. An fcc site is in the
center of a surface triangle (shown as solid triangle). f1 and f2 differ in the sublayer
triangle beneath the surface triangle. f1 has one Ni beneath it while f2 has two. hcp sites
are also in the center of a surface triangle. hcp sites have one sublayer atom beneath it.
For h1 it is Ni, while for h2 it is Pt. .................................................................................. 120
Figure 9-3. Potential energy surface, including barriers, for the OOH-form-hydr
mechanism preferred for both Pt and Pt3Ni in gas phase ................................................ 121
Figure 9-4. Potential energy surface, including barriers, for the O2-diss-hydr mechanism
preferred by both Pt3Ni and Pt in solution. The purple line shows the alternative
mechanism at higher coverage. ....................................................................................... 122

xvii
Figure 10-1. Phase diagram of PdCu system. Three unique phases exists in the diagram.
A bcc type phase at around 45% atomic ratio, an FCC type Cu3Pd (AuCu3 structure), and
a FCC-type solid solution phase. (From ASM115) .......................................................... 140
Figure 10-2. Four type of bulk structures considered in this research. (Images taken from
http://en.wikipedia.org/) .................................................................................................. 141
Figure 10-3. Mass activity of Pt, Pd, and Pd-Cu alloy catalysts. This shows that the 1:1
PdCu catalyst has a performance about half as good as Pt, and over twice as good as Pd.
Based on the results of Deborah J. Myers, etc.107 ........................................................... 142
xviii
Abbreviations
BE. Binding energies
DFT. Density functional theory
FCC. Face center cubic
GGA. Generalized gradient approximation
HCP. Hexagonal centered cubic
HER. Hydrogen evolution reaction
HOR. Hydrogen oxidation reaction
ORR. Oxygen reduction reaction, O2 + 4H+ 2H2O; the cathode process in a hydrogen
fuel cell
PBE. Density functional developed by Perdew, Becke, and Ernzerhof
PEMFC. Proton exchange membrane fuel cell; fuel cell that uses proton exchange
membrane as separator
RDS. Rate determining step

1
Chapter 1 Overview
Oxygen reduction reaction (ORR) is one of the key steps in proton exchange
membrane fuel cells (PEMFC). The slow kinetics and the expensive Pt-based catalysts
have become a major obstacle towards more extensive usage of PEMFC for households
and automobiles. Great efforts have been made to develop new materials as ORR
catalysts, but few materials have reached the requirement of high economical feasibility,
high discharging efficiency, and long life. Compared with the enormous experimental
research, theoretical modeling for the ORR is rather limited in both range and extent.
Here in this study, we examined the mechanisms of ORR on various surfaces using first
principle calculations.
We systematically demonstrated way to study ORR using density-functional-theory
(DFT)-based methods. We developed an implicit solvation model based on the Poisson-
Boltzmann equation to correctly access the solvent effect essential for the understanding
of ORR at fuel cell condition, and showed that the aqueous environment changed
dramatically the energetics and the preferred mechanisms. See Chapter 2 for details of the
methods and disquisitions about the importance of solvation.
In addition to the traditional mechanisms of ORR for Pt surface, we found three
alternative mechanisms that could play an important role at different conditions. These
three mechanisms, along with the two well-known ones, form a generic reaction network
for ORR on all kinds of metal surfaces. See Chapter 3 for the discussions about the
implications of the alternative reaction pathways.

2
H+ may be directly involved in the ORR as a direct reactant on metal surfaces; hence
we developed a reliable way to model the electron transfer between the metal surface and
the anions in solution. With this approach we were able to calculate for the first time the
electrode-potential-dependent barrier on a semi-infinite surface. We showed that H+
played a minor role in ORR on Pt surface. See Chapter 4 for details.
We then applied the same methods to various 8–11 column metal surfaces and
studied the optimal ORR pathway. We showed the factor that limits each metal from
becoming a good ORR catalyst and pointed out possible ways of improving the
performance. See Chapter 5, Chapter 6, Chapter 7, and Chapter 8 for details.
Pt3Ni and Pt3Co alloys have shown better performance than pure Pt. Research so far
attributes the improved activity to a change in band structure. We, however, examined the
influence of a second metal at the atomic level. The result showed that the second metal
in sublayer could bring inhomogeneity to the surface and make the reaction coverage
dependent. Chapter 9 discusses Pt3Ni as an example.
In Chapter 10, we discuss in general how to handle an unknown alloy. Taking PdCu
alloy as an example, we showed how one can predict the preferred phase, surface, and
ORR activity using DFT calculations.
3
Chapter 2 Theoretical Study of Solvent Effects on the
Platinum Catalyzed Oxygen Reduction Reaction
Abstract
We report here density functional theory (DFT) studies (PBE) of the reaction
intermediates and barriers involved in the oxygen reduction reaction (ORR) on a
platinum fuel cell catalyst. Solvent effects were taken into account by applying
continuum Poisson-Boltzmann theory to the bound adsorbates and to the transition states
of the various reactions on the platinum (111) surface. Our calculations show that the
solvent effects change the reaction barriers significantly compared with those in the gas
phase environment (without solvation). The O2 dissociation barrier decreases from 0.58
eV to 0.27 eV, whereas the H + O OH formation barrier increases from 0.73 eV to
1.09 eV. In the water-solvated phase, OH formation becomes the rate-determining step
for both ORR mechanisms, O2-dissociation, and OOH-association, proposed earlier for
the gas phase environment. Both mechanisms become significantly less favorable for the
platinum catalytic surface in water solvent, suggesting that alternative mechanisms must
be considered to describe properly the ORR on the platinum surface.
Introduction
Polymer electrolyte membrane fuel cells (PEMFCs) have tremendous potential for
addressing the world’s energy needs but are limited by the efficiency of the cathode
catalyst for the oxygen reduction reaction (ORR)1–4. Currently, the best catalyst is

4
platinum but it is too expensive and not sufficiently efficient. Many efforts are underway
to find replacements or improvements by using different supports, platinum alloys, or
non-platinum catalysts5–9. Despite these efforts there remain uncertainties concerning the
fundamental reaction mechanism underlying ORR.
Numerous experimental and theoretical studies have been carried out to study the
kinetics of ORR mechanisms10–17. Most published theoretical studies simplify the ORR as
a reaction in a gas phase environment, leading to good agreement with the high vacuum
surface experiments on hydrogen oxidation reactions. However, fuel cell operation
involves also a solvent environment, and there is not yet a validated efficient method to
estimate the contributions of water solvent to the key steps in the reaction mechanisms.
One approach to estimating the solvent effect is to add explicit water molecules11,18 (~
4 per unit cell) or even an entire water bilayer16–17,19. These explicit solvent model
approaches lead to plausible results, but the optimum structure for a few waters or a
bilayer may not resemble that of the fully solvated system20, leading to questions of how
to describe the relaxation around the adsorbed species. Moreover this leads to the
possible direct participation of water in the reactions21–22. In addition, the periodicity in
the solvent structure imposed by the periodic boundary conditions may introduce
artificial ordering. Also, without well-justified initial and final configurations, it is
difficult to identify the correct solvent structures for transition states to obtain the barriers
that determine the reaction rates.
Here, we propose an alternative approach of using the fast but accurate Poisson-
Boltzmann implicit continuum model to estimate solvent effects23–25. This approach has
been applied widely in cluster studies where it has led to quite accurate results for many

5
systems26–28. The contributions of solvent and ions are considered through their
electrostatic interactions with the solutes. The use of a continuum solvent environment
leads to a consistent model for estimating the contribution of the solvent all along the
reaction surface. Details of our approach are given below.
Methodology
The active Pt (111) surface was modeled using a metal slab that is infinitely periodic
along two dimensions but finite along the third one. We used a 2 × 2 hexagonal unit cell
with four metal atoms per layer and six layers in total to model the catalyst. The slab
calculations were performed with the Seqquest DFT code29 using the Perdew-Becke-
Ernzerhof (PBE)30 exchange-correlation functional of the generalized gradient
approximation (GGA) 31–32. Seqquest uses local Gaussian-type basis functions (double
zeta plus polarization quality, optimized for bulk systems) rather than periodic plane
waves. In Seqquest the Kohn-Sham equations33 are solved self-consistently using two-
dimensional periodic conditions. The 62 core electrons (Kr[5s24d104f14]) of platinum are
replaced with an angular momentum projected34–35, norm-conserving36–37, effective core
potential (ECP) so that only 16 electrons are considered explicitly. The real space grid
density is 7 points/Å.
All calculations were performed with the optimized cell parameter of 3.98 Å found in
the bulk calculation using the PBE DFT. We allowed the atoms in the top two layers to
relax to their lowest energy configuration, while fixing the atoms of the bottom four
layers to their bulk positions. All binding configurations and transition states were
determined using PBE DFT calculations without solvation. Then we carried out single

6
point calculations to include the solvent effect. The total energy was represented as the
sum of gas-phase and solvation energies:
Etotal = Egas + Esolv . (1)
We evaluated the solvent effect using the Poisson-Boltzmann implicit solvent method
as implemented in the APBS38–40 which is incorporated in the Computational Materials
Design Facility41 (CMDF) developed in the Materials and Process Simulation Center
(MSC) at Caltech. Here the boundary of the continuum is taken as the solvent-accessible
surface for a solvent with spherical radius of 1.4 Å and a dielectric constant of 78.
Structures and charges were taken from PBE for all intermediates and transition states. To
test whether more than 6 layers might be needed, we carried out calculations for 3 to 10
layers and found negligible energy changes (~ 0.02 eV) between 6 and 10 layers.
However, we were concerned that calculations of solvent effect might require larger
slabs, since the electrostatic interaction between solvent and solute may converge slowly.
Thus, we used an alternative approach to evaluate the solvent effect. Here, instead of
solving the Poisson-Boltzmann equation for a periodic system, we cut a super cell out of
the infinite pure platinum slab. The center cell was substituted by the adsorbing system of
interest, while all remaining cells were similar to those in the original platinum slab.
Thus, a center cell with adsorbate is surrounded by bare, and hence neutral, ones. To
avoid solvent stabilization due to interaction between solvent and the back side of the
slab (the bulk side), we added three additional layers of neutral platinum atoms to the
bulk side. A sketch of the model is shown in Figure 2-1.

7
Results and Discussion
We studied systematically the adsorption preference of six adsorbed intermediates: H
(atomic hydrogen), O (atomic oxygen), O2 (molecular oxygen), OH, OOH, and H2O on
the Pt (111) surface (Table 2-1), by density function theory (DFT).
All adsorbates prefer one of four binding sites available on the (111) surface (Figure
2-2), which are denoted as µ1 (top), µ2 (bridge), µ3-fcc (fcc hollow), and µ3-hcp (hcp
hollow), according to the number of surface atoms to which the adsorbate binds.
Without solvation we find that atomic oxygen (O) prefers the µ3-fcc site, with a
binding energy of BE = 3.68 eV, followed by the µ3-hcp site with BE = 3.30 eV. This
agrees with the experimental adsorption energy of 3.68 eV at the µ3-fcc adsorption site42.
Previous theoretical studies on 3 layer slabs using generalized gradient approximation
(GGA) of Perdew and Wang (PW91) DFT led to BE = 4.03eV for the µ3-fcc site10.
B3LYP DFT calculations on a 35 atom Pt cluster14 (Pt35) led to BE = 3.37eV for fcc and
3.03 eV for hcp sites.
Without solvation we find that O2 prefers the µ3-fcc site with BE = 0.48 eV and ROO
= 1.41 Å, followed by the µ2-bridge site with BE =0.41 eV and ROO = 1.34 Å. This agrees
well with low temperature adsorption experiments43 that find that O2 can absorb into both
a peroxide-like (O22-) with a vibrational frequency of 690 cm-1 and a weaker bound
superoxo-like (O2-) with a vibrational frequency of 870 cm-1. Our bond lengths agree with
experimental estimates of 1.43 Å for peroxo-like and the 1.37 Å for superoxo-like
species44. Our calculated BE is consistent with the experimental estimate of 0.38 eV for
the superoxo-like configuration45. Earlier theoretical studies12,46 led to 0.65 to 0.72 eV for
8
peroxo-like and 0.53 to 0.68 eV for superoxo-like. This difference is mainly due to the
smaller number of layers included in these earlier studies. Thus we find that using only
three-layer slabs as in the previous studies leads to 0.62 and 0.75 eV, respectively.
B3LYP DFT calculations on a 35-atom Pt cluster14 found the bridge site to be preferred
with BE = 0.49 eV, while calculations on a 5-atom cluster47 led to BE = 0.53 eV for the
bridge site.
We find that OH prefers the µ2 (bridge) site with BE = 2.26 eV while the µ1 site is
close with BE = 2.24 eV. This agrees with the calculations on a 3-layer slab using GGA
PW91 DFT by Hu48, who found BE = 2.22 eV for the µ2 (bridge) site and 2.27 eV for the
µ1 site. B3LYP calculations for the Pt35 cluster14 obtained BE = 2.06 eV. It is important to
note that this OH structure would not be stable for a monolayer, which would reconstruct
into an overlayer having a network of hydrogen bonds48. Here, we use this structure just
to estimate the solvation energy (without considering stabilization from adjacent OH).
We find that OOH is stable only on the µ1 (top) site, leading to an optimum
configuration in which the OO bond is parallel to the surface pointing towards an
adjacent Pt atom, leading to BE = 1.06 eV. An alternative configuration for OOH has the
O−O bond pointing toward an adjacent fcc site with BE of 0.96 eV. This implies a 0.08
eV agostic stabilization from the adjacent surface atom. Similar results were obtained for
the Pt35 cluster14 with BE = 1.03 eV.
We find that H2O is stable only on the top site, with a binding energy of 0.22 eV
without solvent. This agrees with 0.29 eV for the top site in 3-layer calculations using
PBE studies49. Calculations for the Pt35 cluster led to a much stronger BE = 0.61 eV.
Direct comparison with experiment is difficult since H2O tends to form a bilayer19,49.

9
Our PBE calculations find that the µ1 (BE=2.79 eV) and µ3-fcc (BE=2.73 eV) sites
are most stable for atomic hydrogen (Table 2-1). This result agrees with the high
resolution electron energy loss spectroscopy (HREELS) experiment50, which finds H in
the threefold coordinated site, and with vibrational neutron spectroscopy studies51, where
hydrogen was observed in the on-top site. Our calculations for the 6-layer slab find that
atomic hydrogen slightly prefers the on-top site over the threefold coordinated site, by
0.06 eV (0.02 eV after zero point energy correction). This is consistent with the small
experimental hydrogen diffusion barrier of ~ 0.07 eV52. For such small differences, one
must consider the biases in the particular form of DFT; indeed Olsen et al53. showed that
various exchange-correlation functionals can change binding energies by up to 0.1 eV,
setting a bound on the accuracy to be expected from such studies.
Two reaction pathways were proposed previously14 for the ORR on the Pt (111) metal
surface in the gas phase environment, the O2-dissociation mechanism:
2H 2H2 2i ii iiiO 2O 2OH 2H O→ → → (2)
and the OOH-association mechanism:
H H 2H2 2iv v ii iiiO OOH O+OH 2OH 2H O→ → → → (3)
where all reactants are surface adsorbates describing the hydrogen oxidation reaction
after dissociative adsorption of H2. Both of these mechanisms are supported by
subsequent calculations11,54.
We computed transition states and barriers using nudged elastic band theory (NEB)
55–56 for all five reaction steps (i–v) involved in pathways (2) and (3). The results are
shown in Table 2-2, Figure 2-3, and Figure 2-4.
10
The three barriers in the O2-dissociation mechanism (2) in the gas phase environment
were calculated to be 0.58 eV for O2 dissociation, 0.73 eV for OH formation, and 0.21 eV
for H2O formation (using six-layer slabs). This can be compared with 0.52, 0.91, and 0.14
eV in DFT studies by Li et al12. using four layers and with 0.94 and 0.21 eV obtained by
Hu10 for OH and H2O formation using three-layer slabs. To validate that these differences
are due to slab thickness effect, we carried out similar calculations with just a three-layer
slab, leading to a result of 0.52, 0.83, and 0.25 eV, which agrees well with previous
results. For the Pt35 cluster, 14 the barriers were 0.63, 1.13 and 0.09 eV.
For the OOH-association mechanism (3), we found the barriers of 0.31 eV for OOH
formation, 0.17 eV for OOH dissociation, 0.73 eV for OH formation, and 0.21 eV for
H2O formation, all with 6-layer slabs. Using only 3 layers we find the OOH to be 0.37
eV, which agrees with the 0.42 eV calculated by Li12 for 3 layers. Again, we find OH
formation to be the rate-determining step (RDS) in the OOH-association mechanism.
Summarizing, our calculations predict that the ORR on the Pt(111) surface in the gas
phase environment would have a total energy barrier of 0.73 eV with the OH formation
as the RDS for both the O2-dissociation and OOH association mechanisms.
The solvent effect on all adsorbed species, ORR intermediates, and transition states
were evaluated using the Adaptive Poisson Boltzmann Solver (APBS) method38–40 at
single points using the structures optimized in the gas phase. Energies and potential
energy surfaces, including the solvent effects as described in equation (1), are shown in
Table 2-1, Table 2-2, Figure 2-3, and Figure 2-4.
Table 2-1 shows that the solvation energy for adsorbed OH (top) is 0.54 eV, which
agrees with the first-layer solvation energy of 0.54 eV estimated for an adsorbed OH/H2O

11
overlayer.57 This becomes an overall solvation of 0.59 eV after including the second layer
solvation energy of 0.05 eV due to wetting of the OH/H2O overlayer.58
We find that solvation stabilizes the water molecule by 0.36 eV, giving a total binding
energy of 0.58 eV. This agrees with 0.62 eV from extensive calculations of water
adsorption by Meng et al.59 using up to six bilayers of explicit water.
The solvation energy for adsorbed hydrogen is only 0.07 (µ1) or 0.12 (µ3) eV for 6
layers, reflecting the similar electronegativity of H and Pt. This agrees with the range of
0.04 to 0.17 eV from studies of surface hydrogen using an explicit solvation method20.
We find that the solvent strongly stabilizes adsorbed oxygen, by 0.63–0.70 eV,
whereas adsorbed O2 is stabilized by 0.41 eV and OOH is stabilized by 0.47 eV. Our
calculated solvation of adsorbed O does not agree with the estimate of -0.03 eV by
Norskov60 using the water bilayer, which assumed that the O would not change the
structure of the water bilayer (no details were provided).
Summarizing, we find that solvent effects significantly modify the reaction energies
and ORR barriers for both mechanisms.
For the direct O2-dissociation mechanism, the barriers for the three steps, O2
dissociation, OH formation, and H2O formation, are estimated to change by -0.31, 0.36,
and 0.12 eV in the presence of water.
For the OOH-association mechanism, solvation changes the barriers for the four
steps, OOH formation, OOH dissociation, OH formation, and H2O formation, by -0.03,
-0.17, 0.36, and 0.12 eV, respectively.
With solvation the RDS for both mechanisms becomes the OH formation step with a
barrier of 1.09 eV in water solvent. Such a high barrier would seem to provide rates at the
12
operating temperature of a PEMFC (below 90°C) that are too low. This makes it
questionable whether either of the two reaction mechanisms considered above can be
responsible for the rates in water solvent. Thus:
• the chemistry must occur through surface structures different than (111) on Pt
(perhaps steps)
• the OH formation and H2O formation steps in ORR must be assumed to occur
mainly through a hydronium-induced mechanism16–17. As discussed above, we assume
that the hydrogen involved in various reaction steps is already on the surface. This
assumption is based on the observation that hydrogen is easily adsorbed on the surface
with a small energy barrier of 0.15 eV in the presence of the water bilayer61. In PEMFCs,
H3O+ stabilized by the sulfonates of the Nafion could serve as a source of hydrogen11 for
formation of OH from Oad (and possibly for forming OOH and H2O), but consideration of
H3O+ is beyond the scope of this publication.
• some other mechanism might exist for the ORR on the platinum surface.
Conclusion
Summarizing, we report the structures, binding energies, and reaction barriers from
PBE DFT studies of the reaction intermediates involved in ORR on platinum slabs
containing 6 layers of Pt. These calculations use the Poisson-Boltzmann method to
include the effects of solvation. We considered two previously proposed mechanisms (O2-
dissociation and OOH-association) and find that the energetics of the ORR on the Pt
surface change significantly in the presence of water solvent. In particular, the OH

13
formation was found to be the RDS for both mechanisms, leading to an overall energy
barrier increase to 1.09 eV in solvent, compared to 0.73 eV without solvation. With such
a high barrier in solvent, these two gas-phase ORR mechanisms become unfavorable and
we conclude that
• the chemistry must occur through surface structures different than (111) (e.g.,
steps), or
• the ORR must be assumed to involve a hydronium induced mechanism, or
• another mechanism must exist for the ORR on the platinum surface.

14
Tables and Figures
Adsorbate Binding sites Ebind (eV) Qslab(eV) Esolv(eV) E solvbind (eV) E solv
explicit (eV)
H
µ1 -2.79 -0.11 -0.07 -2.86
-0.04 to 0.1720 µ2 -2.70 -0.21 -0.12 -2.82
µ3-fcc -2.73 -0.23 -0.12 -2.85
µ3-hcp -2.70 -0.22 -0.12 -2.82
O
µ1 -2.30 0.55 -0.75 -3.05
µ2 -3.11 0.61 -0.63 -3.74
µ3-fcc -3.68 0.70 -0.70 -4.38
µ3-hcp -3.30 0.66 -0.63 -3.93
OH
µ1 -2.24 0.33 -0.54 -2.78 -0.5957–58,60
µ2 -2.26 0.25 -0.38 -2.64
µ3-fcc -1.67 0.34 -0.32 -1.99
µ3-hcp -1.55 0.34 -0.34 -1.89
O2
bridge -0.41 0.40 -0.32 -0.73
fcc -0.48 0.51 -0.41 -0.89
hcp -0.36 0.47 -0.36 -0.72
OOH µ1-bridge -1.06 0.26 -0.47 -1.53
µ1-fcc -0.96 0.27 -0.47 -1.43
H2O µ1 -0.22 -0.10 -0.36 -0.58 -0.6259

15
Table 2-1. Binding energies without solvent (Ebind), slab charge (Qslab), solvation energy
(Esolv), and binding energy with solvation (E solvbind ) for all intermediates. Ebind is calculated
as ESlab-adsorbate-ESlab-Eadsorbate. Qslab(e) is the net charge of the slab. Esolv(eV) is the
solvation energy calculated using the continuum model. E solvbind (eV) is the sum of Ebind
and E solvbind (eV). Both OOH configurations are atop sites. The only difference is the
orientation of OOH.
Barriers Reaction steps Ea (eV) E solva (eV)
Barriers for steps
O2 dissociation 0.58 0.27
OH formation 0.73 1.09
H2O formation 0.21 0.33
OOH formation 0.31 0.28
OOH dissociation 0.17 0.00
Barriers for the overall reaction O2 dissociation 0.73 1.09
OOH dissociation 0.73 1.09
Table 2-2. Reaction barriers without solvent (Ea) and in water-solvated phase (E solva ) for
five steps involved in the O2-dissociation and OOH-association pathways.

16
Figure 2-1. The super slab used to calculate the solvent effect. Only the center cell has
adsorbate attached. All cells surrounding the center cell contain neutral platinum atoms.
Three additional layers of platinum are added to the bulk side to eliminate extraneous
solvent effects.
Figure 2-2. Important binding sites on the closest packed Pt (111) surface
17
Figure 2-3. Potential energy surface of the O2-dissociation mechanism without and with
water solvent
Figure 2-4. Potential energy surface of the OOH-association mechanism without and with
water solvent
18
Chapter 3 The Oxygen Hydration Mechanism for the Oxygen
Reduction Reaction at Pt and Pd Fuel Cell Catalysts
Abstract
We report the reaction pathways and barriers for the oxygen reduction reaction (ORR)
on platinum, both for gas phase and in solution, based on quantum mechanics
calculations (PBE-DFT) on semi-infinite slabs. We find a new mechanism in solution:
O2 2Oad (Eact = 0.00eV),
Oad + H2Oad 2OHad (Eact = 0.50eV),
OHad + Had H2Oad (Eact = 0.24eV),
in which OHad is formed by hydration of surface Oad.
For the gas phase (hydrophilic phase of Nafion), we find that the favored step for
activation of the O2 is
Had + O2ad OOHad (Eact = 0.30eV OHad + Oad (Eact=0.12eV)
followed by
Oad + H2Oad 2OHad (Eact = 0.23eV), OHad + Had H2Oad (Eact = 0.14eV).
This suggests that to improve the efficiency of ORR catalysts, we should focus on
decreasing the barrier for Oad hydration while providing hydrophobic conditions for the
OH and H2O formation steps

19
Introduction
Critical to the performance of Polymer Electrolyte Membrane Fuel Cells (PEMFC) is
the efficiency of the reaction in which protons (passed through the electrolyte) from the
anode reduce O2 at the cathode to form H2O, the oxygen reduction reaction (ORR) 1–4.
Currently the best cathode catalysts are Pt or alloys of Pt with Co or Ni62–63, but the
efficiency remains unacceptably low while the costs are too high. In order to improve the
performance of current PEMFCs, it is important to understand the chemical mechanism,
that is, the sequence of fundamental reaction steps taking protons delivered to the cathode
and O2 to form H2O.
We consider here the Nafion PEMFC, in which we have shown64–65 that for standard
humidity conditions (H2O/SO3 ratio ~ 15) the Nafion has percolating water channels (~ 4
nm wide) with ionized sulfonic acid groups (R-SO3-) lining the surface intermixed with
percolating hydrophobic (Teflon-like) regions (Figure 3-1). We assume here that O2
accesses the catalyst surface via the hydrophobic regions (modeled as gas phase) while
the protons migrate through the water channels (the solution phase).
As shown in Chapter 2, considering solvent effect, the two known mechanisms,
namely the O2-diss mechanism and the OOH-form mechanism, all have to go through an
unfavorable OH formation with a barrier of 1.09eV, contrary to the fact that Pt is an
effective catalyst for ORR. Here we report two alternative mechanisms which bypass the
difficult OH formation.

20
Methodology
In this study, the Pt catalyst particle was modeled as a slab infinite in two directions
(a and b) and finite in the third direction (c). We consider a 3×3 supercell of the (111)
surface (9 atoms) that is six layers thick (54 atoms). The top two layers are allowed to
relax, representing the active surface while the bottom four layers are fixed, representing
the bulk side of the surface. The same model was applied in previous studies.66
All calculations employed the kinetic and exchange-correlation functional developed
by Perdew, Burke and Ernzerhof (PBE) 30. We used the Seqquest29 implementation with
an optimized double-zeta plus polarization Gaussian-type basis set contracted from
calculations on the most stable unit cell of the pure elements. Angular-momentum-
projected norm-conserving nonlocal effective core potentials34–37 (pseudopotentials) were
used to replace the core electrons. Thus, the Pt atom was described with 16 explicit
electrons (six 5p, one 6s, and nine 5d in the ground state). The real-space grid density
was 5 points per Angstrom, while the reciprocal space grid was 5×5×0 for slab
calculations. All calculations allowed the up-spin orbitals to be optimized independently
of the down spin orbitals (spin unrestricted DFT).
The solvation of the water phase employed a continuum model based on the Poisson-
Boltzmann approximation23–25,38. All reaction pathways were determined using the
Nudged Elastic Band55–56 method and solvent effects were included for each point along
the path.

21
Results and Discussion
The most common mechanism, denoted as O2-diss-gas14 is
1a. O2g O2ad (no barrier)
1b. O2ad 2 Oad [Eact = 0.57 eV (Pt), 0.72(Pd)]
1c. Oad + Had OHad [Eact = 0.74 eV (Pt), 0.30 (Pd)]
1d. OHad + Had H2Oad [Eact = 0.14 eV (Pt), 0.58 (Pd)].
Many studies have focused only on the O2 dissociation step (1b) 16–18,67, however, we
find step 1c to be the rate determining step (RDS). Enthalpies and barriers for steps
possibly important for ORR on Pt and Pd are presented in Table 3-1 and Table 3-2.
Recently Mavrikakis, etc.68, published gas phase barriers for the first five reactions in
table 1a for Pt and Pd, but without allowing the metal surface slab to relax. As a result
their barriers are 0.00–0.25eV too high for Pt and 0.00–0.65eV too high for Pd.
A second possible pathway14, OOH-form-gas, for ORR involves activation of O2ad
with Had prior to dissociation:
2a. O2g O2ad (no barrier)
2b. Had + O2ad OOHad [Eact = 0.30 eV (Pt), 0.55 (Pd)]
2c. OOHad OHad + Oad [Eact = 0.12 eV (Pt), 0.26 (Pd)]
2d. Oad + Had OHad [Eact = 0.74 eV (Pt), 030 (Pd)]
2e. OHad + Had H2Oad [Eact = 0.14 eV (Pt), 0.58 (Pd)].
In this mechanism Had activates O2 to form OOH (Eact = 0.30 eV) and then OOHad
dissociates to form Oad and OHad (Eact = 0.12 eV). This leads to a barrier of 0.30 eV,

22
making the OOH pathway preferred over the direct O2 dissociation pathway (0.57 eV) in
gas phase. However, the RDS remains step 2d (same as 1c).
In the above mechanisms, Had is assumed to be available as reactant on the surface. At
normal operating potentials, H+ is the stable form; thus the mechanisms involving Had
require an additional step of the Had formation from H+:
H+ + e Had (step 0).
Assuming an electrode potential of 0.80 V versus SHE leads to ∆E = 0.25 eV for Pt
and 0.11 eV for Pd (see Chapter 4 for more details). According to Norskov, etc.17, the
enthalpy of step 0 is related to that of
H+ + e 1/2H2 Had
which is barrierless for SHE69. Thus the reaction barrier at an electrode potential of 0.80
V relative to the SHE will likely be close to the reaction enthalpy. Our estimated barrier,
0.25 eV, is consistent with 0.33 eV calculated by Anderson, etc.69, for Pt. The barriers,
0.25 eV for Pt and 0.11 eV for Pd, are smaller than the RDS barriers for all mechanisms
considered in our paper and do not affect our discussions.
We report here a new mechanism, OOH-form-hydr-gas, for ORR that avoids the high
barrier of 1c or 2d for OHad formation. This involves hydrolysis of Oad by H2Oad, step 3d,
as an alternative mechanism for forming OHad from Oad:
3a. O2g O2ad (no barrier)
3b. Had + O2ad OOHad [Eact = 0.30 eV (Pt), 0.55 (Pd)]
3c. OOHad OHad + Oad [Eact = 0.12 eV (Pt), 0.26 (Pd)]
3d. Oad + H2Oad 2OHad [Eact = 0.23 eV (Pt), 0.30 (Pd)]
3e. OHad + Had H2Oad [Eact = 0.14 eV (Pt), 0.58 (Pd)].

23
Here OOH-form-hydr-gas involves OOH formation (Eact = 0.30 eV) and then OOHad
dissociation to form Oad and OHad (Eact = 0.12 eV) as in OOH-form-gas. But this is now
followed by step 3d, hydration of adsorbed oxygen (Eact = 0.23 eV) (Figure 3-2), and then
step 3e (Eact = 0.14 eV). Thus step 3b with Eact = 0.30 eV is the RDS for Pt versus 0.55
eV for Pd, indicating Pt to be much better.
Indeed, this Oad hydration step has been observed in experiments by Ertl, et al.70–71,
and plays an essential role in the catalytic formation of H2O at low temperature under
UHV conditions. Our calculated barriers are consistent with the Ertl experimental result
that H2O formation (Ea,calc = 0.14eV, Ea,exp = 0.27eV) is much faster than OH formation
(Ea,calc = 0.23eV, Ea,exp = 0.44eV). Under UHV conditions, the hydration of Oad becomes
impossible at temperature above 180 K because of the low adsorption energy of water on
Pt (calculated 0.21 eV). But under ORR conditions, there is an abundant supply of water
on the surface so that hydration becomes an essential step for ORR. Michaelides and
Hu10,48 using DFT methods (GGA PW91), found results similar to ours: 0.33 eV for step
3d, 0.21 eV for step 3e, 0.96 eV for step 2d—all 0.1 to 0.2 eV higher than our results,
probably because they used smaller 2×2 unit cells and only three- and four-layer slabs
instead of a 3×3 unit cell and a six-layer slab as in our calculations.
Next we consider how solvation affects the mechanism of ORR using our recently66
developed approach for estimating the effect of the water phase on these barriers. The
contribution of solvation is calculated implicitly using the Poisson-Boltzmann continuum
model23–24. Including solvation we find O2-diss-solv mechanism:
4a. O2g O2ad (no barrier)
4b. O2ad 2Oad [Eact = 0.00 eV (Pt), 0.27 (Pd)]

24
4c. Oad + Had OHad [Eact = 0.97 eV (Pt), 0.47 (Pd)]
4d. OHad + Had H2Oad [Eact = 0.24 eV (Pt), 0.78 (Pd)]
Thus solvation effects dramatically influence the barriers. The O2 dissociation barrier
drops to zero for Pt (0.27 eV for Pd), because of the large solvent stabilization of Oad,
increasing the exothermicity from -1.23 eV in gas phase to -2.18 eV in solution for Pt
(from -1.02 eV to -1.91 eV for Pd). However, the barrier for OHad formation (step 4c)
increases dramatically from 0.74 eV to 0.97 eV, making this mechanism unlikely.
Reaction of OHad with Had to form H2O is quite favorable with a barrier of 0.24 eV.
In solvent the OOHad-form-gas mechanism, involving formation and dissociation of
OOH, becomes OOH-form-solv:
5a. Had + O2ad OOHad [Eact = 0.22 eV (Pt), 0.74 (Pd)]
5b. OOHad OHad + Oad [Eact = 0.00 eV (Pt), 0.10 (Pd)]
5c. Oad + Had OHad [Eact = 0.97 eV (Pt), 0.47 (Pd)]
5d. OHad + Had H2Oad [Eact = 0.24 eV (Pt), 0.78 (Pd)].
Again the RDS becomes OH formation for Pt with a barrier of 0.97 eV and H2O
formation for Pd with a barrier of 0.78 eV. The OOHad formation barrier is higher than
the direct dissociation of O2ad, making it less favorable than the direct O2 dissociation,
step 4b. Thus, we will ignore this mechanism.
In solvent the barrier for OH formation from step 4c or 5c is 0.97 eV, clearly too high
to play an important role at PEMFC operating temperatures. Therefore neither O2-diss-
solv nor OOH-form-solv is appropriate for Pt in an aqueous environment. Instead we find
that O2-diss-hydr-solv is most favorable for solution:
6a. O2g O2ad (no barrier)

25
6b. O2ad 2Oad [Eact = 0.00 eV (Pt), 0.27 (Pd)]
6c. Oad+H2Oad 2OHad [Eact = 0.50 eV (Pt), 0.49 (Pd)]
6d. OHad + Had H2Oad [Eact = 0.24 eV (Pt), 0.78 (Pd)].
Here O hydration (step 6c) is the RDS with a barrier of 0.50 eV for Pt. For Pd the
RDS is H2O formation (step 6d) with a barrier of 0.78 eV, consistent with the decreased
performance of Pd. This new mechanism suggests that a strategy for improving
efficiency of ORR catalysts is to focus on decreasing the Eact for Oad hydration. We have
examined this hydration step for 11 metals in columns 8, 9, 10, and 11 of the periodic
table and find that the lowest barriers are for Ni (0.20 eV) and Co (0.04 eV), which are
already known to increase the efficiency of platinum catalysts62–63. (Of course the
improved performance might arise from other effects, for example, easier OH removal63
and lower coverage benefiting O2 dissociation.) We also find low hydration barriers for
Os (0.54 eV), Ru (0.69 eV), and Ir (0.69 eV), suggesting that alloying with these
elements might also improve the efficiency of Pt cathodes.
The above solvation calculations considered reactions involving Had formed from H+
in solution. There might be a direct pathway for H3O+ to transfer the H+ directly to OHad
with a lower barrier than the 0.24eV we calculate for Had, but since this is not the RDS
we did not consider it. Similarly a direct process for Oad OHad involving H3O+ could
lower the barrier below the 0.94eV we find for Had, but we suspect that the hydration of
Oad is still the favorable step.
The above discussion considered separately the gas phase and solution phase
reactions, but the PEMFC allows the O2 to access the catalyst through the hydrophobic
regions of the Nafion membrane while the protons to form H2O arrive through the

26
sulfonic acid lined water channels (illustrated in Figure 3-1). In this case, the O2g would
dissociate to form Oad in the hydrophobic region, which would stay fixed since the barrier
for Oad migration is 0.42 eV (Pt). Thus we expect that some H2O will migrate into this
region to form OHad via the Oad hydrolysis mechanism. However we do not want a full
monolayer of H2O in this hydrophobic region since it would impede O2 dissociation.
Next we must account for H2O formation. We assume that the OHad is formed
initially in the hydrophobic region, but since the OHad migration barrier is < 0.1 eV, it can
migrate to the part of the Pt in contact with the water channels to react directly with H3O+
at the interface. Alternatively it could remain in the hydrophobic region to react with Had
moving along the surface (barrier only 0.09 eV) from the part of the catalyst in contact
with the water channel. A third alternative is that OH in the middle of a monolayer of
H2O in the hydrophobic region could exchange hydrogen (OHad + H2Oad H2Oad +
OHad, Eact = 0.03 eV) to effectively migrate the OHad to the water channel for reaction
with H3O+.
Probably the best design would have the O2 dissociate on the Pt at the interface
between hydrophobic and water phases of Nafion so that the Oad could contact H2Oad to
form OHad on the hydrophobic side but next to the water phase, allowing extraction of the
proton from H3O+ to form H2Oad. Thus the optimum membrane for Pt might have the
aqueous and hydrophobic phases alternate to maximize the contact length between these
phases on the catalyst’s surface.
27
Conclusion
In this study we studied systematically the ORR mechanisms on the Pt (111) surface.
In addition to the two known mechanisms, namely O2 dissociation and OOH formation,
we proposed two novel mechanisms involving the O hydration reaction Oad + H2Oad
2OHad. Without solvent effect, the preferred mechanism becomes OOH-form-hydr-gas
mechanism involving OOH formation, OOH dissociation, O hydration, and H2O
formation with an overall barrier of 0.30eV for Pt, as compared to 0.55eV for Pd. This
agrees with the fact that Pt is a better catalyst for hydrogen oxidation, as compared to Pd.
With solvent effect, the preferred mechanism is O2-diss-hydr-solv with an overall barrier
of 0.50eV for Pt, as compared with the 0.78eV for Pd. It also agrees with the
experimental result that Pt is a good catalyst for ORR in aqueous condition. The RDS for
Pt with solvation is the O hydration step. Hence it suggests that to improve the efficiency
of ORR catalysts, we should focus on decreasing the barrier for Oad hydration while
providing hydrophobic conditions for the OH and H2O formation steps

28
Tables and Figures
Reaction Step Barriers Pt E(gas) Eact(gas) E(solv) Eact(solv) E(gas,exp)
O2 Dissociation -1.23 0.44* -2.18 0.00 0.3045
OH Formation -0.32 0.74 -0.07 0.97
H2O Formation -0.78 0.14 -0.56 0.24 0.2771
OOH Formation -0.24 0.30 -0.19 0.22
OOH Dissociation -1.30 0.12 -2.07 0.00
H-OOH dissociation -1.62 0.14 -2.14 0.00
O hydration 0.46 0.23 0.49 0.50 0.4471
Table 3-1. Enthalpies and barriers (eV) for steps possibly important for ORR on Pt
*We find coverage dependence for O2 dissociation. The barrier is 0.51eV for c(2x2),
0.45eV for c(3x3), and 0.44eV for (4x4) for a three layer slab. The experimental value is
for the limit of zero coverage.

29
Reaction Step Barriers Pd E(gas) Eact(gas) E(solv) Eact(solv)
O2 Dissociation -1.02 0.72 -1.91 0.27
OH Formation -0.35 0.30 -0.03 0.47
H2O Formation -0.59 0.58 -0.39 0.78
OOH Formation** 0.12 0.55 0.05 0.74
OOH Dissociation** -1.49 0.26 -1.99 0.10
H-OOH dissociation* -1.85 0.12 -2.01 0.12
O hydration 0.24 0.30 0.36 0.49
* Under conditions with high Had, another mechanism producing OH is possible, but this
is unlikely under ordinary operating fuel cell conditions. See footnote 1
** The H-associated OOHad dissociation mechanism is not preferred because of the O2
dissociation step.
.
Table 3-2. Enthalpies and barriers (eV) for steps possibly important for ORR on Pd
1 When hydrogen is present, it can react with surface OOHad to form two OHad, leading to a barrier of 0.14 eV in gas phase. Combining
this step with formation of OOH leads to the HighH-gas mechanism:
7a. O2g O2ad (no barrier)
7b. Had + O2ad OOHad [Eact = 0.30 eV (Pt), 0.55 (Pd)]
7c. Had + OOHad 2HOad [Eact = 0.14 eV (Pt), 0.12 (Pd)]
7e. OHad + Had H2Oad [Eact = 0.14 eV (Pt), 0.58 (Pd)].
Here the RDS is OOH formation for both gas phase and solvent with Ea = 0.30 eV. This mechanism might be favorable only under
extremely high coverage of Had, since the barrier for 7c (Had + OOHad) is higher than for 3c (OOHad dissociation). In operating fuel cells, such a
high Had coverage is not likely.

30
Figure 3-1. Illustration of the sulfonic acid lined hydrophilic water channels and
hydrophobic (Teflon-like) regions in Nafion (from references 64-65) showing the likely
locations of the O2g 2Oad, Oad + H2Oad 2OHad, and OHad + Had H2Oad steps in
the hydrophobic channels, but H+ Had at the boundary with the water phase. For the
gas phase process we assume that the proton is chemisorbed on the surface, Had. For Pt in
water at pH = 1 (typical for a fuel cell), this occurs at a potential of -0.06 eV (relative to
the Standard Hydrogen Electrode [SHE]).
Figure 3-2. Potential energy surface (eV) for the Oad hydration step of ORR.
31
Chapter 4 Prediction of Optimum Operating Voltage for the
Fuel Cell Oxygen Reduction Reaction from DFT Calculations
Abstract
In order to use density functional theory (DFT) to seek improved catalysts for the
Oxygen Reduction Reaction (ORR) in Proton Exchange Membrane Fuel Cells (PEMFC),
we develop a systematic way to handle the barriers of electron transfer reactions [e.g., H+
+ e + Oad OHad] within the DFT framework. We apply this new method to determining
the optimum operating electrochemical potential for the Pt-catalyzed fuel cell and show
how much the efficiency can be increased by changes in the reaction barriers.
Introduction
Proton exchange membrane fuel cells (PEMFC) are most promising emission-free
energy systems for homes and families1–4. However, poor kinetics for the catalytic
oxygen reduction reaction (ORR) ½ O2 + 2 H+ + 2 e H2O is a formidable obstacle in
lowering the costs to a practical level. Density functional theory (DFT) provides a
powerful method for finding new materials to improve these catalysts. Many DFT
calculations relevant to ORR have been published16,66,68,72–75 in the past decade. However,
a critical issue in such studies is accounting for the dependence of the electron transfer
steps on the external electrochemical potential17,73,76.

32
We develop here a systematic approach for handling the electron transfer step along
with the solvation effects, and including the effect of the external electrochemical
potential on the electron transfer reactions involved in ORR.
We consider the following steps for ORR:
• H+(aq) + e Had (1)
• O2gas O2ad 2Oad (2)
• Oad + (H+ + e)/Had OHad (3)
• OHad + (H+ + e)/Had H2Oad . (4)
For each of these reactions we carried out DFT calculations on the Pt (111) surface
using the PBE functional, as described in the Method Details section below. The resulting
gas phase barriers were corrected for solvation effects as described in our previous
paper66. For reactions 1, 3, and 4 it is necessary to correct these DFT calculations for the
external chemical potential. To do this for 1 we must consider the following steps:
H+ (solv) + e 1/2H2 Had .
At the normal hydrogen electrode (NHE), the free energy of H+ in solution is equal to
the energy of H2 in solution. At an external potential of +V, the free energy of H+ relative
to H2 becomes –V. The DFT calculations for 1/2H2 Had on Pt is -0.44eV, thus the total
enthalpy of reaction 1, is
∆H1 = -0.44eV + V . (a)
The other steps lead to
∆H2 = -2.51eV (b)
∆H3 = -0.28eV + V (c)

33
∆H4 = -1.15 eV+ V . (d)
Methodology
In this study, we used Seqquest29, where the Kohn-Shan equation is self-consistently
solved in a periodic system. The Pt (111) surface is approximated as a semi-infinite slab
with a c(2x2) unit cell and three layers of atoms. One side (the bottom layer) is fixed to
approximate the bulk side while the other side (the top two layers) is relaxed to
approximate the surface.
The solvent effect for such charged system can be evaluated by taking the DFT-
calculated Mulliken charge as input for the Poisson-Boltzmann equation as described in
our earlier paper66. Here, we used the Adaptive Poisson Boltzmann Solver (APBS)
method38–40 solver incorporated in the Computational Materials Design Facility41
(CMDF).
The reaction path is optimized by nudge elastic band55–56 (NEB) method. Every
image along the path is reoptimized at different charge (+q) with atoms deciding the
reaction coordinates fixed. Due to the periodic nature of the method, a partial charge is
allowed. The partial electron given away by the surface is assumed to go to the Fermi
surface, ending with an energy gain of qEfermi.
Efermi is not directly taken from the gas phase DFT calculation because of the
difficulty in deciding the work function with solvation. Nor did we use the experimental
value because it may not be compatible with the calculated value due to possible
systematic bias. Instead, we first benchmark the calculated values using the standard
cycle as follows.
34
H+ (solv) H+ (gas) H+ (gas) + e 1/2H2
The first step is the solvation of H+ which had been accurately calculated as
+11.92eV77. The second step involves getting an electron from the Fermi level of the
electrode, so the energy cost is exactly Efermi, NHE. The third step can be calculated by DFT
as -15.86eV. So the total energy cost is +11.92 + Efermi + (-15.86) = Efermi - 3.94eV. From
the fact that H (1/2H2) = H (H+solv), we have Efermi - 3.94eV = 0eV. So the NHE work
function consistent with our method would be 3.94eV. At ORR condition (0.8V relative
to NHE), the work function is hence -4.74eV.
Our calculations showed that a change in Efermi from DFT calculation does not
change the binding energy as well as the reaction barriers. The details are shown in
supporting information. So in this study we use the above value (-3.94eV and -4.74eV) in
equation (*) and ignore any change brought by a change in work function.
In order to determine the reaction barriers for reactions 1, 2, and 3 we have to
determine the reaction barrier as a function of charge. We do this by considering the full
reaction surface for fixed total charges ranging from zero to +1 in 0.1 increments as
shown in Figure 4-1 (taking reaction 2 as example). This leads to the surface shown in
Figure 4-2 where the two coordinates are charge and reaction progress. Based on Figure
4-2 we construct the reaction path in which q adjusts along the reaction path to find the
lowest overall barrier for the overall reaction. This leads to the overall reaction path
shown in Figure 4-3, where the charge changes continuously from +1 to +0.7 at the
transition state and then changes from 0.7 to zero as we proceed to the products. In Figure
4-1, Figure 4-2, and Figure 4-3 we assumed the external potential to be zero.
35
For an external potential of +V relative to NHE, the relationship between q and the
external potential is given by
E+q, corrected, solv = E(+q)gas,DFT + q * Efermi + Esolvation (*)
Efermi = Efermi(NHE) +V .
Using equation (*) we carried out similar calculations for V = 0.0 – 1.2 in 0.1
increments and calculated the PES at different electrode potentials, leading to results as in
Figure 4-4. Figure 4-4 summarizes the net barrier as a function of external potential. Here
we see that the barrier = 0.68eV and ∆H=0.40eV are independent of the external potential
up to V=0.6eV, because Had is either more stable or slightly less stable than H+. Then
from V=0.6 to 1.2 the ∆H increases linearly to 0.95eV at 1.23eV while the barrier
increases monotonically to 0.96eV at 1.23eV, because H+ is increasingly more stable than
Had and the reaction becomes strongly endothermic.
The barriers and ∆H for reactions (1) and (4) are shown in Figure 4-6. We see that
throughout the operating range (0.0-1.23V), OH formation dominates the reaction.
Results and Discussion
Hydrogen reduction reaction (Volmer Reaction) H+ Had
The first step, the hydrogen evolution reaction (Volmer reaction78) is
H+ (aq) + e 1/2H2 .
The reaction enthalpy as a function of V is shown in Figure 4-8 and the reversible
potential can be calculated by using the following cycle
H+ (aq) 1/2H2 (gas) Had (solv) .

36
The first step has reaction enthalpy of 0.00eV because H(H+(aq)) = H(1/2H2) by
definition. The second step is the binding energy of Had and has an enthalpy of -0.62eV,
leading to an overall reaction enthalpy of -0.62eV. This implies that Had would be
preferred at potential below 0.62eV versus NHE, differing from the experimental value of
0.40V79–80. The difference comes from the stabilization of H3O+ near the surface. Using
equation (*) and starting from H3O+surface(solv) near the surface, the reaction has ∆H =
-0.44eV. As the electrode potential goes higher, the reaction changes from endothermic
to endothermic, making H3O+ the more stable form. The calculated reversible potential
0.44V agrees with the experimentally measured 0.40V79–80, as well as the Hupd region on
the cyclovoltammetry curve in acid media63.
Using similar methods as described above, we calculated the PES of Volmer reaction
at +0.0V, +0.3V, +0.7V, and +1.0V and used it to determine the barrier of the Volmer
reaction at various potentials, as shown in Figure 4-8. We see that as the potential
increases, the reaction changes from exothermic to endothermic and the reaction begins
to have a barrier. These results show that as the potential goes above 0.44V relative to
NHE, Had becomes less available. Although endothermic, the Volmer reaction can still
proceed as the source of Had. As the electrode potential continues to increase, at
sufficiently high electrode potential the Volmer step would become the RDS for all
mechanisms involving Had.
OH formation reaction H+ + Oad OHad
Equation (**) shows the reaction enthalpy as a function of external potential for
reaction (c).
H+(aq) + Oad(solv) 1/2H2(gas) + Oad(solv) OHad(solv) (**)
37
The reaction enthalpy is -0.47eV at 0.0V relative to NHE, leading to a reversible
potential of 0.47V. For the ORR condition, the reaction enthalpy increases to 0.33eV at a
potential of 0.80V versus NHE due to solvent effect.
Similar to the case of Volmer reaction, starting from a H3O+ near the surface, we have
a slightly different reaction enthalpy. At 0.0V relative to NHE, the reaction enthalpy
calculated by equation (*) is -0.27eV, smaller than the -0.47eV for free H3O+(solv), due
to the stabilization of H3O+ near the surface. As a comparison, as the potential at the
electrode increases, the reaction becomes endothermic. At 0.8V relative to NHE, the
reaction enthalpy becomes 0.52eV. However, as discussed earlier, Had is the preferred
form at 0.0V relative to NHE. In the presence of a nearby Oad, this preference becomes as
large as 0.67eV. So at 0.0V relative to NHE, H3O+ would first get adsorbed onto the
surface leading to Had, which would then react with Oad, either directly or indirectly
(through a H2O bridge). The preference is flipped at electrode potentials larger than
0.67V. Consequently, at low potential (0–0.67V versus NHE) the reaction proceeds as
H+HadOHad, while at higher potential (> 0.67V versus NHE) the reaction proceeds
as H+OHad. The reversible potential between H+, Oad and OHad is -0.27V relative to
NHE, while the reaction Had + Oad OHad (through a H2O bridge) is always
endothermic on Pt surface.
Using similar methods, we were able to determine the PES at various electrode
potentials. Figure 4-4 shows the PES for formation of OH from Had at 0.0V and from H+
at 0.8V and 1.23V versus NHE. The hypothetical PES starting from H+ at NHE potential
is also provided, although Had is the preferred form. At 0.0V versus NHE, the barrier is

38
0.68eV. As potential increases, barrier increases and OH formation from H+ and Had
becomes more unfavorable. At the ORR condition (0.8V), it has a barrier of 0.70eV.
As shown in our previous paper66, the barrier for direct formation of OHad from Oad
and Had is 0.97eV. Since the barrier for H+ + e Had is always smaller than that of H+ +
Oad OHad, the H+/Had balance could be viewed as always being at equilibrium. The
one-step reaction H+ + Oad OHad is preferred, because the barrier is always smaller
than 0.97eV. Thus the actual OH formation mechanism has two different regions:
• For 0.0V to 0.34V relative to NHE, it is H+ Had OHad (through a H2O).
• For > 0.34V relative to NHE, it is H+ + Oad OHad
Water formation reaction H3O+ + OHad H2Oad
Similarly, the reaction enthalpy from a free H+ in solution can be directly calculated
using the cycle
H+(solv) + OHad(solv) 1/2H2(gas) + OHad(solv) H2Oad(solv) . (**)
The reaction enthalpy ∆H = -1.02eV on Pt surface. At ORR condition, however, it
increases to -0.22eV at 0.8V versus NHE. Taking into the interaction between H3O+ and
the surface OHad, the reaction enthalpy becomes -1.15eV. Again, Had is the preferred
form at NHE potential by 0.69eV, lowering the reaction enthalpy to -0.46eV. As
electrode potential increases to above 0.69eV, H3O+ directly react with OHad to form
H2Oad.
Due to the exothermic nature of the reaction, it does not have a barrier in the range of
0.0–1.15V relative to NHE. The PES of the reaction at 0.0 starting from Had and at 0.8,
1.23V relative to NHE are shown in Figure 4-9. We also included a hypothetical PES
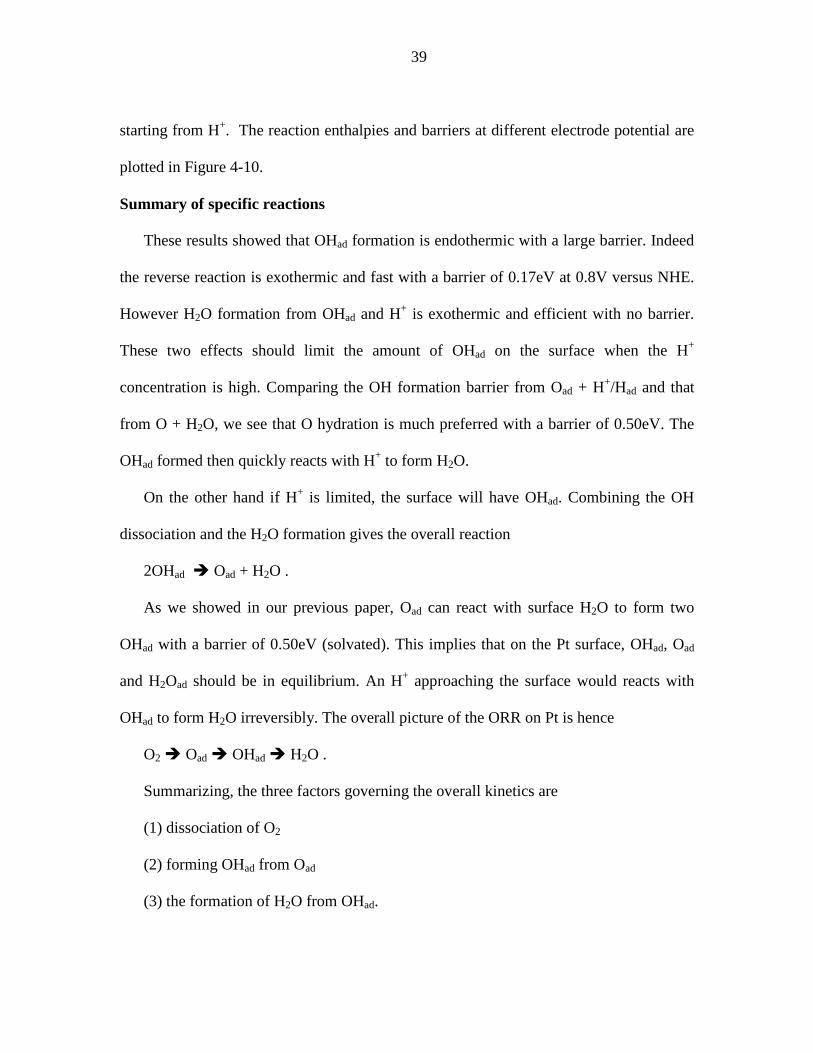
39
starting from H+. The reaction enthalpies and barriers at different electrode potential are
plotted in Figure 4-10.
Summary of specific reactions
These results showed that OHad formation is endothermic with a large barrier. Indeed
the reverse reaction is exothermic and fast with a barrier of 0.17eV at 0.8V versus NHE.
However H2O formation from OHad and H+ is exothermic and efficient with no barrier.
These two effects should limit the amount of OHad on the surface when the H+
concentration is high. Comparing the OH formation barrier from Oad + H+/Had and that
from O + H2O, we see that O hydration is much preferred with a barrier of 0.50eV. The
OHad formed then quickly reacts with H+ to form H2O.
On the other hand if H+ is limited, the surface will have OHad. Combining the OH
dissociation and the H2O formation gives the overall reaction
2OHad Oad + H2O .
As we showed in our previous paper, Oad can react with surface H2O to form two
OHad with a barrier of 0.50eV (solvated). This implies that on the Pt surface, OHad, Oad
and H2Oad should be in equilibrium. An H+ approaching the surface would reacts with
OHad to form H2O irreversibly. The overall picture of the ORR on Pt is hence
O2 Oad OHad H2O .
Summarizing, the three factors governing the overall kinetics are
(1) dissociation of O2
(2) forming OHad from Oad
(3) the formation of H2O from OHad.

40
Most metals in columns 8–11 have low or no barrier for (1), except Au. For (2), only
Au and Ag have a favorable reaction enthalpy perspective from Oad + H+. All other
metals go through O hydration. For (3), our earlier results showed that only Au, Ir, Os, Pt,
and Pd would be able to form H2O from OHad and H+ at above 0.8V versus NHE, which
agrees with experimental studies showing only Pt and Pd are effective catalysts.
To improve ORR catalysts, we want a weaker O binding energy to make the OH
formation easier. Also a weak OH binding energy is desired if the surface is not
composed of Pt or Pd to make H2O formation exothermic at above 0.8V versus NHE.
Optimal power
Figure 4-6 shows the barriers of the various ORR reaction steps (1), (3), and (4) from
Figure 4-5, Figure 4-8, and Figure 4-10, as compared with the potential independent
barrier for (2). We see that the RDS is reaction (c) in all cases. Writing the total current
as
I = AExp(-Ea,RDS(V)/RT)
the total power is
P = IV = AVexp(-Ea,RDS(V)/RT)
which is plotted as a function of V in Figure 4-11. Here we see that the optimal potential
is predicted to be V= 0.68V. Normally, the ORR fuel cell is operated at 08V relative to
NHE. Our results suggest, however, that an operating potential of 0.68 would lead to a
power 2.8 times larger than for 0.8V versus NHE.
This model can help assess the impact of potential improvements. For example, if we
can modify the catalyst to decrease the barrier for forming OHad from Had by 0.05eV,
Figure 4-11 shows that the power would improve by a factor of 2.81 and the optimal

41
operating potential would drop to Vop = 0.60. Such a change in the barrier could be also
be achieved by making Had less stable by 0.10–0.40eV, perhaps by alloying. (For
example, Ni binds H 0.34eV less strongly than Pt, and it is well known that Pt3Ni leads to
improved rates63).
Alternatively we might destabilize H+ relative to Had by modifying the solvent
(lowing the dielectric constant). Thus changing the dielectric constant from 80 to 40
would destabilize H+ by 0.12 eV.
Comparison to previous methods
Norskov, etc.17, tried to handle the effect of electrode potential by approximating the
energy of the electron as the Fermi level calculated by Efermi = Efermi, NHE + ∆E (relative to
NHE) and using the fact that G(1/2H2) = G(H3O+) = 0. Then the energy of each
intermediate can be calculated directly. The method has been used to predict the
overpotential of oxygen reduction reaction from the reaction enthalpy perspective.
However this method can only handle one unit of electron transfer. For transition states
(TS), the charge of the system is undetermined, so this method is not applicable for
barrier calculations.
In contrast, Anderson et al.76,81 used a finite system and assumed that the electron
transfer step is the transition state. Thus they scanned the potential energy surface (PES)
of the diatomic association reaction Pt + H PtH and Pt + H+ PtH+ and assumed that
a configuration serves as the TS when the Fermi level coincides with the average of
ionization potential (IP) and electron affinity (EA). The method gives an approximate
barrier at various potentials. But the assumption of a diatomic model and the Fermi level
makes this unreliable for a real ORR system.

42
Furthermore, both methods ignore solvent effects, likely an essential factor for the
ORR in a fuel cell66. Assuming a +1 charge for the system, H3O+ H2O + Had+ is
barrierless because of the high energy from charge separation in H3O+. In comparison,
aqueous H3O+ is stabilized by a huge solvation energy of 11.92eV82–83. The Norskov
approach, bypasses this problem by using the G(H2)=G(H3O+), but this can only work
with the starting and ending states. The Anderson approach can be used to calculate the
solvent effect for the cluster, but this is likely very different than for a full electrode
surface. Recently, we developed a new approach66 for using the Poisson Boltzmann
continuum model23–24 to predict solvent stabilization. We found that the calculated
implicit solvation energy agrees well with known explicit solvation66 for ORR system on
Pt. We found that including solvation leads to a substantial change in the favored
mechanism for ORR on Pt84.
Conclusion
In this study, we studied systematically the three typical reactions involving electron
transfer for ORR. The results showed that Had is preferred at 0.44V or lower relative to
NHE, while H+ is preferred at higher electrode potential. At the ORR potential, OH
formation from H+ and Oad is the preferred mechanism rather than direct formation from
Had and Oad, but it still bears a barrier of 0.70eV at ORR potential. Considering the Oad
hydration barrier of 0.50eV, Oad hydration is the major source of OHad on the surface.
H2O formation poses a fundamental limit for ORR on metals towards higher
operating voltage. On Pt, the 1.15eV reversible potential makes it impossible to develop
Pt-based materials operating at higher than 1.15eV. For the current developments for

43
substitutes of Pt, with this limitation, metals with stronger binding energy with OHad can
be directly eliminated from the candidate list of better ORR catalysts. Only Pd-, Rh-, and
Au- based materials will have fair enough H2O formation efficiency.

44
Tables and Figures
Figure 4-1. Reaction path for Oad + H+ + e OHad in which the electrode potential is
kept fixed. The bright green line shows the optimal path.

45
Figure 4-2. Contour plot for the energy surface for the reaction Oad + H+ + e OHad in
which charge and OH formation are considered as two independent coordinates. The
green curve gives an optimal reaction path at +1.0 electrode potential.
Figure 4-3. The optimal reaction PES at electrode potential of +1.0V versus NHE where
at each point the charge is indicated

46
Figure 4-4. Optimal PES of H+ + Oad OHad for various electrode potentials. Each line
in this plot represents the “green” line selected from Figure 4-1, Figure 4-2, and Figure
4-3. In the NHE line, the reaction starts with Had because that is below the reversible
potential of H+ Had and hence Had is the preferred form (see the corresponding section
for details). For simplicity, here we show only the three typical cases and an imaginary
line supposing reaction from H+.

47
Figure 4-5. Potential dependent barrier for H+ + Oad OHad. Each point in the barrier
line represents the TS point (highest energy point in Figure 4-4), while each point in the
enthalpy curve represents the difference between the starting and ending point in Figure
4-4.

48
Figure 4-6. Barriers of reaction (1)–(4), the four steps involved in the ORR. In general,
all barriers increase as electrode potential increases. OH formation dominates the ORR
reaction.
Figure 4-7. Potential dependent PES for H+ Had

49
Figure 4-8. Potential dependent barriers for H+ Had
Figure 4-9. Potential dependent PES for H2O formation
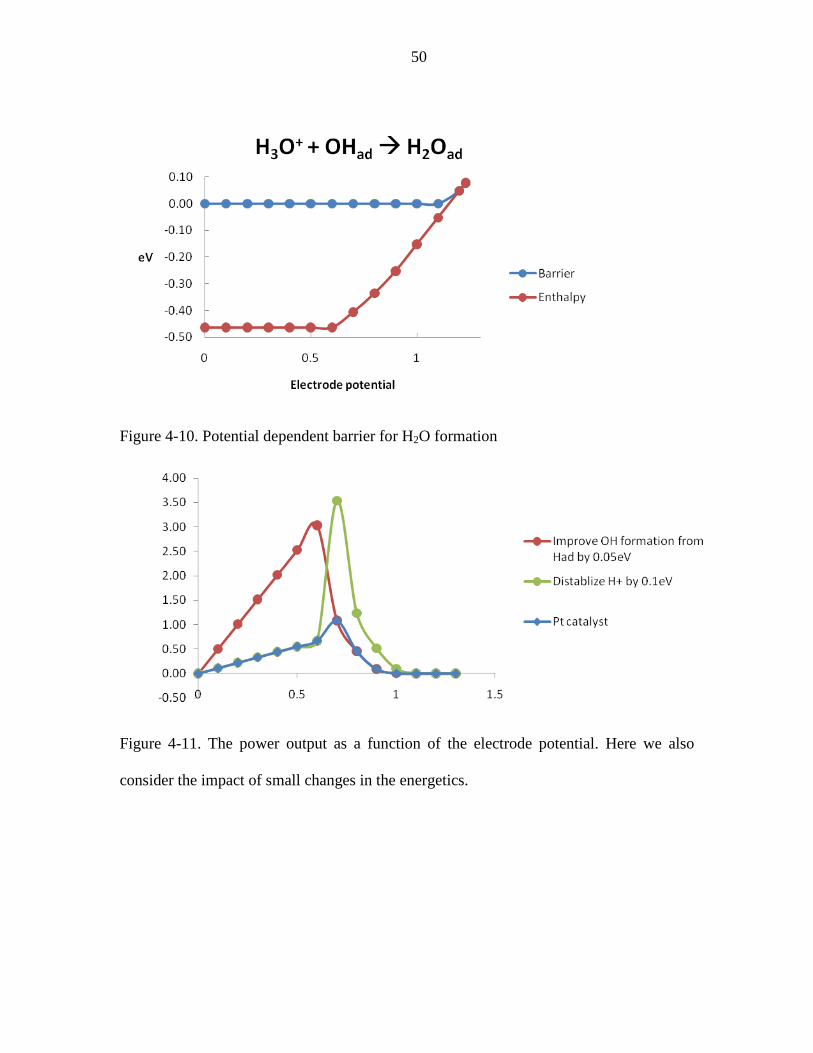
50
Figure 4-10. Potential dependent barrier for H2O formation
Figure 4-11. The power output as a function of the electrode potential. Here we also
consider the impact of small changes in the energetics.

51
Chapter 5 Density Functional Studies of the Fuel Cell Oxygen
Reduction Reaction on Co and Ni Surfaces
Abstract
We calculated the binding preferences of various intermediates involved in the
oxygen reduction reaction (ORR) on the closest packed surfaces of Co (0001) and Ni
(111). In addition we calculated the barriers for all plausible steps for all five ORR
pathways that have been discussed or suggested on these surfaces. These calculations
were carried out under two conditions:
• hydrophobic or gas phase, assuming the Teflon part of the Nafion electrolyte to be
in contact with the catalyst surface, and
• hydrophilic for the part of the catalysts exposed to the water channel of the Nafion.
These studies were undertaken as part of a project to determine how various parts of
the ORR are affected by choice of the metal or solvent. Both Ni and Co lead to huge H2O
formation barriers (1.00eV for Ni and 1.43eV for Co), mainly due to the very large
binding energy of OHad to these electropositive metals. To complete the ORR, Co and Ni
must be combined with a metal having a low H2O formation barrier such as Pt or Au.
Introduction
The inefficiency of the oxygen reduction reaction (ORR) is a key impediment for
commercial use of PEMFC in automobiles1–4. The best current catalysts are still Pt and
the Pt3Ni63 and Pt3Co alloys62. A great amount of experimental research has been carried

52
out searching for improved catalysts, but progress has been slow. Consequently we have
embarked on a project to systemically examine the various possible ORR reactions, first
on various pure transition metals and then on the various alloys. The hope is that these
systematic studies may point the way to build alloys that can achieve fast kinetics and
stability. Our first such systematic study84 was on Pt and Pd where we discovered a new
mechanism, involving hydration of surface oxygen, Oad, as the rate determining step
(RDS) for ORR on Pt, (Ea = 0.50 eV). This suggests a strategy for improving the ORR
efficiency by alloying Pt with an element that could decrease the hydration barrier.
Indeed we show here that of the 12 metals in columns 8-11 of the periodic table the two
with the lowest hydration barriers are Ni (Ea = 0.48) and Co (Ea = 0.62). In this study, we
study systematically all possible ORR mechanisms on Ni and Co to learn how they affect
various mechanisms of ORR and why alloying with Pt leads to reduced barriers.
Methodology
In this study, the Ni and Co catalysts were modeled as a slab infinite in two directions
(a) and (b) and finite in the third direction (c). We consider a 3×3 supercell of the (111)
surface (9 atoms) that is six layers thick (54 atoms). The top two layers are allowed to
relax, representing the active surface while the bottom four layers are fixed, representing
the bulk side of the surface. The same model was applied in previous studies on Pt66.
All calculations employed the kinetic and exchange-correlation DFT functional were
developed by Perdew, Burke, and Ernzerhof (PBE) 30. We used the Seqquest29
implementation with an optimized double-zeta plus polarization Gaussian type basis set
contracted from calculations on the most stable unit cell of the pure elements. We used

53
the small-core angular-momentum-projected norm-conserving nonlocal effective core
potentials34–37 (pseudopotentials) to replace the core electrons. Thus, the neutral Ni atom
was described with 16 explicit electrons (six 3p, one 4s, and nine 3d in the ground state),
while neutral Co has 15 electrons (the comparison calculations with Pt included the 5p,
5d, 6s electrons on the Pt, so neutral Pt has 16 electrons). The real space grid density was
5 points per angstrom, while the reciprocal space grid was 5×5×0 for slab calculations.
All calculations allowed the up-spin orbitals to be optimized independently of the down-
spin orbitals (spin-unrestricted DFT). The two periodic cell parameters are based on the
optimized Co and Ni bulk structure (which are 2.6% and 1.4% smaller than the
experimental value).
The implicit solvation of the water phase employed a continuum model based on the
Poisson-Boltzmann approximation23–25,38. All reaction pathways were determined using
the nudged elastic band55–56 method and solvent effects were included for each point
along the path.
Results and Discussion
Binding sites and energies
For the closed packing surfaces (111 for Ni and 0001 for Co), we find 14,66 four types
of binding sites to be important:
• top site (µ1),
• bridging site (µ2),
• fcc hollow site (µ3f), at the C site when the top 2 closest packed layers are AB,
• hcp hollow site (µ3h) at the A site when the top 2 closest packed layers are AB.

54
Thus our first step was to determine the preferred binding sites for each intermediate
species that might plausibly be involved in the ORR on Ni and Co. The binding energies
for H, O, O2, OH, OOH, H2, and H2O2 are shown in Table 5-1. The binding sites are
illustrated in Figure 5-1.
Generally, Ni and Co surfaces have much stronger interaction with electronegative
species than Pt. Thus:
• BEgas[Oad] = 5.28eV for Co (µ3h) gas phase and BEsol[Oad] = 5.88 eV for Co (µ3h)
in water solvent.
• BEgas[Oad] = 4.84eV for Ni (µ3f) gas phase and BEsol[Oad] = 5.37 eV for Ni (µ3f) in
water solvent.
(For comparison, BEgas[Oad] = 3.59eV on Pt (µ3f) gas phase and BEsol[Oad] = 4.28 eV
for Pt (µ3f) in water solvent.)
This makes O 1.69eV and 1.25eV more stable on Co and Ni than Pt. Solvent effect
helped balance the difference, leading to a smaller, yet still huge, difference of 1.54eV
and 1.04eV for Co and Ni, respectively.
Similarly, Co and Ni also bind stronger with OH as compared with Pt. Thus
• BEgas[OHad] = 3.56 eV for Co (µ3h) gas phase and BEsol[OHad] = 3.83 eV for Co
(µ3h) in water solvent, and
• BEgas[OHad] = 3.13 eV for Ni (µ3c) gas phase and BEsol[OHad] = 3.44 eV for Ni
(µ2) in water solvent,
as compared with BEgas [OHad] = 2.23 eV on Pt (µ2) gas phase and BEsol [OHad] = 2.71
eV for Pt (µ1) in water solvent.

55
However H2O does not have strong binding with any of the metals.
• BEgas [H2Oad] = 0.21 eV for Co (µ1) gas phase and BEsol [H2Oad] = 0.55 eV for Co
(µ1) in water solvent, and
• BEgas [H2Oad] = 0.36 eV for Ni (µ1), gas phase and BEsol [H2Oad] = 0.70 eV for Ni
(µ1) in water solvent,
as compared with BEgas [H2Oad] = 0.21 eV on Pt (µ1) gas phase and BEsol [H2Oad] = 0.59
eV for Pt (µ1) in water solvent.
On the other hand, H binds more weakly to Ni than to Pt. H binds as strongly to Co as
to Pt.
• BEgas [Had] = 2.79 eV for Co (µ3c) gas phase and BEsol [H2Oad] = 2.85 eV for Co
(µ3c) in water solvent, and
• BEgas [Had] = 2.64 eV for Ni (µ3c), gas phase and BEsol [H2Oad] = 2.72 eV for Ni
(µ3c) in water solvent,
as compared with BEgas [H2Oad] = 2.78 eV on Pt (µ1) gas phase and BEsol [H2Oad] = 2.86
eV for Pt (µ1) in water solvent.
This implies that at ORR condition, it will be harder to get form Had from H+ in the
solvent for Co. This makes Had less available for all reactions involving Had. As discussed
in the supplemental mater of our previous paper84, the energy cost can be estimated by
using the method developed by Norskov, etc.17, as
H3O+ 1/2H2 (gas) H (gas) Had .
Using our PBE bond dissociation energy of 2.31eV for 1/2H2, the energy cost is 2.31
–BEsol [Had] + V, where V is the potential of the cathode relative to normal hydrogen

56
electrode (NHE). Consequently, at 0.0V relative to NHE, the energy cost to get Had is
exothermic by -0.54eV, -0.41eV, and 0.-51eV for Co, Ni, and Pt, respectively. Thus
assuming an operating voltage of 0.80V versus NHE, the H+ Had becomes
endothermic with reaction enthalpy of 0.26eV, 0.39eV, and 0.29eV for Co, Ni, and Pt
respectively. These barriers are lower than that of our calculated RDS barrier.
O2 binds much stronger to Co and Ni, as compared with Pt. Thus:
• BEgas [O2ad] = 1.78 eV for Co (µ3c) gas phase and BEsol [O2ad] = 2.43 eV for Co
(µ3c) in water solvent, and
• BEgas [O2ad] = 1.51 eV for Ni (µ3c), gas phase and BEsol [O2ad] = 1.51 eV for Ni
(µ3c) in water solvent,
as compared with BEgas [O2ad] = 0.42 eV on Pt (µ1) gas phase and BEsol [O2ad] = 0.83 eV
for Pt (µ1) in water solvent.
Since binding O2 to the surface must compete with H2O for space, the strong binding
for O2 suggests that for Ni and Co, H2O flooding would not block the ORR.
OOH binds more strongly to Ni and Co than Pt. Thus:
BEgas [OOHad] = 1.73 eV for Co (µ1) gas phase and BEsol [OOHad] = 2.24 eV for Co
(µ1) in water solvent, and
BEgas [OOHad] = 1.68 eV for Ni (µ1), gas phase and BEsol [OOHad] = 2.14 eV for Ni
(µ1) in water solvent,
as compared with BEgas [OOHad] = 1.02 eV on Pt (µ1) gas phase and BEsol [OOHad] =
1.47 eV for Pt (µ1) in water solvent.
57
Taking into account the strong binding energy of O2 and H, it is much harder to form
OOH on Ni and Co surfaces. Moreover, the OOHad formed is expected be much easier to
dissociate. Thus for Ni and Co, OOH formation and dissociation does not serve as the
lower barrier process to dissociate O2 that it does for Pt.
Simply by comparing the binding energies, we would expect Co and Ni to have a
smaller O2 dissociation barrier due to the strong exothermicity. For the same reason, the
OH formation and H2O formation barrier will be higher for Ni and Co. The calculated
barriers for all seven steps involved in ORR84 are discussed next.
Reaction Barriers and Mechanisms
Our previous research showed that six fundamental steps are involved in the various
possible mechanisms, namely,
• O2 dissociation: O2ad 2Oad
• OH formation: Oad + Had OHad
• H2O formation: OHad + Had H2Oad
• OOH formation: O2ad + Had OOHad
• OOH dissociation: OOHad OHad + Oad
• hydration: Oad + H2Oad OHad + Oad .
In putting these fundamental steps into an overall mechanism we can distinguish three
categories:
• OO bond activation: This includes O2 dissociation (a) and OOH formation (d)
followed by OOH dissociation (e).
• OH Formation: This includes OH formation (b) and O hydration (f).
• OH consumption: This includes H2O formation (c).
58
To make a good catalyst, a metal must be able to have a step with a low barrier in
each of these three categories.
Starting from the preferred sites, we calculated the barriers for all six steps on Co and
Ni. The barriers and the comparison with pure Pt are shown in Table 5-2.
Gas phase processes
OO bond activation: O2 dissociation (step a) has much lower barrier on Co and Ni
(0.00eV for Co 0.15eV for Ni as compared with 0.57eV for Pt) because of the much
stronger O binding energy, As suggested from the relative binding energies, OOH
formation (step d) is much less favorable on Co and Ni (Ea = 0.97eV and 1.52eV as
compared with 0.30eV for Pt). In addition the OOH formed would dissociate
immediately (step e). Thus OOH formation is the dominant mechanism on Pt but is not
competitive with the direct O2 dissociation for Co and Ni.
OH formation: OH formation (step b) on Co (Ea = 0.55eV) and Ni (Ea = 0.59eV) are
much easier than on Pt (Ea = 0.74eV). So we expect the OH formation rate for step b on
Ni and Co to be much faster than Pt on Co and Ni. O hydration on Ni and Co have larger
barriers than Pt (0.48eV for Ni 0.47eV for Co compared to 0.23eV Pt). Comparing both
methods, O hydration has a lower barrier for all of Co, Ni, and Pt. Hence O hydration is
the preferred way.
OH consumption (step c): Due to the large stability of OHad, the formation of H2O
from OH becomes much harder on Co and Ni surfaces than on Pt. The H2O formation
barrier is 1.30eV on Co and 0.81eV on Ni as compared to the 0.14eV on Pt.
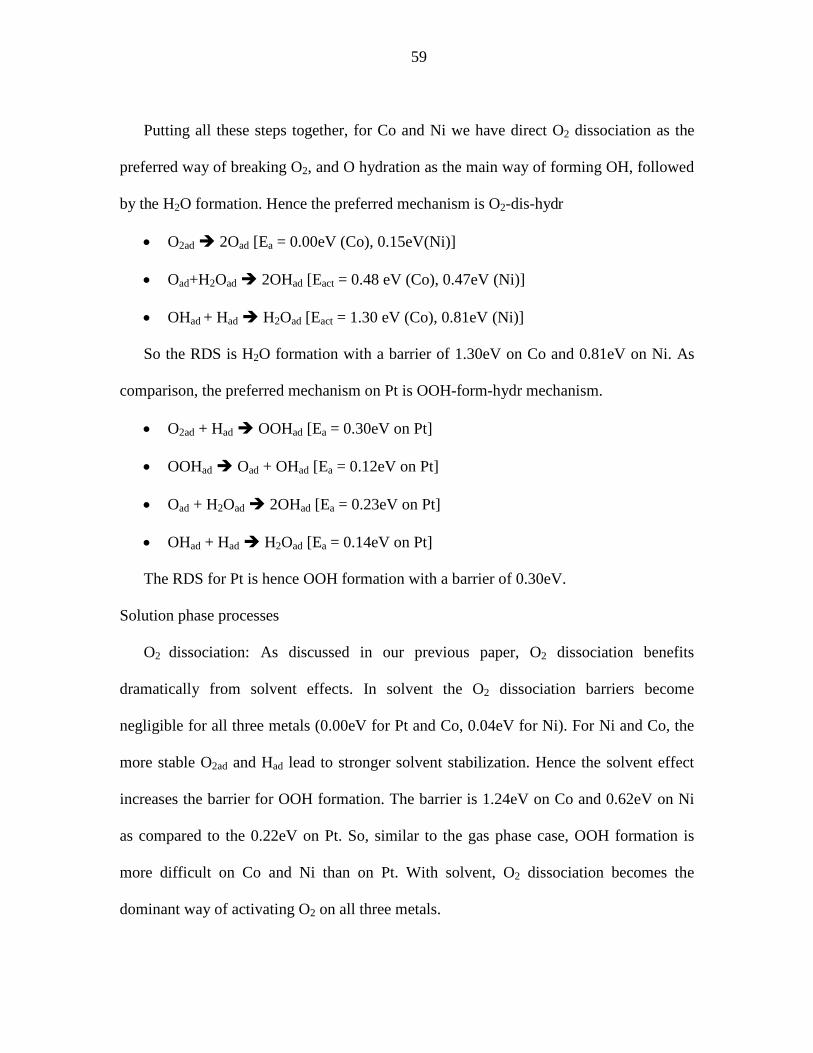
59
Putting all these steps together, for Co and Ni we have direct O2 dissociation as the
preferred way of breaking O2, and O hydration as the main way of forming OH, followed
by the H2O formation. Hence the preferred mechanism is O2-dis-hydr
• O2ad 2Oad [Ea = 0.00eV (Co), 0.15eV(Ni)]
• Oad+H2Oad 2OHad [Eact = 0.48 eV (Co), 0.47eV (Ni)]
• OHad + Had H2Oad [Eact = 1.30 eV (Co), 0.81eV (Ni)]
So the RDS is H2O formation with a barrier of 1.30eV on Co and 0.81eV on Ni. As
comparison, the preferred mechanism on Pt is OOH-form-hydr mechanism.
• O2ad + Had OOHad [Ea = 0.30eV on Pt]
• OOHad Oad + OHad [Ea = 0.12eV on Pt]
• Oad + H2Oad 2OHad [Ea = 0.23eV on Pt]
• OHad + Had H2Oad [Ea = 0.14eV on Pt]
The RDS for Pt is hence OOH formation with a barrier of 0.30eV.
Solution phase processes
O2 dissociation: As discussed in our previous paper, O2 dissociation benefits
dramatically from solvent effects. In solvent the O2 dissociation barriers become
negligible for all three metals (0.00eV for Pt and Co, 0.04eV for Ni). For Ni and Co, the
more stable O2ad and Had lead to stronger solvent stabilization. Hence the solvent effect
increases the barrier for OOH formation. The barrier is 1.24eV on Co and 0.62eV on Ni
as compared to the 0.22eV on Pt. So, similar to the gas phase case, OOH formation is
more difficult on Co and Ni than on Pt. With solvent, O2 dissociation becomes the
dominant way of activating O2 on all three metals.

60
OH formation: Due to stronger solvent effect for O than for OH, solvation increases
the barrier for direct OH formation. The barrier increases to 0.84eV for Co and 0.74eV
for Ni as compared with the 0.97eV for Pt. O hydration is also more difficult with a
barrier of 0.62eV on Co and 0.54eV on Ni as compared to the 0.23eV on Pt. Hence, O
hydration dominates the direct OH as the main way of forming OHad.
OH consumption: OHad in general has stronger solvent effect then H2Oad.
Consequently, H2O formation has higher barrier when considering solvation. The barrier
is 1.43eV on Co, 1.00eV on Ni, and 0.24eV on Pt.
Putting all these together, we have direct O2 dissociation as the preferred way of
dissociating the O=O bond, and O hydration as the preferred way of forming OH. The
overall mechanism is hence:
• O2ad 2Oad [Eact = 0.00eV (Co), 0.04eV (Ni) and 0.00eV (Pt)]
• Oad+H2Oad 2OHad [Eact = 0.62eV(Co), 0.54eV (Ni) and 0.50 eV (Pt)]
• OHad + Had H2Oad [Eact = 1.43eV(Co), 1.00eV (Ni) and 0.24 eV (Pt)]
H2O formation is the RDS on Co and Ni, while O hydration is the RDS for Pt. The
overall barriers for Ni and Co are 1.00eV and 1.43eV, respectively, as compared to the
0.50eV on Pt. Comparing with Pt we can see that Co and Ni are inferior as ORR catalysts
because they can successfully reduce O2 to OH but fail to remove the OH from the
surface.
For Co and Ni, the high binding energy to O and OH makes Ni and Co good materials
for reducing O2 to OH. But this comes with the price that OHad is extremely stable and
almost reluctant to have any further reaction, including forming H2O. By comparison, Pt
has reasonably strong binding with O but weaker binding with OH, making it easy for

61
OH to form H2O and harder to form OH through O hydration. So the proper way of
improving the ORR activity of Pt would be alloying with other metals to lower the Oad
binding energy and increase OHad binding energy to lower the O hydration barrier.
Alloying with Co and Ni could be the reason for this improvement.
Discussion
Given that reactions involving O2 might occur in the hydrophobic regions, while
those involving H+ might occur in hydrophilic regions, the best process for Co or Ni
would be to dissociate O2 in the hydrophobic region, forming OH with H2O nearby, then
migrate to the hydrophilic region and form H2O. Of course it is well known that alloys of
Co and Ni with Pt have excellent performance.
Conclusion
We studied the binding site preferences, reaction step barriers, and ORR mechanisms on
Ni and Co surfaces using DFT calculations. The prefered mechanism for Ni and Co in
gas phase is O2-diss-hydr with an overall barrier of 1.30eV for Co and 0.81eV for Ni.
H2O formaton is the RDS for both metals. With solvation, the situation is worse, with an
overall barrier of 1.43eV for Co and 1.00eV for Ni. Hence to have a good Co- or Ni-
based catalyst, one needs to find a way to lower the H2O formation barrier. Os could be a
promising candidate with a stronger binder with Os and lower H2O formation barrier.

62
Tables and Figures
Binding Energy (eV) Gas Solv
Species Binding Site Pt Ni Co Pt Ni Co
M-H
µ1 -2.78 -2.32 -2.28 -2.86 -2.41 -2.37
µ2* -2.69 -2.47 -2.64 -2.81 -2.54 -2.69
µ3-ccp -2.70 -2.64 -2.79 -2.82 -2.72 -2.85
µ3-hcp -2.66 -2.60 -2.76 -2.77 -2.67 -2.82
M-O
µ1 -2.57 -3.32 -4.06 -3.19 -3.81 -4.67
µ2 -3.17 -4.37 -4.96 -3.84 -4.91 -5.56
µ3-ccp -3.59 -4.84 -5.25 -4.28 -5.37 -5.86
µ3-hcp -3.30 -4.69 -5.28 -3.93 -5.24 -5.88
M-H2 0.22 0.28 0.22 0.17 0.25 0.18
M-OH
µ1 -2.22 -2.68 -2.82 -2.75 -3.13 -3.27
µ2 -2.23 -3.09 -3.33 -2.61 -3.45 -3.68
µ3-ccp -2.22 -3.13 -3.49 -2.57 -3.44 -3.81
µ3-hcp -2.20 -3.11 -3.56 -2.54 -3.43 -3.83
M-O2
bridge -0.43 -1.40 -1.47 -0.75 -1.72 -1.98
ccp -0.42 -1.51 -1.78 -0.83 -1.97 -2.43
hcp -0.36 -1.47 -1.78 -0.74 -1.94 -2.39
M-OOH
µ1b -1.02 -1.68 -1.73 -1.47 -2.14 -2.24
µc -0.92 -1.53 -1.65 -1.39 -2.01 -2.18

63
M-H2O2 bridge -0.33 -0.55 -0.42 -0.69 -0.86 -0.73
M-H2O µ1 -0.21 -0.36 -0.21 -0.59 -0.70 -0.55
Table 5-1. Binding energies (eV) of various ORR species on Pt, Co, and Ni
* µ2 is not a stable site for H on Ni and Co.
Barriers-gas Barriers-solv
Reaction Barriers Pt Ni Co Pt Ni Co
H2 Dissociation 0.00 0.11 0.03 0.00 0.08 0.00
O2 Dissociation 0.57 0.15 0.00 0.00 0.04 0.00
OH Formation 0.74 0.59 0.55 0.97 0.74 0.84
H2O Formation 0.14 0.81 1.30 0.24 1.00 1.43
OOH Formation 0.30 0.52 0.97 0.22 0.62 1.24
OOH Dissociation 0.12 0.00 0.00 0.00 0.00 0.00
H-OOH dissociation 0.14 0.00 0.00 0.00 0.00 0.00
O hydration 0.23 0.47 0.48 0.50 0.54 0.62
Table 5-2. Reaction barriers for various steps involved in ORR

64
Barriers-gas Barriers-solv
Reaction Barriers Pt Ni Co Pt Ni Co
O2-diss 0.74 0.81 1.30 0.97 1.00 1.43
OOH-form 0.74 0.81 1.30 0.97 1.00 1.43
O2-diss-hydr 0.57 0.81 1.30 0.50 1.00 1.43
OOH-form-hydr 0.30 0.81 1.30 0.50 1.00 1.43
H-OOH Dissociation 0.30 0.81 1.30 0.24 1.00 1.43
Overall 0.57 0.81 1.30 0.50 1.00 1.43
Table 5-3. Overall barriers for each step
Figure 5-1. Binding sites on FCC closed packing surface (111 surface)
65
Chapter 6 Density Functional Studies on Oxygen Reduction
Reaction on Cu, Ag, and Au Surfaces
Abstract
We study theoretically the binding preferences of various intermediates involved in
oxygen reduction reaction (ORR) on the (111) surface of Cu, Ag, and Au. Barriers for all
necessary steps for all five possible pathways known on Pt are calculated. Au shows a
high O2 dissociation barrier of 1.40eV (aq) which prevents the ORR. We find that Ag and
Cu have low O2 dissociation barriers (0.00eV and 0.12eV) and O hydration barriers
(0.12eV and 0.35eV), but that they suffer from a huge H2O formation barrier (0.98eV and
1.08eV) as compared with Pt (0.30eV). This suggests that phase-separated Ag/Pt alloy or
Cu/Pt alloy might be promising candidates, since O2 can first dissociate and form OH on
Ag/Cu, and then the OH can migrate to the Pt area and finish the H2O formation (which
is much easier on Pt).
Introduction
The oxygen reduction reaction (ORR) has been studied extensively in the past few
decades because it is among the key problems in creating an economically efficient
hydrogen fuel cell1–4. Great efforts have been made to synthesize different metal catalysts
to accelerate the slack kinetics of ORR 62–63.
Despite the fruitful experimental studies on many metals and alloys, most theoretical
studies have only focused on Pt and Pt-related materials16–17,85–86. We consider it

66
important to understand why all other metals have inferior performance in catalyzing
ORR and have embarked on a series of theoretical studies to elucidate the mechanisms
and kinetics of other systems.
Previously, we successfully modeled the ORR on a Pt surface with solvent effect and
electrode potential consideration66,87. We found five mechanisms for Pt (111) surface84.
We also compared the kinetics of ORR on Pt with that on Ni and Co, where we attribute
the great performance of Pt to the less-stable OHad and the corresponding lower H2O
formation barrier88. Herein, we studied systematically the ORR on Ag, Au, and Cu
surfaces to explore why these three metals cannot serve as ORR catalysts.
Methodology
The closed packing surface (111) is modeled as a c(3x3) slab with six layers of atoms,
big enough to eliminate the interaction between images of the adsorbents. The four
bottom layers are fixed to mimic the bulk/support side of the catalyst while the top two
layers are relaxed to cover the interaction between the surface and the adsorbates. All
calculations are carried out by using Seqquest DFT code29, where the Kohn-Shan
equation is self-consistently solved under periodic boundary conditions. We used norm-
conserving pseudo potentials34–37 for the core electrons and Gaussian type orbitals for the
valence electrons. The solvent effect of the system is estimated by using the implicit
solvent method we developed earlier, which is based on the Poisson-Boltzmann
continuum model23–25,38,66. Mulliken charge from Seqquest is taken as input for the APBS
solver.

67
Results and Discussion
Binding site preference and binding energies
Similar to the case of Pt, all the three metals involved in this research have FCC
structure. On the (111) surface, there are in general four unique binding sites, µ1, µ2, µ3-
ccp, and µ3-hcp. µ1, µ2, and µ3 indicate how many surface metal atoms the adsorbate is
bonded to at the same time. The binding energies for different species on Ag, Au, and Cu
as compared with Pt are shown in Table 6-1.
H prefers to bind to µ3-ccp sites with a binding energy of 2.08eV, 2.12eV, and 2.44
eV in gas phase on Ag, Au, and Cu, respectively. The binding energy is smaller than the
2.72eV of Pt. The small binding energy will make the reaction H+ Had unfavorable
under ORR conditions, making it a great challenge for ORR on Ag, Au, and Cu. The gas
phase H binding energy on Au agreed with the 2.11eV of Barton, etc.89.
O prefers µ3-ccp sites on Ag, Au, and Cu with a binding energy of 3.06eV, 2.41eV,
and 4.23eV in gas phase, respectively. Comparing with the 3.66eV on Pt, the binding is
stronger for Ag and Cu but dramatically weaker for Au. This agrees with the fact that Au
is noble because of the weak binding with O. Dissociative adsorption of O2 on Au is
simply endothermic. The gas phase binding energy of 2.41eV on Au agrees with earlier
theoretical work of 2.53eV by Mavrikakis, etc. 90.
OH prefers µ2 and µ3 sites on Ag, Au, and Cu with similar binding energies. µ1 sites
are less stable by 0.46eV, 0.14eV, and 0.38eV than the optimum binding sites. This
property is unique on the three metals because on Pt, all sites have similar binding energy.
OH binding energy of Au agreed with the 1.90eV calculated by Barton, etc.89.

68
O2 prefers hcp sites on Cu with a binding energy of 0.57eV, stronger than the 0.46eV
on Pt. Au does not have an effective binding with O2, which agrees with earlier
experiments91–92 and calculations90,93. Ag can only weakly adsorb O2 on the µ3 with a
binding energy of 0.13eV.
Our calculations showed that OOH and H2O can only bind with top sites, which
agrees with previous research94–95. For OOH, the binding energy is 0.65eV on Ag,
0.35eV on Au, and 1.18eV on Cu, weaker than the 1.06eV on Pt. For H2O the binding
energy is 0.50eV on Ag, 0.48eV on Au, and 0.54eV on Cu with solvent effect as
compared with the 0.58eV on Pt. It agreed with the 0.45–0.58eV Michaelides, etc.94, got
from a more accurate simulation using explicit water. The corresponding binding
energies without solvent also agrees well with their result94 and the 0.19eV, 0.12eV, and
0.26eV reported recently by Wang, etc. 95.
In summary, binding with OH, O2, and OOH is stronger on Cu than on Pt but is
weaker on Au and Ag. It agrees with the fact that Cu is not noble. H binds more weakly
on all of Ag, Au, and Cu as compared with Pt.
Barriers for reaction steps and the pathways
There are seven possible steps involved in the ORR reaction, as shown in Figure 6-1.
O2 can directly dissociate into 2Oad or it may react with Had to form OOHad, which
dissociates into Oad and OHad. Oad then can either react with Had directly or go through
hydration to form OHad. The final step of ORR is the formation of H2O from OHad and H.
So the six steps involved in the ORR are O2 dissociation, OOH formation, OOH
dissociation, OH formation, O hydration, and H2O formation. The barriers are shown in
Table 6-2.

69
We can see that O2 dissociation is difficult on Au, with a barrier of 2.12eV in the gas
phase. Solvation helps lower the barrier to 1.40eV but it is still a barrier that is impossible
to overcome at the operating temperature. For Ag, the barrier is 0.93eV in gas phase,
implying that the dissociation of O2 on Ag surface will not happen in gas phase.
Solvation helps to stabilize the formed Oad and lowers the barrier to 0.05eV. On Cu, the
O2 dissociation barrier is 0.15eV in gas phase and 0.02eV in solution. So O2 dissociation
would be fast on Ag and Cu, similar to the case of Pt.
OOH formation has a barrier of 0.24eV, 0.00eV, and 0.42eV on Ag, Au, and Cu,
respectively, similar to the 0.19eV on Pt. The corresponding dissociation for OOH,
however, is more difficult, with a barrier of 0.39eV on Ag and Cu and 0.58eV on Au.
Comparing with the competing direct O2 dissociation, we can see that, the preferred way
of reducing O2 on Au is OOH formation/dissociation, while the direct O2 dissociation is
preferred on Ag and Cu. The small barrier agreed with the previous belief that OOH
formation is easy on Au clusters93.
Formation of OH is much easier on Ag, Au, and Cu than on Pt, with barriers of
0.00eV, 0.16eV, and 0.00eV as compared to the 0.72eV in gas phase, respectively. With
solvation the barrier increases to 0.00eV on Ag, 0.32eV on Au, and 0.08eV on Cu,
mainly due to the strong solvation of Oad. Comparing with the high barrier of 1.09eV on
Pt surface, we can see that OH formation should not be a problem for all three of the
metals.
O hydration is the alternative way of forming OH. Oad reacts with H2O to form 2OHad
directly. On Pt, this is the rate-determining step (RDS), with a barrier of 0.50eV. On Ag,

70
Au, and Cu, the barriers are 1.29eV, 0.87eV, and 0.83eV, much higher than on Pt. We
can see that direct OH formation is not preferred.
The formation of H2O is more difficult on Ag, Au and Cu with a barrier of 0.86eV,
0.37eV and 0.87eV, much higher than the 0.17eV on Pt.
Mechanisms and overall barriers without solvation
Combining all the barriers, we can get the RDS barrier for the same five possible
mechanisms as in our previous study84. The overall barriers are shown in Table 6-3.
On Ag and Au surfaces, OOH formation has a much lower barrier (0.21eV and
0.00eV on Ag and Au) than O2 dissociation (0.78eV on Ag and 1.82eV on Au), hence
mechanisms involving O2 dissociation are as not likely to happen on both surfaces. The
consequent OOH dissociation has a high barrier of 0.87eV on Ag and 0.88eV on Au. The
following OH formation is barrierless on Ag and has only a small barrier of 0.10eV on
Au. Consequently, O hydration is the dominant way of consuming Oad, similar to the case
of Pt. H2O formation has a high barrier of 0.72eV on Ag and a low barrier of 0.29eV on
Au. These lead to the OOH-form-hydr mechanism consists of OOH formation, OOH
dissociation, formation hydration, and H2O formation, as shown in equation 1a–1d. This
is also the preferred mechanism of ORR on Pt in gas phase.
(1a) O2 + Had OOHad [Ea (Ag) = 0.21eV, Ea (Au) = 0.00eV, Ea (Pt) = 0.33eV]
(1b) OOHad Oad + OHad [Ea (Ag) = 0.87eV, Ea (Au) = 0.88eV, Ea (Pt) = 0.04eV]
(1c) Oad + H2Oad 2OHad [Ea (Ag) = 0.00eV, Ea (Au) = 0.10eV, Ea (Pt) = 0.22eV]
(1d) OHad + Had H2Oad [Ea (Ag) = 0.72eV, Ea (Au) = 0.29eV, Ea (Pt) = 0.12eV]

71
The overall RDS is OOH dissociation with a barrier of 0.87eV on Ag and 0.88eV on
Au, as compared to the 0.33eV on Pt.
On Cu, as comparison, O2 dissociation (Ea = 0.11eV) is much easier than OOH
formation (Ea = 0.29eV). Hence the predominant way of consuming O2 is through direct
O2 dissociation. Similar to the case of Pt, Cu has lower barrier of O hydration (Ea =
0.24eV) than OH formation (Ea = 0.44eV), so the former is preferred. Combining the
essential H2O formation with a barrier of 0.98eV gives the O2-dis-hydr mechanism.
(2a) O2 2Oad [Ea (Cu) = 0.11eV]
(2b) Oad + H2Oad 2OHad [Ea (Cu) = 0.24eV]
(2d) OHad + Had H2Oad [Ea (Cu) = 0.98eV]
The overall RDS is H2O formation with a barrier of 0.98eV in the gas phase.
Mechanisms and overall barriers with solvation
As discussed in our previous studies66,84, solvation dramatically changed the reaction
barriers and the consequent preferred mechanism. So it’s very important to see how
solvation could change ORR activity on Ag, Au, and Cu.
On Ag surface O2 dissociation becomes barrierless with solvation due to the strong
solvent stabilization of Oad. Cu also has a low barrier of 0.12eV. This is much lower than
the 0.25eV and 0.31eV OOH formation barrier on Ag and Cu, hence direct O2
dissociation is the dominant way of consuming O2. For the same reason, OH formation
from Oad and Had becomes more difficult with solvation, with a barrier of 0.39eV and
0.59eV on Ag and Au, respectively. As comparison, O hydration has a lower barrier
(0.12eV on Ag and 0.35eV on Au) and is hence the preferred way of consuming Oad.

72
Combining with the last step, H2O formation with a barrier of 0.98eV on Ag and 1.08eV
on Cu, leads to O2-dis-hydr-solv:
(step zero) H+ Had [E (Ag) = 0.31eV, E (Cu) = -0.14eV, E (Pt) = -0.68eV]
(3a) O2 2Oad [Ea (Ag) = 0.00eV, Ea (Cu) = 0.12eV, Ea (Pt) = 0.00eV]
(3b) Oad + H2Oad 2OHad [Ea (Ag) = 0.12eV Ea (Cu) = 0.35eV, Ea (Pt) = 0.49eV]
(3d) OHad + Had H2Oad [Ea (Ag) = 0.98eV Ea (Cu) = 1.08eV, Ea (Pt) = 0.30eV].
The overall RDS is hence H2O formation for both Ag and Cu with a barrier of 0.98eV
and 1.08eV, making ORR impossible on both metals. As comparison, the RDS for Pt is O
hydration which leads to an overall barrier of 0.49eV with solvation.
The case of Au is more complicated. Solvation still lowered the barrier of O2
dissociation from 1.82eV in gas phase to 0.96eV with solvation, but the barrier is still
higher than the barrierless OOH formation. The formed OOH then directly dissociates
into Oad and OHad with a barrier of 0.57eV, 0.31eV lower than the case without solvation.
O hydration barrier on Au is 0.28eV with solvation, slightly higher than the 0.10eV
without solvation. Similarly, H2O formation has a barrier of 0.38eV, higher than the gas
phase barrier of 0.29eV. This gives an overall mechanism of OOH-form-hydr:
(step zero) H+ Had [E (Au) = 0.29eV at 0.0V versus NHE, E (Au) = 1.09eV, at
0.80V versus NHE]
(4a) O2 + Had OOHad [Ea (Au) = 0.00eV]
(4b) OOHad Oad + OHad [Ea (Au) = 0.57eV]
(4c) Oad + H2Oad 2OHad [Ea (Au) = 0.28eV]
(4d) OHad + Had H2Oad [Ea (Au) = 0.38eV].
The overall RDS is hence OOH dissociation with a barrier of 0.57eV.
73
Another factor that needs to be taken into account is the availability of Had, especially
at higher potential. The H reduction reaction is H+ Had. This step is potentially
dependent and can be estimated using Norskov’s17 and our approach87 as follows:
H+(solv) 1/2H2 Had .
The corresponding reaction enthalpy for Ag, Au, Cu, and Pt are 0.31eV, 0.29eV,
-0.14eV, and -0.65eV at 0.0V versus normal hydrogen electrode (NHE). At fuel cell
condition (0.8V versus NHE), the reaction enthalpy becomes 1.11eV, 1.09eV, 0.66eV,
and 0.15eV for Ag, Au, Cu, and Pt. Comparing with the RDS barrier mentioned above,
we can see that H reduction becomes the RDS for Ag and Au, with a barrier of 1.11eV
and 1.09eV.
Summarizing all of the above discussions, with solvation, Ag and Cu prefer the O2-
diss-hydr-solv mechanism while Au prefers the OOH-form-hydr-solv mechanism. The
RDS for Au and Ag is H reduction with a barrier of 1.11eV and 1.09eV. For Cu the RDS
is H2O formation with an overall barrier of 1.08eV. So none of Ag, Au, or Cu are
effective ORR catalysts.
Hence for Au and Ag, the availability of Had becomes the fundamental limit toward a
better catalyst. Co, Ir, Os, Pd, Pt, Rh, and Ru all have large binding energy with Had and
could be good candidates. They need to be combined with a second metal with good
affinity with Had. For Cu, the most important improvement to look for is the H2O
formation. Among the 8–11th column metals, Au and Pt both have a low barrier for
forming H2O and are hence promising choices.

74
Conclusion
We systematically studied the ORR on Ag, Au, and Cu surfaces and compared with
Pt. The preferred mechanisms for Ag and Cu are both O2-diss-hydr with an overall
barrier of 0.98eV and 1.08eV. On Au the preferred mechanism is OOH-form-hydr-solv
with an overall barrier of 0.57eV, but Au suffers from the availability of Had. In contrast,
the overall barrier for Pt is 0.49eV. The two main problems for these three metals is the
formation of H2O due to the high stability of OHad and the reduction of H+ due to small
binding energy with Had.

75
Tables and Figures
Gas Solv
Binding
Energy (eV)
OH
species Ag Au Cu Pt Ag Au Cu Pt
M 0.00 0.00 0.00 0.00 0.00 0.00 0.00 0.00
M-H
µ1 -1.54 -1.93 -1.99 -2.89 -1.63 -1.94 -2.02 -2.97
µ2 -1.87 -1.97 -2.32 -2.77 -1.89 -2.00 -2.35 -2.89
µ3-ccp -1.99 -2.00 -2.37 -2.74 -2.00 -2.03 -2.41 -2.86
µ3-hcp -1.98 -1.99 -2.42 -2.72 -2.00 -2.03 -2.45 -2.83
M-O
µ1 -1.87 -1.47 -2.80 -2.54 -2.93 -2.07 -3.54 -3.31
µ2 -2.85 -2.19 -4.00 -3.30 -3.80 -2.87 -4.51 -3.96
µ3-ccp -3.13 -2.50 -4.35 -3.75 -4.06 -3.21 -4.92 -4.44
µ3-hcp -3.06 -2.36 -4.25 -3.36 -4.04 -3.07 -4.81 -4.02
M-H2 0.21 0.18 0.36 0.18 0.20 0.17 0.33 0.12
M-OH
µ1 -2.02 -1.74 -2.54 -2.35 -2.75 -2.28 -3.01 -2.86
µ2 -2.42 -1.84 -2.90 -2.35 -2.98 -2.28 -3.22 -2.73
µ3-ccp -2.45 -1.82 -2.96 -2.32 -2.93 -2.21 -3.22 -2.67
µ3-hcp -2.42 -1.80 -2.92 -2.35 -2.93 -2.20 -3.18 -2.70
M-OO Bridge -0.13 0.11 -0.54 -0.54 -0.45 0.01 -0.92 -0.87
µ3-ccp -0.13 0.08 -0.78 -0.56 -0.38 0.03 -1.32 -0.96

76
µ3-hcp -0.10 0.10 -0.77 -0.51 -0.42 0.05 -1.28 -0.88
M-OOH µ1-b -0.66 -0.45 -1.14 -1.13 -1.33 -0.91 -1.62 -1.57
µ1-c -0.68 -0.32 -1.08 -1.02 -1.36 -0.81 -1.59 -1.48
M-H2O2 Bridge -0.18 -0.17 -0.23 -0.33 -0.50 -0.50 -0.54 -0.69
M-H2O µ1 -0.11 -0.10 -0.17 -0.24 -0.48 -0.47 -0.50 -0.64
Table 6-1. Binding energy for Ir and Os as compared with Pt, both with and without
solvent.
Gas Solv
Reaction Barriers Ag Au Cu Pt Ag Au Cu Pt
H2 Dissociation 1.26 0.99 0.22 0.00 1.24 0.97 0.05 0.00
O2 Dissociation 0.78 1.82 0.11 0.45 0.00 0.96 0.12 0.00
OH Formation 0.06 0.28 0.44 0.79 0.39 0.40 0.59 1.02
H2O Formation 0.72 0.29 0.98 0.12 0.98 0.38 1.08 0.30
OOH Formation 0.21 0.00 0.29 0.33 0.25 0.00 0.31 0.23
OOH Dissociation 0.87 0.88 0.21 0.04 0.27 0.57 0.00 0.00
H-OOH dissociation 0.02 0.00 0.77 0.06 0.13 0.04 0.78 0.00
O hydration 0.00 0.10 0.24 0.22 0.12 0.28 0.35 0.49
Table 6-2. Reaction barriers for various steps involved in ORR.
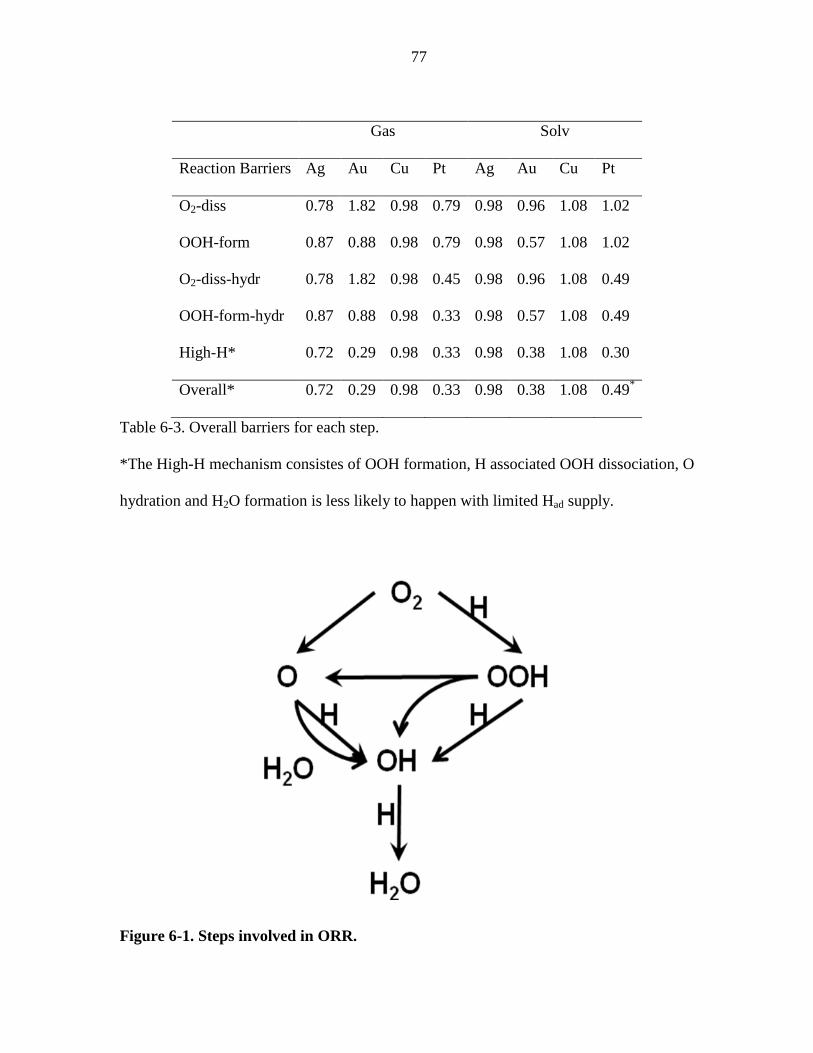
77
Gas Solv
Reaction Barriers Ag Au Cu Pt Ag Au Cu Pt
O2-diss 0.78 1.82 0.98 0.79 0.98 0.96 1.08 1.02
OOH-form 0.87 0.88 0.98 0.79 0.98 0.57 1.08 1.02
O2-diss-hydr 0.78 1.82 0.98 0.45 0.98 0.96 1.08 0.49
OOH-form-hydr 0.87 0.88 0.98 0.33 0.98 0.57 1.08 0.49
High-H* 0.72 0.29 0.98 0.33 0.98 0.38 1.08 0.30
Overall* 0.72 0.29 0.98 0.33 0.98 0.38 1.08 0.49*
Table 6-3. Overall barriers for each step.
*The High-H mechanism consistes of OOH formation, H associated OOH dissociation, O
hydration and H2O formation is less likely to happen with limited Had supply.
Figure 6-1. Steps involved in ORR.
78
Chapter 7 Density Functional Studies on Oxygen Reduction
Reaction on Pd, Rh, and Ru Surfaces
Abstract
In this study, we studied theoretically the binding preferences of various
intermediates involved in oxygen reduction reaction (ORR) on the (111) surface of Pd,
Rh, and Ru, calculating barriers (with and without solvation) for all necessary steps for
all five possible pathways known on Pt. All metals within this group have large H2O
formation barriers. Without solvation Rh and Ru showed behavior quite different than Pt.
Rh and Ru prefer the O2-diss-hydr mechanism involving O2 dissociation, O hydration and
H2O formation with an overall barrier of 0.89eV and 1.09eV. In contrast, Pd and Pt prefer
the OOH-form-hydr mechanism with overall barriers of 0.58eV and 0.33eV. Including
solvation, all four metals prefer O2-diss-hydr mechanism with barriers of 0.89eV, 1.28eV
0.79eV and 0.49eV for Rh, Ru, Pd and Pt, respectively. The major problem with all Pd
group metals is the high H2O formation barrier due to strong OHad binding. Alloys should
at least contain one other metal to decrease the OHad binding energy and the consequent
H2O formation barrier. Pt Ir, Au, Ag, and Cu could be good choices.
Introduction
Developing efficient catalyst for the slow oxygen reduction reaction process on the
cathode of PEMFC is one of the key problems for more economically feasible usage in
automobiles1–4. Pt and Pt alloys are so far the best catalysts62–63. There had been

79
numerous studies focusing on synthesizing new materials as substitutes5–9. Compared to
the fruitful experimental studies, there had been limited theoretical understanding of the
ORR mechanism and how one could go about improving the kinetics. Most theoretical
studies focused on the gas phase reaction for lack of a proper way of handling the solvent
effect10,14,17–18,47,70. In our previous study, we developed a practical way of estimating the
solvation effect by using the implicit solvation model based on Poisson-Boltzmann
equation66. We showed that the solvation dramatically changes the kinetics and leads to
the superior performance of Pt in catalyzing ORR. . We had systematically studied the
ORR mechanism on Pt, Pd, Ni, Co, Ag, Au and Cu. In this study, we focus on the
binding preference, reactions steps and ORR mechanisms on Rh and Ru, the two Pd
group metals, and explore the possibility of developing Rh and Ru based alloys as the
next generation ORR catalyst. .
Methodology
The calculations were carried out by using Seqquest DFT code29 where Kohn-sham
equation is solved with periodic boundary condition in a self-consistent way. Norm-
conserving potential34–37 and Gaussian type orbitals are used to represent the metal atoms.
A c(3x3) unit cell with six layers of atoms is used to represent surface. The system is
hence periodic in to reactions (x and y) and finite in the third (z) direction, making it a
slab. Four bottom layers are fixed as the optimal bulk structure to mimic the bulk side
while the other two layers are relaxed to represent the surface. Implicit solvation based on
Poisson-Boltzmann equation23–25,38,66 is calculated using Mulliken charge calculated from
gas phase calculation, details of which were shown in our previous paper66,84.

80
Results and Discussion
Binding sites and Binding energies
As discussed in previous papers, there are in general four types of binding sites on the
closed packing surface, namely,
• top site (µ1),
• bridging site(µ2),
• fcc hollow site (µ3f), at the C site when the top 2 closest packed layers are AB
• hcp hollow site (µ3h) at the A site when the top 2 closest packed layers are AB
We calculated the binding preferences of H, O, OH, O2, OOH, H2O and H2O, all the
intermediates involved in the reaction.
H prefers to bind to bind to (µ3f) site on Rh and Ru without solvation with a binding
energy of 2.72eV and 2.87eV, similar to the case of Pd (BE=2.85eV). With solvation, the
binding energies increase to 2.87eV and 3.06eV for Rh and Ru, as compared to the
2.99eV on Pd. (µ1) is less stable by 0.23eV and 0.52eV without solvation and 0.25 and
0.40 eV with solvation on Rh and Ru. As compared to the relatively flat PES for Pt, H
has stronger preference over high coordination on Pd, Rh and Ru surface.
O prefers to bind to bind to (µ3f) site on Rh with a binding energy of 4.46eV without
solvation and 4.98eV with solvation. Ru showed strong preference towards (µ3h) site with
a large binding energy of 5.37eV without solvation and 5.94eV with solvation. (µ2) is not
stable on both metals, similar to Pt and Pd and serve as the transition state for the
diffusion of O on the surface, giving a barrier of 0.45eV and 0.41eV without solvation
and 0.48 and 0.31eV with solvation.

81
OH prefers to bind to (µ2) site on Rh and Ru with binding energy of 2.88eV and
3.22eV without solvation and 3.21eV and 3.53eV with solvation, as compared to the
2.32eV and 2.67eV for Pt. Similar to the case of Pd and Pt, the binding energies on (µ3f)
(µ3c) and (µ2) for OH are close, implying that OH can easily migrates along the surface.
O2 prefers to bind to (µ3f) site on both Rh and Ru with a binding energy of 1.35eV for
Rh and 1.82eV for Ru without solvation. With solvation, the binding energy becomes
1.72eV and 2.38eV. Comparing with the 0.56eV binding energy without solvation and
the 0.96eV with solvation, we can see that Rh and Ru binds much stronger to the surface,
leading to a weakened O=O bond. Hence we expect easier O2 dissociation.
OOH binds to (µ1) site with binding energy of 1.51eV and1.80eV without solvation
for Rh and Ru, respectively. Taking solvation into account, the binding energies increase
to 1.92 and 2.30eV. The binding energies are much stronger than that of Pt (1.13eV
without solvation and 1.57eV with solvation). H2O also binds to (µ1) site with a binding
energy of 0.32eV and 0.42eV on Rh and Ru without solvation and 0.70eV and 0.78eV
with solvation, also stronger than that of Pt (0.24 and 0.64eV)
Summarizing the binding energies, we can see that Ru and Rh binds stronger to O,
OH, OOH and H2O and are hence less noble than Pt. This would lead to easier O2
dissociation and more difficult H2O formation.
Barriers and Preferred Mechanism
In general, there are six possible reactions on metal surfaces, including
(1) O2 dissociation, O2ad 2O ad
(2) OH formation: Oad + Had OHad
82
(3) H2O formation: OHad + Had H2Oad
(4) OOH formation: O2ad + Had OOHad
(5) OOH dissociation: OOHad Oad + OHad
(6) O hydration: Oad + H2Oad 2OHad
The barriers are shown in Table 7-2. As in previous studies, the ORR process can be
roughly divided into three steps.
Dissociation of O=O bond: O2 can directly dissociate into two O. Or alternatively, it
can react with H to form OOH which consequently dissociates into O and OH, hence
breaks the O=O bond.
O2 dissociation has low barriers of 0.17eV on Rh and 0.03eV on Ru and is hence
much easier than on Pt without solvation. Solvation is known to help with the O2
dissociation by stabilizing the resulting Oad. When solvent effect is taken into account, O2
dissociation on both Ru and Rh become barrierless, similar to the case of Pt.
OOH formation has barrier of 0.42 and 0.62eV on Rh and Ru without solvation.
Solvent effect has little influence for the OOH formation barrier. The barrier only slightly
increases to 0.64eV and 0.69eV with solvation. The consequent OOH dissociation is
barrierless on both Rh and Ru, regardless of whether solvent effect is included.
Comparing the barrier of the competing OOH formation and O2 dissociation, we can
see that O2 dissociation is the dominant way of dissociating O=O bond, resulting with Oad
on the surface.
Formation of OH. O can either react with an H to form an OH or get’s hydrated by
reacting with an H2O, forming two OH at the same time.

83
OH formation is easier on Rh than on Pt with a barrier of 0.61eV without solvation
and 091eV without solvation. On Ru surface, the direct OH formation becomes difficult
with a high barrier of 0.93eV without solvent and 1.45eV with solvation. Similar to the
case of Pt (Ea = 0.79 without solvation and Ea = 1.02 with solvation), OH formation is
simply too slow to happen at ambient temperature.
O hydration on Rh and Ru have barrier of 0.27eV and 0.34eV on Rh and Ru in gas
phase, respectively. The solution phase barriers are 0.44 and 0.36eV. The gas phase
barriers are slightly higher than the Pt while the solution phase barriers are lower than the
case of Pt.
Comparing with the direct OH formation from O and H, O hydration has a much
lower barrier and hence is the dominant way of forming OH on both Ru and Rh, similar
to the case of Pt.
Formation of H2O. Formation of H2O has barrier of 0.78eV and 1.09eV on Rh and
Ru without solvation. With solvation, the barriers increase to 0.89 and 1.28eV. It is larger
than the e barriers are larger than Pt, leading to more difficult OH removal.
Overall mechanism
Gas phase, As discussed earlier, on Rh and Ru, O2 dissociation (Ea = 0.17eV and
0.00eV) dominates OOH (Ea = 0.42eV and 0.62eV) and act as the major way of breaking
O2. This if followed by the hydration of Oad with barriers of 0.27eV on Rh and 0.34eV on
Ru. Direct OH formation from Oad and Had is less likely to happen higher barriers of
0.61eV and 0.93eV. Combining with the H2O formation with a barrier of 0.78eV on Rh
and 1.09eV on Ru, this leads to the O2-diss-hydr mechanism as shown in 1a-1c.
(1a) O2ad 2Oad [Ea (Rh) = 0.17eV, Ea (Ru) = 0.00eV]

84
(1b) Oad + H2Oad 2OHad [Ea (Rh) = 0.27eV, Ea (Ru) = 0.34eV]
(1c) OHad + Had H2Oad [Ea (Rh) = 0.78eV, Ea (Ru) = 1.09eV]
The overall rate determining step (RDS) is hence H2O formation with an overall
barrier of 0.89eV for Rh and 1.09eV for Ru. This is different from the preferred OOH-
form-hydr mechanism of Pd and Pt without solvation as shown in equation 2a-d. The
RDS for Pd is H2O formation with a barrier of 0.58eV while the RDS for Pt is OOH
formation with a barrier of 0.33eV.
(2a) O2 + Had OOHad [Ea (Pd) = 0.56eV, Ea (Pt) = 0.33eV]
(2b) OOHad Oad + OHad [Ea (Pd) = 0.24, Ea (Pt) = 0.04eV]
(2c) Oad + H2Oad 2OHad [Ea (Pd) = 0.27eV, Ea (Pt) = 0.22eV]
(2d) OHad + Had H2Oad [Ea (Pd) = 0.58eV, Ea (Pt) = 0.12eV]
So without solvation none of Rh, Ru and Pd could be comparable to Pt as ORR
catalyst.
With solvation. Similar to the case of Pt and Pd, solvation dramatically changes the
barriers and the consequent preferred mechanism. For the four metals involved in this
study, solvation stabilizes Oad, and OHad, especially Oad. It leads to lower barrier for O2
dissociation and higher barriers for OH formation and H2O formation.
O2 dissociation becomes barrierless for Rh and Ru, similar to the case of Pt. The
corresponding barrier for Pd is also greatly lowered by 0.40eV to 0.26eV. This makes O2
dissociation the dominate way of breaking O2 for all the four metals discussed. Higher
OH formation barrier makes it impossible to directly form OHad from Had and Oad. O
hydration becomes the only possible way with a barrier of 0.44eV, 0.35eV, 0.46eV and

85
0.49eV for Rh, Ru, Pd and Pt, respectively. Combining with the essential H2O formation
step leads to O2-diss-hydr-solv mechanism, as shown in 3a-3c.
(3a) O2ad 2Oad [Ea (Rh) = 0.00eV, Ea (Ru) = 0.00eV, Ea (Pd) = 0.26eV, Ea (Pt) =
0.00eV]
(3b) Oad + H2Oad 2OHad [Ea (Rh) = 0.44eV, Ea (Ru) = 0.35eV, Ea (Pd) = 0.46eV,
Ea (Pt) = 0.49eV]
(3c) OHad + Had H2Oad [Ea (Rh) = 0.89eV, Ea (Ru) = 1.28eV, Ea (Pd) = 0.79eV, Ea
(Pt) = 0.30eV]
Hence H2O formation (3a) is the RDS for all of Rh, Ru and Pd with a high barrier of
0.89eV 1.28eV and 0.79eV. As comparison, RDS for Pt is O hydration with a barrier of
0.49eV, much lower than the overall barrier for Rh, Ru and Pd, making Pt a better
catalyst.
We can see that the biggest problem with Pd group metals are the high H2O formation
barrier which origins from the stronger binding with OH as shown in Table 7-1. So
materials based on Rh, Ru and Pd will need to resolve this issue. Pd group based alloys
will need a weaker OHad binding, Pt, Ir, Cu, Au and Ag would be good candidates for this
purpose.
To make a good ORR catalyst, a material has to has low barriers for all of O=O bond
splitting, OH bond formation and H2O formation. With the help of solvation, O2
dissociation is not a problem for almost all the metals in group 8-11 due to the solvent
stabilization of Oad. So an ideal catalyst should have a weak binding for Oad and a
relatively strong OH binding energy. This guarantees a low barrier for both O
hydration/OH formation and H2O. Pt has a weak binding of OH which leads to an ideal

86
H2O formation barrier of 0.30eV, but the 0.49eV hydration barrier is still a little bit high.
Hence alloying of Pt should aim at a weaker binding of O. Pd has about the same binding
with Oad as Pt and could be a promising candidate. Another approach would be alloying
Pt with another metal to make OHad binding stronger. All of Rh, Ru and Pd could be
good candidates.
Conclusion
In this study we studied systematically the ORR on Ru and Rh surface and compared
it with OOR of Pd and Pt, calculating the binding site preference and the corresponding
binding energies and barriers for all possible steps involved. The preferred mechanism
for both Ru and Rh is O2-dis-hydr mechanism, independent of solvent. H2O formation is
the RDS with a barrier of 0.78eV (Rh) and 1.09eV (Ru) without solvation and 0.89eV
(Rh) and 1.28eV (Ru) with solvation. To improve activity for Rh and Ru based materials,
we suggest combining it with another material having weaker OHad binding (leading to
lower H2O formation barrier). Promising candidates include Ag, Au, Cu, Ir and Pt.
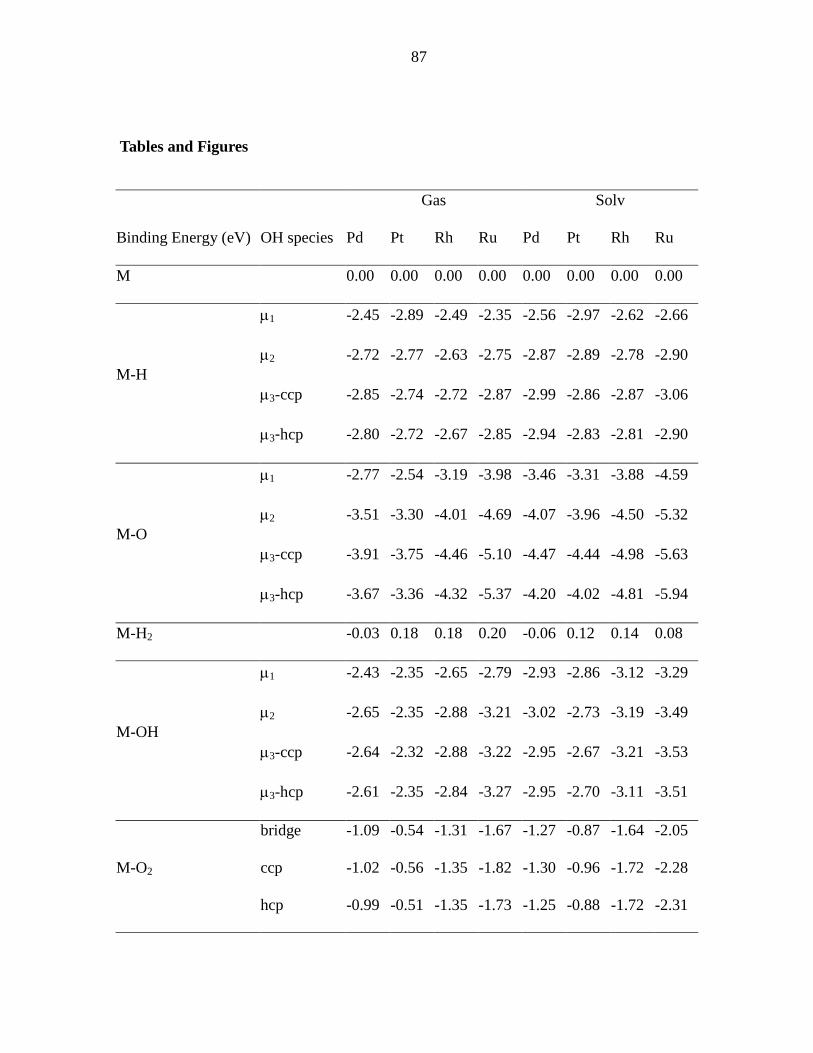
87
Tables and Figures
Gas Solv
Binding Energy (eV) OH species Pd Pt Rh Ru Pd Pt Rh Ru
M 0.00 0.00 0.00 0.00 0.00 0.00 0.00 0.00
M-H
µ1 -2.45 -2.89 -2.49 -2.35 -2.56 -2.97 -2.62 -2.66
µ2 -2.72 -2.77 -2.63 -2.75 -2.87 -2.89 -2.78 -2.90
µ3-ccp -2.85 -2.74 -2.72 -2.87 -2.99 -2.86 -2.87 -3.06
µ3-hcp -2.80 -2.72 -2.67 -2.85 -2.94 -2.83 -2.81 -2.90
M-O
µ1 -2.77 -2.54 -3.19 -3.98 -3.46 -3.31 -3.88 -4.59
µ2 -3.51 -3.30 -4.01 -4.69 -4.07 -3.96 -4.50 -5.32
µ3-ccp -3.91 -3.75 -4.46 -5.10 -4.47 -4.44 -4.98 -5.63
µ3-hcp -3.67 -3.36 -4.32 -5.37 -4.20 -4.02 -4.81 -5.94
M-H2 -0.03 0.18 0.18 0.20 -0.06 0.12 0.14 0.08
M-OH
µ1 -2.43 -2.35 -2.65 -2.79 -2.93 -2.86 -3.12 -3.29
µ2 -2.65 -2.35 -2.88 -3.21 -3.02 -2.73 -3.19 -3.49
µ3-ccp -2.64 -2.32 -2.88 -3.22 -2.95 -2.67 -3.21 -3.53
µ3-hcp -2.61 -2.35 -2.84 -3.27 -2.95 -2.70 -3.11 -3.51
M-O2
bridge -1.09 -0.54 -1.31 -1.67 -1.27 -0.87 -1.64 -2.05
ccp -1.02 -0.56 -1.35 -1.82 -1.30 -0.96 -1.72 -2.28
hcp -0.99 -0.51 -1.35 -1.73 -1.25 -0.88 -1.72 -2.31

88
M-OOH µ1b -1.41 -1.13 -1.51 -1.80 -1.86 -1.57 -1.92 -2.30
µc -1.36 -1.02 -1.41 -1.61 -1.80 -1.48 -1.90 -2.14
M-H2O2 bridge -0.61 -0.33 -0.50 -0.28 -0.93 -0.69 -0.82 -0.82
M-H2O µ1 -0.42 -0.24 -0.32 -0.42 -0.76 -0.64 -0.70 -0.78
Table 7-1. Binding energy for Ir and Os as compared with Pt, both with and without
solvent
Gas Solv
Reaction Barriers Pd Pt Rh Ru Pd Pt Rh Ru
H2 Dissociation 0.00 0.00 0.00 0.00 0.00 0.00 0.00 0.02
O2 Dissociation 0.66 0.45 0.17 0.00 0.26 0.00 0.00 0.00
OH Formation 0.35 0.79 0.61 0.93 0.52 1.02 0.91 1.45
H2O Formation 0.58 0.12 0.78 1.09 0.79 0.30 0.89 1.28
OOH Formation 0.56 0.33 0.42 0.62 0.82 0.23 0.54 0.69
OOH Dissociation 0.24 0.04 0.00 0.00 0.08 0.00 0.00 0.00
H-OOH dissociation 0.18 0.06 3.55 0.00 0.22 0.00 3.94 0.00
O hydration 0.27 0.22 0.27 0.34 0.46 0.49 0.44 0.35
Table 7-2. Reaction barriers for various steps involved in ORR
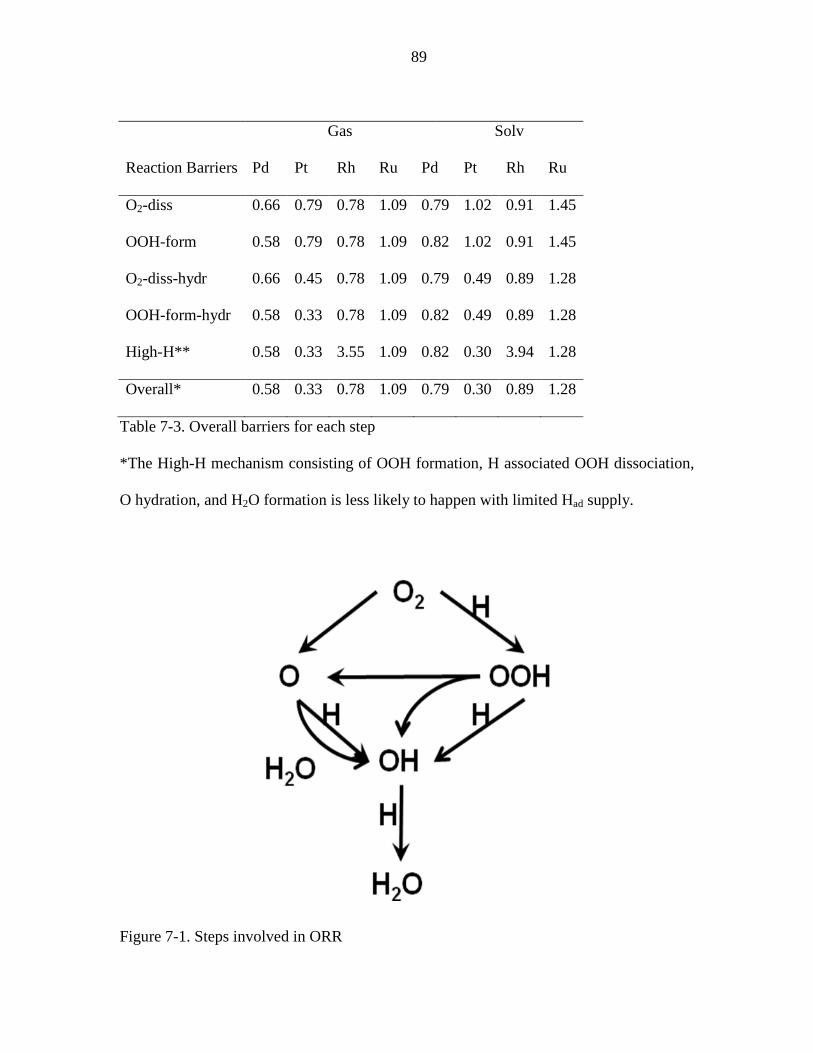
89
Gas Solv
Reaction Barriers Pd Pt Rh Ru Pd Pt Rh Ru
O2-diss 0.66 0.79 0.78 1.09 0.79 1.02 0.91 1.45
OOH-form 0.58 0.79 0.78 1.09 0.82 1.02 0.91 1.45
O2-diss-hydr 0.66 0.45 0.78 1.09 0.79 0.49 0.89 1.28
OOH-form-hydr 0.58 0.33 0.78 1.09 0.82 0.49 0.89 1.28
High-H** 0.58 0.33 3.55 1.09 0.82 0.30 3.94 1.28
Overall* 0.58 0.33 0.78 1.09 0.79 0.30 0.89 1.28
Table 7-3. Overall barriers for each step
*The High-H mechanism consisting of OOH formation, H associated OOH dissociation,
O hydration, and H2O formation is less likely to happen with limited Had supply.
Figure 7-1. Steps involved in ORR

90
Chapter 8 Density Functional Studies of the Fuel Cell Oxygen
Reduction Reaction on Os and Ir Surfaces
Abstract
We studied theoretically the binding preferences of various intermediates involved in
the oxygen reduction reaction (ORR) on the (111) surface of Os and Ir, where in all cases
the quantum mechanical reaction surfaces are corrected for aqueous solvation. Barriers
for all necessary steps for all five possible pathways known on Pt are calculated. Ir and
Os show similar behavior with Pt for almost all pathways. The OH formation barrier is
1.08eV for Ir and 1.66eV for Os, much higher than for Pt (1.02eV). So the only viable
pathway for Ir and Os is the O2-dis-hyd mechanism. The hydration barriers for Ir and Os
(0.35eV and 0.56eV) are lower than the H2O formation barrier (0.61eV and 0.67eV,
making H2O formation the rate determining step [RDS]. To get improved ORR activity,
it is necessary to lower the H2O formation barrier. Alloying with a second metal with a
better H2O formation barrier could be a promising approach. Ag, Au, Cu, Pd, Pt, and Rh
are good candidates.
Introduction
The PEM fuel cell is one of the most promising environment-friendly ways of
converting chemical energies into electricity to power automobiles1–4. The lack of a
powerful catalyst for the slack oxygen reduction reaction on a cathode is among the
biggest obstacles towards wider commercial usage of such systems. Pt and Pt alloys are
91
so far the best catalysts, but they still suffer a huge potential loss (operating at 0.80eV as
compared to the theoretical limit of 1.23V) and slow kinetics.
Lots of research has been done in the past decade to find better alternatives, as well as
to better understand the mechanism5–9. Most theoretical studies10,14,17–18,47,70 about the
ORR on metal surfaces focused on the hydrogen oxidation reaction (HOR) in gas phase,
assuming that a good HOR catalyst may also be a good ORR catalyst. This approach was
the most expedient without a correct way of handling the solvent effect. Recently66, we
developed a systematical way to calculate solvation energy and showed that ORR
kinetics differs a lot from those of HOR. O2 dissociation becomes barrierless with the
help of solvent, making the formation of OHad and H2Oad the more important steps in
ORR. Here, we study the ORR mechanism on Os and Ir using density functional theory
(DFT) calculations, and suggest possible ways of developing improved Os/Ir-based
material as catalysts for ORR.
Methodology
The calculations were carried out by using Seqquest DFT code29 where the Kohn-
sham equation is solved with a periodic boundary condition in a self-consistent way.
Norm-conserving potential34–37 and Gaussian type orbitals are used to represent the metal
atoms. A c(3x3) unit cell with six layers of atoms is used to represent surface. The system
is periodic in two directions (x and y) and finite in the third (z) direction, making it a slab.
Four bottom layers are fixed as the optimal bulk structure to mimic the bulk side, while
the other two layers are relaxed to represent the surface. Implicit solvation based on the

92
Poisson-Boltzmann equation23–25,38,66 is calculated using Mulliken charge calculated from
gas phase calculation, details of which were shown in our previous paper66.
Results and Discussion
Binding sites and binding energies
In general, as mentioned in previous papers, there are four possible sites for
adsorbates on the closed packing surface (111 surface of Ir and 100 surfaces of Os).
• top site (µ1),
• bridging site(µ2),
• fcc hollow site (µ3f), at the C site when the top 2 closest packed layers are AB,
• hcp hollow site (µ3h) at the A site when the top 2 closest packed layers are AB.
Thus the first step is to decide the preferred binding sites for all the intermediates
involved. The binding energies of H, O, O2, OH, OOH, H2O, and H2O2 are summarized
in Table 8-1.
H prefers to bind to top site (µ1) for both Ir and Os with a binding energy of 2.79eV
and 2.70eV without solvent, as compared to the 2.89eV of Pt. When solvent is present the
binding energies changes to 2.90eV for Ir and 2.77eV for Os. This agrees with the
experimentally observed result that Ir binds to top sites 96–97. Similar to the case of Pt, the
PES for H on the surface is relatively flat. Binding energies on different sites differ by
less than 0.21eV for all of Ir, Os, and Pt.
O prefers to bind to (µ3f) on Ir with a binding energy of 4.36eV without solvation and
4.89eV with solvation, similar to the case of Pt. For Os, O prefers (µ3h) with a binding

93
energy of 3.94eV without solvation and 5.67eV with solvation. The bridging site is
unstable for both Ir and Os and serves as the transition state for the diffusion of O
between the adjacent (µ3f) and (µ3h) site. The corresponding barrier is hence 0.44eV and
0.47eV for Ir and Os in gas phase, and 0.43eV and 0.38eV with solvation. The barrier
makes it difficult for oxygen to migrate on the surface once formed.
OH prefers to bind to (µ2) on Ir with a binding energy of 2.73eV and to a (µ1) site
without solvation. The PES of OH is flat on Ir surface without solvation, given that the
binding energies differ by less than 0.06eV, similar to the case of Pt. However, with
solvation (µ1) becomes the most stable form with a binding energy of 3.28eV. For Os,
(µ3f) are the preferred binding sites with binding energies of 3.08eV. In solvent (µ3h)
becomes the preferred site for OH with a binding energy of 3.47eV. The binding of OH is
stronger on both Ir and Os than on Pt.
O2 prefers to bind with a (µ2) site on Ir with a binding energy of 1.34eV without
solvation and 1.89eV with solvation, as compared to the 0.56eV and 0.96eV on Pt,
implying a strong interaction and great weakening of the O=O bond. Similarly, on Os, the
(µ3h) is preferred without solvation with a binding energy of 1.55eV and the (µ3c) site is
preferred with solvation with a binding energy of 2.34eV, even stronger than in the case
of Ir.
OOH prefers to bind to a (µ1) site for both Ir and Os, similar to the case of Pt. Again,
the binding energy of 1.61eV and 1.74eV without solvation and 2.19eV and 2.26eV with
solvation are all stronger for both than the 1.13eV and 1.57eV on Pt.

94
H2O prefers to bind to (µ1), similar to Pt. The binding energies are 0.38eV and
0.40eV without solvation and 0.79eV and 0.91eV with solvation for Ir and Os,
respectively. They are only slightly stronger than the 0.24eV and 0.64eV of Pt.
Barriers for possible reaction steps
In general, there are six reactions involved in the ORR:
• O2ad 2Oad
• Oad + Had OHad
• OHad + Had H2Oad
• O2ad + Had OOHad
• OOHad Oad + OHad
• Oad + H2Oad 2OH .
The barriers for all the six steps on Os and Ir are calculated and shown in Table 8-2.
As discussed in previous studies66,84,88,98–99, it’s convenient to divide the reactions into
three categories: (1) splitting the O=O bond, (2) forming the OH bond, and (3) forming
H2O.
Splitting the O=O bond. There are two possible ways of splitting O2 for ORR on
metal. One way is direct O2 dissociation where an adsorbed O2 dissociates into two
adjacent threefold sites. The other is through formation and dissociation of OOH.
O2 dissociation (O2ad 2Oad): On the Ir and Os surface, the O2 can both directly
dissociate into two Oad with a barrier of 0.03eV without solvation, much lower than the
0.45eV of Pt. The low barrier is mainly due to the strong bonding of O with the surface,
as shown by the large binding energy of both O2ad and Oad. With solvation, the barriers
are lowered to 0.00eV.
95
OOH association and dissociation (O2ad + Had OOHad Oad + OHad): OOH
formation has a barrier of 0.51eV and 0.52eV on Ir and Os without solvation,
respectively, higher than the 0.33eV on Pt. Solvation does not change the 0.51eV OOH
formation barrier on Ir. For Os, solvation lowers the barrier by 0.12eV to 0.40eV with
solvation. OOH dissociation is much easier than its formation, with a low barrier of
0.14eV on Ir, as compared to the 0.04eV for Pt. For Os, the reaction is barrierless and
hence (µ1)-OOH is only metastable on Os. With solvation, dissociation of OOH is
barrierless for all of Ir, Os, and Pt.
Comparing the direct dissociation of O2 and association of OOHad, we can see that the
barrierless O2 dissociation dominates and serves as the major way of dissociating the
O=O bond.
Formation of OH. There are two possible ways of forming OHad, either through
direct OH formation or through hydration of Oad.
OH formation (Oad + Had OHad): OH formation is difficult for all of Ir, Os, and Pt.
The barrier without solvation is 0.86eV and 1.26eV for Ir and Os, as compared with the
0.79eV of Pt. The situation is worse when solvent effect is taken into account. Solvation
in general stabilizes Oad more than OHad (as indicated by Table 8-1), leading to a higher
barrier for OH formation. The barriers increase to 1.08eV on Ir and 1.66eV on Os, as
compared to 1.02eV for Pt. As discussed our previous studies66,84, these high barriers
actually make the direct OH formation impossible.
O hydration (Oad + H2Oad 2OHad): Oad can also react with another H2O to form
two OHad. The barriers are 0.22eV for Ir and 0.33eV for Os without solvation. Similar to
the case of OH formation, solvation makes Oad more stable and increases the barriers to

96
0.35 and 0.56eV on Ir and Os when solvation is taken into account. The barriers are
higher than that of Pt (0.22 without solvation and 0.49 with solvation), implying that
hydration on both metals would be more difficult than on Pt.
Comparing the two possible ways of forming OH and consuming the Oad produced by
the previous steps (O2 dissociation or OOH dissociation), we can see that O hydration is
the preferred one for Ir and Os, similar to Pt.
Formation of H2O. H2O formation reaction (OHad + Had H2Oad) has barrier of
0.51eV on both Ir and Os without considering solvent effect, as compared to the low
barrier of 0.12eV on Pt. When the solvation is taken into account, the barriers increase to
0.61eV and 0.67eV, much higher than the 0.30eV on Pt.
Summarizing the preferred reaction in the three categorizes, we can see that for Os
and Ir, the preferred mechanism is O2-diss-hydr:
(1a) O2ad 2Oad [Ea (Ir) = 0.03eV, Ea (Os) = 0.03eV]
(1b) Oad + H2Oad 2OH [Ea (Ir) = 0.22eV, Ea (Os) = 0.33eV]
(1c) OHad + Had H2O [Ea (Ir) = 0.51eV, Ea (Os) = 0.51eV] .
The rate determining step (RDS) is hence H2O formation with a barrier of 0.51eV for
both Ir and Os. As comparison, the preferred mechanism for Pt is OOH-form-hydr84:
(2a) O2ad + Had OOHad [Ea (Pt) = 0.33eV]
(2b) OOHad Oad + OHad [Ea (Pt) = 0.04eV]
(2c) Oad + H2Oad 2OH [Ea (Pt) = 0.22eV]
(2d) OHad + Had H2O [Ea (Pt) = 0.12eV] .
The RDS is hence OOH formation with a barrier of 0.33eV.

97
Comparing Os and Ir with Pt, we can see that without solvation, Pt has better
performance than Os and Ir. It agrees with the fact that Pt is the best catalyst of hydrogen
oxidation reaction.
Solvation greatly changes the barriers and the preferred mechanism for Pt. With
solvation, all of Ir, Os, and Pt have O2-diss-hydr mechanism as the preferred mechanism:
(3a) O2ad 2Oad [Ea (Ir) = 0.00eV, Ea (Os) = 0.00eV, Ea (Pt) = 0.00eV]
(3b) Oad + H2Oad 2OH [Ea (Ir) = 0.35eV, Ea (Os) = 0.56eV, Ea (Pt) = 0.49eV]
(3c) OHad + Had H2O [Ea (Ir) = 0.61eV, Ea (Os) = 0.67eV, Ea (Pt) = 0.30eV]
Hence the H2O formation step is the RDS for ORR on Ir and Os, leading to overall
barriers of 0.61eV and 0.67eV. As discussed in our previous studies84, the RDS for Pt is
O hydration with a barrier of 0.49eV.
The results showed that Ir and Os are better in reducing O2 to Oad and reducing Oad to
OHad. But they are not efficient in converting OHad formed on the surface. The
hydrophilic OHad formed hence aggregates on the surface and generates unfavorable
kinetics. To get improved activity for Ir- and Os-related catalysts, it is essential to
improve the H2O formation. For this reason, materials with weaker binding with OH than
Ir and Os (3.28eV and 3.47eV with solvation) are preferred as the second alloying metal.
Good candidates include Ag (2.98eV), Au (2.28eV), Cu (3.22eV), Pd (3.02eV), Pt
(2.86eV), and Rh (3.21eV).
Conclusion
We examined the mechanism of ORR on Ir and Os surfaces, calculating the binding
site preference of all the intermediates involved in this reaction. We showed that the

98
preferred mechanism on both Os and Ir is the O2-diss-hydr mechanism which involves (1)
O2ad 2Oad (2) Oad + H2Oad 2OHad (3) OHad + Had H2O. The overall RDS is the
H2O formation step (step three), giving an overall barrier of 0.61eV and 0.67eV for Ir and
Os, respectively. The barriers are higher than the 0.49eV overall barrier of Pt (O
hydration being RDS). To obtain improved performance for Ir- and Os-based materials,
the H2O formation barrier needs to be decreased. Alloying with metals with weaker
binding with OH is a promising approach, suggesting Ag, Au, Cu, Pd, Pt, and Rh as good
candidate alloying elements.

99
Tables and Figures
Gas Solv
Binding Energy (eV) OH species Ir Os Pt Ir Os Pt
M 0.00 0.00 0.00 0.00 0.00 0.00
M-H
µ1 -2.79 -2.70 -2.89 -2.90 -2.77 -2.97
µ2 -2.60 -2.59 -2.77 -2.81 -3.00 -2.89
µ3-ccp -2.61 -2.64 -2.74 -2.80 -3.31 -2.86
µ3-hcp -2.58 -2.53 -2.72 -2.72 -2.81 -2.83
M-O
µ1 -3.45 -3.91 -2.54 -4.26 -4.60 -3.31
µ2 -3.92 -4.34 -3.30 -4.46 -5.05 -3.96
µ3-ccp -4.36 -4.81 -3.75 -4.89 -5.43 -4.44
µ3-hcp -4.11 -4.94 -3.36 -4.60 -5.67 -4.02
M-H2 0.37 0.43 0.18 0.30 0.31 0.12
M-OH
µ1 -2.73 -2.84 -2.35 -3.28 -3.33 -2.86
µ2 -2.75 -2.98 -2.35 -3.02 -3.16 -2.73
µ3-ccp -2.69 -3.06 -2.32 -3.02 -3.47 -2.67
µ3-hcp -2.74 -3.08 -2.35 -3.00 -3.33 -2.70
M-O2
bridge -1.34 -1.44 -0.54 -1.89 -2.11 -0.87
ccp -1.19 -1.43 -0.56 -1.61 -2.34 -0.96
hcp -1.21 -1.55 -0.51 -1.61 -2.25 -0.88

100
M-OOH µ1b -1.61 -1.74 -1.13 -2.19 -2.26 -1.57
µ2c -1.32 -1.53 -1.02 -1.88 -2.04 -1.48
M-H2O2 bridge -0.43 -0.51 -0.33 -0.77 -0.84 -0.69
M-H2O µ1 -0.38 -0.40 -0.24 -0.79 -0.91 -0.64
Table 8-1. Binding energy for Ir and Os as compared with Pt, both with and without
solvent effect
Gas Solv
Reaction Barriers Ir Os Pt Ir Os Pt
H2 Dissociation 0.00 0.00 0.00 0.00 0.00 0.00
O2 Dissociation 0.03 0.03 0.45 0.00 0.00 0.00
OH Formation 0.86 1.26 0.79 1.08 1.66 1.02
H2O Formation 0.51 0.51 0.12 0.61 0.67 0.30
OOH Formation 0.51 0.52 0.33 0.51 0.40 0.23
OOH Dissociation 0.14 0.00 0.04 0.00 0.00 0.00
H-OOH dissociation 0.58 0.00 0.06 0.85 0.00 0.00
O hydration 0.22 0.33 0.22 0.35 0.56 0.49
Table 8-2. Reaction barriers for various steps involved in ORR

101
Gas Solv
Reaction Barriers Ir Os Pt Ir Os Pt
O2-diss 0.86 1.26 0.79 1.08 1.66 1.02
OOH-form 0.86 1.26 0.79 1.08 1.66 1.02
O2-diss-hydr 0.51 0.51 0.45 0.61 0.67 0.49
OOH-form-hydr 0.51 0.52 0.33 0.61 0.67 0.49
High-H* 0.58 0.52 0.33 0.85 0.67 0.30
Overall* 0.51 0.51 0.33 0.61 0.67 0.30
Table 8-3. Overall barriers for each step
*The High-H mechanism consists of OOH formation, H associated OOH dissociation, O
hydration and H2O formation is less likely to happen with limited Had supply.
Figure 8-1. Steps involved in ORR
102
Chapter 9 Mechanism for the Oxygen Reduction Reaction on
Pt3Ni Alloy Fuel Cell Cathodes
Abstract
We use quantum mechanics (QM) (density functional theory (DFT) at the PBE level)
to predict the binding-site preferences and reaction barriers for all intermediates involved
in the oxygen reduction reaction (ORR) on the low-energy surface of Pt3Ni alloy. Here
we calculate that the surface layer is Ni depleted (100% Pt) while the second layer is Ni
enriched (50% Pt) as shown by experiment. Even though the top layer is pure Pt, we find
that the sublayer Ni imposes strong preferences in binding sites for most intermediates,
which in turn strongly influences the reaction barriers. This strong preference leads to a
strong site dependence for the barriers. Considering water as the solvent, we predict that
at low coverage (of O and OH), the barrier of the rate determining step (RDS) is 0.81eV,
whereas at high coverage, this barrier decreases to 0.38eV. This can be compared to a
barrier of 0.50 for pure Pt, explaining the improved rate for the alloy. We report the
results both for gas phase and for aqueous phase environments.
Introduction
The efficiency of the oxygen reduction reaction (ORR) (4H+ + 4e- + O2 2 H2O) at
the cathode of proton electrolyte membrane fuel cells (PEMFC) is a critical issue for
commercial application of PEMFC in automobiles1–4. The best current catalysts are Pt
and Pt-based binary alloys, including63 Pt3Ni and100 Pt3Co. Several different hypotheses

103
have been put forward for the improved ORR activity of these alloys, including the shift
in the d-band101 or a decrease in the surface lattice parameter to values optimal for
ORR102. Also it has been argued that that the alloy makes OH removal favorable,
increasing the surface area available for O2 binding63.
A relatively rare property of Pt3Ni and Pt3Co is the surface segregation observed
experimentally103 in 1985 from quantitative analysis of LEED experiments104. Our
quantum mechanics (QM) (density functional theory [DFT] at the PBE level) calculations
using finite slabs find the same segregation of the Pt3Ni alloy into a structure with 100%
percent Pt on the surface layer, 50% on the second layer, and 75% for deeper layers. We
consider that this strong segregation to form a pure Pt surface layer (analogous to a core-
shell system) may be important in ensuring a long lifetime for these catalysts.
Starting with this segregated surface of Pt3Ni alloy, we use QM to predict the
binding-site preferences and reaction barriers for all intermediates involved in the oxygen
reduction reaction (ORR). This leads to a new detailed atomistic-level chemical
mechanism explaining the increased reactivity on Pt3Ni alloys. In particular, we find that
subsurface Ni influences the ORR kinetics on the surface even though the surface is
100% Pt.
Methodology
We model the Pt3Ni alloy as a two-dimensionally infinite periodic slab with four
atoms per cell and six layers of atoms. We consider the atomic Pt composition as 100-50-
75-75-75-75, as observed experimentally103 and calculated theoretically105. All
calculations use the Perdew-Becke-Ernzerhof (PBE) functional of DFT. We use small-

104
core, norm-conserving, angular momentum projected pseudopotentials34–37 in which the
3p, 3d, and 4s electrons of Ni and the 5p, 5d, 6s electrons on the Pt are treated explicitly
with 16 electrons for neutral Ni and Pt. We use optimized double zeta plus polarization-
quality Gaussian-type orbitals on the Pt and Ni with the Seqquest software29. To represent
the effects of solvent polarization, we use the implicit model developed earlier. 66 The
periodic cell parameters of the slab are based on the optimized Pt3Ni bulk structure
(which is 0.08% smaller than the experimental value106).
Results and Discussion
Binding site preferences
First, we studied the preference of H, O, OH, H2O, O2, and OOH on the various
binding sites shown in Figure 9-1. Generally a closest packed (111) surface of FCC
metals has four types of sites:
• On top, bonded to one Pt (µ1), denoted as t,
• Bridging between two Pt (µ2), denoted as b,
• Bridging between three Pt (µ3) but in the fcc position (not above atoms of the top
or second layer), denoted as f,
• Bridging between three Pt (µ3) but in the hcp position (above atoms of the second
layer), denoted as h.
However for the Pt3Ni surface, we need to take into account that the second layer is
50% Ni and 50% Pt, while the third layer 25% Ni. We find that the binding energies to
the pure Pt layer depend strongly on the nature of the second layer atoms. The various
cases are tabulated in Table 9-1. See Figure 9-2 for details.

105
Considering only the first and second layers, we have two types of top sites: t1 with
one Ni neighbor in the second layer and t2 with two. Considering also the third layer, we
can distinguish t1a with no Ni in the third layer directly beneath the surface and t1b with
one. All t2 sites are the same, even considering the third-layer Ni, as shown in Figure 9-2.
Considering just the top two layers there are four µ2 bridge sites, depending on the
number of Ni atoms underneath it: b0, b1, b2, and b3, with 0, 1, 2 and 3 Ni atoms in the
second layer. Considering also the third layer, there are two subtypes for b1, b2, and b3
depending on the distance to the Ni in the third layer. We denote the subtypes closer to
the third layer Ni as b1a, b2a, b3a, and the others as b1b, b2b, b3b, respectively. The b0, b1a,
b1b, b2a, b2b, b3a, and b3b sites are shown in Figure 9-2.
Considering just the top two layers there are two FCC sites: f1 and f2 with one and
two Ni atoms in the sublayer triangle, but considering the third layer, f1 splits into f1a and
f1b, with f1a on top of the third-layer Ni and the f1b on top of the third-layer Pt.
Similarly, for just the top two layers there are two hcp sites: h1 and h2. Here h1 is on
top of the sublayer Ni while h0 is on top of the sublayer Pt. Considering the third-layer
the h1 splits into h1a and h1b, in which one and zero Ni atoms are in the projected triangle
of third-layer atoms as shown in Figure 9-2.
Binding of H. As shown in Table 9-2, the preferred binding sites for H on the Pt3Ni
surface are t1a with a binding energy of 2.70eV, followed by t1b and b0 with binding
energy of 2.60eV without solvation. On the other hand, the b3a, b3b, and t2 sites in the
purple region have binding energy of 2.39–2.44eV without solvation, making them
higher than the preferred binding site by 0.28eV without solvation.

106
With solvation the preferred sites become t1a, b2, and f1b, with binding energies
ranging from 2.78–2.83eV, followed by t1b, b0, b1a, f2, h2, h1a, h1b, and h2, with binding
energy ranging from 2.68–2.74eV,. This favorable region of H is colored orange in
Figure 9-1. The barrier for migration of H within the orange region is small. The b3a, b3b,
and t2 sites in the purple region have binding energies of 2.48–2.54eV with solvation,
making them higher than the preferred binding site by 0.35eV.
Consequently the blue region serves as a barrier region preventing hydrogen from
diffusing between different orange stripes. For the pure Pt surface, the binding energies
of H are 2.70–2.80eV without solvation and 2.81–2.81eV with solvation, with no such
forbidden region, allowing H to migrate easily in all directions to react with other species.
Binding of O atom. On pure Pt, Oad binds strongly to the FCC site, with a net
bonding energy of 3.66eV without solvation and 4.36eV with solvation. For Pt3Ni, the
binding energy for Oad depends dramatically on the site. f2 is preferred, with a binding
energy of 3.47eV, followed by f1a, with 3.06–3.17eV gas phase. With solvent, f2 and f1b
become the two dominant binding sites, with binding energy of 4.49eV and 4.28eV. All
other binding sites are at least 0.60eV less stable than f2. This strong stabilization of f2
arises because the two electropositive Ni in the second layer enhance the charge transfer
to the surface O, stabilizing it, as illustrated by the surface total charge of 0.079 on f1 and
0.114 on f2a and f2b.
The next-best sites in gas phase are b0, f1b, and h2, which are weaker than f2 by
0.40eV. With solvation, all other sites are weaker than f2 by at least 0.6eV. All the other
sites have small barriers to fall into the f2 site (except at extremely high coverage).

107
The binding energy for the FCC site on pure Pt surface is 0.19eV stronger without
solvation but 0.13 eV weaker with solvation than f2.
The smaller Ni atoms allow the surface Pt above two Ni to contract toward the bulk
by 0.29A, whereas the surface Pt above one Ni contracts by 0.19A.
These results indicate that dissociation of O2 strongly prefers to give Oad at the f2 site,
with no migration to other sites.
Binding of OH. On pure Pt, OH has almost the same binding energy on all sites, with
a binding energy of 2.22–2.28eV without solvation and 2.57–2.77eV with solvation.
For Pt3Ni the best site without solvation is b0 with a binding energy of 2.42eV. Here
the OH bond tilts toward h1b (away from f2). t1a, t1b, f2, h2, and b1a are less stable than b0
by 0.13, 0.20, 0.13, 0.10eV, and 0.17eV without solvation. With solvation, t1a is the most
preferred site, with binding energy of 2.83eV, followed by f2, b0, and t1b, with binding
energy of 2.73–2.75eV. As comparison, OH binds much more weakly to t2, b3a, and b3b,
with binding energy of 2.24–2.47eV. Hence OH selectively binds to the orange region,
just as does H. OHad at other binding sites has a strong preference to migrate to this
preferred region. This differs dramatically from the case of the Pt surface where the
binding energies of OH range over 0.10eV without solvation and 0.06 eV with solvation,
indicating that it can migrate easily.
Binding of O2. For pure Pt, we find a binding energy of 0.46eV without solvation and
0.87eV with solvation, with a range of just 0.19 and 0.17 eV for various sites for gas
phase and solution phase, respectively.
For the Pt3Ni surface O2 binds most strongly (0.33–0.59 eV without solvation and
0.62–0.76eV with solvation) to b0, b1a, b2a, and f2. All other sites are higher by at least

108
0.3eV. Thus O2 has a small preferred binding region near f2 on Pt3Ni that is adjacent to
the f2 site for Oad and the b0 site for OH. This gives a favorable migration pathway for
formation of OOH
Binding of OOH. For pure Pt, OOH binds to the top sites with the terminal O bonded
to the Pt and the OOH plane parallel to the surface. OOH prefers to have the O=O bond
heading to an adjacent Pt atom, leading to a binding energy of 1.06eV without solvation
and 1.52eV with solvation.
For Pt3Ni, we find that t1a is quite favorable, with binding energies of 1.05eV in gas
phase and 1.55eV with solvation. Here the preferred orientation for the O=O bond is also
toward the adjacent Pt atom, similar to Pt.
All other sites cannot bind OOH, leading instead to dissociation, so once formed
OOH cannot migrate on the surface.
Binding of H2O. H2O binds only to top sites, but it does not have strong preference
between different sites, with binding energies of 0.18–0.20eV in gas phase and 0.57–
0.60eV with solvation, all close to the 0.22 and 0.58eV on Pt. Comparing with the
0.40eV solvent stabilization of bulk H2O, H2O shows positive binding to both surfaces.
However H2O does not bind to bridge, fcc, or hcp sites. Thus migration of H2O from
one top site to the next is through adsorption and dissociation. Hence the migration
barrier is 0.20eV in gas phase and 0.20eV in solvation (0.60eV binding energy minus the
0.40eV solvation of H2O).
Binding of H2O2. H2O2 has a binding energy on Pt3Ni of 0.23–0.31eV without
solvation and 0.58–0.67eV with solvation, close to the 0.27eV and 0.61eV on Pt.
109
Summary for binding preferences
We find that O2 prefers b0, b1a, b1b, and f2, placing it close to f2, the only site preferred
by O. H prefers to move within in the orange region, allowing it to attack O at the f2 site
to form OH at the b0, t1a, or t1b site. OH can also move along b0, t1a, t1b, f2, and h2. OOH
prefers top sites with second O orienting nearby Pt. H2O prefers all top sites and H2O2
prefers bridge sites.
We see that there is a strong regional preference for O2, O, H, OH, and OOH to
remain in the orange stripes. Of the top sites, t1a and t1b are most preferred for all species.
Similarly, b0 is predominantly preferred among bridge sites. As for threefold binding sites
(fcc and hcp, f1a, f1b, f2, h1a, h1b, h2), f2 is strongly preferred. So when the surface is
exposed to all the intermediates, at lower coverage (quarter layer), sites b0, f2, and t1a
(also t1b) are preferred. Only at higher coverage will the adsorbates bind to other sites.
The big picture is that the chemistry prefers the orange region. The direct effect of
this is that reaction barriers depend on whether the starting and ending sites are inside the
preferred region.
Reaction barriers and possible mechanisms
Our previous studies showed that six fundamental steps are involved in the various
possible mechanisms, namely,
a) O2 dissociation: O2ad Oad + Oad
b) OH formation: Oad + Ha OHad
c) H2O formation: OHad + Ha H2Oa
d) OOH formation: O2a + Ha OOHad
e) OOH dissociation: OOHad OHad + Oad .

110
f) hydration: Oad + H2Oa OHad + Oad
In putting these fundamental steps into an overall mechanism we distinguish three
categories.
• OO bond activation. There are two mechanisms: O2 dissociation (a) and OOH
formation (d) followed by OOH dissociation (e).
• OH formation. There are two mechanisms: OH formation (b) and O hydration (f).
• OH consumption. There is one mechanism, H2O formation (c).
A good catalyst must provide a low barrier in each of these three categories and for a
pathway for connecting them
Starting from the preferred sites, we calculated the barriers for all six steps on Pt3Ni.
The barriers and the comparison with pure Pt are shown in Table 9-4.
Gas phase barriers at high coverage
OO bond activation: On Pt3Ni, the mechanism of OOH formation followed by OOH
dissociation leads to a barrier of 0.32eV (OOH formation barrier since OOH dissociation
only has a small barrier of 0.04eV), compared to 1.02eV for the direct dissociation. This
is similar to the case of Pt where OOH formation has a barrier of 0.28, compared to
0.58eV for direct dissociation.
OH formation: On Pt3Ni, O hydration has a barrier of 0.34eV, compared with
0.57eV for the direct OH formation. This preference for O hydration is similar to the case
of Pt where the O hydration barrier is 0.29eV, compared to 0.72eV for the direct OH
formation.
OH consumption: On Pt3Ni, H2O formation has a small barrier of 0.11eV, which is
the same as the 0.11eV barrier for the Pt case.

111
Summarizing the three steps, we have the following preferred mechanism (denoted
OOH-form-hydr) for both Pt3Ni and Pt.
• O2ad + Had OOHad (Ea = 0.32eV for Pt3Ni and 0.28eV for Pt)
• OOHad Oad + OHad (Ea = 0.04eV for Pt3Ni and 0.14eV for Pt)
• Oad + H2Oad 2OHad (Ea = 0.34eV for Pt3Ni and 0.29eV for Pt)
• OHad + Had H2Oad (Ea = 0.11eV for Pt3Ni and 0.11eV for Pt)
The RDS for this mechanism is O hydration with a barrier of 0.34eV for Pt3Ni. For Pt,
the RDS is OOH formation with a barrier of 0.29eV. Hence for the gas phase, Pt out
performs Pt3Ni.
Solution phase barriers at low coverage
OO bond activation: The best O2 dissociation pathway starts from an f2-bound O2
and dissociates to form two Oad at f2 sites, with a barrier of 0.00eV (because solvent
strongly favors dissociation). This is similar to that on Pt surface. On Pt3Ni, we find that
OOH formation has a barrier of 0.17eV, similar to the 0.19eV on Pt. OOH dissociation
on Pt3Ni is barrierless, similar to that on Pt. Thus OOH formation and dissociation are not
the favored pathways for the solvated system.
OH formation: For the second step, Pt3Ni has a direct OH formation barrier of
1.02eV, 0.07eV lower than the 1.09eV on Pt. The O hydration step is less favorable on
Pt3Ni, leading to a barrier of 0.81eV, compared with 0.50eV for Pt. As illustrated in our
previous paper 84, O hydration is the dominant mechanism for forming OH on Pt. Hence
O hydration is the preferred mechanism for both Pt3Ni and Pt, with barriers of 0.81eV
and 0.50eV. This suggests that P3Ni would have worse performance for formation of
OHad.
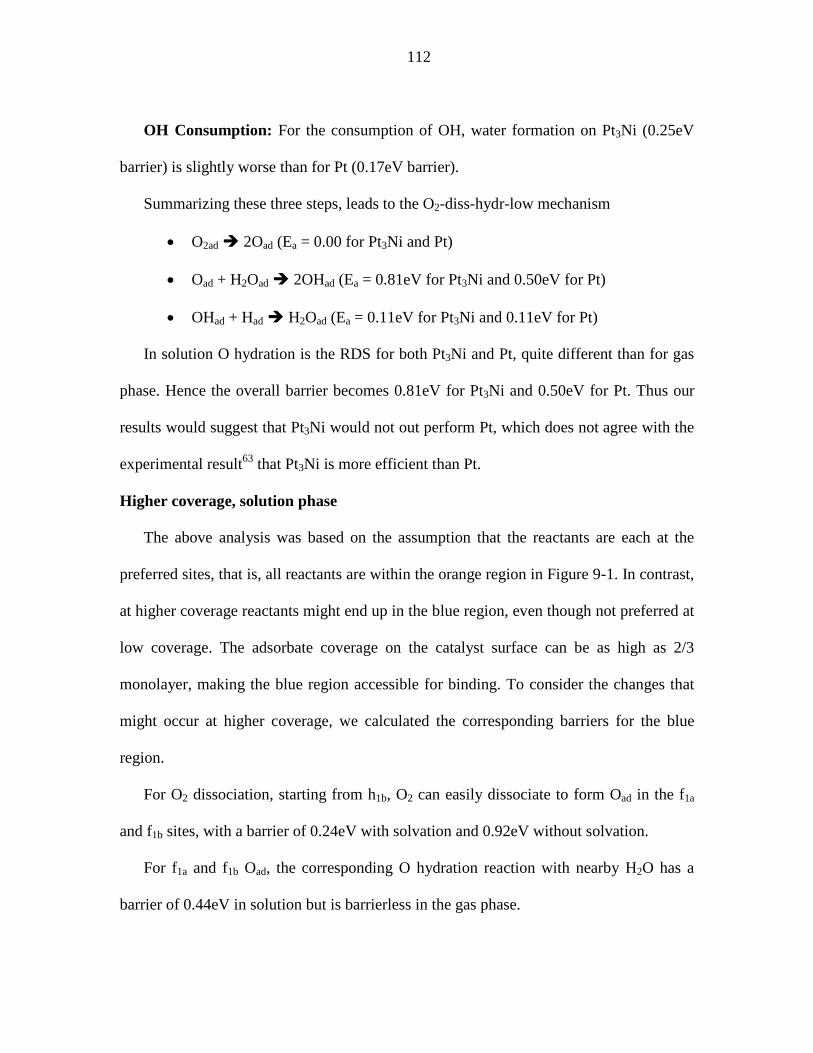
112
OH Consumption: For the consumption of OH, water formation on Pt3Ni (0.25eV
barrier) is slightly worse than for Pt (0.17eV barrier).
Summarizing these three steps, leads to the O2-diss-hydr-low mechanism
• O2ad 2Oad (Ea = 0.00 for Pt3Ni and Pt)
• Oad + H2Oad 2OHad (Ea = 0.81eV for Pt3Ni and 0.50eV for Pt)
• OHad + Had H2Oad (Ea = 0.11eV for Pt3Ni and 0.11eV for Pt)
In solution O hydration is the RDS for both Pt3Ni and Pt, quite different than for gas
phase. Hence the overall barrier becomes 0.81eV for Pt3Ni and 0.50eV for Pt. Thus our
results would suggest that Pt3Ni would not out perform Pt, which does not agree with the
experimental result63 that Pt3Ni is more efficient than Pt.
Higher coverage, solution phase
The above analysis was based on the assumption that the reactants are each at the
preferred sites, that is, all reactants are within the orange region in Figure 9-1. In contrast,
at higher coverage reactants might end up in the blue region, even though not preferred at
low coverage. The adsorbate coverage on the catalyst surface can be as high as 2/3
monolayer, making the blue region accessible for binding. To consider the changes that
might occur at higher coverage, we calculated the corresponding barriers for the blue
region.
For O2 dissociation, starting from h1b, O2 can easily dissociate to form Oad in the f1a
and f1b sites, with a barrier of 0.24eV with solvation and 0.92eV without solvation.
For f1a and f1b Oad, the corresponding O hydration reaction with nearby H2O has a
barrier of 0.44eV in solution but is barrierless in the gas phase.

113
The following step of H2O formation also has a low barrier of 0.43 eV with solvation
and 0.36eV without solvation.
Hence, when the preferred region is covered with Oad, O2 can start to bind to the
unfavored h1b, and then dissociate to form f1a and f1b. This allows a lower barrier for
hydration into 2 OH. This might avoid the high O hydration (0.81eV barrier) and OH
formation (1.09eV). The mechanism is as follows O2-diss-hydr-high.
• O2ad 2Oad (Ea = 0.00 at low coverage and 0.25 at high coverage)
• Oad + H2Oad 2OHad (Ea = 0.81eV at low coverage and 0.38eV at high
coverage)
• OHad + Had H2Oad (Ea = 0.11eV at low coverage and 0.43eV at high
coverage)
The overall mechanism has O hydration as the RDS with a barrier of 0.43eV, smaller
than the 0.50eV for Pt. This mechanism for the reaction on Pt3Ni happens at higher
coverage.
Summarizing the above discussion, in gas phase the preferred mechanism is OOH-
form-hydr with a RDS barrier of 0.34eV for Pt3Ni and 0.29eV for Pt. With solvation at
low coverage, where all intermediates can bind to the preferred region, we predict that
Pt3Ni would have slower kinetics than Pt with an overall barrier of 0.81eV. However, at
higher coverage, the less preferred (blue) region leads to a RDS barrier of 0.43 eV,
smaller than the Pt barrier of 0.50eV. This would be consistent with experiment.

114
Conclusion
We studied systematically the binding site preference of all reaction intermediates
involved in ORR on Pt3Ni. The binding energy of adsorbates on the alloy surface show
strong sublayer dependence. Compared with the pure Pt surface, the binding sites are
partitioned into two regions, the preferred (orange) and the less-preferred (blue) region.
The mechanism of ORR on Pt3Ni is similar to that of Pt. In solvent O2 first dissociates
into Oad. Oad then reacts with H2O to produce OHad, which finally reacts with Had to form
H2O.
Due to the substantial difference in binding sites, ORR shows different kinetics on the
preferred and not-preferred regions. The overall barrier for ORR in the preferred region is
0.81eV, while the barrier for the non-preferred region is 0.54eV. Thus ORR should be
strongly coverage-dependent. At low coverage, all reactants and intermediates adsorb
only onto the preferred region, generating a slower reaction rate than with pure Pt. At
higher coverage, O2 begins to react on the non-preferred region, leading to a better rate as
compared with pure Pt.

115
Tables and Figures
BE BE H O OH O2 OOH H2O H2O2
Pt3Ni
t1a -2.70 -2.48 -2.29 -1.05 -0.20
t1b -2.60 -2.37 -2.22 -0.97 -0.18
t2 -2.44 -2.16 -2.00 -0.98 -0.18
b0 -2.60 -3.09 -2.42 -0.59 -0.23
b1a -2.57 -2.98 -2.25 -0.47 -0.29
b1b -2.48 -2.95 -2.10 -0.39 -0.29
b3a -2.39 -2.67 -1.96 -0.26 -0.29
b3b -2.39 -2.62 -1.85 -0.24 -0.29
b2a -2.46 -2.76 -1.98 -0.27 -0.31
b2b -2.52 -2.75 -2.01 -0.25 -0.31
f2 -2.55 -3.47 -2.29 -0.33 -0.93
f1a -2.45 -3.17 -1.92 0.04 -0.77
f1b -2.49 -3.08 -1.89 0.00 -0.78
h1a -2.48 -2.96 -1.90 -0.18
h1b -2.47 -2.94 -1.87 -0.09
h2 -2.53 -3.06 -2.32 -0.15
best -2.70 -3.47 -2.42 -0.59 -1.05 -0.20 -0.31
Pt t -2.80 -2.50 -2.23 -1.06 -0.22
b -2.70 -3.10 -2.25 -0.40 -0.27
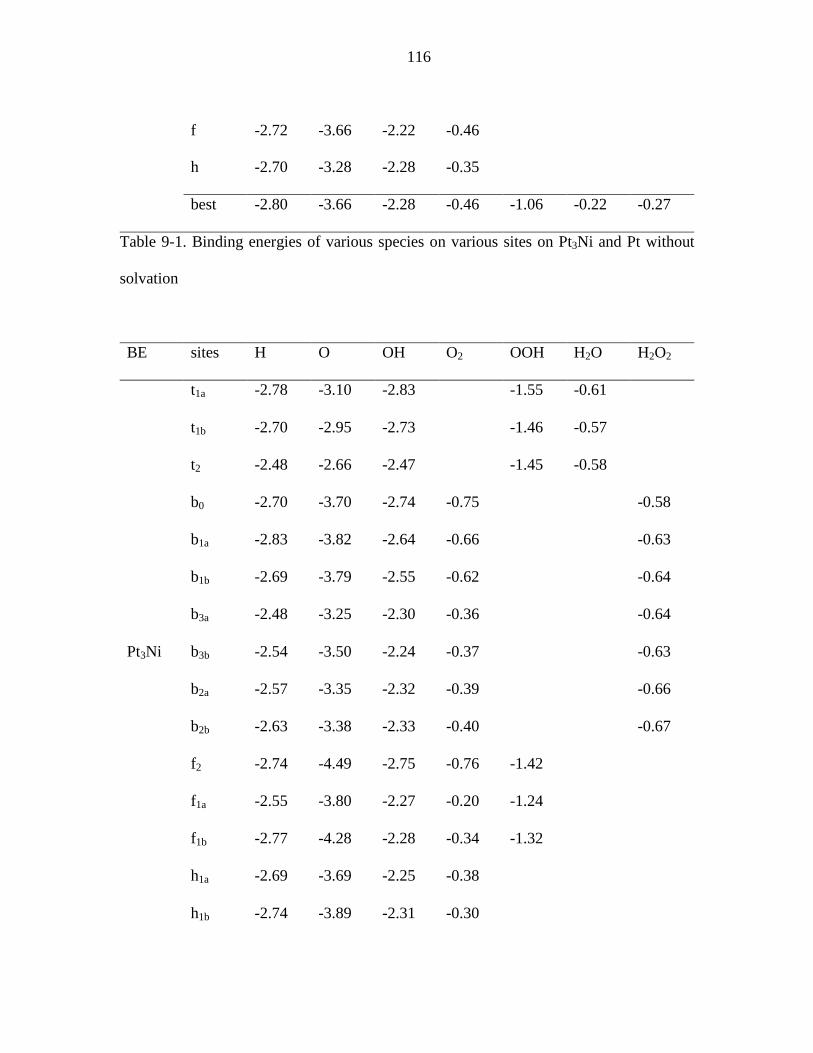
116
f -2.72 -3.66 -2.22 -0.46
h -2.70 -3.28 -2.28 -0.35
best -2.80 -3.66 -2.28 -0.46 -1.06 -0.22 -0.27
Table 9-1. Binding energies of various species on various sites on Pt3Ni and Pt without
solvation
BE sites H O OH O2 OOH H2O H2O2
Pt3Ni
t1a -2.78 -3.10 -2.83 -1.55 -0.61
t1b -2.70 -2.95 -2.73 -1.46 -0.57
t2 -2.48 -2.66 -2.47 -1.45 -0.58
b0 -2.70 -3.70 -2.74 -0.75 -0.58
b1a -2.83 -3.82 -2.64 -0.66 -0.63
b1b -2.69 -3.79 -2.55 -0.62 -0.64
b3a -2.48 -3.25 -2.30 -0.36 -0.64
b3b -2.54 -3.50 -2.24 -0.37 -0.63
b2a -2.57 -3.35 -2.32 -0.39 -0.66
b2b -2.63 -3.38 -2.33 -0.40 -0.67
f2 -2.74 -4.49 -2.75 -0.76 -1.42
f1a -2.55 -3.80 -2.27 -0.20 -1.24
f1b -2.77 -4.28 -2.28 -0.34 -1.32
h1a -2.69 -3.69 -2.25 -0.38
h1b -2.74 -3.89 -2.31 -0.30

117
h2 -2.68 -3.66 -2.66 -0.38
best -2.83 -4.49 -2.83 -0.76 -1.55 -0.61 -0.67
Pt
t -2.87 -3.09 -2.77 -1.52 -0.58
b -2.82 -3.73 -2.63 -0.73 -0.61
f -2.85 -4.36 -2.57 -0.87
h -2.81 -3.92 -2.64 -0.70
best -2.87 -4.36 -2.77 -0.87 -1.52 -0.58 -0.61
Table 9-2. Binding energies of various species on various sites on Pt3Ni and Pt with
solvation
Reaction Barriers Pt Pt3Ni alternative
H2 Dissociation 0.00 0.05
O2 Dissociation 0.58 1.02 0.92
OH Formation 0.72 0.57 0.67
H2O Formation 0.11 0.11 0.36
OOH Formation 0.28 0.32
OOH Dissociation 0.14 0.04
H-OOH dissociation 0.18 0.20
O hydration 0.29 0.34 0.00
Table 9-3. Reaction barriers for Pt3Ni in gas phase
* The O hydration on Pt is from 3x3 calculations because the c(2x2) cell is not large
enough.
** For Pt3Ni, to keep the correct periodic condition, we used c(4x2) and c(2x4).

118
Reaction Barriers Pt Pt3Ni alternative
H2 Dissociation 0.00 0.01
O2 Dissociation 0.00 0.00 0.24
OH Formation 1.09 1.02 0.80
H2O Formation 0.17 0.25 0.43
OOH Formation 0.19 0.17
OOH Dissociation 0.00 0.00
H-OOH dissociation 0.04 0.22
O hydration 0.50* 0.81** 0.44
Table 9-4. Reaction barriers on Pt3Ni with solvation
* The O hydration on Pt is from 3x3 calculations because the c(2x2) cell is not large
enough.
** For Pt3Ni, to keep the correct periodic condition, c(4x2) and c(2x4) were used.

119
Figure 9-1. Binding sites on Pt3Ni surface. The blue and orange stripes indicate the
partitioning of the Pt surface into two regions induced by the sublayer Ni. The O2, O, H,
OH, and OOH species prefer to move only within the blue stripes.

120
Ni Ni
Ni
Ni
Ni
Ni
Ni Ni Ni
t1 t2
b0 b1 b2 b3Ni
Ni Ni
f1 f2 h1 h2
Ni
Figure 9-2. Illustration of various binding sites on Pt3Ni surface. For top sites t1 and t2,
the triangle indicates the sublayer atoms. t1 has one Ni atom beneath it, while t2 has two.
For bridge sites, the bridge itself is shown as the thick black line while the two termini of
the black line connect the two surface atoms forming the bridge site. The trapezoid
beneath are sublayer atoms. b0-b3 has 0-3 Ni atoms in this sublayer. An fcc site is in the
center of a surface triangle (shown as solid triangle). f1 and f2 differ in the sublayer
triangle beneath the surface triangle. f1 has one Ni beneath it while f2 has two. hcp sites
are also in the center of a surface triangle. hcp sites have one sublayer atom beneath it.
For h1 it is Ni, while for h2 it is Pt.
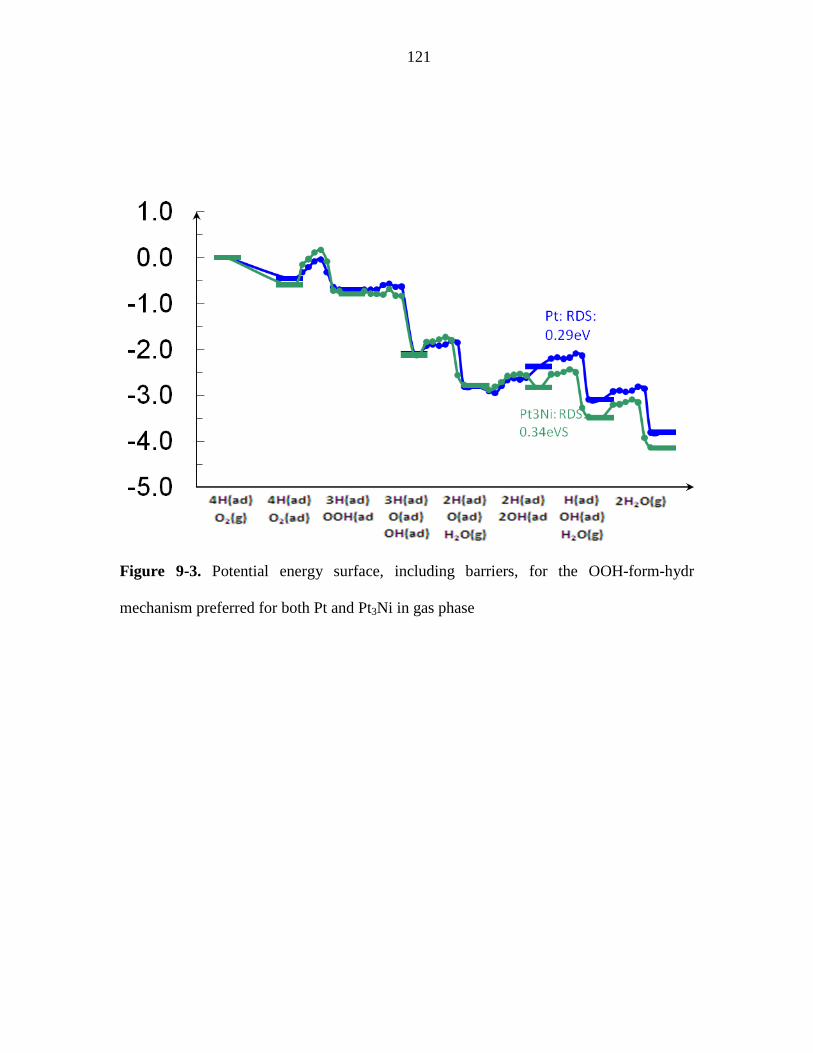
121
Figure 9-3. Potential energy surface, including barriers, for the OOH-form-hydr
mechanism preferred for both Pt and Pt3Ni in gas phase

122
Figure 9-4. Potential energy surface, including barriers, for the O2-diss-hydr mechanism
preferred by both Pt3Ni and Pt in solution. The purple line shows the alternative
mechanism at higher coverage.

123
Chapter 10 Predictions of the Oxygen Reduction Reaction on
Copper-Palladium Alloys
Abstract
Based on the Norskov d-band center hypothesis, we considered that Pd-Cu catalysts
might have increased activity over pure Pd for the oxygen reduction reaction (ORR) in
fuel cells. To serve as a basis for comparing with experiments on these catalysts and on
the d-band structures, we used density functional theory calculations to determine the
structural preference and ORR activity as a function of composition and structure. Five
PdCu alloy structures are considered and the layered L11 structure showed promising
ORR kinetics.
Introduction
There is great interest in cathode catalysts for proton electrolyte membrane fuel cell
(PEMFC) that maintain or improve the high performance for the oxygen reduction
reaction (ORR) exhibited by Pt, while dramatically reducing material costs1–4. The
Norskov d-band center hypothesis suggested that Pd-Cu alloys might have improved
oxygen reduction reaction (ORR) in fuel cells compared to Pd107. This led to a DOE-BES
funded project in which experiments were carried out by Deborah Myers at Argonne
National Labs and by John Regalbuto at U. Illinois Chicago Circle. In addition,
experiments on the d-band centers for these alloys were carried out by Christian Heske at
U. Nevada, Las Vegas. Comparisons of the theory to these d-band experiments will be

124
discussed in a separate paper. Here we will discuss the crystals and surface structures for
PdCu alloys and the predicted ORR raters for these systems.
Methodology
The ORR studies on the PdCu catalysts modeled the system as a slab infinite in two
directions (a and b) and finite in the third direction (c). We consider a 3x3 supercell of the
(111) surface (4 atoms per layer) that is six layers thick (24 atoms). The top two layers
are allowed to relax, representing the active surface, while the bottom four layers are
fixed, representing the bulk side of the surface. The same model was applied in previous
studies on Pt66.
All calculations employed the kinetic and exchange-correlation DFT functional
developed by Perdew, Burke, and Ernzerhof (PBE) 30. We used the Seqquest29
implementation with an optimized double-zeta plus polarization Gaussian-type basis set
contracted from calculations on the most stable unit cell of the pure elements. We used
the small-core, angular-momentum-projected, norm-conserving, nonlocal effective core
potentials34–37 (pseudopotentials) to replace the core electrons. Thus, the neutral Cu atom
was described with 17 explicit electrons (six 3p, one 4s, and ten 3d in the ground state),
while Pd included the 4p, 4d, 5s electrons so neutral Pd has 16 electrons.
The real space grid density was 5 points per angstrom, while the reciprocal space grid
was 5×5×0 for slab calculations. All calculations allowed the up-spin orbitals to be
optimized independently of the down-spin orbitals (spin-unrestricted DFT).
The periodic cell parameters are based on the optimized bulk structure with all
possible fcc-type binary alloys.

125
The solvation of the water phase employed a continuum model66 based on the
Poisson-Boltzmann approximation23–25,38. All reaction pathways were determined using
the nudged elastic band55–56 method and solvent effects were included for each point
along the path.
For the ordered bulk structures, we use FCC and BCC cubic unit cells with 4 and 2
atoms per cell, respectively, relaxing both the atom and cell parameters. The resulting
lattice parameters are tabulated in Table 10-1. The reciprocal space grid was 12×12×12.
For the solid solution (disordered) bulk structures, we randomly placed Pd and Cu
atoms in a 2x2x1 16-atom FCC cell. The atoms and volume of the cells were allowed to
relax. The resulting lattice parameters are tabulated in Table 1. The reciprocal space grid
was 6×6×12.
Table 10-1 shows the predicted lattice parameters of Pd, Cu, Pt, and alloys from DFT
compared with experiment. The predicted results are within 2% of experiment.
Results and Discussion
Bulk structures and energetics
The phase diagram, Figure 10-1, shows the following structures:
• A distinct PdCu phase with CsCl type structure stable below 598 C. The
composition ranges from 34 to 48 at% Pd at 400°C.
• A Cu3Pd phase stable below 490°C with L12 structure (Cu3Au), with a range of
comparison from 20 to 27 at% Pd at 400°C. Two slightly distorted L12 structures. Cu
composition in the range of 23–30 at% Pd at 400°C. The structure deviates from L12 and
has a long-period superstructure (LPS) 108.

126
• Outside of these ranges the Cu and Pd give a single solid solution phase for 0 to
100%Pd. The structure is fcc-type with Cu randomly replaced by Pd.
Table 10-1 compares the DFT calculated cell parameters and cohesive energies to
experiment where we see that for the pure phases the cell parameter is in general
systematically larger than the experimental value. The pure Cu, Pd, and Pt lattice
parameters are 1.23%, 1.37%, and 1.45% larger than the experimental value. For the
PdCu alloys, PdCu (CsCl), PdCu3 (L12), and PdCu (L10 and L11) are 1.40%, 1.21%, and
1.58% larger than the experimental value. All agree well with experiments.
For ORR catalyst particle, it is difficult to generalize the catalytic activity for a solid
solution because of the numerous possible structures. Instead we consider the two most
common FCC-type binary alloy, L11 (CuPt type) and L10 (AuCu type). L11-type alloy is
layered in the (111) direction of an FCC cell, while L10 is layered in (001) direction. L11
can be deformed in the (111) direction and becomes a B13 structure.
For the Cu3Pd composition we considered the L12 ordered phase in which the Cu are
at the faces of a cube and the Pd at the corners. The LPS structures are ignored because
they are not likely to exist, or does not differ much from the L12 structure. We also
considered a random alloy. L12 is the only possible fcc-type structure that keeps all Pd
separated from each other. Hence we considered an alternative structure with Pd
appearing in pairs. The L12 structure is more stable than the random structure by 0.20eV
per Cu3Pd unit. This agrees with the fact that at low temperature L12 is a stable phase,
while at higher temperature the alloy becomes solid solution. The LPS structures are not
likely to exist or to differ from the L12 structure. Hence they are ignored in our study. Of
particular interest is the 1:1 PdCu composition. The experimentally reported preferred
127
structures at lower than 598°C are the B2 or CsCl structure in which the cubic unit cell
has Pd at the corners and Cu at the center. Thus each atom has 8 neighbors instead of 12.
At temperatures higher than 600°C Cu and Pd form a continuous FCC solid solution
phase changing continuously from pure Cu to pure Pd. It is difficult to generalize the
catalytic activity for a solid solution because of the numerous possible structures.
Considering the fact that Cu3Pd alloys have ordered versions of FCC, we considered two
PdCu might also have a stable ordered phase related to FCC. Consequently instead of a
random PdCu structure, we optimized two FCC-like ordered phases for the PdCu
compositions. We considered the L10 structure (see Figure 10-2) in which the Cu and Pd
are ordered in the (100) direction of FCC unit cell and the L11 structure in which the Cu
and Pd are ordered in the (111) direction of FCC. L11 can be deformed in the (111)
direction leading to the B13 structure, which has been observed experimentally109. As
shown in Table 10-1, we find the L11 and L10 phase are less stable than the CsCl
structure by 0.26eV per PdCu unit.
We consider that the L11/B13 phase of PdCu could be a potential interesting catalyst
because it has layered structure in the closed packing direction. L10 is also layered, but its
closed packing surface would always have half-Cu/half-Pd and hence be subject to much
faster corrosion in the desired acid environment. The L11 structure however, is layered in
the closed packing direction. Thus in a catalyst, we can expect that the Cu plane could be
oxidized off the surface, leaving a closest, packed Pd surface exposed to the reactants at
the cathode.
Consequently we examined the ORR reaction as reported in the next section.

128
Surface structures and energetics
For FCC structure, it is clear that (111) is preferred. Hence for Cu3Pd, it is a pure Cu
surface, for L10 it is the closed packing (221) surface. For L11/B13, there are two unique
closed packing surfaces, one with the surface Pd connecting to two sublayer Pd atoms
and another with the surface Pd connecting to one Pd atom in sublayer.
For CsCl structure, it’s not clear which surface is preferred. Hence we did a surface
cleavage study by cleaving all possible low-index surfaces and calculating the
corresponding surface energy. The six most stable surfaces are shown in Table 10-2. We
can see that the most preferred surfaces are (320) and (110). (320) surface can be viewed
as a tilted (110) surface or, in other words, a (110) surface with steps. So in the following
calculations, we focused on the (110) surface on CsCl-structured PdCu alloy.
Binding site preferences on Cu, Pd, PdCu, and PdCu3
First of all, we studied the preferred binding sites of O, H, O2, OH, H2O, OOH, and
H2O on all the involved surfaces. Table 10-3 shows the binding energies of all the
intermediates on all PdCu alloy surfaces involved. We also included the corresponding
numbers for Pt, Pd, and Cu for comparison.
H prefers to bind to ccp sites on Pd, Cu, and all layered L11 PdCu, PCu3 and CsCl-
structured PdCu alloy surfaces. Similar to Pd and Cu, the top site is a stable binding site
but is less preferred. Nonlayered L11 PdCu and L10 PdCu prefer top sites. This unique
preference comes from the fact that they both have lines of Pd atoms on the surface. H
binds much more strongly to Pd than to Cu.
O prefers to bind to fcc sites for Pd, Cu, Pt, and all alloys except CsCl-structured and
L10-structured PdCu alloys. For CsCl-structured PdCu, the smaller distance between

129
surface atoms (2.62A as compared to 2.70A) helps improve the stability of the µ2 site.
For all mixed-metal surfaces (CsCl structured, L10 and L11 nonlayered), sites with more
adjacent Cu are always preferred, mostly due to the fact that O binds more strongly to Cu.
OH prefers to bind to µ2, µ3-ccp, and µ3-hcp with similar binding energies. This leads
to a flat surface on the metals and high mobility for OH, given that the OH can migrate
through a µ2 site. Similar to the case of Oad, OH prefers to bind to Cu on the surface
rather than Pd. Hence for the stripped L10 and L11 nonlayered structure, the migration is
limited to the Cu line.
O2 prefers to bind to a ccp site, except for CsCl-structured PdCu, where a bridge site
is preferred. Again, strong bond energy between O and Cu makes all sites with more
connected Cu preferred ones.
OOH and H2O can only bind to top sites for all the materials involved.
Barriers for the essential steps
Here we only discuss the two most popular mechanisms: O2 dissociation mechanism
and OOH association mechanism. The steps involved are O2 dissociation, OH formation,
H2O formation, OOH formation, and OOH dissociation. See Table 10-5 and Table 10-6
for the barriers with and without solvation.
O2 dissociation is easy on PdCu3 surface with a low barrier of 0.15eV without
solvation, mostly due to the stable Oad. On B2 and L10-structured PdCu surface the
reaction has a higher barrier of 0.42eV and 0.33eV. Layered L11 PdCu has a high barrier
of 0.89eV due to the weak binding of Oad (3.35eV as compared to > 3.93eV for other
alloys).
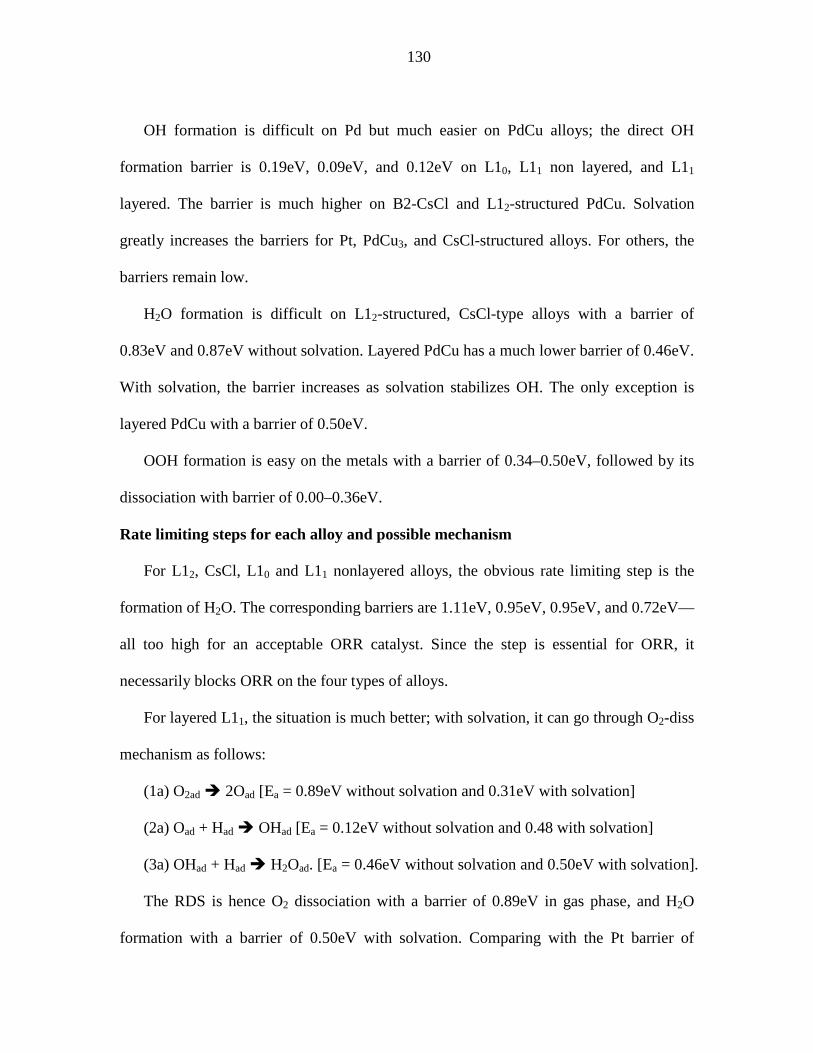
130
OH formation is difficult on Pd but much easier on PdCu alloys; the direct OH
formation barrier is 0.19eV, 0.09eV, and 0.12eV on L10, L11 non layered, and L11
layered. The barrier is much higher on B2-CsCl and L12-structured PdCu. Solvation
greatly increases the barriers for Pt, PdCu3, and CsCl-structured alloys. For others, the
barriers remain low.
H2O formation is difficult on L12-structured, CsCl-type alloys with a barrier of
0.83eV and 0.87eV without solvation. Layered PdCu has a much lower barrier of 0.46eV.
With solvation, the barrier increases as solvation stabilizes OH. The only exception is
layered PdCu with a barrier of 0.50eV.
OOH formation is easy on the metals with a barrier of 0.34–0.50eV, followed by its
dissociation with barrier of 0.00–0.36eV.
Rate limiting steps for each alloy and possible mechanism
For L12, CsCl, L10 and L11 nonlayered alloys, the obvious rate limiting step is the
formation of H2O. The corresponding barriers are 1.11eV, 0.95eV, 0.95eV, and 0.72eV—
all too high for an acceptable ORR catalyst. Since the step is essential for ORR, it
necessarily blocks ORR on the four types of alloys.
For layered L11, the situation is much better; with solvation, it can go through O2-diss
mechanism as follows:
(1a) O2ad 2Oad [Ea = 0.89eV without solvation and 0.31eV with solvation]
(2a) Oad + Had OHad [Ea = 0.12eV without solvation and 0.48 with solvation]
(3a) OHad + Had H2Oad. [Ea = 0.46eV without solvation and 0.50eV with solvation].
The RDS is hence O2 dissociation with a barrier of 0.89eV in gas phase, and H2O
formation with a barrier of 0.50eV with solvation. Comparing with the Pt barrier of

131
0.50eV and Pd barrier of 0.76eV, we can see that the PdCu-layered alloy shows a great
improvement in kinetics as well as cost, compared with Pd.
Comparison with later experimental results of colloidal Pd-Cu alloy
The calculations were carried in advance of the experimental studies for PdCu alloy
materials to provide some insight useful for interpreting the experiments. Figure 10-3
shows the experimental mass activity of various Pd-Cu colloidal catalysts reported
recently107. The mass activity was much higher for Pt (~ 1450 mA/mg) than Pd (~ 200
mA/mg), as expected. However, the mass activity of Pd-Cu alloys is higher than pure Pd
(~ 800 mA/mg for PdCu and ~ 600 mA/mg for PdCu3). This is consistent with the results
from our computational studies.
In the analysis of the Pd-Cu catalysts by X-ray diffraction, the structures were
determined to be disordered FCC rather than the BCC-like (B2) phase observed
experimentally to be the stable phase for this composition. This is probably due to the
heat treatment above the order/disorder transition temperature. Indeed, as shown above,
the BCC structure would have poor performance, whereas the ordered L11 phase is
predicted to have good performance. This suggests that the heat treatment might have
facilitated the formation of the ORR favorable phase. Probably the acid treatment helped
by removing the disordered components.
Analysis of d-band centers
Norskov proposed a simple model that correlates the d-band center of the surface
metal to catalytic activity110. Indeed, he found the adsorption energy of simple adsorbates
(O, CO, H) correlated well with the center of the surface metal d-band17,110. We will
publish elsewhere a detailed description of the band structures for these PdCu alloys with
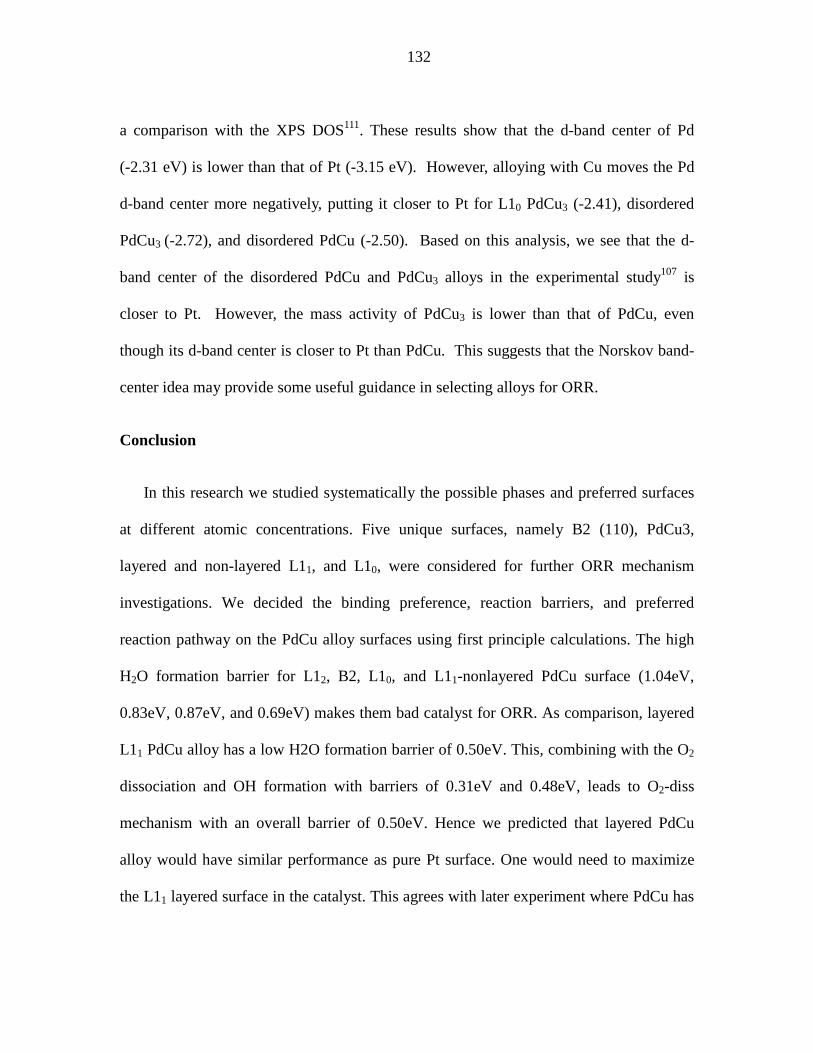
132
a comparison with the XPS DOS111. These results show that the d-band center of Pd
(-2.31 eV) is lower than that of Pt (-3.15 eV). However, alloying with Cu moves the Pd
d-band center more negatively, putting it closer to Pt for L10 PdCu3 (-2.41), disordered
PdCu3 (-2.72), and disordered PdCu (-2.50). Based on this analysis, we see that the d-
band center of the disordered PdCu and PdCu3 alloys in the experimental study107 is
closer to Pt. However, the mass activity of PdCu3 is lower than that of PdCu, even
though its d-band center is closer to Pt than PdCu. This suggests that the Norskov band-
center idea may provide some useful guidance in selecting alloys for ORR.
Conclusion
In this research we studied systematically the possible phases and preferred surfaces
at different atomic concentrations. Five unique surfaces, namely B2 (110), PdCu3,
layered and non-layered L11, and L10, were considered for further ORR mechanism
investigations. We decided the binding preference, reaction barriers, and preferred
reaction pathway on the PdCu alloy surfaces using first principle calculations. The high
H2O formation barrier for L12, B2, L10, and L11-nonlayered PdCu surface (1.04eV,
0.83eV, 0.87eV, and 0.69eV) makes them bad catalyst for ORR. As comparison, layered
L11 PdCu alloy has a low H2O formation barrier of 0.50eV. This, combining with the O2
dissociation and OH formation with barriers of 0.31eV and 0.48eV, leads to O2-diss
mechanism with an overall barrier of 0.50eV. Hence we predicted that layered PdCu
alloy would have similar performance as pure Pt surface. One would need to maximize
the L11 layered surface in the catalyst. This agrees with later experiment where PdCu has

133
improved performance as compared to Pd. And it also explains why heat and acid
treatment could boost the ORR performance for PdCu alloy.
134
Tables and Figures
Structure cell
parameters
(Å) DFT
Cell parameters
(Å) Experiment
Cohesive energy
(eV) QM, per
atom
Cu (FCC) 3.66 3.615112 3.63
Pd (FCC) 3.954 3.90113 4.27
Pt (FCC) 3.980 3.97113
PdCu3 (L12, FCC) 3.734 3.676114 3.96
PdCu3 (FCC solid solution) N/A 3.765109 3.91
PdCu (B1, BCC) Pm3m 3.020 2.981109 4.17
PdCu (L10, FCC) 3.820* N/A 4.04
PdCu (L11/B13, FCC) R3m 2.706** 2.700109 4.04
PdCu (FCC solid solution) N/A 3.765109
Table 10-1. Calculated lattice parameter as compared to experimental value
* For L10 structure has a tetragonal cell containing a PdCu unit, to make comparison
easier, convert that to a fcc-type cell instead of the tetragonal cell.
** For L11, the unit cell contains 32 atoms which is beyond the range that we can handle.
Instead we used the triclinic cell with three-fold rotational symmetry forced. The number
represents the Pd-Cu distance.

135
Surface (hkl) Energy (eV/A2) Energy (erg/cm2)
PdCu(320) 0.270 4.32×10³
PdCu(110) 0.271 4.35×10³
PdCu(100) 0.290 4.65×10³
PdCu(210) 0.294 4.72×10³
PdCu(310) 0.301 4.83×10³
PdCu(332) 0.303 4.86×10³
Table 10-2. Six most table surfaces of B2 PdCu

136
Binding
Energy
(eV)
Binding
Site Pt Pd Cu
PdCu3-
L12
PdCu-
CsCl
PdCu-
L10
PdCu-
L11-non-
layered
PdCu-
L11-
layered
M 0.00 0.00 0.00 0.00 0.00 0.00 0.00 0.00
M-H
µ1 -2.90 -2.37 -2.03 -2.03 -2.24 -2.64 -2.81 -2.06
µ2 -2.75 -2.68 -2.40* -2.49 -2.79 -2.62 -2.72 -2.52
µ3-ccp -2.75 -2.78 -2.50 -2.60 -2.82 -2.66 -2.79 -2.65
µ3-hcp -2.75 -2.76 -2.51 -2.58 -2.67 -2.63 -2.58 -2.68
M-O
µ1 -2.70 -2.52 -2.79 -2.54 -2.46 -2.27 -2.41 -2.05
µ2∗∗ -3.33 -3.38 -4.05 -3.99 -3.93 -3.80 -3.76 -2.91
µ3 -ccp -3.89 -3.82 -4.40 -4.43 -3.93 -3.75 -3.96 -3.35
µ3-hcp -3.38 -3.63 -4.29 -3.98 -3.78 -3.94 -3.82 -3.19
M-OH
µ1 -2.42 -2.52 -2.23 -2.27 -1.95 -2.42 -2.52 -2.23
µ2 -2.67 -2.76 -2.53 -2.70 -2.16 -2.67 -2.76 -2.53
µ3-ccp -2.69 -2.72 -2.42 -2.66 -2.12 -2.69 -2.72 -2.42
µ3-hcp -2.68 -2.74 -2.81 -2.55 -2.12 -2.68 -2.74 -2.81
M-O2
bridge -0.45 -0.63 -0.46 -0.71 -0.35 -0.45 -0.63 -0.46
ccp -0.61 -0.71 -0.36 -0.61 -0.25 -0.61 -0.71 -0.36
hcp -0.47 -0.62 -0.31 -0.54 -0.26 -0.47 -0.62 -0.31
M-OOH µ1b -1.20 -1.10 -1.27 -1.03 -1.18 -0.96 -0.94 -0.76
µ1c -1.07 -1.05 -1.20 -0.90 -0.99 -0.92 -0.93 -0.77

137
M-H2O2 bridge -0.30 -0.35 -0.22 -0.24 -0.30 -0.26 -0.30 -0.28
M-H2O µ1 -0.29 -0.26 -0.19 -0.24 -0.16 -0.24 -0.22 -0.25
Table 10-3. Binding energies for the intermediates involved in ORR on Pt, Pd, Cu, and
PdCu alloys
*H is not stable on µ2 bridge site on Cu, PdCu3 (L12).
** O is not stable on µ2 bridge site, serves as the transition state of surface diffusion.
Binding
Energy
(eV)
Binding
Site Pt Pd Cu
PdCu3-
L12
PdCu-
CsCl
PdCu-
L10
PdCu-L11-
non-
layered
PdCu-
L11-
layered
M 0.00 0.00 0.00 0.00 0.00 0.00 0.00 0.00
M-H
µ1 -2.97 -2.47 -2.05 -2.25 -2.37 -2.90 -3.22 -2.20
µ2 -2.88 -2.82 -2.43 -2.61 -3.05 -2.87 -2.92 -2.67
µ3-ccp -2.88 -2.94 -2.54 -2.67 -2.98 -2.74 -2.88 -2.77
µ3-hcp -2.87 -2.90 -2.54 -2.65 -2.70 -2.77 -2.85 -2.87
M-O
µ1 -3.28 -3.13 -3.35 -3.04 -2.97 -2.90 -2.96 -2.78
µ2∗∗ -3.96 -3.88 -4.51 -4.92 -4.88 -4.60 -4.18 -3.57
µ3-ccp -4.60 -4.36 -4.90 -5.58 -4.85 -4.77 -5.10 -4.02
µ3-hcp -4.02 -4.15 -4.78 -4.90 -4.29 -4.55 -4.31 -3.90
M-OH µ1 -2.92 -2.79 -3.08 -2.87 -2.86 -2.69 -2.80 -2.58
µ2 -2.83 -2.90 -3.36 -3.04 -3.17 -2.96 -3.18 -2.69
138
µ3-ccp -2.75 -2.81 -3.33 -3.02 -3.16 -2.92 -3.19 -2.55
µ3-hcp -2.86 -2.82 -3.31 -3.16 -3.15 -2.92 -2.87 -2.57
M-O2
bridge -0.95 -0.89 -0.83 -0.70 -0.88 -0.73 -0.93 -0.60
ccp -1.16 -1.05 -1.10 -1.17 -1.18 -0.65 -0.89 -0.52
hcp -0.93 -0.97 -1.09 -1.00 -1.16 -0.79 -0.81 -0.57
M-
OOH
µ1b -1.66 -1.50 -1.73 -1.44 -1.62 -1.36 -1.36 -1.31
µ1c -1.54 -1.48 -1.68 -1.38 -1.57 -1.29 -1.36 -1.35
M-
H2O2 bridge -0.64 -0.66 -0.51 -0.58 -0.66 -0.53 -0.61 -0.67
M-H2O µ1 -0.67 -0.60 -0.52 -0.61 -0.63 -0.56 -0.58 -0.70
Table 10-4. Binding energies for intermediates involved in ORR on Pt, Pd, Cu, and PdCu
alloys with solvent effect
Reaction Barriers Pt Pd Cu PdCu3-
L12
PdCu-
CsCl
PdCu-
L10
PdCu-L11-
nonlayered
PdCu-L11-
layered
H2 Dissociation 0.00 0.00 0.16 0.66 0.19 0.30 0.30 0.43
O2 Dissociation 0.51 0.72 0.12 0.15 0.42 0.44 0.66 0.89
OH Formation 0.82 0.27 0.00 0.46 0.47 0.19 0.09 0.12
H2O Formation 0.12 0.53 0.84 1.04 0.83 0.87 0.69 0.46
OOH Formation 0.34 0.50 0.37 0.42 0.75 0.46 0.36 0.40
OOH Dissociation 0.01 0.32 0.49 0.04 0.09 0.28 0.61 0.65
Table 10-5. Barriers for the reaction steps involved in ORR without solvation

139
Reaction Barriers Pt Pd Cu PdCu3-
L12
PdCu-
CsCl
PdCu-
L10
PdCu-L11-
nonlayered
PdCu-
L11-
layered
H2 Dissociation 0.00 0.00 0.04 0.59 0.00 0.25 0.10 0.21
O2 Dissociation 0.00 0.31 0.00 0.00 0.07 0.20 0.23 0.31
OH Formation 1.23 0.42 0.14 0.84 1.00 0.27 0.23 0.48
H2O Formation 0.24 0.76 0.94 1.11 0.95 0.95 0.72 0.50
OOH Formation 0.25 0.65 0.43 0.50 0.86 0.65 0.50 0.56
OOH Dissociation 0.00 0.04 0.31 0.00 0.00 0.00 0.36 0.22
Table 10-6. Barriers for the reaction steps involved in ORR with solvation

140
Figure 10-1. Phase diagram of PdCu system. Three unique phases exists in the diagram.
A bcc type phase at around 45% atomic ratio, an FCC type Cu3Pd (AuCu3 structure), and
a FCC-type solid solution phase. (From ASM115)

141
Figure 10-2. Four type of bulk structures considered in this research. (Images taken from
http://en.wikipedia.org/)
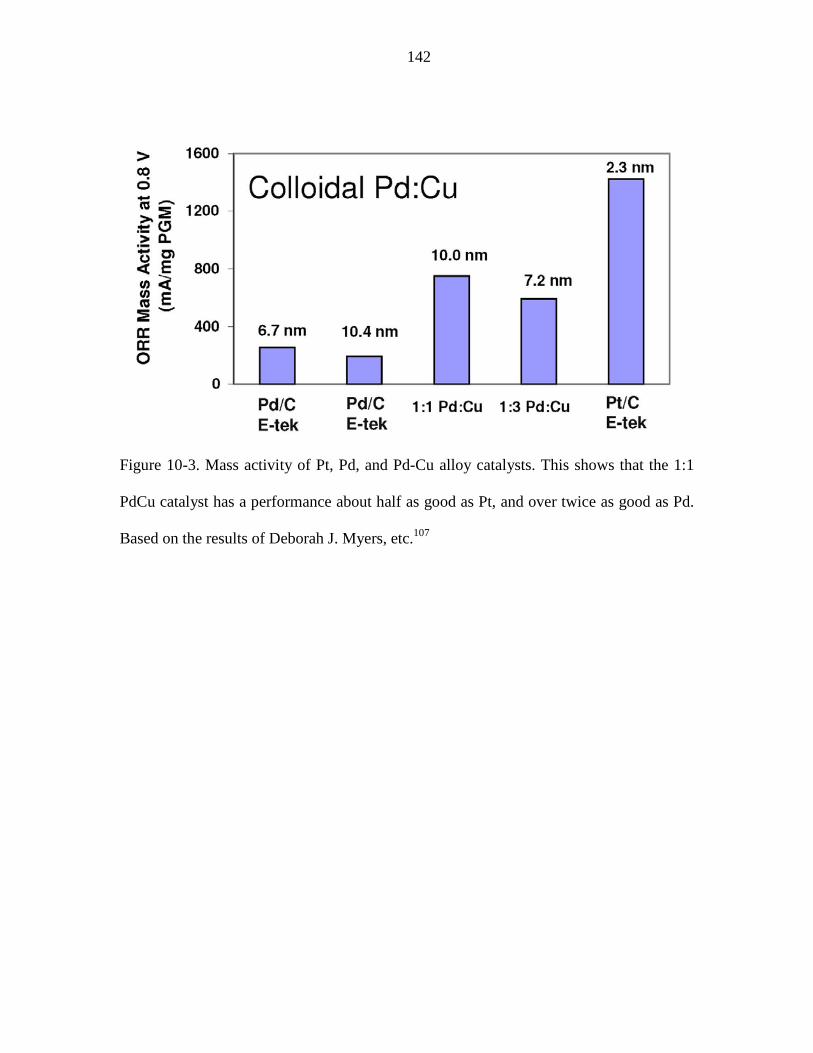
142
Figure 10-3. Mass activity of Pt, Pd, and Pd-Cu alloy catalysts. This shows that the 1:1
PdCu catalyst has a performance about half as good as Pt, and over twice as good as Pd.
Based on the results of Deborah J. Myers, etc.107

143
References
(1) Kordesch, K.; Simader, G. Fuel Cells and Their Applications; VCH: New York,
1996.
(2) Appleby, A.; Foulkes, F. Fuel Cell Handbook; Van Nostrand Reinhold: New
York, 1989.
(3) Brandon, N. P.; Skinner, S.; Steele, B. C. H. Annu. Rev. Mater. Res. 2003, 33, 183.
(4) Mehta, V.; Cooper, J. S. J. Power Sources 2003, 114, 32.
(5) Baturina, O. A.; Garsany, Y.; Zega, T. J.; Stroud, R. M.; Schull, T.; Swider-Lyons,
K. E. J. Electrochem. Soc. 2008, 155, B1314.
(6) Neophytides, S. G.; Murase, K.; Zafeiratos, S.; Papakonstantinou, G.; Paloukis, F.
E.; Krstajic, N. V.; Jaksic, M. M. J. Phys. Chem. B 2006, 110, 3030.
(7) Shim, J.; Lee, C. R.; Lee, H. K.; Lee, J. S.; Cairns, E. J. J. Power Sources 2001,
102, 172.
(8) Xiong, L.; Manthiram, A. Electrochim. Acta 2004, 49, 4163.
(9) Wang, B. J. Power Sources 2005, 152, 1.
(10) Michaelides, A.; Hu, P. J. Am. Chem. Soc. 2001, 123, 4235.
(11) Hyman, M. P.; Medlin, J. W. J. Phys. Chem. B 2006, 110, 15338.
(12) Qi, L.; Yu, J. G.; Li, J. J. Chem. Phys. 2006, 125, 8.
(13) Zhang, T.; Anderson, A. B. Electrochim. Acta 2007, 53, 982.
(14) Jacob, T.; Goddard, W. A. ChemPhysChem 2006, 7, 992.
(15) Nilekar, A. U.; Mavrikakis, M. Surf. Sci. 2008, 602, L89.
(16) Janik, M. J.; Taylor, C. D.; Neurock, M. J. Electrochem. Soc. 2009, 156, B126.

144
(17) Norskov, J. K.; Rossmeisl, J.; Logadottir, A.; Lindqvist, L.; Kitchin, J. R.;
Bligaard, T.; Jonsson, H. J. Phys. Chem. B 2004, 108, 17886.
(18) Wang, Y.; Balbuena, P. J. Phys. Chem. B 2005, 109, 14896.
(19) Ogasawara, H.; Brena, B.; Nordlund, D.; Nyberg, M.; Pelmenschikov, A.;
Pettersson, L.; Nilsson, A. Phys. Rev. Lett. 2002, 89, 276102.
(20) Hamada, I.; Morikawa, Y. J. Phys. Chem. C 2008, 112, 10889.
(21) Xu, X.; Muller, R. P.; Goddard, W. A. Proc. Natl. Acad. Sci. U. S. A. 2002, 99,
3376.
(22) Keith, J. A.; Oxgaard, J.; Goddard, W. A. J. Am. Chem. Soc. 2006, 128, 3132.
(23) Tomasi, J.; Persico, M. Chem. Rev. 1994, 94, 2027.
(24) Cramer, C.; Truhlar, D. Chem. Rev. 1999, 99, 2161.
(25) Tannor, D. J.; Marten, B.; Murphy, R.; Friesner, R. A.; Sitkoff, D.; Nicholls, A.;
Ringnalda, M.; Goddard, W. A.; Honig, B. J. Am. Chem. Soc. 1994, 116, 11875.
(26) Rogstad, K. N.; Jang, Y. H.; Sowers, L. C.; Goddard, W. A. Chem. Res. Toxicol.
2003, 16, 1455.
(27) Jones, C. J.; Taube, D.; Ziatdinov, V. R.; Periana, R. A.; Nielsen, R. J.; Oxgaard,
J.; Goddard, W. A. Angew. Chem. Int. Edit. 2004, 43, 4626.
(28) Nielsen, R. J.; Goddard, W. A. J. Am. Chem. Soc. 2006, 128, 9651.
(29) Schultz, P. SeqQuest Code Project; Sandia National Laboratories,
(http://www.cs.sandia.gov/~paschul/Quest/).
(30) Perdew, J.; Burke, K.; Ernzerhof, M. Phys. Rev. Lett. 1996, 77, 3865.
(31) Ceperley, D. M.; Alder, B. J. Phys. Rev. Lett. 1980, 45, 566.
(32) Perdew, J. P.; Zunger, A. Phys. Rev. B. 1981, 23, 5048.

145
(33) Kohn, W.; Sham, L. J. Physical Review 1965, 140, A1133.
(34) Melius, C. F.; Goddard, W. A. Phys. Rev. A 1974, 10, 1528.
(35) Melius, C. F.; Olafson, B. D.; Goddard, W. A. Chem. Phys. Lett. 1974, 28, 457.
(36) Redondo, A.; Goddard, W. A.; Mcgill, T. C. Phys. Rev. B. 1977, 15, 5038.
(37) Hamann, D. R. Phys. Rev. B. 1989, 40, 2980.
(38) Baker, N.; Sept, D.; Joseph, S.; Holst, M.; McCammon, J. Proc. Natl. Acad. Sci.
U. S. A. 2001, 181342398.
(39) Holst, M.; Saied, F. J. Comb. Chem. 1993, 14.
(40) Holst, M.; Saied, F. J. Comb. Chem. 1995, 16, 337.
(41) Goddard, W. A.; Jaramillo-Botero, A.; Liu, Y.; Duin, A. v.; Buehler, M.;
Meulbroek, P.; Dodson, J. The Computational Materials Design Facility (CMDF)
Project; (http://www.wag.caltech.edu/multiscale/multsicale_computations.htm).
(42) Parker, D.; Bartram, M.; Koel, B. Surf. Sci. 1989, 217, 489.
(43) Nolan, P. D.; Lutz, B. R.; Tanaka, P. L.; Davis, J. E.; Mullins, C. B. Phys. Rev.
Lett. 1998, 81, 3179.
(44) Puglia, C.; Nilsson, A.; Hernnas, B.; Karis, O.; Bennich, P.; Martensson, N. Surf.
Sci. 1995, 342, 119.
(45) Gland, J. L.; Sexton, B. A.; Fisher, G. B. Surf. Sci. 1980, 95, 587.
(46) Eichler, A.; Hafner, J. Phys. Rev. Lett. 1997, 79, 4481.
(47) Li, T.; Balbuena, P. B. Chem. Phys. Lett. 2003, 367, 439.
(48) Michaelides, A.; Hu, P. J. Chem. Phys. 2001, 114, 513.
(49) Meng, S.; Xu, L. F.; Wang, E. G.; Gao, S. W. Phys. Rev. Lett. 2002, 89.

146
(50) Bădescu, C.; Salo, P.; Ala-Nissila, T.; Ying, S.; Jacobi, K.; Wang, Y.; Bedürftig,
K.; Ertl, G. Phys. Rev. Lett. 2002, 88, 136101.
(51) Parker, S. F.; Frost, C. D.; Telling, M.; Albers, P.; Lopez, M.; Seitz, K. Catal.
Today 2006, 114, 418.
(52) Graham, A. P.; Menzel, A.; Toennies, J. P. J. Chem. Phys. 1999, 111, 1676.
(53) Olsen, R.; Kroes, G.; Baerends, E. J. Chem. Phys. 1999, 111, 11155.
(54) Walch, S.; Dhanda, A.; Aryanpour, M.; Pitsch, H. J. Phys. Chem. C 2008, 112,
8464.
(55) Mills, G.; Jonsson, H.; Schenter, G. K. Surf. Sci. 1995, 324, 305.
(56) Mills, G.; Jonsson, H. Phys. Rev. Lett. 1994, 72, 1124.
(57) Karlberg, G. S.; Olsson, F. E.; Persson, M.; Wahnstrom, G. J. Chem. Phys. 2003,
119, 4865.
(58) Zimbitas, G.; Gallagher, M. E.; Darling, G. R.; Hodgson, A. J. Chem. Phys. 2008,
128, 12.
(59) Meng, S.; Wang, E. G.; Gao, S. W. Phys. Rev. B. 2004, 69.
(60) Rossmeisl, J.; Norskov, J. K.; Taylor, C. D.; Janik, M. J.; Neurock, M. J. Phys.
Chem. B 2006, 110, 21833.
(61) Skulason, E.; Karlberg, G. S.; Rossmeisl, J.; Bligaard, T.; Greeley, J.; Jonsson, H.;
Norskov, J. K. Phys. Chem. Chem. Phys. 2007, 9, 3241.
(62) Beard, B. C.; Ross, P. N. J. Electrochem. Soc. 1990, 137, 3368.
(63) Stamenkovic, V. R.; Fowler, B.; Mun, B. S.; Wang, G. F.; Ross, P. N.; Lucas, C.
A.; Markovic, N. M. Science 2007, 315, 493.

147
(64) Jang, S. S.; Molinero, V.; Cagin, T.; Goddard, W. A. J. Phys. Chem. B 2004, 108,
3149.
(65) Jang, S. S.; Molinero, V.; Cagin, T.; Goddard, W. A. Solid State Ionics 2004, 175,
805.
(66) Sha, Y.; Yu, T. H.; Liu, Y.; Merinov, B. V.; Goddard, W. A. J. Phys. Chem. Lett.
2010, 1, 856.
(67) Hyman, M. P.; Medlin, J. W. J. Phys. Chem. B 2005, 109, 6304.
(68) Ford, D. C.; Nilekar, A. U.; Xu, Y.; Mavrikakis, M. Surf. Sci. 2010, 604, 1565.
(69) Anderson, A. B.; Sidik, R. A.; Narayanasamy, J.; Shiller, P. J. Phys. Chem. B
2003, 107, 4618.
(70) Völkening, S.; Bedürftig, K.; Jacobi, K.; Wintterlin, J.; Ertl, G. Phys. Rev. Lett.
1999, 83, 2672.
(71) Sachs, C.; Hildebrand, M.; Volkening, S.; Wintterlin, J.; Ertl, G. J. Chem. Phys.
2002, 116, 5759.
(72) Wang, X. G.; Fisher, G. B. Phys. Rev. Lett. 2007, 99.
(73) Zhang, T.; Anderson, A. 2007.
(74) Rai, V.; Aryanpour, M.; Pitsch, H. J. Phys. Chem. C 2008, 112, 9760.
(75) Greeley, J.; Norskov, J. K. J. Phys. Chem. C 2009, 113, 4932.
(76) Cai, Y.; Anderson, A. J. Phys. Chem. B 2005, 109, 7557.
(77) Mejias, J. A.; Lago, S. J. Chem. Phys. 2000, 113, 7306.
(78) Thalinger, M.; Volmer, M. Z. Phys. Chem. a–Chem. T. 1930, 150, 401.
(79) Marcus, R. A.; Sutin, N. Biochim. Biophys. Acta 1985, 811, 265.
(80) Peremans, A.; Tadjeddine, A. J. Chem. Phys. 1995, 103, 7197.
148
(81) Cai, Y.; Anderson, A. B. J. Phys. Chem. B 2004, 108, 9829.
(82) Tawa, G. J.; Topol, I. A.; Burt, S. K.; Caldwell, R. A.; Rashin, A. A. J. Chem.
Phys. 1998, 109, 4852.
(83) Dang, L. X. J. Chem. Phys. 2003, 119, 6351.
(84) Sha, Y.; Yu, T. H.; Merinov, B. V.; Shirvanian, P.; Goddard, W. A. The Journal
of Physical Chemistry Letters 2011, 2, 572.
(85) Wasileski, S. A.; Janik, M. J. Phys. Chem. Chem. Phys. 2008, 10, 3613.
(86) Karlberg, G. S.; Jaramillo, T. F.; Skulason, E.; Rossmeisl, J.; Bligaard, T.;
Norskov, J. K. Phys. Rev. Lett. 2007, 99.
(87) Sha, Y.; Yu, T. H.; Merinov, B.; Goddard, W. A. In preparation. 2010
(88) Sha, Y.; Yu, T. H.; Merinov, B. H.; Goddard, W. A. In preparation. 2011
(89) Barton, D. G.; Podkolzin, S. G. J. Phys. Chem. B 2005, 109, 2262.
(90) Mavrikakis, M.; Stoltze, P.; Norskov, J. K. Catal. Lett. 2000, 64, 101.
(91) Saliba, N.; Parker, D. H.; Koel, B. E. Surf. Sci. 1998, 410, 270.
(92) Miller, J. T.; Kropf, A. J.; Zha, Y.; Regalbuto, J. R.; Delannoy, L.; Louis, C.; Bus,
E.; van Bokhoven, J. A. J. Catal. 2006, 240, 222.
(93) Barrio, L.; Liu, P.; Rodriguez, J. A.; Campos-Martin, J. M.; Fierro, J. L. G. J.
Phys. Chem. C 2007, 111, 19001.
(94) Michaelides, A. Appl. Phys. A. 2006, 85, 415.
(95) Huang, S. C.; Lin, C. H.; Wang, J. H. J. Phys. Chem. C 2010, 114, 9826.
(96) Xu, Y.; Mavrikakis, M. J. Chem. Phys. 2002, 116, 10846.
(97) Krekelberg, W. P.; Greeley, J.; Mavrikakis, M. J. Phys. Chem. B 2004, 108, 987.
(98) Sha, Y.; Yu, T. H.; Merinov, B. H.; Goddard, W. A. In preparation. 2011

149
(99) Sha, Y.; Yu, T. H.; Merinov, B. H.; Goddard, W. A. In preparation. 2011
(100) Stamenkovic, V.; Schmidt, T. J.; Ross, P. N.; Markovic, N. M. J. Phys. Chem. B
2002, 106, 11970.
(101) Stamenkovic, V. R.; Mun, B. S.; Arenz, M.; Mayrhofer, K. J. J.; Lucas, C. A.;
Wang, G. F.; Ross, P. N.; Markovic, N. M. Nat. Mater. 2007, 6, 241.
(102) Yang, H.; Vogel, W.; Lamy, C.; Alonso-Vante, N. J. Phys. Chem. B 2004, 108,
11024.
(103) Gauthier, Y.; Joly, Y.; Baudoing, R.; Rundgren, J. Phys. Rev. B. 1985, 31, 6216.
(104) Gauthier, Y. Surf. Rev. Lett. 1996, 3, 1663.
(105) Yu, T.; Sha, Y.; Merinov, B.; Goddard III, W. The Journal of Physical Chemistry
C 2010, 114, 11527.
(106) Loukrakpam, R.; Luo, J.; He, T.; Chen, Y.; Xu, Z.; Njoki, P. N.; Wanjala, B. N.;
Fang, B.; Mott, D.; Yin, J.; Klar, J.; Powell, B.; Zhong, C.-J. The Journal of
Physical Chemistry C 2011, 115, 1682.
(107) Wang, X. P.; Kariuki, N.; Vaughey, J. T.; Goodpaster, J.; Kumar, R.; Myers, D. J.
J. Electrochem. Soc. 2008, 155, B602.
(108) Takeda, S.; Kulik, J.; Defontaine, D. J. Phys. F. Met. Phys. 1988, 18, 1387.
(109) Yusenko, K. V.; Filatov, E. Y.; Vasilchenko, D. B.; Baidina, I. A.; Zadesenez, A.
V.; Shubin, Y. V. Zeitschrift Fur Kristallographie 2007, 289.
(110) Hammer, B.; Norskov, J. K. Surf. Sci. 1995, 343, 211.
(111) Yu, T.; Sha, Y.; Merinov, B.; Goddard, W. A. In preparation. 2011
(112) Otte, H. M. J. Appl. Phys. 1961, 32, 1536.

150
(113) Haglund, J.; Guillermet, A. F.; Grimvall, G.; Korling, M. Phys. Rev. B. 1993, 48,
11685.
(114) Guymont, M.; Gratias, D. Phys. Status Solidi A 1976, 36, 329.
(115) Villars, P.; Okamoto, H.; Cenzual, K.; Center, A. A. P. D. ASM International,
Materials Park, OH. 2006