The market Risk Premium and risk free rate after the recession · finance and valuation textbooks...
52
1 The market Risk Premium and risk free rate after the recession Valuation and common sense Pablo Fernandez Professor of Finance. IESE Business School. Madrid. Spain. PhD. Harvard University NiRV Amsterdam. April 18, 2018 http://webprofesores.iese.edu/PabloFernandez//
Transcript of The market Risk Premium and risk free rate after the recession · finance and valuation textbooks...

1
The market Risk Premium andrisk free rate after the recession
Valuation and common sense
Pablo Fernandez
Professor of Finance. IESE Business School. Madrid. Spain.
PhD. Harvard University
NiRV
Amsterdam. April 18, 2018
http://webprofesores.iese.edu/PabloFernandez//

2
MRP, ERP or EP (Equity Premium): 4 different concepts
• Historical equity premium (HEP): historical differential return of the stock market over treasuries.
• Expected equity premium (EEP): expected differential return of the stock market over treasuries.
• Required equity premium (REP): incremental return of a diversified portfolio (the market) over the risk-free rate required by an investor. It is used for calculating the required return to equity.
• Implied equity premium (IEP): the expected equity premium that arises from assuming a set of expectations and using the market price.
Some confusion arises from not distinguishing among the four concepts that the phrase equity premium designates

3
Four different concepts
• The HEP is easy to calculate and should be equal for all investors, provided they use the same time frame, the same market index, the same risk-free instrument and the same average (arithmetic or geometric).
• But the EEP, the REP and the IEP may be different for different investors and are not observable magnitudes.
• The Historical Equity Premium (HEP) is the historical average differential return of the market portfolio over the risk-free debt. The most widely cited sources are: Ibbotson Associates whose U.S. database starts in 1926; Dimson et al. (2007) that calculate the HEP for 17 countries over 106 years (1900-2005), and the Center for Research in Security Prices (CRSP) at the University of Chicago. 40 books use data from Ibbotson, 6 from Dimson et al., 3 from CRSP, 10 use their own data, and the rest do not mention which data they use.

Not a reasonable RF
QE (Quantitative Easing)?
4
When not reasonable prices exist, trade against them.
RF too low means Price of Gov. Bonds too High.
If you believe so, you should sell futures on Government Bonds.
When RF near zero, selling futures on Government Bonds is similar to
buy puts with zero cost.
Bigger risk/opportunity? BREXIT or DREXIT

5

6

7

8
The Equity Premium in 150 Textbooks
• I review 150 textbooks on corporate finance and valuation published between 1979 and 2009 (Brealey, Myers, Copeland, Damodaran, Merton, Ross, Bruner, Bodie, Penman, Arzac…).
• Their recommendations regarding the EP range from 3% to 10%. The 5-year moving average has declined from 8.4% in 1990 to 5.7% in 2008 and 2009.
• 51 books use different EP in various pages. • 129 books identify Expected and Required equity premium• 82 books identify Expected and Historical equity premium.
Damodaran (2001a, 2009) and Arzac (2005, 2007) assume that REP = IEP.
Penman (2001, 2003):“no one knows what the REP is.”
Fernandez (2002, 2004):“different investors have different REPs”.“There is not a premium for the market as a whole”

9
About the 150 books
• The recommendations regarding the equity premium of 150 finance and valuation textbooks published between 1979 and 2009 range from 3% to 10%.
• Different investors use different equity premia
• Several books use different equity premia in different pages.
• Most books do not distinguish among the four different concepts that the phrase equity premium designates: Historical equity premium, Expected equity premium, Required equity premium and Implied equity premium.
• There is not a generally accepted equity premium point estimate and that there is not either a common method to estimate it, even for the HEP.

10
Assumptions and recommendations of the 129 books that assume that REP = EEP

11
Required Equity Premium (REP) used or recommended in 150 finance and valuation textbooks

12
Discussion and conclusion
• Although some books mention that “the true Equity Risk Premium is an expectation”and also that "the goal is to estimate the true Equity Risk Premium as of the valuation date", I think that we cannot talk of a “true Equity Risk Premium”.
• Different investors have different REPs and different EEPs.
• A unique IEP requires assuming homogeneous expectations for the expected growth (g): there are several pairs (IEP, g) that satisfy current market prices.
• We could only talk of an EEP = REP = IEP if all investors had the same expectations. If they did, it would make sense to talk of a market risk premium and all investors would have the market portfolio.
• A reasonable REP may be constant for all maturities, while reasonable EEPs may be different for different maturities.
• EEPs may be negative for some maturities, while REPs should be always positive.

13
Different authors about the Equity Premium
1. Brealey and Myers. Until 1996, REP = EEP = arithmetic HEP over T-Bills according to Ibbotson: 8.3% in 1984 and 8.4% in 1988, 1991 and 1996. In 2000 & 2003:“Brealey and Myers have no official position on the exact market risk premium, but we believe a range of 6 to 8.5% is reasonable for the US.” In 2005, they increased that range to “5 to 8%.”
2. Copeland et al. (1990 and 95, McKinsey book on valuation).REP = geometric HEP vs. Gov T-Bonds= 6% and 5.5% respectively. In 2000 and 2005 changed criteria: arithmetic[1] HEP of 2-year returns versus Government T-Bonds reduced by a survivorship bias. In 2000 they recommended 4.5-5% and in 2005 they used a REP of 4.8% because “we believe that the market risk premium as of year-end 2003 was just under 5%.”
3. Damodaran. 1994, 96, 97, 2001b, 2001c and 2002 REP = EEP = geom HEP vs T-bonds = 5.5%.[2] In 2001a and 2006, REP = IEP = 4%. In 1994 and in 1997 he calculated the cost of equity of PepsiCo using, respectively, REPs of 6.41% (geomHEP 1926-90 using T-Bills) and 8.41% (arith HEP 1926-90 using T-Bills). Damodaran (2005) used different REPs: 4%, 4.82%, 5.5% and 6%.
[1] Although in the 2nd edition they stated (page 268) “we use a geometric average of rates of return because arithmetic averages are biased by the measurement period.”
[2] Damodaran (2001c, page 192): “we must confess that this is more for the sake of continuity with the previous version of the book and for purposes of saving a significant amount of reworking practice problems and solutions.”
14
Different authors about the Equity Premium (2)
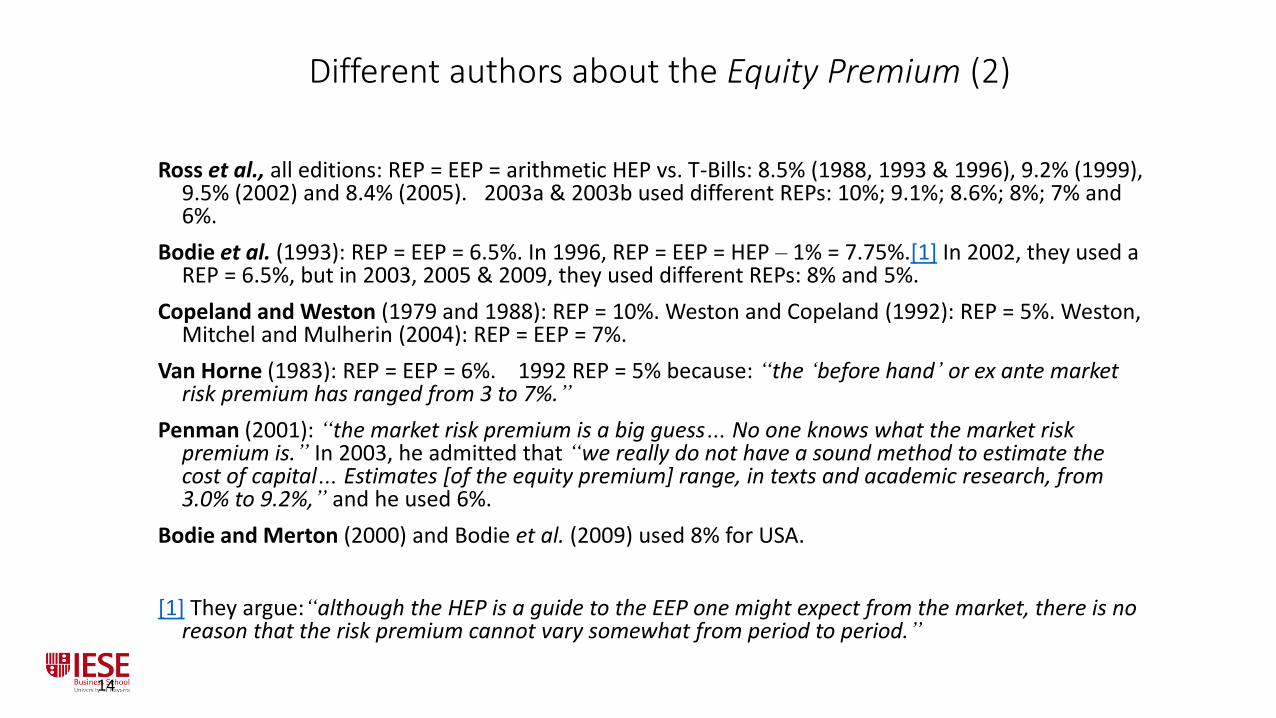
Ross et al., all editions: REP = EEP = arithmetic HEP vs. T-Bills: 8.5% (1988, 1993 & 1996), 9.2% (1999), 9.5% (2002) and 8.4% (2005). 2003a & 2003b used different REPs: 10%; 9.1%; 8.6%; 8%; 7% and 6%.
Bodie et al. (1993): REP = EEP = 6.5%. In 1996, REP = EEP = HEP – 1% = 7.75%.[1] In 2002, they used a REP = 6.5%, but in 2003, 2005 & 2009, they used different REPs: 8% and 5%.
Copeland and Weston (1979 and 1988): REP = 10%. Weston and Copeland (1992): REP = 5%. Weston, Mitchel and Mulherin (2004): REP = EEP = 7%.
Van Horne (1983): REP = EEP = 6%. 1992 REP = 5% because: “the ‘before hand’ or ex ante market risk premium has ranged from 3 to 7%.”
Penman (2001): “the market risk premium is a big guess… No one knows what the market risk premium is.” In 2003, he admitted that “we really do not have a sound method to estimate the cost of capital… Estimates [of the equity premium] range, in texts and academic research, from 3.0% to 9.2%,” and he used 6%.
Bodie and Merton (2000) and Bodie et al. (2009) used 8% for USA.
[1] They argue:“although the HEP is a guide to the EEP one might expect from the market, there is no reason that the risk premium cannot vary somewhat from period to period.”

15
Different authors about the Equity Premium (3)
• HBS teaching notes. Until 1989 most teaching notes used REPs 8 - 9%.[1] In 1989, the teaching note for the case Simmons Japan Limited admitted that the equity premium was in the 6-9% range and the teaching note for the 2000 case Airbus A3XX used 6%. On the contrary, the REPs used in the teaching notes published by the Darden Business School have increased slightly over time. The teaching notes in Bruner (1999) use REPs in the 5.4-5.6%range, whereas the teaching note of the 2002 case The Timken Company uses 6%.
• It is easy to conclude that there is not a generally accepted equity premium point estimate and that there is not either a common method to estimate it: the recommendations regarding the equity premium of the textbooks range from 3% to 10% and some books use different equity premia in different pages.
[1] For example, TN of Levitz Furniture Corp. (9%, 1986), Richardson Vicks (8.8%, 1985), Gulf Oil Corporation (8.8%, 1984). Goodyear Restructuring (8.8%, 1986), Owens Corning Fiberglas (8.5%, 1986), Atlantic Corporation (8.5%, 1984) and RJR Nabisco (8%, 1988). Gilson (2000) uses 7.5% and mentions that “the market risk premium has historically been about 7.5%, on average, although academic estimates of the ex ante premium range from 0.5% to 12%.”

16
Different books about the Equity Premium

17
Different books about the Equity Premium (1)

18
Different books about the Equity Premium (2)

19
Different books about the Equity Premium (3)

20
Schizophrenic2 approach to valuation
• Valuation is about expected cash flows and about requiredreturn.
• We all admit that different investors may have different expected cash flows, but many of us affirm that the required return (discount rate) should be equal for everybody.
• That is the schizophrenic2 approach: to be a democrat for the expected cash flows but a dictator for the discount rate + to look at the future for expected cash flows but to the past for the required return

21
CAPM: an absurd model http://ssrn.com/abstract=2505597
CAPM: the model and 305 comments about ithttp://ssrn.com/abstract=2523870

CAPM: an absurd model
• CAPM is about expected return. If you find a formula for expected returns that works well in the real markets, would you publish it? Before or after becoming a billionaire?
• The CAPM is an absurd model because its assumptions and its predictions/conclusions have no basis in the real world.
Absurd means 1. ridiculously unreasonable, unsound, or incongruous. 2: having no rational or orderly relationship to human life. Meaningless. utterly or obviously senseless, illogical, or untrue; contrary to all reason or common sense; laughably foolish or false.
Source: http://www.merriam-webster.com/dictionary/absurd
22

CAPM: assumptions and predictions
23
Main assumptions of the CAPM. ALL investors:
a. have homogeneous expectations: same expected (return, volatility and correlations for
every security). Representative investor.
b. investors only care about the expected return and the volatility of their investments.
c. risk = volatility of returns!!!!!!!!
d. equal investment horizon
Main predictions of the CAPM. ALL investors:
a. will always combine a risk free asset with the market portfolio (the same portfolio of risky
assets),
b. agree on the expected MRP and on the beta of every asset (expect returns from their
investments according to the betas). As all agree: expected = required MRP
c. No undervaluation nor overvaluation
With homogeneous expectations, constant utility functions and without disagreement
about the value of any security: trading volume of financial markets would be very small.

24
Consequences of using the CAPM (1)
Calculation of the beta of electrical companies according to a
European Electricity Regulatory Commission. “We calculate the betas of all traded European companies. Levered betas were calculated
using 2 years of weekly data. The Market Index chosen was the Dow Jones STOXX Total
Market Index.
“There is a great dispersion (from -0.24 to 1.16) and some odd betas (negative and
higher than one). We decided to maintain all betas… The average is 0,47

25
… We unlever the betas, calculate the average of the unlevered betas and relever it using
the average debt to equity ratio of comparable companies.
Consequences of using the CAPM (2)
The levered beta proposed by the Commission for the transport
activity is 0.471870073”.
a precision of 9 figures after the decimal point!!!!

26
An anecdote from Merton Miller about the
expected market return
• An anecdote from Merton Miller (2000, page 3) about the expected market
return in the Nobel context: “I still remember the teasing we financial
economists, Harry Markowitz, William Sharpe, and I, had to put up with from the
physicists and chemists in Stockholm when we conceded that the basic unit of
our research, the expected rate of return, was not actually observable. I tried to
tease back by reminding them of their neutrino –a particle with no mass whose
presence was inferred only as a missing residual from the interactions of other
particles. But that was eight years ago. In the meantime, the neutrino has been
detected.”
• Brealey et al. (2005, page 154): “Out of this debate only one firm conclusion
emerges: Do not trust anyone who claims to know what returns investors
expect”.
In order for all investors to share a common EEP, it is necessary to assume homogeneous expectations
(or a representative investor) and, with our knowledge of financial markets, this assumption is not a
reasonable one. With homogeneous expectations it is also difficult to explain why the annual trading
volume of most exchanges is more than twice their market capitalization.
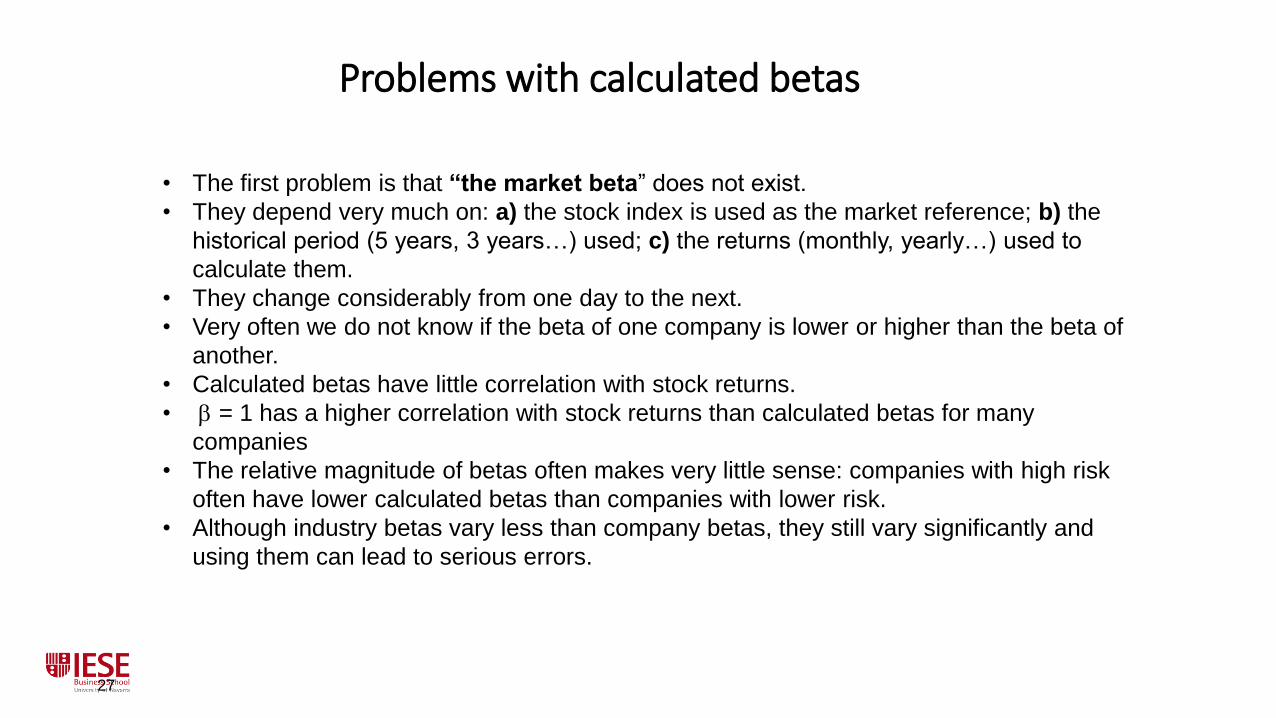
Problems with calculated betas
27
• The first problem is that “the market beta” does not exist.
• They depend very much on: a) the stock index is used as the market reference; b) the
historical period (5 years, 3 years…) used; c) the returns (monthly, yearly…) used to
calculate them.
• They change considerably from one day to the next.
• Very often we do not know if the beta of one company is lower or higher than the beta of
another.
• Calculated betas have little correlation with stock returns.
• b = 1 has a higher correlation with stock returns than calculated betas for many
companies
• The relative magnitude of betas often makes very little sense: companies with high risk
often have lower calculated betas than companies with lower risk.
• Although industry betas vary less than company betas, they still vary significantly and
using them can lead to serious errors.

2
8
Historical betas change dramatically from one day to the nextBetas calculated during the two-month period of December 2001 and January 2002 with respect
to the S&P 500. Each day, betas are calculated using 5 years of monthly data, i.e. on December
18, 2001, the beta is calculated by running a regression of the 60 monthly returns of the
company on the 60 monthly returns of the S&P 500

Which is the right “Market Beta”?http://ssrn.com/abstract=2509849
29
147 calculated betas of March 31st, 2014: Great dispersion
Summary of the 147 betas / company for 1,385 US CompaniesBeta MAX-Beta min Beta average St.Dev of 147 betas / company
Average 1,17 1,18 0,24Median 1,03 1,15 0,21

Betas of 3 companies according to the most used webs and databases. May 12, 2009
30
WEB / Database COCA-COLA WALT DISNEY WAL MART STORESBloomberg 0.79 1.06 0.58
Cnbc 0.60 1.00 0.30
Damodaran 0.61 0.88 0.19
Datastream 0.31 0.72 0.13
Ft.Com 0.80 1.06 0.57
Google Finance 0.60 1.03 0.26
Hoovers 0.60 1.00 0.20
Infomercados 0.33 1.39 0.31
Msn Moneycentral 0.54 1.03 0.16
Quote 0.54 1.13 0.19
Reuters 0.53 1.01 0.17
Smartmoney 0.61 1.03 0.26
Thomson Banker 0.55 1.09 0.38
Value Line 0.55 1.00 0.60
Vernimmen Website - 1.08 0.71
Yahoo Finance 0.63 0.99 0.28
Max 0.80 1.39 0.71min 0.31 0.72 0.13

31
Reasons for using calculated betas(according to a survey)
• “has received a Nobel Prize in Economics”
• “while not perfect, it is used extensively in practice”
• “If one does not use beta then what is there?”
• “No substitution so far. There are no better alternatives”
• “We need another model to substitute CAPM and betas and 3-factor models”
• “Calculated betas are on the CFA exam”
• “Almost every practitioner book uses betas such as the McKinsey publications”
• “Beta allows you to defend a valuation, impress management and come across as a finance guru"
• “Beta is simple and it is used in the real world"
• “In consulting, it is essential to fully support your estimates”
• “Referees want to see them as the underlying model”
• “Fortune 500 firms use the CAPM to estimate their cost of equity”
• “Regulatory practice often requires it”
• “That point estimate gives the impression of truth”

Main results of the survey about betas
32
USA Europe Asia TOTALNumber of answers 1,340 748 170 2,510Different countries 1 26 20 65Do not use betas, but use Required Return to equity 87 43 5 151Use Betas 995 478 138 1,791Do not justify the betas 62 26 11 107
Justify the betas with:Regressions 669 344 104 1,253Webs and Databases 461 167 42 761Textbooks or papers 298 153 36 555Cases 12 4 0 16Common sense, judgement… 12 12 0 26Other 18 74 28 139Regressions, Webs, Databases, Textbooks or Papers 922 426 123 1,639
Use ONLY Common sense, judgement… 6 8 0 15
Do not use betas because:Teach accounting or economics 79 68 13 183Teach basic finance 47 27 3 85CAPM is useless 46 29 4 86Do not provide a reason for it 86 103 7 214
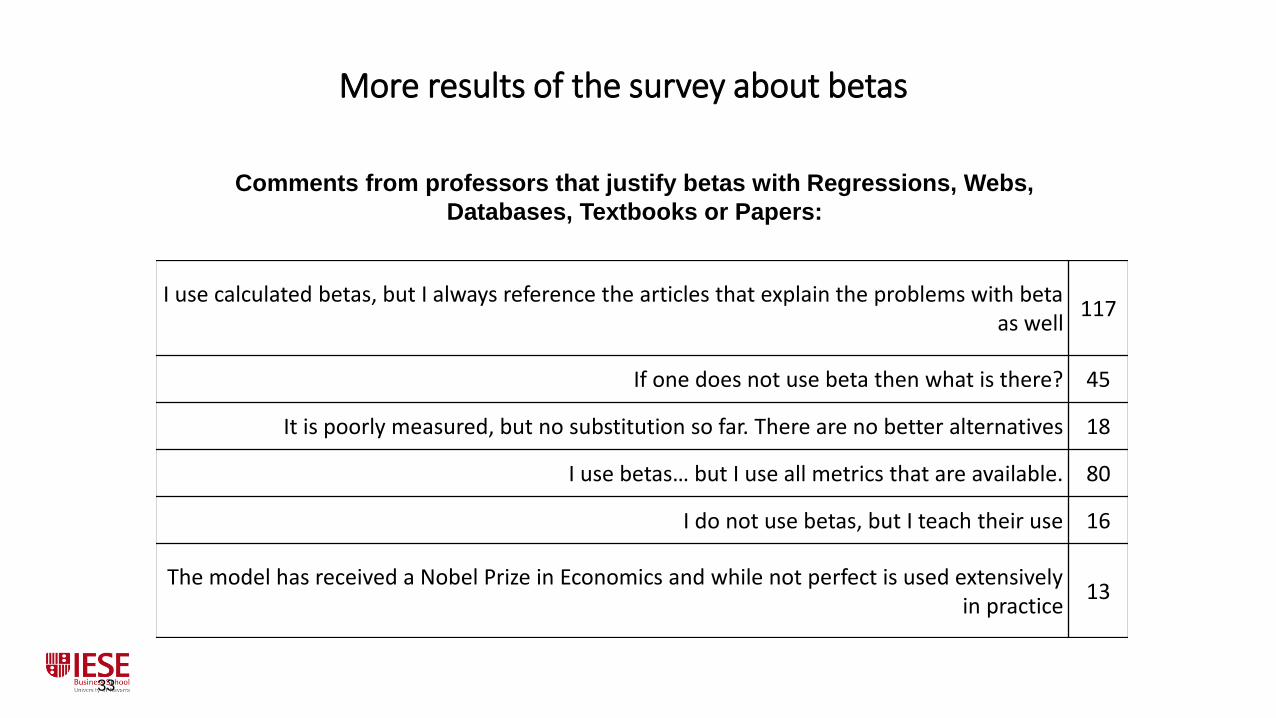
More results of the survey about betas
33
I use calculated betas, but I always reference the articles that explain the problems with beta as well
117
If one does not use beta then what is there? 45
It is poorly measured, but no substitution so far. There are no better alternatives 18
I use betas… but I use all metrics that are available. 80
I do not use betas, but I teach their use 16
The model has received a Nobel Prize in Economics and while not perfect is used extensively in practice
13
Comments from professors that justify betas with Regressions, Webs,
Databases, Textbooks or Papers:

34
Mail sent on May and June 2013
… Market Risk Premium (MRP or Equity Premium) and Risk Free Rate that companies, analysts and professors use to calculate the required return on equity in different countries. 2 questions:
1. The Market Risk Premium that I am using in 2013
• for USA is: _______ %
• for___________ is: _______ %
2. The Risk Free Rate that I am using in 2013
• for USA is: _______ %
• for ___________ is: _______ %

35
Common sense and reality
• A common request: ‘Give me a rule of thumb I can follow without thinking’
• Learning means being able to keep perceiving reality as it truly is: complex - and not trying to fit every new experience into a closed and pre-conceived notion or overall scheme (model).
Yepes Stork, Ricardo. Professor of Philosophy.University of Navarra
• Experience doesn´t consist of the number of things one has seen, but of the number of things on which one has reflected.
Pereda, José María. Writer. Santander. Spain
• Common sense (Merriam-Webster): "sound and prudent judgment based on a simple perception of the situation or facts."

36
Mail sent on May and June 2013
… Market Risk Premium (MRP or Equity Premium) and Risk Free Rate that companies, analysts and professors use to calculate the required return on equity in different countries. 2 questions:
1. The Market Risk Premium that I am using in 2013
• for USA is: _______ %
• for___________ is: _______ %
2. The Risk Free Rate that I am using in 2013
• for USA is: _______ %
• for ___________ is: _______ %
37
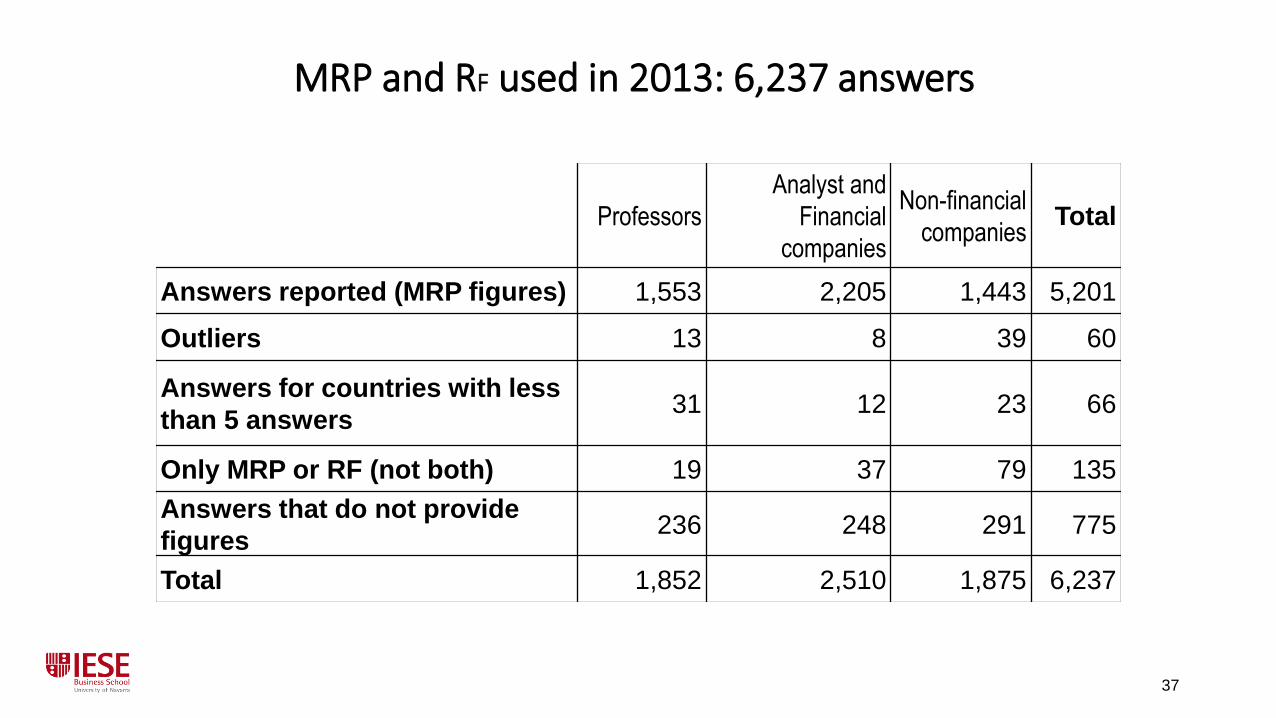
MRP and RF used in 2013: 6,237 answers
Professors
Analyst and
Financial
companies
Non-financial
companiesTotal
Answers reported (MRP figures) 1,553 2,205 1,443 5,201
Outliers 13 8 39 60
Answers for countries with less
than 5 answers31 12 23 66
Only MRP or RF (not both) 19 37 79 135
Answers that do not provide
figures236 248 291 775
Total 1,852 2,510 1,875 6,237

38
Answers that do not provide a figure
Use a minimum IRR 43Use multiples 132
We use only WACC 18"MRP is a concept that we do not use" 115
Use a Required Return to Equity 49“Confidential. We don't disclose the assumptions” 30
"The CAPM is not very useful" 61"I think about premia for particular stocks" 34
“I teach derivatives: I did not have to use a MRP” 53"I use whatever MRP is specified in the textbook" 27
“The MRP changes every day”, or “monthly” 48"I am an academic, not a practitioner" 3
Other reasons 162

39
Market Risk Premium used in 2013
Number of
answersaverage St. Dev. max min Av-Median
USA 2394 5,7% 1,6% 15,8% 2,5% 0,2%
Spain 804 6,0% 1,7% 15,0% 3,0% 0,5%
Germany 343 5,5% 1,7% 18,0% 1,6% 0,5%
UK 247 5,5% 1,4% 11,0% 2,0% 0,5%
Italy 205 5,7% 1,5% 12,0% 3,0% 0,2%
France 134 6,1% 1,6% 12,0% 3,0% 0,1%
Switzerland 113 5,6% 1,5% 12,0% 3,0% 0,1%
Brazil 112 6,5% 2,1% 12,0% 1,6% 0,5%
Canada 110 5,4% 1,3% 12,0% 3,0% 0,1%

40
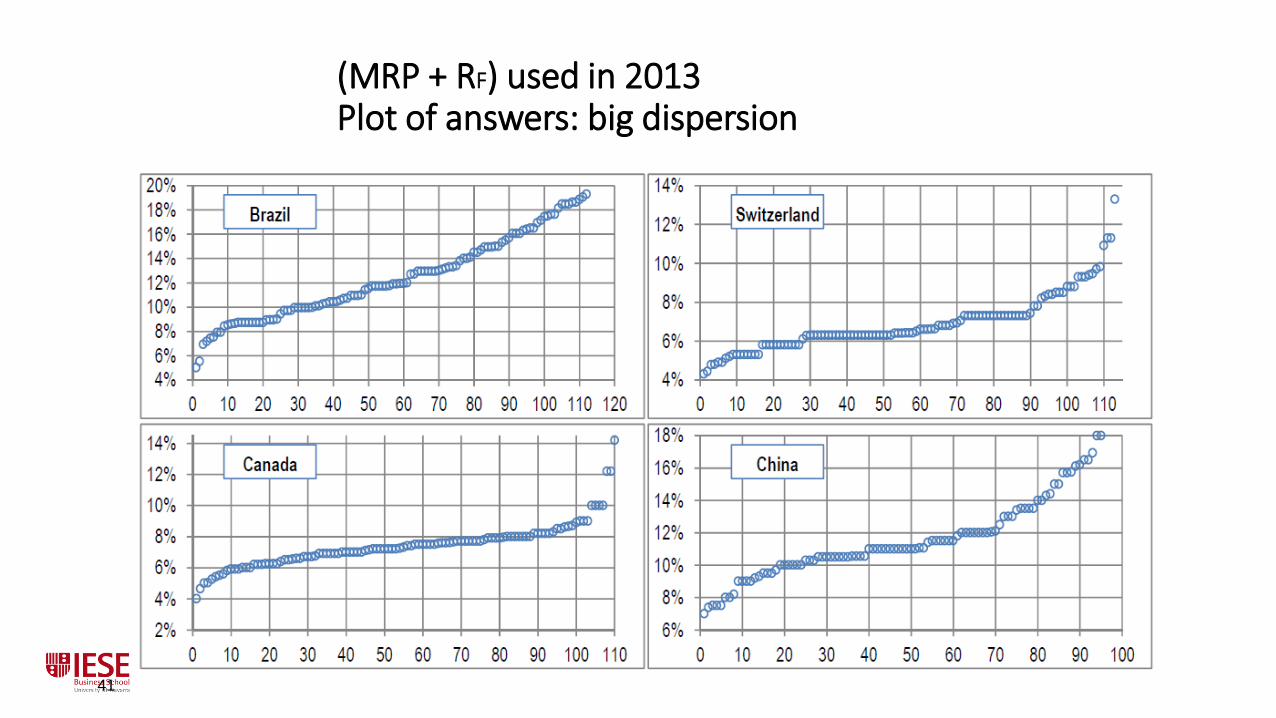
(MRP + RF) used in 2013Plot of answers: big dispersion
41
(MRP + RF) used in 2013Plot of answers: big dispersion

42
References used to justify the Market Risk Premium (2011)
References Prof Anal Comp Total
Ibbotson / Morningstar 53 31 172 256
Damodaran 72 34 114 220
Internal (own) estimate 15 84 67 166
Analysts / Inv. Banks 16 25 80 121
Experience, subjective,
own judgement 57 23 28 108
Bloomberg 7 44 47 98
Historic data 45 15 33 93
Fernandez 26 6 31 63
Duff&Phelps 2 0 34 36
Surveys, conversations,… 12 3 18 33
Dimson, M & S 13 3 15 31
Grabowski / Pratt's and
Grabowski 1 5 24 30
References Prof Anal Comp Total
Brealy & Myers 14 4 8 26
Mckinsey, Copeland 5 4 15 24
Internet 2 2 16 20
CFA books 2 9 6 17
Reuters 0 6 10 16
Ross/Westerfield 13 0 1 14
Fama and French 10 0 3 13
Siegel 5 0 5 10
Others* 142 47 135 324
CDS, Internet, Reuters, Siegel, Bodie, Kane,
Marcus, Implied MRP, Economic Press,
Datastream, Malkiel, Sharpe, Brigham, Consensus,
IMF, RWJ, Shapiro, Kaplan, Shiller, Welch

43
MRP and RF used in 2013: 6,237 answers
Professors
Analyst and
Financial
companies
Non-financial
companiesTotal
Answers reported (MRP figures) 1,553 2,205 1,443 5,201
Outliers 13 8 39 60
Answers for countries with less
than 5 answers31 12 23 66
Only MRP or RF (not both) 19 37 79 135
Answers that do not provide
figures236 248 291 775
Total 1,852 2,510 1,875 6,237

44
Answers that do not provide a figure
Use a minimum IRR 43Use multiples 132
We use only WACC 18"MRP is a concept that we do not use" 115
Use a Required Return to Equity 49“Confidential. We don't disclose the assumptions” 30
"The CAPM is not very useful" 61"I think about premia for particular stocks" 34
“I teach derivatives: I did not have to use a MRP” 53"I use whatever MRP is specified in the textbook" 27
“The MRP changes every day”, or “monthly” 48"I am an academic, not a practitioner" 3
Other reasons 162

45
RF used in 2013
Number of
answersaverage St. Dev. max min Av-Median
USA 2394 2,4% 1,0% 6,0% 0,1% 0,2%
Spain 804 4,4% 0,9% 6,0% 0,5% -0,2%
Germany 343 1,9% 0,6% 6,5% 0,1% -0,1%
UK 247 2,4% 1,0% 7,0% 0,2% 0,3%
Italy 205 4,4% 0,6% 8,0% 1,5% -0,1%
France 134 2,0% 1,0% 5,0% 0,1% 0,0%
Switzerland 113 1,3% 0,3% 3,0% 0,6% 0,0%
Brazil 112 5,9% 2,4% 10,1% 3,0% 1,0%
Canada 110 2,0% 0,5% 5,0% 1,0% 0,0%

46
Discussion and conclusion
• The recommendations regarding the equity premium of 150 finance and valuation textbooks published between 1979 and 2009 range from 3% to 10%.
• Different investors use different equity premia
• Several books use different equity premia in different pages.
• Most books do not distinguish among the four different concepts that the phrase equity premium designates: Historical equity premium, Expected equity premium, Required equity premium and Implied equity premium.
• There is not a generally accepted equity premium point estimate and that there is not either a common method to estimate it, even for the HEP.

47
Discussion and conclusion (2)
• Although some books mention that “the true Equity Risk Premium is an expectation”and also that "the goal is to estimate the true Equity Risk Premium as of the valuation date", I think that we cannot talk of a “true Equity Risk Premium”.
• Different investors have different REPs and different EEPs.
• A unique IEP requires assuming homogeneous expectations for the expected growth (g), but there are several pairs (IEP, g) that satisfy current market prices.
• We could only talk of an EEP = REP = IEP if all investors had the same expectations. If they did, it would make sense to talk of a market risk premium and all investors would have the market portfolio.
• A reasonable REP may be constant for all maturities, while reasonable EEPs may be different for different maturities.
• EEPs may be negative for some maturities, while REPs should be always positive.

48
Discussion and conclusion (3)
• Which equity premium do I use to value companies and investment projects? In most of the valuations that I have done in the 21st century I have used REPs between 3.8 and 4.8% for Europe and for the U.S. Given the yields of the T-Bonds, I (and most of my students and clients) think that an additional 4% compensates the additional risk of a diversified portfolio.
• Finance textbooks should clarify the equity premium by incorporating distinguishing definitions of the four different concepts and conveying a clearer message about their sensible magnitudes. It is necessary to distinguish among the different concepts and to specify to which equity premium we are referring to.

More errors due to the CAPM
49
“119 common errors in company valuations” http://ssrn.com/abstract=1025424
contains a collection of errors seen in company valuations performed by
analysts, investment banks, consultants and expert witnesses. Some of the
errors are wrong betas and wrong market risk premia.
The most common error consists in using the historical industry beta, or the
average of the betas of similar companies, when this magnitude does not make
sense.
Users of the CAPM have made many errors valuing companies,
accepting/rejecting investment projects, evaluating fund performance, pricing
goods and services in regulated markets, calculating value creation…

The Market Portfolio is NOT efficient:Evidences, consequences and easy to avoid errors
50
•We document evidences about seven ‘Equal weighted indexes’ that have had
higher returns than the corresponding ‘market-value weighted index’: S&P500,
MSCI Emerging Markets, FTSE 100, MSCI World. MSCI, DAX 30 and IBEX 35.
•However, many finance and investment books still recommend “to diversify in
the same relative proportions as in a broad market index such as the Standard
& Poor’s 500”, many funds compare their performance with the return of market-
value weighted indexes…
•This error and all other errors covered in this document come from “believing”
in the CAPM and in the efficient market hypothesis. As there are not
homogeneous expectations, the market portfolio cannot be an efficient portfolio
for all investors.

MSCI Emerging Markets Equal Weighted Indexhttps://www.msci.com/resources/factsheets/index_fact_sheet/msci-em-equal-weighted-index.pdfAt each quarterly rebalance date, all index constituents are weighted equally. 837 constituents
51

MSCI WORLD Equal Weighted Index (USD)Source: https://www.msci.com/documents/10199/f7972c87-76f7-425b-9942-4e89292552101653 constituents. large and mid cap securities from 23 Developed Markets countries
52


![RJR,NABISCO ANDTH E:'ENWRONMENT - DeSmogBlog · RJR,NABISCO THE RJR NABISCO THIRD ANNUAL ENVIRONMENTAL CONFERENCE Health, Safety and Environmentai Management and R]R Nabisco's Future](https://static.fdocuments.us/doc/165x107/5e7fccea05e8a567bd401713/rjrnabisco-andth-eenwronment-desmogblog-rjrnabisco-the-rjr-nabisco-third-annual.jpg)