THE MADHYA PRADESH HUMAN DEVELOPMENT REPORT...
488
THE MADHYA PRADESH HUMAN DEVELOPMENT REPORT 2002 USING THE POWER OF DEMOCRACY FOR DEVELOPMENT
Transcript of THE MADHYA PRADESH HUMAN DEVELOPMENT REPORT...

THE MADHYA PRADESH HUMAN DEVELOPMENT REPORT
2002
USING THE POWER OF DEMOCRACY
FOR DEVELOPMENT
i

“The service of India ..... means the ending of poverty and ignorance and diseaseand inequality of opportunity”
Jawaharlal Nehru defining the challenge of a newly independent India, 1947
They are only exhausted Who think they areThey are only exhausted who no longerHave a reason to striveAnd dream and hope
Those who are exhausted have lostThe greater picture,The greater perspective.They are trapped in their own labyrinth,Their lovelessness, selfishness,I hear them talk about the end Of history.But for those of us who haven’t yet tastedThe best fruits of time yet,To whom history has been harsh,We think differently.We know that history is all there to be made in the future.
There is no exhaustion where there is muchTo be hoped for, much to work towards,And where the dreams and sufferingsOf our ancestorsHave not been realised,Or redeemed.
But when you can no longer dreamNo longer see possibilitiesNo longer see alternatives;When you see only limitationOnly despair, and negation,Then you are in the wayYou are also the problemThe exhausted obstructThe creation of a greater future.
The exhausted should therefore clearThe stage for new dreamers-For warriors of love, justiceAnd enlightenment
Is time exhausted?No, time is yet young,And has timeless millennia ahead,Way beyond our furthest dreams
Is nature exhausted? Ask the oak-trees, the hollies,The flowers, birds, fishes, and lions.They will continue for as longAs the earth allows them.
Is humanity exhausted?Individuals are, nations are,Some civilisations are becoming so;But humanity isn’t.
The hungry nations are hungry still.The starving people dream of food.The unfree fight for freedomThe oppressed plan for liberation.The small scheme for might.The invisible prepare for higher visibility.
ii
BEN OKRI
Mental Fight: An anti-spell for the twenty-first century

This is the Third Human Development Report
of Madhya Pradesh. While introducing the
two earlier reports we have mentioned the
reasons that prompted us to prepare Human
Development Reports. The first Report in 1995 was,
like we mentioned, a report on our failures, on what
remained to be done. In that sense it benchmarked
our status on human development indicators and
shared concern and urgency. Looking back, the Report
served its purpose. It served to mobilise public
opinion towards the new agenda we had adopted of
according the highest priority to human development
goals, working on some of them as Missions and
working on them through a model of collective action
made possible by Panchayat Raj.
Our second Report in 1998 acknowledged that
governments do not have the luxury of merely
documenting status in human development but
instead are voted to office to make change in the
human development situation. It could not be a
passive record of statistics and comparative profiling.
Therefore we reported on our efforts or the road
covered and focussed as much on agency as on tasks.
Both Reports had one limitation in that often we
were forced to rely on statistics of Census 1991, which
by the time of the second Report of 1998 was indeed
outdated. This Third Report has the advantage that at
least some of the results of Census 2001 have been
made public. This in fact prompted us to postpone our
Report to 2002 instead of 2001 which ought to have
been our deadline to keep to our three-year frequency.
It must be stated here that while the preparation
of Human Development Report was certainly inspired
by the pioneering work of UNDP under the leadership
of late Mahbub-ul-Haq, our Reports have been home
grown efforts, undertaken entirely on our own voli-
tion and with our own funds, people and limitations.
We have felt that this ownership is important so that
the Reports lead to action.
I must acknowledge here Dr. Manmohan Singh
who encouraged us to continue on this path when we
broke new ground with the first sub-national Human
Development Report which he released in 1995. Our
first Report led to UNDP organising a national
seminar at Bhopal coordinated by Professor Richard
Jolly to persuade other state governments to prepare
similar reports. We take some pride in the fact that the
idea did indeed spread and several state governments
have since produced similar state-level Human
Development Reports. The Government of India has
also produced a national HDR in 2001.
Professor Amartya Sen whose writing has been an
inspiration for our work released our Second Human
Development Report. We had made a commitment to
him on that occasion that by the time our third Report
is due, we would have universalised access to elemen-
tary education. We are happy to report that we univer-
salised access to primary education in 1998 and have
almost universalised access to elementary education.
To ensure quality, we have become the first state in
India to enact a People’s Education Act which seeks
to create a legal safeguard for quality. Quality for
elementary education would no more remain an issue
that agitates only the academic but a user issue that
Foreword
iii

involves learners, parents, local bodies, elected
representatives at several levels, state legislature,
teachers and academic institutions. We have legally
ensured the preparation and publication of Public
Education Reports and their submission to the State
legislature each year.
We are aware that in the area of health we need to
strengthen our efforts. We feel that here too the answer
too lies in decentralisation to the district and below
district levels for management. We must also build
health action from below by mobilising the local
community. Management of health institutions must
be brought under community control. We have made
some significant beginnings in the area of decentralisa-
tion through our Mission for Community Health and
for management of hospitals through Rogi Kalyan
Samitis.
Livelihood security for the poor is our most
important challenge. We have been trying to address
this issue through a variety of programmes for
creating entitlements and enhancing opportunities.
We feel that resources under programmes of the
Government of India especially in the areas of
anti-poverty programmes and food subsidies must be
better targeted to vulnerable areas and vulnerable
sections of our people. Macro economic policy must
focus on employment creation as a clear objective in
itself.
This Third Human Development Report registers
the progress we have made on the human development
agenda. Here again we report on action and how we
have sought to use the power of democracy for devel-
opment. We also present some of the constraints faced
by the states like Madhya Pradesh in realising a human
development vision in the current macro-economic
context. Human development goals cannot be pursued
in isolation of these larger factors which sub-national
governments are today unable to influence.
In this Report we also present the need to develop
indicators of measurement that are relevant to our
context. To the professionals guiding the development
of HDI and related indices, we would like to suggest
that disparities in India have not merely a class or
gender dimension but also a caste/ tribe dimension. It
is time we develop in India, like the UNDP did the
Gender Development Index in 1995, a Scheduled
Tribe- Scheduled Caste Development Index to capture
the inequality in opportunities to human develop-
ment faced by the people belonging to the scheduled
castes and scheduled tribes in India.
A Human Development Report produced in India
cannot be indifferent to the stratification on the basis
of caste and the glass ceilings that exist even with our
commitment to equality before law and programmes
for affirmative action. Similarly the growing alienation
of tribal communities on account of the statisation of
their resource base of forests and minerals has a
negative impact on reducing human poverty of these
groups. This can be resolved through imaginative
policies at the national level that combine the
objectives of natural resources conservation and
development. Policies that build on such arguments
can be initiated or reinforced through the creation of
a Scheduled Tribe — Scheduled Caste Development
Index. This will be the effort in our next Report.
Digvijay Singh
Chief Minister, Madhya Pradesh
1 November 2002
F O R E W O R D
iv

v
Mandla
Dindori
Umaria
Betul
Shahdol
Balaghat
SeoniChhindwara
Narsimhapur
Jabalpur
Katni
Sidhi
RewaSatnaPanna
Damoh
TikamgarhChhatarpur
Sagar
Raisen
Vidisha
BhindMorena
Gwalior
DatiaSheopur
Shivpuri
Guna
Rajgarh
Bhopal
Nimach
Mandsaur
RatlamUjjain
Shajapur
JhabuaDhar
IndoreDewas
Sehore
Barwani KhargaonKhandwa
Hoshangabad
Harda
Madhya Pradesh

vi
The Madhya Pradesh Human Development report hasbeen prepared by a team comprising of Shri Dilip RajSingh Chaudhary, and Shri R. Gopalakrishnan from the
Government of Madhya Pradesh, and personnel of ‘Sanket’, anindependent multi-disciplinary research group based in NewDelhi, Raipur and Bhopal. The ‘Sanket’ Project Team consisted of Sandeep Dikshit, Puja Gour, MadhuraChaphekar, Manish Shankar, Sanjay Shrivastava, and SwetaVerma assisted by Maheen Mirza, Monika Banerjie andDinesh Sinha. Management assistance to the project was givenby Shri Sultan Ahmad of the Directorate of InstitutionalFinance.
The third Madhya Pradesh Human Development Reporthas benefited from many individuals and institutions.
Members of the Empowered Committee of the StateGovernment, chaired by the Chief Secretary Shri A V Singhencouraged academic freedom for the report.
Special mention needs to be made of Shri KSRVSChallam, Economic Advisor, Shri Manohar Agnani, ProjectDirector, Health and Shri P D Joshi, Director Economics andStatistics, Government of Madhya Pradesh.
The Hindi translations of this report were undertaken byShri Manohar Notani, Dr Sushil Joshi, Dr Suresh Mishra,Shri Parihar, Sushri Shashi Sablok, Sushri Rama Rao,Shri Raghvendra Kumar and Shri Anil Kumar Singh.Mr Pradeep Saha has designed the report and the printing hasbeen done through Madhya Pradesh Madhyam.
Acknowledgements
Advisory Group
Dr Vijas S Vyas, Prof. Suresh Tendulkar, Dr Vinod Vyasalu,
Dr NJ Kurien, Dr K Seetha Prabhu, Dr R Sudershan, Dr Rajan
Katoch, Dr Ravi Narayan, Mr Sanjay Kaul, Dr R Govinda,
Mr Ram Sharan Joshi, Ms Anjali Noronha, Shri P Sainath and
Dr Suraj Kumar.
OUR PRINCIPAL CONTRIBUTORS
The report has drawn on the expert background papers of Shri R Gopalakrishnan for the chapter on Using
the Power of Democracy for Development, Smt Amita Sharma for the chapter on education, and Shri Vijay
Mahajan for the chapter on livelihoods. The health chapter was put together with inputs from Dr Ravi
Narayan, Dr Abhay Shukla and Dr J S Vaseer. The chapter on widening regional disparities was drawn from
a background paper by Dr Rajan Katoch, and the chapter on institutions on the background paper by
Dr Vinod Vyasulu. Other papers used are on inter-region comparisons in Madhya Pradesh by Dr Rajan
Katoch, on Panchayat Raj by Amitabh Singh and Leena Singh, on Gram Swaraj by Shri Shyam Bohre,
and livelihood profiles of poor by Dr Pradeep Bose.

ADB Asian Development BankAgri AgricultureAIDS Acquired Immuno Deficiency SyndromeALS Alternative Learning SourcesARI Acute Respiratory InfectionB.Ed. Bachelor of EducationBAS Base Assessment TestsBMI Body Mass IndexBSNL Bharat Sanchar Nigam Ltd.CAGR Compound Annual Growth RateCARR Compound Annual Reduction RateCDS Current Daily StatusCE Continuing EducationCHAMP Catholic Health Association of Madhya PradeshCHC Community Health Center CSO Central Statistical OrganisationCSS Centrally Sponsored SchemesCWS Current Weekly StatusDPC District Planning CommitteeDPEP District Primary Education ProgrammeDPIP District Poverty Initiatives ProjectDRDA District Rural Development AgencyEFA Education for AllEFC Eleventh Finance CommissionEGS Education Guarantee SchemeFRU First Referral UnitGAR Gross Access RatioGDP Gross Domestic ProductGER Gross Enrolment RatioGFCF Gross Fixed Capital FormationGOI Government of IndiaGoMP Government of Madhya PradeshGSA Gram Sampark AbhiyaanGSDP Gross State Domestic ProductHDI Human Development IndexHDR Human Development ReportHh HouseholdHR Human ResourceIAS Indian Administrative ServicesICDS Integrated Child Development SchemeICOR Incremental Capital Output RatioID Institutional DevelopmentIF InfrastructureIFA Iron Folic AcidIMR Infant Mortality RateInstl. Institutional
Invest. InvestmentIT Information TechnologyJSK Jan Shiksha Kendrask.m. KilometerLSA Lok Sampark AbhiyaanMAS Middle Assessment TestsMDM Mid Day MealsMIS Management Information SystemMLA Member of Legislative AssemblyMMR Maternal Mortality RateMMRL Multi Media Rich LessonsMP Member of ParliamentMPBA Mahila Padhna Badhna Andolan MPVHA Madhya Pradesh Voluntary Health
AssociationNABARD National Bank for Agricultural and Rural
DevelopmentNFE Non Formal EducationNFHS National Family Health SurveyNHDR National Human Development ReportNIC National Industrial ClassificationNLM National Literacy MissionNNMB National Nutrition Monitoring BureauNR Natural ResourcesNSDP Net State Domestic ProductNSS National Sample SurveyNTFP Non Timber Forest ProduceOBC Other Backward ClassesORT Oral Rehydration TherapyPBA Padhna Badhna AndolanPCI Per Capita IncomePDS Public Distribution SystemPHC Primary Health CentrePNDT Prevention of mis-use pre natal diagnostic
techniquesPRI Panchayati Raj InstitutionsPTA Parent Teacher AssociationPTR Pupil Teacher RatioPvt. PrivateRCH Reproductive and Child Health RDA Recommended Daily AllowanceRG Rajiv GandhiRKS Rogi Kalyan SamitiRMP Registered Medical PractitionersRNTCP Revised National Tuberculosis Control
Programme
Abbreviations
vii

RTI Reproductive Tract InfectionSC Scheduled CastesSCERT State Council of Educational Research and
TrainingSD Standard DeviationSDP State Domestic ProductSHC Sub Health CentersSHG Self Help GroupSHPC Selective Primary Health CareSRS Sample Registration SchemeSSA Sarva Shiksha AbhiyaanST Scheduled TribesTAS Terminal Assessment Tests
TB TuberculosisTFR Total Fertility RateTLC Total Literacy CampaignUEE Universal Elementary EducationUNFPA United Nations Population FundUP Uttar PradeshUS Usual StatusUT Union Territory VEC Village Education CommitteeVit. A Vitamin AWPR Worker Participation RateWTO World Trade OrganisationZP Zilla Panchayat
A B B R E V I AT I O N S
viii
Gram Sabha Village AssemblyMandi Samitis Agricultural Marketing SocietiesGuruji TeacherDai MidwifeTendu Patta Leaves of Diospyros melanoxylonGurudakshina Gift or fee to a guru (teacher) by
an initiate
Gram Nyayalaya Village CourtGram Kosh Village FundDalit Those belonging to socially
oppressed communitiesMajras/ Tolas/ Phalias HamletsPrerak One who incites or stimulatesAdivasi Tribal
Glossary

Foreword . . . . . . . . . . . . . . . . . . . . . . . iii
Acknowledgements . . . . . . . . . . . . . . . . . . . . . . . vi
Abbreviations . . . . . . . . . . . . . . . . . . . . . . . vii
Glossary . . . . . . . . . . . . . . . . . . . . . . . viii
Using the Power of Democracy for Development: The Madhya Pradesh Effort . . . . . . . . . . . . . . . . . . . . . . . 1
HDI and GDI Table . . . . . . . . . . . . . . . . . . . . . . . 14
Universalising Elementary Education in Madhya Pradesh . . . . . . . . . . . . . . . . . . . . . . . 17
The Challenge in Health: To Build from Below . . . . . . . . . . . . . . . . . . . . . . . 53
Livelihoods: Crisis and Growth . . . . . . . . . . . . . . . . . . . . . . . 79
Human Development: The Institutional Underpinnings . . . . . . . . . . . . . . . . . . . . . . . 103
Widening Inter Regional Disparities in India . . . . . . . . . . . . . . . . . . . . . . . 121
Technical Notes . . . . . . . . . . . . . . . . . . . . . . . 131
District Factsheets . . . . . . . . . . . . . . . . . . . . . . . 138
Tables . . . . . . . . . . . . . . . . . . . . . . . 319
Education Tables
ED1: Literate Population and Literacy Rate in Districts of Madhya Pradesh, 2001 . . . . . . . . . . . . . . . . . . . . . . . 319
ED 2: Literacy Rate by Sex and Location in Districts of Madhya Pradesh, 1991-2001 . . . . . . . . . . . . . . . . . . . . . 322
ED 3: Elementary Education Infrastructure and Enrolment in Elementary School in . . . . . . . . . . . . . . . . . . . . . . 325
Districts of Madhya Pradesh, 2000
Employment Tables
EL 1: Employment Indicators in Districts of MP, 1991 & 2001 . . . . . . . . . . . . . . . . . . . . . . . 328
EL 2: Percentage of Total Workers, Main Workers and Marginal Workers to . . . . . . . . . . . . . . . . . . . . . . . 336
Total Population by Residence and Sex in Districts of
Madhya Pradesh, 1991, 2001
EL 3: Employment Indicators in Districts of Madhya Pradesh, 1991 . . . . . . . . . . . . . . . . . . . . . . . 348
EL 4: Numbers and Percentage of Total, Main, Marginal and Non-Workers . . . . . . . . . . . . . . . . . . . . . . . 350
by Rural and Urban and Male and Female in Districts of
Madhya Pradesh, 2001
EL 5: Sector Share of Employment of Main and Marginal Workers, 2001 . . . . . . . . . . . . . . . . . . . . . . . 360
Contents
ix

EL 6: Land Use Classification in Districts of Madhya Pradesh over 30 years . . . . . . . . . . . . . . . . . . . . . . . 370
EL 7: Wastelands in Madhya Pradesh, 2000- NRSA Imagery . . . . . . . . . . . . . . . . . . . . . . . 382
EL 8: Land Ownership by Social Categories, Average Landholding Size, . . . . . . . . . . . . . . . . . . . . . . . 386
Gini Coefficient of Operational Holdings- 1990, 1995 and
Tenancy Status, 1990
EL 9: Area, Production, Yield and per capita availability of Food grains in . . . . . . . . . . . . . . . . . . . . . . . 392
Districts of Madhya Pradesh over 30 years
EL 10: Net and Gross Area Irrigated over 30 Years and Sourcewise Net . . . . . . . . . . . . . . . . . . . . . . . 400
Irrigated Area, 1998-99 in Districts of Madhya Pradesh
EL 11: Livestock Population in Districts of Madhya Pradesh, 1998-99 . . . . . . . . . . . . . . . . . . . . . . . 404
EL 12: Credit Deposit Ratio, Credit flow to Agriculture and Rural Credit in . . . . . . . . . . . . . . . . . . . . . . . 406
Districts of Madhya Pradesh
Gender Tables
GE 1: Population and Gender Ratio in Different Age Groups in . . . . . . . . . . . . . . . . . . . . . . . 410
Districts of Madhya Pradesh
GE 2: Gender Ratio over 100 Years in Districts of Madhya Pradesh . . . . . . . . . . . . . . . . . . . . . . . 415
GE 3: Male Female Differentials in Human Development in Districts of . . . . . . . . . . . . . . . . . . . . . . . 418
Madhya Pradesh
GE 4: Participation of Women in Economic Activities, 1991 . . . . . . . . . . . . . . . . . . . . . . . 421
General Tables
GL 1: Population, Sex Ratio, Population Density and Decadal Growth Rate . . . . . . . . . . . . . . . . . . . . . . . 424
of Population in Indian States and Union Territories, 2001
GL 2: Population, Literate Population and Literacy Rate in Indian States and . . . . . . . . . . . . . . . . . . . . . . . 427
Union Territories, 2001
GL 3: Poverty Rates, 1993-94 . . . . . . . . . . . . . . . . . . . . . . . 430
GL 4: Population distribution, Decadal Growth Rate, Sex Ratio and Density by District, 2001 . . . . . . . . . . . . . . . 432
GL 5: Percentage Decadal Variation in Population over 100 years . . . . . . . . . . . . . . . . . . . . . . . 437
GL 6: Districtwise Information on Geographical Area, Towns, Villages and . . . . . . . . . . . . . . . . . . . . . . . 440
Administrative Setup
GL 7: Road Network in Districts of Madhya Pradesh, 1999 . . . . . . . . . . . . . . . . . . . . . . . 442
GL 8: Electricity Consumers and Consumption in Districts of Madhya Pradesh . . . . . . . . . . . . . . . . . . . . . . . 445
GL 9: Telecom Connections (DoT) in Districts of Madhya Pradesh, 2000 . . . . . . . . . . . . . . . . . . . . . . . 448
Habitat Tables
HA 1: Forest Cover in Districts of Madhya Pradesh . . . . . . . . . . . . . . . . . . . . . . . 450
HA 2: Selected Information on Urban Slums and Towns in Madhya Pradesh . . . . . . . . . . . . . . . . . . . . . . . 454
HA 3: Status of Drinking Water in Villages, Institutional Provision, 2000 . . . . . . . . . . . . . . . . . . . . . . . 457
Health Tables
HE 1: Health Institutions in Madhya Pradesh, 2001 . . . . . . . . . . . . . . . . . . . . . . . 460
HE 2: Life Expectancy and Mortality Rates . . . . . . . . . . . . . . . . . . . . . . . 464
HE 3: Select Health Indicators . . . . . . . . . . . . . . . . . . . . . . . 470
References . . . . . . . . . . . . . . . . . . . . . . . 473
C O N T E N T S
x

This chapter seeks to give an overview on the effort inMadhya Pradesh towards addressing goals of humandevelopment in the period from 1994 when the state
went in for large-scale political decentralisation. It presentsexamples where the spaces created through decentralisationwere utilised to advance action on human development goals.It explores the possibility of putting the architecture ofdecentralisation to work on human development goals to bothconsolidate grassroots democracy and move towards a rights-based framework for these goals. It underscores institutionalreform in governance as the key enabling variable for acceler-ating achievement of goals. It sees this effort as having to operate within two major constraints. One constraint resultsfrom the macro-economic situation of the country which asub-national entity like a provincial government is unable toinfluence. The other constraint relates to the continuing centralising tendency in planning for human development atthe national level which state governments are continuallyforced to challenge if they are serious about achieving goals ofhuman development quickly. Uneven development has alwayscharacterised the Indian situation. After the results of Census2001 it is more than evident that problems of human development in India have increasingly become problems ofselected Indian states, have characteristics that are not univer-sally shared across Indian states and need responses thataccount for the specificity of those states. More than everhuman development in India has become less of an “Indian”issue and more the issue of selected Indian states further vindicating the need to capture the human development situ-ation of those relatively backward states through sub-nationalhuman development reports and document responses.
Putting political democracy back into poverty reduction andhuman developmentMadhya Pradesh has been attempting to address the backlogof its challenges in human development through people seeing people as a strategic resource for action. The enablingframework of political democracy was itself seen as the biggestopportunity for doing this. Political decentralisation through
Panchayat Raj deepened democracy in the state. This wascomplemented by a widening of democracy through pluralspaces for community action groups to work on specific agendas. The coming into being of these institutions was dis-cussed in the Second Madhya Pradesh Human DevelopmentReport in 1998 which also discussed how the state was able toconvert selected goals into Missions to be implementedthrough this new institutional arrangement.
A revitalised Panchayat and Urban local body system wasbrought into place in 1994 in Madhya Pradesh after the73rd/74th Constitution Amendment. A second round ofgeneral elections was completed in 1999. The Panchayat Rajsystem was revamped by legally empowering the Gram Sabhathrough the Panchayat Raj and Gram Swaraj Act. ThroughGram Swaraj opportunities for direct action by the com-munity has increased through the Committees under it.Political supremacy of the Gram Sabha was reinforcedthrough creating the provision of the Right to Recall in ruraland urban local bodies, for the first time in India. Electionshave been held for not only rural and urban local bodies, butalso Cooperative Institutions, Agricultural MarketingSocieties, Forest Produce Federations, Water UsersAssociations etc. In addition there are elected people’s repre-sentatives in bodies that that guide Watershed Management,Joint Forest Management, Management of Public Hospitalsthrough Rogi Kalyan Samitis, Management of Collegesthrough College Management Committees etc. (See BoxReducing the Democracy Deficit)
A few examples —two from education, three from natu-ral resources management and one from public health arebeing cited merely to illustrate potential of accelerating onhuman development goals through a framework of collectiveaction enabled by political democracy.● Madhya Pradesh was among the educationally backward
states in India in the middle-nineties. The Governmentdevised an Education Guarantee Scheme to provide a primary school to every community that demanded sucha facility and had at least twenty-five children of theschool-going age. If they did not have a school within one
Using the Power of Democracy forDevelopment: The Madhya PradeshEffort
1
kilometre they could make a demand and the governmentguaranteed to meet that demand within 90 days. Thecommunity could also identify a local qualified residentto be the teacher. The scheme worked through a tripartitepartnership between local community, local governmentand the state government with specific roles. The com-munity raised the demand, identified the teacher andprovided the space to run the school. The local body orpanchayat supervised the school. The state governmentsupported the local community through a grant to paythe teacher and ensured all academic inputs and qualityof teaching and learning. The scheme which started on 1st
January 1997 was able to provide a school to every habi-tation in the state by August 1998. 26,000 EGS schoolscame up in less than 20 months and Madhya Pradesh uni-versalised access to primary education. Over a millionchildren are enrolled in these community schools ofwhich nearly fifty percent are girl children and ninetypercent belong to scheduled castes, scheduled tribes andother backward castes. The Scheme went on to four otherstates and was adopted as a national model in 2000.
● A similar model was tried in adult literacy in the year2000. People who were non-literate could come togetheras a Padhna Badhna Samiti and engage any literate personto be their teacher in a year-long campaign. Governmentprovided the teaching-learning material. The Govern-ment also set in place an evaluation system. Based on thenumber of non-literate people who cleared the examina-tion, the voluntary teacher would get a Gurudakshina asan honorarium at the rate of Rs 100 per person made literate. By providing an incentive-spine to the mass
literacy programme, over 2,17,000 Padhna Samitis cameup in Madhya Pradesh and within one year these volun-tary teachers, made 3 million people literate. This wasreflected in the literacy rate in the Census of 2001. The literacy rate of Madhya Pradesh went up by an unprece-dented 20% to catch up with the national average. Itsmale literacy at 76.6% is today above many states includ-ing Andhra Pradesh and Karnataka. Its female literacyrate went up by over 20% in the decade of the ninetiesand exceeded the cumulative growth of the three-preced-ing decades. These Padhna Badhna Samitis are gettingrepositioned as Self-Help Groups for economic activitiesand the Government another campaign for female literacy – a Mahila Padhna Badhna Andolan – has com-menced. The volunteer teachers of the campaign are com-ing together as a network of a Padhna Badhna Sangh,with a local group for social action in each of the 51,086villages of Madhya Pradesh and will manage a rurallibrary in each village.
● In the area of natural resources management, by organisingpeople through the Watershed Management Mission and aJoint Forest Management Programme, Madhya Pradeshhas been able to arrest the degradation of land and provideincomes to the poor. In the Watershed ManagementProgramme people come together as WatershedManagement Committees to work on an agenda ofcreating community-level water security and improvementof land resources. The task was simple: to impound rainwater which runs off into a series of water harvesting structures. The problem in our rural areas has been one ofunemployment and inadequately developed land and
I N T R O D U C T I O N
2
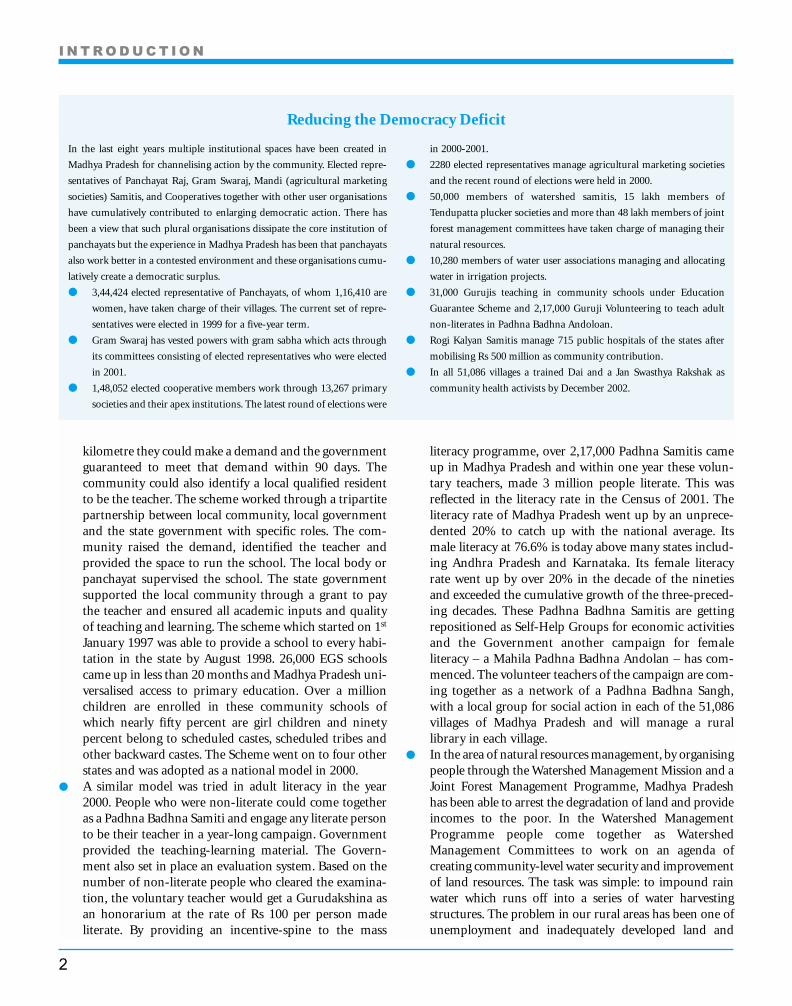
In the last eight years multiple institutional spaces have been created in
Madhya Pradesh for channelising action by the community. Elected repre-
sentatives of Panchayat Raj, Gram Swaraj, Mandi (agricultural marketing
societies) Samitis, and Cooperatives together with other user organisations
have cumulatively contributed to enlarging democratic action. There has
been a view that such plural organisations dissipate the core institution of
panchayats but the experience in Madhya Pradesh has been that panchayats
also work better in a contested environment and these organisations cumu-
latively create a democratic surplus.
● 3,44,424 elected representative of Panchayats, of whom 1,16,410 are
women, have taken charge of their villages. The current set of repre-
sentatives were elected in 1999 for a five-year term.
● Gram Swaraj has vested powers with gram sabha which acts through
its committees consisting of elected representatives who were elected
in 2001.
● 1,48,052 elected cooperative members work through 13,267 primary
societies and their apex institutions. The latest round of elections were
in 2000-2001.
● 2280 elected representatives manage agricultural marketing societies
and the recent round of elections were held in 2000.
● 50,000 members of watershed samitis, 15 lakh members of
Tendupatta plucker societies and more than 48 lakh members of joint
forest management committees have taken charge of managing their
natural resources.
● 10,280 members of water user associations managing and allocating
water in irrigation projects.
● 31,000 Gurujis teaching in community schools under Education
Guarantee Scheme and 2,17,000 Guruji Volunteering to teach adult
non-literates in Padhna Badhna Andoloan.
● Rogi Kalyan Samitis manage 715 public hospitals of the states after
mobilising Rs 500 million as community contribution.
● In all 51,086 villages a trained Dai and a Jan Swasthya Rakshak as
community health activists by December 2002.
Reducing the Democracy Deficit

water resources. What the programme does is to bringthem together and invest the surplus labour energy in atask of natural resources upgrading which in turn providessteady employment. The Watershed Management Missionwhich works in 7600 villages of the state on to improve 35lakh hectares of land has evolved into a movement forwater conservation across the state through a Pani RokoAbhiyan. This Pani Roko Abhiyan for community-ledwater harvesting has resulted in citizen action in privatefarms and community lands in an unprecedented manner.Between January 2001 when it started and now, over a million water harvesting structures ranging from tanks andfarm ponds to simple Do-It-Yourself methods of chan-nelising rain water to recharge dugwells showing the scalethat is possible. Similarly through Joint Forest manage-ment, the management of forest is done through People’sCommittees. After Madhya Pradesh transited to such amodel, the forest cover in the state as shown by satellitemaps of 1999 increased by 635 square kilometres. 10,280elected representatives of Water Users Associations manageirrigation systems in the state over 1.5 million members areinvolved through NTFP societies for management of NonTimber Forest Produce who collect the produce and retainthe entire value from the operation.
● In the area of management of public hospitals MadhyaPradesh has gone in for Rogi Kalyan Samitis for theirmanagement. They are permitted to levy a modest userfee that can be retained at the hospital level to improvedelivery of services. Today over 770 public hospitals aremanaged by such committees who have a saving of Rs 600million with which they are improving services. Localmanagement and autonomy is leading to improved pub-lic services provisioning. Madhya Pradesh is currentlyengaged in decentralising the management of its healthsystems to district and local levels and implement amodel of community health action. This has several com-ponents starting from basics like training two communi-ty health activists in each village as a Jan Swastya Rakshak(a barefoot doctor) and a trained Traditional birth atten-dant to strengthening rural health care and first-contacthospitals. The effort is to address the determinants ofhealth like safe water supply, sanitation, nutrition andhealth education along with health action in inter-sec-toral institutional arrangements like the Village HealthCommittees, Panchayats and District Governmentsbrought into existence through political decentralisation.The decentralised framework if effectively utilised offersgreat opportunity for improving rural health care.The simple point made by these examples is that when
political democracy adopts decentralisation as its strategicarchitecture, solutions can be devised for seemingly formida-ble goals in unusual ways. Many of these challenges, if viewedaggregately, have a crisis-like dimension. Decentralisation
helps break them into small, manageable units and gets themdone. For a large state like Madhya Pradesh political decen-tralisation becomes both a political imperative and soundmanagerial strategy. The challenge for political leadership hasbeen one of sharing leadership. Through Panchayat Raj,Education Guarantee Scheme, Padhna Badhna Andolan,Watershed Management Mission, Joint Forest Management,Rogi Kayan Samiti and similar such initiatives, an effort hasbeen made to create a platform for several leaders to emerge toaddress these tasks in their local contexts.
Political Decentralisation and Mass Education When Madhya Pradesh set about addressing its agenda ofpolitical decentralisation through Panchayat Raj and humandevelopment through the Rajiv Gandhi Missions in 1994 itwas made clear that it sees mass education as the most impor-tant objective. Education is both an end in itself to realise thefull potential of a human being and has instrumental value inmaking political democracy full-blooded. Eight years into thateffort, by the time we measure its performance, MadhyaPradesh is seen to have moved closer to this goal. It has caughtup with the national average in literacy thereby closing the historical gap. The next chapter of this Report discusses thegrowth in basic education and literacy in the state in detail.
A comparison of states which were similarly placed in thebeginning of the decade would serve to illustrate the effort inMP and the so-called Bimaru states (Bihar, Madhya Pradesh,Rajasthan, Uttar Pradesh) would be a good indication of peerstates. While all these states registered increase in literacybetween the 1991 and 2001 Census Madhya Pradesh todayamong these states has the highest literacy rate at 64.1 whileRajasthan has 61%, Uttar Pradesh 57.4% and Bihar 47.5%.Given the fact that Chhattisgarh was carved out of MadhyaPradesh only in November 2000, and the work of the decadeis being measured when Chhattisgarh was also part of MadhyaPradesh, the literacy rate further goes up marginally. Amongthe top ten districts of the country where the percentage ofilliteracy reduced most in the decade, eight are from the erst-while Madhya Pradesh (four of them are now inChhattisgarh). Efforts at mass literacy complemented theeffort at providing universal access to elementary education,goals that Madhya Pradesh has been pursuing in the ninetieson a Mission-mode. Observers of the Indian economy whohave drawn attention to increase in inequality between Indianstates in the nineties (mainly between southern and westernstates on the one hand and the northern and eastern states onthe other the latter already burdened with historical inequali-ties: Deaton and Dreze) cite Madhya Pradesh as a state wherepublic action in the area of elementary education and literacyhas resulted in social achievements.
The two graphs shown here show the closing gap betweenliteracy rates of Madhya Pradesh and India over the last manydecades. The pace at which this gap has closed has been the
3
I N T R O D U C T I O N

achievements of the last decade only. The other graph exhibitsthe closing gap between male and female literacy. From 1961to 1991, the gap between male and female literacy was contin-uously on the rise, but in the last decade for the first time, thisgap reduced.
The increase in access to primary schooling in MadhyaPradesh leading to increase in enrolment is borne out by acomparison of the data of the two Lok Samark Abhiyan of1996 and 2001. Lok Sampark Abhiyan or People’s Data Base isan exercise carried out in Madhya Pradesh on a door-to-doorbasis through elected representatives in villages and teachersworking as a team. This leads to the creation of a VillageEducation Register that becomes the unit for planning for edu-cation for all at the village level. It is seen that between 1996and 2001, Gross Enrolment Ratio in the state went up from76.5% to 96.2%. The Gross Enrolment Ratio of girls hasincreased from 70.7% to in 1996 to 94.3% in 2001. The GrossEnrolment Ratio of Scheduled Tribes has risen from 78% in1996 to 91% in 2001. The percentage of out of school childrenreduced from 29.3% in 1996 to 11.2% in 2001. In other wordswhile three out of ten children did not attend primary schoolin 1996 now it is only one out of ten. The gap in GrossEnrolment Ratio of boys and girls has also narrowed from 25%in 1992 to 11% in 1996 to 3.6% in 2001, a very positive sign.
In the area of health, Madhya Pradesh alone among the
“Bimaru” states has shown a declining trend in populationgrowth, much of which can be attributed to the growth in liter-acy and education given the fact that health indicators per sehave not improved dramatically in inter-state comparison.While population growth rate increased in Uttar Pradesh andBihar and remained static in Rajasthan, Madhya Pradesh for thefirst time registered a declining trend. There is increasing cross-country evidence that political decentralisation which empow-ers women to move out from the private domain to the publicdomain thereby exercising a greater control on their environ-ment can have a positive impact on population reduction.
In human development, the one sector where the statestill faces a considerable challenge is health. Most of the majorindicators are way below the national averages and standamongst the lowest in India. On the other hand, there hasbeen a small but significant shift in the progress level in health,and this is seen if we compare the last seven to eight years(1993 to 1999) of MP with the decade preceding that (1980 to1992) (see Table 1).
Increased allocation to the Social SectorDuring this period, Madhya Pradesh has sought to steadilyincrease its expenditure in the social sector. The chart belowshows the increase in the social sector spending by MadhyaPradesh.
I N T R O D U C T I O N
4
Closing the Literacy Gap:
Madhya Pradesh and India
70.00
60.00
50.00
40.00
30.00
20.00
10.00
0.001961 1971 1981 1991 2001
Madhya Pradesh National
Lite
racy
Rat
e
28.33
20.4826.37
34.23
44.67
64.11
34.45
43.57
52.21
65.38
Gap between Male and Female
Literacy in Madhya Pradesh
35.00
30.00
25.00
20.00
15.00
10.00
5.00
0.001961 1971 1981 1991 2001
Lite
racy
Rat
e
24.08 25.4429.18 29.29
26.52
Change % age between 1980 and 1992 -6.3% -14.0% -17.8% -22.8% -36.5% -44.3%
Change % age between 1993 and 1999 -13.7% -10.0% -18.9% -13.4% -16.5% -5.7%
Birth Rate Death Rate Infant Mortality Rate
MP India MP India MP India
Source: Calculations made on data from Various Volumes of SRS, Registrar General of India.
Table 1: Changes in Birth Rate, Death rate and IMR in Madhya Pradesh, 1993 to 1999

During the year 1994-1995, the plan expenditure onsocial services was 23.64 % of the total plan expenditure. Theplan expenditure on social services steadily rose in the remain-ing period of the Eighth Plan and throughout the period ofthe Ninth Plan (1997-2002). It became 27.15 % in 95-96,32.34 % in 96-97, 33.14% in 97-98, 35.30 % in 98-99, and38.77% in 99-2000.
The Table 2 shows increase in provisioning of amenitiesin terms of institutions in basic education, technical educationand basic health in Madhya Pradesh in the period 1994-2001.
Acceleration of growth in Madhya Pradesh Madhya Pradesh has been among the economically backwardstates of India. However in the decade of the nineties, MadhyaPradesh reversed this position and became one of the fastergrowing states of India and has sustained a high growth rate ifthe year of acute drought is excluded. Among the states in thenorth, Rajasthan and Madhya Pradesh have been seen as fastergrowing states but while Rajasthan has had this high growthsince eighties, it is in the nineties that MP has begun to regis-ter this high growth rate. Seven states showed acceleration ofgrowth in the nineties as reported in the Mid-Term Appraisalof Ninth Fine Year Plan by the Planning Commission. Toquote the Report “seven states showed an acceleration ofgrowth in the 1990s. They are fairly well distributed regionallyi.e, Gujarat (9.6%), Maharashtra (8.0%), West Bengal (6.9%),
Tamil Nadu (6.2%), Madhya Pradesh (6.2%), Rajasthan(5.9%) and Kerala (5.8%)”. Per Capita income has also grownover the period though at a slower rate on account of slowpace of population reduction. The per capita income ofMadhya Pradesh, which was Rs 6577 in 93-94 has gone up toRs 7088 in 96-97 and Rs 7947 by 1999-2000.
According to the National Human Development Report2001, Headcount Ratio of rural poverty went down in MadhyaPradesh from 40.6 in 1993-1994 to 37.1 in 1999-2000.Headcount ratio of poverty in Urban areas during the sameperiod went down from 48.4% to 38.4%. According to NHDR2001 Madhya Pradesh, among the Bimaru states has the second highest HDI, (Rajasthan has the highest) at 0.328 whileUttar Pradesh is at 0.314 and Bihar at 0.308.
Moving towards a rights-based framework on human development goals Madhya Pradesh became the first state in India to conceive arights-based framework for basic education in India when itintroduced the Education Guarantee Scheme in 1997. Theunderstanding of rights in the Education Guarantee Schemegoes beyond seeing it as a civil right, a right of the citizen vis-à-vis the state or society but wraps within it the notion ofsocial, economic and cultural rights. Education of the child ispresented as a right that the state has to ensure workingtogether with society and citizens. The debate between proce-dural rights and substantive rights is sought to be reconciledin a practical manner in the form of a state guarantee, whichthe state was able to ensure because the participation soughtfrom society was forthcoming. Here again political decentral-isation becomes the enabling framework.
In the area of basic education, the rights-based frame-work has been carried over into the area of ensuring qualityfor elementary education through the Madhya Pradesh JanShiksha Adhiniyam (Madhya Pradesh People’s Education Act,2002). As the first Act of its kind it charts new territory. TheAct holds providers in the public schooling system account-able for quality and for this Parent-Teacher Associations havebeen given legal space. The Act stipulates quarterly submissionof academic records of children at the school level at theParent-Teacher Association meetings and annual PublicEducation Reports to District Planning Committees (DistrictGovernment) and the state legislature, which will organiseinformation based on legislative constituencies. It is expected
5
I N T R O D U C T I O N
1993/94 52786 12745 4303 412 9900
2000-01 82219 21043 7943 675 10390
Years Primary Schools Middle Schools High Schools Colleges Health Centres
Source: Various Volumes of State Statistical Abstract, Directorate of Economics and Statistics, Government of Madhya Pradesh
Table 2: Institutions in Madhya Pradesh, 1994 to 2001
State Expenditures on Social Sectors
40
35
30
25
20
15
10
5
0
Madhya Pradesh Rajasthan Andhra Pradesh
Uttar Pradesh West Bengal Bihar
1997-98 (%) 1998-99 (%)

that this Act will create an understanding of quality as much auser issue of learners, parents and local communities asproviders of public schooling like the government and its aca-demic agencies. Political decentralisation, which created theenabling framework for universalising access to schoolingfacility is being leveraged for improving quality.
In the area of health, Madhya Pradesh has initiated a fewmodest steps towards creating a Health Guarantee Scheme ormore appropriately a Heath Services Guarantee Scheme(Swasth Jeevan Sewa Guarantee Yojana). Here again politicaldecentralisation provides the institutional arrangements tomove from selective health care to comprehensive healthcare. The problems in the health sector need extra-sectoraction to be effective. Many key determinants of health likesafe water supply, sanitation, nutrition and the like lie out-side the sector. It is here that the multi-sector mandate thatvillage, panchayat and district have received through politi-cal decentralisation helps the health sector to create collec-tive intersectoral action for health outcomes. The effort is toback this at the district-level through provision ofCommunity Health Action Fund and address gaps in theprovision of services including determinant services. Twohealth activists who are volunteers from the community willanimate the Village Health Society which is the nearest unitfor such collective action.
Creating greater transparency and accountability in governmentPromotion of measures that ensure accountability is integralto democracy. Panchayat Raj and decentralisation upset tradi-tionally accepted patterns of bureaucratic governance and thechallenge was to reorient accountability-structures from beingupward to being outward. Since 1994 powers have been vest-ed with gram sabha for social audit of actions by elected rep-resentatives and in 1999 the provision of Right to Recall wasintroduced for all local bodies. The Panchayat Raj Act wasreformulated to give salience to the Gram Sabha through thePanchayat Raj evam Gram Swaraj Ahiniyam whereby electedrepresentatives have been subordinated to the collectivity ofthe Gram Sabha. Citizen Charters are in place for all depart-ments since 1999 and Public Service Agreements have beeninitiated for 6 major departments.
A week-long Gram Sampark Abhiyan and Nagar SamparkAbhiyan where every village in the state and every ward in atown is intensely covered for a reality check on developmentprogrammes initiated in 1997 has now become institution-alised. Every month in every village a 11-point programme onbasic development inputs is monitored. It has been web-enabled and readers of this document can access basic infor-mation on every village in the state of Madhya Pradesh onwww.mp.nic.in/gramsampark. A measure for transparencyand accountability for community schools of the EducationGuarantee Scheme through the internet has been used also asa way of creating a local-global partnership on a C2C modelthereby leveraging an information technology tool of theinternet to promote equity. Here citizens can choose thesecommunity schools for support on an internet site www.fun-daschool.org which realises the notion of a global partnershipfor basic education. The Government of Madhya Pradesh seesthis less as a fund-raising venture and makes it clear that theseresources will not be substitutive but additive but sees it asvaluable for creating a community of concern around basiceducation. An interactive public information website in Hindiand English called www.kisanwatch.org has been set up toeducate the Indian farmer on issues of relevance especially inthe new context of WTO. Globalisation has to engaged withon terms that negotiated through political democracy andinformation is seen as playing critical role in enhancing polit-ical democracy.
Gyandoot (www.gyandoot.nic) has been a major steptowards provision of citizen services in an accountable man-ner through an intranet linked to information and citizenservices kiosks operated through entrepreneurs. Initiated inthe district of Dhar in Madhya Pradesh it now covers 16 dis-tricts of the state. Most of the work relating to computerisa-tion of land records has been completed and by March 2003all tax systems would also have been completely computerised.
Madhya Pradesh has taken human development report-ing to the village level. Village Education Registers and Village
I N T R O D U C T I O N
6
Gujarat 5.08 9.57
Maharashtra 6.02 8.01
West Bengal 4.71 6.91
Rajasthan 6.60 6.54
Tamil Nadu 5.38 6.22
Madhya Pradesh 4.56 6.17
Kerala 3.57 5.83
Karnataka 5.29 5.29
Andhra Pradesh 5.65 5.03
Haryana 6.43 5.02
Punjab 5.32 4.71
Uttar Pradesh 4.95 3.58
Orissa 4.29 3.25
Bihar 4.66 2.69
All 14 States 5.24 5.92
All India 5.55 6.89
States 1980-81 1990-91 1991-92 1997-98
Source: Mid Term Appraisal of the Ninth Five Year Plan: Planning Commission
Table 3: Rates of Growth of Gross State
Domestic Product

Health Registers map the situation in the sectors of educationand health and update them at regular intervals.
Supplementing political institutions with social and communitarian institutionsMadhya Pradesh made a conscious effort to rejuvenate somecommunitarian institutions and practices which seek to usesocial energy for development. One significant initiative hasbeen the “grain bank”. Grain banks used to be managed bycommunities to tide over adverse conditions in years of cropfailure. It is a common pool of grain to which all memberscontribute and draw according to their need and repay. Thesystem operates through peer pressure and community bond-ing. It becomes an appropriate model in those villages whichremain inaccessible during parts of the year and to addressseasonal hunger especially during rainy months. This practicewas revived in villages identified as prone to hunger and malnutrition and over 2500 villages now have grain banksmanaged by self help-groups.
The system of Gram Nyayalayas has been revived and alsothe institution of family courts has been brought into exis-tence in Madhya Pradesh. The Madhya Pradesh GramNyayalaya Act came into effect from 26th of January 2001. Itwas proposed that 1580 Gram Nyayalayas in all the districtsbarring the four districts of Mandla, Dindori, Jhabua andBadwani would be established. A total of 890 GramNyayalayas out of 1580 proposed have been established tillSeptember 2002. Family courts have been brought into existence in seven major cities.
Formation of Self-Help Groups where people cometogether for micro-finance activities has seen a major revivalin the state between 1998 and now. These Self-Help Groupsbegin as Thrift and Credit Groups and later move into activi-ties of micro-credit for economic activity. They are supportedthrough a series of government programmes like the SwarnaJayanti Gramin Swarojgar Yojana, the Swashakti Yojana, theSwayamsidha Yojana, Indira Gandhi Garibi Hatao Yojana(DPIP) etc. These Self-Help Groups are also created in otherprogrammes like the Watershed Management Mission, JointForest Management Programme, and the Padhna BadhnaAndolan. These Groups also constitute a democratic platformwhich uses collective resources for development.
Self-Help Groups are being formed in the state also byvoluntary organisation on which data is difficult to get. Fromthe information available, as on June 2002, there were at least2,60,000 self help groups in the state. If we assume that themembership would average a conservative ten, it would meanthat 26 lakh families are involved in self help groups in thestate. The Table 4 shows the share of groups promoted underdifferent programmes as collated from the CommissionerPanchayats and by a study by MP-LEAP.
The most important initiative made by the state in grass-roots democratisation has been the move towards Gram
Swaraj. Here the process of political decentralisation is at onelevel deepened up to the village and at another level is trans-formed to embrace the entire community where powers vestwith the Gram Sabha. While the law for the creation of GramSwaraj was enacted in 2001, the institutions are gradually get-ting into place. The system works through stakeholder groupsfor key activities and has an omnibus committee in the formof a Village Development Committee. This has within it aGram Kosh or a repository of funds. Government is placingfunds with this Gram Kosh as well as empowering the GramSabha to raise resources to supplement the Gram Kosh. As theinstitutional arrangement consolidates, the scope for directcommunity action increases manifold.
Madhya Pradesh has also seen a rapid growth in the num-ber of voluntary action groups, professional Non GovernmentOrganisations, and other civil society-based communityorganisations all of which cumulatively add to the democraticplatform. The challenge before them is to position themselvesin a way that political and social democracy is enhancedthrough collaborative action and not subverted or subordi-nated through claims of expertise. Intermediation by expertgroups have to acknowledge the superiority and legitimacy ofpolitical democracy which provides for inclusion and as a normative ideal with even efficiency coming only next afterthe cardinal norm of inclusion which encompasses the rightto define expertise. Capacity building for democratic decen-tralisation emerges as a natural challenge to give the criticaledge to the entire process of democratic decentralisation.
Constraints of macro-economic factorsIn the current macro-ecomomic context there are increasinglimitations on sub-national entities like state governments toeffectively intervene for human development. This needs to be
7
I N T R O D U C T I O N
SGSY 121643
Others 1 (NABARD & DPIP)* 3307
Other 2 (Forest Deptt., Agri. Dept. & DWC&D)** 31370
Swashakti 1487
SJSRY 1698
Watershed Mission 19601
Padhna Badhna Andolan 57204
ICDS 23449
Total 259759
Promoters/Programmes No. of groups
Source: *"SHG and MF-A Status Report and A Strategy for CARE in MP" (As on
July 2001) **Office of Commissioner Panchayats and Social Welfare (as on July
2002)
Table 4: Self Help Groups in
Madhya Pradesh

articulated, as there is an increasing tendency to pass onresponsibilities to states on a “states-better-get-smart” argu-ment ignoring historical factors that limit capabilities andstate action. Direct public action to improve social indicatorsis definitely important as it could be used to improve upon orneutralise the minimally positive or even negative fall-outs ofthe larger process of economic growth. However it has to beseen whether the process of growth is leading to increasingunemployment, increases in income inequality, loss of socialsecurity, and such other factors vital for human development.In the Indian context there are many ways in which monetaryand fiscal reform have eroded the ability of the state to imple-ment appropriate social policies. Principally, the scope hasbeen limited for government spending on the social sector byreducing the government’s revenue base as well as forcing cutsin deficit-financed spending.
It is abundantly clear that there are initial winners andinitial losers among Indian states on the rocky road to eco-nomic reform. However as yet there have not been any signif-icant compensatory mechanisms in public policy at thenational level to narrow this widening gap which could have anegative impact on human development, especially since theinitial loser states are also the same states with historical bur-dens of low human development. The Mid-Term Appraisal ofthe Ninth Plan has highlighted this as a serious issue. TheEleventh Finance Commission has noted that states with goodinfrastructure are attracting private investment in much larg-er measure than states where infrastructure is weak, and sug-gested that Central investment should be directed taking thisinto view. Clearly it follows that in years to come, larger pro-portion of Central assistance to states would have to be devot-ed to attainment of basic human development objectives, andthe closing of the infrastructure gaps in poorly endowedstates. Allocations of Central assistance to states would have tofollow a more direct approach in terms of the existing gaps inthe provision of basic minimum services and infrastructure.The larger the gap between the level of facilities available in astate and the national average, the greater would have to be theallocation to ensure that no state lags behind.
The Table on Capital flows in the Annexure 1 showsCapital Flows to States substantiating the inherent inequity inthe situation that is getting accentuated. Just looking at the fig-ure of the per capita plan outlay and the per capita institu-tional investments, states like Madhya Pradesh fall well belowdeveloped states.
The fact that our central planning system has not beenable to address this increasing gap can be seen from the dataon agreed outlays of the Tenth Plan and its comparison withNinth Plan. States like Madhya Pradesh, Bihar, Uttar Pradesh,and Rajasthan fair poorly in terms of Tenth Plan outlays (they show negative growth compared to Ninth Plan agreedoutlays) while many other states, including states with bettereconomic and infrastructure indicators such as Andhra
Pradesh, Tamil Nadu, Maharashtra, fare much better.Increasingly a case of winner takes all seems to prevail as thesharpest increases are in those states which have much higherlevels of private investment, developed infrastructure and better human development indicators.
External assistance, which in over all terms may constituteonly 0.4% of India’s GNP, is also skewed in favour of a fewstates. The Mid Term Appraisal of the Ninth Plan by thePlanning Commission admits that seven states namely,Andhra Pradesh, Maharashtra, Uttar Pradesh, Tamil Nadu,Gujarat, Karnataka and West Bengal received more thaneighty percent of the entire external assistance. Data on statewise external assistance is presented in Annexure 2.
A sensitive reform-based funding would actually focus onsoftening the immediate adverse impact of reform on thesestates and instead the current thinking seems to be to rewardthose with initial advantages on the grounds of moving fasteron the reform track. While Madhya Pradesh is seen as areforming state for such assistance, its larger case rests on thebacklog in infrastructure and human development whichrequires additional resource support. It will also not be correctto highlight inadequacies in human development without ref-erence to the possible relation this has with the strategy ofgrowth being pursued and its impact on the resources availablefor social policies. In recent years states have been deprived oftheir expected share in central taxes. The decline in central tax-GDP ratio implies that the volume of tax revenues transferredto the states is being squeezed. This is of far greater conse-quences to states since their ability to borrow is not as flexibleas that of the Centre. States are increasingly facing a majorresource crunch to sustain a reasonable social policy agenda.
Constraints of Centralised PlanningWhile the above sections tried to give an overview of howMadhya Pradesh has attempted to put democracy to use inimproving its human development indicators, this effort hasbeen stymied by the dominance and proliferation of CentrallySponsored Schemes. Centrally Sponsored Schemes limitefforts by state governments to empower local bodies and havebeen vitiating the principle of federalism. Chief Ministers ofStates had raised this issue and in the National DevelopmentCouncil there was a consensus on transfer of CSS to stateswith resources. This however, has not been implemented. Thelegal validity of the Centrally Sponsored Schemes is weakbecause many areas where these proliferate are areas belong-ing either to the State-List of the Constitution (RuralDevelopment, Health, Agriculture) or to the Concurrent List(Education). It is also to be pointed out that after Seventy-third and Seventy-fourth Constitution Amendment, functionsin these areas have been demarcated for local bodies. PostCensus 2001, it is very clear that India is more than ever char-acterised by uneven development. Problems, especially in thehuman development area, are no more “Indian” problems but
I N T R O D U C T I O N
8

problems of select Indian states. These therefore call for state-specific responses and strategies built on specificity of state-situations. CSS fails the human development agenda by notallowing such differential responses to emerge.
It is abundantly clear after years of planning that CentralPlanners have ignored strategic planning. People should beseen as a strategic resource to be deployed on finding solutionsto India’s development challenges. There are several examplesof state governments managing to achieve results by adoptingsuch a methodology and some instances of these in MadhyaPradesh is listed in this early part of this Chapter. However thecritical issue in addressing human development is the asser-tion of intersectoral institutional frames. This is precisely theopportunity provided by the architecture of political decen-tralisation and its sub-optimal use wastes the sectoralresources deployed on the agenda. It is unfortunate to watchthe multiple exercises of “sectoral reforms” being unfolded ineach sector ranging from health to water supply to forestryignoring the fundamental matrix of political decentralisation.It is also a weakness of Human Development Reports thatwhile they have been strong on sector analysis, when it comesto solution, nothing better is offered except to increase invest-ment in the particular sector. The equally important issue is toinvest those resources through appropriate multi-sectoralinstitutional arrangements that create a cumulative impactacross sectors and maximise returns even at the same timestrengthening political democracy.
States that take the human development agenda seriouslylike Madhya Pradesh work under the constraints of cen-tralised planning that prevails in spite of the consensus in sub-national political levels and academic circles against CSS.Centrally Sponsored Schemes should largely be only in theareas of “capacity building, inter-sectoral coordination, outlay
monitoring, and impact studies of state-sector projects” asrightly mentioned by the Planning Commission itself in itsApproach Paper to the Tenth Five Year Plan. The full potentialof democratic decentralisation in furthering the human development agenda gets limited in the current context.
Refining HDI: Including a Scheduled Tribe-Scheduled CasteDevelopment IndexNow that sub-national Human Development Reports havebecome an accepted practice in India to measure attainments itis perhaps time to revisit some of the indices. There is a need tolook inward, within the country to identify groups that farepoorly in human development as against spatially in terms ofhow districts fare or how sectors fare. Deprivation in India hasan obvious face of exclusion, the scheduled tribes due to socialexclusion and the scheduled tribes due to geographical andcultural exclusion. Scheduled Castes suffer social deprivationon account of the residual power of a discriminatory caste sys-tem which though made illegal continues sway as a social forcewhereas scheduled tribes see their predicament as victims ofthe state which denies them property rights to their habitat. AScheduled Tribe-Scheduled Caste Development Index needs tobe developed by professionals to capture their deprivations soas to goad state policy to address them. A broad attainmentindex does not effectively address the roots of these veryimportant deprivations in the Indian context. The process ofdemocracy is at work drawing these people into the mainstream and seeking to address their specific concerns.How well this is being done needs to be assessed through the development of a Scheduled Tribe-Scheduled CasteDevelopment Index. This is a task we are identifying for our next Human Development Report by which time relevantcensus information will be available.
9
I N T R O D U C T I O N

10
Non Spl. Category States
Andhra Pradesh 75,727,541 14715 64.9 162416 21447.42
Bihar 82,878,796 6328 20.7 23634 2851.63
Chhattisgarh 20,795,956 @ 49.9 25389 12208.62
Goa 1,343,998 NA 27.3 7534 56056.63
Gujarat 50,596,992 18685 53.6 171399 33875.33
Haryana 21,082,989 21551 54.0 19399 9201.26
Jharkhand 26,909,428 @ 30.6 24503 9105.73
Karnataka 52,733,958 16343 61.8 130651 24775.50
Kerala 31,838,619 18262 42.3 38955 12235.14
Madhya Pradesh 60,385,118 10907 52.5 44001 7286.73
Maharashtra 96,752,247 23398 83.5 169855 17555.66
Orissa 36,706,920 9162 41.6 93694 25524.89
Punjab 24,289,296 23040 42.3 30818 12687.89
Rajasthan 56,473,122 12533 49.6 38194 6763.22
Tamil Nadu 62,110,839 19141 90.6 163303 26292.19
Uttar Pradesh 166,052,859 9765 31.9 54859 3303.71
West Bengal 80,221,171 15569 43.4 57058 7112.59
Spl. Category States
Arun. Pradesh 1,091,117 14338 22.1 4134 37887.78
Assam 26,638,407 9720 38.1 112303 42158.30
Manipur 2,388,634 11370 40.7 1207 5053.10
Meghalaya 2,306,069 11678 17.3 697 3022.46
Mizoram 891,058 NA 29.0 1196 13422.25
Nagaland 1,988,636 NA 13.6 273 1372.80
Sikkim 540,493 13356 14.5 6628 122628.79
Tripura 3,191,168 10213 21.7 5609 17576.64
Himachal Pradesh 6,077,248 15012 25.7 31664 52102.53
Jammu & Kashmir 10,069,917 12338 33.5 17034 16915.73
Uttaranchal 8,479,562 @ 23.9 16911 19943.25
Union Territories
A & N Islands 356,265 NA 27.5 77 2161.31
Chandigarh 900,914 46347 99.3 1170 12986.81
Dad.&Nag Haveli 220,451 135.2 584 26491.15
Daman & Diu 158,059 75.3 12 759.21
Delhi 13,782,976 35705 57.6 16246 11787.00
Lakshadweep 60,595 11.8 24 3960.72
Pondicherry 973,829 30768 35.8 2072 21276.84
States Population Per Capita Credit Deposit Public & Pvt. Public & Pvt.
2001 NSDP (Rs.) Ratio Invest. (Rs. Cr) Invest. per
99-00 2001 Oct 2001 Capita (Rs.)
Source: Various Publications of Planning Commission, Government of India
ANNEXURE 1: CAPITAL FLOWS TO STATES

11
7816.48 1032.18 6887.36 909.49 35348.76 4667.89
2644.00 319.02 4524.49 545.92 5547.18 669.31
1312.00 630.89 66.66 32.05 3748.97 1802.74
460.00 3422.62 244.72 1820.84 1947.27 14488.64
6500.00 1284.66 3641.14 719.64 29482.99 5827.02
1814.17 860.49 1743.57 827.00 10747.41 5097.67
2250.00 836.14 98.43 36.58 4733.35 1758.99
7903.79 1498.80 3628.24 688.03 33856.03 6420.16
2260.00 709.83 3733.05 1172.49 18697.06 5872.45
3937.76 652.11 4380.59 725.44 15264.19 2527.81
10834.00 1119.77 6383.38 659.77 144064.2 14890.01
2300.00 626.58 3851.48 1049.25 6262.34 1706.04
3021.00 1243.76 2618.59 1078.08 18718.77 7706.59
4642.35 822.05 5161.87 914.04 13662.06 2419.21
5200.00 837.21 4405.87 709.36 57106.8 9194.34
4872.77 293.45 10274.34 618.74 27192.58 1637.59
5693.31 709.70 5308.71 661.76 29475.59 3674.29
660.91 6057.19 59.8 548.06 135.51 1241.94
1710.00 641.93 1663.25 624.38 3759.79 1411.42
352.65 1476.37 138.76 580.92 175.76 735.82
472.82 2050.33 262.91 1140.08 285.35 1237.39
441.51 4954.90 78.07 876.15 114.74 1287.68
411.47 2069.11 266 1337.60 122.45 615.75
300.00 5550.49 105.32 1948.59 88.1 1629.99
560.00 1754.84 196.15 614.67 339.08 1062.56
1744.51 2870.56 107.49 176.87 1903.38 3131.98
2050.00 2035.77 817.46 811.78 3313.21 3290.21
1050.00 1238.27 13.26 15.64 2233.33 2633.78
370.00 10385.53 – 106.26 2982.61
154.11 1710.60 – 7509.27 83351.69
51.48 2335.21 – 299.41 13581.70
42.19 2669.26 – 304.24 19248.51
3800.00 2757.02 195.8 142.06 61306.79 44480.08
104.98 17324.86 – 6.49 1071.05
355.00 3645.40 0.24 2.46 575.03 5904.84
Plan Outlays Per Capita Instl. Investment Per Capita Total Credit Utilized Per Capita Total
(Rs. Cr) Plan Outlay (Rs Cr.) Inst. Investment in States Credit Utilised in
2001-02 (Rs.) 2001 (Rs.) (Cr.) Mar. 2001 States (Rs.)
ANNEXURE 1: CAPITAL FLOWS TO STATES

12
Andhra Pradesh 1117.94 624.72 1440.51 1442.34 3755.84 8381.36 1676.27
Arun Pradesh 0.00 0.00 0.00 0.00 0.32 0.32 0.06
Assam 0.22 33.16 41.19 78.26 93.25 246.08 49.22
Bihar 132.26 112.78 130.41 63.67 16.83 455.96 91.19
Goa 10.82 5.73 0.45 0.00 0.00 16.99 3.40
Gujarat 219.27 267.65 512.33 891.24 1604.96 3495.45 699.09
Haryana 221.25 165.01 280.85 296.66 151.93 1115.70 223.14
Himachal Pradesh 0.00 0.00 15.56 56.40 38.16 110.12 22.02
Jammu & Kashmir 10.51 8.42 24.84 15.71 38.05 97.53 19.51
Karnataka 264.48 316.49 456.70 579.50 1691.74 3308.91 661.78
Kerala 38.73 40.85 41.55 77.16 96.99 295.28 59.06
Madhya Pradesh 117.32 163.26 598.67 172.68 819.60 1871.53 374.31
Maharashtra 1073.68 597.13 245.36 318.70 289.23 2524.11 504.82
Manipur 0.00 8.96 18.43 19.57 16.27 63.23 12.65
Meghalaya 0.00 0.00 0.62 8.15 43.12 51.89 10.38
Mizoram 0.00 0.49 3.19 1.89 3.49 9.06 1.81
Nagaland 0.00 0.00 0.00 0.00 1.06 1.06 0.21
Orissa 535.54 415.83 391.56 516.34 310.50 2169.76 433.95
Punjab 149.91 171.11 106.35 187.15 209.58 824.11 164.82
Rajasthan 230.11 225.17 188.09 248.42 99.12 990.91 198.18
Sikkim 0.00 11.69 2.09 0.50 1.92 16.20 3.24
Tamilnadu 568.52 305.16 591.41 775.14 340.19 2580.42 516.08
Tripura 0.00 0.00 0.00 0.03 3.67 3.69 0.74
Uttar Pradesh 721.39 465.05 431.22 1697.90 606.37 3921.92 784.38
West Bengal 542.31 886.21 819.67 636.09 688.45 3572.74 714.55
Chhattisgarh 0.00 0.00 0.00 0.00 7.17 7.17 1.43
Jharkhand 0.00 0.00 0.00 0.00 0.00 0.00 0.00
Uttaranchal 0.00 0.00 0.00 9.73 17.41 27.14 5.43
Total 5954.25 4824.89 6341.06 8093.24 10945.23 7231.73
States 1997-98 1998-99 1999-00 2000-01 2001-02 Total Average
Source: Various publications of Planning Commission, Government of India
ANNEXURE 2: FLOW OF EXTERNAL ASSISTANCE TO STATES

13

H D I
14
Indore 0.748 0.937 0.811 0.746 0.746 0.526 0.526 0.694
Bhopal 0.751 0.937 0.813 0.665 0.665 0.510 0.510 0.663
Raisen 0.728 0.936 0.797 0.505 0.505 0.632 0.632 0.645
Ujjain 0.712 0.864 0.763 0.580 0.580 0.555 0.555 0.632
Mandsaur 0.707 0.973 0.795 0.558 0.558 0.544 0.544 0.632
Ratlam 0.677 0.914 0.756 0.551 0.551 0.584 0.584 0.630
Neemuch 0.665 0.925 0.751 0.558 0.558 0.570 0.570 0.626
Gwalior 0.698 0.897 0.764 0.672 0.672 0.435 0.435 0.624
Shajapur 0.711 0.953 0.792 0.555 0.555 0.505 0.505 0.617
Dewas 0.610 0.865 0.695 0.639 0.639 0.497 0.497 0.610
Narsimhapur 0.783 0.931 0.833 0.531 0.531 0.466 0.466 0.610
Harda 0.668 0.877 0.738 0.510 0.510 0.516 0.516 0.588
Chhindwara 0.660 0.866 0.729 0.591 0.591 0.440 0.440 0.586
Hoshangabad 0.704 0.888 0.765 0.510 0.510 0.478 0.478 0.584
Balaghat 0.688 0.930 0.769 0.558 0.558 0.415 0.415 0.580
Mandla 0.608 0.943 0.720 0.626 0.626 0.388 0.388 0.578
Jabalpur 0.762 0.931 0.818 0.542 0.542 0.356 0.356 0.572
Damoh 0.621 0.916 0.719 0.484 0.484 0.501 0.501 0.568
Bhind 0.712 1.000 0.808 0.582 0.582 0.306 0.306 0.566
Sagar 0.681 0.902 0.755 0.484 0.484 0.456 0.456 0.565
EastNimar (Khandwa) 0.617 0.880 0.705 0.544 0.544 0.440 0.440 0.563
Sehore 0.638 0.895 0.724 0.491 0.491 0.466 0.466 0.560
Dhar 0.527 0.780 0.611 0.641 0.641 0.424 0.424 0.559
Dindori 0.545 0.882 0.657 0.626 0.626 0.387 0.387 0.557
Sidhi 0.528 0.845 0.634 0.550 0.550 0.481 0.481 0.555
Seoni 0.659 0.906 0.741 0.582 0.582 0.326 0.326 0.550
Vidisha 0.621 0.920 0.721 0.495 0.495 0.431 0.431 0.549
Datia 0.735 0.940 0.803 0.504 0.504 0.322 0.322 0.543
Katni 0.647 0.925 0.739 0.542 0.542 0.345 0.345 0.542
Betul 0.669 0.939 0.759 0.494 0.494 0.359 0.359 0.537
Shahdol 0.578 0.946 0.700 0.535 0.535 0.338 0.338 0.525
Morena 0.656 0.987 0.766 0.540 0.540 0.255 0.255 0.520
Sheopur 0.466 0.835 0.589 0.540 0.540 0.412 0.412 0.514
Rajgarh 0.540 0.771 0.617 0.487 0.487 0.408 0.408 0.504
West Nimar (Khargone) 0.634 0.832 0.700 0.576 0.576 0.217 0.217 0.498
Guna 0.599 0.909 0.702 0.476 0.476 0.300 0.300 0.493
Umaria 0.603 0.881 0.695 0.535 0.535 0.245 0.245 0.492
Satna 0.651 0.894 0.732 0.410 0.410 0.307 0.307 0.483
Rewa 0.623 0.868 0.705 0.476 0.476 0.254 0.254 0.478
Shivpuri 0.595 0.918 0.703 0.372 0.372 0.343 0.343 0.473
Panna 0.616 0.868 0.700 0.466 0.466 0.243 0.243 0.470
Tikamgarh 0.558 0.821 0.646 0.463 0.463 0.296 0.296 0.468
Chhatarpur 0.534 0.877 0.649 0.424 0.424 0.273 0.273 0.449
Barwani 0.413 0.713 0.513 0.576 0.576 0.177 0.177 0.422
Jhabua 0.371 0.670 0.471 0.513 0.513 0.133 0.133 0.372
EDUCATION HEALTH INCOME HUMAN
Literacy Children's Education Life Health Adjusted Income DEVELOPMENTEnrollment Expectancy per capita INDEXin Schools Income
A B D E F G H I
District
THE HUMAN DEVELOPMENT INDEX FOR MADHYA PRADESH, 2001

15
G D I
Dewas 83.7% 57.6% 91.7% 80.5% 0.747 64.7 62.0 0.635 17389 8138 0.522 0.634
Ratlam 85.8% 54.9% 94.2% 87.8% 0.758 57.0 59.3 0.552 21020 9432 0.588 0.633
Shajapur 83.7% 57.9% 96.5% 93.7% 0.782 57.0 59.6 0.556 17178 8724 0.543 0.627
Mandsaur 83.0% 49.1% 100.0% 89.7% 0.737 58.9 57.9 0.553 19321 9336 0.575 0.622
Dindori 86.8% 69.0% 89.9% 86.2% 0.808 61.6 63.8 0.627 11119 6898 0.415 0.617
Ujjain 80.1% 54.7% 90.4% 81.6% 0.726 62.4 57.2 0.570 20170 8424 0.549 0.615
Balaghat 77.5% 54.1% 93.7% 92.3% 0.739 58.9 58.1 0.553 14614 8274 0.501 0.598
Neemuch 68.0% 36.4% 93.6% 91.0% 0.640 59.9 56.9 0.551 19643 9473 0.582 0.591
Sehore 82.6% 66.7% 92.2% 86.4% 0.793 51.9 57.4 0.494 15888 7396 0.483 0.590
Narsimhapur 91.4% 59.5% 94.1% 91.9% 0.803 59.4 54.4 0.522 17725 6333 0.437 0.588
Damoh 80.0% 54.5% 92.2% 90.9% 0.748 52.6 55.7 0.486 18046 8067 0.526 0.586
Raisen 78.1% 48.0% 95.1% 91.7% 0.723 53.6 57.2 0.507 24907 7295 0.522 0.584
Indore 66.2% 38.6% 93.9% 93.5% 0.653 74.1 65.6 0.736 21205 5113 0.353 0.581
Harda 77.3% 56.0% 90.7% 83.9% 0.730 57.6 53.4 0.500 16931 7781 0.506 0.579
Chhindwara 76.7% 45.4% 88.5% 84.6% 0.680 62.2 58.7 0.584 16102 6945 0.459 0.575
Sidhi 69.6% 45.4% 88.6% 79.8% 0.653 59.9 56.1 0.542 16894 8016 0.514 0.570
Sheopur 76.8% 50.3% 88.0% 77.5% 0.689 60.5 54.4 0.530 17168 7301 0.488 0.569
Seoni 76.7% 54.8% 91.8% 89.3% 0.733 59.4 60.2 0.578 11377 6092 0.378 0.563
Mandla 70.4% 38.5% 96.7% 91.7% 0.657 61.6 63.7 0.627 11419 6601 0.404 0.563
Betul 82.2% 61.9% 95.8% 91.9% 0.787 55.6 53.8 0.490 12872 6214 0.398 0.558
Katni 81.4% 58.0% 94.0% 90.5% 0.766 57.0 58.5 0.545 13822 5568 0.365 0.558
Datia 80.8% 56.8% 94.4% 93.4% 0.769 58.9 51.6 0.491 11848 6044 0.388 0.549
Rajgarh 74.1% 48.5% 83.9% 69.2% 0.649 62.0 53.0 0.520 13831 7576 0.473 0.548
Bhopal 74.7% 47.4% 93.5% 94.0% 0.713 64.9 64.7 0.663 21045 4326 0.265 0.547
Sagar 74.0% 47.8% 91.5% 88.7% 0.700 54.0 54.0 0.483 16828 6602 0.451 0.545
West Nimar (Khargone) 84.7% 64.0% 85.5% 80.4% 0.766 59.8 59.5 0.575 9784 4917 0.289 0.543
Shahdol 74.1% 45.6% 95.5% 93.5% 0.703 57.1 57.1 0.533 13316 5719 0.371 0.535
Dhar 48.8% 25.5% 81.4% 74.0% 0.493 65.8 60.7 0.628 14672 7528 0.477 0.533
Hoshangabad 78.4% 54.1% 90.2% 87.1% 0.732 57.0 54.0 0.503 18937 5165 0.354 0.530
Gwalior 84.1% 55.7% 92.0% 86.9% 0.759 68.8 61.5 0.662 18160 3649 0.161 0.527
East Nimar (Khandwa) 51.1% 31.4% 90.3% 85.2% 0.560 57.6 57.8 0.543 15641 6759 0.448 0.517
Shivpuri 82.9% 62.5% 94.0% 88.8% 0.788 50.8 43.8 0.352 12755 6070 0.397 0.512
Bhind 81.0% 46.8% 100.0% 100.0% 0.753 66.0 54.0 0.562 12938 4052 0.221 0.512
Jabalpur 79.9% 48.5% 93.3% 92.8% 0.728 58.1 57.3 0.543 14627 4315 0.252 0.508
Umaria 76.0% 47.8% 89.9% 86.1% 0.694 56.6 57.6 0.534 11161 4869 0.294 0.508
Rewa 77.8% 51.4% 89.5% 83.7% 0.709 56.0 51.0 0.464 10491 5350 0.328 0.500
Barwani 75.2% 50.9% 74.9% 67.2% 0.645 57.9 57.4 0.541 8875 4872 0.277 0.488
Tikamgarh 74.7% 43.1% 85.1% 78.2% 0.651 57.3 48.1 0.439 11124 5851 0.368 0.486
Vidisha 69.5% 37.4% 93.4% 90.3% 0.651 55.8 53.4 0.490 17232 4703 0.306 0.482
Guna 74.8% 41.5% 95.1% 85.4% 0.673 56.5 50.5 0.463 12580 4719 0.292 0.476
Satna 75.1% 47.5% 91.3% 87.3% 0.696 51.5 47.8 0.401 12404 5195 0.330 0.476
Panna 65.5% 39.4% 89.3% 83.7% 0.628 56.2 50.0 0.454 10984 4965 0.304 0.462
Jhabua 76.1% 44.9% 74.6% 58.5% 0.598 60.5 51.3 0.489 7823 4843 0.263 0.450
Chhatarpur 68.8% 41.0% 90.5% 84.3% 0.648 53.6 47.4 0.411 11595 4640 0.282 0.447
Morena 62.2% 29.0% 99.0% 98.4% 0.624 61.8 53.2 0.528 11174 3651 0.157 0.436
EDUCATION HEALTH INCOME GENDER
Literacy Rate Child Enrolment Education Expectancy of Life Health Adjusted per capita Income RELATED
Index Index income Index DEVELOPMENT
Male Female Male Female Male Female Male Female INDEX
District
THE GENDER RELATED DEVELOPMENT INDEX FOR MADHYA PRADESH, 2001

16

Sissy Jupe’s problem as to how one determines the qualityof life of a human being persists. It is not enough toknow about the availability of resources, but also of their
distribution and quality, and it is not enough to know only ofthe economic resources but equally of the other socialresources that help people conduct their lives. If the quality oflife cannot be neatly set forth in tabular form, because itinvolves complex questions of human perceptions, relations,choices and opportunities, what kind of measurement can betrusted to give a satisfactory account of well being? The ques-tion becomes more complex in considering issues like educa-tion, where the understanding of education can sweep such awide spectrum that while its one end may permit simple formulations, its other end gets increasingly problematisedbecause it raises questions about the meaning and end ofhuman life, the nature of human values, freedom and capabil-ity-questions on which there is no easy consensus, and even ifthere is, no easy forms of assessment.
Education as an expression of human development isseen to have both intrinsic and instrumental value. Such anunderstanding of education requires methods that assess theavailability of educational resources as basic opportunities,and its quality. Quality itself is a complex issue. It requires anevaluation of skill development, and comprehension whichcan range from scholastic aptitudes that are more commonlymeasured to the capacity to analyse and connect practicalapplications and abstract thought which is still not common-ly assessed to the capacity for critical enquiry which is moredifficult and almost never assessed. Whether a person is edu-cated or not, whether a system is imparting quality educationwill thus depend on which end of the spectrum one chooses tolook from.
In attempting to describe the status of elementary andadult education in Madhya Pradesh, the effort has been toassess the distributive aspects on the basis of data available,
and for qualitative aspects to focus on the processes to assesswhether they seek to enable more informed, more profession-ally competent interactions in schools for improving learnercomprehension. Going beyond the question of scholasticcapabilities to assess whether educational initiatives seek topromote greater equity and enlarge the scope of freedom isdifficult because it hinges on issues of a complex societal char-acter. However, being an issue that ultimately defines theessence of education an attempt has been made to examinethe process of educational management to see whether theeducation system redefines relationships within the schooland between the school and the community in a way whichseeks to transfer power to those whose education is in ques-tion. With this understanding, the key indicators of elemen-tary education commonly prevalent have been accepted todescribe the current status. These are discussed below.
KEY INDICATORS OF ELEMENTARY EDUCATION
Key indicators of educational attainment are defined as ● Universal access to elementary schooling ● Universal enrolment of children of age group of 6-14
years.● Universal retention of all enrolled children till they
complete elementary schooling● Universal achievement, implying that all children acquire
satisfactory levels of learning.● That education intervenes effectively for equity.
THE CONTEXT OF MADHYA PRADESH
It is significant that whereas the National Policy on Educationof 1987 (revised 1993) – stipulated Universal ElementaryEducation (UEE), the state documents of policy and pro-gramme do not talk about UEE till about 1994. Prior to 1994,the state’s action for education is evinced in discreet,dispersed, small incremental accretions of schools. These
Universalising ElementaryEducation in Madhya Pradesh
17
“Now, this schoolroom is a Nation. And in this nation there are fifty millions of money. Girl number twenty, isn’t this a prosperous
nation and a’int you in a thriving state?”
“I thought I couldn’t know whether it was a prosperous nation or not, unless I knew who had got the money and whether any of it
was mine," said Sissy, wiping her eyes.
(Charles Dickens, Hard Times)

additions too, are on an ad-hoc basis, without realistic estimates of the size of the problems and the impact of theadditional benefits. No goals are set to measure performanceagainst policy. If discourse is an indicator of government commitment which, because the process of development is acontinuous one it is, then this absence of a consciously articu-lated strategy for UEE is a sort of indicator of the level ofawareness and commitment to UEE. The year 1994 marks thefirst-ever efforts to address the goal of UEE, beginning with anincreasingly growing concern of the state for universal primary education and by 2000 moving up to a concern foruniversal elementary education. It is significant that this con-cern sparks off with the emergence in the state of the electedpanchayats dotting almost each village with a Panchayat RajInstitution (PRI). The idea of universality pushes itself up asan inevitable corollary of the deepening and broadening of thedemocratic process up to the village level. State educationalplanning moves from piece meal provisioning to a concern forAll and a search for strategies that address All. This was challenging in view of historically entrenched problems.
Historical ChallengesThe 1991 census revealed that in Madhya Pradesh, 56 percentof the population was illiterate, 70 percent women were notliterate. Literacy rates were lowest for the scheduled castes andscheduled tribe i.e. 35.1 percent and 21.5 percent respectively.Access to schools was a problem, which had both physical andsocial implications. This was because the norms for opening aschool in a village with population between 250 and 300ignored the scattered and inaccessible habitation pattern ofthe state, where people live dispersed in small household com-munities, one to four kilometres away from the main village.These areas are generally inhabited by socio-economicallydeprived communities resulting in their needs getting sub-merged within standardised norms and strategies. Till 1996,out of 0.11 million habitations in the state, approximately30,000 were without basic schooling facility. A centralised andhighly bureaucratised education management system createdits own distortions. Planning was centralised and so failed toreach out to the needs of the people. This perhaps was bestexemplified in the norms created for access.
Excessive centralisation had also resulted in inadequateacademic support to schools. There was no structural linkbetween the district level academic support structures such asDIETs and the schools. There was no systematic plan for regular in-service teacher training. No effective system ofacademic supervision, feedback and discussion existed at theschool level, the supervisor school ratio being 1:80. Educationof the community had no lateral accountability to the local community. This was perhaps reflected in the dysfunc-tionality of the schools, teacher absenteeism and low quality ofteaching.
Contesting development needs competed for budget
resources affecting allocations for the education sector. InMadhya Pradesh the expenditure on school education wasroughly 10 percent of the total budget and salaries accountedfor approximately 95 percent of this expenditure. These con-straints were reflected in key educational indicators – MadhyaPradesh had poor access (70 percent), low enrolment (72 percent), low retention (65 percent) and low achievements.
A New VisionThe educational vision of the state is shaped by the overallvision of human development in the state. The developmentvision of the state has shown a marked movement away frompeople as recipients to people as agents. The participatoryprocess of development is seen to have as much value as theproduct at the end, and the extent of its inclusiveness is seento be as much an indicator of development. This is true ofeducation. The emphasis on education is creating conditionsthat enable people to come together for their education.Therefore the way a school or a literacy class comes into exis-tence, or gets managed become significant issues rather thansimply sanctioning schools from the top. The relationshipbetween the teacher and the local community becomes signif-icant rather than between the teacher and a government hier-archy on top. Whether all children have equal access to oppor-tunities is as important an issue as the quality of opportunitiescreated. The issue of quality itself gets expanded to mean notjust the text but also the context. School-community interface,the behavioural responses of children teachers and parentstowards the school, social expectations of the school, the senseof inclusiveness and ownership-these intangible attributesstart influencing the notion of quality as much as its more tan-gible features as physical conditions and scholastic measure-ments. This has certain implications. It requires that the statedevelop processes and policies that balance local autonomywith normative standards, professional capabilities with asense of ownership and accountability, structural flexibilitywith common goals.
New OpportunitiesThe main emphasis in Madhya Pradesh, since 1994 has beenon universalising primary education and since 1999 this con-cern has enlarged to encompass universalisation of elementaryeducation. The strategic framework for this was created bynew opportunities in the State.
DECENTRALISATION OF GOVERNANCE
Decentralisation became the premise for development in theState, because it was seen to open up opportunities for newways of doing things and because it was possible to create newpartnerships. The dichotomy between demand and supply,between provider and receiver could be dissolved.Stakeholders could be given greater control and ownership.The single most significant change in Madhya Pradesh’s vision
E D U C AT I O N
18

of development is the recognition of the agency of people ascentral to development. The relationship between state government and people has been perceived as one of partner-ship based on mutual right and responsibilities. This has beenthe guiding vision in the choice of strategies. This vision hasbeen articulated as the new architecture of governancegrounded on decentralisation, lateral accountability andincreasing space for direct community action. The panchayatsystem provided an institutional framework for decentralisa-tion right down to the village level. The state government alsointroduced the system of District Government and recentlythe village government system, further decentralizing thepower of the state level administrative structure to the districtand village level. The implication of this development vision isthat development is measurable not just through creation ofassets and resources, but through the effectiveness of theprocess of empowering communities to make choices andparticipate in creating those assets and resources. If this hasbeen the vision, then how did it express itself in the planningof education especially in its basic levels of ElementaryEducation and Adult Literacy and with what results?
The key objective for educational planning was
decentralisation of educational management. It should beremembered here that decentralisation of educational management here and the attempt to give greater space todirect community participation has been an end in itselfbecause it expresses the belief that strengthening processes ofdemocracy is itself a larger understanding of education.
The effort of the government has been to move increas-ingly towards user groups at the grass root level, and so establishing structures that enable their direct participation inthe management of schools.
The education sector saw a very substantive delegation ofpowers to the local panchayat bodies and Village EducationCommittees (VECs). Recruitment and transfer of teachers,construction of school buildings and procurement of schoolequipment have become the responsibility of the panchayats.The VEC have been reconstituted under the recent amend-ment in the Gram Swaraj Act, further decentralising powers tothe village government acquired a statutory existence and hasbeen entrusted with powers to supervise the local schools. AParent Teacher Association (PTA) has been envisaged for eachschool with substantive powers in school management. ThePTAs are in the process of being set up.
19
E D U C AT I O N
A critical determinant to the quality of schooling is the extent of local own-
ership and accountability and the challenge here is to create institutional
arrangements that help to establish the school as a unit responsive to the
learning needs of the children and the educational aspirations of the com-
munity.
The idea of a Parent Teacher Association (PTA) offers an option in
this direction. The Madhya Pradesh Jan Shiksha Adhiniyam (see Box) stip-
ulates setting up PTA, giving it a legal status. The PTA as the term implies,
consists of all parents of the children studying in the school along with all
the teachers. The PTA elects a President and Vice President from itself. The
Head Teacher of the school is the Secretary of the PTA, which meets once a
month.
Recognising the need to strengthen the school as unit the PTA has
been given powers to facilitate effective school functioning and to make the
school management responsive to the needs of children.
Responsibilities of the PTA include:
● Ensuring cent percent enrolment of children in 5-14 years age group.
● Ensuring regular attendance of students and teachers.
● Assist in the development of school and school assets.
● Present the needs of learners to Gram Sabha for availing of the
benefits/grants from it.
● Assist the teachers in the discharge of their duties to impart quality
education.
● Raise funds for the development of school.
● Motivate illiterates and Neo-literates to wards sustainable continuing
education
The Rights of the PTA include the following:
● Preparing the Jan Shiksha Yojana.
● Maintain, operate and strengthen Shala Shiksha Kosh.
● Decide and recommend a school uniform for the students of the
school.
● Monitor the children’s growth in the achievement levels in the various
competencies of different subjects.
● Supervise and review all development, academic, administrative and
financial activities of the school.
● Decide a cess for the development of the school.
● Recommend withholding salaries of teacher in case of wilful
default.
● Examining and advising on the Public Evaluation Report (Jan Shiksha
Pradivedan)
PTAs are at the initial formative stage. The current paradox is that
good schools with motivated teachers tend to have stronger, more involved
PTAs; and relatively less functional schools have weaker PTAs; whereas the
need for strong PTAs really exists for these weaker schools. Currently, the
character of the school tends to determine the character of the PTA. Till
date, 1,03,546 PTAs have been formed.
A PTA that evolves a reciprocal balance of rights and responsibilities
in the interest of the children’s learning would offer an instance of partici-
patory school management where local ownership and accountability
cohere and the dichotomy between demand and supply, between provider
and receiver dissolves.
Training of PTAs then becomes of critical significance.
Parent Teacher Association: Institutionalising local ownership

A significant strategic choice made by the Governmentfor focused action on primary education through decen-tralised process was the setting-up of Missions on select areasof development to address identified tasks in a time-boundmanner. The Mission on universal primary education designated as the Rajiv Gandhi Shiksha Mission was carvedout from the education sector for focused action on primaryeducation and adult literacy, and subsequently since 1999,made into a mission for elementary education and literacy forthe State. The idea of the Mission, although it started off as aprogramme delivery, bears significance in Madhya Pradeshbecause it has evolved into a sustainable structural arrangement for delivering elementary and adult educationand has sought to move educational management into a moreparticipatory, societal mode.
The emergence of the State government policy of decen-tralisation and support to community processes coincidedhistorically with the entry in the state of a major externallyaided programme in the education sector. This was theDistrict Primary Education Programme (DPEP) introducedin 33 districts of low literacy in the state, in 1994 in its firstphase and 1997 in its second phase. DPEP’s concern for decen-tralised participatory action aimed at improving primary edu-cation was in consonance with the state government’s policy.The strategic framework of DPEP was constituted by elementsof district based decentralised planning and community participation, emphasis on capacity building of teachers,teacher educators, educational managers, space for contextualinnovation, a wide array of strategies ranging from socialmobilisation, material development to infrastructureimprovement and adopting a societal Mission approach toimplementing basic education programme. Decentralisationand the resources made available to the state under DPEP created opportunities for innovative action to address longstanding problems.
By the beginning of the tenth plan, the issue of universalelementary education has been addressed through a compre-hensive programme – the Sarva Shiksha Abhiyan, which willreinforce the work for strengthening the primary base, andbuild the upper primary base.
Decentralised, participatory problem mappingDecentralisation opens up the possibility of alternative lateralthinking critical for development. The problem of develop-ment is to find ways of understanding and articulating theneeds of the community undocumented or obscured by predetermined categories of planning needs. The only way todo this is to encourage shifting the perspective from the gov-ernment to the community. Looked at from the point of viewof the community, the problems may be re-defined, provokinga review of existing assumptions and norms. Solutions willemerge and planning norms move closer to people’s needs-asthe people themselves perceive them to be.
Decentralisation of education has facilitated the introduction of alternative methods of participatory problemmapping. A system of collective micro planning on a habita-tion basis to assess the status of children’s schooling out ofschool and educational & infrastructure facilities was initiatedto enable disaggregated problem mapping. This was designat-ed Lok Sampark Abhiyan (LSA). The first LSA was undertak-en in 1996 and the second in 2000-01. LSA-I aimed at findingout how many children were going to school, what were thereasons for those not doing so, and what was the outreach ofschooling facilities. LSA-I conducted in 1996 covered 55,295villages and contacted 6.1 million households and 10 millionchildren. LSA-I revealed that only 70 percent of the habita-tions had access to primary schools. LSA-I also demolished themyth of universal enrolment. Enrolment was not more than70 percent. Most children reported as dropouts had neverbeen enrolled. The most deprived were girls and children fromscheduled tribes. Another round of household survey was carried out as LSA-II in 2000. It identified middle school gapsand measured the progress of educational indicators at theprimary level and established a benchmark for the upper primary. It has made possible the formulation of a compre-hensive state perspective UEE plan with district specific perspective plans. Lok Sampark Abhiyan (LSA) I and IIbecome important processes for documenting status, drawingattention to gaps and provoking prompt action and demon-strate the efficiency of decentralisation, which is the premisefor planning. LSA I and II make possible the measurement ofattainments of key educational indicators in a comparativeframe of 1996 and 2001 – a period of 5 years, beginning afterthe first HDR that flagged a set of issues for educational planning. The issues that have been addressed on priority bythe state working towards universal elementary education arediscussed below.
Creating access to elementary educationLSA made visible the large access gaps particularly highlight-ing the very deprived areas and groups. Current norms ofschool provisioning stipulated a primary school within a kilometre and upper primary or middle school within 3 kilo-metres of the habitation. LSA also threw into relief the nexusbetween geography and deprivation – both social and economic, since most of the unserved habitations were inhabited by SC/ST groups revealing access to be a social issueand not just a physical one.
a. Access to primary schoolsResponding to the demand for schools, the state Governmentevolved an innovative scheme for universalising access. Thiswas the M.P. Education Guarantee Scheme (EGS). EGS waslaunched in January 1997. The scheme is sensitive to the habi-tation pattern in the tribal areas of the state where peoplereside in hamlets called majras, tolas or phalias that are distant
E D U C AT I O N
20

from one another. A historical backlog of about 30000 accessless habitations could be eliminated in 2 years time. TheEGS also aimed at time bound provisioning of schools andwas therefore postulated on Government guaranteeing aschool in 90 days. EGS works through a tripartite sharing ofresponsibilities between panchayats, community and stateGovernment. Now every habitation in the state has a school-ing facility within a km. By August 1998 Madhya Pradeshdeclared universal access to primary education (Annexure-1).The benefits of the EGS have gone to the backward areas andthe deprived children. About 40 percent of the EGS schools arein tribal areas, 45 percent children are from ST families, 91percent children are from SC, ST and other backward classes.Universalisation of access through EGS clearly indicates that itis not just a geographical outreach, but also a very significantsocially inclusive strategy.
The state government’s intervention has been very significant in creating access in the primary sector where thegovernment’s share is 84 percent. The government policy forprivate schools is liberal. Anyone can open a school, with anaffidavit, since no prior permission is required. The idea is toencourage a wide network of institutions for primary education.
b. Access to upper primaryA gap of about 7575 schools was estimated as of 2000. 7575schools are being upgraded into upper primary (Annexure 2).This will ensure universal access to the upper primary, implyingthat each primary school has an upper primary schooling facility within 3 kilometres. In the case of upper primary, 66percent of upper primary access is through government fundedschools and 34 percent through private.
The issue of qualityThe issue of quality has been comprehensively defined toinclude diverse factors that impact on school effectiveness.This includes the following:● Physical infrastructure ● Academic inputs and processes● School management● Physical infrastructure – The quality of learning space
Physical infrastructure – The quality of learning spaceEmphasising decentralised construction of school buildings,encouraging community participation, has resulted in lowering construction cost. Programmes like DPEP have con-tributed towards gap filling in the physical infrastructure. 236
21
E D U C AT I O N
Discussion on issues of universalising elementary education of quality in a
cost-effective manner will require moving beyond certain fuzzy categories
which trap the delivery of universal elementary education such as ‘Formal’
and ‘Non-Formal’, —‘teacher and para teacher.
Educational initiatives would have to be understood and assessed in
terms of their objectives and context rather than by terms like formal school
and non-formal centre in the way they are currently used to denote superi-
or-inferior systems. Some attributes derived historically have been associat-
ed with the term formal school. These are four-to-five hours of schooling,
clearly marked grades with fixed duration, usually of a year each, a fixed
curriculum and an affiliation to a recognised public system of examination
and certification. That this is an inadequate description and in no way a def-
inition is evident. Within a broad framework, there are differences
expressed in the form of management, materials, teachers, infrastructure,
academic processes, system of evaluation and promotion. According to the
Oxford Advanced Learner’s Dictionary, the word ‘formal’ includes a defini-
tion of formal “education or training received in a school, college or uni-
versity with lessons, examinations etc., rather than gained through practical
experience.’ Looked at like this, all non-formal centres, the government at
State or the Centre has so far supported are highly formal schools. The
terms formal and non formal will have historical and relativistic connota-
tions and should not be used as judgemental categories.
In this context, the EGS that Madhya Pradesh introduced in 1997 per-
ceives the school as a process that evolves towards acquiring attributes of
higher quality, rather than a static entity reified as formal and non-formal.
The second set of oppositional terms associated with the formal and
non-formal debate, is the teacher/ para teacher issue. If the teacher is meant
to be one who is on a permanent official pay roll, then private schools or
most American universities who employ people on contract would be said
to have para teachers on roll. If teachers mean people paid officially fixed
salary scales then the same situation would follow. If teacher means a cer-
tain level of remuneration decided by Pay Commissions then again, several
teachers in private schools would become para teachers. If teacher means a
full time teaching person, then several teachers called para-teachers would
deserve to be called teachers. If qualifications are stipulated, then again a
large number of teachers would become para teachers, because eligibility
criteria are not uniform either among state governments, or among private
schools. Conversely several so called para-teachers would become teachers
because they have the same qualifications as those of the official teachers
such as the gurujis of Madhya Pradesh’s EGS. If modes of recruitment are
considered then, again a large number of para teachers become para teach-
ers because recruitment modes and procedures are widely differing among
states and among private institutions.
The dichotomy between school and centre, teacher and para teacher
would have to go. The focus should be on children going to schools assum-
ing the terms to indicate the diverse forms that schools can and ought to
take, rather than on fragmenting children into categories going to formal
schools and NFE centres. This is not a matter of semantics. It perpetuates
cumulative deprivations for those children who most need the learning
opportunities that are available.
Myths like ‘Non-Formal’ and ‘Para Teachers’

Block Resource Centres (Teacher Training Centres) have beenconstructed in 33 DPEP districts to facilitate teachers’ trainingat the block level. A big gap of 20000 schools without buildings was covered in a space of five years. Decentralisedconstruction through village level committees and cost effective techniques have characterised such construction.
Drinking water facility, toilets (common and for girls)have been provided to the government school through conver-gence of resources and community contribution. Percentage ofschools with drinking water facility has increased from 57 percent in 1997 to 66 percent in 2000-01. Despite the effortsthat have been made to mobilise resources from different programmes to provide school buildings large gaps in infra-structure persist. Annexure-3 shows the status of schools without buildings and without drinking water and toilets.
The quality of academic inputsKey issues in the improvement of the quality of academicinputs are of resources, teacher provisioning and teacher qualification, curriculum and teaching learning materials,capacity development of teachers, availability of academicsupport to schools and teachers and the system of evaluation.
a. Provisioning of teachers (Pupil-Teacher Ratio-PTR)A suitable pupil teacher ratio is necessary for ensuring qualityof learning. The system of multi-grade teaching affects theefficiency of teaching learning reduces time for transactionand specially for process of continuous evaluation alternativefor diagnostic and remedial action. Comparison of data ofenrolment and teachers of different years shows a rising trendin PTR because of increase in enrolment.
The State government has taken a number of decisionsabout teachers. First, the cadre of teacher appointed on a per-manent basis on a government pay scale has been brought toan end. In its place teachers are appointed on a contract basis.Teachers are employed by panchayats on a fixed contract,which has been pitched at a lower level than the old scale. Thishas been the corollary to the panchayat-based decentralisation.The eligibility criteria, in terms of minimum educational qual-ifications have been the same as for the earlier lot of teachers.There are 3 main types of teachers i.e. the traditional assistant
teachers; teachers appointed by local bodies comprising of theShiksha Karmi and Samvida Shikshak who are the contractteachers and the Gurujis of EGS schools. The latter two typesare appointed against schools and are not transferable. EGSgurujis are chosen by the local community and are local residents. The same minimum educational qualification isapplicable to all but the recruitment procedure differs whichaffect their perception of themselves as teachers. The ShikshaKarmis and Samvida Shikshaks are accountable to block anddistrict level panchayats bodies, while gurujis are accountableto the local community. Fixing teacher remuneration at a lowerlevel and devolving teacher recruitment to block panchayatsled to a rapid provisioning of teachers. Sample data reveals thatthe new policy towards teachers has encouraged a greater num-ber of women and persons from SC and ST and OBC groupsto enlist as teachers. This can be attributed to three reasons.Local recruitment, therefore greater dissemination of informa-tion and awareness, recruitment against school and thereforenon-transferability of service, broader-based character of pan-chayats as recruitment agencies therefore greater sensitivity toissues of caste and gender.
b. CurriculumThe curriculum of primary level was reviewed in 1994 tointroduce elements of competency based, activity based andchild friendly pedagogy. Based on the new curriculum, thestate has now introduced new teaching learning materials atthe primary stage. Textbooks are self contained and each text-book is divided into a number of lesson covering severalteaching sessions, each of which comprises signposting to thespecific competencies addressed, student material and teacherguidance in the form of footnotes. The textbooks have a shelflife of five years, after which they are revised in the light ofexperience, evaluation and changing ideas about teaching andlearning. Review of the curriculum and materials for theupper primary is in process. The need for a rich pool of usefulteaching learning materials as alternative learning sourcesbeside the textbooks, has been recognised. This is being servedthrough a school library movement implemented in a phasedmanner. School libraries have been established in 982 JSKsand 8582 EGS schools. Procedures are also being establishedto open up the school libraries to community after schoolhours, by integrating them with the libraries established underadult education programmes and to encourage systems ofcommunity ownership and user fee.
The potential of information technology has been recog-nised to enrich educational processes. A programme for Computer enabled education has been introduced at theelementary school level to provide computer – enabled educa-tion to rural school children. 648 Jan Shiksha Kendras havebeen covered under this programme named Headstart 2429teachers have been trained in two phases. Positioned in ruralschools Headstart aims at bridging the digital divide. A
E D U C AT I O N
22
*AIES 1993 82.46 1.78 46
** Year 2000-01 69.42 1.46 47
Year Number (in lakhs) PTR
Enrolment (I-V) Teachers (Primary)
* Including Chhattisgarh
** Data of government schools of M.P.
The present PTR at the upper primary level is 38.
Table 1

syllabus for Headstart lessons has been developed.Educational software on Language Hindi and English,Mathematics and Environment Sciences has been developedto help the teachers reinforce textual materials and encouragechildren through interactive learning. These multi-media richlessons aim at strengthening learning competencies andexpand the knowledge base of students and teachers anddevelop computer literacy along with it.
c. Teacher EducationThe variety of teachers poses challenges for training:● Differences of training requirement get aggravated, and
that too, on a very large scale● The state government has not had a policy of pre service
training as a mandatory pre requisite for teacher recruit-ment. Therefore quite a large number of teachers and specially shiksha karmis, contract teachers and guruji donot have pre service training. This creates a need for care-ful perspective planning for developing their capabilities.
● In addition there are pedagogical challenges created byfirst generation learners and heterogeneous multi age –multi ability groups.The strategy for training therefore has been sensitive to
these complexities. Trainings have focused on the primaryteachers raising the number of teachers trained from an average of 473 per district per year to 2731 per district per yearfrom 1994 to 2001. Average teachers trained per year since1995 have been approximately one lakh. The mode of distancelearning has been used to supplement teacher training. 4050teachers have been trained through this mode, on an averageannually since 1996. Teacher training till recently tended to behighly centralised. Training modules were developed at thestate level and run uniformly throughout all districts. Over therecent years because of continuous decentralisation ofprogramme management and focus on learner evaluationespecially in terms of learning outcomes, the need for decen-tralised and contextualised responses to teacher trainingrequirements was acknowledged. The state teacher trainingpolicy now has decentralised basic inductional and in-servicetraining to the districts. Districts map and analyse their training needs, and develop and implement their trainingplans. This policy has been put into effect full scale for the year2001-2002. For the professional development of existingteachers, new contract teachers and gurujis, a decision hasbeen taken by the State Government to reserve the seats ofD.Ed and B.Ed. courses in Government institutes for them.
d. Learner evaluationThe State Government followed the policy of non-detentiontill the upper primary level with only the District BoardExaminations at the end of the Vth and VIIIth classes. This pol-icy was changed in the academic year 2000-2001 wherein anannual examination had to be cleared for promotion to the
higher grade. The new policy of learner evaluation stipulatesquarterly tests conducted internally with cumulative creditsclassifying achievements under grades. Diagnoses of assess-ment outcomes are expected to be followed up by remedialaction. This is to be done at all levels starting from school toJSK, Block, District and State level to evolve clear methods toprovide academic support to the school. Difficulties capturedthrough this learner evaluation analysis are expected to enablethe teachers to focus on problem areas so that remedial actioncan be taken at the school level. Periodic external evaluation isplanned in order to create a more detailed understanding offactors that promote quality of learning. This is expected toenable the teacher to undertake remedial action for lowachievements.
HEADSTART: Improving quality of learningthrough Computer Enabled Education
Head Start is a programme for Computer enabled education introduced
in selected government elementary schools in rural areas. Headstart aims
at improving the quality of education by providing CD based Multi
Media Rich Lessons (MMRL) for the use of children and teachers based
on an analysis of their knowledge base and learning needs. These
multi-media rich lessons aim at strengthening learning competencies and
expand the knowledge base of students and teachers and develop
computer literacy along with it.
The educational software is developed in-house by the Rajiv Gandhi
Shiksha Mission based on research into curriculum, materials, teaching
learning processes and knowledge levels leading to the identification of
concepts that pose difficulties in transaction as well as areas for knowl-
edge enrichment. The challenge is to use technology shift for a paradigm
shift in pedagogy, by making it interactive, interrogative, self-learning and
discovery through error, enquiry and reasoning. Since Headstart aims at
quality improvement, it is not seen as a stand-alone intervention, but an
integral part of a total teaching learning process within built-on-line - off-
line activities to be evaluated for assessing the quality of learning
outcomes.
A syllabus for Head Start has been formulated to guide material
development. Educational software on Language, Mathematics and
Science has been produced and provided to schools. The distinctive fea-
tures of Headstart are customised culturally familiar educational software
in Hindi, Mathematics, Science and English emphasis on learning
through computers whereby computer literacy is an inevitable spin-off
and integration with a total teaching learning process. Currently
Headstart is located in 648 elementary level government schools that also
act a school cluster resource centres (Jan Shiksha Kendras) where teachers
meet once a month for academic sharing. It is poised to expand to 2070
Jan Shiksha Kendras by 2003 and cover the remaining 2000 Jan Shiksha
Kendras in 2004. 4000 Teachers have been trained on the technical and
academic aspects of Headstart. A Headstart unit includes 3 computers,
printer, UPS and ancillaries and costs about Rs. 0.14 million.
23
E D U C AT I O N

e. Decentralisation of Academic SupportTo strengthen the academic support system, DPEP helped tocreate a bridge from the school to the academic institutions atthe top by establishing 236 Block Resource Centres (now designated Janpad Shiksha Kendra) at the block level, and4325 Cluster Resource Centres (now designated as Jan ShikshaKendra) located within primary or middle schools and servinggroups of 10-15 schools. The Jan Shiksha Kendra (JSK) has anacademic coordinator Jan Shikshak who is a senior teacher.The Jan Shikshak is expected to visit the schools for purposesof academic monitoring and facilitates teacher discussions atmonthly JSK meetings. This has made possible the regularsupervision of schools, reducing the ratio of supervisors toschools from 1:80 to 1:20. The Jan Shiksha Kendras have thepotential to grow as peer support hubs at levels closer to theschool context.
f. Restructuring of academic support institutionsRestructuring of academic support institutions has beenacknowledged as a key area of concern and the state has initi-ated review of the academic requirements of key institutions.The state government has recently undertaken professionalreorganisation of academic support institutions (SCERT andDIETs) seeking to restructure these institutions on the follow-ing premises to create the necessary pre-conditions of qualitysupport.● Clear delineation of academic criteria comprising of
knowledge specialization, academic qualifications, schoolexperience and evidence of professional development forthe purpose of staffing.
● Rotational placement between academic support institutions and school to ensure mutual enrichment oftheory and practice.
● Emphasis on subject faculty structure to ensure that corecurricular inputs are designed and implemented by competent professionals.While technical and financial support from the state to
the district level (DIETs) will continue, district level academicsupport institution are to be made laterally accountable to districts for management purposes. DIETs will be responsiblefor the academic planning of their districts, ensuring itsimplementation and quality assessment.
SCHOOL MANAGEMENT
School Management has been decentralised to the district andsub district levels. Recognising the need to strengthen theschool as a unit, the PTA and the VEC have been given powersto decide on issues that impinge on the daily functioning ofthe school, such as school timing, local holidays, monitoringthe regular functioning of the school. Teachers are nowexpected to be accountable to the local PTA and the VEC, Thisis expected to make the school management responsive to theneeds of the children.
Emphasis has been given to each school to develop its owndevelopment plan with participation of parents. This wouldthen be the basis of the village education plan and upward toget integrated into a District education plan. Teachers areexpected to help in developing village education registers torecord and track each child’s movement through school.
Decentralisation of school management and the policy tomake it accountable to the local structures such as PTA, VECand panchayats is expected to help in enabling school management to orient itself to the educational needs of thechildren. However, the process of institutionalising these lateral relationships is new and needs to be firmly groundedand strengthened for it to yield expected results that canbecome effective indicators of the transition of school managed as end –links of a bureaucratic machinery to becom-ing community schools locally managed with sufficientautonomy, such as is evident in relatively greater measure inthe state’s Education Guarantee Scheme (EGS) schools. In theEGS schools, the local community chooses the teacher, gets agrant from the state government to run it’s school and forms
E D U C AT I O N
24
Modalities of EGS
EGS is a demand-based; time bound strategy to universalise access. It has
enabled us in reaching out to the un-reached in quickest possible time.
The key elements of the EGS are as follows:
● Under EGS, the government gives guarantee to provide a primary
schooling facility to the children in a habitation where there is no
such facility within a kilometre within a period of 90 days of receiv-
ing a demand for such a facility by the local community.
● Community without a schooling facility within a distance of 1 km
and 40 children (25 children in case of ST population) can demand
schooling facility.
● Community chooses teacher, provides space and supplements
resources.
● Government trains teachers, provides free Teaching-Learning
Material and school contingency, academic supervision and seed
money for infrastructure.
● Government releases its grant to EGS school account maintained at
village level.
● The EGS operates on a decentralised basis through collaboration of
the State Government, local bodies and the community.
Decentralised management of EGS is done by local Parents Teacher
Association.
● The EGS teacher is designated as 'Guruji' and is provided for a
group of 40 children and in tribal areas for a group of every 25
children. If the number exceeds 50 then another Guruji can be
appointed so as to maintain the teacher-pupil ratio near 1:40.
The academic level and progress of each child is evaluated on a
continuous and periodic basis. Continuous evaluation is inbuilt into the
teaching learning material and also imparted through teacher training.
There is also a provision of Quarterly exams.

a PTA that manages the school completely, academic supportcoming in from the Jan Shiksha Kendra.
INSTITUTIONAL RESTRUCTURING
The management of education has been steadily decentralisedboth vertically and laterally. Decentralisation has createdopportunities for Institutional Restructuring. Prior to decen-tralisation educational management was characterised bymultiple agencies with scant coordination and since decision-making was centralised it actually created multiple sources ofauthority located on top leading to a situation where directivesabounded, but action at the end-point became unconnected,if not conflicting. Decentralisation makes possible coordina-tion and convergence and as this increases the closer onemoves towards user-groups, direct participation, and localself-management. Decentralisation because it re-locates pow-ers and functions and necessitates a realignment of structures.In the elementary education sector, substantive powers havebeen delegated to the panchayats, District Planning body andnow to the VEC and PTA. The role of administrative and technical bodies is now seen as being one of laying downbroad parameters and norms, facilitating, monitoring, andproblem solving and resource-support. With decentralisationtransferring powers locally, and allowing flexible planning, coordination and convergence of structures for ensuring that acommon perspective informs all action was perceived as anecessary condition. Accordingly, administrative arrange-ments for integrating structures have been initiated. At thestate level, Elementary and adult education programmes havebeen brought under one agency designated as the RajyaShikhsa Kendra that has been created by bringing theDirectorate of Adult Education, the state project offices forvarious projects, and the SCERT together into one commoninstitution. District and block level elementary and adult education structures have been integrated as Zilla Shiksha andJanpad Shiksha Kendras so that the different agencies involvedin planning and implementing these programmes cometogether for coordinated action. The unit for school supportthat is seen to be the most critical is the school cluster resourcecentre or the Jan Shiksha Kendra.
Institutional restructuring which is the most criticalpremise of educational reform is being effected through inter-nal rationalisation of resources and does not require any additional financial support. In fact, it has led to a better utilisation of existing resources.
KEY INDICATORS: STATUS OF ELEMENTARY EDUCATION
As a result of these strategies, key indicators reflect the follow-ing status of the participation of children in schools.
Enrolment in Primary schoolsGross Enrolment Ratio (GER) has risen from 76.5 percent in1996 to 96.2 percent in 2000-2001. The GER of girls has risen
from 70.7 percent in 1996 to 94.3 percent in 2000-2001 clear-ly indicating that there has been a rise in girls’ enrolment.There has been significant increase in GER of ST, which hasrisen from 78 percent in 1992 to 91.0 percent in 2000-2001.The gap in GER of boys and girls has also narrowed from 25in 1992 to 10.8 in 1996 to 3.6 in 2000-2001, indicative of thefact that girls’ enrolment has increased in the past eight years.
In the State, presently 82.64 lakh children are enrolled atthe primary level. Out of these 37.78 lakh are girls, which is45.7 percent of the total enrolment. The increase in enrolmentis a result of a series of mobilisation activities such as MahilaShiksha Abhiyan, which focused on enrolment of girls,
25
E D U C AT I O N
JAN SHIKSHA ADHINIYAM : An Act for creating public accountability for quality
M.P. Jan Shiksha Adhiniyam, 2002 is shaped by the vision of education as
a collaborative process of the teachers, learners and the local community
and the role of the government as facilitating this process towards the
twin goals of equity and quality. The Act recognises the right of every
child to basic education and seeks to remove impediments to access and
participation in schools both by improving delivery as well as by creating
social pressure. Parental responsibility for compulsory education upto age
14 is enforceable by Gram Sabha. Strengthening decentralisation, the Act
lays down clearly the roles and responsibilities of key agencies : parents,
teachers, local bodies and government. A crucial role is assigned to the
PTA to be set up for every school.
The aim is to foster processes that help school emerge as a strong
unit accountable to the local community of parents, with all other
structures performing the role of school support institutions. Perceiving
academic and administrative functions as constitutive of educational
management, structural convergence has been effected at all levels of
support institution for enabling holistic planning for qualitative learning
outcomes.
Human resource support has been enlisted at school-level through
voluntary teachers (retired) or Shiksha Bandhu. Incentive framework for
teachers and students has been stipulated. Teachers are not to be normally
deployed for non-teaching tasks. Private Sector has been encouraged. No
prior permission required to open schools upto middle level.
To make planning responsive to the local educational needs, a jan
shiksha yojana emanating from the PTA level is envisaged. Educational
funds at the school, district and state level designated as shala, zilla and
Rajya Shiksha Kosh are to be set up for enabling mobilisation of additional
resources. Public education Report (Jan Shiksha Prativedan) will be
presented on the status of education, specially learning outcomes, every
quarter to the PTA and to the District Government and annually to the
legislative assembly, constituency wise. These reports are expected to feed
back into the jan shiksha yojanas for incremental improvement; thereby
creating an organic relationship between planning and evaluation,
placing their outcomes in public space for reinforcing people’s right and
the state’s responsibility for better quality education.

especially SC and ST girls. These resulted in the additionalenrolment of approximately 14 lakh girls. The opening of EGSin areas, which were deprived of education facility, also result-ed in enrolment of children, who otherwise were not enrolledin schools or were not regular in attending school because oflong distances. There are 12.2 lakh children enrolled in EGSschools, out of these 5.7 lakh are girls which is 47 percent ofthe total children enrolled in EGS schools. Similarly the number of tribal children enrolled in EGS schools is 5.4 lakh,which is 45 percent of the total children enrolled in EGSschools.
District wise details of target population, enrolment andGER at primary level are given at Annexure–4.
Enrolment in upper primary schoolsThe GER at upper primary level is 70.3. The enrolment atupper primary level is 23.14 lakhs, out of which 9.18 lakhs aregirls. District wise details are given at Annexure-5.
Retention Even while enrolments have improved the problem of reten-tion persists. About 70 percent children survive till the pri-mary cycle, 50 percent survive the upper primary cycle andonly 40 percent the higher secondary. Although the transitionrate from primary to upper primary level is 97 percent, only50 percent of them complete the upper primary level. Girls arethe biggest casualty. Proximity of the middle school is an
important factor. It is hoped that with the universalisation ofthe middle school, completion of the upper primary cycle willimprove.
OUT- OF -SCHOOL CHILDREN
District data captured in the habitation wise household contact surveys in 1996 and 2000 show that the percentage of Out- of- school Children against the target population has decreased from 29.3 percent in 1996 to 11.2 percent in2000-2001.
● Out-of-school Children in age group of 6–14 years are13.28 lakh, which is 11.2 percent of the target population.Annexure-6
● Out-of-school children comprise of the never enrolledand dropout children. Of the total out-of-school children,the never-enrolled children are 70.7 percent of the totalOut-of-school children & drop-out children are 29.3 percent of the total out-of-school children
● Dropouts at primary level are 2.81 lakh, whereas at middle level it is 1.08 lakh.
● Out-of-school girls are 7.2 lakh, which is 54.5 percent ofthe total out-of-school children.
● Never-enrolled children are 9.4 lakh; out of which 5.2lakh are girls, which is 55.3 percent of the total never-enrolled children.
● Dropout children are 3.88 lakh; out of which 2.04 lakh aregirls, which is 52.6 percent of the total dropout children.Broad reasons for children being out of school, either asnever enrolled or drop out are as follows:
● About 80 percent girls remain out of school due to thefollowing five reasons i.e. sibling care (24.6 percent),engaged in economic activities (18.5 percent), cattle grazing (13.6 percent), weak financial condition (13.6percent) and migration (9.3 percent).
● About 86 percent boys remain out of school due to thefollowing five reasons i.e. engaged in economic activities(21.6 percent), cattle grazing (22.4 percent), sibling care(15.6 percent), migration (11.5 percent) and weak financial condition (14.4 percent).
● Other factors responsible for children being out of school
E D U C AT I O N
26
In percentage 24.4 35.2 29.3 9.4 13.3 11.2
In lakhs 13.15 16.04 29.19 6.05 7.23 13.28
Out -of -school children Out -of -school children
against target population against target population
LSA-I (1996) LSA-II (2000-2001)
Boys Girls Total Boys Girls Total
Source: LSA 1996 and LSA 2000-2001
Table 3
GER as per LSA
100
80
60
40
20
0Boys Girls Total
LSA 1996 LSA 00-01
81.5
97.9
70.7
94.3
76.5
96.2
Source: Lok Sampark Abhiyan I and II, Rajiv Gandhi Shiksha Mission,
Government of Madhya Pradesh
81.5 70.7 76.5 97.9 94.3 96.2
GER as per LSA 1996 GER as per LSA 2000-2001
Boys Girls Total Boys Girls Total
Source: LSA 1996 and LSA 2000-2001
Table 2

are social belief and parental reluctance to send childrento school, especially girls, lack of upper primary educational facilities (8.0 percent), prolonged illness orhandicap (2.4 percent) and school environment not conducive (1.6 percent).
● Social belief and parental attitude is responsible for ahigher girls’ out of school (8.24 percent) in comparison toboys (3.1 percent). Similarly, migration affects the boys(11.5 percent) in comparison to girls (9.3 percent)It is evident from the data above that having achieved the
goal of providing access to primary education facility, theproblem of out of school children still persists. This is moreacute for the upper primary level. The upper primary datashows that gross enrolment ratios are low. It is expected thatthe opening of middle schools in close habitations willimprove the transition rate from primary to upper primary.These cases require specific attention for effective interven-tions. It is evident that the major reasons for children beingout of school whether as never enrolled or drop out acrossboth genders are economic (75 percent). Some schoolingincentives are being provided to meet the cost of some factorsaffecting school participation. Incentives like book-banks, freeeducational materials, uniforms are being provided focusingon SC/ST children and girls of economically backward families etc. subject to resources Community mobilizationand making the school flexible in its operation have provedeffective for increasing enrolment. Largely, however economic, health and cultural factors are exogenous to theeducation sector and require convergence inputs from sectorsthat deal with livelihood issues. Health reasons too are exogenous to the education sector and require clear targetingof health programmes.
LEARNER ACHIEVEMENT
Sample studies have been used to indicate trends in learningachievement levels.
NCERT designed tests were conducted on a sample basisin 950 schools in 19 DPEP districts between the years 1995 to2000 for the primary level. These were the base, middle and terminal assessment test (BAS, MAS and TAS). These indicatea progression from mean achievement levels over a period of5-6 years. From 1995 onwards; the mean achievement scores inLanguage moved from 46.04 percent to 75.75 percent for classI and from 31.75 percent to 60.31 percent for class IV and forMath from 40.39 percent to 76.04 percent for class I from 27.84percent to 52.12 percent for class IV in phase I districts (fromBAS to TAS). What the NCERT study shows is that while therehas been a positive trend towards improvement. Nevertheless,it is a matter of concern that the achievement in mathematicsby the time the child reaches class five is not more than 50 percent, and not more than 60 percent for language, creating asituation where the child would move onto upper primarywith competence over only half the curriculum.
Baseline and Midterm assessment survey was conductedin 15 DPEP II districts in 1997 & 2000 respectively. These surveys indicate a progression from mean achievement levelsover a period of 3 years. From 1997 onwards; the meanachievement scores in Language moved from 38.76 percent to54.95 percent for class I and from 31.99 percent to 43.05 per-cent for class IV and for Mathematics from 34.09 percent to62.07 percent for class I from 26.65 percent to 35.78 percentfor class IV in phase II districts (from BAS to MAS).
Factors responsible for unsatisfactory academic achieve-ments can be identified as being both academic and non academic. Among the non-academic factors the commonest isthe absence of the teacher from the classroom mainly on non-teaching tasks, which affects the time on transactionand completion of the course. It has also emerged that a large number of children do not have textbooks. Although the state has a commitment to provide free textbooks the resources required to support this do not match the need. Among the academic factors attention needs to be given to deploying qualified teachers for appropriate tasks,the professional development of teachers, improving classroom processes and learner evaluation systems and academicsupervision.
EQUITY
The issue of equity is central to education both because thedelivery of education should target the disadvantaged grouptraditionally deprived of the opportunities of education, andbecause education is understood as a process of empower-ment. This involves a distributive aspects and a qualitativeone. The distributive aspects, in terms of the spread ofresources, have been measured through indicators of accessand participation. Primary schools have been establishedwithin a k.m. of each habitation, with more than 50 percent ofthe EGS schools coming up in tribal areas. This universalspread of primary education gives every child the opportuni-ty to access basic education. In addition there has been animprovement in the share of girls’ participation in schools andthe gender gap in children in and out of school has reduced.The number of girls out of school has been reduced from 35.2percent in 1996 to 13.3 percent in 2001. Table 3 shows thereduction in the difference between out of school girls and boys from 11 to 4 percent. The Table 4 also shows thereduction in the difference between girls and boys in terms ofenrolment.
REDUCING GENDER GAP IN ENROLMENT (LSA-I(1996) AND
LSAII (2000-01)Indicators for measuring equity in participation are captured in Annexure-9
Sample studies undertaken by IIM Lucknow, on thebehest of GOI also indicates the positive trend of equity indicators.
27
E D U C AT I O N

In terms of quality sample data of periodic tests (BAS/MAS/ TAS) tests show that the percentage increase in theachievement levels of girls and boys is almost on par.Annexure-10
KEY EDUCATIONAL INDICATORS ARE CAPTURED IN THE TABLE BELOW
KEY CHANGES IN THE STATE’S EDUCATIONAL PERSPECTIVE
One could attempt to assess the performance of the state andthe tasks ahead for it, based on the kind of policies, and infor-mation discussed above. The state has succeeded in establish-ing a decentralised management of education, especially pri-mary education right up to the village level. The focus is now
on empowering the school as a unit. Issues of decentralisingacademic support to schools have acquired significance andstructures for academic decentralisation have been created. Itshould now be possible to address a holistic agenda for mak-ing the school effective for quality education because ofdecentralisation. Key issues of quality now are getting posi-tioned centrally. Planning now has a large database rooted atthe habitation level. The issue of primary education has beenlodged in a regime of rights. Rights themselves have been seenas civil society covenants not just as legalistic provisions, mak-ing the whole issue of universal education a pragmatic com-mitment moving towards the fulfilment of a normative vision.The understanding of community participation has deepenedand this has expressed itself in different institutional formsmoving from elected representative structures of the panchay-at type to VEC, to collaborative structures as PTAs, to directcommunity participation institutions as the Gram Sabha andthis has expressed itself significantly for education. Thisunderstanding of community has also influenced the percep-tion of resources as meaning not just financial but humanresources possibilities for innovative action on a large scale.
TASKS AHEAD
With the outreach of primary schools being universalised andthat of upper primary also being universalised, the key agendafor the state is to focus on (a) special efforts to bring out-of-school children within the fold of education. b) improvingretention completion and transition with special focus onequity. c) improving achievement levels.
This really implies a very comprehensive agenda for qual-ity reform. The broad strategy for this would be underpinnedby (a) strengthening organic bonds between the school andthe community by enhancing school accountability to thelocal community and ownership and support to the school bythe community, (b) improving academic inputs throughdecentralised institutional reform, content enrichment, evalu-ation reform and capacity development, (c) capacity develop-ment of educational management personnel by reorientingtowards school as unit, retraining on working with communi-ty, professional development of necessary skills, like informa-tion analysis, planning and monitoring, problem solving andremedial action.
Thus, the challenges that MP has are improving the qual-ity of education, bringing back the still out of school childrento school, and improving retention in the whole school cycle.
Focus on children-out-of schoolA clear focus is now required on out of school children i.e. thenever enrolled and drop out categories. District specific data isnow available with the districts for decentralised planning forchild specific targeting at the local level. These districts requirespecial focus. However, an interesting feature is that the out ofschool factors are more or less similar in all districts in their
E D U C AT I O N
28
Literacy Rate 2001 76.80 50.28 64.11
Gross Acess Ratio (GAR) Primary 100%
Gross Enrolment Ratio (GER) Primary 97.9 94.3 96.2
Gross Enrolment Ratio (GER) Middle 74.6 64.6 70.3
Retention Rate (RR) Primary 91.6 85.8 88.9
Drop-out Rate Primary 8.4 14.2 11.1
Grade Completion Rate Class I-V (GCR) Primary 65.2 58.0 62.0
Male Female Total
Boys Girls Total
Source: Lok Sampark Abhiyan and DISE Data
Educational Indicators (2000-2001)
GER Boys 81.5 97.9
GER Girls 70.7 94.3
LSA-I (1996) LSA-II (2000-01)
Source: LSA 1996 and LSA 2000-2001
Table 4
Reducing Gender Gap in Enrolment
100
90
80
70
60
GE
R
LSA-I (1996) LSA-II (2000-01)
GER Boys GER Girls
81.5
70.7
97.994.3
Source: Lok Sampark Abhiyan I and II, Rajiv Gandhi Shiksha Mission,
Government of Madhya Pradesh

character and relative significance when viewed at the districtlevel. This suggests that variations of critical significancewould occur not only at the inter district level or regionallevel, but actually substantively at sub district levels, possiblein pockets or among specific social or economic groups. Thisindicates the need for further decentralisation of planningbelow the district to the habitation/ village/ gram panchayatand school cluster levels where child-specific, family-focusedtargeting is possible. The newly instituted gram swaraj provides the framework for such habitation specific planning.In this context setting up Parent Teacher Associations (PTAs)and mobilising PTA and VECs through capacity developmentprogrammes and control of resources as well as decision-mak-ing could be a major strategy for child wise tracking. The PTAwould also have the power to determine school timings andholidays in order to make school responsible to be local cultural and livelihood requirements. The PTA would beencouraged to raise resources locally so that child specificinterventions can be given to out-of-school children.
Decentralisation and community control over develop-ment processes makes possible inter sectoral convergenceneeded to address, health and socio-cultural factors effectingchildren’s schooling. Decentralisation can facilitate conver-gence to ensure health services for all the children. Movingtoward decentralised management for Health care, the StateGovernment has launched a scheme called Swasth JeevanSewa Guarantee Yojna. The scheme aims at improving the status of rural health care by ensuring the provision of basicdeterminants of health: safe drinking water supply, sanitation,nutrition, immunization, ante-natal care, training of the localhealth workers. Convergence with this scheme would enablebetter targeting of better health enabling services for children.Mid day meals could prove to be an effective incentive especially for children belonging to families of low economicstatus of the effective use of MDM gets monitored by PTA andfor ensuring its timely distribution to the children.Convergence can also be sought of programmes of womenempowerment. Convergence with programmes of self-helpgroups to some extent would also help in addressing economic reasons influencing enrolment and attendance.
The main challenge for MP is the education of the poorchildren. Despite the universalisation of access, and increase inthe provisioning of infrastructure and teachers, the problemof retention, substantial reduction of drop out and improvedlearning levels for all children remains. In rural governmentschools there are clear indications that poverty has a negativeeffect on all key educational indicators. Empirical observa-tions and the data available shows that among the first gener-ation learners, children with low health and nutrition levels, orwho support the family tend to be the ones whose attendancetherefore is irregular, and whose participation in schoolprocesses tends to be conspicuously inhibited and slow. Theeducation of poor children requires pedagogic innovations,
flexible academic structures for schools, and teachers with astrong empathic commitment to working patiently and perse-veringly. Since the school is a social institution, besides freetext books, free uniforms, and a mid day meal would helpencouraging the participation of poor children.
The issue of out of school children needs to be seen notonly as a back to school programme but is intimately linkedwith the retention of children in the completion of a wholeschool cycle. Completing school with a school certificatebesides allowing transition to higher education gives a definite advantage in the employment market and in optingfor other avenues of skill acquisition. Therefore, one of thefactors that hold attraction is the prospect of a school completion certificate, and this needs to be made to appearpossible for all. The challenge here is double fold: Retain thechildren in school at the primary level to complete the wholeschool cycle, and to enroll and retain the over-age childrenwho are late starters to complete the whole school cycle. Theimplications of this involve a wide range of action. First,attention to the whole school cycle would have to be given,and universalisation of elementary education would have tobe seen not as an end in itself, but as creating the prerequisitecondition for it. Thus, while prioritising primary and elementary stages may have a justification both as historicalbeginning points and in resources, nevertheless as the stateworks on the elementary stage, it would be manifestly evidentthat not looking at the whole school cycle would mean thepersistence of basic problems of low social motivation specially among the poorer classes to take the steady school-ing of their children seriously. In the social perception it is the whole school that has value, not an interim stage in it.Therefore, even while the state is planning universal elemen-tary education, it has to start addressing the issue of highschool access in a way that makes the opportunity of schoolcompletion a possibility for all.
For overage children, especially overage girls, on the adolescence threshold, special methods would have to bethought of to facilitate their enrolling and transiting throughto complete the school cycle. This will require the develop-ment of materials and methods that facilitate swifter pacedtransition by the overage late entrants to the school and helpsthem complete their school cycle in a shorter duration. A feasible approach here would be to tap the potential of thestate open school and to develop systems of Equivalence. Thiswould benefit the fifteen plus youth that enlists in the adulteducation programmes, as well. As the state expands its reach,the hard to reach groups tend to become increasingly more visible, and the need to strengthen the open school andequivalence systems becomes increasingly more central inview of the fact that the gap in the literacy base would remainunless opportunities for completing a full school cycle are restored to this group that has missed the right age forenlisting in school.
29
E D U C AT I O N

Improving the quality of learning at the primary levelReturning children to school with the objective of enablingthem to acquire education of satisfactory quality demands anin depth and comprehensive agenda of quality reform.Improving quality of education needs focus on institutionalreform, better classroom processes, need-based teacher educa-tion programmes, curriculum and evaluation reform andemphasizing processes of lateral accountability and improvingeducational quantities.
Enriching the quality of classroom processA challenge common to all schools is the different levels ofabilities among children and often in the same child in eitherdifferent subjects or different times depending on the qualityof his participation. Madhya Pradesh was able to evolve a rangeof pedagogic practices that highlight the possibility of makingclass room processes more meaningful through organizationalstrategies that balance flexible groups and normative grades.These can help respond to. This requires both continuousteachers training, development of appropriate TLM to diversi-fy the linearity of the text and most significantly, policy support to flexible school structuring principles. While thesepedagogic methods are important for all good schooling, theyare most critically needed for contexts of first generation learn-ers or mixed age, mixed ability heterogeneous groups charac-teristic of chronically deprived areas and communities. Thestate need to build upon its nascent insights and experience ofthese pedagogies of learning focussed on multiple levels. Theuse of IT has been viewed as a potential medium for pedagog-ic transformation, creating ground for interrogation, choice,self-learning. It should be continued in this direction withgreater integration with classroom process, expansion of thehorizon of knowledge, and greater stimulation to self-learning.
Strengthening teacher educationAssessment of learning levels at the primary and upper pri-mary both indicate the need to focus on the development offoundational competencies in Mathematics, Language andScience. There is a need to develop teacher capability boththrough the induction and in-service training programmes ofteachers. Special emphasis will therefore have to be placed onimproving teacher capability in transacting Mathematics andScience curriculum. This should be done through need-basedprogrammes focusing on specific content and pedagogicalareas. The process of using distance education, computerenabled education and school libraries as Alternative LearningSources (ALS) for teacher and students development shouldbe further supported and expanded. Distance learning programmes need to be continued.
Improving learner evaluation processesIt needs to be ensured that learner evaluation will be not justa test of basic text based competencies but also a process of
appraising the quality of teacher-pupil interactions and theoverall cognitive development of the learners, handlings theindividual differences positively. A balance has to be maintained between individualism issues and normative stan-dardisation, which will also help keep evaluation from becom-ing threatening. Lateral accountability of the school to thelocal community for learning outcomes needs to be clearlyestablished to elicit parental support for improving the quality of learning. The results of quarterly evaluation need tobe shared with the VEC and PTA at the village level succes-sively to the Panchayats and District Planning Committee toensure regular monitoring of learner achievement by them.
Maintaining an efficient Teacher-Pupil RatioProvision of additional teachers both at the primary andupper primary levels in order to maintain the TPR at 1: 40 onthe basis of rationalisation and reallocation, to improve thequality of classroom transactions. An efficient TPR is neces-sary for effective teaching learning processes. The current sit-uation on multi grade teaching is very clearly contra indicativeto quality transactions. Inadequate attention to evaluation,failure to undertake diagnostic and remedial action, negli-gence even in simple routine tasks like completion of textbookbased exercise can be clearly traced to high TPR multi gradesituation, wherein teachers do not have enough time to focuson child specific tasks. As a consequence, the result of multigrade teaching or large class sizes is the un-noticed perpetua-tion of errors militating against all inputs into mastery levelcompetencies, it is evident that while an efficient TPR is theprinciple condition of quality teaching learning, nevertheless,it is also equally susceptible to availability of resources. Effortsshould be made to move towards a more efficient TPR beyonda 2 teacher per school primary norm and 3 teachers per schoolupper primary norm on the basis of a realistic assessment ofstudents’ attendance patterns and teacher availability and spe-cific academic requirement especially at the upper primarylevels. A current estimate of additional teachers is based on thecurrent estimate of TPR. School specific TPR can be improvedthrough teacher reallocation, but if the average TPR has to bebrought to 1:40, then additional teachers will be needed.
Striving for a holistic view of qualityThe issue of quality is often limited to academic inputs andoutcomes. Thus, there has been a demand for B.Ed/ D.Ed/inservice trainings and a great emphasis on text book revision.What has been difficult to explain has been a widely prevalentsituation where teachers with desired professional qualifica-tions, and refresher trainings and improved text books andpedagogies still do not generate effective teaching learningprocesses and the desired results. The inadequacy of a predetermined criteria of academic inputs seen in isolation fromother historical contingencies becomes glaringly obvious insuch commonly prevalent cases of quality default. A number
E D U C AT I O N
30

of studies conducted show that apart from a prescribed qualification criteria, intangible attributes like empathy andsense of responsibility are necessary for a teacher to performeffectively, and that without these, even highly qualified teach-ers do not teach even by minimal standards of satisfactorytransaction. Yet these are rarely factored in the way the teacherhas to be recruited, or trained or even assessed and these posea challenge for designing a criteria for the teacher’s profes-sional development. Issues of teacher empathy with the students coupled with clearly defined accountability of theteacher to the parents whose wards are in his charge becomevery significant in a state like Madhya Pradesh where the children whose education really poses a challenge to the stateare from economically deprived families.
Issues of accountability, incentives or the effect of generallevels of social awareness offer themselves for consideration.One of the realizations in the process of decentralised man-agement is the need to look at the whole context for under-standing quality. The context would imply the school and itsacademic inputs and their relationship with each other, theschool and management practices and policies that define itand would also imply the school and its relationship with thesocial community within which it functions. Quality thenwould have cognitive, infrastructural, managerial and socialdimensions and would derive from the relational nature ofthese dimensions. This understanding has determined the wayin which issues of quality are being sought to address. Oneeffect of this whole context perspective is that it places theissue of curriculum reform within the larger frame of educa-tional reform. This alters the conventional way of posing ques-tions on quality that start with just the academic inputs,assuming that the other factors are administrative or ‘physical’or pertain to the community and outside the core issues ofacademics that actually determines quality. A holisticapproach to educational reform on the other hand recognizesthe need to transform the context in which the text has to betransacted. The present level of quality in the state then is theresult of the present relationship between the academic, andsocial factors and the institutions of political democracy.
Thus, the state has planned for an intensive training of allthe teachers, and curriculum review, and strengthening teachereducation and academic support institutions. This is accompa-nied by a commitment to establishing social accountability ofthe school. The Jan Shiksha Adhiniyam aims at creatingprocesses towards social accountability for quality. For this thePTA and the VEC are seen as key institutional arrangements.The People’s Education Report to be instituted annually isexpected to make the Government accountable for quality. Theempowerment of democratic institutions and processes forcreating accountability of school performance is expected togive a critical edge to the issue of quality. Empowerment hereimplies both the creation of structures and focused efforts todevelop capacity. This is why the state has given serious
attention to the adult education programme, through itsPadhna Badhna Andolan and its Padhna Badhna Sanghs thatare in the making to consolidate and institutionalize the ener-gies and build capabilities of such sections of the communitywho depend on the public education system. The objectivehere is to continuously increase the capacity of the communi-ty to create as well as to demand better services for themselves.Finally, since quality is seen to be a relational process of multi-ple factors, the approach towards improving quality empha-sizes an intensive broad based participatory research strategythat does not abstract single strands for study like academics,or community or management, but strives for a holistic per-spective. Such an approach also rejects the notion of quality asonly a technical, supply side issue and sees it evolving througha dialogic process of all participants. This conceptual analysisof quality provides the framework of action presently initiatedby the state for educational reform. Such action is at a very nascent stage and would have to be sustained through carefulplanning and evaluation in the time to come.
Improving physical infrastructurePhysical infrastructure in schools will be improved throughthe provision of buildings, additional classrooms, toilets anddrinking water facilities. Currently, there is a gap of 23387 primary school buildings, 36668 additional rooms, 6287schools require major repairs and 9426 schools require minorrepairs. District-wise details of infrastructure gaps are given atAnnexure-3(i), (ii), (iii). Convergence of resources is beingplanned to mobilise support for filling in infrastructure gaps.
Improving School Management through decentralisationand capacity development The complex nature of UEE demands that the greatest atten-tion be paid to the process of planning and implementation,institutional reform, and convergence of resources. Again, inview of the complexity of the problem, decentralisation willhave to be the key defining principle of the educational plan-ning and management. Decentralisation has been a key strat-egy for improving school quality by making managementaccountable to stake holders. The effort is to establish schoolas a unit responsive to the learning needs of the children andthe educational aspirations of the community. The process ofdecentralisation of educational management has culminatedwith the establishment of PTAs and VECs as statutory institu-tions devolving power on the community to control the localschools as well as to support it in its basic requirements.Similarly the process of academic decentralisation has beeninitiated with the establishment of Cluster Resource Centres(Jan Shiksha Kendras). Attention needs to be given to strate-gies for strengthening these decentralised institutions throughinternal restructuring along with professional capacity devel-opment. Formation of decentralised management structuresright upto the grass root level has an implication for the need
31
E D U C AT I O N

of capacity building at all levels. Capacity development andstrengthening infrastructure support to these decentralisedintegrated units is needed to enable them to function effectively. All VECs/PTAs will be oriented towards theirschool management roles. The training focus will be on therole of VEC/PTA in micro planning and implementation ofVillage Education Plans, effective use of school contingency,monitoring, progress of children in schools.
EQUITY: IMPROVING EDUCATIONAL OPPORTUNITIES FOR SPECIAL
FOCUS GROUPS : GIRLS, SC, STGaps in girls’ participation at the primary and upper primarylevels have been assessed and collected. Also the census data of2001 clearly indicates the district, which requires special attention because their literacy status is below that of the Stateaverage and the female literacy rate is also very low. A clearproblem area is the education of girls in the age group 11upwards, who have never enrolled in schools. They need spe-cially designed and planned education programmes to enablethem to enlist and complete their education. Making theschool timings and holidays flexible makes the school moreinclusive and while the power to do so has been vested in thePTA, it needs to be consciously and sensitively emphasizedand ensured. Non-grade, group based pedagogic practices,bridge-materials in a self learning mode allowing transitionand completion at learner pace would enormously increasethe chances of these children who tend to form the bulk of thevulnerable category of drop out or never enrolled. The openschooling system which is essentially a system for flexiblelearning reaching out to learners regardless of their age needsto be remoulded to serve this purpose. Efforts need to be madeto encourage women to enlist as teachers especially at theupper primary level. Provision of separate urinals for girls isalso expected to have a positive impact on girls’ retention bothat the primary and upper primary level. Social mobilisationand convergence with programmes of women’s empowermentand especially with Continuing Education programmes willprove to be effective. Appropriate incentives such as scholar-ships, uniforms, free teaching learning material need to bedesigned to target needy children of special focus groups.
In Summary, the action ahead has to take the followingissues into consideration:● Provision of appropriate infrastructure facilities to
schools.● Focusing on strengthening institutional management
processes and strengthening the use of information forplanning and management
● Strengthening decentralised management through capacity development
● Strengthening community participation especiallythrough institutional means such as the PTA and theVEC.
● Sustaining the new impetus towards restructuring
academic support systems on principles of professionalcalibre, school experience as participatory forum ofteacher development and motivation, especially at thelevel of the Jan Shiksha Kendra.
● Adopting a more developmental approach to teachertraining, and creating professional incentives for teachersto upgrade their knowledge and skills.
● Ensuring that the curriculum both respects local knowl-edge and culture and adds wider dimensions of under-standing and accordingly effect improvement in content.
● Establishing a reliable system of learner assessment.● Develop appropriate incentives for learners mainly of
special focus groups● These measures have been initiated. They need to be
sustained and strengthened in the light of experiencesand in the interest of learners.The key theme is to continue decentralising management
and academic support to schools so as to redefine the schoolfrom its inherited identity as the lowest level appendage tolarge bureaucratic machinery to school as empowered andautonomous unit.
RESOURCES
Resources required for UEE have to be estimated first on aneeds basis. The extent to which the resource gaps are met,will be subject to the availability of resources under differentprogrammes. Therefore resource-based estimates also need tobe drawn up. The state has drawn up Education for All (EFA)plans projecting needs, proposing strategies and estimatingresources for both elementary and adult education. The EFAplans estimate approximately 8,500 crores will be required forfulfilling all the needs and providing free elementary educa-tion to children. A major programme for planning and mobi-lizing resources for implementing the elementary educationstrategies is Sarva Shiksha Abhiyan (SSA).
A significant strength of the planning emerging in thestate is that it seeks convergence of schemes. SSA is an effectivevehicle for this convergence. This internal convergence of edu-cational schemes and resources will itself enable comprehen-sive planning with optimum utilisation of resources. The stateexpects all 45 districts will be covered under the SSA.Perspective plans for a five-year period have been submitted tothe Government of India. 12 have already been sanctioned.The process of upgrading DPEP into SSA in the remainingdistricts is in process and it is expected that by end- 2002 allDPEP districts would move into the SSA mode. This willmobilise additional resources for universalising elementaryeducation.
However, it needs to be mentioned quite clearly thatresources through specific programmes are additional. Themain share of finances come from the state’s own supportresources. The state has therefore to seriously review andreformulate its own financial investments in the education
E D U C AT I O N
32

sector to optimise their benefits. Some options that the statehas are:
Reducing administrative expenditure at state level institutionsThis is long pending since decentralisation really does allow athinning down of top-level structures because their powersand functions have been devolved. This is needed not just forcutting out redundant financial expenditure, but most urgent-ly for liberating the new empowered decentralised arrange-ments from the hegemonic with then influence of top struc-tures with their historically inherited authoritarian cultures.
This would also imply administrative efficiency. As aninterim measure, state level personal could be allocated at dis-trict and sub district levels where work functions would tendto acquire a greater responsibility because of greater autono-my. Over a period of time administrative overheads should berationalized to liberate more resources for programmes.Secondly, there is a need to closely scrutinise and understandchoices on the basis of a cost - benefit analysis, to adjudge costeffective inputs.
The state has been wresting with the problems inherent inuniversalisation: needs versus resources, commitment to uni-versalisation and concern for quality, time- bound action andthe necessity of resource-based, phased planning, standardiza-tion of norms and pervasive differences and disparities.Looking to the different types of teachers schools and relatedincentive systems it could decide upon the most cost effectiveinputs. Setting performing norms itself can ensure effectivereturns on current investment without incurring additionalexpenditure. This could imply for example, setting eligibilitycriteria for the placement of personnel and teachers andaccording to the needs of the institution and performancenorms as incentives or disincentives. Capacity developmentwould enable optimising the impact of available resources byimproving internal efficiency. This would include retrainingin newer skill requirements, structural reorganization andintegration on the principles of decentralisation would reducestagnation and wastage on top and encourage accountabilityat school/closer to school levels. Convergence of programmeson a comprehensive intra and inter-sectoral needs will reduceduplicate/parallel efforts and costs. Empowering communitiesis the most effective the most cost-effective way of meeting thecomplex challenges of education. Ownership can helpimprove the school even with limited resources in a partner-ship framework, which the Madhya Pradesh government hasbeen pursuing. Finally it would help to look at the school as an evolving process balancing a pragmatic strategy and normative frame.
Creating a legal frame for educational reformThe state government has formulated a legal frame for consol-idating and promoting the initiatives for educational reform
through its Jan Shiksha Adhiniyam-which seeks to strengthenthe institutional partnership between the Government, thelocal bodies and the community in the task of universal ele-mentary and adult education. The Act has been passed by thestate Assembly for implementation in the State.
ADULT EDUCATION
Adult Education has been an area of key concern, bothbecause basic literacy to all is a commitment of the state, andbecause there is a clear reciprocity between the educationalstatus of children and the adult community. The key strategyfor this in Madhya Pradesh in the first half of the decade of the90s was the Total Literacy Campaign (TLC) sponsored by theCentral Government. Under this all the districts in MadhyaPradesh implemented the Total Literacy Campaign (TLC).54.10 lakh were made literate over 9 years. But by mid-90sthere was a need to review the TLC strategy.
The major change made against the movement for totalliteracy was that it is unable to excite the adult communitywhose children did not go to school because they lacked thefacility. That was what led observers to lament the literacycampaign as an effort to mop the floor with the tap open. Thesynergies in the relationship between the efforts for universalprimary education and mass literacy needed to be realized.
The primary education base supported action for adulteducation. EGS through its wild fire spread took the messageof education for all into all habitation in Madhya Pradesh sothat when subsequently the Padhna Badhna Andolan wasstarted for literacy in late 1999 there was a torchbearer foreducation in each habitation and a community that had par-ticipated in creating a learning environment for their children.
Padhna Badhna Andolan (PBA) was Madhya Pradesh’sprogramme to revitalise the literacy movement in the state.PBA differentiated itself from the prior literacy strategy of theNational Literacy Mission (NLM) (the Literacy Mission of theCentral government) by emphasising collectivity, demand,local choice and incentive to the literacy volunteer. The pro-gramme undertaken for a year in 2000 had the following keyelements.● Non-literates would come together as Padhna Badhna
Samitis● They would chose local educated person to be their
teacher (Guruji)● They would register at the nearest Panchayat or Jan
Shiksha Kendra (Cluster Resource Centre) their namesand that of the proposed Guruji
● Government would verify the status as being non-literateprovide the Guruji training and teaching-learning material.
● Three basic literacy primers of the NLM would be transacted.
● In addition to the 3 literacy Primers of NLM, a fourthPrimer (Choutha Primer) was developed by the Rajiv
33
E D U C AT I O N

Gandhi Mission on Rights (land rights, gender rights,forest rights, labour rights, development rights etc). Theidea was that as the PBA Samiti transacts the FourthPrimer it repositions itself as a Self-Help Group and thena thrift and credit society.
● The Government would monitor hand hold and under-take a 100 percent external evaluation of the learners.
● Based on the number of people who cleared the examina-tion the Guruji would be given a Gurudakshina of Rs 100per learner to which the community was also free to add.So if a Guruji made 20 people literate he/she would get
Rs.2000 as Gurudakshina from the people he has taught. Thismoney was made available by reducing other costs on super-vision, having full-time literacy employees etc. It would be inorder here to compare the physical achievement as well ascosts under the two strategies of National Literacy Mission’sTotal Literacy Campaign and Madhya Pradesh’s PadhnaBadhna Andolan.
The hypothetical Rs. 65 per learner of the NationalLiteracy Mission’s Total Literacy Campaign becomes almostRs. 230 because of protraction yet had no incentive for the
teacher. In the case of the Padhna Badhna Andolan, out ofthe Rs.150. 25 per learner cost, Rs 100 per learner has been the component of the Gurudakhshina. Interestingly post-evaluation encounters showed that the incentivisation wasresponsible for the wide popular involvement of unemployededucated youth as Gurujis as they went through the campaign,the moral charges of leadership was a far greater incentivethan the money given as Gurudakshina.
Padhna Badhna Andolan was crafted to revitalise the literacy movement in the state. The response was phenome-nal as over 2,17,000 Padhna Badhna Samitis enrolling 5.18million came up. There was no restriction on who could bea Guruji and even grassroots level functionaries like Gurujisof EGS schools, erstwhile TLC volunteers could also becomeGurujis of the Padhna Badhna Andolan. The final evaluationwas scheduled between 7-9 December and out of the 51.83lakh people enrolled 32 lakh had completed the ThirdPrimer (another 19.41 lakh had completed the secondPrimer) and took the examination. 29.85 lakh cleared the
examination which was conducted openly with invitationsadvertised in newspapers requesting the public to witness theevent. Results of external evaluation by expert panelapproved by NLM are close to those of the 100 percent statelevel evaluations corroborating the results of this one-yearcampaign.
OF THE SAMITIS,The Rajiv Gandhi Shiksha Mission had also invited the evalu-ation teams of the NLM to this event and their findings cor-roborated the results of this one-year campaign, which wasfinally vindicated when the Census results were announced.57000 Padhna Badhna Samitis have repositioned, as Self-Helpgroups with savings of Rs. 4 crore and over 70% of these aregroups of women..
LITERACY IN MADHYA PRADESH
The sections above have discussed the issues and parametersof education, and of the efforts at achieving and ensuring uni-versal elementary education. The last seven to eight years havewitnessed sustained action towards educating people in thestate, making children and adults literate, bringing children toschool and ensuring that they remain there, and that theyreceives quality and useful education. It is extremely difficultto be able to measure or assess progress of level of develop-ment of people in education. The only universally acceptableand appropriate measure is literacy, although that itself doesnot really tell us about the depth and quality of education levels of people. Nevertheless, it is an indicator that shows thecurrent spread and reach of basic ability in education and perhaps also shows the expanding and deepening education inpeople.
The Census of 2001, gives us figures of literacy that enable us to make some assessment of the impact of all theseefforts on education levels of people in the state, especiallywhen we compare the literacy levels from previous censusdata.
Madhya Pradesh has recorded an unprecedented jump of20 percent in literacy in the period of the nineties as reportedin Census 2001. The work in the nineties was in the combinedState of the then Madhya Pradesh that included the new Stateof Chhattisgarh. Taken together there has been a rise of 20.45percent in the decade of 1991-2001 in literacy in MadhyaPradesh. The key features are :● Undivided Madhya Pradesh records the highest decadal
growth in the period of the nineties. As against a 10 percent growth in the decade of the eighties in the state,over 20 percent growth is recorded in the nineties. As faras the new state of Madhya Pradesh is concerned, therewas a rise of 19.4 percent.
● The growth in Madhya Pradesh in literacy far exceedsnational growth rate in comparative terms. In fact thegrowth rate is more than double of the national growth
E D U C AT I O N
34
Total Literacy Campaign 125 lakhs 54.10 lakhs 9 years Rs. 229.55
(1990-1999)
Padhna Badhna Andolan 51.83 lakhs 29.85 lakhs 1 year Rs. 150.25
(Dec 1999-
Dec 2000)
Strategy Target Achievement Duration Per Learner Cost
Source: Rajiv Gandhi Shiksha Mission, Government of Madhya Pradesh,
Bhopal
Table 5

rate. At the national level literacy rate grew from 8.64 percent in the eighties to 13.17 percent in the ninetiesindicating a decadal increase growth rate of only 4.53 percent whereas in Madhya Pradesh, literacy grewfrom 10.4 percent in the decade of the eighties to 20.45percent in the decade of the nineties indicating an increased growth rate of 11 percent. This jump is significant.
● Madhya Pradesh condenses the development of threedecades into one decade. In the decades of the ninetiesMadhya Pradesh records a jump almost equalling thetotal of the three decades of sixties, seventies and eighties.In three decades preceding nineties (61-91) female literacy grew by 20.47 percent. In the decade of thenineties (1991-2001) it grew by 20.93 percent.
● More than one person out of six persons removed fromthe category of non-literates in India in the decade of thenineties is from Madhya Pradesh. Madhya Pradesh takentogether with Chhattisgarh account for 17.94 percent ofthe decadal decrease in illiteracy in India.
● Taken together with population figures, out of thedecadal decrease in number of non-literates in India of3,19,58,336, Madhya Pradesh together with Chhattisgarhaccount of 57,30,327.
● The net reduction in number of female non-literates is 10million of which the then unified state of MadhyaPradesh accounts for 2.2 million. Almost one out of everyfive women removed from the category of non-literateswas from Madhya Pradesh.
● Madhya Pradesh (again taken together with Chhattisgarhas it was a common state in the decade under review) astate with a considerable backlog in the area of literacydoes better than Andhra Pradesh, Uttar Pradesh,Rajasthan, Bihar, Orissa and Jammu and Kashmir. Inmale literacy it goes ahead of the national average and thestates mentioned above as well as Karnataka.
● In summary Nineties become the defining decade whenMP leads by 20 percent to catch up with the national average and shed its “Bimaru” tag.
MADHYA PRADESH CLOSES THE GAP
Literacy is catching up with national average. While in 1991,the literacy rate of the new state of Madhya Pradesh was 18percentage points below the national rate, today it stands neckto neck (64 percent to 65 percent).
Male Literacy ● In the period 1991-2001, male literacy in Madhya Pradesh
increased from 58.54 percent in 1991 to 76.80 in 2001indicating an increase of 18.26 percent.
● Madhya Pradesh has moved ahead of the national averageof 75.85 in male literacy and is ahead of the two southernstates of Andhra Pradesh (70.85 percent) and Karnataka
(76.29 percent, marginally lower) in male literacy.● At the national level the growth rate in male literacy has
been 11.72 percent, 42 out of 45 districts in MadhyaPradesh exceed the national growth rate in male literacy(the only exceptions being Indore, Gwalior and Bhopal).
Female Literacy: Condensing three decades growth into onedecadeIn female literacy, Madhya Pradesh has condensed the growthof three decades into one decade. Taken as a combined state,the growth in female literacy has been 22.49 percent in thedecade of the nineties. Female literacy was 8.88 in the 1961Census, the first Census after the formation of the state ofMadhya Pradesh. It grew to 13.93 in 1971, to 19.00 in 1981 andto 29.35 in 1991 making the combined growth in the 3decades equal 20.47 percent. Against 20.47 percent growth in3 decades, in the decade 1991-2001, Madhya Pradesh femaleliteracy went up by 22.49 percent in the combined state and by20.93 percent in the new state of Madhya Pradesh.
DECADAL INCREASE IN FEMALE LITERACY
This graph shows the impact of the period of the nineties onthis vital development indicator.
35
E D U C AT I O N
Growth in Male Literacy in MP
80
60
40
20
0
1961 1971 1981 1991 2001
31.1838.76
48.42
76.80
58.54
Male Literacy Growth Rate Exceeds
National Male Literacy Growth Rate
20
15
10
5
0
Incr
ease
in M
ale
Lite
racy
National M.P.
11.72
18.26

● Female literacy growth rate exceeds male literacy growthrate and it goes from 29.4 percent in 1991 to 50.3 percentin 2001 registering a 20.9 percent growth.
● The growth in Madhya Pradesh in female literacy farexceeds the national average. At the national level femaleliteracy went up from 39.3 percent in 1991 to 54.2 percentin 2001 registering a 14.9 growth whereas in MadhyaPradesh the growth has been 22.5 (combined) and 20.93(after division).
● It is for the first time that the growth rate of female literacy in Madhya Pradesh exceeded the growth rate formen and the national growth rate in female literacy.
● 39 out of Madhya Pradesh’s 45 districts have a female literacy growth rate above the national female literacygrowth rate of 14.87 percent.
● In 17 districts in Madhya Pradesh female literacy rateexceeds the national average of 54.2 percent whereas in1991 only 6 districts in MP had a growth rate above thethen national average.
● A few miracles in female literacy in Madhya Pradesh: Inthree districts -Datia, Shajapur and Raisen – female liter-acy rate growth ranges between 35-38 percent. The storyof female literacy in 3 districts is shown in Table 6.
● In 22 districts female literacy rate went up more than 30percent.
● For the first time, the gender gap between male literacy
and female literacy started to decline in the decade of thenineties. The reduction in the male to female literacy rateis plotted in the graph.
Probing Deeper into Some Districts● Districts with larger Scheduled Caste Population do
better in literacy growth● Scheduled Caste populations constitute over 16 percent
of Madhya Pradesh population. How have the districtswith large scheduled caste populations done in literacy inthe decade of the nineties?
● As may be seen in Table 7, 14 out of 19 districts withabove average population of scheduled castes have agrowth rate in literacy exceeding the state average.
● All these districts have a growth rate ahead of the nation-al growth rate in literacy of 13.17 percent. Only two urbandistricts Gwalior and Indore which though they have a
higher than state average of population of ScheduledCaste also have a relatively higher literacy rate of 69.79and 74.82 respectively have logged a lower growth ratethan the national growth rate.
● Districts with larger than state-share of Scheduled Tribesalso do well in literacy in the nineties
● Madhya Pradesh has a population of over 20 percentScheduled Tribes after the division of the state. 13 dis-tricts (of 1991) have a population of Scheduled Tribesexceeding 20 percent of the population.
● Here again 8 out of 13 predominantly tribal districts far exceed that state average and national average in the growth rate of literacy between 1991-2001. Only the districts of Barwani, Dindori, Dhar, Khandwa and Jhabuahave a growth rate below the state average. All these five districts however have a growth rate above the nationalaverage.
E D U C AT I O N
36
Decadal Increase in Female Literacy in
Madhya Pradesh
60
50
40
30
20
10
0
1961 1971 1981 1991 2001
8.8813.93
19.00
50.28
29.35
Datia 15.13 24.45 62.48
Shajapur 11.38 19.77 57.58
Raisen 14.66 25.47 61.89
District 1981 1991 2001
Source: Census of India, 2001
Table 6
MP Female Literacy Growth Rate Exceeds
National and Male Literacy Growth Rate
25
20
15
10
5
0
Incr
ease
in L
iter
acy
National M.P. Joint M.P.
Female Total Male
14.87
20.9320.45
18.9118.26
11.72
13.17
22.49
19.44

CHALLENGES AHEAD
The challenges in Adult education are sustaining and consolidating the nascent literacy skills, linking literacy withlife needs, and above all promoting women’s education.Mahila Padhna Badhna Andolan was launched on 8th March2002 to cover the female literacy gaps still remaining. It isexpected that the Mahila Padhna Badhna Andolan will coverthe remaining gap of 50 percent illiterate women. UnderMPBA, 1.73 lakh Mahila Padhna Badhna Samitis have beenformed and 35 lakh illiterate women have forwarded their demands to be made literate. Out of these 29.64 lakhwomen have been enrolled in the Mahila Padhna Badhna
37
E D U C AT I O N
Gap between Male and Female
Literacy in MP
35
30
25
20
15
10
5
01961 1971 1981 1991 2001
Gender gap in literacy
24.0825.44 26.52
29.2929.18
Selected Districts with % of Scheduled % Literacy % of growth in SC Population above Caste Population in 2001 literacy between state average in district Census 91-2001 (against
State Growth 20%,
National Growth 13%)
Table 7
Datia 24.67 73.51 28.32
Bhind 21.34 71.22 21.99
Morena 19.89 65.58 19.65 (Sheopur 20.06)
Rajgarh 18.00 54.05 22.24
Shivpuri 19.36 59.55 26.52
Guna 18.08 59.93 25.35
Tikamgarh 22.75 55.80 21.02
Raisen 16.55 72.76 32.00
Ujjain 24.56 71.18 22.12
Panna 20.40 61.61 27.93
Shajapur 22.34 71.14 31.94
Sehore 20.30 63.83 23.40
Satna 17.85 65.12 20.47
Narsinghpur 16.59 78.34 22.69
Chatarpur 23.70 53.44 18.24
Dewas 18.15 61.04 16.96
Vidisha 20.31 62.10 18.02
Sagar 21.09 68.08 14.64
Damoh 20.08 62.06 15.79
Source: Census of India, 2001
Padhna Badhna Andolan with its 0.217 million Padhna Badhna literacy vol-
unteers generated social energy even in remote rural areas that needed to be
consolidated and strengthened. The nascent bonding for shared agenda
seeded through a Padhna Badhna Samiti is sought to be captured in the
form of village based Social Action Groups. The Social Action Group or the
Padhna Badhna Sangh is conceptualised as a federation of the local Padhna
Badhna Samiies. The Padhna Badhna Sangh or the Social Action Group is a
collective of the Gurujis and the adult neo literates.
The key components around which Social Action Group activities are
to be organised include :
● Mopping up residual illiteracy and consolidating neo-literacy skills.
● Income generation activities: Padhna Badhna Sanghs as self-Help
Groups can develop projects for economic activities and field it to the
district -level which could support this activity and also leverage other
development funds.
● Cultural activities like setting up of Libraries: The state has set for
itself a target of 51508 rural libraries to be established by the begin-
ning of 2003. The effort is to give each library a television, radio and
a public address system in addition to books, periodicals and newspa-
pers and sport facilities. The community and the local administration
will arrange the space for the library.
Each Padhna Badhna Sangh will select an animator or a “Prerak” who
will lead the group. The literacy volunteer who has made the maximum
number of persons literate in the Padhna Badhna Andolan would be chosen
as the animator or Prerak of the Social Action Group.
The Prerak would be eligible for an honorarium for action under a
six point charter : (a) managing the library (b) ensuring that every child
is enrolled and retained in school, (c) every women in the village is made
literate, (d) households are motivated for water conservation under the
Pani Roko Abhiyan of the state government, (e) motivating households to
adopt sanitation practices, and (f) conducting house-to-house campaigns
for removal of untouchability. Based on the report of work done,
an honorarium of Rupees six thousand will be made available to the
Prerak after every twelve months. The Prerak thus takes the responsibility of
activising the Padhna Badhna Sangh towards collective social action
and cultural development. The training of the Prerak becomes a critical
issue to be addressed on priority. The Shiksha Mission has planned for
institutional development of these Padhna Badhna Sanghs by linking them
up for capacity building by institutions engaged in social and cultural
action.
Creating a Social Action Group in every village: Padhna Badhna Sangh

classes. The fourth Primer has been revised to make it sensitive to gender issues so that it becomes relevant to thewomen literacy groups.
Institutionalising the literacy energies to create a sustained base for continuing education is the major task athand. This is expected from the Continuing Education (CE)programme of the NLM. A Continuing Education Project foreach district has been formulated. Out of 45 districts 19 districts have received approvals and the remaining areexpected to be cleared shortly. Work under CE has started,addressing issues like mopping up residual illiteracy in theform of Mahila Padhna Badhna, strengthening self helpgroups, and developing neo literate materials. Establishing anetwork of rural libraries and Padhna Badhna Sanghs are thekey elements of institutionalisation that are expected to moveliteracy efforts towards Continuing Education that helps inimproving the quality of life.
E D U C AT I O N
38
Jhabua 85.67 37.08 18.07
Mandla 60.84 60.77 23.75
Dindori 60.48 54.49 16.75
Umaria 54.84 60.26 27.63
Shahdol 46.32 57.76 22.31
Dhar 53.48 52.70 18.16
Khargone 46.23 63.41 22.18
Barwani 66.50 41.35 13.27
Betul 37.51 66.87 20.98
Seoni 36.95 65.88 21.39
Chhindwara 34.47 66.03 21.13
Sidhi 30.43 52.82 23.67
Khandwa 26.77 61.71 16.22
District Population of ST % of Literacy in 2001 % growth in
in district Census literacy
Source: Census of India, 2001
Table 8

39
E D U C AT I O N
Note: Private schools account for 12.3% mainly concentrated in urban areas. Acess has been an issue for rural areas, where the government is the main, if not very
often, the sole provider.
Source: Rajiv Gandhi Prathmik Shiksha Mission, Government of Madhya Pradesh
1 Betul 1565 433 100%
2 Raisen 1279 526 100%
3 Rajgarh 1281 593 100%
4 Sehore 1036 344 100%
5 Guna 1640 1040 100%
6 Dhar 1886 1326 100%
7 Rewa 1532 2033 100%
8 Satna 1776 903 100%
9 Shahdol 1774 1161 100%
10 Umaria 605 216 100%
11 Sidhi 1732 1455 100%
12 Chhatarpur 1393 494 100%
13 Panna 936 653 100%
14 Tikamgarh 1177 609 100%
15 Mandsaur 1013 231 100%
16 Neemuch 638 229 100%
17 Ratlam 1133 534 100%
18 Bhind 1349 420 100%
19 Damoh 1061 356 100%
20 Datia 670 126 100%
21 Dewas 1206 284 100%
22 Jhabua 2016 1860 100%
23 Khandwa 1470 275 100%
24 Khargone 1640 980 100%
25 Barwani 1009 1117 100%
26 Mandla 1419 662 100%
27 Dindori 984 392 100%
28 Morena 1315 453 100%
29 Sheopur 604 175 100%
30 Seoni 1659 521 100%
31 Shajapur 1178 350 100%
32 Shivpuri 1362 900 100%
33 Vidisha 1329 501 100%
34 Balaghat 1686 442 100%
35 Gwalior 1000 419 100%
36 Bhopal 605 192 100%
37 Narsinghpur 958 266 100%
38 Hoshangabad 954 174 100%
39 Harda 394 132 100%
40 Indore 883 154 100%
41 Chhindwara 1917 772 100%
42 Ujjain 1213 239 100%
43 Jabalpur 1232 352 100%
44 Katni 842 441 100%
45 Sagar 1537 596 100%
Total 55888 26331 100%
S.No. Name of the District Number of Govt. Primary School Number of EGS School GAR
ANNEXURE-1: STATUS OF ACCESS AT PRIMARY LEVEL

E D U C AT I O N
40
S. No. Name of the District Number of existing Government Number of New Government Total
Middle Schools Middle Schools
Note: Data of only government schools; has been considered because government bears a major responsibility for providing access and hence of ensuring
appropriate infrastructure support to the schools it creates.
Source: Rajiv Gandhi Prathmik Shiksha Mission, Government of Madhya Pradesh
1 Betul 404 175 579
2 Raisen 268 239 507
3 Rajgarh 359 192 551
4 Sehore 306 183 489
5 Guna 316 350 666
6 Dhar 518 133 651
7 Rewa 285 224 509
8 Satna 456 207 663
9 Shahdol 389 145 534
10 Umaria 64 86 150
11 Sidhi 428 300 728
12 Chhatarpur 296 163 459
13 Panna 250 195 445
14 Tikamgarh 192 273 465
15 Mandsaur 210 140 350
16 Neemuch 183 112 295
17 Ratlam 310 118 428
18 Bhind 427 157 584
19 Damoh 274 204 478
20 Datia 140 166 306
21 Dewas 229 150 379
22 Jhabua 310 168 478
23 Khandwa 326 109 435
24 Khargone 455 219 674
25 Barwani 233 239 472
26 Mandla 273 234 507
27 Dindori 176 112 288
28 Morena 309 97 406
29 Sheopur 105 56 161
30 Seoni 344 216 560
31 Shajapur 311 289 600
32 Shivpuri 319 249 568
33 Vidisha 307 152 459
34 Balaghat 396 129 525
35 Gwalior 324 77 401
36 Bhopal 167 86 253
37 Narsinghpur 241 87 328
38 Hoshangabad 272 121 393
39 Harda 80 76 156
40 Indore 413 171 584
41 Chhindwara 574 82 656
42 Ujjain 260 179 439
43 Jabalpur 393 128 521
44 Katni 198 127 325
45 Sagar 378 260 638
Total 13468 7575 21043
ANNEXURE-2: STATUS OF ACCESS AT UPPER PRIMARY LEVEL

41
E D U C AT I O N
S.No. Name of the District Existing Govt. Primary Schools Existing Govt. Middle Schools
without Building without Building
Note: Private schools account for 25.3% mainly concentrated in urban areas. Acess has been an issue for rural areas, where the government is the main, if not very
often, the sole provider.
Source: Rajiv Gandhi Prathmik Shiksha Mission, Government of Madhya Pradesh
1 Betul 204 311
2 Raisen 505 319
3 Rajgarh 390 469
4 Sehore 400 326
5 Guna 777 653
6 Dhar 1061 279
7 Rewa 1314 338
8 Satna 1011 329
9 Shahdol 783 340
10 Umaria 165 108
11 Sidhi 671 746
12 Chhatarpur 125 256
13 Panna 513 384
14 Tikamgarh 248 360
15 Mandsaur 132 215
16 Neemuch 81 158
17 Ratlam 234 351
18 Bhind 388 562
19 Damoh 370 453
20 Datia 118 232
21 Dewas 195 312
22 Jhabua 416 318
23 Khandwa 305 323
24 Khargone 1030 446
25 Barwani 1077 421
26 Mandla 816 397
27 Dindori 437 204
28 Morena 425 180
29 Sheopur 279 108
30 Seoni 764 357
31 Shajapur 210 535
32 Shivpuri 431 519
33 Vidisha 697 261
34 Balaghat 765 320
35 Gwalior 612 338
36 Bhopal 403 223
37 Narsinghpur 544 243
38 Hoshangabad 272 292
39 Harda 185 216
40 Indore 781 442
41 Chhindwara 950 362
42 Ujjain 500 338
43 Jabalpur 590 369
44 Katni 503 317
45 Sagar 710 496
Total 23387 15526
ANNEXURE-3(i): INFRASTRUCTURE GAPS

E D U C AT I O N
42
S. No. District GAPS TOILETS GAPS DRINKING WATER
At Primary Level At Middle Level At Primary Level At Middle Level
Note: Data of only government schools; has been considered because government bears a major responsibility for providing access and hence of ensuring
appropriate infrastructure support to the schools it creates.
1 Betul 1137 491 652 424
2 Raisen 585 260 785 325
3 Rajgarh 630 284 631 308
4 Sehore 596 266 298 319
5 Guna 820 158 984 190
6 Dhar 504 404 612 263
7 Rewa 1218 160 300 150
8 Satna 1155 228 963 274
9 Shahdol 1561 99 1624 111
10 Umaria 600 120 598 120
11 Sidhi 416 285 420 220
12 Chhatarpur 1021 248 856 189
13 Panna 400 187 784 378
14 Tikamgarh 326 20 544 279
15 Mandsaur 507 175 608 175
16 Neemuch 297 97 248 120
17 Ratlam 200 275 650 250
18 Bhind 884 197 654 169
19 Damoh 400 321 637 200
20 Datia 515 140 476 140
21 Dewas 777 419 460 419
22 Jhabua 916 60 600 201
23 Khandwa 735 261 882 313
24 Khargone 1836 384 704 375
25 Barwani 504 116 500 140
26 Mandla 643 149 749 194
27 Dindori 1000 288 1169 288
28 Morena 865 207 1038 248
29 Sheopur 301 55 362 60
30 Seoni 820 275 984 336
31 Shajapur 764 135 920 680
32 Shivpuri 200 166 180 106
33 Vidisha 1516 639 467 225
34 Balaghat 943 200 1012 238
35 Gwalior 771 278 276 69
36 Bhopal 302 176 363 180
37 Narsinghpur 879 205 252 90
38 Hoshangabad 500 224 600 165
39 Harda 377 140 250 90
40 Indore 600 645 500 500
41 Chhindwara 959 287 1150 344
42 Ujjain 788 472 788 416
43 Jabalpur 1019 107 531 80
44 Katni 772 194 220 60
45 Sagar 700 140 952 187
Grand Total 33259 10637 29233 10608
ANNEXURE-3(ii): INFRASTRUCTURE GAPS (DRINKING WATER FACILITY & TOILETS)

43
E D U C AT I O N
S.No. District Additional Rooms Required Additional Rooms Required Major Repairs required in Minor Repair required
in Primary Schools in Middle Schools school buildings in school buildings
Note: Data of only government schools; has been considered because government bears a major responsibility for providing access and hence of ensuring
appropriate infrastructure support to the schools it creates.
1 Betul 1320 355 154 232
2 Raisen 1282 342 117 176
3 Rajgarh 618 328 144 215
4 Sehore 418 178 113 169
5 Guna 800 300 248 372
6 Dhar 640 325 207 311
7 Rewa 505 360 114 171
8 Satna 658 415 182 274
9 Shahdol 871 500 232 347
10 Umaria 1636 687 21 32
11 Sidhi 2196 717 164 246
12 Chhatarpur 743 468 118 178
13 Panna 633 363 84 125
14 Tikamgarh 452 84 77 115
15 Mandsaur 1065 230 89 133
16 Neemuch 199 92 73 110
17 Ratlam 407 108 124 186
18 Bhind 745 855 171 256
19 Damoh 541 171 110 164
20 Datia 1187 859 56 84
21 Dewas 411 132 116 173
22 Jhabua 881 267 182 272
23 Khandwa 561 480 130 196
24 Khargone 445 254 182 273
25 Barwani 274 107 94 142
26 Mandla 576 226 109 164
27 Dindori 521 100 70 105
28 Morena 810 555 124 185
29 Sheopur 253 114 108 162
30 Seoni 1249 885 138 206
31 Shajapur 1939 374 124 187
32 Shivpuri 494 109 126 188
33 Vidisha 1013 1046 123 184
34 Balaghat 1575 397 158 238
35 Gwalior 749 588 296 443
36 Bhopal 315 252 208 311
37 Narsinghpur 545 358 82 123
38 Hoshangabad 304 296 109 163
39 Harda 932 582 43 64
40 Indore 700 800 334 500
41 Chhindwara 1200 805 184 277
42 Ujjain 895 437 199 299
43 Jabalpur 919 240 150 224
44 Katni 594 237 149 224
45 Sagar 1597 564 151 227
Total 36668 17942 6287 9426
ANNEXURE-3(iii): INFRASTRUCTURE GAP (ADDITIONAL ROOMS & REPAIRS)

E D U C AT I O N
44
S.No. District Population 6-11 years Enrolment Primary Level GER Primary
age group (I to V) 6-11age
Boys Girls Total Boys Girls Total Boys Girls Total
Source: Lok Sampark Abhiyan (2000-01)
Note: Data includes all children (government + private)
1 Betul 107842 99250 207092 112938 100803 213741 104.7 101.6 103.2
2 Raisen 85560 75507 161067 87669 77020 164689 102.5 102.0 102.2
3 Rajgarh 94656 87404 182060 91886 75138 167024 97.1 86.0 91.7
4 Sehore 92853 83302 176155 89403 76775 166178 96.3 92.2 94.3
5 Guna 113280 92743 206023 120401 91366 211767 106.3 98.5 102.8
6 Dhar 139124 122711 261835 125924 101375 227299 90.5 82.6 86.8
7 Rewa 163826 143424 307250 157555 128065 285620 96.2 89.3 93.0
8 Satna 131707 120248 251955 124691 113124 237815 94.7 94.1 94.4
9 Shahdol 109899 101684 211583 107744 98690 206434 98.0 97.1 97.6
10 Umaria 45429 40352 85781 42777 37326 80103 94.2 92.5 93.4
11 Sidhi 148221 134963 283184 149285 124355 273640 100.7 92.1 96.6
12 Chhatarpur 108548 93357 201905 110237 90270 200507 101.6 96.7 99.3
13 Panna 69339 57510 126849 67738 54370 122108 97.7 94.5 96.3
14 Tikamgarh 97788 82300 180088 98906 82039 180945 101.1 99.7 100.5
15 Mandsaur 79862 71315 151177 77392 68320 145712 96.9 95.8 96.4
16 Neemuch 47369 40993 88362 45413 38075 83488 95.9 92.9 94.5
17 Ratlam 90332 75269 165601 94633 73858 168491 104.8 98.1 101.7
18 Bhind 121957 95196 217153 130162 103410 233572 106.7 108.6 107.6
19 Damoh 94365 81233 175598 90307 78264 168571 95.7 96.3 96.0
20 Datia 51221 43171 94392 51836 44648 96484 101.2 103.4 102.2
21 Dewas 98586 92392 190978 95904 80574 176478 97.3 87.2 92.4
22 Jhabua 156645 124452 281097 136637 95606 232243 87.2 76.8 82.6
23 Khandwa 118594 102181 220775 118339 96692 215031 99.8 94.6 97.4
24 Khargone 115545 104947 220492 108913 91710 200623 94.3 87.4 91.0
25 Barwani 82818 76253 159071 71763 58222 129985 86.7 76.4 81.7
26 Mandla 71671 67482 139153 71043 65494 136537 99.1 97.1 98.1
27 Dindori 43343 40546 83889 41581 36918 78499 95.9 91.1 93.6
28 Morena 132670 109098 241768 136612 111957 248569 103.0 102.6 102.8
29 Sheopur 46500 37234 83734 48617 34758 83375 104.6 93.4 99.6
30 Seoni 93099 89775 182874 93785 88928 182713 100.7 99.1 99.9
31 Shajapur 101172 85267 186439 100120 83438 183558 99.0 97.9 98.5
32 Shivpuri 149048 117135 266183 143872 109447 253319 96.5 93.4 95.2
33 Vidisha 95941 84938 180879 100278 85848 186126 104.5 101.1 102.9
34 Balaghat 107377 104526 211903 108781 104932 213713 101.3 100.4 100.9
35 Gwalior 98051 79646 177697 98890 78139 177029 100.9 98.1 99.6
36 Bhopal 122426 104486 226912 113361 100774 214135 92.6 96.4 94.4
37 Narsinghpur 62852 56766 119618 63964 56535 120499 101.8 99.6 100.7
38 Hoshangabad 72154 63370 135524 71088 63370 134458 98.5 100.0 99.2
39 Harda 37955 30916 68871 37536 29113 66649 98.9 94.2 96.8
40 Indore 141201 121113 262314 125227 109016 234243 88.7 90.0 89.3
41 Chhindwara 142300 128698 270998 139756 120891 260647 98.2 93.9 96.2
42 Ujjain 160485 140474 300959 156357 128454 284811 97.4 91.4 94.6
43 Jabalpur 136115 126658 262773 131201 123641 254842 96.4 97.6 97.0
44 Katni 80972 67980 148952 77410 63724 141134 95.6 93.7 94.8
45 Sagar 119809 107217 227026 117704 102398 220102 98.2 95.5 97.0
Total 4580507 4005482 8585989 4485636 3777870 8263506 97.9 94.3 96.2
ANNEXURE-4: POPULATION, ENROLMENT AND GROSS ENROLMENT RATIO (PRIMARY)

45
E D U C AT I O N
S.No. District Population 11-14 years age group Enrolment at Middle Level GER Middle 11-14 age
(VI-VIII)
Boys Girls Total Boys Girls Total Boys Girls Total
Source: Lok Sampark Abhiyan (2000-01)
Note: Data includes all children (government + private)
1 Betul 41185 37456 78641 29881 24798 54679 72.6 66.2 69.5
2 Raisen 30250 22258 52508 22505 12598 35103 74.4 56.6 66.9
3 Rajgarh 39100 32635 71735 25377 18946 44323 64.9 58.1 61.8
4 Sehore 35957 27363 63320 29341 18801 48142 81.6 68.7 76.0
5 Guna 49525 34837 84362 34500 17583 52083 69.7 50.5 61.7
6 Dhar 56350 47453 103803 33207 24602 57809 58.9 51.8 55.7
7 Rewa 73696 58700 132396 54943 41042 95985 74.6 69.9 72.5
8 Satna 65018 51541 116559 54859 36851 91710 84.4 71.5 78.7
9 Shahdol 49529 43508 93037 44551 37134 81685 89.9 85.3 87.8
10 Umaria 19881 16527 36408 15904 11651 27555 80.0 70.5 75.7
11 Sidhi 65462 50892 116354 40023 23862 63885 61.1 46.9 54.9
12 Chhatarpur 44649 29331 73980 28369 13141 41510 63.5 44.8 56.1
13 Panna 24852 18952 43804 16351 9607 25958 65.8 50.7 59.3
14 Tikamgarh 39828 26340 66168 33204 10950 44154 83.4 41.6 66.7
15 Mandsaur 29420 19937 49357 25801 13509 39310 87.7 67.8 79.6
16 Neemuch 17248 11181 28429 15068 9421 24489 87.4 84.3 86.1
17 Ratlam 33537 21897 55434 22029 11459 33488 65.7 52.3 60.4
18 Bhind 52008 34793 86801 49812 31558 81370 95.8 90.7 93.7
19 Damoh 35218 25217 60435 29149 18475 47624 82.8 73.3 78.8
20 Datia 21496 14115 35611 16835 8854 25689 78.3 62.7 72.1
21 Dewas 44037 32121 76158 34832 19649 54481 79.1 61.2 71.5
22 Jhabua 50581 42732 93313 17915 10933 28848 35.4 25.6 30.9
23 Khandwa 43148 32675 75823 27709 18227 45936 64.2 55.8 60.6
24 Khargone 48947 35019 83966 31783 20878 52661 64.9 59.6 62.7
25 Barwani 30653 23529 54182 13176 8856 22032 43.0 37.6 40.7
26 Mandla 27577 22439 50016 24918 16996 41914 90.4 75.7 83.8
27 Dindori 16068 12506 28574 11838 8811 20649 73.7 70.5 72.3
28 Morena 58738 34103 92841 52954 28887 81841 90.2 84.7 88.2
29 Sheopur 20433 12393 32826 10257 3691 13948 50.2 29.8 42.5
30 Seoni 38095 34272 72367 26660 21890 48550 70.0 63.9 67.1
31 Shajapur 37245 18939 56184 33411 14224 47635 89.7 75.1 84.8
32 Shivpuri 36951 19181 56132 30951 10742 41693 83.8 56.0 74.3
33 Vidisha 36855 23553 60408 23760 12106 35866 64.5 51.4 59.4
34 Balaghat 62195 59228 121423 52126 48908 101034 83.8 82.6 83.2
35 Gwalior 52021 39469 91490 31709 21595 53304 61.0 54.7 58.3
36 Bhopal 56880 45830 102710 50044 40498 90542 88.0 88.4 88.2
37 Narsinghpur 27954 21712 49666 21489 15507 36996 76.9 71.4 74.5
38 Hoshangabad 32538 25471 58009 24791 17604 42395 76.2 69.1 73.1
39 Harda 19374 14664 34038 14361 9149 23510 74.1 62.4 69.1
40 Indore 65270 55690 120960 57473 47711 105184 88.1 85.7 87.0
41 Chhindwara 59209 53149 112358 39019 32862 71881 65.9 61.8 64.0
42 Ujjain 57450 48972 106422 41907 27910 69817 72.9 57.0 65.6
43 Jabalpur 36273 27350 63623 30234 22343 52577 83.4 81.7 82.6
44 Katni 32827 22292 55119 28139 16621 44760 85.7 74.6 81.2
45 Sagar 55326 39631 94957 43252 26516 69768 78.2 66.9 73.5
Total 1870854 1421853 3292707 1396417 917956 2314373 74.6 64.6 70.3
ANNEXURE-5: POPULATION, ENROLMENT AND GROSS ENROLMENT RATIO (MIDDLE)

E D U C AT I O N
46
S.No. District Dropouts Never Enrolled of 6-14 age Total Out of School of 6-14 age(Class 1-8)
Boys Girls Total Boys Girls Total Boys Girls Total
Source: Lok Sampark Abhiyan (2000-01)Note: Data includes all children (government + private)
1 Betul 4236 4256 8492 3942 5740 9682 8178 9996 18174
2 Raisen 1802 2016 3818 3249 3528 6777 5051 5544 10595
3 Rajgarh 5623 7677 13300 10194 13176 23370 15817 20853 36670
4 Sehore 4041 7354 11395 10157 13894 24051 14198 21248 35446
5 Guna 4952 5535 10487 11771 15039 26810 16723 20574 37297
6 Dhar 10387 11160 21547 29539 34230 63769 39926 45390 85316
7 Rewa 6082 6731 12813 13473 23755 37228 19555 30486 50041
8 Satna 3210 3616 6826 9523 10998 20521 12733 14614 27347
9 Shahdol 4531 4482 9013 6547 7333 13880 11078 11815 22893
10 Umaria 1751 2817 4568 3301 4662 7963 5052 7479 12531
11 Sidhi 5471 6109 11580 21286 34652 55938 26757 40761 67518
12 Chhatarpur 3600 4107 7707 11422 13276 24698 15022 17383 32405
13 Panna 2425 2547 4972 8287 9405 17692 10712 11952 22664
14 Tikamgarh 1902 1888 3790 11328 11554 22882 13230 13442 26672
15 Mandsaur 1326 1799 3125 3291 4378 7669 4617 6177 10794
16 Neemuch 1273 1812 3085 2863 2866 5729 4136 4678 8814
17 Ratlam 3520 3372 6892 2642 3511 6153 6162 6883 13045
18 Bhind 694 928 1622 2372 2316 4688 3066 3244 6310
19 Damoh 3775 4023 7798 5445 6002 11447 9220 10025 19245
20 Datia 558 599 1157 1672 1783 3455 2230 2382 4612
21 Dewas 3749 5495 9244 6158 10637 16795 9907 16132 26039
22 Jhabua 10098 7970 18068 37771 45707 83478 47869 53677 101546
23 Khandwa 5755 5216 10971 14318 15848 30166 20073 21064 41137
24 Khargone 6412 6561 12973 14288 16161 30449 20700 22722 43422
25 Barwani 6336 5607 11943 21459 24265 45724 27795 29872 57667
26 Mandla 3019 3904 6923 2014 2368 4382 5033 6272 11305
27 Dindori 3405 4040 7445 2639 2922 5561 6044 6962 13006
28 Morena 883 1302 2185 1935 2150 4085 2818 3452 6270
29 Sheopur 2284 2363 4647 5802 8581 14383 8086 10944 19030
30 Seoni 4233 4066 8299 6574 7546 14120 10807 11612 22419
31 Shajapur 2386 2930 5316 2756 3707 6463 5142 6637 11779
32 Shivpuri 4462 5212 9674 5737 8469 14206 10199 13681 23880
33 Vidisha 1545 1314 2859 6136 6788 12924 7681 8102 15783
34 Balaghat 6116 6086 12202 5024 5969 10993 11140 12055 23195
35 Gwalior 2966 3077 6043 12535 12992 25527 15501 16069 31570
36 Bhopal 1386 1686 3072 10980 7164 18144 12366 8850 21216
37 Narsinghpur 1493 1722 3215 3740 4341 8081 5233 6063 11296
38 Hoshangabad 2437 2768 5205 8451 11081 19532 10888 13849 24737
39 Harda 1859 1799 3658 4551 5528 10079 6410 7327 13737
40 Indore 5436 6482 11918 24173 23523 47696 29609 30005 59614
41 Chhindwara 11377 11880 23257 14704 26140 40844 26081 38020 64101
42 Ujjain 8529 10628 19157 10996 17832 28828 19525 28460 47985
43 Jabalpur 6839 7374 14213 9515 9103 18618 16354 16477 32831
44 Katni 3336 4027 7363 7737 6892 14629 11073 10919 21992
45 Sagar 6729 8129 14858 8243 10454 18697 14972 18583 33555
Total 184229 204466 388695 420540 518266 938806 604769 722732 1327501
ANNEXURE-6: OUT OF SCHOOL CHILDREN

47
E D U C AT I O N
S. No District Literacy % in 1991 Literacy % in 2001 Literacy growth in decade (1991-2001)
Total Male Female Total Male Female Total * Male Female
Source: Lok Sampark Abhiyan (2000-01)Note: Data includes all children (government + private)
1 Betul 45.89 57.42 33.90 66.87 77.31 56.05 20.98 19.89 22.15
2 Raisen 40.76 54.02 25.47 72.76 82.18 61.89 32.00 28.16 36.42
3 Rajgarh 31.81 46.73 15.62 54.05 69.53 37.37 22.24 22.80 21.75
4 Sehore 40.43 56.90 21.99 63.83 78.14 47.95 23.40 21.24 25.96
5 Guna 34.58 48.86 17.99 59.93 74.70 43.06 25.35 25.84 25.07
6 Dhar 34.54 47.62 20.71 52.70 66.18 38.62 18.16 18.56 17.91
7 Rewa 44.38 60.67 26.88 62.33 75.97 47.83 17.95 15.30 20.95
8 Satna 44.65 60.03 27.80 65.12 77.82 51.40 20.47 17.79 23.60
9 Shadol 35.45 48.93 20.93 57.76 69.55 45.40 22.31 20.62 24.47
10 Umaria 32.63 46.85 17.43 60.26 74.11 45.57 27.63 27.26 28.14
11 Sidhi 29.15 43.23 13.61 52.82 68.03 36.43 23.67 24.80 22.82
12 Chatarpur 35.20 46.87 21.32 53.44 65.50 39.38 18.24 18.63 18.06
13 Panna 33.68 46.29 19.41 61.61 74.02 47.84 27.93 27.73 28.43
14 Tikamgarh 34.78 47.52 19.96 55.80 68.83 40.98 21.02 21.31 21.02
15 Mandsaur 47.66 66.98 27.24 70.65 85.77 54.87 22.99 18.79 27.63
16 Neemuch 50.27 69.34 30.04 66.47 83.04 49.12 16.20 13.70 19.08
17 Ratlam 44.15 58.36 29.13 67.65 80.10 54.66 23.50 21.74 25.53
18 Bhind 49.23 66.20 28.20 71.22 84.06 55.73 21.99 17.86 27.53
19 Damoh 46.27 60.49 30.46 62.06 75.05 47.51 15.79 14.56 17.05
20 Datia 45.19 62.50 24.45 73.51 82.94 62.48 28.32 20.44 38.03
21 Dewas 44.08 61.15 25.57 61.04 76.07 44.90 16.96 14.92 19.33
22 Jhabua 19.01 26.29 11.52 37.08 48.75 25.50 18.07 22.46 13.98
23 Khandwa 45.49 58.53 31.53 61.71 74.09 48.46 16.22 15.56 16.93
24 Khargoan 41.23 55.43 26.09 63.41 75.23 50.89 22.18 19.80 24.80
25 Badwani 28.08 36.77 19.01 41.35 51.09 31.35 13.27 14.32 12.34
26 Mandla 37.02 50.45 23.48 60.77 76.71 45.39 23.75 26.26 21.91
27 Dindori 37.74 55.05 20.21 54.49 70.41 38.48 16.75 15.36 18.27
28 Morena 45.93 63.53 23.79 65.58 80.97 46.81 19.65 17.44 23.02
29 Sheopur 26.55 40.73 12.27 46.61 62.19 28.99 20.06 21.46 16.72
30 Seoni 44.49 57.50 31.14 65.88 77.50 54.06 21.39 20.00 22.92
31 Shajapur 39.20 56.99 19.77 71.14 83.68 57.58 31.94 26.69 37.81
32 Shivpuri 33.03 47.50 15.64 59.55 74.78 41.54 26.52 27.28 25.90
33 Vidisha 44.08 58.04 27.81 62.10 74.71 47.45 18.02 16.67 19.64
34 Balaghat 53.23 67.63 38.95 68.81 81.09 57.02 15.58 13.46 18.07
35 Gwalior 58.36 70.87 43.08 69.79 80.83 56.76 11.43 9.96 13.68
36 Bhopal 64.27 73.14 54.17 75.08 82.56 66.67 10.81 9.42 12.50
37 Narsingpur 55.65 68.44 41.59 78.34 86.79 69.02 22.69 18.35 27.43
38 Hoshangabad 54.11 67.19 39.29 70.36 81.36 58.02 16.25 14.17 18.73
39 Harda 48.84 62.54 33.76 66.82 78.45 54.14 17.98 15.91 20.38
40 Indore 66.32 77.99 53.35 74.82 84.32 63.96 8.50 6.33 10.61
41 Chindwara 44.90 56.65 32.52 66.03 76.70 54.82 21.13 20.05 22.30
42 Ujjain 49.06 64.25 32.64 71.18 83.70 57.87 22.12 19.45 25.23
43 Jabalpur 64.60 75.64 52.29 76.21 91.40 59.47 11.61 15.76 7.18
44 Katni 47.81 63.97 30.53 64.68 79.88 48.48 16.87 15.91 17.95
45 Sagar 53.44 67.02 37.78 68.08 79.96 54.50 14.64 12.94 16.72
M.P. 44.67 58.54 29.35 64.11 76.80 50.28 19.44 18.26 20.93
National 52.21 64.13 39.29 65.38 75.85 54.16 13.17 11.72 14.87
ANNEXURE-7: DISTRICT WISE LITERACY STATUS AS PER 2001 CENSUS

E D U C AT I O N
48
Equity Index of Participation Enrolment as per Lok Sampark Abhiyan - II (Year 2000) data
ANNEXURE-8
"DEFINITIONS
Equity
Equity Index of participation (Enrolment) : Equity in terms of share of target group in
Enrolment as against share of target group in population."
ST as % of total Enrolment
Tribal Equity Index = ---------------------------------------- X 100
ST as % of Target Population
Girls as % of total Enrolment
Gender Equity Index = ------------------------------------------- X 100
Girls as % of Target Population
SC+ST as % of total Enrolment
Social Equity Index = ----------------------------------------------- X 100
SC+ST as % of Target Population
Gross Enrolment Ratio (GER)
Enrolment Class 1 to 5
GER Primary = ----------------------------------------------- X 100
Target population 6 to 11 years
Enrolment Class 6 to 8
GER Middle = ------------------------------------------------ X 100
Target population 11 to 14 years
Enrolment Class 1 to 8
GER Elementary = ----------------------------------------------- X 100
Target population 6 to 14 years
Enrolment includes unde rage and over age children, so GER may be more than 100
Gross Access Ratio (GAR)
No of Habitations having Primary Schooling facility within 1 k.m.
GAR Primary = ------------------------------------------------------------------------------------------------- X 100
Total No of Habitations

49
E D U C AT I O N
District Gross Enrolment Ratio Primary by Gender & Caste Equity Index at Primary Level
Boys Girls SC ST Others Total Gender SC Tribal Social
Source: Lok Sampark Abhiyan (2000-01)
Note: Data includes all children (government + private)
Betul 104.7 101.6 105.2 ST 97.7 103.2 98.4 102.0 104.5 104.0Raisen 102.5 102.0 105.7 ST 100.1 102.2 99.8 103.4 103.7 103.6Rajgarh 97.1 86.0 89.8 ST 92.7 91.7 93.7 97.9 90.6 96.7Sehore 96.3 92.2 94.5 ST 96.4 94.3 97.7 100.1 88.3 96.0Guna 106.3 98.5 101.8 ST 104.0 102.8 95.8 99.0 96.4 97.9Dhar 90.5 82.6 84.8 ST 91.4 86.8 95.2 97.7 97.6 97.6Rewa 96.2 89.3 83.5 ST 92.3 93.0 96.1 89.8 111.0 101.3Satna 94.7 94.1 97.2 ST 94.8 94.4 99.7 103.0 94.8 99.2Shahdol 98.0 97.1 96.3 ST 98.2 97.6 99.5 98.7 99.7 99.5Umaria 94.2 92.5 92.8 ST 92.8 93.4 99.1 99.4 100.7 100.5Sidhi 100.7 92.1 95.9 ST 99.8 96.6 95.4 99.2 94.5 96.0Chhatarpur 101.6 96.7 98.5 ST 100.0 99.3 97.4 99.2 95.3 98.6Panna 97.7 94.5 94.8 ST 98.5 96.3 98.2 98.5 94.1 96.5Tikamgarh 101.1 99.7 100.0 ST 100.7 100.5 99.2 99.5 99.5 99.5Mandsaur 96.9 95.8 99.2 ST 95.5 96.4 99.4 103.0 104.0 103.1Neemuch 95.9 92.9 92.4 ST 95.9 94.5 98.3 97.8 90.0 94.9Ratlam 104.8 98.1 107.0 ST 102.4 101.7 96.4 105.1 95.9 99.1DPEP-I Total 98.8 94.0 96.5 ST 97.3 96.5 97.4 99.9 98.2 98.9Bhind 106.7 108.6 103.3 ST 109.0 107.6 101.0 96.1 73.4 95.7Damoh 95.7 96.3 92.8 ST 95.2 96.0 100.4 96.6 109.2 101.4Datia 101.2 103.4 102.6 ST 101.9 102.2 101.2 100.4 109.1 100.9Dewas 97.3 87.2 93.7 ST 98.2 92.4 94.4 101.4 79.5 91.6Jhabua 87.2 76.8 85.5 ST 101.0 82.6 93.0 103.5 98.3 98.5Khandwa 99.8 94.6 102.2 ST 105.6 97.4 97.2 104.9 87.3 91.8Khargone 94.3 87.4 91.0 ST 92.8 91.0 96.0 100.0 97.6 98.3Barwani 86.7 76.4 83.5 ST 88.9 81.7 93.4 102.2 97.2 97.6Mandla 99.1 97.1 96.7 ST 98.3 98.1 98.9 98.5 100.0 99.9Dindori 95.9 91.1 97.3 ST 95.6 93.6 97.3 104.0 98.8 99.2Morena 103.0 102.6 103.7 ST 102.5 102.8 99.8 100.9 106.6 101.1Sheopur 104.6 93.4 105.6 ST 102.5 99.6 93.8 106.1 87.7 95.7Seoni 100.7 99.1 99.7 ST 99.9 99.9 99.1 99.8 100.0 100.0Shajapur 99.0 97.9 98.3 ST 98.6 98.5 99.4 99.8 97.1 99.5Shivpuri 96.5 93.4 90.5 ST 99.9 95.2 98.2 95.1 86.6 91.7Vidisha 104.5 101.1 105.0 ST 102.2 102.9 98.2 102.0 100.9 101.8DPEP-II Total 97.9 93.7 97.8 ST 100.6 95.9 97.6 102.0 90.6 94.6DPEP-I+II Total 98.3 93.8 97.1 ST 98.8 96.3 97.5 100.9 94.1 96.7Balaghat 101.3 100.4 102.9 ST 102.0 100.9 99.5 102.0 96.2 97.5Gwalior 100.9 98.1 88.3 ST 104.9 99.6 98.5 88.7 84.3 88.0Bhopal 92.6 96.4 94.8 ST 95.2 94.4 102.2 100.5 84.0 96.8Narsinghpur 101.8 99.6 100.8 ST 100.5 100.7 98.9 100.0 101.0 100.5Hoshangabad 98.5 100.0 103.2 ST 97.8 99.2 100.8 104.0 102.7 103.4Harda 98.9 94.2 99.7 ST 102.8 96.8 97.3 103.0 85.8 92.8Indore 88.7 90.0 90.4 ST 89.4 89.3 100.8 101.2 95.0 99.6Chhindwara 98.2 93.9 101.3 ST 99.5 96.2 97.7 105.3 94.3 96.8Ujjain 97.4 91.4 93.6 ST 95.0 94.6 96.6 98.9 101.2 99.1Jabalpur 96.4 97.6 100.4 ST 95.7 97.0 100.7 103.5 100.5 101.8Katni 95.6 93.7 91.0 ST 96.9 94.8 98.9 96.0 97.1 96.7Sagar 98.2 95.5 98.0 ST 97.8 97.0 98.5 101.1 93.3 98.5Non DPEP 96.8 95.5 95.9 ST 97.1 96.2 99.3 99.7 96.5 98.2
Total (45 Dist) 97.9 94.3 96.7 ST 98.2 96.2 98.0 100.5 94.6 97.0
Total (45 Dist) 97.9 94.3 96.7 91.0 98.2 96.2 98.0 100.5 94.6 97.0
ANNEXURE-9

E D U C AT I O N
50
Testing year Class I Class IV
Language Mathematics Language Mathematics
Boys Girls Total Boys Girls Total Boys Girls Total Boys Girls Total
Baseline 1994 47.21 44.54 46.04 41.38 40.19 40.39 32.62 31.05 31.75 28.55 26.26 27.84
Mid-term 1997 56.56 54.77 56.04 55.72 49.73 53.42 36.73 35.97 36.47 29.17 26.50 28.36
Terminal 2001 76.35 75.11 75.75 77.18 74.85 76.04 60.43 60.17 60.31 52.71 51.40 52.12
Increase in 29.14 30.57 29.71 35.80 34.66 35.65 27.81 29.12 28.56 24.16 25.14 24.28
Achievement
Testing year Class I Class IV
Language Mathematics Language Mathematics
Boys Girls Total Boys Girls Total Boys Girls Total Boys Girls Total
*These tests were conducted by NCERT, New Delhi for districts covered under the centrally sponsered scheme District Primary Education programme (DPEP)
Baseline 1997 39.69 36.08 38.76 33.83 35.09 34.09 31.39 32.04 31.99 26.67 26.30 26.65
Mid-term 2000 55.33 53.68 54.95 61.68 65.10 62.07 43.17 42.10 43.05 33.64 36.88 35.78
Terminal tests are to be conducted Increase in Achievement
from Baseline to Mid-term 15.64 17.60 16.19 27.85 30.01 27.98 11.78 10.06 11.06 6.97 10.58 9.13tests
ANNEXURE-10: ACHIEVEMENT (IN MEAN%) OF STUDENTS IN LANGUAGE AND
MATHEMATICS IN BASE LINE TESTS (1994), MID-TERM TESTS(1997) AND TERMINAL
TESTS(2001) IN 17 DISTRICTS*
ANNEXURE-10: ACHIEVEMENT (IN MEAN %) OF STUDENTS IN LANGUAGE AND
MATHEMATICS IN BASE LINE TESTS (1997) AND MID-TERM TESTS (2000) IN 13
DISTRICTS*

51
E D U C AT I O N
District Population 6-14 years age group Enrolment at Elementary Level GER Elementary 6-14 age(I-VIII)
Boys Girls Total Boys Girls Total Boys Girls Total
Source: Lok Sampark Abhiyan(2000-01)
Note: Data includes all children (government + private)
1 Betul 149027 136706 285733 142819 125601 268420 95.8 91.9 93.9
2 Raisen 115810 97765 213575 110174 89618 199792 95.1 91.7 93.5
3 Rajgarh 133756 120039 253795 117263 94084 211347 87.7 78.4 83.3
4 Sehore 128810 110665 239475 118744 95576 214320 92.2 86.4 89.5
5 Guna 162805 127580 290385 154901 108949 263850 95.1 85.4 90.9
6 Dhar 195474 170164 365638 159131 125977 285108 81.4 74.0 78.0
7 Rewa 237522 202124 439646 212498 169107 381605 89.5 83.7 86.8
8 Satna 196725 171789 368514 179550 149975 329525 91.3 87.3 89.4
9 Shahdol 159428 145192 304620 152295 135824 288119 95.5 93.5 94.6
10 Umaria 65310 56879 122189 58681 48977 107658 89.8 86.1 88.1
11 Sidhi 213683 185855 399538 189308 148217 337525 88.6 79.7 84.5
12 Chhatarpur 153197 122688 275885 138606 103411 242017 90.5 84.3 87.7
13 Panna 94191 76462 170653 84089 63977 148066 89.3 83.7 86.8
14 Tikamgarh 137616 108640 246256 132110 92989 225099 96.0 85.6 91.4
15 Mandsaur 109282 91252 200534 103193 81829 185022 94.4 89.7 92.3
16 Neemuch 64617 52174 116791 60481 47496 107977 93.6 91.0 92.5
17 Ratlam 123869 97166 221035 116662 85317 201979 94.2 87.8 91.4
18 Bhind 173965 129989 303954 179974 134968 314942 103.5 103.8 103.6
19 Damoh 129583 106450 236033 119456 96739 216195 92.2 90.9 91.6
20 Datia 72717 57286 130003 68671 53502 122173 94.4 93.4 94.0
21 Dewas 142623 124513 267136 130736 100223 230959 91.7 80.5 86.5
22 Jhabua 207226 167184 374410 154552 106539 261091 74.6 63.7 69.7
23 Khandwa 161742 134856 296598 146048 114919 260967 90.3 85.2 88.0
24 Khargone 164492 139966 304458 140696 112588 253284 85.5 80.4 83.2
25 Barwani 113471 99782 213253 84939 67078 152017 74.9 67.2 71.3
26 Mandla 99248 89921 189169 95961 82490 178451 96.7 91.7 94.3
27 Dindori 59411 53052 112463 53419 45729 99148 89.9 86.2 88.2
28 Morena 191408 143201 334609 189566 140844 330410 99.0 98.4 98.7
29 Sheopur 66933 49627 116560 58874 38449 97323 88.0 77.5 83.5
30 Seoni 131194 124047 255241 120445 110818 231263 91.8 89.3 90.6
31 Shajapur 138417 104206 242623 133531 97662 231193 96.5 93.7 95.3
32 Shivpuri 185999 136316 322315 174823 120189 295012 94.0 88.2 91.5
33 Vidisha 132796 108491 241287 124038 97954 221992 93.4 90.3 92.0
34 Balaghat 169572 163754 333326 160907 153840 314747 94.9 93.9 94.4
35 Gwalior 150072 119115 269187 130599 99734 230333 87.0 83.7 85.6
36 Bhopal 179306 150316 329622 163405 141272 304677 91.1 94.0 92.4
37 Narsinghpur 90806 78478 169284 85453 72042 157495 94.1 91.8 93.0
38 Hoshangabad 104692 88841 193533 95879 80974 176853 91.6 91.1 91.4
39 Harda 57329 45580 102909 51897 38262 90159 90.5 83.9 87.6
40 Indore 206471 176803 383274 182700 156727 339427 88.5 88.6 88.6
41 Chhindwara 201509 181847 383356 178775 153753 332528 88.7 84.6 86.7
42 Ujjain 217935 189446 407381 198264 156364 354628 91.0 82.5 87.1
43 Jabalpur 172388 154008 326396 161435 145984 307419 93.6 94.8 94.2
44 Katni 113799 90272 204071 105549 80345 185894 92.8 89.0 91.1
45 Sagar 175135 146848 321983 160956 128914 289870 91.9 87.8 90.0Total 6451361 5427335 11878696 5882053 4695826 10577879 91.2 86.5 89.0
ANNEXURE-11: POPULATION, ENROLMENT AND GROSS ENROLMENT RATIO (ELEMENTRY)

52

1. BACKGROUND
Within the human development sector, delivery of effectivepublic health services is the most daunting challenge facingMadhya Pradesh. Several national level evaluations haveshown that Madhya Pradesh along with Orissa are amongstthe two States that have the lowest indicators. However, a positive signal that has emerged from Census 2001 is that, forthe first time, the growth in population has shown a decliningtrend. Given the fact that health indicators have not dramati-cally improved, this decline could be attributed to cumulativeoutcome of multiple initiatives that have happened in the statein the area of women empowerment, female literacy, girls education and political decentralisation which providedbrought women into public space.
The management of health care if imaginatively restruc-tured, can benefit from the multiple energies that get releasedin this process of decentralisation. Health sector can use thisopportunity to move back to a desirable framework of com-prehensive health care from the trap of selective health care into which it has fallen. Political decentralisation provides themulti-sectoral institutional framework into which such anagenda can be seeded. The need to shift to comprehensivehealth care, strengthen community health action and workthrough institutional arrangement created by political decentralisation has informed the new health policy of theGovernment of India and has been a recurring theme at thePeople’s Health Assembly held in 2001 in Dhaka. The recentinitiatives of the government of Madhya Pradesh of constitut-ing a Mission for Community Health for decentralisation ofhealth care, the creation of a multi-sectoral forum at the district level of the District Health Society and at the state levelof a State Health Society are steps in this directions.
In the last decade, while the state of Madhya Pradesh hasmade considerable gains and moved both in its institutionalset up and in its programmatic framework in many fields, theproblems of health are a challenge for everyone. Since its for-mation in 1956, there has been sustained state action toimprove the health of the people of Madhya Pradesh, throughan ever-increasing provision of health services. This has
resulted in health indicators improving over the years.Among the many reasons for persistent poor state of
health in the state is that health care delivery infrastructure inthe state is still not adequate enough to meet out the healthneeds of the people in an efficient and cost effective manner.Given the geographical vastness of the state and its very sharpsocial cultural and economic diversity, it is abundantly clearthat substantial inputs are still needed for the development ofhealthy human resources in the state. The population densityof Madhya Pradesh is low, 183 persons per square kilometres,as against 324 persons per square kilometres for India1. Thushealth centres, planned and established on population normsare not spatially as accessible and plenty as required2. MadhyaPradesh has a large forest cover that excludes large areas fromaccess, and build up of social and economic infrastructure.Around 18000 of the 51806 villages of Madhya Pradesh areeither forest villages or are on the periphery of a forest, and aredirectly affected by forests and rules and regulations governingthem. With a large population of tribal communities residingin such villages, provision of health services and their access isdifficult for communities residing in these villages.
This chapter is divided into three sections. The first sections deals with the state of health in Madhya Pradesh.Covering different indicators of health, and related issues suchas nutrition, sanitation, drinking water etc., this section putsforward the picture of health. Attempt is also made to high-light, gender, social and regional differences within the state.The next section talks of the institutional response to health,the government health services, the role of the private sector,and tries to highlight major policy and programmes in health,with comments on their efficiency and impact. The third section deals with the challenge of health.
2. STATE OF HEALTH
The state of Madhya Pradesh has recently (2000) been dividedinto Madhya Pradesh and the newly carved state ofChhattisgarh. Information and data available for most healthparameters till recently was for the undivided state of MadhyaPradesh. While time series data pertaining to the new state of
The Challenge in Health:To Build from Below
53
1. Provisional Population Totals, Census of India 2001, Registrar General of India, New Delhi.
2. India’s population density is 324 persons per square kilometre while that of Madhya Pradesh is 196 persons per square kilometre in 2001 (Census of India 2001).

Madhya Pradesh is not available, some data is now availablefor latest years on crucial health indicators, or is just becom-ing available, and shall be used as and where possible.
2.1 Life Expectancy and Death Rates Life expectancy at birth (e0)3 is the most comprehensive indi-cator of health. A better health status can be safely assumed togive a better life expectancy to people. The latest estimate forLife Expectancy at Birth in Madhya Pradesh was 55.2 years forthe period 1992-964. While this is a considerable jump from47.2 years for the period 1970-75 and 49.0 years for 1976-80,it is far behind the national life expectancy of 60.7 years atbirth. Within the state there are geographical differences in lifeexpectancy, with rural life expectancy of 53.7 years substan-tially less than urban life expectancy of 63 years.
Male life expectancy in 1992-96 is little higher than thatof females (55.1 years to 54.7 years). The female have biologi-cal superiority in terms of better survival and therefore tocompare male and female life expectancies, we assume thatfemale life expectancy should be about five years more thanmales. Therefore the near equal life expectancy of males andfemales in effect show that females in comparison to men donot enjoy an equal health status.
The death rate of Madhya Pradesh in 2000 was 10.25 per1000 population, and this is 20 percent higher than the Deathrate for all India. Over the last two decades there has been asharp decline in the death rate from 15.2 in 1980 for the undi-vided state to 10.2 for the new state today. The death rate inrural Madhya Pradesh was assessed at 11.0, while urban deathrate was 7.5.
H E A LT H
54
1970-75 45.7 48.0 2.3 4.8% 44.8 48.9 46.6 47.1
1981-85 50.0 53.7 3.7 6.9% 50.0 54.0 50.2 53.6
1991-95 53.2 58.9 5.7 9.7% 53.4 58.5 52.9 59.3
1992-96 53.7 59.4 5.7 9.6% 53.9 58.9 53.4 59.8
1970-75 56.6 58.9 2.3 3.9% 57.1 58.8 56.3 59.2
1981-85 60.3 62.8 2.5 4.0% 59.4 61.6 61.4 64.1
1991-95 62.8 65.9 3.1 4.7% 61.1 64.5 63.0 67.3
1992-96 63.0 66.3 3.3 5.0% 61.6 64.9 63.4 67.7
1970-75 47.2 49.7 2.5 5.0% 46.3 50.5 47.6 49.0
1981-85 51.6 55.5 3.9 7.0% 51.5 55.4 51.9 55.7
1991-95 54.7 60.3 5.6 9.3% 54.7 59.7 54.6 60.9
1992-96 55.2 60.7 5.5 9.1% 55.1 60.1 54.7 61.4
Year Total
Total Male Female
MP India Difference in Years % age Madhya Pradesh India Madhya Pradesh India
Year Rural
Total Male Female
MP India Difference in Years % age Madhya Pradesh India Madhya Pradesh India
Year Urban
Total Male Female
MP India Difference in Years % age Madhya Pradesh India Madhya Pradesh India
Table 1: Estimates of Life Expectancy at Birth in Madhya Pradesh
3. Life Expectancy is the number of years a newborn is expected to live at the time of his or her birth. Life expectancy is different for different ages, and also changes over time, with
medical and health systems improving and so on.
4. The best estimates for life expectancy are provided by the Sample Registration Scheme (SRS) of the Registrar General of India, and reference to any data from this scheme will be
referred to as SRS.
5. This data pertains to the new state of Madhya Pradesh, SRS October 2001.
Source: Various Volumes of Sample Registration Scheme, Registrar General of India, New Delhi

2.2 Infant and child mortalityState of Infant and child mortality would perhaps be the bestassessment of the state of basic health care, quality and reachof health delivery, general environment for health, crucialhealth determinants such as nutrition, sanitation, safe drinking water etc. It would also be a very good determinantof the performance of development initiatives that focus onpoverty, backwardness, gender equity, and even empower-ment. Infants (up to the age of one year) and children (up tothe age of five) die prematurely of causes such as low birthweight, pneumonia, and certain vaccine preventable diseasessuch as measles, every one of which is preventable throughprimary health care interventions. While the state, and agen-cies involved with health have made provisions and extensiveprogrammes and systems to enable immunisation of all chil-dren, provide them with vitamin A supplements, encouragepaediatric care, the number of infants and children dying prematurely is very high.
The Infant Mortality Rate for the new Madhya Pradeshhas been estimated by SRS6 at 88 in 2000. The rural IMR is 94,while urban IMR 54. The national IMR at the same time was68. Madhya Pradesh falls amongst the lowest in IMR com-pared with other states. The trends of IMR for the undividedMadhya Pradesh and India are depicted in Graph 1.
In terms of gender differences in IMR, SRS has recentlyalso provided information for new Madhya Pradesh, but forthe year 1999. Although the girl child is a stronger baby thanher brothers, and should naturally have a lower mortality, thisis not the case. The male and female IMRs were estimated at89.6 and 89.5 for entire state, and 94.9 and 96.8 for rural areas.It is only in urban areas that the female IMR of 50.7 is lower
than the male IMR of 59.6. The gap between female and maleinfant mortality has reduced as compared to the last decadewhich is an important step towards the direction of equity ofstatus.
In the first year after birth, mortality of infants is cate-gorised into three periods, and these are based on the qualityand magnitude of risk faced by an infant in its various stagesof growth. These are termed as early neo-natal7, neo-natal8
and post natal. Post natal and neo-natal mortality rates arepresented in Table 2. The data shows that since 1980 post-natal mortality rate in Madhya Pradesh declined from 56.9 to30.4 (decline by nearly half), accounting for 40 percent ofinfant deaths in 1980 to 32 percent of infant deaths in 1999.The decline in peri-natal mortality was much lesser, from 64in 1980 to 56 to 1999, a reduction by just 12.5 percent.National Family Health Survey 29 (conducted in 1998-99)reported an infant mortality rate of 86 for the new MadhyaPradesh, and neo-natal mortality of 54.9, accounting foralmost two thirds of all infant deaths.
There is encouraging decline in post-natal mortality,however the situation in case of neo-natal mortality remains aworry. Any reduction in mortality in this period would have asignificant impact on survival of children. The main causes ofearly neo-natal and neo-natal mortality are tetanus, complica-tions in birth, birth related injuries, sepsis, etc. These can bedirectly controlled by early tetanus immunisation of mothersduring pregnancy and child after birth, and proper attendanceduring delivery, preferably institutional deliveries.
55
H E A LT H
6. Sample Registration Scheme of the Registrar General of India. This undertaken periodic surveys in every state to determine crucial health indicators.
7. Infant death within the first week of birth
8. Infant death within the first month of birth
9. Report on India – National Family Health Survey 2, 1998/99, International Institute for Population Studies, Mumbai
10. Child Mortality is the probability of dying between the first and fifth birthday.
Graph 1: IMR in Madhya Pradesh and India:
1980 to 1999
160
120
80
40
0
1980 1982 1984 1986 1988 1990 1992 1994 1996 1998
Year
Madhya Pradesh
India
NFHS 1 MP: 1988-92 53.2 32 85.2 49.3 130.3
NFHS 2 MP: 1994-98 54.9 31.2 86.1 56.4 137.6
Change in 7 years 103.2% 97.5% 101.1% 114.4% 105.6%
NFHS 2: India 43.4 24.2 67.6 29.3 94.9
SRS 1992 63.9 39.7 104
SRS 1997 64.0 30.4 94
Change in 5 years 100.2% 76.6% 90.4%
Survey and Year Neonatal Post Infant Child Under 5
Mortality neonatal Mortality Mortality Mortality
Mortality
Source : NFHS I and II, Various Volumes of SRS
Table 2: Comparison of Child Mortality10
Figures from National Family Health
Surveys and Sample Registration Scheme
(undivided Madhya Pradesh)

The child mortality rate of Madhya Pradesh assessed inthe NFHS 2 survey was 56.4, nearly double of the nationalaverage. The age specific mortality rates provided by SRS alsoshow a similar picture.
Factors behind Infant DeathsAn attack on high infant and child mortality in particular hasbeen led by programmes for universal immunisation, promot-ing and ensuring hygienic and safe delivery practices, promot-ing better natal and child care etc. National Family HealthSurvey 2 shows that in 1998 in Madhya Pradesh only 22.4 per-cent children received the entire dosage of vaccines, indicatingnearly eighty percent of children in Madhya Pradesh arepotentially vulnerable to preventable diseases.
The recently conducted multi-indicator cluster surveysand coverage evaluation survey results are encouraging,and they confirm that the percentage of fully immunised children has gone up to 50%, showing a jump of nearly 25percentage points and an improvement in access of immuni-sation services.
The NSS survey data shows that it is easier to ensure thatinfants receive their first dose in the case of multiple dose vaccines. There is a lot of dropping off of infants for each successive dose. Children, who receive the first dosage, startmissing out on further doses subsequently.
Diarrhoea is a common disease afflicting children. In thecontrol of diarrhoea, basic oral re-hydration is the bestmethod. This form is also promoted through state wide promotion of ORT, which aims to increase awareness amongstwomen and within the community on dehydration from diarrhoea, how to treat it and simultaneously ensure widespread availability of Oral re-hydration salts. NFHS 2gives an idea of the impact of this and other associated programmes. In 1998/99, while 23 percent children aged up to3 years had suffered from diarrhoea within a fortnight ofthe survey, 30 percent of these children were given oral re-hydration salts, whereas 46 percent received some form oforal re-hydration therapy.
Post birth, infants and children need regular paediatriccare. NSS 52nd Round found that 57 percent children inMadhya Pradesh were registered for paediatric care. Of the
children going for paediatric care, 67.5 percent did so with ahospital, 16 percent with a doctor, and another 16 percentwith an ANM or local health worker. The reach of paediatriccare clearly needs to be doubled covering every single child.
2.3 Age Specific Death RatesIf we analyse information on age specific death rates with esti-mated population in these age groups, it tells us about the agegroups where more deaths are taking place (see Graph 2) Themaximum deaths occur in the age group of 0-4, a share of 37percent of all deaths. If for a moment we accept that all deathsin the age group 50 and below are the main concern for the health system, then the child deaths (0-4 years) make up for 62 percent of such mortality. Any attempt toimprove health will therefore have to re-emphasise and focusto address pre-mature mortality between the ages of 0-4 yearswith priority.
A comparison of the age specific death rates for India andMadhya Pradesh in Graph 3 shows that the substantial differ-ence in death rates between India and Madhya Pradesh is upto the ages 0-24 years. The difference in death rates remainsmore moderate after that. The high differential in early yearsclearly points out to the main areas of weakness in the healthof the state.
H E A LT H
56
Source : NFHS2 and NSS 52nd round
1_ Months DPT – I, Polio – I
2_ Months DPT – II, Polio – II
3_ Months DPT – III, Polio – III
9 Months Measles
18 Months DPT Booster, Polio Booster
5 Years DT
At birth BCG
Immunisation Schedule for Children
Measles 0-4 43.4 Measles 64.5
OPV 0 47.3 Polio 1 37.1
1 21.8 Polio 2 43.0
2 19.9 Polio 3 53.1
3-4 23.1
BCG 0 35.3 12-23 months 35.1
1-4 20.4
0-4 24.1
DPT 0 47.1 DPT 1 38.7
1 24.2 DPT 2 46.5
2 22.9 DPT 3 56.3
3-4 29.0
Vaccination NSS 52nd Round NFHS 2
Age of Children who Vaccination for Children who
Child never received ages 12-13 did not
vaccination months receive
(NSS) – 1995/96 vaccination
(NFHS2) – 1998
Table 3: Estimates of NFHS 2 and NSS
52nd Round on Children Receiving
Vaccination, 1995-96

What are the causes of such high mortality in these earlyyears? There is lot of evidence to show the causes – we haveseen evidence of poor immunisation above, and we will seelater in this chapter that poor nutrition, poor medical andgeneral care during childhood, neglect of girl child and poorinfrastructure in terms of road network are significant contributory factors.
2.4 Fertility, Birth Rates and Maternal HealthThe fertility rate in Madhya Pradesh for 1997 was 4.011, muchhigher than national Total Fertility Rate (TFR) of 3.3, and farfrom the targeted net replacement rate of TFR of 2.1. At thecurrent rate of decline of TFR, it will take at least another thirty years for Madhya Pradesh to achieve a net replacementrate of 2.1 (the case is similar for rural Madhya Pradesh). TheTotal Fertility Rates for rural Madhya Pradesh was 4.4, and 2.6for urban areas.
In Madhya Pradesh the maternal mortality rate was 498
57
H E A LT H
Graph 2: Deaths by Age Group
in MP, 1996
70+, 20.5%
60-69, 12.6%
50-59, 8.9%
40-49, 5.2%
30-39, 4.2%
20-29, 4.5%
10-19, 3.2%
5-9, 3.6%
0-4, 37.3%
11. SRS Estimates for 1997
Graph 3: Age Specific Death rate - MP and India, 1996
120
100
80
60
40
20
0
0-4 10-15 20-24 30-34 40-44 50-54 60-64 70+
India
Madhya Pradesh
Difference

deaths per 1,00,000 live births (all India was 408) according toSRS in 1998. Let us take a look at the situation of health services for women and pregnant mothers.
The 52nd survey of NSS in 1995/9612 found that 41.7 percent pregnant women were actually registered for pre-natal care in Madhya Pradesh. The most important source for pre-natal care of pregnant women was public hospitals (43 percent) and Primary Health Centres (PHC) (42.6 percent) in rural areas and public hospitals (56.3 percent) inurban areas. In terms of pre-natal medical services, only 27 percent pregnant women had received both the requireddose of tetanus toxoid and 40 percent had received IFA tablets.Only 16.4 of all deliveries were in a health institution inMadhya Pradesh. Further, 36 percent deliveries did not haveany attendance during delivery (39 percent in rural MadhyaPradesh). At the current birth rate, we can expect that over six and a half lakh children born in a year are delivered with-out “proper” attendance. This large number of unattendeddeliveries would explain to a large extent the one and a halflakh plus infant deaths that take place in Madhya Pradesh incurrent years.
The NSS findings are supported by the NFHS 2 survey in 1998, in which 55 percent mothers received two or more doses of tetanus toxoid, and almost half the mothersreceived iron and folic acid tablets or syrup. About 11 percentmothers received antenatal check up through home visit,and another 51 percent mothers received antenatal check upoutside home.
It is evident that the number of women seeking pre-natal basic care is low, number of women protected from tetanus and anaemia is low, and a large number are exposed to risks of child birth. Another contributing factor to women’s health is low age at effective marriage.NFHS 2 found that age at effective marriage in rural MadhyaPradesh is was 15.5 years with average age of first born 18.1 years. Low age at effective marriage puts girls at risk ofmotherhood in early ages.
2.5 The Disease BurdenExact rates of morbidity or affliction of diseases are difficult toestimate. There is information on morbidity rates for diseaseshandled through vertical programmes of Government ofIndia through their MIS systems. Some of these diseases aremalaria, tuberculosis, leprosy, and blindness.
Some indirect measures are available from the NHFS survey and NSS 52nd Round. NSS gives three estimates from itssurvey. It found that nearly one out of every twenty five persons in rural Madhya Pradesh was ill the period of fifteendays preceding the survey. Applying this percentage to population size, we find that the number of ill at any point oftime would be approximately eighteen lakhs in rural Madhya
Pradesh. The data from NSS however does show that the per-sons reporting ailments are amongst the lowest compared tothe other major states in India.
The morbidity level of children from acute respiratoryinfection, diarrhoea and fever is in the second section of Table5. While nearly quarter children suffer from diarrhoea at anypoint of time, thirty percent have symptoms of acute respira-tory infection. The NHFS survey found that about half of thechildren with ARI did not receive health care from any healthfacility or health provider, and ARI and related infections arethe common killers of infants and children.
H E A LT H
58
12. Sarvekshana, 82nd Issue, NSSO, Government of India, page 31
India 5.4 5.7 5.5
Madhya Pradesh 4.0 4.3 4.1
Percentage persons reporting any ailment during the last 15 days
by sex for all types of ailments
Male Female Person
Source: Morbidity and Treatment of Ailments NSS Fifty-second Round
Table 4: Rural Persons Reporting Illness,
NSS 52nd Round
MP 2.273 0.602 0.520 1.927 10.015
India 2.468 0.544 0.432 1.361 3.697
MP 29.2 31.0 23.4 4.3 57.9
India 19.3 29.5 19.2 2.6 64.0
Morbidity
Percentage of persons suffering from:
Asthma Tuberculosis Medically Jaundice Malaria
treated during past during the
tuberculosis 12 months past 3
months
Prevalence of acute respiratory infection, fever and diarrhoea
Percentage of children under age 3 years
suffering in past two weeks from:
Cough Fever Diarrhoea Percentage
accom- Any Diarrhoea with ARI
panied by diarrhoea with blood taken to
fast brea- health
thing (ARI) facility or
provider
Source: NFHS- 2
Table 5: Percentage of Persons Suffering
from Diseases, NFHS 2, 1998

3. DETERMINANTS OF HEALTH
Health is determined by many factors that are personal,economic and social. It is convincingly argued that the mostcrucial determinant of health is poverty. We shall not dwellinto poverty directly here, but discuss more direct determi-nants of health, which are also associated with poverty —nutrition, sanitation, drinking water etc.
3.1 NutritionThe nutritional status of any population is a complex andcomposite entity, being a reflection of overall socio-economicstatus and stratification, livelihood and food security, intra-household food distribution patterns, food related practicesand dietary habits. In addition, the effectiveness of variousnutritional supplementation programmes, including those formicronutrient supplementation, affects the nutritional statusof a community.
3.1.1 Household food expenditure The disposable income available to a household, and the related expenditure is one of the most important determinantsof the quantity and quality of the household’s food intake. Inthis context, the Mean Per capita Expenditure per month forrural India is Rs. 287.1. The situation of Madhya Pradesh incomparison to other selected states is shown is Table 6.
What emerges from an All-India comparison is thatMadhya Pradesh has the lowest per capita expenditure on foodamongst all the Indian states. This is primarily a manifestationof widespread poverty and lack of livelihood security, and isarguably the most important factor, responsible for determin-ing the poor nutritional status of people in the state.
3.1.2 Availability of FoodPer capita consumption of food grains is one key indicatorlinked to food security. In this context, Madhya Pradesh has a
lower per capita food grain consumption level (13.5 kg. permonth). The combination in Madhya Pradesh of low annualper capita income (Rs. 4166) and low food grain consumptionis not positive at all for a good healthy population, and it isunlikely that the basic caloric requirements are met by other,non-food grain sources. This tends to indicate an overalldeficit of food intake. On the other hand, certain states with acomparatively higher annual per capita income, such as Kerala(PCI - Rs. 5778), Gujarat (PCI - Rs. 5288) and North-easternstates (PCI - Rs. 5070) also have somewhat low food grainconsumption but this is mainly because of dietary practiceswhich favour non-grain food intake.
3.1.3 Food intake among vulnerable groupsGiven this background of household food expenditure, wemay briefly examine the situation of food intake by variousvulnerable groups, particularly women and the tribal popula-tion, especially tribal children.
59
H E A LT H
Madhya Pradesh 128.6 79.4 208.0
Orissa 145.2 65.4 210.6
Bihar 151.6 66.5 218.1
Uttar Pradesh 192.5 113.4 305.9
Rajasthan 243.5 166.8 410.3
Gujarat 191.5 99.6 291.1
Punjab 320.3 234.2 554.5
All India 183.3 103.8 287.1
State Food Non-food Total
expenditure expenditure
Source: NCAER, India: Human Development Report, 1999
Table 6: Estimated Per Capita Expenditure
(Rs) per month for Selected States
Madhya Pradesh 13.5 15.7 20.4
Orissa 16.4 18.6 16.7
Bihar 14.8 49.5 29.2
Uttar Pradesh 15.2 33.4 24.5
Rajasthan 17.6 33.1 14.7
Gujarat 10.1 17.3 18.1
Punjab 14.3 23.4 5.5
All India 14.3 19.0 23.5
State Per capita food Quantity of cereals Percentage
grain consumption (kg) bought from requirement of
per month (kg) PDS per hh / month cereals met
by PDS
Source: NCAER, India: Human Development Report, 1999
Table 7: Per Capita Food Grain Consumption
and Utilisation of PDS for Selected States
Milk or curd 20.3 12.1
Pulses or beans 43.0 36.9
Green, leafy vegetable 40.9 40.1
Other vegetables 53.0 33.1
Fruits 5.0 17.6
Eggs 0.9 10.8
Chicken, meat or fish 0.5 10.7
Type of food Daily Weekly
Source: NFHS –2, Madhya Pradesh (National Family Health Survey, 1998-99)
Table 8: Women’s Frequency of Consumption
of Specific Foods in Madhya Pradesh

Regarding nutrient food items, somewhat less than half ofwomen consume pulses or green leafy vegetables daily. Sincethese are the major sources of protein and several vitaminsand minerals in the usual Indian diet, a less frequent intake(weekly or less), which is the pattern for the majority ofwomen, is not likely to be adequate. Other nutritious foodslike milk/ curd, fruits and non-vegetarian foods are consumedmuch less frequently. Milk or curd is consumed either daily orweekly by only about one-third of women.
The tribal or adivasi population of the state is especiallyvulnerable regarding food security and food intake, for a variety of reasons. One major factor is the process ofalienation from traditional natural resources, which manysuch communities have undergone in the previous decades,due to various reasons such as deforestation, land degradationetc. Additional stresses due to drought may then contribute totipping the balance critically towards severe food insecurity(see Box on Drought and Nutrition in West Madhya Pradesh).
Among all the vulnerable population groups, inadequacyof protein/ calorie intake is quite striking. Looking at thegroups most at risk, namely the pre-school children and chil-dren below 10 years of age, we find that only about one-third ofthese tribal children receive a diet adequate in calories and pro-tein. Similarly, among elder children (10-12 years) and preg-nant and lactating women, only around half of the tribal pop-ulation in these groups has adequate caloric and proteinintake.
It may be noted that an intake of less than 70% of the recommended daily allowance constitutes a serious dietary deficiency. However, about one-fourth of tribal children do not receive even this bare minimum cereal intake, exposing them to the risk of severe malnutrition (see Table 9).
3.1.4 Nutritional status of womenWith this background, we can look at the nutritional status ofwomen in Madhya Pradesh, and also examine variations anddisparities among various sections of the population ofwomen. Special emphasis is required relating to tribal women,
H E A LT H
60
Graph 4: Adequacy of Calorie Intake in
Tribal Population
70
60
50
40
30
20
10
01-3 4-6 7-9 10-12 10-12 Females, Females,
girls boys 18+, 18+pregnant lactating
Source: National Nutrition Monitoring Bureau, NIN : Diet and Nutritional Status
of Tribal Population, Report on First Repeat Survey, 2000
Cereals and millets 77.4 77.2
Pulses 35.0 45.8
Leafy vegetable 11.1 11.4
Other vegetable 32.4 31.4
Roots and tubers 39.7 36.8
Milk and milk prod. 0.3 0.9
Fats and oils 3.9 0.9
Sugar and jaggery 0.5 0.2
Age 1-3 years Age 4-6 years
>= 70% RDA* >= 70% RDA*
*Recommended daily allowance
Source: National Nutrition Monitoring Bureau, NIN : Diet and Nutritional Status
of Tribal Population, Report on First Repeat Survey, 2000
Table 9: Adequacy of Intake of Major FoodCategories – Tribal Children in Madhya
Pradesh
1.Residence
Urban 28.2
Rural 41.8
2.Region
Vindhya 25.0
Central Madhya Pradesh 30.5
Malwa Plateau 36.3
South Central Madhya Pradesh 47.1
South Western Madhya Pradesh 36.9
Northern Madhya Pradesh 33.8
3. Caste/Tribe
Scheduled Caste 39.9
Scheduled Tribe 49.2
Other Backward Class 37.4
Other 27.4
Total 38.2
Background Characteristic % of women with BMI below 18.5
BMI: Body Mass Index; a BMI less than 18.5 denotes under nourishment
Source: NFHS –2, Madhya Pradesh (National Family Health Survey, 1998-99)
Table 10: Nutritional Status of Women in
Madhya Pradesh

because of their socio-economic situation.Given the information about women’s intake of nutri-
tious foods discussed above, it is not surprising to note that38.2% of women in Madhya Pradesh are undernourished andhence some grade of Chronic Energy Deficiency. However, thedisparities among various social strata are responsible for evenhigher levels of under nutrition. Rural women are one-and-half times more likely to be undernourished than urbanwomen. There are significant regional disparities too, withwomen from the ‘South Central’ area faring much worse thanthose from Vindhya and Central Madhya Pradesh. And final-ly, prevalence of under nutrition among tribal women isalmost twice of those in the ‘other’ category.
3.1.5 Nutritional status of childrenAnthropometric indices such as Weight for age (indicatingproportion of underweight children) and Height for age(indicating proportion of stunted children) are commonlyused to assess the nutritional status of children in a population. According to both Weight for age and Height forage, about half of the children in Madhya Pradesh are malnourished and one-fourth are severely malnourished.Again, there are significant social disparities among socialstrata. Proportion of underweight (58.4%) and stunted(54.3%) children in rural areas is much higher than that inurban areas, and similarly tribal children are worse offcompared to those from ‘other’ group. However, there do notappear to be major regional disparities in this regard.
A further look at the nutritional status of tribal childrenin Madhya Pradesh confirms what we would expect from thedata on food intake already discussed above.
The NNMB survey shows that almost three-fourths oftribal children in Madhya Pradesh are underweight (74.1%)and stunted (73.4%). (This is somewhat higher than theNFHS proportions, perhaps because of sampling variation).What is more worrisome is the very high proportion of severe-ly underweight tribal children, at about 42%, this being a groupwhich is most vulnerable in situations of fluctuation of foodsupply or infectious illnesses.
In response to the problem of under nourishment, therehas been sustained effort to reduce malnourishment.Simultaneously, the government set up a system of regularsurvey of children to assess the levels of nourishment amongstthem. The data from these surveys over the period of last oneyear shows that there is reduction in malnourishment. InOctober, 2001, this survey of 61 lakh children found that while52 percent children were moderately malnourished, and 5.3percent severely malnourished. The survey in September,2002, surveyed 59 lakh children and found that while moder-ately malnourished children were 53 percent, percentage ofseverely malnourished had dropped to 3 percent.
3.1.6 Anaemia among women and childrenIron deficiency anaemia is probably the most prevalent andsignificant micronutrient deficiency to be seen in our country,with major consequences for well-being and work efficiency.The prevalence of anaemia among women is an index, whichreflects the combined impact of availability of nutrient foodsto the household, gender-equity of food distribution withinthe household, and effectiveness of iron-folic acid supplemen-tation through the health services. A high prevalence ofanaemia in a population usually reflects an unfavourable situ-ation regarding all these factors.
Data from the NFHS 2 survey shows that over half of thewomen in the state (54.3%) have anaemia, with one-sixth(16.7%) having moderate or severe anaemia, a little higherthan the proportion of anaemia among women nationally(51.8%). Rural women are one-and-half times more likelythan urban women to have moderate/ severe anaemia. Thereare some regional differences, with women in Malwa (38.2% anaemic) faring significantly better than their sisters
61
H E A LT H
Source: NFHS –2, Madhya Pradesh (National Family Health Survey, 1998-99)
1.Residence
Urban 19.5 44.3 19.6 39.8
Rural 25.7 58.4 30.9 54.3
2. Caste/Tribe
Scheduled Caste 30.0 57.5 32.2 52.7
Scheduled Tribe 31.4 64.5 33.6 59.9
Other Backward Class 22.4 55.4 28.1 51.5
Other 14.5 40.5 18.5 37.2
Total 24.3 55.1 28.3 51.0
Background Weight for age Height for age
Characteristic Percentage of children Percentage of children
Below -3SD Below -2SD Below -3SD Below -2SD
Table 11: Nutritional Status of Children inMadhya Pradesh
Source: National Nutrition Monitoring Bureau, NIN: Diet and Nutritional Status of
Tribal Population, Report on First Repeat Survey, 2000
Boys 42.5 53.0 31.6 21.7 74.1 74.7
Girls 41.3 54.1 32.9 18.2 74.2 72.3
Both 41.9 53.6 32.2 19.9 74.1 73.5
Sex Below -3SD Between -3SD and -2SD Total below -2SD
Wt.for age Ht.for age Wt.for age Ht.for age Underwt. Stunting
Table 12: Nutritional Status of Children in
Tribal Areas in Madhya Pradesh

in South-Central Madhya Pradesh (59.5 % anaemic). Tribalwomen seem to be suffering the most, with almost three-fourths (70.3%) being anaemic and almost one-fourths(23.8%) having moderate or severe anaemia.
We see that three-fourths of children in Madhya Pradeshare anaemic, and strikingly, over half of the children have moderate/ severe anaemia. This high prevalence of anaemiacuts across all regions, though children from NorthernMadhya Pradesh fare the worst with 85% being anaemic andalmost two-thirds having moderate/ severe anaemia. Similarly,among tribal children, almost two-thirds have moderate/severeanaemia. However, there are hardly any significant urban-rural or gender differences in this regard.
3.2 Food SupplementsWhile household food intake is the main determinant of nutritional status, nutritional supplementation has animportant role to play in ensuring minimum nutrient intaketo vulnerable groups. Below we examine a few key supple-mentation measures, which have a direct bearing on the nutritional status of women and children.
Supplementation with Iron-Folic acid during pregnancyis the most widely practiced and institutionalised form ofmicro-nutrient supplementation, as part of the NationalNutritional Anaemia Control Programme. This is one of the
basic components of routine ante-natal care and has a signifi-cant role to play in prevention or correction of anaemiaamong women. However, it is important that Iron-FA is givenand consumed for an adequate period, usually considered tobe at least three months. Survey carried out by the NFHS 2shows that in Madhya Pradesh, about half (48.9%) womenreceived Iron-FA during pregnancy, but only 38.8% received itfor an adequate period. Women in urban areas are one-and-half times more likely to receive Iron-FA during pregnancythan those from rural areas. Only about one-third of tribalwomen received Iron-FA, and about one-fourth received it foradequate duration.
A similar major supplementation programme relates toVit. A, which has important consequences for visual health andresistance to infections among children. Supplementation withVitamin A to pre-school children is the major programmaticform of micro-nutrient supplementation for children, in theform of the Vitamin A Prophylaxis Programme. A massive doseof Vit. A is to be given once in every six months to childrenbetween the age of 6 months and five years. In this context, weobserve from data revealed by NFSH2 that only one in sevenchildren in Madhya Pradesh received a dose of Vit. A duringthe last six months. The same report further also shows that inareas like Vindhya and Northern MP, this proportion wasextremely low, less than 10% of children having received it.
H E A LT H
62
The nutritional status of any population is closely related to the food
supply and food security of communities within that population. Given the
context of varying degrees of drought in parts of West Madhya Pradesh
during the years 1998 to 2000, it is especially relevant to understand the
state of nutrition in this region and its relationship to health in the recent
period.
The South-west monsoon 2000 brought 31% less rainfall than the
average and Western Madhya Pradesh received only 65% of its normal
rainfall. 22,490 villages in 32 districts of Madhya Pradesh were officially
declared ‘drought affected’. The number of drought affected people in the
year 2000 comprised 26.17% of the states population.
In this setting, surveys in the drought-hit district of Barwani in West
Madhya Pradesh conducted by CEHAT (Centre for Enquiry into Health
and Allied Themes) in collaboration with local organisations give some idea
of the impact that drought has had on nutrition in the region–
● A sample of 712 under-five children from two blocks were studied for
their nutritional status based on ‘weight-for-age’. Of these, 84%
children were found to have some degree of mal nourishment, and
21.9% children had severe mal nourishment. These figures correlate
with the findings of the special study report on nutritional status of
tribal children by NNMB, who found 20.4% of the sample of tribal
children in Madhya Pradesh to be severely malnourished
● A similar study of 132 adults showed 63% individuals to have a BMI
of below 18.5, i.e. some grade of under nutrition. However 15% adults
had a BMI of less than 16, indicating severe under nutrition (Chronic
energy deficiency Gr. III) in this group. These proportions are some-
what higher for the figures related to tribal areas of Madhya Pradesh.
According to the NNMB data collected from the tribal areas of
Madhya Pradesh, 49% of the adults are undernourished (BMI < 18.5)
and 8% are severely undernourished (BMI < 16).
● The impact of drought was observed clearly in these villages in the
form of reduced dietary intakes, with reduction in non-cereal food
items like pulses, vegetables, cooking oil etc. Some families also had sig-
nificant reduction in the quantity of intake of cereals. A few families
reported occasional consumption of famine foods like forest leaves and
tubers during the height of the food scarcity due to drought.
One impact of the study process has been the subsequent dialogue
between the ‘Jan Swasthya Samiti’, a local voluntary group, and the ICDS
authorities. This is accompanied by a process of people’s monitoring of
ICDS services, to ensure better utilisation of Aanganwadi services by the
tribal communities, which could have an impact in reducing malnutrition.
Sources- National Disaster Management Committee weekly drought
report No. 10; copy of Madhya Pradesh memorandum of scarcity; Diet and
Nutritional status of tribal population – report on first repeat survey by
National Nutrition Monitoring Bureau, 2000; Article on pp. 38-39, SROTE
science and technology features, Oct. 2001.
Drought and Nutrition in Western Madhya Pradesh

3.3 Sanitation
3.3.1 Water and solid waste management The infrastructure or facilities for ensuring proper waste waterdisposal in Madhya Pradesh are currently inadequate. TheNSS 52nd survey undertaken in 1995/96 found that a third ofthe rural and a quarter of urban households had no wastewater drainage system. To further compound this, 29 percentrural households had some sort of an “open kuccha” drainagesystem, whose efficiency in dealing with dirty water, ensure itsswift flow, and prevent spillage and water logging is doubtful.Even in urban households, “open kuccha” drains serve 21 per-cent. The type of latrine is also directly connected to level ofsanitation. In rural Madhya Pradesh in 1999, NSS 54th round13
estimated that 94.5 percent used no latrine, and the statecomes last amongst fifteen major states in India in use oflatrine by rural households. Even in urban Madhya Pradesh in1999, 45 percent households used no latrine.
The lack of adequate drainage adds onto problems likestagnant water, poor waste disposal, and with lack of toiletfacilities, the chances of water and air contamination increase.In urban Madhya Pradesh, nearly fifteen percent people live inslums, and they would be specially subjected to dirty sanitaryconditions, dirty stagnant water, poor drainage, lack ofproper waste disposal, and unhygienic housing.
3.3.2 Household air pollution NSS 49th round survey in 199314 showed that of the ruralhouseholds in Madhya Pradesh in 1993, nearly 95 percentused leaves or straw or firewood for cooking, thereby exposing women to dangers from smoke from these sources of energy. Even in urban Madhya Pradesh, nearly 45 percent households used similar cooking fuel. Use ofpolluting fuels at home and general unsatisfactory hygiene in home would be one of the major contributing factors to the
high prevalence of respiratory diseases found in the state.
3.3.3 VectorsA significant piece of information from NSS 54th round surveywas on number of households reporting an increase ordecrease in the problem of flies, mosquitoes and foul odourover the last five years. These measures are a direct indicator ofthe menace of in-sanitary conditions and a cause of many ofthe disease infecting people of the state. The reports fromrural households are somewhat better than what the urbanresidents find as far as increase in flies, mosquitoes and foulodour is concerned. A high 58 percent rural and 77 percenturban households reported that mosquitoes have increasedover a period of five years. This widespread feeling that therehas been an increase in flies coupled with lack of properdrainage and waste disposal does not augur well for a healthyenvironment.
If we convert the percentages to population, we see inTable 13 that while around 36 lakh people have benefited froma cleaner environment that has lesser flies and sixteen lakhsfind fewer mosquitoes, 2.68 crores live with more flies and 3.8crores suffer more mosquitoes in the state.
3.3.4 Drinking waterWith water borne disease reported to account for a very largeshare of diseases suffered by people, adequate and safe drink-ing water is crucial for a healthy population. Let us first get anidea of the status of drinking water in Madhya Pradesh.
We get an idea of the adequacy of drinking water byhouseholds from NSS 54th round15 conducted in 1998. About13 percent rural households and 16 percent urban householdsin Madhya Pradesh appear to have insufficient drinking water.Reading it the other way, the number of people now withaccess to safe drinking water is very high in Madhya Pradesh.The progress over the last years in further public provisioning
63
H E A LT H
Sarvekshana, 82nd issue, January-March, 2000, NSSO, Government of India, page 81
Rural Areas 43.8% 7.3% 57.9% 3.5% 22.1% 8.3%
Urban Areas 46.2% 2.2% 76.5% 0.4% 40.8% 2.3%
Population 2,68,35,144 35,86,882 3,79,58,065 16,14,299 1,63,56,295 40,45,809
Percentage 44.4% 5.9% 62.9% 2.7% 27.1% 6.7%
Area Flies Mosquitoes Foul Odour
Increase Decrease Increase Decrease Increase Decrease
Table 13: Households Reporting Increase or Decrease in Problem of Flies, Mosquitoes and
Foul Odour over Last Five Years, 1999
13. Sarvekshana, 82nd issue, January-March, 2000, NSSO, Government of India
14. Sarvekshana, 78th issue, January-March, 1999, NSSO, Government of India
15. Sarvekshana, 82nd issue, January-March 2000, NSSO, Government of India

of safe drinking water in the villages has been very encourag-ing. Over the last eighteen months, from just a little less thanten thousand habitations (out of 1.11 lakh overall habitations)without full access to safe drinking water, only twenty six hundred habitations remain without proper access to drink-ing water.
However, there is very little really known on the quality ofdrinking water. But we can use other measures to get an indirect idea of the possible quality of drinking water.
The source of drinking water would determine to a largeextent, what is the surety of safe drinking water for house-holds. The data from NSS 54th round16 in 1998 tells that ruralhouseholds use tube well or hand pump (52 percent) andwells (39 percent) maximum. In the case of both, maintenanceand cleanliness of the source determines water quality. Thesame survey further finds that only 29 percent rural house-holds used some form of cleaning the water before drinking,by filtering with plain cloth (24 percent), some other form offiltering (3 percent), and 1.3 percent chemically treated thewater before drinking it. In urban areas, 36.5 percent house-holds filtered drinking water before drinking. In both the casesthere is very little precaution taken by households to treat thewater in some manner before consumption. With fairly poordrainage systems, wells and hand pump providing most of thedrinking water, and no use of latrines, water quality cannot beassumed to be satisfactory directly from its source.
4. THE INSTITUTTIONAL RESPONSE
In the first part of this chapter we have travelled some distancereviewing the state of health of the people of Madhya Pradesh.Let us now move towards the response - the thinking behindhealth service system, and the health services themselves.
The Bhore Committee Report (Health Survey andDevelopment Committee Report, 1946) laid down the blue-print of the rural and urban health system in the entire nation.The basic focus of this report was to set up a primary healthcare system across the country to ensure availability of “basichealth care” for every individual, in the context of a predomi-nant rural population. The recommendations of the reportmake for a comprehensive package of preventive, promotiveand curative health care and a strategy of involving people inthe health system itself. This report was adopted by theGovernment of independent India and formed the basis ofsetting up an extensive health care delivery system across theentire nation, including for Madhya Pradesh.
A landmark in development of health policies andaccompanying focus world-wide was the InternationalConference on Primary Health Care (PHC) held in Alma Atain 1978. This conference evolved the Alma-Ata declarationwhich called for extending health to all people and also pro-vided a new definition to the word ‘health’ itself. It affirmed
that Primary Health Care was a critical option and should bethe focus for all health systems. India was a signatory to thisconference and its goals. The “Health for All by 2000” thrusthas guided much of our health interventions ever since. It alsoformed the core thrusts of the National Health Policy of 1983.The Madhya Pradesh Government health programmes havebeen influenced by both of these.
However this reaffirmation of Primary Health Care wasimmediately challenged by many international agencies andhealth initiatives that spoke of “Selective Primary Health Care”(SHPC). The SHPC approach argues that primary health careis too expensive, and a more effective method is to select andprioritise a limited number of major diseases and attack themthrough specific programmes. The focus was on deliveringmedical care for selected diseases rather than encouraging par-ticipation by communities in defining their health needs, andprofessionalise rather than de-professionalise health. SHPCwas a technology-focussed approach, where delivery of healthcare through health professionals was the focus, it detractedany society or community and medicine interface, and ignoredaspects of community empowerment vis-à-vis medical servic-es. This approach was soon adopted by international develop-ment aid agencies, including those of the United Nations.
Primary Health Care as the main vehicle to deliver goodand effective medical care got subjugated by programmes andinitiatives that were disease specific. This is the case both inter-nationally and nationally. In India, a study by Duggal andAntia (1995) for instance, have noted that the Primary HealthCentre and Sub-Centre networks are concerned more withfamily planning and meeting the targets of national diseasecontrol programmes than tackling comprehensive PrimaryHealth Care.
A series of national level programmes catalysed by fund-ing from bilateral and multilateral support institutions haveevolved which promote the selective vertical disease controlstrategy. This approach has been justified on the basis of effi-ciency, with a techno-managerial approach, and very littleinvolvement of the community, which is taken as a passiverecipient of their benefit. A major corner stone of the AlmaAta declaration was equity and the community was empha-sised as an agent of change. This approach has dropped boththese key components.
A further change came in the 1990s, when the countrywent through an economic crisis resulting in new economicpolicies which promoted liberalisation, privatisation andglobalisation. Conditionalities of international funding agen-cies during this time led to some downsizing of public healthallocations and health expenditures with focus on harnessingother resources and involvement of private sector.
The above factors describe the mosaic in which the healthcare response of the state has to be contextualised. These
H E A LT H
64
16. Sarvekshana, 82nd Issue, January-March 2000, NSSO, Government of India

factors of overall commitment to primary health care; selec-tivisation and verticalisation of national health programmes;the new economic context; and the downsizing of healthinvestment; has led to a series of health care strategies not adequately integrated but each in their own way trying toreach health care primary or selective to those who need it inan in-equitous situation with additional problems peculiar tothe state of access and cultural diversity.
4.1 State Policies and InitiativesGovernment of Madhya Pradesh has been working on evolving a medium term health strategy, but it is still in itsdrafting form. The policy framework for health in then guided by the national level health policies, and some specificpolicies and new initiatives that the state has evolved, whichhave a direct and indirect bearing on health. We briefly discussthem below.
Having a direct bearing on health in the state are thePopulation policy, the Nutrition policy, and the Women’s policy. The salient points of the population and nutrition policy are given in the box below.
The state has broadly followed the formulations of theNational Health Policy and the National Health Programmes.The Rajiv Gandhi Mission for Community Health describedlater is a beginning of such a policy statement. For the timebeing, the health policies though unstated separately broadlyfocus on three major areas:1. Improving infrastructure for primary and secondary
health care;2. Disease control and public health;3. Reproductive and Child Health Programme
We shall cover the infrastructure issues in a separate section later in this chapter. Here we concentrate on the second and third aspects.
4.1.1 Disease Control and Public HealthWhile the primary health centres and hospitals provide basicand curative health services, there is also a vast network ofprogrammes and agencies that work directly for specific diseases. These include the major centrally sponsored diseasecontrol programmes, popularly referred to as vertical programmes. Their sheer size, investments, control by theGovernment of India, have made these programmes large andcentral to the states health effort. They play a major role in thehealth system and absorb time, effort, planning and co-ordi-nation systems of the state to a large extent. Five major programmes are:1. Revised National Tuberculosis Control Programme
(RNTCP) (covering the entire state)2. National Leprosy Elimination Programme (The objective
is to eliminate disease in state by 2003 and integrated intogeneral health system by 2003).
3. National Programme for Control of Blindness (Aims tocontrol blindness due to cataract which accounts for 70-80% of total blindness)
4. National Anti-Malaria Programme5. National AIDS Control Programme (supports the
Madhya Pradesh State AIDS Control Society to tackleHIV/AIDS problem in the state)These programmes have been somewhat successful in
reducing the incidence of leprosy, blindness, improved detec-tion of tuberculosis, and are helping in creating awareness onHIV/ AIDS. Tackling many of these diseases poses a stiff chal-lenge to public health, since they have specific problems asso-ciated with them. These include stigma (associated withtuberculosis, leprosy and HIV/AIDS), duration of treatment(treatment of tuberculosis and leprosy takes a long time, andpatients often discontinue treatment), distance and access totreatment facilities for patients (TB and leprosy centres arefew and far, and tribals and women have special problems ofaccess), migration by patients, especially for tribals whomigrate (patients migrate in search of work discontinuingtreatment).
The growing private sector has not been an effectivemedium to tackle these diseases. The private practitionershardly ever send patients to District Centres or PHCs/ CHCsand when they do, it is often found to be too late. The standarddrug regimes are not necessary followed, and cases are not regularly recorded and followed up17. Counselling by the doctors to TB and HIV patients is usually poor.
4.1.2 Reproductive and Child Health ProgrammeThe family welfare and RCH formed the second major component of health policy and consists of a large number ofprogrammes that respond to the complexity of the situation.The main components are given in the box.
65
H E A LT H
Population Policy Goals● Total Fertility Rate to 3.0 by 2005 and to 2.1 by 2011.
● Maternal Mortality to 330 by 2005 and to 220 by 2011
● Infant Mortality Rate to 75 by 2005, and 62 by 2011
● Child Mortality Rate to 90 by 2005 and to 65 by 2011
Objectives of State Nutrition Policy● To bring 15 percent decrease in moderate level malnutrition and 10
percent decrease in severe level malnutrition found in children less
than five years of age.
● To bring 10 percent decrease in cases of low weight at birth.
● To eliminate the problem of blindness due to lack of Vitamin 'A'.
● To bring 20 percent decrease in problem of anaemia due to lack of
iron, amongst pregnant women.
17. A Report on National Consultation on Tuberculosis, VHAI, 1994

These programmes are supported by the National RCHand Immunisation programmes, apart from the state’s owncontribution to them.
4.2 Health Care Financing and Health care expenditure
4.2.1 State Government FundsFinancial allocations in the health sector have shown a trendof decline or stagnation over the years, as per the state budgetallocations. Taken at constant prices, there has actually been adecline in per capita costs.
However, Government investments into the health sectorhave been gradually increasing in the plan allocations. TheGraph 5 portrays the share of the resource allocations to thehealth and family welfare departments in five year plans from
the Vth Plan. The allocations have been fluctuating but thereis a gradual increase in last plans.
These allocations notwithstanding, there is a decline inper capita expenditure, and is evident from actual expenditureon the health sector in the state budgets. A study by the Asian Development Bank18 on public sector reform shows thatactual per capita expenditure on health has been going downin the 1990s. Per capita expenditure of the Government
H E A LT H
66
Reproductive and Child Health Programme
a) Meeting the needs for contraception and couple protection
b) Behavioural change communication strategies
c) Prevention of mis-use pre natal diagnostic techniques (PNDT Act)
d) Social mobilisation for increasing age of marriage
e) Establishing infertility diagnostic facilities
f) Community based distribution of contraceptives
g) Adolescent health education
h) Management of reproductive track infection (RTI)
i) Immunisation of children for six preventable diseases
j) Reducing MMR due to high risk pregnancies
k) Strengthening of first referral units (FRUs)
l) Urban maternity and counselling centres
m) Improving new born care
n) Improving registration of marriage pregnancy birth centres.
18. “Madhya Pradesh Public Finance Reform – Final Report”, Tata Consultancy Services, Asian Development Bank
Graph 5: Outlays in Health Sector in State
Five Year Plans
3.00%
2.50%
2.00%
1.50%
1.00%
0.50%
0.00%Vth Plan VIth Plan VIIth Plan VIIIth Plan IXth Plan
1.66%
2.60%
2.24%
2.61%
Source: National Nutrition Monitoring Bureau, NIN : Diet and nutritional status of
tribal population, report on first repeat survey, 2000
2.83%
80%Salaries
Machinery (0%)
Vehicles (0%)
Supplies (1%)
Diet, Food (2%)
Drugs (12%)Bedding (1%) Others (3%)
Graph 6: Non Plan Expenditure by Items,
1990-91
Machinery (0%)
Vehicles (0%)
Supplies (1%)Diet, Food (1%)
Drugs (8%)Bedding (0%) Others (3%)
Salaries (87%)
Graph 7: Non Plan Expenditure by Items,
1997-98

Health expenditure was Rs 21.18 at 1980-81 prices in 1990-91,and has gone down over the years to Rs 16.32 per capita in1996-97.
The expenditures comprise cost of establishment, whichare primarily salaries of existing staff. The ADB study indicatesthat the shares of salaries in total non-plan health expenditurein the state was 87 percent in the year 1997-98. There has beena steady increase in the share of salaries over the last decade innon-plan expenditure as stated in the Graphs 6 and 7.
The increase in the expenditure on items has been 92 per-cent in case of salaries from 1990-91 to 1997-98, but only 4.6 percent for drugs, 0.23 percent in machinery, and 0.39 percentin supplies.
5.4.2 Externally aided health projects
4.2.2 Externally Aided ProjectsApart from own and central funds, another source of fundsfor the state has been through externally aided projects. Theseprogrammes have been either focussed regionally or focussedon a particular aspect of health, and have not been aiming atmore definite and structural impact in the health system. In
fact this assessment of externally aided projects also formspart of the governments own current thinking (see the sectionon Swastha Jeevan Sewa Guarantee Yojana).
Centrally aided projects have actually resulted in movingthe health sector away from comprehensive health care toselective health care. It has reinforced the vertical programmesand in fact created more of them. There is a strange situationof arguing for inter sectoral action in problem analysis andending up with creating yet another vertical programme. Thishas emerged as a serious problem because it tends to make thesector forgo the benefit of horizontal linkages effected in thenew dispensation of Panchayat Raj. Health sector needs extra-health sector action to be effective, and so an effective strategywould be to enlist them.
The Government of India has been equally responsiblefor promoting externally aided projects while paying lip serv-ice to decentralisation. Region specific problems of healthredressal get low priority in such a situation.
4.2.3 User ChargesUser charges have been offered as a manageable and effectivemeans of financing the health systems. User charges are leviedin government hospitals in cases of hospitalisation. The costrecovery levels have generally been abysmal. The current rateshave been hovering from 1.2 to 2.5 percent over the last sixyears.
In recent years, the concept of Rogi Kalyan Samitis orpatient welfare committees have come into play in the man-agement of health centres across the state and have been quitehelpful in generating user charges that are being utilised tomodernise health centres and better patient care and facilities.More details on RKS are given later in this chapter.
4.3.3 Source of treatment and health care expenditureOne indicator of the weak and inadequate state of publichealth services in Madhya Pradesh is the fact that in a statewith such a low per capita income, the vast majority of peopleare constrained to access medical care from the less affordableprivate sector. Some micro-studies show that non-availabilityof drugs, extra charging, indifferent behaviour, irregular avail-ability of staff and other factors in the public health sectorinduce the poor to access private services.
67
H E A LT H
Graph 8: Rates of Cost Recovery in Health
6.00
5.00
4.00
3.00
2.00
1.00
0.00
Perc
ent
ofC
urr
ent
Exp
endi
ture
3.2
4.5 4.6
5.0
4.5
3.7
2.92.5
1.8
2.6
1.6
1980
/81
1985
/86
1990
/91
1991
/92
1992
/93
1993
/94
1994
/95
1995
/96
1996
/97
1997
/98
1999
/00
Year
1.2
*Some patients resorted to home treatment, medical stores etc. and hence the totals of Public and Private do not add to 100
Source: Health Care Utilisation and Expenditures in M.P., George Alex et al, FRCH, 1993
16.74 70.52 87.26 13.67 71.6 85.27
Rural Urban
Public Private Total Public Private Total
Table 14: Source of Outpatient Treatment in Madhya Pradesh (in percentage)*

According to this study in the early 90s, over 70% of out-patients in both rural and urban areas, were taking treatmentfrom the private sector.
The time-trends in this regard as documented by NSSOshow a significant and worrisome decrease in utilisation ofpublic health services, for both rural and urban areas, and forboth Outpatient and Inpatient care. The utilisation of ‘other’sources (basically private care) has increased to above 70% inboth rural and urban areas by the mid 90s. Similarly, utilisa-tion of ‘other’ (basically private) sources for Inpatient care,which was only about 20% in the mid-80s has gone up tonearly half of such care by the mid-90s. This is a disturbingtrend, which indicates weakening of quality or financial acces-sibility of public health services compared to private services.This is likely to result in both increase in costs and also greaterrisk of unnecessary and irrational therapy, often resorted to inorder to boost private medical profits.
The per capita medical expenditure was found aboveRs.125 per episode in both rural and urban areas, which maybe prohibitively expensive for poor families.
The time-wise analysis based on comparing NSSO datafor mid-80s and mid-90s shows overall a sharp rise in expen-diture on medical care in almost all categories except publicoutpatient care in rural areas. The major rise in expenditure
on ‘other’ (basically private) services – increasing from two-fold to six-fold in a decade – is a worrying change. But of evengreater concern is the dramatic rise in out of pocket spending onpublic medical facilities, especially for outpatient care in urbanareas and inpatient care in all areas - rising seven to nine foldwithin a decade, outstripping inflation related increases. Thiseffectively indicates a significant degree of privatisation ofpublic health services, with patients having to pay either usercharges or costs of medications and supplies, at prohibitivelyhigh levels which would effectively deny the poor access tomedical care even in public hospitals.
5. INSTITUTIONAL HEALTH RESOURCES
5.1 Health ServicesThe state government is the single largest health provider
in Madhya Pradesh, especially when it comes to preventivecare and public health issues. However, the direct role of gov-ernment service providers is on a decline and a majority ofpeople resort to private health providers, especially in ruralareas for medical treatment.
The National Sample Survey19 found that out of all non-hospitalised treatments, 23 percent in rural and 19 percent inurban Madhya Pradesh went to a government health facility,while 62 percent in rural and 75 percent in urban areas wentto private sources. The previous NSS survey in 1986-87 hadreported government sources treating 24 percent health serv-ice seekers in rural areas and 28 percent in urban areas. Theuse of public health services in case of hospitalised treatmentis more than private sources, with the NSS 52nd Roundreporting 53 percent rural and 56 percent urban patients usinggovernment health institutions in 1995/96. Overall, people areaccessing private medical health services far more than public
H E A LT H
68
Source: NSSO 1992, NSSO 1998.
(a) Outpatient Care
1986-87 32.9 67.1 100.0 31.3 68.7 100.0
1995-96 27.1 72.9 100.0 20.4 79.6 100.0
(c ) Inpatient Care
1986-87 79.2 20.8 100.0 77.0 23.0 100.0
1995-96 53.3 46.7 100.0 56.0 44.0 100.0
Year Rural Urban
Public Others Total Public Others Total
Table 15: Percentage Distribution of Ailments Treated in Inpatient and Outpatient Care
Units by Source of Treatment, Madhya Pradesh 1986-87 and 1995-96
Source: Health Care Utilisation and Expenditures in M.P., George Alex et al,
FRCH, 1993
137.67 128.86
Rural Urban
Table 16: Average Medical Expenditure
per Ailment/Episode in MP (in Rs.)
19. Morbidity and Treatment of Ailment, NSS 52nd Round July 1995-June 1996, NSSO, Government of India, November 1998

services. Issues of efficiency of public health, perceptionsabout public health institutions, quality and accessibility ofgovernment health services, especially in rural health and forprimary health needs, comparative costs of public and privatehealth etc. combine to decrease the importance of publichealth institutions in curative health.
In preventive health, while no direct evidence is available,it can be assumed that public health bodies and schemes playa crucial role and perhaps are the only agencies involved insuch tasks. NSS 52nd Round pointed out that in post-natalcare, public hospitals and primary health centres took care of77 percent mothers who went for post-natal care in rural and74 percent in urban Madhya Pradesh. Out of the number ofpregnant women registered for pre-natal care (42 percent), 78percent used government hospitals or Primary HealthCentres. If we take natal care as some kind of a surrogate forpreventive care, it reinforces our assumption. Rural motherand child immunisation, and children’s nutrition programmes
will also be almost entirely under government health systems.
5.1.1 Government Health ServicesThe Government health system is widespread in the state,based on norms of population coverage in setting up healthcare centres, hospitals and staff. The primary, secondary andtertiary health care facilities form the long chain from healthsub-centres (SHC), the Primary Health Centres (PHC), andthe Community Health Centres (CHC), as the chain of ruralhealth institutions, and then move onto the civil and districthospitals, to medical colleges and speciality institutions. Thehospitals cater to urban health care needs along with tertiaryservices for rural population.
The government health system has separate norms forrural and urban centres. In rural areas, there is a three tieredsystem consisting of sub-health centres, primary health centreand the community health centre. The three centres have beenassigned particular roles and responsibilities in delivery andplanning of health care, and are established based upon pop-ulation coverage norms, decided nationally (norms are pre-sented in the box). The three rural health delivery institutionsmentioned above are referred to as primary health care deliv-ery institutions. In urban areas, government provides for civilhospitals and district hospitals, and they are termed as sec-ondary level health care delivery institutions. They are linkedto the primary level institutions through provision of referraland managerial support. At the top of the three-tiered system
69
H E A LT H
Source: NSSO 1992, NSSO 1998.
(a) Outpatient Care
1986-87 105 85 95 65 82 75
1995-96 94 161 140 477 264 352
(c ) Inpatient Care
1986-87 249 699 438 197 587 419
1995-96 2207 3482 2191 1678 3889 2774
Year Rural Urban
Public Others Total Public Others Total
Table 17: Out of Pocket Expenditure (in Rs.) on Medical Care in Madhya Pradesh
SHC 3000 5000
PHC 20000 30000
CHC 80000 120000
Norm for health centre on size of population
For tribal & Hilly area For other areas
Graph 9: Use of Government Facilities in
Treatment
30
25
20
15
10
5
0Rural Urban
Non Hospitalised, 1986/87 Non Hospitalised, 1985/86
24 23
28
19

come the medical colleges and other specialised institutions,termed the tertiary health care delivery institutions.
5.1.2 Government Medical InfrastructureThe medical institutions in the undivided state of MadhyaPradesh along with population covered by them are given inthe Tables 18.
The latest position of medical centres in the new state ofMadhya Pradesh in 2001 is given in the Table 19. Overall thereis at least one medical institution for every 5600 persons in thestate, and the average coverage is one PHCs for every 37
thousand rural population, one SHC for every 5 thousand andone CHC for every 1.9 lakh rural persons.
Going by coverage norms there is a considerable gap inthe number of Community Health centres, Primary Healthcentres and Health sub-centres. This gap and the requirementin these centres are given in Table 20. The rural health centresset up is still not as per the specified national norms.The shortfall in the crucial primary health centres and com-munity health centres is 29 and 47 percent respectively. TheGovernment of Madhya Pradesh, took steps to convert manyPHCs into CHCs in late 1990’s to somewhat solve the problemof lack of CHCs. The shortage figures if looked at district wiseshow that there are substantial inter-regional disparities inprovision of health infrastructure.
For urban areas no clear norms are specified. Apart fromthe civil and district hospitals, most medical centres are situated in urban locations, especially the primary and com-munity health centres, and the urban resident is serviced bythese centres as much as by the hospitals. Further, the mainsecondary and tertiary health care units in urban areas alsoprovide primary health care to urban residents. In spite of thefact that this put additional pressure on hospitals meant forsecondary or tertiary level services, little attention has a yetbeen paid to evolving a urban primary health care system.
Over the last many years another feature is the spread andreach of the medical institutions has been the lack of growthof secondary and tertiary level institutions. While there hasbeen a large increase in SHC, PHC and CHC, the number ofcivil, district and speciality hospitals has been stagnant over along period.
5.1.3 Access to Health CentresHealth centres have come up in rural areas based on popula-tion norms (see Box on Page 67) and have mushroomed rap-idly in a bid to cover the entire state. However, with a popu-lation density lower than national average, health centres onpopulation norms are too widespread geographically. In the
H E A LT H
70
Source: Different publications of Directorate of Health, Government of Madhya Pradesh (some of the Civil Hospitals were converted into Community Health Centres)
1982 6 42 78 455996
1986 6 42 78 501484
1990 6 42 78 551510
1994 6 42 78 592278
1998 6 42 74 661952
2000 6 42 74 690031
Year Medical College District Hospital Civil Hospital* Population Covered
Table 18: Public Hospitals in (undivided) Madhya Pradesh
Source: Directorate of Health Services, Government of Madhya Pradesh, Bhopal
All health institutions in MP 11149 5416
Districts 45
District Hospitals 36
Civil Hospitals 57
Janpad/ Blocks 313
Community Health Centres 229 193373
Primary Health Centres 1192 37150
Sub Health centres 8874 4990
UFWC 97
UHC 80
PPC 96
CD 97
Other 32
Health facility Units Population Served
Rural Health facility Units Rural Population Served
Table 19: Health Institutions in New
Madhya Pradesh, 2001

new state of Madhya Pradesh, health workers cover on anaverage six villages and have to cover a radical distance of 3.3kilometres for delivery of primary health care services. Allthese figures are well above the national average. Similar distance problems are also associated with primary and community health centres.
What is the distance that people have to travel to access aPrimary Health Centre? The data from area coverage indicatesomething. A close estimate is provided by NSSO round in1993 for the undivided state of Madhya Pradesh. Only 16 per-cent rural households had to travel less than half a kilometreto access a primary health centre, whereas 29 percent had totravel between 2-5 kilometres and forty percent had to travel5-10 kilometres in 199320. The number of SHCs, PHCs andCHCs in Madhya Pradesh in 1993/94 were 11936, 1841 and191, and this number rose to 12559, 1705 and 343 respective-ly. Putting PHC and CHC together (since many PHC wereconverted to CHC in MP in late 1990s), the numbers rosefrom 2032 to 2048, and this marginal increase would havemade little difference to the problem of distance access.
5.1.4 Health Personnel Personnel working in these medical institutions are the soul ofthe health care delivery system. Each type of centre has per-sonnel on specified norms, and the norms are specified based
on the roles performed by the centre. The staff available andworking in government health units is far less than what isneeded. The data from the Directorate of Health Servicesshows that amongst class I doctors there is shortage of 28 per-cent and the shortage amongst class II doctors is another 19percent. Anecdotal evidence and evidence from field visitssuggest that attendance by staff in rural health centres is poor,which further worsens the situation created by shortage ofstaff.
There are also district wise variations in personnel. If wejust look at data on main doctors and health officers, whileBhopal, Gwalior, Datia, Morena, Damoh, and Tikamgarh haveno vacancies, and another nine districts have less than ten per-cent vacancies, eight districts have over thirty percent vacan-cies (districts of Katni, Ratlam, Badwani, Jhabua, Shajapur,Shahdol, Dindori, and Sidhi).
Apart from this data, in Table 21b, we present data onrequired, sanctioned, in-position and vacancies for differentcategories of health personnel in India and Madhya Pradesh.Of the total specialists required in rural areas, there is a mas-sive shortfall from what is required (over 90 percent), whilethis shortage is about 62 percent for all India (data pertains to1998 and refers to the undivided Madhya Pradesh). In termsof doctors at primary health centres, the vacancy status was 17percent of the sanctioned posts in rural MP.
71
H E A LT H
Source: Unpublished data from the Directorate of Health Services, Government of Madhya Pradesh
Sub Health Centres 8835 10524 1689 16.0%
Primary Health Centres 1194 1691 497 29.4%
Community Health Centres 229 428 199 46.5%
District Hospitals 36 45 9 20.0%
Institution Numbers in Existence (as of 2001) Required for 2002 Gap in Numbers % Gap
Table 20: Number of Rural Primary Health Care Institutions in New Madhya Pradesh
Source: Directorate of Health Services, Government of Madhya Pradesh, Bhopal
Class I (July 2001)
Specialist 739 530 209 28.2
Class II (June 2001)
CMO&H 45 20 25 56%
Civil Surgeon 45 Nil 45 100%
Post Sanctioned Filled Vacant Vacancy %
Table 21a: State of Doctors in Government Medical Centres, 2001
20. Sarvekshnana, 78th issue, January-March 1999, NSSO (49th survey) Government of India

5.2 Non Government Health Care
5.2.1 Private Health ServicesAs surveys have shown, private health services dominate thehealth sector as far as share of patients is concerned. These arecharacterised by private doctor clinics and nursing home facil-ities in cities and towns, and small doctor clinics at town andmofussil market centres and roving doctors, registered med-ical practitioners and jhola chhaap (footloose) health serviceproviders. Very little information is currently available aboutthe non-government health care delivery system in the state.There has, however, been a very substantial expansion of thenon-government health care delivery system in the state inrecent years, especially in large urban areas.
There is no effective mechanism to regulate private healthproviders by the state or by medical associations as a self reg-ulatory exercise. There are very few norms existing if any, andthe question of charges is normally market based, rather thanany price regime for a public utility service. The state govern-ment has a hospital regulation act that may help in regulatingthe non-government health sector but this act is still to beenforced because of a stay petition in the court.
Very little is really knows about the private health sector,apart from individual experiences, and sporadic assessments.
The rural private sector health providers work on network andword of mouth systems. The private doctor clinics and nurs-ing homes lead the three major health providers. These clinicsare usually situated at places where market congregations andvisits are normal features. Often doctors also roam around onset routes and on set dates visiting small clinics in the coun-tryside, or patients directly. Small operations, small emergen-cies, basic health care and medication are given here. In casethe patients are serious and centres cannot handle them, theyare referred to nearby government hospitals. These privatehealth centres do very little as far as preventive health is concerned and there are growing doubts on the question ofquality of care and health practices adopted.
The second category is of the Registered MedicalPractitioners (RMP). RMPs are registered with the state government and are trained in basic health care. The RMPsperform two very crucial functions – one is that they are farmore easily accessible to people than either the private doctorsor the government health centres, and second they are prettyadept and quick in administering basic relief and basic curativedrugs and injections. They are also more affordable. RegardingRMPs although they provide health care where qualified doctors have left a void, they can provide only second besttreatment when it comes to major diseases and emergencies.
H E A LT H
72
Source: Directorate of Health, Government of Madhya Pradesh, Health Information of India - 1997 and 1998, Directorate General of Health services, Government of
India, New Delhi
Total Specialists (Surgeon, OB&GY, Physicians, Paediatricians
MP 1368 699 400 31.12.98 299 968 42.8
India 11652 6556 3731 31.12.98 2825 7332 43.1
Doctors at Primary Health Centres
MP 1760 1690 1469 30.6.98 221 291 13.1
India 23179 29699 25418 31.12.98 4284 2186 14.4
Pharmacists
MP 2032 2141 1600 30.6.98 541 ** 25.3
India 26092 22843 20986 31.12.98 2472 6790 10.8
Laboratory Technicians
MP 2032 1574 1347 30.6.98 227 685 14.4
India 26092 16022 12998 31.12.98 3045 13133 19
Nurse Midwife
MP 4084 966 966 30.6.98 0 3118 0
India 43573 22682 17681 31.12.98 5004 20419 22.1
Type of Health Personnel Required Sanctioned In Position Date Vacant Shortfall % Vacant
Table 21b: Health Manpower in Rural Areas

There is a third category of health providers, whom weterm as the footloose health service providers or the jholachhaap health providers. These should not be confused withthe government’s scheme of the Jan Swasthya Rakshak or the‘barefoot doctor’ as they are termed. All over the countrysidewe find persons who have received some training or workexperience in health care, or an employee of some years witha private doctor. Such persons often break out on their ownand start providing health care, giving services for they are nottrained and in anyway qualified. They provide basic healthcare, look after symptoms in patients such as fever, cold, aches,injuries etc., at their level. When they come across cases theyare unable to handle, they may refer to them to local healthcare centres, both private and government. There is no data orinformation available on the scale of such people or theirimpact on health, but it is certainly a situation that warrants acloser look. In a way it also offers an opportunity to utilisesuch semi-trained or oriented persons in developing a cadre ofwell trained and oriented health watchers and basic serviceproviders.
The basic need of the health care seeker and the objectiveof the health care provider is to administer effective, quick andeasily managed health care, especially in rural areas and forslum dwellers. The need for quick cure amongst the pooroften leads to use of treatments such as injections, high dosageof drugs for quick relief from symptoms like fever, body ache,weakness etc..
The urban health systems are clinic and nursing homedominated. Little is known about them, except popular per-ceptions, and that the momentum of collective experiencecalls for a quality and cost control regime in these health cen-tres. These private health providers in urban areas service notonly cater to the city well off, especially in speciality care, theyalso cater to both the urban poor and the rural poor whocome to towns and cities in cases of serious illness andinjuries.
Recently there has been some erosion of faith regardingthe roles and practices of the private sector. Instances ofunethical practice, negligence and corruption are on the rise.There has to be a controlling body of eminent and honest doc-tors that can act as regulators. The Government also needs toensure on proper record keeping of cases seen by the doctorsthat can be monitored, build up crucial data on diseases, andpatients, etc. The private sector has to be more activelyinvolved in the health programmes and preventive healthactivities.
Two acts that directly pertain to quality control of the pri-vate health system are the Prenatal Diagnostic Techniques Act,1994, and the Nursing Home Act. The first Act was enacted bythe Government of India, and passed in the Parliament in1994. The attempt is to put a strict control on prenatal diag-nosis of the sex of the foetus, put a stop to female foeticide,and sex selection of the foetus etc. The recent Supreme Court
directives following alarming fall of juvenile sex ratio acrossIndia in the 2001 census data has put public attention to thisproblem. Over the last year, the Government of MadhyaPradesh has been rigorously implementing the PNDT Actacross the state. To effectively implement the provisions of thisact, the Director Public Health and Family welfare has beenmade the appropriate state level authority, with a direct systemright down to the block level. The Act is being strictly imple-mented. Of the 720 private and government bodies, 571 havealready been surveyed, and action has been taken against 15 ofthem till June 2002.
The Nursing Home Act which lays down guidelines forthe nursing homes in Madhya Pradesh was passed by theVidhan Sabha. However it could not be enforced as one of thedistrict IMA put a stay petition in the High Court and stay wasgranted. Even after 2 year no final decision has been arrived at.The process of stay, the attitudes of private practitionerstowards any form of regulation is a very poor reflection on theseriousness with which the private medical fraternity sees theissue of quality, and patients’ rights.
The formal private health delivery system is mostly confined to large towns and the cities of the state. In smallertowns, the private health centres are usually clinics and smallnursing homes. Secondly, all their services concentrate on providing curative hospitalisation services rather than healthpromotion and preventive health care services. There are nostaffing and infrastructure norms for the non-governmentalsector, resulting in a five star culture in the form of nursinghomes in large urban conglomerations and in sub-standardhealth facilities when catering to the poor. Finally, the systemshifts the focus from traditional medicine to that of the west-ern medicine. The prohibitive cost of western medicines anddiagnostic tests results in a comprehensive lack of access tothese services of people who are not affluent.
A large major part of the informal private health servicesproviders consist of those who are neither properly trainednor formally registered to provide health care services to thecommunity, especially in small towns and rural areas. Thespace for such health service providers comes from the inability of government or private medical services to currently provide easily accessible and timely medical servicesto patients residing in remote locations or who are too poor toaccess such medical services. The unorganised and peripateticcharacteristic of these providers makes it very difficult to putin a place any effective mechanism to regulate them. Althoughthey do provide available and quick health service, thesehealth services providers do more harm than good to people’shealth in the longer run.
5.2.2 Non Government Organisations and HealthThere is very little organised knowledge of voluntary effort inhealth in the state. The state does have a history of hospitals,dispensaries and community health care projects in the
73
H E A LT H

voluntary sector, which is growing over the years. These insti-tutions and projects have been networking into associationsthat provide continuing education for its members and sup-port them in other ways to carry out their activities. The net-works include the Madhya Pradesh Voluntary HealthAssociation (MPVHA); the Catholic Health Association ofMadhya Pradesh (CHAMP) and others. In 1999-2000, thesecame together with other networks to participate in themobilisation for the people’s health assembly at Kolkata andDhaka in December 2000, bringing to these assemblies thewealth of experience evolving at the grass-root level.
The state of Madhya Pradesh has been rich in social andpeoples movements, which have created their own people’sorganisations, and some very good non-government organisa-tions across the state. There is also wide experience in the stateof collaborating with NGOs in core work in different socialsectors. The most well know role of NGOs in health has beenin the case of the Bhopal Gas tragedy.
The presence of such peoples organisations and NGO’scalls for a need for the state to dialogue with the NGO sectorand the social movements to harness their resources, commit-ment and capacities for the health of the people. This is a largepotential still that should be explored and could become amajor partner in the people oriented health policies of thestate which seeks to empower the local elected bodies in healthwork.
5.2.3 Community ParticipationCommunity participation has not been exploited in the healthsystem. Technology dominated, technology solution dominat-ed and technicians dominated, this system has actively soughtto remain outside any interaction with the patients or anyother groups in health delivery. It has been a domain issues,and since the health system has become almost totally tech-nology intensive, it has made non-technical interventionseven more difficult.
The role that communities have been able to seek hasbeen with the coming of the new Panchayati Raj set up. Themain role of community participation in Madhya Pradesh hasbeen through the medium of the Panchayati Raj institutions.The district Zila panchayats were entrusted with some respon-sibility of managing local health set up. However in practisetill now there has been very little interface between the healthstructure and people’s representatives.
The latest amendments to the Panchayati Raj Act,popularly referred to as the Gram Swarajya amendments, havecreated substantial space for community participation andlocal control over health. The Act is perceived by many as an
instrument that will go a long way in decentralisation anddevolution of statutory powers to the Gram Sabhas21. Underthese amendments, a Gram Swasthya Samiti (Village HealthCommittee) has been set up. The Gram Swasthya Samiti has amulti sector mandate combining health, safe dinking water,sanitation and nutrition.
Another move towards involving the community hasbeen the village health register. Every village now has a villagehealth register, in which community is involved in registeringinformation on JSR, Dai, immunisation, ANC, FamilyWelfare, Malnutrition, Availability of Safe Drinking Water,Service Providers, VHC, Depot Holder, 4 Vital Registrations,etc. The Gram Swasthya Samitis will be trained on the healthregisters. The current registers are based on information collected in 2002, and these shall be up dated annually.
6. NARROWING THE GAPS — THE MP HEALTH RESPONSE
6.1 Evaluation of the health systemIn spite of the network of medical institutions, large army ofmedical personnel and many efforts in the health arena, thehealth status of Madhya Pradesh has been deplorable at best.The Rajiv Gandhi Missions system undertook a critical evalu-ation of the health system of the state, which is presented inthe box22. This evaluation of the health system has been thebackground for the planning that went into the new SwasthJeevan Sewa Guarantee Yojana of the state. The points ofassessment show the current government thinking on health.The scheme is planning for a major shift in the managementof a people health initiative, a like the Education GuaranteeScheme23. In fact this critique of the health system has helpeddesign elements of the new health scheme.
6.2 Initiatives in HealthIn the arena of health, as all indicators and data show, MadhyaPradesh has a very long way to go. There are constraints of adifficult terrain, poor availability of funds in a backward andpoor region, lack of medical personnel to adequately servicethe population, coupled with an under nourished and weakpopulation. With no options to enhance funding in health inthe near future, it calls for changes in the delivery strategiesand delivery systems in the state. On the other hand, health isan area where quality of care and therefore quality of persondelivering the service is utterly crucial.
To overcome some of these constraints, the StateGovernment has undertaken some initiatives in health in thelast eight years. These have been crucial both in what they haveachieved and in what they have shows in way of institutional
H E A LT H
74
21. There shall be a Gram sabha in every village. The Gram sabha will be a body corporate by the name specified thereof.
22. “Swasth Jeevan Sewa Guarantee Yojana” Moving Towards Decentralised Management of Health care in Madhya Pradesh, Rajiv Gandhi Missions : Occasional Papers No 8, R
Gopalakrishnan and Manohar Agnani, March 2001
23. The designers of this mission state that they have been inspired by the Education Guarantee Scheme in the design of this initiative.

arrangements and designing of new ways. We will undertake abrief tour of these initiatives. In Madhya Pradesh we are alsoseized with two other problems – qualified doctors do notwork in rural health centres, and either get themselves postedto urban centres or do not attend their duties, and seconddeclining funds have turned many of these health centres inac-tive. Drawing on the experience of these initiatives and the twoproblems listed, Government of Madhya Pradesh has recentlycome up with a state wide initiative to tackle this. We will alsothen take a look at this initiative and what went into making it.
6.2.1 Selected Initiatives It is important to list down some specific initiatives undertaken by the state government focussing on critical issues inhealth. In its effort at reducing infant related mortality and ill-ness, the great success story has been the pulse polio cam-paign, undertaken nation wide. The success of the programmecan be gauged from the fact that the state remained polio freein 2001 and throughout 2002. In fact in 2000, the State hasachieved the international standards with regard to the tech-nical aspects of this campaign. Based on community manage-ment, and participation, pulse polio campaign has shown anexcellent manner of putting together the community andtechnology in achieving great success.
The recent efforts at ensuring full immunisation in thestate has also achieved results. As mentioned earlier, the cur-rent rate of fully immunised children has touched nearly fiftypercent, up from the 25 percent that the State would achievetill a couple of years back.
The State of Madhya Pradesh has initiated a State Illness
Assistance Fund for providing grants to below poverty linecases. Those identified as poor in the below poverty line surveys can now get benefit for 13 major diseases requiringsurgery and treatment. A fund of Rs 10 crores has been kept ina nationalised bank for this purpose. The grants are sanc-tioned by a committee or by the Minister of Health in cases ofemergency, and assistance ranges between rs 25000 to a maximum of Rs 1.5 lakhs.
6.2.2 RKS - The Rogi Kalyan SamitiThe State has initiated a scheme for citizen involvement in themanagement of State hospitals and health centres, following thesuccessful experiment with a Rogi Kalyan Samiti in cleaning andrefurbishing the Maharaja Yashwant Rao hospital at Indore. Thisscheme brings in citizens participation in health centre manage-ment, introduces levying user charges, citizen bodies controllinguser charge funds, and maintaining the health centres.
Today, there are 750 hospitals and health centres acrossMadhya Pradesh that have a Rogi Kalyan Samiti out of a totalof 1527 total centres. More than 7000 people are involved inthe running and management of their health centres and hospitals as participants in RKS, and over the last five years,53.2 crore rupees has been collected as user charges or raisedby citizens as donations for their hospitals and health centres,and 40.2 crores out of this has been spent on improving hospitals, buying equipment, and medicines etc..
Many problems have also been identified with the RKS,but what has happened is that it has opened up the health system to participation of people in their management,brought a sense of ownership amongst citizens, with usercharges it has broken the bogey that people will not pay forgood services, and has provided a system with potential to beused to improve services of health units. It clearly shows thatpeople’s participation can definitely improve the status ofpublic health delivery system.
6.2.3 Swasth Jeevan Sewa Guarantee Yojana (SJSGY)The Swasth Jeevan Sewa Guarantee Yojana aims at establishinga system through which the participation of the communityincreases in the management of health services and effectiveutilisation of resources and facilities. The implementation ofthe Swasth Jeevan Sewa Guarantee Yojana will ensure the pro-vision of a core set of services by the state government withina specified time frame. These services will include:● One trained Jan Swasthya Rakshak in every village by
December 2002.● One trained birth attendant in every village by December
2002.● Universal Immunisation.● Three Ante-natal checks for pregnant women.● Safe drinking water supply.● Nutrition cover – Infants, children aged less than 3,
pregnant and lactating women.
75
H E A LT H
Evaluation of the Health System
Abandoning Comprehensive Health care for Selective Health Care
Vertical Management that bypasses Horizontal Structures.
Declining share of Non-salary component and non optimal mix.
Ineffectual Delivery of Services: Data on Benefit Incidence.
Uneven Benefits: The Social and Gender Divide
Inadequate Focus on the Private Sector and Indian Systems of medicine
Citizen and Community as Patients not agents of change
No Framework to Capture Determinants
Limitations of Current Sector Reform Proposals
Extracted from “Swasth Jeevan Sewa Guarantee Yojana” Moving TowardsDecentralised Management of Health care in Madhya Pradesh, RajivGandhi Missions: Occasional Papers No 8, R Gopalakrishnan andManohar Agnani, March 2001

● Proper sanitation facility – solid waste management andwaste water disposal.
Training of Village Health CommitteeThe Gram Sabha members of every village will be given theresponsibility to constitute a health committee of stakehold-ers, called the Gram Swasthya Samiti to carry out this plan atthe village level. This committee should have at least 12 mem-bers out of which fifty percent should belong to ScheduledCastes, Scheduled Tribes and Other Backward Classes (2/3SC/ST and 1/3 OBCs) and thirty three percent women members.
With the support of the Rajiv Gandhi Community HealthMission, number of Master Trainers and Block level trainershave been trained and now they are training VHC membersacross the state.
Community Health Activists is SJSGY – Jan SwasthyaRakshak (JSR) and Trained Birth Attendant (TBA)The State Government started the Jan Swasthya Rakshak
Yojana on 19th November, 1995 to provide basic health serv-ices in the rural areas through trained personnel who can treatminor ailments, and to develop a cadre of people who can alsoassist in the implementation of national health programmes.This scheme ran in the state for nearly five to six years. Thereis not very much known regarding the actual effectiveness orimpact of the JSR scheme, but the general impression from thefield has been that they can be fairly effective and possesimmense potential as an army of para-professionals. To fill inthe information gap on JSRs, and to strengthen this pro-gramme the state government got an evaluation conducted ofJSRs, which has thrown light on the JSR scheme and whatpotential lies in this scheme for the state (see box).
Building on the JSR scheme and drawing action pointsand guidelines from evaluations of the JSR scheme and feed-back from the field, the state government has brought themunder the Swasth Jeevan Sewa Guarantee Yojana, the compre-hensive community health scheme. As per the directions ofthe state government in response to the new initiativesplanned in the states health delivery set up, the presence of at
The State Government started the Jan Swasthya Rakshak Yojana on 19th
November, 1995, aiming to provide basic health care in every village of the
state. The idea was highly relevant, aiming at creating a functionary capable
of providing accessible, affordable and appropriate care right at the village
level. As per the goals of the SJSGY, the presence of a trained Jan Swasthya
Rakshak in every Village is to be ensured by Dec. 2002.
Presented below are salient findings of a review of the JSR scheme -
The common opinion about this scheme encountered is that it is
conceptually sound and designed to meet a much-felt need.
There is an attrition rate in JSRs. Going by interviews and investiga-
tion in various blocks, it appears that quite a few of the JSRs are not fully
active today.
Regarding process of selection, the JSRs are to be selected by the Gram
sabha. As far as the selection of JSRs earlier on was concerned, there were
many cases when Gram Sabhas did not actually select the JSR. However,
based on feedback, this selection procedure today has been ensured, and
Gram sabha now play an active role.
Gender wise, men heavily predominate. Educational status among
most of trainees and trained JSRs was class 12th or above, while the lower
ceiling for educational qualification to become a JSR was Class 12th pass. A
few Private medical practitioners (2% of JSR trainees studied) have entered
the JSR training process and pose the risk of providing an unhealthy role
model for other JSRs. The education criterion for JSRs has now been
relaxed to 8th pass, and preference is being given to candidates from SC and
ST communities.
Methods of training include observation of clinical work in OPD,
wards, lab or injection room. In classrooms the main method is reading of
the manual. In the earlier experience of JSR training, training aids were
lacking, including the manuals. The trainers in most instances were the
medical officer of the PHC/ CHC and may be the sole trainer; generally
trainers had little time and mental space to devote for training and venue
for training was also often inadequate. The feedback on improving training
management, training curriculum and its design have been incorporated
into the training now being given to JSRs.
JSR links with public health system was tenuous. Personal
contact with ANM/MPW seems to be the unstructured link, with involve-
ment in occasional assignments like Pulse Polio being the only content.
There was no formal monitoring of JSRs either in form of regular feedback
from them or communication to them from the PHC. This has changed
now, and in the tenth plan, the government plans to network with JSRs
under different programmes, especially those related with primary and
community health.
It may be said that the scheme has major potential because of the vast
need for available and affordable care in a backward state with far-flung vil-
lages. The evaluation report stated that the scheme lacked a ‘system frame-
work’ and the report as well as most stakeholders were of the opinion that
improvements were necessary. The evaluation report mentions “Redesign
of the scheme with educated involvement of users, analysis of processes,
better support systems, slower pace could provide a viable option for village
level primary care. Also there is a need to institute controls including con-
trol by users, better training, continuing education and concerted effort on
National/ State Health Programmes.” Most of these recommendations have
been put into effect under the overall umbrella of the SJSGY (some of these
elements have already been mentioned above).
Jan Swasthya Rakshak Scheme - An Evaluation
H E A LT H
76
Source: Draft Report of Evaluation of JSR scheme, CHC Bangalore, and Reports and Information from Directorate of Health, Government of Madhya Pradesh

least one trained Jan Swasthya Rakshak in every Village has tobe ensured by December 2002. Under this initiative, out of thetotal 52352 villages, JSRs are to be made available for 42816villages. Till date 29371 JSRs have been trained, and another10069 are undergoing training. This just leaves 3376 moreJSRs to be trained to achieve the target of one JSR for everyvillage.
Along with JSRs, the state government has also decided toensure at least one trained Dai for each village by the end ofthe year 2002, again a part of the Swastha Jeevan SewaGuarantee Yojana. Till date 41928 Dais have been trained andanother 1466 are under going training. Another 9027 Dais arestill left to be trained. The main objectives of the Dai programme is to provide ANC checkups, identify high riskpregnancies and counselling on nutrition and safe delivery; toconduct safe deliveries; to identify danger signs during delivery and appropriate timely referral.
7. IN CONCLUSION
The effort through the Swastha Jeevan Sewa Gurantee Yojana isto move towards a rights-based framework for delivery of basichealth care. It is expected that the Swasthya Jeevan SewaGurantee Yojana will leverage the management of health sectortowards district and below district level management. TheState Government has also set up a State Health Society chairedby the Chief Minister as a multi sectoral forum with expertsand sectoral heads represented on it so that issues of health canbe addressed in an integrated framework. This has beenextended to the Districts as District-level Health Societies.
The Village Health Society at the Village-level, the DistrictHealth Society at the District-level and the State HealthSociety at the State level are key multisectoral managementunits to address health issues. It is proposed to build healthaction from below to address the major challenges thatMadhya Pradesh faces in public health.
77
H E A LT H

78

Livelihood is the most defining and determining need fora human being. A livelihood in many ways is almost theentire gamut of issues covering life. For a decent level of
human development, a person and her household requires asource of sustainable livelihood that ensures access to basicresources and access to basic amenities to survive well.Employment, sustainable, gainful and one that ensures a basiclevel of remuneration is essential for all human beings.Employment by itself is not a complete condition for a sus-tainable livelihood – it is the character of employment – itsregularity and periodicity, level of income or benefits from it,and security of employment, and ensured basic rights ofemployment.
In this chapter we will take a look at the question ofemployment and un-employment in Madhya Pradesh, and abrief look at the conditions affecting livelihoods apart fromemployment.
INTRODUCTION
People need sustainable livelihoods to ensure that they andtheir dependants are able to have access to basic resources and basic needs to ensure a life of dignity, decent living, savefrom disease, hunger, squalor, poverty, deprivation and denial of basic rights. This means that livelihoods ensurenutrition, lack of hunger, ability to access basic health,give children basic education, ability to afford a decent shelter, clothes and resources for necessary daily and socialexpenditures.
Livelihoods, in many ways would then be a sum total ofboth the employment portfolio of a household and what itearns in monetary terms, or as services and goods, and what ahousehold receives as entitlements being a citizen of the state,or gram panchayat. Dealing with both these aspects, we willconcentrate more on the status, trends, issues and action onlivelihoods of people and lesser on the livelihoods provision-ing by state, or other agencies.
The most crucial need for a sustainable livelihoods for anindividual or household is employment, or being gainfullyemployed over a period of time, that ensures a level of remu-neration satisfying basic needs and a quality of life. What isthis level of earning/ income/ inflow of money goods or serv-ices to a household that ensures such a standard is difficult to
estimate, but there are a few ways of assessing these. The mostwidely used measure is one of income poverty. Householdssubsisting below this level of income (calculated using expen-diture estimates), would be the most vulnerable and deprivedhouseholds. The other measures would be employment figures, employment in different categories.
Households involved in labour, without possession ofland, households with very little land (marginal farmers,or even small farmers owning poor quality or un-irrigatedlands), households with just one member employed (especially in rural areas, and employed as labour, or verysmall trading or wage employment), persons employed in activities facing crisis/ shrinking/ decline and so on. On the other hand, evidence of persons gainfully employed,and being able to sustain their households would be available from figures of employment from census and othersurveys, and their sustainability can be ascertained from ownership/ operational rights over land, factors of produc-tion, employment in salaried positions, self-employed in units of some size, employed in growing/ emergent clusters,and so on.
Other measures or indications on the state of livelihoodsare the issue of ownership/ access to productive capital/ assets.Ownership or access to land, access to forest and forest produce, including usufruct, access of natural resources forlivelihoods dependent on them (pond and lakes for fish folk,access to clay for the potters, access to dead carcass for leatherflayers, etc.), access to water.
The chapter on livelihoods would attempt to understandthe nature and sources of employment in Madhya Pradesh, and the quantum or numbers of persons belonging to various categories of employed, asset holdings and so on. This would give a precise idea of thequality and quantity of the livelihood issue in the state.The first section would therefore deal with the magnitude of employment, problem of un-employment and underemployment. The next section will deals with aspects affect-ing livelihoods, where we deal briefly with the economy ofthe state and some of the crucial issues of ownership,growth areas, the institutional framework for livelihoods and last the action in livelihoods promotion in MadhyaPradesh.
Livelihood: Crisis and Growth
79

The Census of 2001 has put the population of MadhyaPradesh at just over six crores, showing a growth rate of over24 percent over the decade. This puts the annual increase inpopulation at 2.2 percent or 13.3 lakh persons per annum. Letus assume that the annual growth rate would remain the samefor the first few years of this decade, and persons added in thelast two decades now need jobs or employment. The WorkerParticipation ratio of MP in the productive ages (15 years to59 years) is presented in the Table 1(a) below.
With the same level of main and marginal workersassumed in the work force as estimated by Census for MadhyaPradesh in 1991 for the different age groups, we see that on anaverage at least nearly ten lakh jobs will be required every yearfor the workforce. This is many sense would be the employ-ment challenge for Madhya Pradesh – to ensure gainful andsustainable employment to ten lakh people every year.Expanding and providing opportunities for productiveemployment is central to sustained poverty reduction, aslabour is the main asset for majority of the poor.
Madhya Pradesh has a very large population dependanton agriculture, there is a gradual casualness of labour, and alarge number of persons are employed in sectors which arenot high growth. The challenge of employment is then not justnew jobs, but to make existing livelihoods stronger, and sustainable. In the following section we will attempt to look atthe employment scenario and trends for Madhya Pradesh in
the light of where is this employment coming from, whatcould be the characteristics of this employment in terms ofsecurity and sustainability of livelihoods and what would bethe future scenario.
The last decade has seen many changes in MadhyaPradesh, including a high rate of growth of the economy. Howmuch of this has translated into an impact on peoples livelihoods is what we need to see. Evidence, both from peoples field experience, and from studies and data shows thatemployment opportunities created is inadequate inspite ofrapid growth. The general perception in the country is that although GDP growth has accelerated, it has not beenaccompanied by a commensurate increase in employmentleading to a worsening in the employment situation in thepost-reform period. These considerations have led to ademand for greater attention to the employment objective1.There is also a concern on youth and educated unemploymentas increase in it will lead to waste of human resources andsocial tensions.
EMPLOYMENT SITUTATION AND TRENDS
Information on the level of employment in the state is derivedfrom both census records and data based on National SampleSurvey (NSS) data.
As shown below, employment in Madhya Pradesh islargely unorganised, rural and non-industrial nature. Casual
L I V E L I H O O D S
80
TOTAL 42.8% 52.3% 32.7% 46.8% 54.0% 39.3% 29.6% 46.8% 10.2%
5-14 8.1% 7.6% 8.6% 9.9% 9.2% 10.7% 1.8% 2.3% 1.3%
15-19 44.9% 47.4% 42.0% 55.0% 55.6% 54.2% 16.7% 24.5% 7.2%
20-24 64.8% 78.8% 51.0% 74.4% 85.9% 63.6% 37.6% 60.3% 12.6%
25-29 74.4% 94.0% 54.4% 81.7% 96.2% 66.9% 52.6% 87.4% 16.6%
30-34 78.4% 97.5% 57.9% 84.3% 98.2% 69.7% 60.2% 95.3% 20.2%
35-39 80.1% 98.5% 59.0% 86.1% 99.0% 71.4% 62.5% 97.2% 21.8%
40-49 79.8% 97.7% 60.3% 84.8% 98.1% 70.8% 63.7% 96.3% 23.1%
50-59 75.0% 94.3% 53.6% 79.3% 95.8% 61.6% 58.8% 89.2% 20.8%
60-69 55.6% 76.4% 33.9% 60.5% 81.3% 38.7% 34.4% 55.1% 12.6%
70-79 33.9% 52.4% 15.7% 36.7% 56.0% 17.9% 21.1% 36.5% 5.7%
80+ 24.7% 38.1% 10.1% 26.3% 39.8% 11.6% 18.1% 31.2% 4.2%
15-59 70.0% 85.1% 53.7% 77.2% 88.5% 65.3% 48.1% 75.2% 16.7%
Age group Population Rural Urban
All Male Female All Male Female All Male Female
Source : Derived from Table B1 (S) for Madhya Pradesh, Economic Tables, Census of India, available of CD-ROM, Registrar General of India, New Delhi
Table 1(a): Worker Participation Ratio by Ages in MP, 1991
1. For details see GOI (2001)

labour forms a substantial part of the total labour force andhas been growing in the last couple of decades.
Work participation ratesWorker-population ratios provide an idea about the participa-tion of population in economic activity2. Table 1(b) provides the worker population ratios for the period 1983 to1999-2000. The participation rates in rural Madhya Pradeshincreased in 1993-94 before declining significantly in 1999-2000. The decline occurred for both rural and urbanareas. The worker-population rates for rural and urban Madhya Pradesh are much higher than for rural or urban India, and this trend has been maintained over the last manyyears. The over ten percent difference between the WPRs ofIndia and Madhya Pradesh shows the need for large number of people to be involved in the workforce in Madhya Pradesh.This quite clearly shows that the remuneration received from
most livelihoods in Madhya Pradesh are low, and many morepeople in households are required to be working to maintainthemselves.
In the trend of a decline in WPR over the years, the survey results for 1993/94 do show a somewhat different picture, where rural WPR went up from 1987/88, and thenreduces again in 1999-2000 in Madhya Pradesh and India.
We see the participation rates for males and females forthe 1990s in Table 2. It shows a decline of rates for both malesand females in 1999-00 as compared to 1993-94, except in thecase of urban males.
Age specific worker participation rates apart from Censusare also available from NSS. From these estimates let us firsttake a look at children working. Looking at the incidence ofchildern working captured by NSS estimates presented in Table3, in Madhya Pradesh an approximate 17 percent of rural chil-dren in the age group ten to fourteen years were working. The
81
L I V E L I H O O D S
1983 49.8 32.3 44.5 34
1987-88 47.9 32.3 43.4 33.7
1993-94 49.4 31.7 44.4 34.7
1999-2000 46.2 31.9 41.7 33.7
Year Madhya Pradesh All India
Rural Urban Rural Urban
Source: NSS Rounds on Employment and Unemployment (38th, 43rd, 50th and
55th Rounds)
Table 1(b): Work Participation Rates:
Madhya Pradesh and All India
Male
1993-94 57.2 47.1 55.3 52.1
1999-2000 53.6 48.8 53.1 51.8
Female
1993-94 41.0 14.2 32.8 15.5
1999-2000 38.2 13.4 29.8 13.9
Year Madhya Pradesh All India
Rural Urban Rural Urban
Source: NSS Rounds on Employment and Unemployment (50th and 55th
Rounds)
Table 2: Work Participation Rates for Males
and Females: Madhya Pradesh and All India
2. In order to capture the complexities of the employment situation in a predominantly agrarian and unorganised economy like India, the estimates of employment and
unemployment by NSSO are derived on three concepts, Usual Status (US); Current Weekly Status (CWS) and Current Daily Status (CDS). The three concepts are based on three dif-
ferent reference periods for ascertaining the activity status of a person. Under the Usual Status concept the reference period is one year and the activity status of a person as employed,
unemployed or out of labour force is determined on the basis of activity pursued by him for the major part of the year. On the CWS criterion, a person is considered as employed or
unemployed if he has worked or has not worked though was available for work, respectively, even for one hour during the week. Under the CDS approach, the unit of classification is
half day. Under this approach the person days are distributed by activity category during an average week. A deficiency of the present time criterion based estimates of employment is
that one gets to know little about how well employed (income etc.) are the persons who are seen as employed. They also do not provide the multiple activities by persons/households.
Andhra Pradesh 3.6 34.4 1.3 12.9
Assam 0.3 4.9 0.2 6.5
Bihar 0.5 7.5 0.2 2.5
Gujarat 0.2 8.4 0.5 3.3
Haryana 0.2 5.1 0.6 4.1
Karnataka 3.6 25.1 0.8 8.0
Kerala 0.1 1.3 0.0 1.1
Madhya Pradesh 1.1 17.3 0.6 2.3
Maharashtra 0.9 12.6 0.1 4.0
Orissa 1.2 14.4 0.3 5.1
Punjab -- 5.3 -- 3.4
Rajasthan 5.0 25.4 0.6 6.1
Tamil Nadu 2.1 18.3 0.5 8.8
Uttar Pradesh 0.4 10.4 0.4 6.2
West Bengal 0.7 10.4 0.6 6.7
All India 1.3 14.0 0.5 5.6
Rural Urban
5-9 10-14 5-9 10.14
Source: NSS 50th Round
Table 3: Percentages of Workers among
Children across States

rate of rural child workers is the fifth highest amongst themajor states of India. In urban areas on the other hand, the rateof children working is relatively much lower at 2.3 percent.
Employment growth The number of employed and worker participation rates showthe current status. Trends in employment growth and thediversity and distribution of work force are a far more crucialand relevant indicator of the state of livelihood. What is hap-pening in employment or livelihoods in the state in the lastdecade or so? Table 4 shows that employment growth declineddrastically in the 1990s as compared to the period 1983 to1993-94. In rural Madhya Pradesh, rate of growth in employ-ment declined from 2.49 percent per annum to 0.69 percentper annum.
What are the reasons for the decline in employmentgrowth in the 1990s? One of the reasons could be decline inparticipation rates of younger age groups. A decline in theparticipation rates of younger age groups is expected asyounger people try to gain access to education and stay inschool for a longer period. Rising income levels also reducethe pressure to enter the labour market. However, it may benoted that participation rates declined for all age groupsalthough the decline was shaper for younger age groups.Another explanation given is that labour force growth itself
has declined. In other words, many are joining the category of‘not in the labour force’. It is not, however, clear why labourforce participation has declined. It is possible that economicopportunities have not increased in the post-reform periodinspite of higher growth.
PROLIFERATION OF MARGINAL AND SMALL FARMERS
The number of smaller holdings and area under them has
L I V E L I H O O D S
82
1983 to 93-94 1.82 1.73 2.98 3.34
1993-94 to 1999-2000 0.69 0.67 2.94 1.34
Period Rural Urban
M. P. All India M. P. All India
Table 4: Employment Growth (per cent per
annum): Madhya Pradesh and All India
Workers in 1983 11897 8803 20700 3108 825 3933 24633
Workers in 1987/88 12900 9200 22100 3600 1000 4600 26700
Workers in 1994 15788 10689 26514 4142 1120 5287 31801
Workers in 1999-2000 16463 11116 27634 5054 1100 6291 33924
Rate of Change in Workers per Annum
Between 1983 to 1987/88 1.63% 0.89% 1.32% 2.98% 3.93% 3.18% 1.62%
1987/88 to 94 4.12% 3.05% 3.71% 2.84% 2.29% 2.82% 3.56%
1993-1994 2.87% 1.96% 2.51% 2.91% 3.11% 3.00% 2.59%
1994 – 2000 0.70% 0.65% 0.69% 3.37% -0.30% 2.94% 1.08%
Period Rural Workers (in ‘000s) Urban Workers (in ‘000s) All Workers
Male Female Total Male Female Total (In ‘000s)
Source : Computed by the author based on NSS and Census data. For absolute numbers, Census figures are used.
Table 4 (contd.): Employment Growth (per cent per annum): Madhya Pradesh
1970-71 16.8 8.9 10.7 11.7 4.9
1995-96 22.8 16.5 13.8 9.5 2.0
No. of Holdings (%)
1970-71 31.8 16.8 20.1 22.0 9.3
1995-96 35.2 25.5 21.4 14.7 3.1
Area (in lakh hectares)
1970-71 7.2 13.2 30.9 73.5 87.2
1995-96 11.4 24.4 39.3 57.9 32.9
Area (%)
1970-71 3.4 6.2 14.6 34.7 41.2
1995-96 6.8 14.7 23.7 34.9 19.8
Year Marginal Small Semi-medium Medium Large
No. of holdings (in lakhs)
Note: Marginal (below 1 hect.); Small (1.0 to 2.0 hect.); Semi-medium (20. to 4.0
hect.); Medium (4.0 to 10.0 hect.); Large (above 10.0 hect.)
Source: Commissioner of Land Records and Settlement, Gwalior, M. P.
Table 5: Distribution of Operational
Holdings and Area by Size Classes:
1970-71 and 1995-96

been increasing, a pointer to fragmentation of the alreadymeagre land holdings of small and marginal farmers upondivision, and many semi-medium and medium level landholdings slipping into marginal or small land holdings withfragmentation due to multiple divisions. The data presentedin Table 5 show that the share of marginal and small farmersin area and number of holdings increased over time from 9.6percent in 1970-71 to 21.5 percent in 1995/96, an increase ofseventy five percent in terms of land under small and margin-al farmers. The data for 1995-96 show that around 61 per centof the land holdings belong to marginal and small farmers.
There are 39.3 lakh small and marginal farmers in the state and they are mostly underemployed. The size ofland holding of these farmers (average land holdings ofsmall and marginal farmers was 0.91 hectares in 1995/96) is uneconomical and majority would also be working as agricultural or casual labourers to supplements their incomesfrom farming to sustain their livelihood. In between 1981 and
1991 there was no significant shift of workers to agriculturelabourers. However, data from NSS rounds report that there isa gradual casualisation of the workforce, and the number of casual labourers in MP went up from 32 percentmale and 38 percent female casual labourers in 1993/94 to 37percent male and 44 percent female casual labourers in1999/2000.
PRODUCTIVITY OF LAND
On livelihoods dependent on agriculture, the quality and pro-ductivity of land has a significant effect. The productivity ofagricultural land is at the heart of income earning opportuni-ties, and the well being of the people is dependent on the yieldfrom agriculture.
If we look at the Table on agriculture productivity it givesa fairly good idea of the regional dimensions of the strengthsof agriculture, a surrogate measure for basic well being ofthose working in farm activities. There are identifiable regions
83
L I V E L I H O O D S
Marginal and small farmers normally till their own till land, their own khud
kasht holdings and many amongst them also take land on lease, owning two
to four acres of land, and on average lease two to three acres of land on batai.
Every subsistence farmer wants to grow food for tiding over at-least six
months’ worth of consumption needs for his/her family, and it was found
that they were able to grow 12-15 quintals of food grains per annum.
Produce grown by them includes edible oils, like linseeds, sesame, rape seeds,
taramira, and also some coarse millets like tapioca (kodo), sama and pulses
like arhar, mung and urad, and some vegetables in the kitchen garden. Most
subsistence level farmers (about 90%), reared one or two bullocks for tilling,
renting them out and for dung, for manuring the fields. The requirement of
dung for one acre of land is about ten cart-loads and one buffalo/cow
produces about ten cart-loads of dung per annum. A subsistence farming
family (of seven members) needs about four acre worth of agricultural
produce for meeting six months of domestic needs. This requires four heads
of cattle, which generally consists of a cow, one or two calves and a pair of
bullocks. However, the study team found that in most cases, the subsistence
farmers had access to only two to three acres of land (either their own land
or sharecropped land). They also do not own any other assets of significant
monetary value like bullock carts, mechanical devices etc. though they do
have implements like ploughs, levelling planks etc.
The subsistence farmers have to complement the agricultural yield
with wage labour (local as well as migration), gathered residuals (from
harvested fields) and other subsidiary non-farm occupations (e.g., service,
pottery, hair-cutting, carpentry, fishing etc. depending on castes and avail-
able choices). Fishing is an important livelihood source for communities
(especially kevats or dhimars) living near water reservoirs. Another activity
undertaken by such farmers is collection and sale of non-timber forest
produce and sale of head loads of fuel wood in the nearby markets.
Households belonging to this category (especially the SC/ST ones) are
often bound in exploitative relationships (as reflected in low wage
payments, harassment of women and harassment of school-going children)
with the dominant segments i.e., the larger farmers.
In Bundelkhand and Chambal regions livelihoods of this category are
subsistence livelihoods. In districts like Narsinghpur, Hoshangabad, Ujjain
and Neemuch – some of the farmers with 4-5 acres of land might even
belong to marginally surplus livelihoods, helped mainly by the black cotton
soils of Malwa region and ample water for irrigation.
One of the chief features of this group is its perpetual state of indebt-
edness to the local moneylenders. The debt burden on the small and mar-
ginal farmers is lesser than on the landless labourers provided (i) the former
have not faced any major health problems in which case they are compelled
to avail loans from the local moneylenders, (ii) The family does not have
more than one daughter to be married and (iii) The family has at least four
bighas of irrigated land which are dual cropped and the family grows
vegetables and other cash crops on that irrigated land.
The small and marginal farmers stand a much better chance of getting
some land to cultivate on share cropping basis than the landless because
they have wherewithal to undertake farming, whereas the landless would
neither have bullocks and agricultural inputs nor much of prior experience
in farming. The details of the agriculture labour and non agriculture labour
are more or less the same but for the fact that the small and marginal
farmers remain fairly busy in their own fields and therefore are unable to
work as much in the field of others as agriculture labour as the landless in
the village. This group is more likely to have cattle but the milk produced is
invariably used more for self-consumption than for sale.
Subsistence (Marginal and Small) Farmers (landholding between one acre to five acres of land) – A study of households in Narsinghpur, Hoshangabad, Ujjain and Neemuch
Source: Fieldwork by Project Team

of low agricultural productivity in the state. In the case ofmajor Kharif crops, the low productivity belt is largely con-centrated in the Rewa and Sagar Divisions, as well as three Nimar districts. In the case of major Rabi crops too,there is a well-defined low productivity belt, which is, howev-er, slightly different from the low productivity belt defined forKharif crops. In Rabi, the districts at the bottom in terms ofyield per hectare fall entirely in the Rewa division and thesouthern tribal districts of Jabalpur division. The three districts of Nimar record comparatively high levels of produc-
tivity in Rabi, ranking at No. 5,6 and 14 in the state out of 45districts.
Some of the differences may be explained by IrrigationIntensity. If we consider the districts with irrigation intensityof less than 20 per cent, we find, in addition to the district ofJhabua in Western MP, a clear contiguous geographical belt inEastern MP encompassing the districts of Panna, Rewa,Shahdol, Sidhi, Umaria, Dindori, Mandla and Seoni. Thesealso happen to be districts in which the productivity of Rabicrops is relatively low. The Nimar districts are comparatively
L I V E L I H O O D S
84
Mahua Madhuca indica Commercial, Medicine, oil June– JulyKanji Pongamia pinnata Non edible oil Jan – Mar
Mahua Phool Madhuca latifolia Beverage March – April
Areetha Sapindus emarginatus Soap Feb – AprilAonla Embelica officinalis Medicine/ Trifala component, fruits very rich in Vitamin C. Nov – JanBaheda Terminalia bellerica Medicine Mar – May
Gond Dhawra Anogeissus latifolia Gum Feb – June
Gond Salar Boswellia serrata Gum Mar – June
Gond Karaya Sterculia urens Gum Mar – June
Gond Babul Acacia nilotica Gum, medicine Mar – June
Gond Khakra Butea monosperma Gum, dye Mar – June
Kali Musli Curculigo orchiodes Medicine Sep – Oct
Safed Musli Cholrophytum tuberosum Medicine Sep – OctSatavari Asparagus racemosus Medicine Sep – OctKemach Beej Mucuna purita Oct –Dec
Ghat Bor Zizyphus xylopara Fruits edible Mar - Apr
Bel Guda Aegle marmelos Diarrhoea, heat –stroke Apr – Jun
Gond Godal Lannea cormondolica Gum Mar – JunShahad Apis dorsota Medicine/ Food All year
Mom Apis dorsota Commercial All year
Gond Khair Acacia catechu Gum Mar – Jun
Lac Tachardia lacca Jewellery, sealing Mar – Jun
Baheda chhal Teminalia bellerica Medicine Mar – May
Adusa Adhatoda vasica Medicine Jan – Jun
Gokharu Tribulus terrestrius Medicine Sep – Oct
Ratanjot Jatropha carcus Medicine, Oil Sep – Nov
Aswagandha Withania somnifera Medicine All year
Marorphali Helecteres isora Medicine Oct – Dec
Sankh Pushpi Evolvlus aisiniodes Medicine Sep – Nov
Tendu Patta Diospyros melanoxylon Bidi making Apr – MayChironji Buchanania lanjan Food/ Dry Fruit Nuts May – June
Bark of Khakra Butea monosperma Fibre for ropes June – July/All the yearKosa/tassar On Terminalia tomentosa Cocoons for tassar silk March – MayMangoes Mangifera indica Edible Fruits June – July
– Betul Oil Exported for Scent Making —Jamun Edible Fruits May – June
Head-loads of wood Many species of trees Fuel-wood. Throughout the year
Name of NTFP Botanical Name Uses Month of Collection
Non Timber Forest Product in Madhya Pradesh

better off in terms of irrigation intensity, and this possiblylinks up with the improved agricultural productivity in Rabi.
The implication of continuing low productivity in theeastern region of the state is that income earning opportunitiesfrom agriculture would be limited. There is a need to bring thisregion into focus and look at ways of making a concerted effortto increase irrigation intensity, as well as undertake watersheddevelopment in a big way. Simultaneously, non-agriculturalland based activities need to be considered. This applies also tothe pockets such as Jhabua and Betul in which similar condi-tions prevail. On the other hand, in the case of relatively betterirrigated districts in the Nimar region, technical solutionsshould be sought to enhance productivity of Kharif crops.
FOREST BASED LIVELIHOODS
Nearly forty percent of the states villages are either forest vil-lages or are situated close to forests and forests play a significant
role in the livelihoods of people in such villages. It is difficult toestimate the exact number of people dependent to some extenton forests, since data captures by either the census operations orby NSS do not capture employment sources that give supportfor brief periods. In case of persons collecting Non TimberForest Product (NTFP), the period of direct persons days ofemployment is not very significant, say ten to fifteen days to amonth or so at the maximum overall in an year. But the forestproduce plays a significant role in peoples lives is very evidentfrom the three brief case studies of villages presented here. A listof some of the main NTFPs collected in Madhya Pradesh is alsopresented in the Box on NTFPs.
The regime governing forests and peoples rights overforests is highly regulated and governed by national acts. InMadhya Pradesh the large population that depends on forestsfor incomes and consumption has had to contend with suchlaws, but there has also been a gradual shift on part of the
85
L I V E L I H O O D S
A study of 53 households living on the outskirts of the Panna Reserve Forest
in Panna district, revealed that the villagers earned a total annual income of
Rs. 3.23 lakhs approximately through collection of NTFPs. They plucked
tendu leaves worth Rs. 1.5 lakh which were sold to tendu patta co-opera-
tives, collected mahua leaves and nuts worth Rs. 98,000 which were either
sold in haats or to traders in barter and sold fuel wood to the Majhgaon
Diamond Mine Employees Colony worth Rs. 65,000 annually. While these
households also had other income sources, the NTFP income of the house-
holds accounted for the 85 % of the total income of 46 households in the
village. On an average 2.7 persons from 46 families were engaged in NTFP
collection and marketing. Each family on an average earned Rs 9450 from
the forests and total incomes accruing to them annually was Rs 11,000/-
In another village of 83 households in Jhabua district, 68 households
draw approximately 35 percent of their total annual income from forest
produce. This village of mixed caste households has two JFM committees.
The nearby dry deciduous mixed teak forest has about 50 percent vegetation
density. All the big trees are below thirty years of age. It has about 60 %
Tectona grandis or sagwan population, besides, khakra, sirish, bamboo,
neem, tendu, pipal, dhawra, mango, jamun and some piloo trees. There is a
big undergrowth of bers, khakra, small khajoor, Adhatoda or adusa,
gobar-sungha and ratanjot plants.
In this village, details of NTFP quantity collected and value realised by
villagers is presented below.
Mahua Flowers Mahua Seeds Tendu Leaves (Bags) Gums
5261 Kg. 3916 Kg 163 1.5 Qt. for Rs. 2250
@ Rs. 8 per Kg. @ Rs. 10 per Kg @ Rs. 400 Value realised per Kg.
per bag and amount in Rs.
= Rs. 42088 = Rs. 39160 = Rs. 65200
Total income realised annually from the NTFPs = Rs. 1.49 lakhs approx.
Average family income = Rs. 2180
Besides the sales through village committees each of the NTFP collec-
tors sells some small amounts of NTFPs individually in haats for about Rs.
800 per annum. Hence the total average income through the NTFPs is Rs.
2980 or Rs. 3000 per household per annum.
Forest Produce Gathering in Mahakaushal
Collection of Non-timber Forest produce or NTFP includes food,
fuel, fodder, tendu leaves, Mahua flowers and seeds as well as Chironji
or Achar seeds. Fruits like mangoes, custard apples, guavas and small
berries are also abundant in this area. Some other forest produce
gathered are the tuberous roots of indigenous trees which are used for
eating/ consumption, some green leaves of grasses and herbs used as
vegetables and fodder and leaves of Khakhra (chevla/dhak), used by the
ginger cultivators to cover the tender plants of ginger and for
making plates and bowls by sticking the leaves together with tiny
wood pieces or scraping. For those people who have access to forest and
NTFP, say, typically, a household of seven persons, with four of them
engaged in NTFP collection, is able to collect tendu leaves worth 200
rupees per day for seven to ten days in a year i.e., an annual income of
fourteen hundred to two thousand rupees. Similarly, for mahua seeds and
flowers, the collectors get about the same amount of money over 30-40
days in a year. On an average, they collect mahua flowers and seeds from
about 4-5 trees and each mahua tree yields about Rs.500/- worth of
NTFPs per year. Hence Rs. 2000-2500 is the average income from mahua.
Other NTFPs and fuel wood, fodder and foods fetch a household with
four collectors yield worth about Rs.1000/- per year. Hence on an average,
a household with four collectors, collects NTFP, worth Rs.4400 to 5500
per year.
It needs to be stressed that all households in a village do not collect
NTFPs. It is the people at the subsistence level of livelihood (generally SCs
and STs), who collect NTFPs.
Livelihoods of Non-Timber Forest Produce (NTFP) Collectors
Source: Fieldwork by Project Team

government to grant more rights to people with regard to basicneeds from forests, and to bring people more and more intomanagement of forests. Rights of nistari were granted to peopleway back in 1970s. Madhya Pradesh today also has a large pro-gramme under Joint Forest Management (JFM). The impact orthe results of the JFM programme have certainly been beneficialas far as the forest cover in the state is concerned. The latestsatellite imagery released by ISRO shows that the forest cover inthe state has increased over the last five years by 376 sq kms.Much of the credit for this could go to the effective role playedby JFM groups in the state. However it must be kept in mindthat satellite imager data does not show the quality of forest.
The crucial role that forests play in the lives of millionswho either reside in forests or in villages within a five kilome-tre periphery of the state is significant. Inspite of efforts suchas rant of nistari rights, and the JFM programme, the relationbetween people and the forest management and regulatoryregime under the acts has sometimes led to conflict betweenvillagers and forest authorities.
ORGANISED EMPLOYMENT
Most of the social security laws in the country are applicableonly to organised workers. In Madhya Pradesh, there were21.89 lakh workers in the organised sector in 1997. If we justcompare the workers in the organised workforce with esti-mates of total workers in the state, the percentage share oforganised workers to total workers was just about 6.2 percentin 1993/94, and should be around six percent even today.Unorganised workers form around 94 percent of the totalworkforce in the state. The vast majority of the workforceincluding agricultural labour, construction labour and labourin traditional leather tanning, forestry, fishing, bidi rolling,household industry etc. as also village artisans, urban informalworkers coming under the general categories of unorganisedsector are wholly out of any reckoning in the various statutory
laws in the country. These workers are unprotected by legislation and most of them tend to be poor.
Employment in the organised sector: Public and private sectorMuch of the concern about the lack of employment reflects astrong preference for employment in the organised sector. Thejobs in organised sector generally provide much higher levelsof wages than in the unorganised sector and also providemuch greater job security and other benefits. The availableinformation summarised in Table 6 shows that it increasedfrom 12.88 lakhs in 1975-76 to 21.89 lakhs in 1997-98.
The Table also shows deceleration in growth of employ-ment in organised sector over time. In the later part of 1990s,the growth rate was around 0.9 per cent per annum. Although,in the two years between 1995-96 to 1997-98 there has been asudden jump in private sector jobs, thereby pushing upemployment overall in the organised sector. But this riseappears to be more of annual fluctuation feature, since otherevidence does not point to such a massive private sectorgrowth in recent years.
One of the main reasons for the lower growth in organ-ised employment is the slowdown in public sector employ-ment in the 1990s. Public sector employment has actuallydeclined from 1990-91 to 1997-98 in the state, and impactsgrowth rates for organised employment, since its share hasbeen around a third of all organised sector employment. Thehigher growth rates in private sector employment, averagingaround 3 percent per annum in 1980s, and over four percentin 1990s has not really been able to compensate for loss ofworkforce in public sector.
CHANGES IN SECTORAL DISTRIBUTION OF WORKERS AND RURAL
NON-FARM EMPLOYMENT
Here we examine diversification in terms of shifts across
L I V E L I H O O D S
86
1975 952564 335904 1288468 1975-76 to 1980-81 2.87% 5.28% 3.52%
1980 1097584 434511 1532095 1980-81 to 1985-86 2.95% 3.18% 3.02%
1983 1198811 467476 1666287 1985-86 to 1990-91 2.32% 2.97% 2.51%
1985 1269487 508042 1777529 1990-91 to 1995-96 -0.06% 3.14% 0.91%
1987 1323803 517787 1841590 1995-96 to 1997-1998 -0.51% 6.88% 1.96%
1990 1423987 588195 2012182 1990-91 to 1997-98 -0.19% 4.19% 1.21%
1993 1436574 665411 2101985
1995 1419371 686370 2105741
1996 1419222 747689 2166911
1997 1404964 784038 2189002
Years Public Private Employment (in lakhs) Compound Growth Rate Public Private Total
Table 6: Employment in Organised Sector
Source: Various issues of Economic Survey, Government of Madhya Pradesh

broad sectors in rural areas for the period 1983 to 1999-00.Diversification of rural livelihoods is important for severalreasons. At the economy level, the demographic pressures onland have been increasing significantly in the state. With itsshare of around 35 per cent in GDP, Agriculture and its alliedactivities has to bear the burden of 75 per cent of rural workers. Therefore, labour productivity has been low in agriculture. Urban areas have their own problems of demo-graphic pressures. As a result, rural non-farm sector becomesan escape route for agricultural workers. In order to increasewages in agriculture and to shift the workers to more productive areas, rural diversification is almost the onlyavenue open.
While examining the trends, usually the numbers for theyear 1987/88 are disregarded as that was a period of severedrought affecting most parts of the country, though its impact on Madhya Pradesh was not so severe. Still the dip that is seen in rural workforce in the primary sector in thisyear is directly a result of drought and not of rural workforcediversification. The percent of workers in primary sector inrural Madhya Pradesh has been much higher than that of all-India rural in 1983 and for all subsequent years for which datais presented. The gap between the share of primary sectorworkers in rural India to the share in rural Madhya Pradeshhas also been higher in the 1990s than in the 1980s. This showsthat the change in workforce diversification has been muchfaster in other parts of India than has happened in MadhyaPradesh.
There has been a gradual expansion of the tertiary orservices sector in Madhya Pradesh, with manufacturing relat-ed activities growing very gradually in rural Madhya Pradesh(see Table 7). In fact, secondary sector share of employmenteven dropped between 1983 and 1993-94, only to pick upfrom then to 1999-2000. The percent of workers in secondarysector in rural Madhya Pradesh was 4.8 per cent in 1983 and5.8 per cent in 1999-2000; that in all-India it increased from9 per cent to 11 percent during the same period. In 1983, thetertiary sector’s share in the state was half of that of all Indiaand has remained so even today.
Table 8 shows that the percentage of rural non-farmemployment in Madhya Pradesh increased significantly from7.2 percent in 1983 to 12.7 percent in 1987-88, and thereafterit tended to stagnate or show a decline. This is true for bothmales and females. In other words, jobs in the rural non-agricultural sector in rural areas were created very slowly.Since rural labour absorption in the non-farm sector is cru-cial for poverty reduction, what has happened in MadhyaPradesh in the 1990s with regard to non-farm employmentcreation is disturbing. When we compare the non-farmemployment of Madhya Pradesh with India, while a quarterof employment across India is in this sector, it is about halfof that in Madhya Pradesh. Even the Census 1991 figures onrural non farm employment supports this. In 1991, the shareof rural non-farm employment to total employment was thelowest in Madhya Pradesh amongst all states.
Trends at one-digit levelNSS provides data at different levels of desegregation based onNational Industrial Classification (NIC). Table 9 provides thetrends in employment in Madhya Pradesh at one digit level. Incomparisons over time, we ignore 1987-88 as it is a droughtyear. As mentioned above the increase in rural non-farmemployment has been slow except a jump between 1993/94and 1999/2000, when workers in this sector in rural areas wentup by 25 percent. The increase is mainly concentrated in con-struction, and trade.
Table 10 provides recent changes for males and females.For males, marginal increases were noticed in non-farmemployment such as trading, hotels and restaurant, construc-tion and transport. Manufacturing sector’s share increasedonly a little over this period from 3.2 percent to 3.9 percent. Inthe case of females, the raise was mainly in Manufacturing andservices
Employment in the districts – diversity and the non farm sectorTo undertake a regional or district wise assessment we get richdata on employment from the recently released employmentfigures from the Census of 2001. The 2001 Census has shown
87
L I V E L I H O O D S
Source: NSS Rounds
1983 90.7 4.8 4.6 81.5 9.0 9.4
1987-88 87.9 6.8 5.3 78.3 11.3 10.3
1993-94 90.4 4.5 5.1 78.2 10.2 11.5
1999-2000 87.5 5.8 6.9 76.1 11.3 12.5
Year Rural M. P. Rural All India
Primary Secondary Tertiary Primary Secondary Tertiary
Table 7: Broad Sectoral Distribution of
Workers in Rural M.P. and India
Source: NSS Rounds
1983 12.6 22.4 6.2 12.2 7.2 18.4
1987-88 14.9 25.7 9.5 15.3 12.7 21.6
1993-94 12.7 26 6.2 13.9 10.9 21.7
1999-2000 15.8 28.7 8.6 14.6 12.9 23.8
Year Males Females Total
M.P. All India M.P. All India M.P. All India
Table 8: Percentage of Non-Farm
Employment in Rural Madhya Pradesh
and Rural All India

that overall in the state there was a worker participation rateof 42.7. The important indicators assessing both the sustain-ability of employment and its strengths are the number ofagriculture labourers in the total workforce and the share ofnon-agriculture activities in total workforce, and we can seethis data in Table EL 5 late in this report.
The number of agriculture workers can be used as anexcellent proxy for finding the level of precarious or unstablelivelihoods, as these workers form the most vulnerable and
perhaps low earning of all. The diversification of employmenton the other hand shows strengths in employment, it is gener-ally an indication of prosperity, and usually pull factors aris-ing out of agriculture prosperity lead to diversification in ruralareas.
Overall in the state, there are 28.7 percent workersengaged as agricultural labourers. The districts with a veryhigh share of agriculture labourers are Narsimhapur, Seoni,Mandla and Harda, all above forty percent. Nearly forty per-cent of the agriculture labourers of the state are concentratedin eleven districts of Rewa, East Nimar (Khandwa), Balaghat,Chhindawara, West Nimar (Khargone), Dhar, Sidhi, Shahdol,Seoni, Satna, Betul, and Sagar. Most of the districts come fromthe poorer south central part of the state, characterised byheavily forested area and large tribal population. There arealso districts of Nimar, and the two on the north eastern partof the state, Rewa and Satna.
Districts with a low concentration of labourers in agricul-ture are (we do not consider districts with large urban con-centration such as Indore, Bhopal, and Gwalior), Morena,Jhabua, Datia, Tikamgarh, Shivpuri, Bhind and Chhattarpur.These districts form the Bundelkhand belt of the state alongwith some districts from the Chambal/ Giridh belt.
Looking at diversity in employment, from the 2001 Census we get information on share of non-agriculturalworkers and workers engaged in household industries. We willnot look at Bhopal, Indore, Jabalpur and Gwalior due to thehigh concentration of urban population and large cities inthese districts. Sagar and Damoh have a very high number ofnon agriculture workers – 48 and 42 percent respectively, but
L I V E L I H O O D S
88
Source: NSS Rounds
Agriculture and Allied 87.2 84.2 93.9 91.6
Mining and Quarrying 1.5 0.4 0.8 0.3
Manufacturing 3.2 3.9 3.2 4.2
Electricity, Water etc. 0.2 0.1 0.1 –
Construction 1.2 2.2 0.4 1.2
Trade, Hotel and 2.2 3.9 0.7 1Restaurant
Transport etc. 0.7 1.2 0.1 –
Real Estate business 0.1 0.2 0.0 –activities etc.
Services (public admin.. 3.6 3.9 0.9 1.9Comm. etc)
Total 99.9 100 100.1 100.2
Sector Rural Males Rural Females
1993-94 1999-2000 1993-94 1999-2000
Table 10: Distribution of Workers by Industry
at One Digit Level: Males and Females (%)
Source: NSS data on Employment and Unemployment
Agriculture & Allied 77.4 74.7 76.8 73.6
Mining and Quarrying 1.5 0.8 1.5 0.7
Manufacturing 6.9 8.1 5.7 6.4
Electricity, Water etc. 0.3 0.3 0.4 0.2
Construction 1.7 2.2 1.7 3.0
Trade, Hotel & Restaurant 4.2 4.6 4.5 7.2
Transport etc. 2.0 1.7 1.9 2.2
Services 5.9 7.6 7.6 6.8
Non-farm Sector 22.6 25.3 23.2 26.4
Sector 1983 1987/88 1993/94 1999/2000
All All All All
Agriculture & Allied 90.1 87.3 89.1 86.9
Mining and Quarrying 0.6 0.6 1.3 0.4
Manufacturing 4.0 5.0 3.4 3.8
Electricity, Water etc. 0.1 0.2 0.2 0.1
Construction 0.7 1.6 0.9 1.9
Trade, Hotel & Restaurant 1.6 2.1 1.7 2.8
Transport etc. 0.3 0.4 0.5 0.8
Services 2.7 2.8 2.9 3.3
Rural non-farm Sector 9.9 12.7 10.9 13.1
Agriculture & Allied 11.4 13.7 15.1 15.2
Mining and Quarrying 6.5 2.0 2.5 1.8
Manufacturing 22.2 23.0 17.1 17.9
Electricity, Water etc. 1.6 0.7 1.3 0.5
Construction 7.2 5.2 5.6 8.0
Trade, Hotel & Restaurant 17.8 16.5 18.4 26.3
Transport etc. 10.8 8.1 8.8 8.3
Services 22.5 30.4 31.2 22.0
Table 9: Percentage Distribution of Workers
by Industry at One Digit Level in Madhya
Pradesh, 1983 to 1999/2000
Sector 1983 1987-88 1993/94 1999/2000
Rural Rural Rural Rural
Sector 1983 1987-88 1993/94 1999/2000
Urban Urban Urban Urban

almost half of these belong to household industries, whichwould mostly be bidi rollers. Bidi rolling extends in largemeasure to Katni, Jabalpur, and Satna. The districts apart fromSagar and Damoh with a significant non-agriculture work-force (at least 25 percent) are Katni, Hoshangabad, Satna,Ujjain, Morena, Raisen, Bhind, Shahdol, Chhindwara, Vidisha,Ratlam and Chhatarpur. There is no significant regional pattern, but many of these districts have good agriculture.
A few significant zones do appear in terms ofdiversifying livelihoods, and these would be the belts of Sagar/Damoh/ Katni/ Jabalpur in central Madhya Pradesh, Gwalior/Bhind/ Morena in the north, Ratlam/ Ujjain/ Indore in thewestern Malwa plateau, and the Hoshangabad/ Bhopalbelt in the west centre of the state. All these zones have theirown characteristics, but the common elements are that theyhave zones of agriculture prosperity, proximity to a largeurban conglomeration and some industrial or industrial service based activity in them. They are also interestingly associated with specific crops or types of produce, such asMustard associated with Bhind and Morena, and soyabeanassociated with Ujjain with Ratlam also falling in the soyabeanproducing zone.
On the lower side of employment diversification fall Dindori, Jhabua, Mandla and Barwani (15 percent nonagriculture workers or less). Sixteen districts in all have nonagriculture employment less than twenty percent. Such a low diverse base for employment is a worrying situation especially for districts where agriculture potential is low.
Unemployment Estimates from unemployment come from National Sample
Surveys. These are based on assessment of people in thelabour force, i.e. they are either working or are looking forwork or are not working for reasons other than not gettingwork (such as illness, holiday, festival etc.) and those amongstthem who have not got employment. Unemployment rate isthe ratio of unemployed to labour force. Similar to work participation rates, NSS provides unemployment rates byusual status, current weekly status and current daily status.
Usual Status: The unemployment rates are relatively high inurban areas than rural areas in Madhya Pradesh (Table 11).Unemployment rates among males are higher than females inrural and urban areas, except in the drought years of 1987-88,when males must have found it more difficult to get employment as agriculture and allied sector would have driedup substantially. The unemployment rates by usual status for males indicate no growth in unemployment since 1987/88,in both rural and urban Madhya Pradesh. For females there has been a gradual decline in unemployment rates overthe same period.
Current Daily Status: As can be seen from Table 11, theunemployment rates according to CDS are higher than thoseof usual status. Except for females in urban Madhya Pradesh,the unemployment rates of males and females went up considerably between 1987/88 to 1999/2000.
Underemployment Underemployment is commonly defined as the underutilisa-tion of labour time of the workers. Some of the workers classified as usually employed do not have work throughout
89
L I V E L I H O O D S
M F M F M F M F
1983 2.1 1.4 7.5 9.0
1987-88 0.9 1.2 2.8 3.5 2.3 2.1 4.6 6.7
1993-94 0.8 0.2 2.0 1.3 2.6 2.6 5.6 5.6
1999-‘00 0.7 0.2 2.1 1.5 4.0 3.5 7.2 7.0
Urban
1983 5.9 6.9 9.2 11
1987-88 4.3 5.6 6.1 8.5 6.0 7.8 8.8 12
1993-94 5.7 4.6 5.4 8.3 7.0 5.9 6.7 10.4
1999-‘00 4.3 1.6 4.8 7.1 7.2 5.7 7.3 9.4
Usual Status Daily Status
M.P. India M.P. India
Rural
Table 11: Usual Status and Current Daily Status Unemployment Rates in M.P. and India
Note: Usual Status refers to Principal status
Source: Different rounds of NSS data.

the year due to seasonality in work or otherwise and theirlabour time is not fully utilised – they are therefore underem-ployed.
The unemployed person days for rural males in MadhyaPradesh has increased from 1.8 percent in 1993-94 to 3.2 per-cent in 1999-00 (Table 12). Similarly it increased for ruralfemales. For the females, the percentage of employed increasedsignificantly while that of ‘not in the labour force’ declinedduring the period 1993-94 and 1999-2000.
However, when we see the data given above, we will seethat un-employment rates are particularly low, and that thefigures for un-employment somehow do not ably justify orexplain the high levels of poverty persisting, whether inMadhya Pradesh or in the entire nation. Further, field studiesand the general condition of poor indicates that the poor inIndia cannot afford to remain without work for any period oftime, whatever be the remuneration they receive for theirwork. With low illiteracy and education, the poor do not haveany qualms or constraint in taking up any kind of work. Notjust these, with hardly any reserves of cash or kind, residentsof poor households cannot afford to sit a home.Unemployment and employment figures do not adequatelycover under employment or low wages and un-sustainablelivelihoods.
Apart from basic un-employment there is large scale under– utilisation of workforce that figures presented in the tableshide. Most agriculture labourers remain idle for 3-4 months ina year. Outside the agriculture season, many casual labourers getwork up to two thirds of the days at the maximum.
Quality of EmploymentFocusing on employment and unemployment fails to capturean aspect of the employment problem, which is extremelyimportant, and this relates to what may be called the quality ofemployment. Income or wages is one of the variables reflect-ing quality. Many people are employed but they get low wagesand income. That is why there is so much gap between unem-ployment (based on time criterion) and poverty and we have
many numbers of ‘working poor’. In this section, we examinechanges in variables representing quality of employment suchas casualisation, labour productivity, real wages and, povertyby sectors.
Casualisation of Labour: The proportion of self-employ-ment has been declining over time (Table 13). One of the rea-sons is the decline in farmers cultivating their own land owingto fragmentation of holdings. There has been sharp increase incasual labour, to the extent of 12 percent as a percentage of allworkers. In recent years, the percentage of casual labourers hasbecome marginally more than the same for all India. As shownin Table 14, the percentage of casual labour increased for bothmales and females.
Labour ProductivityGross state domestic product (GSDP) at constant prices perNSS worker – provides one meaningful absolute measure ofemployment quality. As per NSS, worker productivity ofMadhya Pradesh and India is provided in Table 15. Labourproductivity in agriculture remained more or less stagnantbetween 1983 and 1993/94, before rising somewhat in 1999-2000. In construction there was a significant decline over thisperiod, especially in 1999-2000. On the other hand, manufac-turing sector recorded significant increase continuously since1983 – and more than doubling to 1999-2000. Transport wasanother sector where per worker productivity rose to twice itsvalue between 1983 and 1999-2000.
L I V E L I H O O D S
90
Source: NSS Rounds
1987-88 25.5 31.0 31.4 35.5
1993-94 31.7 37.6 33.8 38.7
1999-2000 37.1 44.1 36.2 39.6
Year M.P. All India
Males Females Males Females
Table 14: Percentage of Casual Labour in
Rural Areas for Males and Females
Source: NSS Rounds
Employed 926 917 672 703
Unemployed 18 32 17 24
Not in labour force 56 52 311 273
Total 1000 1001 1000 1000
Current daily status Males Females
1993-94 1999-2000 1993-94 1999-2000
Table 12: Underemployment: Per 1000
Distribution of Person-Days of Usually
Employed (Principal and Subsidiary) by
their Current Daily Status in Rural M.P
Source: NSS Rounds
1987-88 64.9 7.3 27.8 59.4 7.7 32.9
1993-94 61.9 4.0 34.1 58.0 6.4 35.6
1999-2000 56.6 3.5 39.9 55.8 6.8 37.4
Year Rural M. P. Rural All India
Self Regular Casual Self Regular Casual Employed Employed Labourers Employed Employed Labourers
Table 13: Distribution of Usually Employed
by Category of Employment

A comparison with All India upto 1993-94 shows that thelevels of labour productivity in Madhya Pradesh inAgriculture, Construction, and Services were higher for allIndia. The near stagnant or declining per worker output in agriculture and construction points to the crisis ofproductivity and the urgent need to take people out ofthese sectors into manufacturing, transport, services, and eventrading activities.
A more recent estimate on per worker output or worker productivity and per annum of growth rates ofproductivity are given in Tables 16a and 16b below (based on GDP at constant 1993/94 prices). These estimates show that manufacturing and services recorded the best per
annum increase. On the other hand agriculture was in fact inthe negative.
Real WagesTrend in real wages is an important indicator of changes inlivelihoods. Table 17 indicates that real wages increased in thelater half of the 1980s, but growth rate was very low in the1990s. The trend rate of growth for males declined from4.55% in the 1980s to 0.071% in the 1990s. If we look at thereal wages numbers in this decade, wages have stagnated.Growing rural wages in real terms was one of the key deter-minants of poverty reduction in India in the 1980s. The trendin wages in last decade is therefore worrying. It is also not clear
91
L I V E L I H O O D S
Source: For Madhya Pradesh calculated by MPHDR Team from NSS (Various Volumes) and Economic Survey Government of Madhya Pradesh (Various Volumes)
and Figures for India from Bhalla (2000), Bhalla (2001)
1983 2306 6955 8261 7439 7619 7881
1987-88 2184 5716 8631 7049 10073 8540
1993-94 2387 7163 9142 12813 11300 10218
1999-2000 2571 5168 14093 15527 14520 8115
Average of 16 states GSDP per person
1983 2491.65 9450.89 9196.60 7529.89 8761.21 8210.72
1987-88 2532.92 8160.88 10714.26 8453.60 10005.86 8359.71
1993-94 2870.87 9139.12 12326.58 10800.23 11468.26 9678.27
M. P. (GSDP per person)
Year Agriculture Construction Services Manufacturing Transport Trade
Table 15: Labour Productivity (GSDP per UPSS worker) in Different Sectors
(Rs. At Constant 1980-81 Prices) in M.P. and All India
Agriculture, Forestry, Fishing 12,226 11,920 11,783 12,119 11,340 12,039 11,966 11,893
Mining and quarrying 164,913 156,971 166,631 173,079 173,376 174,856 176,664 178,490
Unregistered manufacturing 53,319 61,368 63,879 70,881 72,811 76,806 81,611 86,717
Registered manufacturing 49,613 55,350 58,246 60,297 64,038 69,157 73,086 77,237
Electricity, Gas and water supply 410,532 416,537 460,133 453,296 455,649 463,876 471,211 478,661
Construction 49,871 46,854 51,262 49,713 48,161 49,330 48,867 48,408
Trades, hotels, etc 51,938 50,438 50,425 52,672 50,872 49,142 48,256 47,386
Transport, storage and communications 74,890 77,322 80,810 84,314 87,657 90,071 92,325 94,635
Finance, insurance, Real estate & business services 388,092 400,503 429,745 460,271 483,253 505,702 527,106 549,415
Community, social & personal services 33,949 34,512 36,722 40,299 40,378 44,022 45,904 47,866
Average 25,093 25,269 26,027 27,105 26,764 27,918 28,339 28,774
Industry 1993-94 1994-95 1995-96 1996-97 1997-98 1998-99 1999-2000 2000-01
Table 16a: Output per Worker in Madhya Pradesh (at GSDP at constant 1993/94 prices)

why the increase in real wages are not commensurate with thatof labour productivity.
The non-agricultural worker productivity and output perworker is higher than those for agriculture. It indicates thatdiversification to non-agriculture may be due to pull factorrather than push factor.
STRATEGIC OPTIONS
ChallengeThe above facts on macro scenario shows that the immediatechallenge is to diversify the activities which include shiftingthe workers to non-agriculture sector to improve the liveli-hoods of poor workers. It may be noted that agriculturalgrowth would not be sufficient to absorb the growing labour force. As shown above, In India as well as in MadhyaPradesh, unemployment rates are not high. The rates arearound three to five per cent in MP. This is because unemployment rates are based on time criterion. Poor people are too poor to be unemployed for a long time. Wehave the concept of “working poor”. In other words many people are working at low wages, low working conditions inagriculture and informal sector. Therefore, the challenge is to shift these workers to high productivity sectors and also create new jobs in the non-agriculture sector. Thus, the realnature of the unemployment problem is not that people arenot ‘employed’ in some activity but that large number ofthose classified as employed are engaged in low qualityemployment, which does not provide adequate income tokeep a family above the poverty line. Besides, the employment
L I V E L I H O O D S
92
Source: Various Volumes of Economic Survey, Government of Madhya Pradesh, and Sundaram (2001)
Agriculture, Forestry, Fishing -2.50% -1.15% 2.85% -6.43% 6.17% -0.61% -0.61% -0.33%
Mining and quarrying -4.82% 6.15% 3.87% 0.17% 0.85% 1.03% 1.03% 1.19%
Unregistered manufacturing 15.10% 4.09% 10.96% 2.72% 5.49% 6.26% 6.26% 7.27%
Registered manufacturing 11.56% 5.23% 3.52% 6.20% 7.99% 5.68% 5.68% 6.55%
Electricity, Gas and water supply 1.46% 10.47% -1.49% 0.52% 1.81% 1.58% 1.58% 2.28%
Construction -6.05% 9.41% -3.02% -3.12% 2.43% -0.94% -0.94% -0.32%
Trades, hotels, etc -2.89% -0.03% 4.46% -3.42% -3.40% -1.80% -1.80% -1.27%
Transport, storage and communications 3.25% 4.51% 4.34% 3.97% 2.75% 2.50% 2.50% 3.40%
Finance, insurance, Real estate & business services 3.20% 7.30% 7.10% 4.99% 4.65% 4.23% 4.23% 5.10%
Community, social & personal services 1.66% 6.40% 9.74% 0.20% 9.02% 4.27% 4.27% 5.08%
Total 0.70% 3.00% 4.14% -1.26% 4.31% 1.51% 1.53% 1.99%
Industry 1994-95 1995-96 1996-97 1997-98 1998-99 1999-2000 2000-01 Average
Increase
Table 16 b: Worker Productivity Increase per annum in Madhya Pradesh
(at GSDP at Constant 1993/94 Prices)
Note: Real wages are obtained by deflating the money wages with Consumer
Price Index for agricultural labourers.
Source: Calculations by Project Team on data from Various Volumes of the
Statistical Abstract, and Economic Surveys, Directorate of Economic and
Statistics, Government of Madhya Pradesh
1985-86 9.61 9.61
1986-87 10.30 9.88
1987-88 11.15 n.a
1988-89 12.45 n.a
1989-90 14.44 11.77
1990-91 17.12 12.01
1991-92 19.31 11.44
1992-93 23.33 13.96
1993-94 24.41 12.86
1994-95 26.51 12.49
1995-96 29.25 11.27
1996-97 32.13 11.67
1997-98 35.39 11.66
1998-99 38.66 12.08
Growth rate 1981-1990 12.232% 4.552%1990-1998 10.721% 0.071%
Year Nominal Wages (males) Real Wages (males)
Table 17: Nominal and Real Wages of Field
Labour in Agriculture

opportunities available in the market too often do not come up to expectations of the new and increasingly educated entrants to the labour force. The employment strategy we need therefore is not a strategy, which ensures anadequate growth in the volume of employment but one, whichensures a sufficient growth in high quality of employmentopportunities.
Around 94 per cent of the Madhya Pradesh workers are inthe unorganised sector. Therefore policies have to take intoaccount the unorganised sector. The options will also have todeal with equity and reduce the gap between per worker outputs, and wages amongst different sectors and ensure thatsectors employing larger numbers provide better incomes.
Projections and Strategic Options3
In order to have macro strategies, we need to know the likelyscenario of employment, investments needed in future.Therefore, we have made projections in Table 18 for the workers and investments in the five-year period and 20 yearperiod. Also, five scenarios of projections were made in orderto know the impact of investments in different sectors onpoverty and inequality. The procedure followed for projec-tions are the following.
● Using employment data of Census 1981 and 1991 for 10NIC (National Industrial Classification) categories (onedigit level) and State Domestic Product (SDP) data, wecomputed the Compound Annual Growth Rate (CAGR)of output per worker
● Based on this, we projected employment and output ineach category for 2005 to 2020
● The employment and output along with the IncrementalCapital Output Ratio (ICOR) was used to estimate theinvestments needed and the CAGR of SDP for 2005 to2020
The following assumptions were made regarding ICOR● In general, productivity enhancement has been assumed
to be coincidental with increase in ICOR● Accordingly, ICORs have been increased where they were
low● However, ICORs have been reduced where efficiency
gains are likely to set in due to private ownership,competition etc.The projections show that employment would increase
from 29.6 million in 2001 to 44 million in 2020 i.e. by 14 mil-lions. If we add the 3.7 million backlog of unemployed and
93
L I V E L I H O O D S
3 This sub-section is based on Mahendra Dev and Mahajan (2000)
Agriculture, Forestry, Fishing 15.66 16.00 16.35 16.70 17.06 17.43 17.81 18.20
Mining and Quarrying 0.16 0.16 0.16 0.16 0.16 0.16 0.16 0.15
Unregistered Manufacturing 0.52 0.52 0.53 0.53 0.53 0.53 0.53 0.53
Registered Manufacturing 0.97 0.98 0.98 0.98 0.98 0.98 0.98 0.98
Electricity, Gas and Water Supply 0.06 0.06 0.06 0.06 0.07 0.07 0.07 0.07
Construction 0.54 0.56 0.59 0.62 0.65 0.68 0.71 0.74
Trades, Hotels, etc 1.20 1.27 1.34 1.41 1.49 1.57 1.66 1.75
Transport, Storage and Communications 0.41 0.43 0.44 0.46 0.47 0.49 0.51 0.53
Finance, Insurance, Real Estate & Business Services 0.11 0.11 0.11 0.11 0.12 0.12 0.12 0.12
Community, Social & Personal Services 1.39 1.40 1.41 1.42 1.43 1.45 1.46 1.47
Total 21.02 21.49 21.96 22.45 22.95 23.47 24.00 24.55
Projections
Population 1981 1991 2001 2005 2010 2015 2020
Population, actual and projected 48.56 60.38 69.0 78.4 88.7 99.9
Growth rate per annum projected for next five years 2.70% 2.60% 2.50% 2.40%
WPR % 50% 49% 48% 46% 45% 44%
Workforce (in millions) 24.3 29.6 33.1 36.1 39.9 44.0
Industry 1993-94 1994-95 1995-96 1996-97 1997-98 1998-99 1999-2000 2000-01
Table 18: Projections of Workforce (in millions) in Madhya Pradesh

severely under employed in 2000, labour force increase by2020 would be 18 million. These numbers in a sense sum upthe employment problem for the state in the comingdecades.
Apart from the workforce numbers, we also need to con-sider the Incremental Capital Output Ratio in the state in thisdecade for our projections and evolving strategic options (see Table 19a and 19b).
Employment Strategies: Five OptionsNext question is to examine the strategic options, whichwould give an idea of the likely impact on employment, pover-ty and inequality. Projections have been made for ten majoreconomic sectors covering agriculture, manufacturing andservices, for Growth in Output (Value Added), Livelihoods(Employment) and the impact on income disparity (betweenagricultural workers and average worker). It has been assumedthat in the selected sectors, investment will also lead toincrease in productivity and reduction in Incremental CapitalOutput Ratio. The projections of impact of investments onemployment, workforce productivity, income disparitiesbetween agriculture wages and other wages would ensure thatstrategic choices lead to best input to output ratio for investments to employment, meanwhile ensuring sustainablelivelihoods and better equity.
Growth requires investments, and to build projections,investment scenarios have been worked out. Projections weremade for investments in Natural Resources or NR (Land,water, forests, and livestock), in Infrastructure or IF (power,roads, warehouses, market yards, telecom etc.), HumanResource development services or HR (nutrition, health, edu-cation, vocational training), and Institutional Developmentservices or ID (financial services, public administration, law
and order, local government). Total investment were workedout in the range of Rs 10,000 crore per year (10-15% morethan 2000-01 estimates).
The following are the four options discussed.● Status Quo: No change from 1981-91 trends and this is
termed as Base in the tables below.● Agriculture, and allied (NR) and services (HR) sectors
productivity has been enhanced, as also employment inthe latter two sectors. Here also we are assuming thatthere is no increase in agricultural employment.
● Infrastructure Services (IF) and Institutional develop-ment (ID), where infrastructure includes Electricity, Gasand Water and Transport and Communications andInstitutional Development includes Financial andBusiness services.
● Agriculture, and allied, services, Infrastructure servicesand Institutional development, where in the service sec-tors productivity and employment has been significantlyenhancedIn these five options we make assumptions on invest-
ments, and corresponding growth rates in incomes, employ-ment, sector change in employment etc.
Findings Our estimates of the key indicators of different strategic optionsfor employment generation are presented in the table below.
The results of projections and their impact based on the investments mentioned in Table 20 are shown in Table 21.
The projections have been made up to the year 2020. Thedetailed results of these investments are presented in earliertables. The best scenario is enhanced investment in NR+HR.This will lead to highest employment, with moderate GSDP
L I V E L I H O O D S
94
Agriculture, Forestry, Fishing -10.75 4.35 0.88 -0.92 0.55 2.83 2.86 1.76
Mining and Quarrying -6.17 5.94 9.70 -229.42 62.37 48.25 49.79 7.82
Unregistered manufacturing 0.45 1.53 0.60 2.27 1.19 1.05 1.04 1.16
Registered manufacturing 2.53 5.35 8.29 5.01 3.98 5.70 5.94 5.26
Electricity, Gas and Water Supply 13.46 4.33 41.23 16.39 11.93 12.44 12.38 11.49
Construction -2.82 0.38 3.33 3.57 0.74 1.41 1.43 1.81
Trades, Hotels, etc 1.02 0.49 0.29 1.43 1.42 0.79 0.81 0.89
Transport, Storage and Communications 4.48 3.77 3.76 3.93 4.62 4.77 4.73 4.30
Finance, Insurance, Real Estate & Business Services 2.23 1.18 1.15 1.45 1.50 1.55 1.51 1.51
Community, Social & Personal Services 2.96 1.04 0.68 6.13 0.73 1.32 1.30 2.02
Total 4.36 2.48 2.04 13.57 2.04 3.53 3.56 4.51
Industry 1994-95 1995-96 1996-97 1997-98 1998-99 1999-2000 2000-01 Avg. ICOR
Table 19a: Incremental Capital Output Ratio in Madhya Pradesh, 1993-94

growth and least income disparity. Investments in Agricultureand allied and Services option seems to be the most desirablefrom the point of view of increasing employment, whilereducing poverty and income disparity significantly
The second best scenario is enhanced investment inNR+HR+IF+ID. This leads to High employment with highestGSDP growth and moderate income disparity. This optionincluding all sectors is better in terms of employment created,but requires more investment and does not reduce income
disparity as muchThe scenario of enhanced investment in IF+ID will lead
to moderate employment generation, with moderate GSDPgrowth and higher income disparity. The result of investmentin industry generates lowest employment, with highest GSDPgrowth and highest income disparity.
Putting the strategic options in a box, the matrix in Table21 exhibits the projected positive impact on different groupsby investing in different sectors.
95
L I V E L I H O O D S
Agriculture, Forestry, Fishing -1.41 -0.80 -2.05 -1.60 4.19 0.01 -0.27
Mining and Quarrying -1.96 0.63 -24.66 -1.27 -0.23 0.03 -4.58
Unregistered manufacturing 2.40 -0.61 2.79 -0.48 -0.12 0.00 0.66
Registered manufacturing 1.12 0.55 -0.40 -0.20 0.43 0.04 0.26
Electricity, Gas and Water Supply -0.68 8.52 -0.60 -0.27 0.04 -0.01 1.17
Construction -1.13 7.83 0.07 -0.79 0.91 0.01 1.15
Trades, Hotels, etc -0.52 -0.40 3.92 -0.01 -0.44 0.02 0.43
Transport, Storage and Communications -0.16 0.00 0.05 0.18 0.03 -0.01 0.01
Finance, Insurance, Real Estate & Business Services -0.47 -0.03 0.26 0.03 0.04 -0.03 -0.03
Community, Social & Personal Services -0.65 -0.35 8.02 -0.88 0.81 -0.02 1.16
Total -0.43 -0.18 5.64 -0.85 0.73 0.01 0.82
Industry 1995-96 1996-97 1997-98 1998-99 1999-2000 2000-01 Avg. ICOR Growth rate
Table 19b: Annual Rate of Change in ICOR in Madhya Pradesh
Agriculture, Allied and Forestry NR 2.5% 5.0% 4.0% 4.0% 3.0%
Commerce and Services HR 3.5% 7.0% 6.0% 5.0% 5.0%
Electricity Gas and Water IF 3.9% 7.8% 7.8% 6.0% 6.0%
Transport and Communications IF 5.5% 8.0% 8.0% 6.0% 6.0%
Financial and Business Services ID 3.1% 5.0% 5.0% 3.0% 3.0%
Average annual investment in five year period in Rs crores Base 11061 13249 15991 19454
Average annual investment in five year period in Rs crores NR+HR 11194 13496 16355 19913
Average annual investment in five year period in Rs crores IF+ID 11471 14229 17429 21468
Average annual investment in five year period in Rs crores NR+HR+IF+ID 11604 14475 17713 21748
CAGR of productivity and CARR of ICOR as proportion of CAGR of GFCF in that five year period is shown below
Policy scenario → HR ID
GFCF CAGR to ICOR, CARR factor 0.20 0.20
GFCF CAGR to Productivity, CAGR factor 0.40 0.10
CAGR of GFCF in the five year period 1993-2000 2001-05 2006-10 2010-15 2016-2020
Table 20: Projections of Investments and Compound Annual Growth Rate (CAGR)
of Output per Worker
GFCF - Gross Fixed Capital Formation, CAGR - Compound Annual Growth Rate, CARR -Compound annual reduction rate, ICOR - Incremental Capital Output Ratio

CONSTRAINTS, POLICIES AND RECOMMENDATIONS
In this previous section we have discussed that public sectorcannot generate jobs and the future employment has to becreated in organised and unorganised private sector.Government should act as a facilitator to increase private sec-tor investment, which in turn increases employment. In thissection, we will discuss about constraints for private sectorparticipation and suggest recommendations for promotion ofemployment in different sectors of Madhya Pradesh.
Livelihoods in Madhya Pradesh are very largely dependanton agriculture, or are forest based or lie in the urban un-organ-ised sector. It must also be mentioned here that livelihoods, orlivelihood sectors no longer exist purely in primarily rural andurban divisions, but extend from the one to the other. There isno strict rural or urban livelihood region or sector.
Within the wide range of livelihoods, there are those thatexist at subsistence levels. The vulnerable groups amongstthose employed are the landless labourers, and the marginalfarmers, the tribals, the urban unskilled labourer, and women,
both in the rural and in the urban areas.Trends show that as a rounded figure, approximately ten
lakh persons would be entering the workforce every year overthe next two decades. The challenge for livelihoods promotionover the next twenty years is to ensure productive livelihoodsfor this number, as also for the existing 25 million workers andthe five million unemployed. This requires a job-led growth ofthe economy, which in turn needs a specific investment pat-tern in different sectors.
Changes are required in the pattern of livelihoods in thestate. Livelihoods need to be moved from primary sector tosecondary and tertiary sectors. The change in employmentpattern needs to be substantial enough to reduce workforce inagriculture from over 80% to 40% by 2020. So a large numberof workforce would need to move out of agriculture toManufacturing, Construction and Infrastructure, but prima-rily and substantially to Services. Not just this, even withinagriculture, diversification is needed, from crop cultivation tohorticulture, dairy, poultry, fishery and forest-based, and
L I V E L I H O O D S
96
Unemployment 2005 in millions 5.20 4.84 5.17 4.80
Unemployment 2010 in millions 4.41 3.36 4.31 3.26
Unemployment 2015 in millions 4.04 1.90 3.86 1.72
Unemployment 2020 in millions 3.28 -0.28 3.02 -0.41
GSDP growth 2005 4.27% 4.42% 4.45% 4.60%
GSDP growth 2010 4.09% 4.30% 4.41% 4.61%
GSDP growth 2015 3.96% 4.20% 4.35% 4.53%
GSDP growth 2020 3.89% 4.12% 4.25% 4.37%
Disparity ratio 2005 2.67 2.65 2.69 2.67
Disparity ratio 2010 2.92 2.88 2.98 2.94
Disparity ratio 2015 3.18 3.09 3.30 3.20
Disparity ratio 2020 3.45 3.31 3.64 3.47
Scenario → Base NR+HR IF+ID NR+HR+IF+ID
Table 21: Impact of Investments and Growth in Different Options on Key indicators
GFCF-Gross Fixed Capital Formation, CAGR-Compound Annual Growth Rate, CARR-Compound Annual Reduction Rate, ICOR-Incremental Capital Output Ratio
Landless High Medium Low Medium
Tribals High Medium Low Medium
Urban unskilled Low High Medium Medium
Women Medium High Medium Medium
Invest in ↓ NR HR IF ID
Groups →

already there are trends towards this. Further, there is anurgent need to increase productivity and wages.
This kind of change will require policy and institutionalchanges, and re-focussing and re-prioritising of investmentsand programme specifics.
Market Failure and Other ConstraintsMarket failure and other constraints prevent active privatesector participation in promising sub-sectors. This in turn hasa negative impact on employment. The direct control of andaccess to natural resources such as land, water and forests, aswell on infrastructure such as power and roads, by theGovernment has restricted action by private sector and civilsociety institutions. Some examples of market failure andother constraints are given below.
Labour Market Failure: A large amount of seasonal unem-ployment in south central and south eastern districts co-existswith shortage of agricultural labour in the Malwa districts andin urban manual activities. The abundance of labour inMandla migrates to depress agriculture wages even duringpeak demand season in agriculturally prosperousNarsinghpur, whereas in northern Malwa, competition fromneighbouring districts and Kota in Rajasthan keeps agricul-ture wages comparatively higher all through the year.
The “shortage” of adequate labour, which is to say labourwith required training or experience is also missing in manysectors. In some place this has also led to construction con-tractors to go in for mechanical equipment for digging, earth-work, road laying, and so on. The problem is even more severewhen one moves up slightly the skill ladder, such as for car-penters, masons, plumbers and electricians.
There is an absence of mechanisms for moving workersout of sub-sectors where demand is declining, such as bidirolling or handlooms, into those sub-sectors where demand isincreasing, such as construction, repairs and small engineer-ing. This failure in the labour market can partly be explainedby the lack of information, inadequate rural-urban trans-portation linkages and inadequate difference in wage rates tocompensate for the risk of migration.
Natural Resource Regime: The forest laws and managementregime has kept people away from forests. This regime is inplace although the economic exploitation of forests, bothwood and non-wood produce, is directly based on people,especially those who traditionally and today work in forestsand survive very substantially on forest, both as consumers offorest produce and as collectors of forest produce and workersin forests. The forest laws have kept people away from anydirect control or any form of ownership or community
partnership in preservation and sustainable exploitation ofthe vast wealth of the forests of Madhya Pradesh. The con-flicting interface between forest dependent population and theforest laws has had negative impact on livelihoods of a verylarge number of people in the state.
In the last decade there has been considerable work ininvolving people in managing forests through the joint forestmanagement programme, and innovative strategies throughthe Lok Vaniki Programme, and efforts to promote bamboocultivation etc.
Credit Market Failure: There is a huge unmet demand forcredit. As per the State focus Paper of NABARD, the potentialplans prepared by NABARD for the undivided MadhyaPradesh was estimated to be Rs 19,969 crores for the period1997/98 to 2001/02, compared to Rs 6,978/- actually disbursed.The actual “ground level credit flow” according to NABARDfor the new Madhya Pradesh during 1999/2000 was only 75percent of what has been estimated as potential in rural MP. Atthe same time, there is no constraint of funds, as is obviousfrom the Credit deposit ratio of the state at 57.8 percent inMarch 20004. In fact the credit deposit ratio in MadhyaPradesh has been declining over the years. The average creditper hectare of area cropped in Madhya Pradesh for the year1999/2000 was just below Rs 560/-. This shows the fairly lowagriculture credit dispersed in the state. There is a huge net-work of banks, even in rural areas, with 2842 rural branches.There are even targets and priority sector lending obligations.
Yet, the availability of credit, both for fixed asset purchas-es and for working capital, have been a problem area both interms of access and transaction costs. Due to the inadequacyof loan amount, time delay and excessive paper work in get-ting a loan from formal institutions, a majority of the produc-ers rely on informal channels, such as traders for working cap-ital. The SHG movement in the state testifies the extent towhich the poor face credit constraints and the extent to whichthey are willing to invest their time in having access to flexibleand friendly credit sources.
Apart from credit market failure, the newer rural sub-sec-tors fail to attract private investment as the private sector seeksopportunities with an assured return considerably higher thanthe bank interest rates. If the return is higher but perceivedrisk is also higher, then private sector hesitates from investing.Thus an attempt needs to be made to reduce risk perceptionthrough information sharing and appropriate regulatoryframeworks. For example, investments in the forestry sectorwill not come as long as restrictions on felling and transportof timber are not rationalised.
Commodity/Product Market Failure: Lack of information
97
L I V E L I H O O D S
4. Lower credit-deposit ratio indicates not necessarily ‘surplus’ but utilisation of funds elsewhere. In general, credit-deposit ratio for rural areas in the country is lower than for
urban areas indicating that rural areas are net savers whereas urban areas are net investors.

about new market opportunities has restricted the participa-tion of the private sector or constrained micro-entrepreneursto continue catering to declining market segments. The exam-ple of soybean illustrates this the most. While there is a com-petitive squeeze in the edible oil market due to cheap palm oilimports, the market for protein focussed soybean productmarkets has remained untapped. No one has responded tothis. This is due to lack of information on new market segments.
Similarly while there is a large market, especially exportmarket, for the durram variety of wheat variety grown inMadhya Pradesh (due to high protein content), no marketingarrangements have come about to take advantage of specificdemand for this type of wheat.
Generally the role of middlemen in marketing is criticisedas they siphon off a major share of the value added. However,the positive role of “middlemen” has to be recognised in mar-keting products that are produced by the unorganised sector.It includes their role in identifying the market demand pat-tern, transportation and taking risk of the product damageand price changes in between transporting it from the pro-ducer to market. In several cases, members of Self HelpGroups find it difficult to market their products. They couldactually benefit by dealing with competitive middlemen. Themove by State Government to bring in private sector involve-ment in selling produce of self-help groups indicates a changein the marketing arrangements and could pave the way for aneffective marketing intervention.
Infrastructure Constraints: In terms of infrastructure, thestate of Madhya Pradesh has been lagging far behind. Theindex of social and economic infrastructure constructed bythe report of the Eleventh Finance Commission placesMadhya Pradesh at eighteen out of twenty five states in thecountry.
Two sectors where the state has had problems are roadsand power. The states power situation has suffered due to thebifurcation of the state, with many of the power units goingoff to Chhattisgarh. Lack of power in rural areas is a constraintfor agriculture as well as some of the rural non-farm sub sectors. Any of the medium sized non-farm units require electricity, such as small lathe machines, small wood units,large pottery units, handloom weavers so that they can weave late in the night using electric light. Power is also necessary for any unit expanding from a household enterpriseto employing 4-5 people or attempting to increase productivity. Lack of adequate and sustained power has alsoaffected agriculture operations in the last two years due todrought conditions in the state. The recent reforms in thestate, charging power supply to rural areas, attempts tostreamline distribution and enhance production would cer-tainly reduce uncertainties and shortfalls in power within thenext year or two at the maximum.
The road network of Madhya Pradesh is also not up to themark. The large land mass coupled with low population den-sity makes it difficult to get good road connectivity. This prob-lem is compounded by the large black cotton soil area wheremaintenance and upkeep of roads is a challenge, and theundulating and hilly terrains where new roads and their main-tenance are difficult and expensive. Recent efforts where pri-vate sector has already been partnered in about a dozen majorroads in the state for construction and maintenance, theefforts in rural connectivity through the state governmentsown efforts from mandi cess levied for better rural transportshould help the rural road connectivity in the state. This willbe further assisted by the roads being built under the PrimeMinisters Gram Sadak Yojana. Road connectivity has verydirect benefits such as marketability, push to the transport andrural tourism sectors, local horticulture production, etc.
The telecommunication network in the state has alsobeen lagging far behind national achievements. However thelast few years have changed the situation in Madhya Pradesh.The public sector provider BSNL along with private sectortelecom providers have given the state a very good networkedsystem, and the state can not only boast of being the first state to have private telephony, but also the largest fibre opticnetwork in India.
The lack of training and infrastructure is also felt inalmost all sectors, especially in rural non-farm sub sectors.There are funds and provisions available for these under vari-ous schemes, and the state government has been utilising thefunds so available (eg. all funds for training in SGSY are beingfully utilised), there is need for more participation. Trainingcannot be handled by government alone and private sectorinvolvement is essential.
Policy Suggestions and RecommendationsThe Government has to act as a facilitator and createfavourable conditions for private sector participation andidentify and prioritise key sectors with employment potentialand ensure successful implementation. The state has alreadyventured on three sets of initiatives in the state directed at pro-moting livelihoods. One initiative is the set of strategiesemployed at creating conditions for increasing productivity ofassets and enhancing the productive potential of people andtheir productive assets, such as the watershed mission andJoint Forest management. The other initiative has been twomajor programmes, one the Indira Gandhi Garibi HataoPariyojana that covers fourteen of the states poorest districts,and another that is on the anvil is Rural Livelihoods Project inseventeen districts. Both these programmes together couldprovide a platform for sustained and co-ordinated action onlivelihoods.
The third set of initiatives is in the realm of policy and legalframework for livelihoods. The state has embarked upon bring-ing in changes in the land and natural resource (especially
L I V E L I H O O D S
98

water) management and use regime through a proposed legis-lation that attempts to ensure equity in the use and exploitationof such resources. Simultaneously there is also an attemptthrough advocacy to change certain provisions of national for-est acts to give greater community control and participation inmanaging and using forests. These legal efforts will undoubted-ly have a substantial impact on peoples’ livelihoods. Relatedwith the legal framework, are efforts at the policy level.
The state government has just released the EconomicDevelopment Policy of the State, which takes a look at and cov-ers the entire spectrum of economic activities from agricultureto manufacturing, from energy to roads, from social sectordevelopment to bio-technology. It provides a comprehensivepicture of where the state would like to go, and also commentson what should be the nature and thrust of private – publicpartnership, and the role of state and its supporting agencies.
Towards promoting livelihoods, the involvement of thestate government, and through its direct and indirect incen-tives, private institutions and private organisations also haveto play their part.
The role of the government should be to mainly invest in ● natural resource development (land, water, livestock,
forests)● human development (nutrition, health, education,
vocational training)
● Government should attract investment in but not directly invest in infrastructure, industry, constructionand trade sectors.A major responsibility of the government will also be to
improve productivity of capital through institutional develop-ment services. The investments of government both financialand institutional building on such services as law and order,loan recoveries (strengthening Debt Recovery Tribunals), con-tract enforcement, regulation of markets etc. These will have asignal impact on investments.
In micro strategies, the issue is of where should invest-ment be attracted and undertaken. Some important principlesto be kept in mind are will not to spread everywhere, but selectand invest in clusters. Small towns are important engines ofrural growth – so there infrastructure, and markets are impor-tant. There should focus on one or two small towns other thanthe district Head quarter in each district, making up around100 growth clusters for Madhya Pradesh.
Based on the strengths of different employment sub-sectors, and current trends hundred growth engines have been identified for Madhya Pradesh. There are thirty inNatural resources, thirty in rural and urban small industries,twenty in rural and urban small Infrastructure, and twenty inrural and urban Services. The reasons for selecting a largenumber are to ensure full-employment and ensure regional
99
L I V E L I H O O D S
The promotion experience of soyabean in Madhya Pradesh is one of the
major success stories of government led promotion. The soybean sector
changed the lives of more than 30 lakh farmers, who shifted from Kharif fal-
low, Minor Millets and Cotton to Soybean Cultivation. But the impact was
not just on farmers, but it also affected 40 lakh farm labourer, about 50
thousand are involved in loading-unloading, 10 thousand involved in trans-
portation, 6 thousand involved in 60 odd processing units, and many more
in related and support industries, such as production and distribution of
Seed, Rhizobium, Fertiliser, Gunnybags, Transport Support, and Dhabas.
What went into making this happen? This was a concerted co-ordi-
nated programme launched through the National Oilseeds Development
Programme following the commitment of Government of India to become
self-sufficient in edible oils. There was focussed research of oilseeds, and
simultaneously in Madhya Pradesh the Tawa dam project went into action,
bringing large areas under perennial and assured irrigation.
The state played its role and
● Established a Co-operative Network
● Created Processing Facilities
● Created Warehousing Facilities
● Ensured that No Barriers were Imposed on movement of goods
What went wrong:
● Failed to enter the human grade protein market effectively.
● Could not compete with Oil from Malaysia
● Productivity stagnated around a Tonne-a-Hectare
What could be the way ahead:
● Enhance productivity of soybean
● Farmer is looking for a return per acre of land and not return per
tonne
● Even if we can push productivity to about half of world average pro-
duction, return for farmers would double
● But the market may induce shrinkage in area under soybean
What do we have:
● We have the agro-climatic condition: soil, rainfall, temperature, sun-
shine
● We have infrastructure facilities to serve such a large area base
● We have 30 lakh farmers in commercial cultivation
● We have a forward looking state administration looking for solutions
Possibly we can look at:
● Organic cultivation of crops, such as cotton, as
■ There is experience of cotton cultivation
■ Agro-climatically suitable
■ With rejection of synthetic fabric, cotton is coming back
■ MP conditions are suitable for eco-friendly production: Maikal
Experience
● Look for other similar commodity subsectors where we have a com-
petitive advantage
Government Led Promotion of the Soyabean Sector

coverage. The 100 growth engines and 100 growth clustersgive a livelihood promotion strategy. It is a “guide to action”for development agencies. In practice, any district would have3-5 growth engines and each engine would be spread over 5-7 districts.
A list of the possible growth engines for Madhya Pradeshare listed below.
Natural Resource Based Growth Engines● For the landless and marginal farmers - concentrate on
Soyabean and Mustard, Cotton, Wheat and Paddy, Pulsesand Jowar, Fruits and Vegetables, Spices, cultivatedmedicinal and aromatic plants, and repair of agro equip-ment such as tractors, sprayers, and pumpsets.
● For tribals — natural resource based opportunities lie in NTFPs (tendu, mahua, amla, harra), gathered medicinal and aromatic plants, bamboo and grasses,timber (CP Teak and others), eco-tourism based liveli-hoods, and natural resource based handicrafts (wood,bamboo, metal).A list of the possible Human resource development based
growth engines would be - ● For the landless and marginal farmers - primary and
elementary education, and vocational skills● For tribals, this would mean investing in natural resource
conservation skills and eco-tourism guides● For women, it will require investing in agricultural skills
and livestock rearing skillsThe possible growth engines for urban and unskilled
would be in repairs and recycling services. These options alsomean investing in conserving capital, the environment andgenerating jobs for the poor.● In Repairs, the potential lie in repairs of vehicles (which
are growing at geometric rates). electrical equipment,electronic goods, and buildings
● Recycling of organic solid waste, paper, cloth, glass, met-als, and linking these with. Power generation possible.The promotion efforts for livelihoods would require specific and focussed intervention. These will involve -
● Selection of those growth engines for focused interven-tion which affect thousands of people e.g. soyabean,dairy, NTFP, power.
● Get professional agencies to draw up plans and imple-ment. This does not call for report writing, but agenciesinvolved in livelihood promotion and action.
● Select clusters for pilot intervention in each growth engine● Appoint agencies in-charge and empower them, monitor
them, incentivise them● Review every six months and scale up to more locations
and more growth engines Livelihood promotion is a complex task, and needs “col-
laborative polygons”. It means that different types of agencies,people and action is required. The State Government has tobe a leader in this field, but not the sole or dominant agency.
The role of the State Government is to ensure participationby all concerned organisations and people, and see to it thatrequired initiatives are in place. Government must get intopublic-private partnerships – with corporate sector and private trade for the market side and NGOs for social mobilisation.
Selected Growth EnginesThe growth sectors that should be focused for selected pro-motion are listed below. The selection of these growth enginesis based on their current strength, potential and expectedgrowth track based on trends.
The selection of which growth engine or sector to selectand promote must be undertaken regionally and district wise,depending on local field realities.
CONCLUSIONS
In conclusion we examine the employment situation inMadhya Pradesh by providing a profile of trends in employ-ment and unemployment including quality of employment.The paper also discusses about constraints and provides policy suggestions and recommendations for promoting productive employment.
The nature of employment problem in Madhya Pradeshcan be summarised as follows.● Employment in Madhya Pradesh is largely unorganised,
rural and non-industrial. The work participation ratesdeclined significantly in both rural and urban areas in the1990s.
● The employment growth recorded a drastic decline dur-ing 1993-94 to 1999-2000 as compared to those for theperiod 1983-84 to 1993-94. Probably the expectations ofincreasing employment opportunities due to economicreforms has not materialised at the aggregate level.
● There has been a proliferation of small and marginalfarmers over time. The share of cultivators in the totaldeclined while those of agricultural labourers increased.
● Only around 6 per cent of the total work force is in theorganised sector in Madhya Pradesh. The growth ofemployment in the organised sector has declined overtime. In the post-reform period, the growth of public sec-tor employment declined drastically while that of privatesector employment increased. However, the growth ofprivate sector employment has not been able to compen-sate for the loss of jobs in the public sector.
● The share of non-farm employment in rural areas hasbeen stagnant since 1983. There has been some variationover the years, but the rural non-farm share has becomemore or less constant. According to census 1991 esti-mates, Madhya Pradesh had the lowest share of ruralnon-farm employment to total rural employment
● There is no sign of increase in the usual status unemploy-ment rates. However, the daily status unemployment
L I V E L I H O O D S
100

recorded significant increase in the 1990s. It is a matter ofconcern for the state. The problem of unemployment ismore with the educated and youth.
● Casualisation has been increasing over time.● Labour productivity showed high growth in agriculture
and manufacturing in the 1990s. Inspite of this, thegrowth of real wages in rural areas declined significantlyin the 1990s.Our macro projections show that focus on agriculture &
allied and services option seems to be the most desirable fromthe point of view of increasing employment, while reducingpoverty and income disparity significantly.
We have discussed about the constraints for private sectorparticipation. Market failure in labour, credit, product aresome of the constraints. Low infrastructure is another impor-tant constraint.
The study recommends that given the problem of unem-ployment and underemployment for the masses and unem-ployment for educated, there is a need to have twin strategies forimproving the livelihoods. The first sub-strategy should aim atrural and urban masses who are illiterate/semi-literate,unskilled, semi-literate/skilled. The second sub-strategy has toaddress the educated unemployed. The policy goal should beto improve economic growth in rural areas with emphasis onemployment for the poor, and shift workers from agricultureto non-agriculture activities, particularly services in ruralareas. To achieve this goal, it is necessary to focus on selectedgrowth engines and clusters as suggested earlier.
In conclusion, we can say that the task of generatingemployment is an urgent one and needs a range of concertedactions from the government, donors, banks, and the privatesector and from civil society institutions.
101
L I V E L I H O O D S
Natural Resource
● Watershed development – to enhance productivity and stabilise
incomes of dryland farmers : soya, mustard, arhar, chana, jowar,
● Irrigated crops – wheat, cotton, sugarcane, paddy – to increase pro-
ductivity and quality for local processing and export marketing
● Horticulture development – citrus, peas, potato, vegetables, flowers,
cultivable aromatics
● Joint forest management – tendu, mahua, amla, myrobalans, other
NTFPs, bamboo, timber
● Livestock rearing – dairy, poultry, sheep/goat
● Fishery, sericulture
● Minor minerals – stone, sand, limestone
Rural and Small Industries
● Agro-processing: wheat, soyabean, mustard, paddy, pulses, cotton,
spices, vegetables
● Crop inputs: bio fertilisers, bio-pesticides
● Livestock based processing: dairy, poultry, fish, leather, meat
● Timber and NTFP: aromatics, medicinal plants, bamboo, tendu
(bidi), mahua, amla processing
● Stone processing, cement building materials
● Textiles: handloom (niche products), powerloom, apparel (low and
high end)
● Metal, glass, ceramic and plastic products
Urban Unskilled Services
● Transport of passengers and goods
● Repairs – vehicles, electrical equipment, electronic goods, buildings
● Recycling – solid waste, paper, cloth, glass, metals.
● Retailing (hawking) - food items, vegetables, cloth, other consumables
● Household services - domestic help, child care, old-age care, house-
keeping services, catering
● Security services, plumbing/electrical repairs, office services
Rural and Small Infrastructure
● Power - decentralised generation, biomass
● Power - local power distribution franchises
● Irrigation : tanks, canals, borewells
● Water - drinking water franchises
● Roads - construction and repairs, toll collection
● Road transport terminals; container depots
● Warehouses and Cold storages
● Plant nurseries; tissue culture units
● Market yards (mandis) and Haats
● Telecom - including voice and Internet
Services
● Wholesale trading
● Retailing - marketing agencies
● Health care
● Veterinary care
● Education all levels
● Vocational training
● Rural tourism: Hotels and restaurants
● Entertainment services
● Micro-finance – thrift, credit, insurance
● Business and real estate services

102

Promoting human development has been an importantobjective of government policy in Madhya Pradesh inthe second half of the 1990s. The first Human
Development Report (HDR) in 1995 provided a baseline ofinformation on the status of human development on chosenindicators. The magnitude and spatial dimensions of theproblem became much clearer than ever before. The reportbecame the focus of discussion and debate across the state1.Given, for example, the financial investment that the govern-ment had been making in social sector areas like primary edu-cation, the question was sharply posed: why was the picture sopoor? If, for example, every village had a school, then whywere so many children out of school? Why was literacy so low?Going beyond the cynical, “Govt is inefficient” kind of gener-al statement, the HDR was part of the thinking and reportingthe government resorted to and raised for itself a whole newset of questions for the policy makers.
The Human Development Report was not just a reportprepared in isolation. The state had put its focus on action onhuman development from 1993, with the Rajiv GandhiMissions focussing on specific areas of immediate andfocussed attention, increased attention to health, and educa-tion and taking the path of implementation through decen-tralisation and empowerment of people through making themvehicles of their own development. The report became a kindof a companion document to this process. The HDR was apart of the overall process of people centred development,part of a commitment to report also on the gaps and achieve-ments in field of human development in the state, and to facil-itate a debate on feasible and acceptable solutions.
Clearly, the then existing systems were either inappro-priate or inadequate. The focus of policy therefore changed: inaddition to allocating [more] finances, the government nowbegan to look into how it was implementing its policies.Systems of administration were re-examined. For example, inselected areas of priority, the Rajiv Gandhi Missions were set
up in the Chief Minister’s Office with specific time boundgoals but drawing on the existing governmental machinery.This was to enable the Government of Madhya Pradesh towork with a sharp focus.
The second Human Development Report of 1998 tookthis issue further. It looked into what had been done in thethree years between the two reports2. And it faced the questionof agency3 squarely. Who was to implement these pro-grammes? How were these policies to be implemented? Andthe answer was clear: it was through the mechanism of decen-tralisation. The system of local governance brought in by the73rd and 74th constitutional amendments provided the instru-ment through which the social sector objectives were to beachieved4. Elections to local bodies had just been held, andthese bodies were mobilised for these tasks by the GoMP.People were now not seen as “targets” to be reached but aspartners in the process of achieving agreed upon goals. Thiswas a basic shift in vision.
Each of these policy objectives has been carefully moni-tored, and independent evaluations speak of major changes—and dramatic improvements that have been made in the lastfive odd years. Thus the process of decentralisation is central tothe question of human development policies in Madhya Pradesh.And this process itself has been evolving with experience. Thevarious changes in law saw, in sequence, the move to ZillaSarkar and then to Gram Swaraj.
The purpose here is to inquire into the institutional aspectsof this process. What are the changes? What are their main fea-tures? Is there an evolutionary process of change underway, orare these the features of special circumstances that may not sus-tain? Is there something unique to Madhya Pradesh in thisprocess? There are many issues here that need scrutiny.
The role that institutions have come to play in MadhyaPradesh must be seen in the light of the context in which theyare operating on field. Institutions have increased multiplicityin the community – multiplicity in number of people involved
Human Development:The Institutional Underpinnings
103
1. The Chief Minister has referred to this first report as a record of “our failures” in a speech to a Conference on Decentralisation held in Bhopal on the 25th of August, 2001.
2. In his Preface to the 1998 report, the Chief Minister wrote “since a state government with responsibilities for action cannot rest with analysis, we feel that such a Report must also
report on action”.
3. This point was made by Amartya Sen when he formally released the second human development of Madhya Pradesh in New Delhi.
4. What began as an instrumentality for implementing development programmes grew, over time, in to a belief in its value for deepening democracy.

more directly in their own work and in matters that affectthem; multiplicity of institutions which sometimes conflictwith each other and sometimes re-inforce each other; multi-plicity in the forums and opportunities they provide for lead-ership; and for people to participate. Another crucial role ofinstitutions has been that they help organise and channelisepeople’s energies and creative and philanthropic urges. Fordevelopment in the background of the 73rd and the 74th
amendments, it needs to be undertaken through people’sinstitutions, and the process and movement towards settingup these institutions has been taken in Madhya Pradesh.
This chapter is organised as follows. Section 2 discussesthe idea of institutional change: what do we mean by this?Section 3 then moves on to an identification of elements ofinstitutional change that may be seen as underlying the trans-formations that have taken place in Madhya Pradesh in thelast five odd years. Section 4 then looks at a few of the pro-grammes and institutional changes from the field, to see if theelements identified in Section 3 stand up to field reality.Section 5 is by way of conclusion.
1.1 What is Institutional Change? It is important, when discussing institutional change, to dis-tinguish between organisations and institutions. This chapter isnot about organisations and organisational development. Thispoint may need some elaboration.
An organisation is an agency, often registered under a law,with specific objectives. It could be a private company. It couldbe a government department. It could be a not for profit soci-ety. It is a legal “person”, with resources of people, materialsand finances. It has to be managed efficiently to achieve itsobjectives—be it profit or something else. The objective has tobe clearly specified if the organisation is to achieve its goal.Thus, the Department of Education, to provide universal pri-mary education to children below 14 years is an organisationin this sense — as is Bharat Bhawan, a premiere national levelagency to work in the field of art and culture. Both have todeploy their resources efficiently to achieve their goals.Needless to say, the appropriate choice of instruments is critical to success.
An institution, on the other hand, is a code of behaviouror a set of behavioural norms, explicit or not, by which groupsof people act to achieve their goals. It may or may not belinked to a formal organisation. Examples of institutions are,say, the joint family, the caste system or the IndianAdministrative Service. Their roots lie in history and tradi-tion. Each is clear about membership and responsibilities ofmembership. Each comes with an implicit code of behaviour.Yet, the caste system is not an organisation in the sense the
term has been used in this chapter. The IAS is much more thanany individual member of the service, or even the IAS OfficersAssociation: it is an institution with its own norms andexpected codes of conduct. The boundaries of an institutionmay not always be easy to identify. Where, for example, is theline between the IAS and the larger civil service of which it isan important part, to be drawn? Both context and judgementbecome important in a discussion of institutions and howthey change over time.
Marriage is another social institution. As an institution, itis more than any one marriage between a couple—it definesthe way in which people in society organise themselves on areligious, social or other basis. It defines the way in which chil-dren are brought up—and much more. There can be much wedisagree with in such an institution—for example, in recentyears, the traditional roles assigned to men and women inmarriage are being redefined because of the injustice towomen [according to modern norms] in traditional marriage.Within the marriage context, dowry in India could be seen asan undesirable example of an institution that is frowned uponin law—yet it exists. Mere law cannot “abolish” such an insti-tution. Thus, even long lasting institutions may change overtime—in unexpected ways too.
This does not mean there are no organisations whoseobjectives overlap institutional concerns. We are all familiar,for example, with caste associations5. But there may be tradi-tions that make people behave in certain ways even when thereare no formal organisations for the purpose. There are manypeople who behave in a fair and just manner even when thereis no threat of legal action, or compulsion to honour a pro-mise. It is this behaviour within certain parameters or normsthat we refer to as an institution. Our concern will be withinstitutions in this sense of the term—of codes and norms ofbehaviour in specific contexts. The context here is humandevelopment. And changes in such norms, codes and contextswithin this broad area then refer to institutional change.
Where human development is concerned, the first HumanDevelopment Report of MP was interpreted as showing thatthe governmental system was poor in delivering results evenwhen government had “good” priorities. The Government ofMadhya Pradesh had invested large amounts in schools andteachers, but in 1995 literacy was abysmal. The institutionalbase of policy implementation then was a bureaucratic one.The Department of Education worked in a certain way: a cen-tralised, hierarchical decision-making and implementationprocess that has little links with the objects of the educationalprocess and its critical elements: parents, teachers and children.As a result of this insight, the Government of Madhya Pradeshmade institutional changes through the Rajiv Gandhi Prathmik
I N S T I T U T I O N S
104
5. In many parts of India we still have the traditional jati panchayats that function because people accept their relevance and jurisdiction, even when it has no place in the legal
structure. These jati panchayats interact with the legal modern bodies in unexpected ways—for example, in the phenomenon of members who are elected unopposed due to the
decisions of such agencies. Too ignore the existence and influence of these bodies would be to impair the effectiveness of the new legal panchayats.

Siksha Mission outside of the Department of Education. It waspart of a set of such missions.
The results of the first few years of experience were dis-cussed in the second HDR of 1998 in the chapter “The RoadTravelled”. The achievement of objectives has changed dra-matically as a result6 of the institutional changes made by theGovernment of Madhya Pradesh. It is our intention in thischapter to explore the nature of institutional change behindthis transformation.
1.2 Institutional Change in Madhya Pradesh Perhaps with the benefit of hindsight, it could be said thatinstitutional change in Madhya Pradesh began with clarity ofobjectives and instruments in the mid 1990s. The objective wasto improve the components of human development—health,education and the like—in an equitable way in a specified period of time. And the instrument for achieving this goal wasthe combination of new initiatives and ideas in the capital andimplementation through the new panchayats and peoples collectives at the local level. There was decentralisation withrespect to what existed earlier, but it was a process guided fromthe top by civil servants acting under the directions of thepolitical executive. The Rajiv Gandhi missions brought in newideas and insights; the panchayats brought in the energies andexperiences of the people. The panchayats and working withpeople’s collectives brought to the fore people’s demands—andthe government responded to that demand, through pro-grammes in panchayats, through using peoples collectivesmore and more in managing people focussed programmes.The two developed into a valuable partnership that is institu-tional in nature. Both, not in themselves, but acting in concert,are crucial to Madhya Pradesh’s subsequent experience. Thisprocess is perhaps the key institutional change that was made.
The setting up of the Rajiv Gandhi Missions in the ChiefMinister’s Office provided direction and management of anorder not available earlier. This also gave the missions the back-ing of the highest political authority. While the missions drewon expertise and resources within the government, their flexiblestructure made it possible to bring in resources and ideas fromoutside in way government departments could not. Further,missions were not permanent organisations like governmentdepartments: they could be shut down when the purpose forwhich they were set up was achieved—or failure became clear7.They were seen as catalysts of institutional change8.
The second is the implementation of the provisions of the73rd and 74th amendments to the Indian Constitution, in theform of a series of state Acts9 and elections based on them.This has been a case of making the path by walking—the sys-tem was one that constantly looked at experience, makingadjustments as and when needed. A centralised, bureaucraticand hardly accountable state government system was beingtransformed into something else—the vision is of a locallymanaged system in which people participate, regulate andmonitor how agreed upon things are done. In the first years ofthe new panchatai raj, the State Government dealt quite deftly with the problems that emerged vis-à-vis panchayats,problems of its leadership and problems from the field. Thebox on Panchayat Raj illustrates with some examples.
There are also critics of these changes and say that therehave been too many changes too soon. The other response is
105
I N S T I T U T I O N S
Panchayat Raj – State Government and itsResponse
In the early years of the new Panchayat Raj system, there were cases where
Sarpanch or Janpad Adhyaksha or Zila Panchayat Adhyaksha belonging to
reserved categories or a woman would be removed through a no confi-
dence motion, and for the next six months till the bye elections, the care-
taker would represent either the dominant communities or be their rep-
resentative. To prevent this, state Government changed the Act and pro-
vided that the caretaker would also belong to the same category as the
person voted out.
The cadre of Panchayat secretary drawn from erstwhile Village Level
Workers were not found to be very responsive to the Panchayat members.
The State Government then abolished this cadre, and allowed Gram
Panchayat to choose their Panchayat Secretary. The Panchayat Secretary
became dependent on the Gram Panchayat since they appointed him/ her
and could remove them through voting in the panchayat. Government
changed this and now the approval of the Gram Sabha is necessary both
in appointing and in removing the Panchayat Secretary.
The State Government off late has introduced the Right to Recall to
Gram sabha, which is a first anywhere in India. While there are reports
that this provision is being used more with respect to elected representa-
tives from weaker sections and women, this right by itself is almost revo-
lutionary and a measure of a truer democracy. Already there are instances
of this right being used, including the case of a City Mayor. This is a case
unique to Madhya Pradesh.
6. There are, understandably, debates about the nature of change, whether it is indeed an improvement, how lasting it is and so on. There are critics on this approach, but all agree
that change has occurred.
7. For example, the Rajiv Gandhi Missions on Diarrhoea Control and reducing Iodine Deficiency have been closed since they achieved their targets, while the Mission on Sanitation
was closed down, as it was unable to make any headway.
8. Physicists, in speaking of a phase transformation—say the change in the state of water from liquid to solid—point out that the presence of an impurity in the water is a necessary
condition for the phase transformation to take place. If institutional change is like a phase transformation, then some such catalyst is essential—and here it was the Rajiv Gandhi
Mission. The example should not be stretched to refer to it as an “impurity”!
9. Madhya Pradesh Panchayat Raj and Gram Swaraj Act, 1993; the Madhya Pradesh Zila Yojana Samiti Act, 1995 and the Rules; Orders and Circulars that have been passed to give
effect to various provisions of the Act.

that changes are responses to field realities and direct democ-racy of this kind has been experienced for this first time.Therefore problems are to be expected, changes are necessaryand are to be done with speed, since this kind of democracyhas too direct a bearing on people not to be acted upon withspeed.
The existing administration in the districts was one cen-tred on the District Collector, with development programmesimplemented by civil servants through the District RuralDevelopment Agency (DRDA)10. The new system reduced therole of the collector, and brought in new organisations/ insti-tutions like the Zilla Panchayat, Janpad Panchayat, GramPanchayat, Zilla Sarkar—and others too. The point of differ-ence was the bringing into being elected bodies11, with reser-vations for women and lower castes, which began gradually toplay a role in the implementation of schemes. Democraticprocesses were also set in motion at the time.
While this is a major democratic change, it is also truethat these bodies began work with a number of handicaps.Many elected had little education, and little exposure to issuesand alternatives available. Many, from the backward andscheduled castes, and in particular women, came into the sys-tem from a background in which they never have voiced theiropinions. Few really knew what the law permitted them to do.In this background, support from above was essential—sup-port to encourage them to face their responsibilities, to gettrained in a range of skills—to voice their views and those oftheir constituents. This could not happen over night. Themany evaluations that have shown that, women for example,were dummies for a male relative, fail to interpret this realityin context. Yes, they often are dummies. But today, it is theywho are formally in office. Their male relatives have to workthrough them—and this in itself is a major change. What isimportant in this social context is to see if the women in thesepositions learn over time, to see if the support system helpsthem in their tasks, to see if society around them begins tochange as a result.
For many programmes another approach was also adopted, that of peoples committees or groups managingthese programmes. Many programmes also initiated andorganised user groups/ management groups/ peoples groupsto manage and implement programmes – the major examplesof this are the Village Forest Committees under the JointForest Management programmes, Irrigation User Committeesunder a progressive legislation that brought irrigation usersinto irrigation management, etc. Even some of the RajivGandhi Missions were implemented through distinct usergroups such as the Watershed Committees. Some of these pro-grammes created committees separate from panchayats, in
which Panchayat leaders were sometimes involved in ex-officio or consultative capacities. The objective was notsubverting the panchayats but a platform that would be effec-tive for that particular programme, since these programmesinvolved a smaller stakeholder network and therefore repre-sentation to these committees needed a different group to berepresented.
The practice of setting up separate committees for vari-ous programmes has had impacts on the institutional front,that have been both negative and positive. There is muchmerit in the strategy that the more peoples institutions thereare, there will be greater participation, and contest in and ofpublic space is good for democracy, good for transparency andnurtures leadership. However, what also happened is thatthese parallel structures often under mined the power andinfluence of panchayats, and even led to confusion amongstpeople. Who is ultimately responsible for development?Legally sanctioned and democratically elected panchayat lead-ership or not. Many of the committees were even getting fundsdirectly that were far more than the funds handled by pan-chayats and in some cases their patronage opportunities andscope were more than available to the panchayats.Departments were keen to push their own committees, andthe field contest between panchayats and these committeeswere often remote controlled fights between departments andthe panchayats and its parent department.
However with the changes in Panchayat Act under the provisions of Gram Swaraj, and the provision ofeight committees under Gram Sabha to oversee most develop-ment activities, dropping programme specific committees isbeing encouraged. The Department of Education has taken alead in this.
Priorities were set on the basis of feedback and informa-tion directly from people. The Rajiv Gandhi Shiksha Missionlaunched a Lok Sampark Abhiyan, which involved school-teachers, local panchas, and the RG mission people—whowere government servants. It was from this that the need forschools in tolas was recognised. The basic problem was re-defined as one of access to a school. Based on an analysis ofthe results, and a fresh appreciation of local needs and requirements, the Education Guarantee Scheme waslaunched. It re-defined teaching and schooling in a new context. Other initiatives were in the removal of iodine deficiency, and in mobilising local people in regeneratingwatersheds and improving the local base for providing a min-imum level of livelihood. The institutional change here is theco-operative functioning of different bodies compared to uni-lateral decisions by the education department earlier—this isthe behavioural norm that has changed.
I N S T I T U T I O N S
106
10. Although the GOI insists upon the setting up of a DRDA distinct from the Zilla Panchayat, MP has merged the DRDA with the ZP. This was important in demonstrating to the
newly elected representatives that they were indeed important in the policy implementation process.
11. This was a concrete implementation of Rajiv Gandhi’s conclusion, after a series of consultations, that there could be no responsive administration without elected representation.

Having said this, it must also be recognised that the inprocess there were mistakes, but there was a willingness tolearn from them, and that is important—and it is here that thevision and will of the political executive and the implementa-tion of that vision by the bureaucracy becomes important. InMadhya Pradesh, the political executive had a long-term vision. Getting the civil servants to positively implementthis vision has been critical in this process. The Chief Ministerhas provided the leadership that has given the senior civil servants the space to implement his vision. Officers were carefully selected for specific positions, and given stabletenures, long enough to think ahead and plan. This is not verycommon in India.
The organisations have to be modified to function in thenew decentralised environment—this is a difficult task nowslowly being tackled through administrative reforms, privati-sation etc. Institutions seen as codes of behaviour have to beput in place, and nurtured till they get embedded in society.The change in modes of behaviour became evident first withthe manner in which the Missions were implemented, andthen extended into other departments and recently even intothe more traditional departments and their concerns. MadhyaPradesh became in early 1990’s to be the first state to have aprivately built road, it built the largest network of optical fibrecabling in the state, and there has been politically supportedaction in downsizing government. Today the government isinviting the attention of the private industrial, and financialworld towards its roads, infrastructure, and investmentopportunities.
This process can be seen in terms of its major components.Decentralisation of administration, to be effective, must includedecentralisation of functions, functionaries and funds. ThisMadhya Pradesh did as follows12. Management concepts havebeen creatively used—Rajiv Gandhi missions provided strategicdirection; panchayats brought in people’s demands and localcontrol; the Gram Sampark Abhiyan brought in an innovativemonitoring system; the District Planning Committees de-con-centrated government and took decision making powers to thedistrict—together the government as re-structured to becomemore responsive and deliver results in a way the earlier arrange-ment could not. This complex of changes taken together repre-sents new ways of government behaviour, and is the institu-tional change that we are talking about.
1.3 Institutions in Madhya PradeshLet us take a quick look at the range of institutions that havebeen initiated by the Government and its action, in variousinitiatives. There is little data to actually find out the member-ship and level of involvement, since records do not specifyduplicity of members, different members of same family/
household in different committees etc.The major institution of course is the Panchayat Raj in
the villages and the institutionalisation of the gram sabha.Under the Panchayat Raj setup are eight committees lookingafter issues of development, education, health, infrastructure,social justice and so on. Although reports suggest that most ofthese committees have not become active, they have createdspace and opportunities for people. The other institutions arein development programmes — watershed committees, inforestry the forest protection committees and village forestcommittees, committees to manage irrigation in many villages, and self help groups under many programmes.
The committees have provided undoubtedly a platformfor people to organise, build common capacities, channeliseand organise creative energies, and gave also helped in reduc-ing decision making processes, and bringing conflict ontoresolvable platforms. While the Panchayat Raj Institutions andpeoples committees do have the issues of dominant powergroup control, yet the tools of reservations, the opportunitiesfor the weaker and voiceless to participate has had a direct and effective impact on the element of equity, giving voice topoor and marginal. Committees by themselves cannot transform societies customs and relations, but they certainlyare giving spaces, hitherto unavailable or available only aftermuch effort and struggle. The membership and effective roles played across the state by women and members of back-ward and scheduled caste and tribe communities is a pointertowards this.
There is of course another side to the creation andstrengthening of peoples’ institutions, the opposition andconfrontation with bureaucracies. These agencies are chal-lenging institutions of power and disturbing status quo – bothwithin people and between people and government is givingrise to tensions. The fairly aggressive nature with which theState Government is pushing people and their institutionsinto roles in development and into roles in direct democracyhas to some extent not permitted such opposition and tensionto obstruct the changes. Yet, much still needs to be done to ori-ent both the bureaucracy and public representatives on theroles and powers of peoples institutions and to bring a morepositive work environment.
1.3.1 Rajiv Gandhi MissionsThe objective here is not to understand why these missionswere undertaken, but to try and understand what were theirinstitutional needs and why were such structures put together.
To talk of Rajiv Gandhi Missions we need to go back to1993, when a new government was sworn in after a year ofPresident’s rule. At the time when the priorities were established and agenda set for the coming five years, it is inter-
107
I N S T I T U T I O N S
12. It must be noted that this was not a one-off change but a gradual process, with some steps being retraced when experience warranted—and on this there can be much debate.
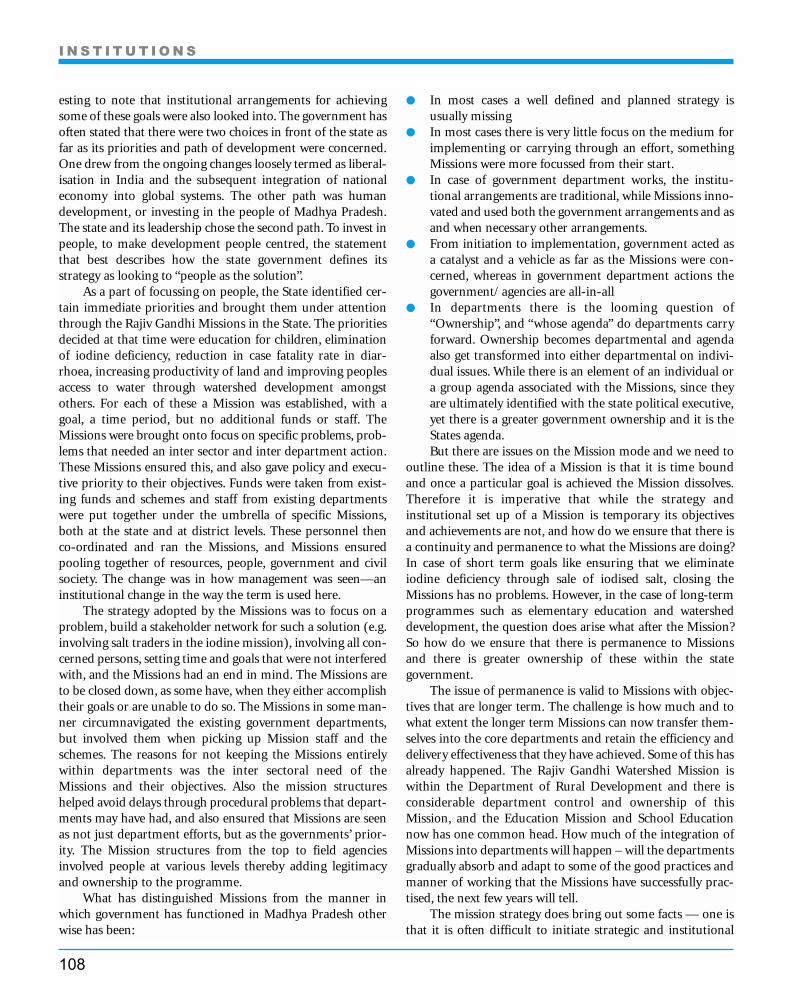
esting to note that institutional arrangements for achievingsome of these goals were also looked into. The government hasoften stated that there were two choices in front of the state asfar as its priorities and path of development were concerned.One drew from the ongoing changes loosely termed as liberal-isation in India and the subsequent integration of nationaleconomy into global systems. The other path was humandevelopment, or investing in the people of Madhya Pradesh.The state and its leadership chose the second path. To invest inpeople, to make development people centred, the statementthat best describes how the state government defines its strategy as looking to “people as the solution”.
As a part of focussing on people, the State identified cer-tain immediate priorities and brought them under attentionthrough the Rajiv Gandhi Missions in the State. The prioritiesdecided at that time were education for children, eliminationof iodine deficiency, reduction in case fatality rate in diar-rhoea, increasing productivity of land and improving peoplesaccess to water through watershed development amongst others. For each of these a Mission was established, with agoal, a time period, but no additional funds or staff. TheMissions were brought onto focus on specific problems, prob-lems that needed an inter sector and inter department action.These Missions ensured this, and also gave policy and execu-tive priority to their objectives. Funds were taken from exist-ing funds and schemes and staff from existing departmentswere put together under the umbrella of specific Missions,both at the state and at district levels. These personnel thenco-ordinated and ran the Missions, and Missions ensuredpooling together of resources, people, government and civilsociety. The change was in how management was seen—aninstitutional change in the way the term is used here.
The strategy adopted by the Missions was to focus on aproblem, build a stakeholder network for such a solution (e.g.involving salt traders in the iodine mission), involving all con-cerned persons, setting time and goals that were not interferedwith, and the Missions had an end in mind. The Missions areto be closed down, as some have, when they either accomplishtheir goals or are unable to do so. The Missions in some man-ner circumnavigated the existing government departments,but involved them when picking up Mission staff and theschemes. The reasons for not keeping the Missions entirelywithin departments was the inter sectoral need of theMissions and their objectives. Also the mission structureshelped avoid delays through procedural problems that depart-ments may have had, and also ensured that Missions are seenas not just department efforts, but as the governments’ prior-ity. The Mission structures from the top to field agenciesinvolved people at various levels thereby adding legitimacyand ownership to the programme.
What has distinguished Missions from the manner inwhich government has functioned in Madhya Pradesh otherwise has been:
● In most cases a well defined and planned strategy is usually missing
● In most cases there is very little focus on the medium forimplementing or carrying through an effort, somethingMissions were more focussed from their start.
● In case of government department works, the institu-tional arrangements are traditional, while Missions inno-vated and used both the government arrangements and asand when necessary other arrangements.
● From initiation to implementation, government acted asa catalyst and a vehicle as far as the Missions were con-cerned, whereas in government department actions thegovernment/ agencies are all-in-all
● In departments there is the looming question of“Ownership”, and “whose agenda” do departments carryforward. Ownership becomes departmental and agendaalso get transformed into either departmental on indivi-dual issues. While there is an element of an individual ora group agenda associated with the Missions, since theyare ultimately identified with the state political executive,yet there is a greater government ownership and it is theStates agenda.But there are issues on the Mission mode and we need to
outline these. The idea of a Mission is that it is time boundand once a particular goal is achieved the Mission dissolves.Therefore it is imperative that while the strategy and institutional set up of a Mission is temporary its objectivesand achievements are not, and how do we ensure that there isa continuity and permanence to what the Missions are doing?In case of short term goals like ensuring that we eliminateiodine deficiency through sale of iodised salt, closing theMissions has no problems. However, in the case of long-termprogrammes such as elementary education and watersheddevelopment, the question does arise what after the Mission?So how do we ensure that there is permanence to Missions and there is greater ownership of these within the state government.
The issue of permanence is valid to Missions with objec-tives that are longer term. The challenge is how much and towhat extent the longer term Missions can now transfer them-selves into the core departments and retain the efficiency anddelivery effectiveness that they have achieved. Some of this hasalready happened. The Rajiv Gandhi Watershed Mission iswithin the Department of Rural Development and there isconsiderable department control and ownership of thisMission, and the Education Mission and School Educationnow has one common head. How much of the integration ofMissions into departments will happen – will the departmentsgradually absorb and adapt to some of the good practices andmanner of working that the Missions have successfully prac-tised, the next few years will tell.
The mission strategy does bring out some facts — one isthat it is often difficult to initiate strategic and institutional
I N S T I T U T I O N S
108

changes within departments, and these take long periods totake effect, and even then after constant resistance by depart-ments. Two, if immediate and urgent changes and focussedchanges are required, governments established systems are notthe best bet, and in action that requires inter-sector, and inter-department co-ordination and collaborative action, then aforce or pull from outside any particular set up can ensure it.
1.3.2 Gram Sampark AbhiyanFrom the year 1998, the Government of Madhya Pradeshstarted a process called Gram Sampark Abhiyan (GSA). It is asimple exercise, carried out over a week each year, where teamsof government officials visit every village and habitation inMadhya Pradesh for a reality check. The teams are trained andprovided with an elaborate questionnaire and a planned chartof activities to be conducted in the GSA.
The teams address Gram Sabha meetings, meet groups of people in all the habitations. They use a questionnaire togather information on different aspects and register problems,observe and document infrastructure and condition of infra-structure (e.g. list all handpumps and observe how many arein working order), and implementation of key developmentschemes. The teams in the initial GSAs also noted down actionpoints, prepared a type of demand list of villages, reviewedpeople’s own problems related with government (e.g. peoplewho have not received patta for land that was allotted to themetc.). The information so collected is put into questionnairesand in a village diary, the former are sent to janpad and district administration for documentation and necessaryaction and the latter remains in the gram panchayat.
Over the last couple of Gram Sampark Abhiyan, theobjective of the programme and its content has changed. Theprocess of generating a wish list and documenting it, as thefirst GSA landed up doing has been abandoned, and the pro-gramme has moved into a drive mode. A drive based on atheme is now one of the principle goals of the GSA, along withcollecting information on functioning of government pro-grammes – have people received the ration cards, is the nursecoming to the village etc. The self monitoring role of theabhiyan is one of its main purposes.
From last year the GSA has a specific theme, where thecontact programmes are used to spread awareness on thetheme, and collect specific information on the theme. Avibrant example of this was the Gram Sampark Abhiyan lastyear which focussed on water conservation in the backdrop ofthe severe drought that had hit the state. Simultaneously italso collected information on health from each village, to drawup district level health action plans. In both a great deal oflocal information was collected from which local demandswere assessed and form the basis for action.
These contact programmes are high profile, and officialsactually do visit habitations. Evidence of official teams visitinghabitations and conducting Gram Sampark exercises are in
abundance. Along with teams, government officials from districts and the state level (including senior officials such as Principal Secretaries to the State Government), members of the State cabinet and the Chief Minister travel and visit villages to participate in this programme and take a check onthe process.
Institutionally, this serves the overseeing function fromthe top—the decisions taken by local bodies must be respectedand implemented—and the GSA is an instrument for ensuringthat the local bureaucracy does what it is supposed to. This isimportant in forcing accountability from civil servants. Theentire exercise is bureaucratic, both because the exercise is onthe functioning and feedback for the bureaucrats and theirbosses – both political and executive, and it is also an exercisein taking government literally to the people. This also ensuresto some extent accountability to the top of field officials, whoin turn are enforcing implementation of people’s decisionsunder the direction of the political executive of the State.
The impact of Gram Sampark Abhiyan had been on two fronts. One is the collection of information on quality ofgovernment services, problems associated with the interface ofgovernment and people. District, Janpad and departmentalaction often follows location of problems in habitations and solvable problems get priority attention. The informationso gathered is an excellent tool for active and motivated official and there are enough examples from across the statewhere such officials have used it to identify problems, and takesuitable action. The Government has placed all the data collected during the Gram Sampark Abhiyan by village onto aweb site (www.mp.nic.in/gramsampark) and this is open forpublic access.
Government resources and capacities are not adequate toaddress all the problems and demands recorded during GSA.In the first Gram Sampark while generating demand, wish listswere generated in villages, and raised high level of expecta-tions. The raised level of expectations cannot be met as statedabove. This has generated a sense of disappointment and evensome cynicism, and impacted people’s perceptions of theGram Sampark Abhiyan.
There is also a problem of consistency and the quality ofdata gathered. However, it is no doubt that field realities areevident and in some platform they get recorded.
The other impact has been when GSA moved into a ‘drive mode’. The utility of Gram Sampark Abhiyan as a check on governance is pretty good. On the other hand the use of Gram Sampark Abhiyan to generate demand has rightly been dropped as a goal of these campaigns. With thethird GSA, the campaign undertook a drive mode and also attempted to make it clear that this is a monitoring tool and not a demand generation tool.
The theme of one of the GSA was pani roko (stop water)under the slogan – khet ka paani khet mein, gaaon ka paanigaaon mein – and this kind of caught the imagination of
109
I N S T I T U T I O N S

people. Termed the Pani Roko Abhiyan, government initiatedthis call across the state, urging people in their communes andhabitats to do something to stop water from flowing away,stop, and store it wherever it falls and wherever it can bestored. The Gram Sampark Abhiyan took this message toevery village and ever villager. From across the state a largenumber of initiatives were taken to build structures for waterconservation, stopping water and conserving it where it falls,etc. Government made part contribution and people con-tributed the rest, both in cash and kind and in labour.
The GSA impact and the success of Pani Roko Abhiyanshowed how such a peoples contact programme can be effec-tively used, and also shows the thinking that such contact programmes are taken seriously and there is a determinationto use them for development. This year the campaign took onthe theme of sanitation.
Gram Sampark Abhiyan is taken with some seriousness.The Gram Sampark Abhiyan have also become a useful tool tolaunch public messages followed by programmes on suchmessages.
If we look carefully at the Gram Sampark Abhiyan,what emerges is that one it was not a one time effort that normally such campaigns are about, and there has been an element of sustainability and follow up to them. This does not state that the all the action objectives of the campaign aresuccessful. Second, that once such a tool is available, otherefforts of the government then utilises it in effective manner.It is also part of similar other efforts of the Government of Madhya Pradesh where they have created systems andprocesses that run parallel to existing government efforts,but draw their legitimacy, their strength and their logisticsfrom the government. GSA has institutionalised ground levelmonitoring and feedback systems, and an effective mechanismto push through drive based initiatives, especially thoseinvolving public partnership.
1.3.3 PanchayatsThe institution of Panchayat Raj was brought into modernindependent India’s political set up over four decades ago.The real impetus came only after the Indian Parliament passed the famous 73rd and 74th Constitutional Amendmentsin 1993. These amendments signalled the fulfilment ofthe promise made in the Constituent Assembly through Article 40. These two amendments facilitated the way for creation of institutions that would strengthen the process ofparticipative democracy.
The constitutional amendments contained mandatoryand discretionary provisions for the state governments withinwhich they were expected to frame their respective state laws
for the local bodies. To enable the states to empower thePanchayats and the Urban local bodies with powers and func-tions a suggestive list was incorporated in the constitution asSchedule 11 and 12, respectively.
The state of Madhya Pradesh saw the amendments as anopportunity. It became the first state to legislate laws withinthe state to bring in the new panchayat system, it was also thefirst state to hold elections under the new system. The involve-ment of people in their own development, involvement ofpeople in decision making and as participants in developmentthrough the institution of panchayats has in fact become acornerstone of government policy and practise.
We will see later in this chapter that the structure of pan-chayats has also been evolving in the state and the change isnot just in terms of administrative provision and rules, butsubstantial. From the time that the new Panchayat Raj systemwas established, there has been constant reflection on the system, and based on such an analysis two major changes werebrought about. One is the District Government system, andthe other the Gram Swaraj system. Both reflect clearly theStates response to feedback, experience and reaction to thePanchayat Raj system in Madhya Pradesh.
1.3.4 The District Planning Committee (DPC) – Co-ordinating InstitutionIn pursuance of the Article 243 ZD of the Constitution theMadhya Pradesh Government enacted the Madhya PradeshZila Yojana Samiti Adhiniyam, 1995 that received the assent ofthe Governor on 19th May 1995. The Act was subsequentlyamended in 1999 to make the provisions comprehensive innature and enable the establishment of Zila Sarkar (DistrictGovernment) in the state.
The Zila Yojana Samiti Act provides for the constitutionof the DPC in all the districts of the state. Further, the districtswere categorised as comprising of 15, 20 or 25 members in theCommittee. The membership to DPC has been provided tothe elected members of the Panchayats, Municipalities,President Zila Panchayats, and the Prabhari Minister of thestate government13 and the District Collector. The PrabhariMinister has been designated as the Chairperson of theCommittee.
As DPC, the Committee has the powers of planning, rais-ing resources for financing their plans, and to monitor andevaluate the programmes and schemes that are implementedunder the system of decentralised planning, including themoney to be allocated by the MP/ MLA fund.
As District Government, the DPC is vested with considerable administrative, executive, financial and legislativepowers. For example, the DPC have the powers to transfer class
I N S T I T U T I O N S
110
13. The State Government has a Minister designated to specially look after the interests and development of each district. This minister of the State cabinet is called the Prabhari
Mantri.

II, III and IV officers of the district that have not been trans-ferred to the Panchayats. The departments’ heads in the districtare expected to take the permission of the Chairperson DPCfor expenditures for which they used to take the permission ofthe state government previously. To ensure that there is nooverlap with the Zila Panchayats, the orders of the departmentsspecifically state that the DPC has the powers over the schemesthat have not been transferred to the Panchayats.
The main aim of decentralising the powers at the districtlevel is to reduce the delay in securing sanctions and toempower the people’s representatives at the districts to takedecision at the district level itself. The DPC being a bodyentrusted with comprehensive powers over all departments,the administrative decision-making can take place at the dis-trict level. As an enabling provision, the Collector has beenmade the Deputy Secretary in all the departments at the state(except Home), to fulfil the objective.
The system of District Government implementedthrough the mechanism of the District Planning Committeemust be seen as a measure of administrative decentralisation,and not as a measure of decentralisation per se. The StateGovernment has faced criticism for the District Governmentsystem, and critics maintain that it has provided for backdoorentry for elected MLAs and State Ministers and Districtbureaucrats to intervene in the rights and duties of panchay-ats and urban local bodies. Criticism also says that the Districtgovernment has re-inforced the status of the DistrictCollector. What is important to note here is that while manyof these criticisms may be true and borne out of personalexperiences across districts, what the District governmenthave done is to decentralise administrative decisions from thecentralised offices at Bhopal to districts. District PlanningCommittees under the District Government today have con-siderable powers to give technical and financial sanction tolarge projects hitherto undertaken by Departments at Bhopal.What DPCs have done is to ensure that decision come home,in the sense that stakeholders from the Districts are involvedin decision making, rather than distant bureaucracies, andmore stakeholders are involved
2 INSTITUTIONS IN ACTION - EXAMPLES FROM THE FIELD
We will look at two examples of institutions and institutionalevolution in the last eight years to observe what trends havebeen followed. These are the Panchayat Raj and Gram Swarajset up in Madhya Pradesh, and the Rajiv Gandhi Missions.While the first is a concrete example of the manner in whichgovernment implements its commitments, in the second wewill see how systems and processes have evolved.
2.1 PanchayatsThis is the only section where we will tackle in detail theorganisational set up in Madhya Pradesh. This is done for tworeasons – one is that at the cutting edge level, panchayats are
the mechanism for implementing governments action, andtwo the institutional and organisational strength and evolu-tion of panchayats are significant.
The functional usefulness of Panchayat institutions lie instrengthening democracy at grass roots and in institutionalis-ing a system that is based on the willing assent of the people andnot the coercive power of the state. The very existence of theseinstitutions provide an opportunity to the people to state theirown views about their needs and difficulties and (that) the cor-rect solutions must be elicited and given the fullest weight inmaking the plans, in the execution of which they will be calledupon to assist.
Thus, Panchayats as institutions and HumanDevelopment as the goal of all planned development has thefollowing three dimensions:● as decentralised institutions that play an effective role in
furthering the national goal of human development● as representative institutions that are able to express the
local concerns for human development and undertakeconsequent action
● as enabling institutions that create opportunities for thelocal human resource to practice their skills for self-gov-ernanceThe ensuing paragraphs uses this three dimensional
framework to assess the role played by the Government ofMadhya Pradesh in developing and strengthening thePanchayat institutions in not only fulfilling their constitu-tional obligation, but also in playing a pro-active role in deve-loping the potential of human resources in the state.
2.1.1 The Framework for PanchayatsThe policy of the State Government towards Panchayat Rajinstitutions was given effect through the circular titledGuiding Principles: Decentralisation of Powers, Responsibilitiesand Programmes to Panchayats in October 1996. The circularpropounded the vision of the state with respect to Panchayatsin general as well as in reference to each level of Panchayat inparticular (see Box on Guiding Principles)
The guiding principles were a major breakthrough for thestate in transferring the work, the staff and the budgets toPanchayats. In pursuance of the principles, works of 23departments and the budget under demand number 15, 80and 82 of these departments was placed at the discretion ofPanchayats institutions. Each of these departments haveissued circulars and orders that effectively transferred theirwork, as well as issued orders that transferred some staff underthe purview and control of Panchayats
Since 1994 there have been two rounds of elections forPanchayats in the state- 1994 and 2000. These two electionswere held before the formation of Chhattisgarh state. After thebifurcation of the state, there are 22029 Gram Panchayats in the state. The details of number of Panchayats and theirrepresentatives is given in Table 1.
111
I N S T I T U T I O N S

There are 3,44,424 Panchayat representatives in the state,which includes 22,387 members as leaders of their respectivePanchayat bodies. Among these 61.4 per cent of the represen-tatives belonged to the Scheduled Castes (15.6 per cent),Scheduled Tribe (27.6 per cent) and Other Backward Class(18.1 per cent) categories. Of the total representatives 33.8 percent are women.
In pursuance of the mandatory provisions of the 73rd
Constitutional Amendment, the State Government had alsoconstituted the First and the Second State FinanceCommission to decide upon the principle of devolution offunds to the Panchayats. The Second Finance Commissionshas also submitted to report.
The State Government that is responsible to conduct elec-tions for Panchayats has also constituted the State ElectionCommission. In past the Election Commission has conductedtwo general elections and elections for seats and posts as andwhen they become vacant.
The section 129 of the Madhya Pradesh Panchayat Rajand Gram Swaraj Act, 1993 provides for the constitution ofseparate Audit Organisation for the conduct of audit ofPanchayats. However, this organisation has not been formedin the state and the functionaries of the Department ofPanchayat and Social Welfare are currently carrying out theaudit.
2.1.2 Legal FrameworkThe legal framework for the Panchayat institutions is definedby the Madhya Pradesh Panchayat Raj and Gram Swaraj Act,1993; the Madhya Pradesh Zila Yojana Samiti Act, 1995 andthe Rules; Orders and Circulars that have been passed to giveeffect to various provisions of the Act. The Act provides for asystem of three-tier Panchayat institutions, Zila Panchayat atthe district, Janpad Panchayat at the block, and GramPanchayat at village level (population of 1000).
The Act is universal in its application as it applies to therevenue and forests villages in the state. There are certain dif-ferences in the way the Act is applicable in the Schedule andnon-Schedule areas of the state (see Box on Special Provision).
The Constitution has laid down special provisions for thewelfare of the members of the Scheduled Tribes in the coun-try. Areas with concentration of tribal population have been
I N S T I T U T I O N S
112
Zila 946 45 1289 61 734 45
Janpad 9097 459 9105 459 6456 313
Gram 443429 30922 443804 31138 314847 22029
Panchayat 1994 2000 From 1 Nov 2000
Member President Member President Member President
Source : Department of Panchayat Raj, Government of Madhya Pradesh
Table 1: Number of Panchayats and Representatives in Madhya Pradesh
Guiding Principles of Devolution ofPower to PRI
Role of state government will be that of a policy regulating agency
● Panchayats should be developed as institutions of self-governance
and not merely as institutions of local governance
● Zila Panchayat should gradually evolve as district government and
Block Panchayat should become its main administrative unit.
● The main responsibility of Panchayats is to plan for economic
development and social justice. To enable Panchayats to fulfil this
role the staff and the budget should be transferred to the
Panchayats.
● At the district and sub-district level the work should be distributed
between the State and the Panchayat sector. This division should
avoid duplication of control and authority of state and Panchayat
sector.
● Gram Panchayat be given functional control of those departments
that needs to be managed at the local level
● Participation of Panchayats to be ensured while preparing welfare
and development programmes
● State employees will work for the state government and the
Panchayat employees will work for the Panchayat. There may be
officials from the same department under the Panchayat and the
State sector- their roles and responsibilities and co-ordination
should be well defined
● Since the work of the departments has to be transferred to the
Panchayats all the budget with the exception of establishment cost
should be transferred to Panchayats
● The power of the departments should be given to an institution, and
not to any particular official.
● The process of use of powers should be based on rules of procedure
in the same manner as the state government. For this working rules
and procedures should be prepared for Panchayats that will define
the roles and responsibilities of the committees and the officials are
empowered to take decisions.
● In no condition the Panchayats will be given the adhoc control of
departments. Either there will be no control or there will be total
control of Panchayats.

specially designated as (a) Tribal Areas in the North-EasternStates of Assam, Meghalaya, Tripura and Mizoram; and as (b)Scheduled areas in other states of the country. The former isgoverned by the Sixth Schedule and the latter by the FifthSchedule of the Constitution.
The MP Panchayat Raj and Gram Swaraj Act, 1993 has been suitably modified to incorporate the provisions ofthe Extension Act of the 73rd Amendment Act to provide forthe Panchayats in the Scheduled Areas (vide amendment MP 43 of 1997 [5-12-97]). There are 4 districts in the state thatare wholly categorised as Scheduled Area districts and 12 districts as partially Scheduled Area districts. The District,Block and Village Panchayats in each of these categories aregiven in Table 2.
There have been 12 amendments to the state Act since itsenforcement. These amendments have been substantive innature, the most notable being the amendments on 5th
December 1997 and the amendment on 22nd January 2001.The former created the distinction between the Scheduled andnon-Scheduled Areas in the State and the latter affected thechange in the name of the Act to Madhya Pradesh PanchayatRaj and Gram Swaraj Adhiniyam, 1993. It also extended theprovisions of the Act to Gram Sabhas in the State. Every Gram Sabha in the state has been recognised as a legal entityand the system of working through the committees have beenextended to the all the Villages.
2.1.3 Gram SwarajThe existing panchayat system was constantly criticised for two major weaknesses or problems. One was the growing and almost over bearing influence of Sarpanch over the panchayat, and the second was that the Gram Sabha was not able to establish its role, character and importance and there was dwindling interest in Gram Sabhas and thereforedeclining attendance in its meetings. The Gram Sabha actually had considerable powers under the existing provisionsof decisions and planning, but most of this has become redundant in practise.
Recognising both these problems, the idea of GramSwaraj was evolved, inspired by the ideals and thinking ofMahatma Gandhi. Empowering Gram Sabhas further andgranting them a greater role, the idea is to tone down the
unnecessary influence of the Sarpanch and to give a compre-hensive role to Gram Sabha so that people find it worthwhileto attend the meetings and thereby participate directly in theirconcerns – a change towards direct democracy.
The Madhya Pradesh Government amended the MadhyaPradesh Panchayat Raj Act to give effect to Gram Swaraj in thestate. The amendment has brought in substantive changes inthe Act and in the nature of Panchayat institutions, especiallyat the village level. The main features of the amendment aregiven in the box on Gram Sabha.
2.1.4 Panchayats as Decentralised InstitutionsThe role of Panchayats, as institutions that can play an effec-tive role in furthering the goals of human development, isdependent on the powers and functions that have been trans-ferred to these institutions and the enabling provisions thataccompany these powers. In this context it will be importantto assess the extent and the degree to which the StateGovernment has de-centralised its powers and functions atthe district and sub-district levels.
Administrative decentralisation: The state government in pur-suance of its policy of strengthening Panchayats as institutionsof self-governance has demarcated the work of departments at
113
I N S T I T U T I O N S
Districts that are wholly declared as Scheduled Areas 4 35
Districts that are partially declared as a Scheduled Area 12 40
- Non Scheduled Blocks 63
Districts with no Schedule Area 29 175
Total 45 313
Status of District District Block
Table 2
Special Provision for the extension ofPanchayat Raj in fifth Scheduled areas
● Separate Gram Sabha for each village in Schedule Areas. Moreover,
separate Gram Sabhas can be constituted for a hamlet or a group of
hamlets
● The meeting of the Gram Sabha shall be presided over by a member
of the Gram Sabha belonging to the Schedule Tribe only. Any
elected member of the Panchayat, Sarpanch and Up-Sarpanch can-
not preside over the meeting of the Gram Sabha.
● Gram Sabhas have the power to safeguard and preserve the tradition
and the customs of the people, their cultural identity, community
resources and the customary mode of dispute resolution.
● Gram Sabhas can exercise control over institutions and functiona-
ries in all social sectors transferred to the Gram Panchayat
● Gram Sabha has the power to manage natural resources including
land, water and forest within the area of the village in accordance
with its tradition and in harmony with the provision of constitution
and with due regard to the spirit of other relevant laws for the time
being in force.
● Gram Sabha can give advice to Gram Panchayat in the regulation
and use of minor water bodies
● Gram Sabha can manage village markets and fairs including cattle-
fair, by what ever name called, through the Gram Panchayat
● Gram Sabha has the power to control local plans, resources and
expenditure for such plans including tribal sub-plans.
the district level to the offices of the Panchayat sector andoffices of the State sector.
The powers and functions of many departments havebeen demarcated in to the office of the Panchayat and theoffice of the State sector, and transferred to the Panchayats at the district level. The offices of Panchayat sector have been placed under the direct control of Zila Panchayats. Thebudget, staff and other functional powers have also beentransferred to the Zila Panchayats.
This transfer of staff has created confusion amongst fieldofficials and affected direct line hierarchies in government.Who does the field staff report to, how do departments handle staff implementing their programmes but technicallywith the zila parishad now? It is a departmental turf issue, andeven for employees, the duality of reporting and identity hasits own set of problems.
Financial decentralisation: The state government has takenpioneering steps to provide increased finances to thePanchayat institutions through budgetary decentralisationand other steps taken to expand the resource base ofPanchayats. The former includes transferring the money votedunder demand number 15, 80 and 82 (see Box) to Panchayats.The latter has been ensured by accepting the recommenda-
tions of the Finance Commission where 2.91 per cent of thetotal revenue (tax and non-tax) of the state has been ear-marked for Gram Panchayats. In addition, the state govern-ment is also sharing revenue generated through stamp duty,receipts collected through Professional tax, cess on Education,and Land revenue with Panchayat institutions. An importantstep for increasing the control of Panchayats on the usage offunds in the district has been the merger of the DRDA withZila Panchayat. As a result the money allocated from the central government for rural development under centrallysponsored schemes is now disbursed on the recommendationsof the Zila Panchayat.
The extent and nature of powers and functions that havebeen delegated to Panchayat institutions in Madhya Pradeshmakes it clear that the State Government does not perceivePanchayats merely as extended arms of the government or asinstitutions that will increase the outreach of its services. On
I N S T I T U T I O N S
114
● The Gram Sabha of every revenue and forest villages in the state has been recognised as a legal entity. That is, the Gram Sabha can sue and be sued,
and it will have its own seal and signature.
● The Gram Sabha itself will convene the meeting of Gram Sabha. One meeting of the Gram Sabha every month is mandatory.
● The condition for the fulfilment of the quorum has been made mandatory for the meeting of the Gram Sabha. The quorum for the Gram Sabha is 20
per cent of the membership of the Gram Sabha. Of the members present one-third should be women.
● Decisions in the Gram Sabha will be unanimous. In case there is dispute attempts will be made to arrive at a general consensus, and if the matter is
still nor resolved the majority opinion will prevail.
● There is provision for appeal on the decision taken by the Gram Sabha.
● Every Gram Sabha will constitute seven Standing Committees, namely, Agriculture, Education, Health, Infrastructure Development, Community
Resources, Village Protection, and Social Justice. The Chairpersons of each of these committees along with the Sarpanch and the Up-Sarpanch of the
Gram Panchayat will constitute the Village Development Committee.
● The amendment if flexible enough to provide space to the Gram Sabha to constitute ad hoc committees for specific work. These committees could be
made and dismantled by the Gram Sabha.
● Every Gram Sabha will have a Village Fund, comprising of the Cash (bank) fund; the Grain fund; the Labour fund; and the Material Fund. The
purpose to which this fund will be put to use will be decided by the Village Development Committee.
● Gram Sabha has been entrusted with the responsibility of the village; of the work that is to be performed by the Gram Panchayat (eg express opinion
on the budget of the Panchayat, and its annual audit etc); control over natural resources and control over institutions and their functionaries. With
respect to responsibility of the village the Gram Sabha will have lay down the principles for implementation of development schemes, identify
families below poverty line, and controlling the implementation and monitoring of beneficiary oriented schemes. The Gram Sabha also has the
responsibility of ensuring equality of benefits in the implementation of various schemes and programmes.
● Gram Sabha has three sources of income- donations, receipts from Panchayat Nidhi, and taxation. As a legal entity, the Gram Sabha has the option of
imposing taxation Profession tax and Public Property. At the same time it has to levy and collect building tax, professional tax, tax on services
provided to the village.
● Every Gram Sabha will ensure that there is annual audit of its accounts.
Gram Sabha - New Role under the Gram Swaraj Initiative
Demand number 15: Financial assistance to Panchayat institutions under
Special component plan for Scheduled Caste
Demand number 80: Financial assistance to Panchayat institutions
Demand number 82: Financial assistance to Panchayats under tribal
sub-plan

the contrary, the Panchayats have been perceived as, anddeveloped as, decision-making bodies within the overall con-trol and management of the village communities. It is thischaracter of Panchayats in the state that has taken thembeyond the scope of decentralised structures towards theframework of institutions that have a critical role in HumanDevelopment.
2.1.5 As Representative InstitutionsThe degree of autonomy enjoyed by the communities, whichis reflected in the opportunities that exist for the communitiesto take decisions and in the decision-making processes thatallows the community to exercise their choices is a crucialindicator in the status of development that people and com-munities enjoy. This gives democracy an intrinsic value thatguides the functioning of all institutions and makes participa-tive democracy a cherished goal for the institutions of self-governance. It is within the dynamic the framework ofdecreasing dependency of communities that Panchayat insti-tutions find a reason for their existence and define their criti-cal role in Human Development.
Effective governance is based on the nearness of the gov-erning institution to the communities. In Madhya Pradesh, thesmallest unit of representation is defined by a ward that is con-stituted over a population of 100 persons. The Gram Panchayat,that forms the institution, is constituted over a population of1000 persons. With the recognition of Gram Sabha as a bodycorporate, comprising of persons entitled to vote within its territory, has effectively located the institutions for decision-making in the village itself. Further, to enable the Gram Sabhato function as a body corporate the state government has provided for the constitution of eight standing committees ofthe Gram Sabha that has further widened the institutional base of the Gram Sabha in the community and has createdopportunity for the community to take specific decisions.
The major role assigned to Panchayat institutions, inMadhya Pradesh, is planning for economic development andsocial justice. Every Gram Sabha and Gram Panchayat isexpected to prepare plan for the development of the villagethat will be consolidated at the Janpad level and later on at theZila Panchayat level. The process of planning is expected toinvolve all sections of the community through the StandingCommittees at the Gram Sabha and the Gram Panchayat level.The village community constitutes the former and thePanchayat representatives (Sarpanch and Panch) comprise thelatter. These committees represent multiple institutionalspaces within the framework of Panchayats to address different issues and concerns.
Thus, the creation of multiple institutional platformsequipped with substantive powers are indicative of the processwhere the communities do not have to depend on institutionsthat are far away and appear as inaccessible monolithic organsof the state. With governance becoming everybody’s concern
the responsibility for achieving the development targets shifttowards the community and its institutions. For example, goalsof universal immunisation or universal literacy or IMR of 40 areas much the targets for local institutions as they are of the state.In fact the role of the state changes from a mere provider ofservices in a supply driven mode to that of an agency that facil-itates the communities to achieve their respective targets. Andthis very fact of changing roles and responsibilities poses thebiggest challenge to the state government in Madhya Pradesh.
Emergence of panchayats and urban local bodies empow-ered institutions for governance imply a change in the rolesand functions of existing institutions, namely the administra-tive departments, who have to change from dispensers ofadministrative largesse to reluctant partners with communi-ties. Delegation of powers to Panchayats implies an inevitablereorientation and redefinition of the role of the administrativedepartments. It also implies development of a mind-setamong the officials that goes beyond considering Panchayatsas a necessary irritant or even evil to be tolerated, towards anapproach that is positive and pro-active towards Panchayats asan institution and towards Panchayat representatives as people’s representatives.
2.1.6 As enabling institutionsThe concept of Panchayat institutions is rooted in the socio-political history of the country, yet their recognition as formalinstitutions of governance and the development role that isassigned to them requires time before it can be internalised bythe community and the institution itself. For example, delega-tion of powers does not ipso facto imply that people will startusing it, or it will be used in the manner and for the purposefor which it has been designed. Thus, the role of state as theprovider of information and as the regulator of institutionalfunctioning assumes greater importance. That is, the challenge before the state is to ensure that Panchayats functionas institutions that allow people to practice their skills ofself-governance. The challenges are posed by the followingstructural and systemic factors:
Response of established power centres: Panchayat institutionsequipped with popular support and powers and functions ofthe state have emerged as new power centres in the communi-ty. The established power centres in the community have beenchallenged and have been forced to respond to Panchayats.The preferred reaction of existing power structures has beento co-opt these institutions within their fold so as to retaintheir power base in the community. However, the larger com-munity has woken up to this process of co-option and haspublicly challenged their dominance. In such a situation thestate cannot remain neutral and has not only to provide pro-tection to the community, but has to demonstratively establishthe dominance of Panchayats as institutions of self-expressionfor the people and individuals.
115
I N S T I T U T I O N S

Centralisation within decentralisation: Within their own insti-tutional framework the there are possibilities that decision-making is centralised in a post or in few hands. The StateGovernment identified the dominance of Sarpanch as the soledecision-making person in the Gram Panchayats that led tothe enactment of the Gram Swaraj within the Panchayatframework. The state government needs to be vigilant to theprocesses of decision-making at all levels in the Panchayats sothat neither individuals nor any constituent of the institutiongain dominating power and start affecting the decisions in theinstitutions.
Institutional negotiations: Panchayat as an institution are in aposition where they need to negotiate with line departmentsand interact with government officials on a daily basis. Thesources of information and the skills for administration arehowever, in the hands of the latter and they are not willing toshare these with Panchayat representatives. As a result thePanchayats find themselves handicapped during the process ofinstitutional negotiations and often complain about their passive role in the process of overall decision-making. Theresponsibility for ensuring a level playing field for thePanchayats is that of the state government that will have toreview its strategy for flow of information to the Panchayatsand to the community.
Financial decentralisation: The debate in Panchayats so farhas focussed on how much of their own resources have theState Government shared with Panchayats. The quantum ofresources transferred to Panchayats has become the index for effective decentralisation. However, the option ofstrengthening Panchayats as institutions that can generatetheir own resources has not entered the arena of publicdebate, nor Panchayats have been assessed as institutionsthat can become financially self-sufficient. The challengebefore the state government is to find alternative ways inwhich the Panchayats can have adequate resources for theirown plans.
Accountability mechanisms: The responsibility for effectivefunctioning of Panchayats is as much of the institutions itselfas it is that of the departments at the district and the sub-district level. This necessitates monitoring and accountabilitysystems within the administrative and Panchayat institutions.The main focus for the former is to assess the quality of sup-port provided to Panchayats where as for the latter it is neces-sary that its functioning becomes transparent and accountableto the community. On both counts the State Government hasto assume the responsibility of instituting accountabilitymechanisms that are able to monitor the functioning of boththe departments and the Panchayats in terms of their respec-tive assigned roles as well as the activities undertaken thatcomplements each other’s role.
2.1.7 Gram Swaraj and PanchayatsGram Sabhas have been at the core of Panchayat Raj Institu-tions, and the Acts as well as the spirit of Panchayat Raj makeGram Sabha the supreme body for all decisions. Following thenew Panchayat Raj system in the state, the Government ofMadhya Pradesh to ensure regular Gram Sabhas ordained thatthere will be four compulsory Gram Sabha meetings everyyear – one each on 26th January, 14th April, 15th August, and 2nd
October. While earlier the Gram Sabha meetings were to beheld on these dates specifically, this was later modified to overa week around these dates. Most observations and studies onGram Sabha brought out the following –● While Gram Sabha meetings were held on the dates,
attendance was very poor. Except for times when benefi-ciaries in programmes were to be decided usually atten-dance would range from a dozen to two dozen persons.
● Usually Gram Sabha members close to or supporters of thesarpanch would dominate such meetings thereby denyingthese bodies the characteristics of a democratic body.
● Many people observed that the issues debated or discussed or dwelled upon in Gram Sabha were mundanematters such as budgets etc., and were of little if any utility to people. Hence, attending these meetings was notof much use. Further, domination by group or groupswould dissuade others.
● Sarpanch and his supporters on their own would oftenuse existing rules and provisions of quorum to theiradvantage and use such meetings to ratify decisions thatsuited them.The problems, both of low attendance and dominance by
some were seen by the State Government as a crucial bottle-neck in making Panchayat Raj system even more democraticand effective. There was also growing concern over an expanded and over powering role of the Sarpanch. Both theseprompted the State Government to take measures to ensure agreater and more effective role for Gram sabha. The changesunder the Gram Swaraj initiative have tried to provide a muchgreater and critical role to Gram Sabha, taking them down tothe level of every habitation. From the 26th of January 2001,amendments to the Act in Madhya Pradesh have heralded thisnew system in the state.
Gram Sabha – an empowered body: The enactment of the concept of Gram Swaraj has brought about a qualitativechange in the character and nature of Gram Sabha in the state.The Gram Sabhas are now a body corporate with their own seal and succession. In addition, they have been entrusted with the powers and functions to:● exercise control over government functionaries● undertake planning ● identify/ approve beneficiaries under different schemes ● provide approval to proposals before they can be
implanted in the village
I N S T I T U T I O N S
116

● control and manage various programmes of government.● Co-operate with other agencies for the implementation of
their activities● undertake the review, monitoring, inspection and
supervision of government programmes in the village ● maintain records and accounts at the village level ● maintain structures created under various schemes● perform a facilitative and promotional role towards the
development of their villageThe wide ranging powers given to Gram Sabha and its
eight committees has suddenly changed the equation in whichpanchayats and the elected representatives were working.There has been a reduction in the role of the Sarpanch, greaterinvolvement of people in decisions, more need for regular andattended Gram Sabha meetings. With hardly a year gone byunder the new enactment it is very early to say anything withregard to what is going to happen. However it is important tonote some of the issues that emerge with the Gram Swaraj ledchanges in the state panchayat system.
One is that under the previous Panchayat Raj system,while there were many Sarpanch who dominated and controlled gram panchayats, it also gave power and built leadership amongst weaker sections and women. The last six years are filled with numerous examples of such empower-ment. The reduction in the role of the Sarpanch has takenaway this one opportunity that men and women of weakersections and women in general got. Under the Gram Swaraj initiative, what roles will the Sarpanch play is yetunclear? The situation, role and context of the Panch is evenmore uncertain. Another point is that while earlier the GramSabha were called four times a year but often not attendedwell, yet there was the Sarpanch who had to call these meet-ings and ensure that they are at least held. With the GramSabha directly exercising the powers hitherto with Sarpanchand Gram Panchayat, who will ensure that these meetings areheld and held properly.
The eight Gram sabha committees are new, and needgreat amount of work upon them to make them active, awareof their roles and responsibilities. There is evidence from fieldthat wherever work concerning committees came, especiallyin the form of funds, these committees became active, whileother committees in the same village are dormant. The evi-dence is clear; the State Government will have to ensure thatpowers, responsibilities and funds are made available to thesecommittees, if they are to become effective and active.
2.2 Missions – from 1993 to 2001Rather than tracing the history and changes within theMissions, we will try and see how the Missions have evolvedover the last eight years. We will also look at the example of the
new Rajiv Gandhi Swastha Jeevan Sewa Guarantee Yojana andhow it has come about.
The Missions initially developed a tendency of buildingparallel implementation structures to panchayats, althoughpanchayats were involved in ex-officio capacities.Most Missions and many departments developed parallelmechanisms – Joint Forest Management Committees,Watershed Development Committees etc. These parallelstructures have been a matter of debate as discussed earlier. While parallel committees subvert the authority ofpanchayats, parallel structures also increase people’s directparticipation in development.
Over the last eight years the experience of developing parallel structures and then integrating them with panchayatshas also produced positive changes. To integrate these, and toensure that there is a co-ordination between panchayats, theGram Swaraj initiatives have provided an ideal platform.Under the Gram Swaraj changes, every village will now haveseparate committees to oversee different development opera-tions14, all under the umbrella of gram panchayats. Thesecommittees provide a valid platform for integrating pro-gramme user groups with such committees. The departmentof education has already taken a decision to dissolve all com-mittees under it and merge them with the gram panchayateducation committee.
Another change of significance has been rationalisationof Missions. Missions that have won the test of time by beingsustainable, effective or which had long term goals continue.Those that either achieved success (such as the Missions forElimination of Iodine Deficiency and Mission for Reductionin Diarrhoea Deaths), or those that somehow could not takeoff or find a direction (such as the Mission on Sanitation orthe Mission on Advanced Technology), have been closeddown. The ones with long term goals such as those for educa-tion and watershed development have remained state wideMissions. This has been an evolution in the Mission system,and reflects a strategic thinking and manner of working, evenin a high profile, and politically sensitive group of pro-grammes. The new Missions being added to the current listare those with longer-term goals and agenda, such as theMission on Community Health. It is in the light of this that wetake a look at the new health scheme launched in the state afew months ago.
Rajiv Gandhi Swastha Jeevan Sewa Gaurantee YojanaThe initial Missions were specific goal focussed, and some tar-geted larger objectives, such as universalising primary educa-tion. The accumulated experience of the Missions, speciallythe experience of the Education Guarantee Scheme wasbrought into the planning and design of the latest State
117
I N S T I T U T I O N S
14. In all eight committees.

Mission on health. The details of the Mission are not impor-tant to us, what is, is the manner in which this Mission wasplanned and its elements brought together.
In its focus on human development, the area of health wasstill the most disturbing with few achievements. In response tothis, the State Government began an exercise in thinking abouthow and in what manner can a sustained and comprehensivehealth Mission be launched. In the design of this Mission manyof the lessons of previous Missions was also utilised.
The Gram Sampark Abhiyan held from 3rd to 7th
February 2001 across the state collected information on thecurrent status of health provision, providers, pockets of dis-eases, key determinants of health, etc. This information hasbeen put together in the form of a Village Register Plan, onthe basis of which a Village level Health Plan will be formu-lated. The specific needs of each village will them become ele-ments to which the health mission will be expected torespond—much as the EGS was framed. The Village levelHealth Plan, in turn are being aggregated at the district levelto form District level Health Plans. These Plans will not onlyfeed into the health guarantee scheme but also feed into theoverall health programmes. Demand and supply are matchedthis way.
The Health Guarantee Mission has evolved in the follow-ing aspects – the Mission is housed in the Department ofHealth, with Commissioner Health the Mission Director.Another very important component of the scheme is the roleof Gram Sabha. The Gram Sabha members of every village areto select amongst themselves the Health Committee of stake-holders or the Gram Swasthya Samiti, under the aegis of theGram Swaraj related changes in the Panchayats Acts. Thesecommittees have at least 12 members out of whom fifty per-cent belong to Scheduled Castes, Scheduled Tribes and OtherBackward Classes (2/3 SC/ST and 1/3 OBCs) and thirty threepercent women members. The members from amongst them-selves will elect the president of the committee for a term ofone year. Preferably the local village Dai, or the resident JanSwasthya Rakshak will be nominated as a secretary of its GramSwasthya Samiti. This committee will also be responsible for maintaining the Village Health Registers and formulatingthe Village level Health Plan. All the personnel and provisionsunder the Health Guarantee scheme will be under the authority of the Gram Swasthya Samitis.
The evolution of the Mission structure in these key organisational arrangements – one that department isdirectly involved, and two that panchayats play a central role –are signals of evolution of the Mission approach, and thatMissions are now getting grounded within the state systems.
3. BY WAY OF CONCLUSION
Students of decentralisation will undoubtedly point out thatthe Madhya Pradesh experiment is one of decentralisationfrom above in which senior civil servants have played an
important role in guiding the process in a particular way. Themajor import of this point is that this has not been somethingthat the people at local levels have done; that they would havedone things differently; and that therefore there is somethingboth undemocratic and undesirable in what has happened inMadhya Pradesh in this time.
Madhya Pradesh, in the centre of the Indian mainland,was traditionally a largely feudal state, with many districts inthe north, north central and western borders under feudalprincipalities, and other districts under kulak peasantry. Inthe last century or so, and even after India gainedIndependence, the state has not witnessed any people’s orsocial movements or significance. This is not to state thatpeoples movements in Madhya Pradesh are not of signifi-cance. But what we refer to here are large scale people’s orsocial movements. Not only has there been an absence ofchanges in the social and political fabric of the state frompeople’s efforts, the state has had a severely under developedand backward infrastructure, poor education and health setup and poor industrial and land base.
It is from this starting point that we need to see MadhyaPradesh – feudal, backward, a conglomeration of differentregions. There have been no peoples movement in humandevelopment as was the case in Kerala, or co-operative move-ments of the sale witnessed in Gujarat and Madhya Pradesh,no rationalist movement as in Tamil Nadu. Then how doeschange begin?
Yes, change has been from above? But it is also a vision ofthe Chief Minister of the state. What is important is whatdirection is this change taking? This is what is important, andyes, it also has a democratic base as a politically elected execu-tive spearheads it, sets the priorities and provides support andbacking to it.
That decentralisation has been a process guided fromabove is a basic truth. India has a system of governance inwhich the state governments have the responsibility to set up and empower local bodies as they deem fit. The constitutional amendment has deepened the federal principlethat form part of the basic structure of the constitution—from a union of states with state and union government, India is moving towards a union of local governments and state governments. From a two tier structure that has worked from 1952 to 1993, we are now moving, with the initiativecoming from the states, to a three tier structure that, in addition to union and state governments, has three levels ofpanchayats and in urban areas, municipalities or nagarpalikas. This is a fundamental change that will in time bring about major changes in many of the organisations andinstitutions that we have been familiar with. This report looksat one small slice of time in just one state—the big picture willtake time to emerge—in this evolving scenario. Differentstates have done this differently. That is a basic truth. But doesit nullify ground experience?
I N S T I T U T I O N S
118

In Madhya Pradesh, given the long feudal history—the term perhaps is used loosely here—a process that did not have support at the highest levels of the state government would have been captured by local vested interests. This could still have happened in many parts ofMadhya Pradesh—time will tell. Given the low capabilitiesof elected representatives at local levels, they would havebeen unable without support to achieve any of their goals.The question therefore is this: has the higher level systemfunctioned in an equitable and democratic way? Has it empowered local people to meet their goals? Has it responded to their needs when they were, however hesitatingly, expressed? Has it given space for dissent,for those who agreed on the goals but differed on the
means being used? Have the first crucial step in an ongoing process of transformation been supportive of longterm change? There can be differing answers based on experience of different regions of the state, based on differing political philosophies and different readings ofhistorical experience. These differences have to be openlydiscussed and resolved.
If the answers to some of these questions are “Yes”, thenthe overall process of institutional change in MP has been inthe right direction. That is the thrust of this chapter. It canonly end on a note of caution: the [limited] success of the pastfew years is no guarantee for the future. Care and cautionmust continue to the watchwords as the process proceeds.Eternal vigilance is, after all, the price of democracy.
119
I N S T I T U T I O N S

120
Right from the beginning of planned development inIndia, the issue of regional egalitarianism has occupiedcentre-stage. The theme of balanced regional develop-
ment has been integral to all the Five-Year Plans framed so far.As far back as the Second Plan, the question was addressed asfollows: “In any comprehensive plan of development, it isaxiomatic that the special needs of the less developed areasshould receive due attention. The pattern of investment mustbe so devised as to lead to balanced regional development.The problem is particularly difficult in the early stages whenthe total resources available are very inadequate in relation toneeds. But, more and more, as development proceeds andlarge resources become available for investment, the stress ofdevelopmental programmes should be on extending the ben-efit of investments to underdeveloped regions. Only thus cana diversified economy be built up. These considerations havebeen kept in mind while formulating the Second Five YearPlan, but they are certain to claim even greater attention in theplans to come”.
These words were prophetic. The issue continues to be ofconcern today, as expressed in the Approach Paper to theTenth Plan, which specifically addresses the issue of unevengrowth in the context of states. The Approach Paper notes that“the Plan has traditionally focused on setting national targetsbut recent experience suggests that the performance of differ-ent states varies considerably. For example, although the econ-omy as a whole has accelerated, the growth rates of differentstates have diverged and some of the poorest states have actu-ally seen a deceleration in growth.
Finance Commissions, which deal with constitutionalcentre-state transfers of tax revenues, have reflected this bytheir concern for “horizontal equity”. In turn, these concerns,expressed by Finance Commissions and the PlanningCommission have been translated into formal structures andformulae for the flow of resources for development, and thedirection of industrial policies. Through the decades sinceindependence, economic policy-makers have consistentlysought to centrally manage and direct development resourcesinto the lesser-developed parts of the country.
In this chapter, we seek to consider the regional dimen-sions of development with special reference to MadhyaPradesh. This is broadly looked at in two parts. In this chapter,
the comparative trends in the growth of the economies of themajor states since the early sixties are outlined, along withmore recent comparisons of inter-state profiles of poverty andhuman development.
INTER-STATE COMPARISONS : GROWTH, POVERTY AND HUMAN
DEVELOPMENT
Income GrowthThe growth performance of states can be tracked by the dataon State Domestic Product (SDP), which is reported by stategovernments and compiled by Central Statistical Organisation(CSO). CSO does not standardize the data or attempt to makethem consistent with each other or the national accounts.However, while there exists this lack of consistency in the SDPdata across states and in respect of the national accounts of thecountry, it is nevertheless used to analyse the growth of states.There have been recent studies on the subject by Ahluwalia(2000), Kurien (2000) and Chaudhuri (2001). Similarly,development economists have been comparing growth acrossdifferent countries despite the data not being always fullycomparable. The caveat is that while broad conclusions can bedrawn from these data, too much significance should not beaccorded to relatively small changes in indicators.
Further, while Gross State Domestic Product (GSDP) isconsidered standard for making per capita income compar-isons in the current period, in the period before 1979-80, esti-mates of state income were available only in terms of Net StateDomestic Product (NSDP). Accordingly, following the analy-sis of Chaudhuri (2001), NSDP is used for the pre-1980-81period while GSDP is used for the post-1980-81 period.
The State of Madhya Pradesh was formed in 1956 pursuant to the States Reorganisation Commission recom-mendations. In the year 2000, this state was divided into thestates of Madhya Pradesh and Chhattisgarh. In tracking thelong run trends of growth, and a number of other indicators,it is the undivided state that is used as a basis of inter-statecomparison, since data is available only for the undivided statein the period 1956-2000. Where subsequent comparisons arepossible e.g as from the Census 2001 data, these have beenused. However, since the essential features of the present state remain similar to that of the undivided state, the
Widening Inter-RegionalDisparities in India
121

comparison is valid.Very shortly after the formation of the State in 1960-61,
the economy of Madhya Pradesh represented a proportion of5.6% of the economy of India as a whole. Four decades later,in 1998-99, the undivided Madhya Pradesh still represented ashare of 5.6% of the economy of India. Table 1 indicates thechanging share of the major states in the all-India economyover time.
The first observation on the undivided State of MadhyaPradesh is the relative constancy in the share of its economy inthe national economy, right from its formation as a state tillvery close to its division.
More instructive is to look at the long term trend in percapita income of the states. Per capita income levels, while nottaking into account intra-state individual differences inincome levels, do represent a standardized measure ofincome. Just as in the eighties and nineties, the acronymBIMARU indicated a peer group of low income states withlow levels of human development it is possible to identify a
peer group of states to which the State of Madhya Pradeshbelonged in the early sixties, in terms of income levels. Therewas a group of states in 1960-61 with per capita incomes (atcurrent prices) fairly close to each other. These were: UttarPradesh with Rs.253, Madhya Pradesh with Rs. 254, AndhraPradesh Rs. 276 and Rajasthan Rs. 282. The all-India per capi-ta income level then was Rs. 331. The per capita income ofMadhya Pradesh as a proportion of all-India per capitaincome was about 75%.
In terms of per capita income, these peer group states ofthe sixties followed relatively different growth paths. As maybe seen from Table 2, of these states, while the relative positionof Madhya Pradesh remained stable in relation to national percapita income, Uttar Pradesh experienced a continuous rela-tive decline vis-à-vis the all-India level over the next fourdecades, and even Rajasthan declined in the 1990s. MadhyaPradesh on the other hand registered a mild increase.
Table 3 indicates the relative ranking of states based onthe relative indices of per capita income given in Table 2
I N T E R S TAT E
122
Maharashtra 11.2 410 15.6 27966
Uttar Pradesh 12.9 253 10.7 10416
Tamil Nadu 7.8 333 7.3 19488
Andhra Pradesh 6.9 276 7.1 15372
West Bengal 9.4 392 6.8 14191
Gujarat 5.2 364 6.3 21623
Madhya Pradesh 5.6 254 5.6 11663
Karnataka 4.8 298 5.6 17660
Bihar 6.9 217 4.1 6803
Kerala 3.0 260 3.9 19753
Rajasthan 3.9 282 3.9 12010
Punjab 2.8 368 3.4 23481
Haryana 1.7 330 2.7 22488
Delhi 1.2 678 2.5 29884
Orissa 2.6 216 2.2 10125
Assam 2.3 317 1.6 9863
Jammu & Kashmir 0.7 268 0.6 9998*
Himachal Pradesh 0.5 236 0.6 14312
All-India 100 331 100 16537
States 1960-61 1998-99
NSDP at current prices Per capita NSDP in Rs. –1960-61 GSDP at current prices Per capita GSDP in Rs.- 1998-99
Proportion to all-India level Proportion to all-India level
Source : Census data on population and mid-year projections, Central Statistical Organisation, State Income Data, Chaudhuri (2001).
Table 1: Changing Share of The Major States In The All-India Economy (in percentage)

above, including other major states.Taken over a long period, the ranking of Madhya Pradesh
and Rajasthan indicated marginal changes, with MadhyaPradesh improving its inter-state position and Rajasthanslightly declining. The long term picture masks in the case ofRajasthan a surge in growth from about the mid-eightiesonwards, which has enabled it to steadily improve its relativeposition since. It may be seen that notable declines in relative
all-India rankings have taken place in the major states of east-ern India, most notably West Bengal, but also in the case ofBihar, Orissa and Assam.
To round off the picture of income growth, we take a lookat the recent trends in growth of Gross State DomesticProduct [GSDP] per capita between two periods in Table 4. Itshows that while the state grew at moderate rates in the 1980s,the pace of growth accelerated in the 1990s.
Public policy has consistently attempted to reduce region-al disparities and bring about balanced regional development.The long term trends seem to indicate that these efforts in
123
I N T E R S TAT E
Andhra Pradesh 87.84 89.61 78.86 90.84
Madhya Pradesh 74.59 72.60 74.20 77.12
Rajasthan 90.15 91.44 83.90 84.30
Uttar Pradesh 76.84 72.71 72.22 62.14
All India 100.00 100.00 100.00 100.00
State 1960-63 1975-78 1990-93 1996-99
NB:The indices indicate the proportion of the per capita income of these then less developed states to the national average (represented by index value of 100).
Table 2: Index of Per Capita State Domestic Product (SDP) at Constant Prices,
Three Year Averages
Andhra Pradesh 10 9
Assam 7 14
Bihar 17 17
Gujarat 3 3
Haryana 6 4
Himachal Pradesh 13 8
J&K 11 13
Karnataka 8 6
Kerala 12 7
Madhya Pradesh 16 12
Maharashtra 1 1
Orissa 15 16
Punjab 4 2
Rajasthan 9 11
Tamil Nadu 5 5
Uttar Pradesh 14 15
West Bengal 2 10
State 1960-63 1996-99
Source: Tables 2 and 3 rely on the analysis of Chaudhari (2001)
Table 3: Ranking of States on the Basis of
per Capita State Domestic Product –
At Constant Prices
Gujarat 5.08 9.57
Maharashtra 6.02 8.01
West Bengal 4.71 6.91
Rajasthan 6.60 6.54
Tamil Nadu 5.38 6.22
Madhya Pradesh 4.56 6.17
Kerala 3.57 5.83
Karnataka 5.29 5.29
Andhra Pradesh 5.65 5.03
Haryana 6.43 5.02
Punjab 5.32 4.71
Uttar Pradesh 4.95 3.58
Orissa 4.29 3.25
Bihar 4.66 2.69
All 14 States 5.24 5.92
All India 5.55 6.89
1980-81 1990-91 1991-92 1997-98
Source: Mid Term Appraisal of the Ninth Five Year Plan: Planning Commission
Table 4: Rates of Growth of Gross State
Domestic Product

public policy at national level have not been particularly effec-tive in reducing regional disparities.
Growth of all-India per capita income has accelerated inthe eighties and nineties relative to earlier period, and growthrates of most of the states have risen, in inter-temporal terms.For example, in the case of Madhya Pradesh, negative growthrates of per capita incomes in the sixties and seventies havebeen replaced by growth rates in excess of 2% per annum in thenineties, but the all-India growth rate has shot up by more thanproportionately from around 1% per annum in the sixties andseventies to nearly 5% per annum in the nineties. For all States,the range of growth rates has widened, and if this persists, theneconomic disparities between states will continue to widen.
COMPARATIVE PROFILE OF POVERTY
The Planning Commission has been estimating the incidence ofpoverty at National and State level using the methodology con-tained in the report of the Expert Group on Estimation ofProportion and Number of Poor (Lakdawala Committee) and
applying it to consumption expenditure data from the largesample surveys on consumer expenditure, conducted periodi-cally by the National Sample Survey Organisation (NSSO).Official poverty estimates are accordingly available for the years1973-74, 1977-78, 1983, 1987-88, 1993-94 and 1999-2000.
These official estimates may be considered to be the stan-dard measure in mapping of State level poverty. Between twoconsecutive periods, there are often short-run fluctuations orvariations in poverty estimates for particular States, which maynot give a true picture of the overall trend, and may sometimesbe due to changes in methodology. However, in consideringthis period as a whole, these variations tend to be ironed outand a better picture of the overall trend emerges. In the com-parison of States, a long term trend of nearly three decades isavailable, if we consider the period from the first estimates forthe years 1973-74, till the latest estimates in 1999-2000.
Since the analysis is with reference to Madhya Pradesh, wehave taken for comparison estimates of six major states com-parable in size to Madhya Pradesh and its basic characteristics.Further, with Madhya Pradesh being a largely rural state, wehave taken the figures for rural poverty as a better comparisonof the poverty profile. The estimates of six major comparativeStates for rural poverty are presented in the Table 5.
There are two schools of thought on the impact of eco-nomic growth on poverty reduction. One view is that growthper se has a poverty reducing impact, and accordingly onewould expect to find poverty decline more rapidly in the fastergrowing States and less rapidly in the others. According to thisview, only a substantial higher rate of growth can bring aboutthe expansion in productive income earning opportunitiesneeded to bring about a significant reduction in poverty.
The other view is that while economic growth has thepotential to reduce poverty, equating growth with povertyreduction is too simplistic. Effective public policy interventionsare needed for translating growth into reduction in povertylevels. These interventions should be such that they bringabout improvements in physical and social infrastructure
I N T E R S TAT E
124
Trend Rates of Growth of Per Capita
Income (% p.a.) MP vs All India,
1960-1/1969-70 to 1993-4/1998-99
6
5
4
3
2
1
0
-1
-260 70 80 90
All India Madhya Pradesh
4.8
2.32.1
-1-1.1
3.3
1.20.8
Bihar 62.99 63.25 64.37 52.63 58.21 44.30
Orissa 67.28 72.38 67.53 57.64 49.72 48.01
Uttar Pradesh 56.53 47.6 46.45 41.10 42.28 31.22
Madhya Pradesh 62.66 62.52 48.90 41.92 40.64 37.06
Rajasthan 44.76 35.89 33.50 33.21 26.46 13.74
Andhra Pradesh 48.41 38.11 26.53 20.92 15.92 11.05
States/ UTs Percentage Percentage Percentage Percentage Percentage Percentage
of Persons of Persons of Persons of Persons of Persons of persons
1973-74 1977-78 1983 1987-88 1993-94 1999-2000
(30 day recall)
Source: Planning Commission
Table 5: Percentage of People Below Poverty Line in Rural Areas
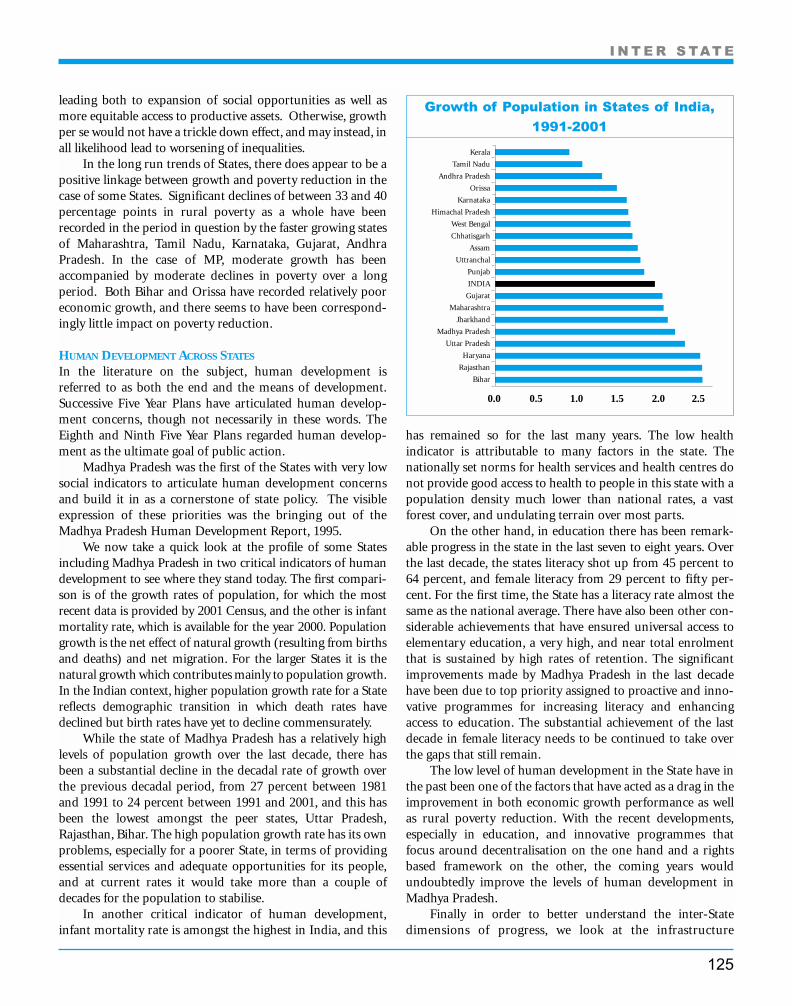
leading both to expansion of social opportunities as well asmore equitable access to productive assets. Otherwise, growthper se would not have a trickle down effect, and may instead, inall likelihood lead to worsening of inequalities.
In the long run trends of States, there does appear to be apositive linkage between growth and poverty reduction in thecase of some States. Significant declines of between 33 and 40percentage points in rural poverty as a whole have beenrecorded in the period in question by the faster growing statesof Maharashtra, Tamil Nadu, Karnataka, Gujarat, AndhraPradesh. In the case of MP, moderate growth has been accompanied by moderate declines in poverty over a longperiod. Both Bihar and Orissa have recorded relatively pooreconomic growth, and there seems to have been correspond-ingly little impact on poverty reduction.
HUMAN DEVELOPMENT ACROSS STATES
In the literature on the subject, human development isreferred to as both the end and the means of development.Successive Five Year Plans have articulated human develop-ment concerns, though not necessarily in these words. TheEighth and Ninth Five Year Plans regarded human develop-ment as the ultimate goal of public action.
Madhya Pradesh was the first of the States with very lowsocial indicators to articulate human development concernsand build it in as a cornerstone of state policy. The visibleexpression of these priorities was the bringing out of theMadhya Pradesh Human Development Report, 1995.
We now take a quick look at the profile of some Statesincluding Madhya Pradesh in two critical indicators of humandevelopment to see where they stand today. The first compari-son is of the growth rates of population, for which the mostrecent data is provided by 2001 Census, and the other is infantmortality rate, which is available for the year 2000. Populationgrowth is the net effect of natural growth (resulting from birthsand deaths) and net migration. For the larger States it is thenatural growth which contributes mainly to population growth.In the Indian context, higher population growth rate for a Statereflects demographic transition in which death rates havedeclined but birth rates have yet to decline commensurately.
While the state of Madhya Pradesh has a relatively highlevels of population growth over the last decade, there hasbeen a substantial decline in the decadal rate of growth overthe previous decadal period, from 27 percent between 1981and 1991 to 24 percent between 1991 and 2001, and this hasbeen the lowest amongst the peer states, Uttar Pradesh,Rajasthan, Bihar. The high population growth rate has its ownproblems, especially for a poorer State, in terms of providingessential services and adequate opportunities for its people,and at current rates it would take more than a couple ofdecades for the population to stabilise.
In another critical indicator of human development,infant mortality rate is amongst the highest in India, and this
has remained so for the last many years. The low health indicator is attributable to many factors in the state. Thenationally set norms for health services and health centres donot provide good access to health to people in this state with apopulation density much lower than national rates, a vast forest cover, and undulating terrain over most parts.
On the other hand, in education there has been remark-able progress in the state in the last seven to eight years. Overthe last decade, the states literacy shot up from 45 percent to64 percent, and female literacy from 29 percent to fifty per-cent. For the first time, the State has a literacy rate almost thesame as the national average. There have also been other con-siderable achievements that have ensured universal access toelementary education, a very high, and near total enrolmentthat is sustained by high rates of retention. The significantimprovements made by Madhya Pradesh in the last decadehave been due to top priority assigned to proactive and inno-vative programmes for increasing literacy and enhancingaccess to education. The substantial achievement of the lastdecade in female literacy needs to be continued to take overthe gaps that still remain.
The low level of human development in the State have inthe past been one of the factors that have acted as a drag in theimprovement in both economic growth performance as wellas rural poverty reduction. With the recent developments,especially in education, and innovative programmes thatfocus around decentralisation on the one hand and a rightsbased framework on the other, the coming years wouldundoubtedly improve the levels of human development inMadhya Pradesh.
Finally in order to better understand the inter-Statedimensions of progress, we look at the infrastructure
125
I N T E R S TAT E
Growth of Population in States of India,
1991-2001
Kerala
Tamil Nadu
Andhra Pradesh
Orissa
Karnataka
Himachal Pradesh
West Bengal
Chhatisgarh
Assam
Uttranchal
Punjab
INDIA
Gujarat
Maharashtra
Jharkhand
Madhya Pradesh
Uttar Pradesh
Haryana
Rajasthan
Bihar
0.0 0.5 1.0 1.5 2.0 2.5

endowments of the States. Poor infrastructure has alwaysbeen a handicap to growth. In the last decade, the importanceof adequate infrastructure has been widely recognised andemphasised. Favourable infrastructure endowments are nowseen as an important factor contributing to the attractivenessof the State for private investments.
Infrastructure is an area which backward States will neverbe able to address effectively without help from theGovernment of India. The fact remains that public policy atthe National level has not responded effectively to the infrastructure inde, inspits of commitments shown in various Places and Finance Commission documents. Poorinfrastructure has been impacting on the efforts to expandsocial opportunities as well avenues for increasing incomesand productivity.
The trends presented above indicate, in sum, that theState of Madhya Pradesh recorded rising but moderate levelsof growth during the period of its existence as an undividedstate, neither increasing nor decreasing its share in the national economy. The proportion of rural poverty in the statehas declined. The goal of population stabilisation is a long wayaway. In terms of human development indicators, while significant progress has been made on the literacy front in thelast decade, the overall relative position continues to bracketthe state in the group of heartland states with relatively poorer indicators. Wide infrastructure differentials remainbetween Madhya Pradesh and most other states.
IMPLICATIONS FOR THE STATE
The reasons as to why the gap between the leading States andStates like Madhya Pradesh is growing should be a concern fornational policy. It would not be possible for the country as awhole to realise the high growth rates projected for the TenthPlan and beyond unless the relatively lower growth rates inmajor States like MP are stepped up. The Approach Paper tothe Tenth Plan expresses this in the following words “It isimportant to recognise that the sharp increase in the growthrate and improvement of social indicators that is being con-templated for the Tenth Plan is possible only if there is a sig-nificant improvement in the growth rates of the slow growingStates. Indeed if the higher growth targets is sought to beachieved with a continuation of the low growth rates observedin some of the most populous States, it would necessarilyimply a very large increase in inter-state inequality with seri-ous consequences for regional balance and national harmony”.
Increasing the rate of growth of the economy of the stateis thus not only an imperative for the State but also for thecountry as a whole. There is a need to focus on ways andmeans to increase the rates of growth of the State significantly,aiming perhaps at a rate double the current one.
While increased growth rate would by itself contribute tosome extent to poverty reduction, as noted earlier, appropriatepublic policy initiatives for reduction in poverty by better land
and water management would help broad-base the benefits ofgrowth. The State would also need to concentrate on bothimproving infrastructure and the levels of human develop-ment, since both are interlinked in terms of delivery of servic-es as well as providing access to income earning opportunities.These areas prioritise themselves precisely because the Statelags behind in these, and because these areas are amenable topublic policy action.
However, public policy interventions need to be support-ed by adequate financial resources. These resources may bepublic or private. The aim should be for private investments tolead in the financing of the growth of economically productiveactivities in the State, whether in the industry, agriculture andservices sectors. Industrial growth depends upon availabilityof infrastructure support in the form of power, transport,communications, while agricultural growth depends on ruralinfrastructure such as irrigation, rural electrification, ruralroads. Public investments would need to be focused on humandevelopment, to expand opportunities for the people, and alsoon strengthening of infrastructure. These alone would makethe state attractive for private investment flows, much morethan any incentives that the government may provide.
Ideally, both Central and State sector public investmentsshould be directed as much as possible to build economic andsocial infrastructure in poorly endowed and less developedStates like Madhya Pradesh, to help remove constraints ongrowth and leverage private investments. The EleventhFinance Commission noted that “States with good infrastruc-ture are attracting private investments” and that “Centralinvestments should be redirected taking this fact in view”.
THE FINANCIAL AND DEVELOPMENTAL CHALLENGE
Whether it is to step up public investment in critical social and economic infrastructure sectors, or to attract private
I N T E R S TAT E
126
Tax/NSDP Ratios (News Series) Selected
States, 1998-99
9.5
9
8.5
8
7.5
7
6.5
6
5.5
5
Tam
il N
adu
Per
cen
tage
s
Gu
jara
t
Kar
nat
aka
Ker
ala
Har
yan
a
Him
ach
al P
rad
esh
Raj
asth
an
Pu
nja
b
Mad
hya
Pra
des
h

investment, it is necessary for the state to strengthen its fiscalposition. The States fiscal position is affected both by generat-ing more revenue as well as by managing expenditure better.Without embarking on a treatise on state finances, we presenthere a picture of the States finances, and compare them to performance with other states.
Before we do that, it is necessary to state two points. From1992/93, the State Government had made the human devel-opment sectors a priority area for government action. Thiskind of focussed prioritisation had reduced emphasis on othersectors. This did force the State to decrease investments ininfrastructure. Since 1998/99, with concerted action on socialsectors taking off, emphasis towards physical build up of thestate and reforms in key financial and infrastructures has nowstarted.
Madhya Pradesh has a relatively low tax base with forty
percent of the states income accruing from agriculture, min-ing and forestry. This puts constraints to the tax potential inMadhya Pradesh. There is not enough buoyancy in the rev-enue collections. Compared to other states, the ratio of tax toSDP (a standardized measure of tax effort) is low, as can beseen from the comparison of the figures for 1998-99 inGraph.
It must also be recognised that the State has far moreresponsibility towards development than the centre, and thefiscal crisis of the 1990’s led by the acceptance of recommen-dations of the Fifth Pay Commission has put the state in adock. To overcome both the impact of the fiscal crisis, and thelow tax base, the state had to resort to borrowings to cover itsdeficits. However, Madhya Pradesh has been a conservativeborrower. Table 8 clearly shows the Debt to SDP ratio ofMadhya Pradesh as being amongst the lowest in Indian states.
127
I N T E R S TAT E
Andhra Pradesh 19.08 18.46 18.70 18.54 19.18 20.29 20.95
Arunachal Pradesh 31.78 37.28 36.01 41.77 39.42 40.23 48.00
Assam 27.26 25.72 27.02 27.21 23.85 23.23 24.12
Bihar 32.43 32.12 34.85 32.50 32.30 33.14 35.31
Goa 42.47 39.65 35.44 31.20 32.57 34.21 35.54
Gujarat 18.33 15.96 16.16 15.93 16.78 18.13 18.95
Haryana 18.94 17.92 19.24 17.65 19.24 21.14 22.58
Himachal Pradesh 38.37 38.21 45.19 42.48 44.34 55.87 58.59
Jammu & Kashmir 57.38 55.19 48.83 51.31 50.04 47.98 47.15
Karnataka 16.32 16.63 16.44 16.27 16.58 17.48 18.94
Kerala 26.32 26.66 24.87 24.10 25.18 27.13 28.16
Madhya Pradesh 17.70 17.57 17.46 17.27 17.56 18.63 19.17
Maharashtra 11.99 11.79 10.83 11.56 12.29 13.08 13.92
Manipur 34.01 32.25 32.91 30.12 39.02 44.66 46.80
Meghalaya 19.34 22.12 20.53 21.87 20.87 23.35 26.71
Mizoram 15.49 47.75 47.04 56.31 50.46 58.39 59.76
Nagaland 39.21 39.36 44.41 45.55 48.58 50.92 50.36
Orissa 33.16 32.25 33.28 38.75 35.24 37.79 39.95
Punjab 33.59 33.60 33.80 32.33 32.29 34.58 34.89
Rajasthan 25.35 23.45 24.60 24.21 25.42 28.85 31.95
Sikkim 52.09 52.03 52.22 52.02 51.33 64.24 71.24
Tamil Nadu 15.82 15.72 15.51 14.88 15.45 16.41 16.77
Tripura 36.94 32.46 35.04 32.20 34.15 37.18 40.25
Uttar Pradesh 26.39 25.98 26.08 24.43 26.06 27.97 29.28
West Bengal 20.15 20.43 20.50 21.47 22.88 26.19 30.44
Total 21.54 21.01 20.89 20.71 21.39 22.98 24.33
State 1993-94 1994-95 1995-96 1996-97 1997-98 1998-99 1999-00 (B.E.)
GSDP figures are on the basis of information received from the CSO. These are for new series from 1993-94 to 1996-97 and thereafter EFC estimates
Source : Report of the Eleventh Finance Commission, Government of India
Table 8: Debt as percentage of State Domestic Product

Further, the share of Madhya Pradesh in the total debt ofIndian states has also been declining in the last seven to eightyears. The growth rate of the share in the case of MadhyaPradesh has been -1.33 percent between 1993 and 2000,with its share dropping from 5.84 percent to 5.27 percent (see Table 9).
The states off-budget borrowings have also been low, andwhile most other states have resorted heavily to such borrow-ings, Madhya Pradesh has used this source only off late andthat too in small measure. The need for investments in
infrastructure has led the state towards such borrowings,which include options such as bond roads.
In tackling the fiscal crisis, there has been some success inmeasures over the last six years. We have a case where the rev-enue deficit, the fiscal deficit and the primary deficit, all threehave reduced. The Table 10 shows that since 1998/99 the rev-enue deficit has almost halved, and primary deficit has gonedown even further.
The positive signs in reducing deficits have been helpedgreatly by a reduction on government bureaucracy over last
I N T E R S TAT E
128
Andhra Pradesh 6.59 6.98 6.99 7.11 7.03 7.04 7.06 6.86 0.42
Arunachal Pradesh 0.15 0.15 0.17 0.18 0.18 0.18 0.17 0.19 2.96
Assam 2.92 2.57 2.51 2.61 2.32 2.08 1.85 1.81 -6.53
Bihar 8.14 8.03 7.69 7.47 7.18 7.03 6.69 6.77 -2.95
Goa 0.63 0.60 0.54 0.51 0.49 0.47 0.46 0.45 -4.81
Gujarat 6.28 6.17 5.97 5.97 5.93 6.09 6.18 6.08 -0.20
Haryana 2.31 2.38 2.32 2.45 2.42 2.44 2.54 2.58 1.48
Himachal Pradesh 1.10 1.08 1.18 1.31 1.29 1.31 1.60 1.62 6.10
Jammu & Kashmir 2.53 2.42 2.10 1.92 1.91 1.87 1.68 1.50 -6.71
Karnataka 4.48 4.73 4.78 4.67 4.70 4.72 4.65 4.66 0.19
Kerala 4.00 4.10 4.25 4.28 4.30 4.37 4.33 4.26 0.96
Madhya Pradesh 5.84 5.83 5.60 5.57 5.55 5.43 5.48 5.27 -1.33
Maharashtra 9.97 10.13 10.00 10.08 10.42 10.60 10.69 10.88 1.30
Manipur 0.32 0.31 0.28 0.27 0.29 0.35 0.36 0.35 2.55
Meghalaya 0.18 0.20 0.22 0.21 0.20 0.21 0.23 0.24 3.05
Mizoram 0.18 0.21 0.21 0.22 0.26 0.24 0.24 0.23 3.58
Nagaland 0.35 0.32 0.32 0.34 0.33 0.36 0.35 0.33 0.43
Orissa 4.04 4.14 4.08 4.15 4.17 4.14 4.12 4.11 0.17
Punjab 5.70 5.82 5.75 5.63 5.43 5.40 5.42 5.19 -1.46
Rajasthan 5.18 5.41 5.46 5.66 5.84 5.82 6.03 6.24 2.49
Sikkim 0.12 0.12 0.12 0.11 0.11 0.11 0.13 0.14 1.46
Tamil Nadu 6.02 6.18 6.16 6.00 5.96 5.85 5.75 5.56 -1.28
Tripura 0.41 0.41 0.39 0.38 0.36 0.36 0.36 0.37 -1.96
Uttar Pradesh 15.74 14.72 15.91 15.77 15.97 15.96 15.65 15.19 0.09
West Bengal 6.82 6.99 7.00 7.13 7.36 7.57 7.98 9.12 3.59
Total 100.00 100.00 100.00 100.00 100.00 100.00 100.00 100.00
State 1993 1994 1995 1996 1997 1998 1999 2000 Growth Rate
(B.E) (‘93-‘00)
Note : Absolute figures of Outstanding Debt include Internal Debt, Loans from Centre, Provident Funds, Insurance Funds and Reserve Funds and Deposits
Source : Report of the Eleventh Finance Commission, Government of India
Table 9: Share of different States in total debt of All States

few years, which was enabled by a virtual stop to recruitmentin many areas and reduced intake in others.
A considerable impact has also been of decentralisation.The initiatives and new programmes in education and healthhas greatly helped here. While teachers and other ground pro-gramme staff are now managed by panchayats, communitymanaged programmes such as the Education GuaranteeScheme has reduced the salary burden of teachers, althoughtheir numbers have increased. Similarly, with panchayats andpeoples collective managing many programmes, it hasreduced the management burden on government staff, andalso reduced basic costs of implementation. Decentralisationmeasures are also good for better fiscal management.
The other improvement has come from reforms in manysectors. User charges in many sectors are today pitted almostequal to if not above the economic rate of return. In the power
sector, which was one of the biggest draws on state exchequer,reforms in user charges have taken them to their economicrate of return and this has helped greatly in debt control.
These signs indicate that measures in fiscal control aremaking their effect today. If the current scenario continues wecould expect some significant impact in the next 3-4 years.This will make available valuable resources need to raise ratesof growth and sustainably improve human development indicators.
The prescriptions for tackling the financial position arewell known. Many of these are already being implemented bythe state to positive effect. The solutions targeting and reduc-tion of direct and indirect subsidies, which include the levy ofadequate user charges for economic services; reducing thedrain on state finances due to mis-management of power sec-tor entities and loss making public sector enterprises: mod-ernisation of tax administration coupled with determinationto realise revenues due to the state and downsizing of the statebureaucracy to affordable levels is an acknowledged impera-tive, and some of these steps are already being put in place. InMadhya Pradesh, as in many other states today, there needsclarity of purpose whether government exists for the public orit exists for the public servants.
What is to be appreciated is that these problems are notjust “a fiscal problem” or something that relates to the FinanceDepartment of the State Government. This is first and fore-most a developmental challenge for the state. The resourcesavailable to a state like Madhya Pradesh, which started as oneof the backward regions of the country cannot match those ofthe developed regions. It is here that the PlanningCommission has failed poorer states in not addressing thegrowing inequality between states. Infact the outlays for thetenth plan in comparison to the ninth plan have in factdropped for poorer States, and this would in all probabilityworsen the already widening disparities.
129
I N T E R S TAT E
Rs in crores Actuals Actuals Actuals Actuals BE
Revenue Deficit -2871.80 -2932.26 -1319.34 -1466.50 -94.84
Fiscal Deficit -4126.72 -3911.38 -2712.11 -2182.44 -3249.02
Primary Deficit -2291.97 -1772.72 -301.33 -432.48 -830.88
Revenue Deficit as % of NSDP -3.64 -3.38 -1.56 -1.85 -0.11
Fiscal Deficit as % of NSDP -5.23 -4.50 -3.20 -2.75 -3.72
Primary Deficit as % of NSDP -2.90 -2.04 -0.36 -0.55 -0.95
Capital Expenditure 1009.83 950.07 1110.51 1454.51 2434.03
Capital Expenditure as % to NSDP 1.28 1.09 1.31 1.83 2.79
Parameter 1998-99 1999-2000 2000-01 2001-02 2003-03
Source : Department of Finance, Government of Madhya Pradesh
Table 10: Financial Parameters of Madhya Pradesh Government
Per Capita Plan Outlay of States,
2000-01 (Rs.)
1600140012001000
800600400200
0
15021375
11891018
918734 726 705 601
506319P
erce
nta
ges
Gu
jara
t
Kar
nat
aka
Mah
aras
htr
a
An
dh
ra P
rad
esh
Tam
il N
adu
Raj
asth
an
Ori
ssa
Wes
t B
enga
l
Mad
hya
Pra
des
h
Utt
ar P
rad
esh
Bih
ar
Source: Planning Commission

130

The district level human development index for MadhyaPradesh1 was first calculated in the Madhya PradeshHuman development Report 1995 and then subse-
quently in 1998. In both these years while some of the dataremained the same, there was a shift in methodology as itevolved both in the UNDP international reports and in accor-dance with data availability at the district level.
The district wise human development index and the gen-der related development index in this report also changes bothin the data it uses and the methodology. The districts HDIs inthe three MP reports are therefore not strictly comparable.
1. HUMAN DEVELOPMENT INDEX
The Human Development Index is a composite index com-prising of levels of human development in education, longevi-ty or health, and in access to opportunities measured in percapita incomes, with the present status of districts in theseparameters related with certain absolute achievement posi-tions, or some desirable achievement positions. This index is ameasure of how far a district has travelled, from a minimumlevel of achievement, and the path still to travel.
The index is calculated by the following formula:
HDIij (Index) = Valueij – Minj
Targetj – Minj
HDIij = Index of deprivation for the ith district for the jth
criterion.
Target j = This is the maximum achievable target for the jth
criterion (for example, it is 100 per cent for literacy).
Value ij = This is the value of the ith district for the jth
criterion.
Min j = This is the minimum value for the jth criterion (it is0% for literacy)
The methodology is illustrated later, with an example of Betuldistrict.
The criteria used for the district HDI and the methodol-ogy applied for the Madhya Pradesh Human DevelopmentIndex (MPHDI) for districts are given below. It needs to bementioned here that calculations for the indices and the dataused for such calculations should not be used in isolationfrom the index. Much of the district data used is relevant incomparing districts and may not be a proper indicator in iso-lation to the index.
1.1 EducationUNDP uses adult literacy rate (literacy of population 15 yearsand above) as one of the two parameters. The other parame-ter used in enrolment of children aged 6-14 years. Data for lit-eracy is now available for the year 2001 from the Censusundertaken, but this literacy pertains to population aged sixyears and above and appropriate data for ages 15 years andabove has still not been released by the Census. Taking litera-cy of ages six and above and enrolment rates of children agedsix to fourteen leads to double counting of the educationalattainment of the population aged six to fourteen as manychildren attending schools would also be literate. However, aswe do not have data to calculate literacy for 15 years andabove, we use the available data only.
Literacy rate for the population was calculated as percent-age share of all literate in a district over the total population ofpeople above 6 years of age in the district.
In the 1995 MPHDI, female literacy was given a weightgreater than male literacy for the literacy index. However, thisyear since a separate Gender Development Index has also beencalculated to assess the relative level of development of womenvis-à-vis men, the literacy index used now does not give anyextra weight to female literacy.
For the target maximum figure for the purpose of calcu-lating the Index of Deprivation in literacy, we use 100 per centthis time, as against 80 percent used in 1995. The minimumrate is taken as 0 percent.
The second component of education is the combinedschool level enrolment. The figures for children enrolled in
Technical Notes on the Human Development Index
131
1 It pertained to the undivided state of Madhya Pradesh, which included the newly carved state of Chhattisgarh.

schools in 2000 have been provided by the Rajiv GandhiShiksha Mission, Government of Madhya Pradesh. These rateshave been calculated from a state wide child to child, habita-tion to habitation survey of children under the Lok SamparkAbhiyan.
The enrolment figures in some cases have exceeded theestimated for population in age group 6-14 years. In suchcases we have taken the enrolment rate to be 100 percent.
The target maximum for this enrolment has been taken at100 percent, and the target maximum is 0 percent enrolment.
The two indices of literacy and school level enrolmentwere combined to get the Index of Deprivation for Education.The indices were combined in a weighted average, with 2/3 forliteracy and 1/3 for all children in schools. A higher weight forliteracy was taken to give importance to this most essential cri-terion and keeping in mind the problems of data in enrolmentfigures.
1.2 HealthLife Expectancy is the single criteria to assess the health status. In 1995, data for Life Expectancy was not available for all the districts and hence, Infant Mortality Rates were used for the year 1981 based on Census Fertility tables.Since then, Census has released Fertility tables for 1991 that permits us to arrive at indirect estimates for LifeExpectancy at birth for districts. The indirect estimates for1991 were arrived at using methodology applied by Census forcalculating mortality tables for 19812. This is explained indetail later in this chapter. These estimates are subject to cor-rections, after final fertility tables are released, and Censuspublishes estimates for Life Expectancy based on this data,however these are not yet available to us. Census had releasedestimates for child mortality in 1991, but is yet to publish esti-mates for Expectancy of Life at the time of the publication ofthis report.
No data has been released from the 2001 census, whichwould help us in making estimations on either the InfantMortality Rate or the Life Expectancy in the districts ofMadhya Pradesh in 2001. However, we do have the lifeexpectancy of the state as a whole and for its regions fromNational Sample Surveys Regional estimates. We used theseregional estimates and the state level estimates to project dis-trict level life expectancies in the state from 1991 to the year2001.
For the maximum target, a figure of 85 years was taken,and for the minimum value, figure of 25 years was applied tocalculate the Health Development Index.
1.3 IncomeThe UNDP HDI uses ‘adjusted per capita income for coun-tries’ to calculate the Index of Income. The State Governmentdoes not calculate district per capita incomes or districtdomestic product in Madhya Pradesh. Since it is extremelydifficult to assess district domestic products directly, andthereby come to an assessment of per capita income, we haveused district incomes derived from the net state domesticproduct (NSDP) for our use.
Data for calculating the district domestic product (DDP)is not available to enable a district – to – district calculation.The state domestic product is calculated under 16 categoriesby using sources from the State’s own production and economic activities (such as, for agriculture, fisheries,forests, electricity etc). Estimation of the volume of productsis done from different sources using centrally administeredsurveys by the Central Statistics Organisation (CSO), AnnualSurvey of Industries (ASI), etc. (for Railways, Industry,Unregistered Manufacturing, Gas, Water) and a mix ofvarious sources. Unfortunately this is not available for dis-tricts, and we have to resort to other means to divide the SDPdistrict wise, under the 16 major categories. Further, while theState Domestic Product is a sum of estimates in 16 differentcategories, many of these 16 are a sum of different compo-nents. Unfortunately, no information of the break up of the 16categories into its sub-categories was available. This was amajor constraint in arriving at estimates for relative strengthsof districts in per capita incomes. The Department ofEconomics and Statistics has recently undertaken the task ofpreparing district income estimates, but the data is not yetready3. This prevented us from more valid estimates for district and per capita incomes. However, the methodologyadopted for arriving at district and per capita incomes is a“best possible” attempt by us, drawing on the methodologyused by the Department of Economics and Statistics to arriveat State level figures, and applying it to the district level.The basic methodology suggested by CSO was also appliedwherever possible.
A note of caution is necessary here. Calculating districtlevel incomes is a difficult task given the lack of data at thislevel of dis-aggregation. What was needed for developing anindex based on income was to get district level figures thatwould indicate the relative strength of districts in terms of percapita incomes drawn from estimates of share of districts tothe state and NSDP. In the absence of such data across all thecategories for the NSDP, the income index for the MPHDIrelies on various surrogate measures. The income component
T E C H N I C A L N O T E S
132
2 The methodology has been taken from ‘Indirect Estimates of Fertility and Mortality at the District Level, 1981, Occasional Paper No. 4 of 1994, Office of Registrar General of India.
3 The CSO has issued instructions to States to calculate their District Domestic Products, along with suggested methodology. The methodology is drawn from the successful experi-
ence of assessing District Domestic Products by the States such as Kerala, Uttar Pradesh, and Rajasthan for the past two decades. Madhya Pradesh Government has now undertaken
this task.
for the MPHDI should in no way be taken as calculations forthe district domestic product. The district shares of NSDP,and the per capita derived from these estimates are neither asubstitute nor a surrogate for district domestic product andper capita incomes from it, but only a comparable figure fordistricts for this report.
The State NSDP is calculated under the 16 categories,using different methods for each category. Much of the calcu-lations and adjustments are made on the basis of estimatesand data from CSO and other studies, and applied to Statelevel data, to arrive at State level estimates. For example, inunregistered manufacturing estimates of value added forunregistered manufacturing for five digit level of NIC isderived from the 1984-85 survey of directory manufacturingestablishments (DME), non-directory establishments (NDE),and Own Account Enterprises (OAE). The Industry wise esti-mates are adjusted by moving them backwards and forwardsfor the current years estimates. Since district level figures forDME and NDE are not available separately and or under five-digit levels, we attempted to estimate district shares of unreg-istered manufacturing by using data on Establishments andOwn account enterprises available district wise (rural andurban) form the provisional results of the Economic Census1990 (though the results of the survey are not officiallyreleased we have used the data only for our estimates and datafrom the 1999 Economic Census has not been released for ouruse). Similarly, calculations for district shares are somewhatrelated to or correspond to, wherever possible, the methodol-ogy of the NSDP.
For some categories like agriculture, industry, mining,forestry, banking and public administration fairly good dis-trict level indicators were available that were used to distributethe domestic products of these categories along districts.Using different indicators, share of districts (in percentage) tothe specific domestic product was estimated, and this sharewas applied to the domestic product of that category to arriveat district level domestic product for that category.
For other categories, we used data for employment, ownaccount enterprises and establishments, etc. to arrive at dis-trict level shares.
The methodology used for the major categories is givenbelow. In all, 95.31 per cent of the net state domestic productfor 2000-2001 was allocated to districts on these lines. Theshare of the 16 categories of NSDP is given in what follows.
1. Agriculture (including Animal Husbandry)Data was not available for agriculture, horticulture and animalhusbandry separately. To estimate district shares of agriculture(including livestock production), district wise production ofall major produce such as cereals, pulses, oilseeds was takenand states average prices for these were applied to get the dis-trict production in price for agriculture. The agriculturedomestic product was then divided along districts according
to the share of each district to the total production (in price)in cereals, pulses and oilseeds.
2. Forestry and LoggingIncomes from Forestry and Logging were not used in 1995,due to lack of data. While there is no data available to esti-mates districts share in the domestic product of Forestry andLogging, we have used surrogates instead. Figures for area ofdistricts under forests and forest revenue accruing to the Statefrom forestry from the districts were used. The share of areaunder forests for every district to total area of State underforests was given two thirds weight and contribution of dis-trict to total revenue from forestry of the state was give onethird weight. The combined weights arrived at were applied toforests contribution to State Domestic Product.
3. FisheriesData on district wise fish production, the value of fish, andother fishery related data was available from the fisherydepartment, and the domestic product corresponds largely tothese figures. Fisheries domestic product was allocated to dis-tricts accordingly.
4. Mining and QuarryingData on production and value of production as well as royal-ty and cess from all major and minor minerals in the state wasavailable district wise. The share of each district to the totalproduction value, and revenue from mining was taken andapplied to the mining and quarrying domestic product of thestate to arrive at district wise figures.
5. Manufacturing – RegisteredIn Small Scale Industries (SSI), we had data on district wisenumber of small units (SSI) and investments in them to date,and current employment. The Annual Survey of Industriesgave district wise data on SSI units, employment, fixed invest-ment and gross and net value added. For assessing contribu-tion of SSI per district, we did a regression analysis betweennet value added (dependent variable) and units of SSI andfixed investment (independent variables). Using this equation,we arrived at an estimate of net value added by SSIs in eachdistrict for 1991-92, and the share of each district to this over-all estimated SSI net value added was taken as the share of dis-trict SSIs to total SSIs contribution to the registered manufac-turing domestic product.
Data was difficult for turnovers and outputs in the large and medium scale industries (LMI) sector. Available data gave us annual district wise large and medium scaleindustry investments, with current employment. We calculated the share of each district to LMI contribution toregistered manufacturing domestic product by first adjusting the total LMI investment to the price levels of1950-51, using the wholesale price index for industrial
133
T E C H N I C A L N O T E S

products. This was used to measure the district wise investment in LMI. We estimated from field work, data avail-able from surveys and regression analysis form availableturnover and output data, the relative contribution of data ofLMI units, employment and investment (adjusted) to totalLMI sector. According to this estimate, LMI units was multi-plied by a factor of 2, investment by 4 and employment by afactor of 1, and the weighted average of the total gave us acomparable column of data to calculate district wise shares ofLMI. The share of each district in this table was taken to be theshare of districts to LMIs share of registered manufacturingdomestic product.
The SSI and LMI weighted share was taken togetherassigning a weight of 4 to LMI and 1 to SSI and share of dis-tricts to total states was applied to state domestic product inmanufacturing – registered.
6. Manufacturing – UnregisteredFor NSDP, unregistered manufacturing is calculated by usingnet value added from the 1984-85 survey on directly manu-facturing establishments, non-directly establishments, andown account enterprises, which gives data for digit level underthe NIC classification. District wise distribution of DME andNDE is not available and, data on establishments is not avail-able below 1 digit NIC.
We took data for unregistered manufacturing from theEconomic Census 1990 (provisional for Madhya Pradesh).The Economic Census gives district-wise number of ownaccount enterprises (non-agriculture) and establishments inmanufacturing. No data was available to get a share of OAE,and establishments to unregistered manufacturing. We addedup the number of OAE to establishments for every district.The resultant sums were divided by the total number of OAEand establishments in the state, to get percentage shares foreach district. These shares were assumed to correspond to dis-trict shares of the domestic product of manufacturing-unreg-istered. This share was applied to manufacturing unregistereddomestic product to arrive at district shares.
7. ConstructionIn construction district level data was scarce, and whereveravailable was not consistent or available in all districts. In theabsence of such figures we had to resort to the provisional datafrom the Economic Census 1990.
Taking figures of Own account enterprises in construc-tion, they were added to the number of establishments in con-struction in each district. The sums were divided by the totalnumber of OAE and establishments in construction in thestate. The shares so arrived at were taken as its share in con-struction domestic product.
8. Electricity, Gas and WaterNo satisfactory estimates could be developed due to absence of
disaggregated data especially for gas and water, and this cate-gory was thus left out.
9. RailwaysNo data was available to estimate district wise share inRailways. The state level estimates are provided directly by theCentral Statistical Organisation, and there was no basis avail-able with us to allocate state income from Railways to districts.Data on trains, railway lines and stations were not available formost districts, disabling us form making any kind of assess-ment.
10. Transport by Other Means and StorageThe assumption here is that the value of Transport andStorage should correspond to the vehicles and the revenuefrom transport from a district. The average of share of eachdistricts total vehicles to all vehicles in the state and vehicleson roads to total vehicles on road in the state was taken, andcombined in equal weight with the total revenue contributedby the district to total revenue from transport in the State. Theshare so arrived at was multiplied to contribution ofTransport by Other Means and Storage to NSDP. This sectionwas not assessed in 1995.
11. CommunicationNo data was available to satisfactorily assess district share incommunications.
12. Trade, Hotels and RestaurantsDomestic product from Trade, Hotels and Restaurants wasdistributed amongst the districts on the basis ofEstablishments and Own Account Enterprises in each districtin Wholesale Trade, Retail Trade and Hotels and Restaurants,according to the Economic Survey 1990.
13. Banking and InsuranceBanking and Insurance domestic product was divided on theshare on each district on the deposits and loans in each districtover the last five years.
14. Real Estate, Ownership of Dwellings and Business ServiceNo satisfactory data was available for this category.
15. Public AdministrationThis was based upon estimates of expenditure on PublicAdministration by the State Government, and strengths of theemployment of state administration employees in each dis-trict, based on actual salaries given to permanent and tempo-rary employees. Since there was a high positive correlationbetween the two, share of salaries of government employees tototal salaries of government employees in Madhya Pradeshwas used. This share was applied to contribution of PublicAdministration to NSDP to get estimates for districts.
T E C H N I C A L N O T E S
134

16. Other ServicesFigures for employment under other services were taken fromthe 1991 Census. The employment figures were divided by thetotal employment in other services in Madhya Pradesh toarrive at district shares and these shares were applied todomestic product from other services to arrive at district fig-ures.
1.1.3.2 Adjusted IncomesBy themselves, the estimates for per capita incomes does notgive an idea of the distortions in distribution or the levels ofpoverty in the districts, and the depth of deprivation of thepoor. UNDP for their income component of the HumanDevelopment Index, used the Aitkinson’s formula to adjustincomes, based upon marginal utility of incomes. This adjust-ment reduces the impact of very high incomes in some dis-tricts, and makes district more comparable to each other toassess relative levels of achievement in incomes. However, oneproblem with this method was that it discounted incomesabove a threshold level (minimum level) quite drastically. TheUNDP HDI, now uses a different method of adjusting pover-ty. The same method has been used to discount incomes forour district human development indices.
Income is discounted by using the following formula :
Income Index =log y – log ymin________________
log y max – log y min
y: income of the districtymin: Minimum incomeymax: Maximum target income
For a minimum income level and we calculated districtwise poverty line by taking the poverty line developed by thePlanning Commission based upon per capita monthly expen-diture separately for rural and urban and adjusted to 1991–92prices. To arrive at the district poverty line, we took a weight-ed average of rural and urban population with the adjustedrural and urban poverty line. The per capita incomes calculat-ed for each district were divided by the resultant poverty linefor each district, the product indicating the number of timesdistrict per capita was to the poverty line.
The three indices of development for health, educationand income are then combined in a simple average to get theHuman Development Index.
1.4 Calculation of HDI for Betul
EducationIndex for literacy of Betul:
Target for literacy = 100.0 per cent
Minimum literacy = 0.0 per centLiteracy of Betul = 66.9 per cent
The calculation is:
66.9 (Literacy in Betul) – 0.0 (Minimum Literacy)
100 (Target Literacy) – 0.0 (Minimum Literacy)
Therefore, Index for Betul in literacy = 0.669
Similarly, the enrolment rate of children in Betul aged 6-14 years -
Index for Enrolment of Betul:
Target for Enrolment = 100.0 per centMinimum Enrolment = 0.0 per centEnrolment in Betul = 93.9 per cent
The calculation is:
66.9 (Enrolment in Betul) – 0.0 (Minimum Enrolment)
100 (Target Enrolment) – 0.0 (Minimum Enrolment)
Therefore, Index for Betul in Enrolment = 0.939
These two are combined with a weightage of 1/3rd to enrol-ment and 2/3rd to Literacy giving the Education DevelopmentIndex-
(2/3) x 0.669 + (1/3) x 0.939 = 0.446 + 0.313 = 0.759
HealthIndex for Life expectancy of Betul :
Target for Life expectancy = 85 yearsMinimum Life expectancy = 25 yearsLife expectancy in Betul = 54.7 years
The calculation is :54.7 (Life Expectancy in Betul) – 25.0
(Minimum Life expectancy)
85.0 (Target Life Expectancy) – 25.0 (Minimum Life Expectancy)
Therefore, Index for Betul in literacy = 0.494
IncomeTarget for Maximum per capita income = Rs 35,705 (the percapita income of Delhi)
135
T E C H N I C A L N O T E S

Minimum per capita income = Rs 4,933/- (the per capitaincome for the income based poverty line)
The per capita income estimated for Betul for 1999/2000 wasRs 10,035/-
Income Index =log 10035 – log 4933
=4.001 – 3.693
= 0.359
log 35705 – log 4933 4.553 – 3.693
y: income of the districtymin: Minimum incomeymax: Maximum target income
Human Development IndexCombining the three indices and taking their average we get
HDI of Betul (average of the three indices) = (0.759 + 0.494 + 0. 359) = 0.537
2.0 Gender Development Index4
The Gender Related Development Index (GDI) uses the samevariable as the HDI. The difference is that the GDI adjusts theaverage achievement of each district in life expectancy, educa-tion attainment and income in accordance with the degree ofdisparity in achievement between woman and man. It is basedon the GDI developed by UNDP, used first in the HumanDevelopment Report in 1995.
For the gender sensitive adjustment, we use a weightingformula that express a moderate aversion to inequality, settingthe weighting parameter equal to 2. This is the harmonicmean of the male and the female values.
The harmonic mean is calculated by taking the reciprocal of the population weighted arithmetic mean of thefemale and male achievement levels (which are themselvesexpressed in reciprocal form). Although this may sound complicated, the basic principle is straight forward. The harmonic mean will be less than the arithmetic mean to thedegree that there is disparity between male and femaleachievement.
2.1 Educational AttainmentThe variable for educational attainment is a composite index.It includes adult literacy, with a 2/3 weight, and gross com-bined primary, secondary and tertiary enrolment with a 1/3weight. Each of these sub components is indexed separately.Both indices use a maximum value of 100 percent and a min-imum value of 0 percent. The two indices are added togetherwith the appropriate weights to form the composite index foreducational attainment.
2.2 Longevity
The first step in the calculation of the GDI is to index the vari-able for life expectancy and education attainment. The esti-mates for life expectancy were calculated using Census ofIndia 1991 fertility tables, as explained earlier in this chapter.Although the range for life expectancy is same for the womenand men (60 years), the maximum and the minimum valuesare different. The value (or “fixed goal post”) for male lifeexpectancy is 82.5 years and the minimum value is 22.5 years.For female life expectancy the maximum value is 87.5 yearsand the minimum 22.5 years. The values for women and menare indexed accordingly.
2.3 IncomeThe calculation of the index for the income is more involved.In calculating the female and male shares of earned income,we used two pieces of information: the ratio of the averagefemale wage to the average male wage and the female and malepercentage shares of the economically active population.
The ratio of the average female wage to the average malewage is not available for the state or the districts. The ratio isassumed to be the average ratio for the agricultural sector aswell. The ratio of the female to the males was assumed to aver-age to 67% based upon some recently conducted povertyassessment surveys.
The ratio is crude proxy for gender income differentials inpaid work. These approximations for wages need to beimproved and assessed for each district, but due to lack ofproper information for all districts, the same ratio was appliedacross the State. Apart from possible under estimating themale-female wage differential, the figure of 67 percent alsodoes not account for the fact that women were more as casuallabour and as marginal workers, working for less than 183days a year. Men on the other hand work primarily as mainworkers (gainfully employed for 183 days or more per year).The ratio of 67 % also does not account for income disparitiesbased on non-labour resources, such as land and physical cap-ital. However, in the absence of better data we use this figure.
The next step in calculating gender disparity in incomeuses available information on the percentage share of men andwomen in economically active population. Because of the lackof data on employment of gender, this procedure make sim-plifying assumption that female employment and maleemployment are proportional to female and male participa-tion in labour force. We have two choices here : one is to takethe workforce participation ratio (WPR), which includesmain and marginal workers, and the second is to take onlymain workers, where the ratio of male to female main workersis very high. We choose to take main and marginal workers, forthe sake of corresponding to the general WPR terms used to
T E C H N I C A L N O T E S
136
4 This note has been taken from the Technical Notes describing the methodology for Gender Development Index from the Human Development Report – 1995, Technical Notes 1.
Computing gender-equity-sensitive indicators, UNDP
∋

assess participation of people in the workforce. From the ratioof female to male wages we can derive two ratio: the ratio ofthe female wage to the overall average wage and the ratio ofthe male wage.
These total ratio are derived from the following definitionof the total wage bill (WL):
WL=WfLf + MmLm
where W is the average wage and L is the total labour force, andthe f subscript denote female, and m subscript denotes male.
Dividing the equation through by WmL, we can solve forW/Wm
W/Wm = (Wf/Wm) (Lf/L) + (Wm/Wm) (Lm/L)we take the reciprocal of this result to solve for Wm/W. We cannow also solve for Wf/W
Wf/W = (Wf/Wm) / (W/Wm)
a rough estimate of the female share of income can then bederived by multiplying the ratio of the of the average femalewage to the overall average wage of the female share of theeconomically active population. The male share of the incomecan be calculated in the same way or by subtracting femaleshare from 1.
The third step in estimating disparities in the income is tocalculate the female and the male share of the population. Theadjusted per capita incomes are then discounted on the basisof the gender disparity in proportional income share. In usingadjusted per capita incomes, we are already taking in accountthe diminishing marginal importance for human develop-ment of the additional income above the average world percapita income. Up to this point, the methodology is the sameas that used for the human development index.
The discounting for the gender disparity is calculated asfollows. We form two proportional income shares by dividingthe female and the male shares of income by the female andmale shares of the population if there were gender equality,each proportional share would be equal to 1. We have applythe gender-equity-sensitive indicators (GESI) methodology of(1- ) averaging - with equal to 2 in this case-to the two pro-portional income shares to derive the “equally distributed pro-portional income share”. The more gender inequality there is,the lower this ratio will be related to 1. We then multiply theadjusted per capita incomes by the equally distributed pro-portional income share to derive a measure of per capitaincome that, in effect, is now discounted for gender inequali-ty. If there were no gender inequality, the ratio would be equalto 1 and per capita incomes would remain the same. As in theHDI, adjusted per capita income is proxy for access to basicresource necessary for human development. Finally, we indexthe adjusted per capita incomes for men and women withrespect to maximum and minimum similar to those used inthe HDI.
Income Index = log y – log ymin_______________
log ymax – log ymin
y: Income of the districtymin: Minimum incomeymax: Maximum target income
The equally adjusted income index is given by :[female population share x (adjusted female per capita)-1 +male population share X (adjusted male per capita)-1]-1
The last step in the calculating the GDI is to add index forthe income that we have just derived to the indices for lifeexpectancy and the educational attainment and divide by 3.That gives each index a one third weight.
137
T E C H N I C A L N O T E S
∋

D I S T R I C T FA C T S H E E T S
138
Human Development Index (HDI) 0.580
Rank in Madhya Pradesh : HDI 15
Gender Related Development Index (GDI) 0.598
Rank in Madhya Pradesh : GDI 7
Human Development Indices - 2002
Area (in sq. km) 9229
Total Inhabited Villages 1269
Total Habitations 3281
Forest Villages 89
Towns (Class I to IV) and Major Towns 6
Balaghat
Crop Zone:
Rice Zone
Soil type:
Red and Yellow Soil
Agri Climatic Zone:
Chhattisgarh Plains
Schedule V Areas:
All Blocks of Baihar Tehsil
Basic Details on the District
1981 1991
Infant Mortality Rate 133 110
1991 2001
Life Expectancy (years) 55.0 58.5
1976-81 1984-90
Crude Birth Rate 32.3 32.8
Health
Janpad Panchayats 10
Gram Panchayats 665
Tehsils 7
Tribal Blocks 3
Legislative Assembly Seats 8
Administrative Information
0.5800.769
0.5580.415
0.000
0.200
0.400
0.600
0.800
1.000
Graph on Human Development Index
All 19.00 5.85
Rural n.a. 1.28
Urban n.a. 49.4
Decadal Growth (%) 1981-91 1991- 00 1991 1998-99
Per Capita Food Production (in kgs.) 258.15 272.28
1996 2000
FPS per lakh population 29.79 31
Food
B A L A G H A T
HDI Education Health Income
1991 2001
Population 1365870 1445760
Share of Madhya Pradesh Population 2.81% 2.39%
Urban Population 9.5% 13.4%
Population of Scheduled Castes (SC) 8.3% n.a.
Population of Scheduled Tribes (ST) 21.9% n.a.
Density of Population (per sq. kms.) 148 157
Demography
BALAGHAT

139
D I S T R I C T FA C T S H E E T S
1991 2001
Worker Participation Rate:
All 49.8% 50.2%
Rural 51.8% 52.9%
Urban 30.2% 33.1%
Share of Primary Sector (%) 83.5% n.a.
Share of Secondary Sector (%) 7.8% n.a.
Share of Tertiary Sector (%) 8.62% n.a.
Employment in Registered Industries (2000) 8194
Employment Rate of Growth (1991 to 2001) n.a. 6.8%
Total Employment in Farm Sector (%) 82.1% 78.48
Rural Employment in Non Farm Sector (%) 14.0% 16.2%
Agriculture Labour (%) 27.5% 38.9%
Employment
2001
Middle Schools per lakh population 29.5
High Schools per lakh population 17.1
Rural Population per Primary Health Centre 35767
Population Serviced Sub Health Centre 4377
2000
Road length per 100 sq. km. (1999) 30.5
Telephone per lakh population 712
Population per Post Office (1994-95) 6708
Registered establishments under Factories Act (1997) 258
Per capita consumption of electricity (non industrial) in kwh 120.8
Infrastructure / Facilities
1991 2001
Life Expectancy of Females at Birth 54.7 58.1
Child Sex Ratio 975 974
Girl Child Mortality (birth to age 1 year) 147 n.a.
Girl Child Mortality (up to age 5 years) 172 n.a.
Total Fertility Rate 4.2 n.a.
Gender Ratio : All 1002 1022
Rural 1009 1030
Urban 937 972
General non SC/ ST Gender Ratio 994 n.a.
SC Gender Ratio 1024 n.a.
ST Gender Ratio 1021 n.a.
Workers Participation Rate - Female 45.5% 46.2%
2000
Female Enrolment Rate (Ages 6-14) 92.3%
Gender
Estimated Poverty Rate (1993-1994) 45.3%
Children as main workers (1991) 5.0%
Children as main and marginal workers (1991) 6.7%
Percentage of safe deliveries (1998-1999) 29.4
Percentage of children fully immunised (1998-1999) 90.4
Deprivation
1991 2001
Literacy (%) : All 53.2% 68.8%
Male 67.6% 81.1%
Female 39.0% 57.0%
Rural 50.8% 66.6%
Urban 75.7% 82.6%
Access to Education 2000
Enrolment Rate (Ages 6-14) 94.4%
Gross access ratio at primary level 100.0%
Habitations with Primary Schools 100.0%
Education
Habitations with SDW facility 100.0%
Habitations without 40 lpd water availability 0.0%
Number of villages electrified 1170
Percentage of villages not connected with pucca roads 46.2
1991
Households without access to electricity, SDW and toilet facilities 40.82
Basic Amenities
1999
Per Capita Forest Area (in hectares) 0.330
Annual Rate of Afforestation (%) (1993-1999) -0.69
Major Non-Timber Forest Produce :
Tendu Leaves, Harra, Charota Seeds, Sal Seeds
Forests

D I S T R I C T FA C T S H E E T S
140
Land Use Classification in 1998-99
1978 1998
Net Area Sown (in 000' ha.) 275.4 272.8
Gross Cropped Area (in 000' ha.) 374.8 343.7
Double Cropped Area to Net Area Sown 36.1 26.0
Net Irrigated Area (in 000' ha.) 113.7 121.4
Gross Irrigated Area (in 000' ha.) 124.1 137.5
1992-93 1998-99
Agriculture Intensity 127.8 126.0
Agriculture and Land Use over
30 Years
1978 1998
Net Sown Area to Total Geographical Area 29.9% 29.5%
Gross Cropped Area to Total Area 40.6% 37.2%
Net Irrigated to Net Sown Area 41.3% 44.5%
Cropped Area under Food Grains 86.0% 90.9%
Yield of Food Grains (in kg. per hectare) 1096 1246
Per Capita Food Production (in kgs.) 272.3
Land Use and Agriculture
2000
Credit-Deposit Ratio 49.53
Commercial Banks (per 1000 population) 0.04
Crop lending per hectare of cultivated land 677.3
Crop lending per hectare of irrigated land 1893.6
Credit
2001
Number of towns reporting slums 6
Urban population residing in slums 2.24%
Level of ground water development 8.67
Average annual rainfall (in mm) 1623.20
1995 2000
Percentage area under wasteland 3.3% 6.54%
Habitat
1991 1998-99
Cereals Per Capita (Kg) 243.5 259.7
Pulses Per Capita (Kg) 14.6 12.6
Oilseeds Per Capita (Kg) 7.2 6.8
Average Landholding (Ha) 1.5 1.35
Gross Irrigated Area ('000 Ha) 137.5
Fertiliser Consumption Per Hectare (Kg) 25.5 32.74
1993 1999
Cropping Intensity 128 126.0
Land Use and Agriculture
Lorenz Curve of Operational Holdings
Cumulative percentage of Land Holdings
0.00 0.25 0.50 0.75 1.00
1.00
0.80
0.60
0.40
0.20
0.00
Cum
ulat
ive
perc
enta
ge o
f Lan
d Ar
ea
Net AreaSown(30%)
Fallow Land (3%)
CultivableWasteland(3%)
OtherUncultivable
Land excludingFallow Land
(4%)
Land NotAvailable for
Cultivation(6%)
Forest (54%)
NA = not available

141
D I S T R I C T FA C T S H E E T S
% Net % GrossName of Block Total Net Sown Gross Per capita Agriculture irrigated area to Irrigated area to Level of GW Status of
Cropped Area Cropped Net Sown Area Intensity Net Sown area total cropped area Development ground water
Balaghat 604.01 46.0% 59.0% 0.2 128 37.77 29.98 7.727 White
Lanji 764.25 46.8% 64.1% 0.25 137 50.09 36.57 13.593 White
Kirnapur 699.35 43.9% 60.8% 0.21 139 31.44 24.72 11.200 White
Baihar 782.64 35.7% 39.1% 0.41 109 6.95 10.13 3.210 White
Paraswara 563.28 40.8% 45.1% 0.31 110 11.02 11.58 5.816 White
Birsa 1139.83 30.0% 32.1% 0.27 107 15.09 15.98 2.947 White
Waraseoni 453.24 62.0% 85.4% 0.22 138 74.25 56.55 15.083 White
Khairlanji 457.59 59.9% 85.4% 0.2 143 59.84 46.06 9.705 White
Lalbarra 479.45 73.0% 98.8% 0.26 135 61.97 54.45 9.353 White
Katangi 564.03 50.0% 63.1% 0.21 126 59.89 54.48 10.537 White
Name of Block SC ST Road length Villages connected by all Population serviced per
per 100 sq.kms. weatherroads post office (1993-' 94)
Balaghat 8.1 19.7 35.1 50.00 5132
Lanji 7.6 18.2 21.46 72.18 6138
Kirnapur 9.3 7.7 21.49 26.28 7516
Baihar 2.9 64.1 11.75 28.99 3404
Paraswara 3.7 52.1 14.02 20.63 3768
Birsa 4.1 49.1 11.84 88.13 7809
Waraseoni 12.1 12.5 32.21 59.21 6991
Khairlanji 11.6 7.8 38.68 77.78 4766
Lalbarra 7.5 13.8 16.68 82.57 12413
Katangi 11.6 13.5 39.89 60.98 4718
Population in 1991 Infrastructure (in percentage) (1991)
Sex ratio Agriculture Worker labourers in participation
Name of Tehsil* Total Rural Urban Urbanisation Total Rural Urban Female All Child workers (%) ratio
Waraseoni 392019 367262 24757 6.3% 71.2% 70.2% 85.6% 60.0% 1025 957 39.41 52.00
Balaghat 236484 145777 90707 38.4% 76.4% 69.6% 87.0% 66.6% 995 978 34.20 41.67
Baihar 336955 282121 54834 16.3% 59.3% 56.1% 75.0% 47.0% 1029 1011 38.73 50.73
Lanji 159621 159621 - - 69.8% 69.8% 0.0% 57.5% 1037 967 44.74 52.75
Kirnapur 154394 154394 - - 69.7% 69.7% 0.0% 57.8% 1027 963 40.46 53.71
Katangi 166287 142680 23607 14.2% 69.2% 67.4% 79.9% 57.6% 1023 943 36.02 51.73
Population Literacy Select Gender EmploymentIndicators
Agriculture and Irrigation Status ofGround Water
*Data for Tehsil Rithi not available separately as it was formed on 18.7.01

D I S T R I C T FA C T S H E E T S
142
Human Development Index (HDI) 0.422
Rank in Madhya Pradesh : HDI 44
Gender Related Development Index (GDI) 0.488
Rank in Madhya Pradesh : GDI 37
Human Development Indices - 2002
Area (in sq. km) 5422
Total Inhabited Villages 714
Total Habitations 3932
Forest Villages 142
Towns (Class I to IV) and Major Towns 6
Sendhwa, Barwani
Crop Zone :
Cotton Jowar
Soil type :
Medium Black (Medium)
Agri Climatic Zone :
Nimar Plain
Schedule V Areas :
Entire Barwani District
Basic Details on the District
1981 1991
Infant Mortality Rate n.a. n.a.
1991 2001
Life Expectancy (years) 55.4 59.6
1976-81 1984-90
Crude Birth Rate n.a. n.a.
Health
Janpad Panchayats 7
Gram Panchayats 383
Tehsils 6
Tribal Blocks 0
Legislative Assembly Seats 4
Administrative Information
0.4220.513 0.576
0.177
0.000
0.200
0.400
0.600
0.800
1.000
Graph on Human Development Index
1991 2001
Population 832422 1081039
Share of Madhya Pradesh Population 1.71% 1.79%
Urban Population 15.1% 14.6%
Population of Scheduled Castes (SC) 6.9% n.a.
Population of Scheduled Tribes (ST) 64.8% n.a.
Density of Population (per sq. kms.) 154 199
All 26.30 29.87
Rural n.a. 30.65
Urban n.a. 25.49
Decadal Growth (%) 1981-91 1991- 00 1991 1998-99
Per Capita Food Production (in kgs.) 207.58 169.69
1996 2000
FPS per lakh population n.a. 19
Food
B A R W A N I
HDI Education Health Income
Demography
BARWANI

143
D I S T R I C T FA C T S H E E T S
1991 2001
Worker Participation Rate :
All 47.5% 48.4%
Rural 50.2% 50.9%
Urban 32.1% 33.8%
Share of Primary Sector (%) 86.8% n.a.
Share of Secondary Sector (%) 3.9% n.a.
Share of Tertiary Sector (%) 9.30% n.a.
Employment in Registered Industries (2000) n.a.
Employment Rate of Growth (1991 to 2001) n.a. 32.4%
Total Employment in Farm Sector (%) 86.8% 84.58
Rural Employment in Non Farm Sector (%) 6.1% 8.7%
Agriculture Labour (%) 23.3% 27.9%
Employment
2001
Middle Schools per lakh population 25.6
High Schools per lakh population 6.4
Rural Population per Primary Health Centre 29776
Population Serviced Sub Health Centre 3846
2000
Road length per 100 sq. km. (1999) 25.2
Telephone per lakh population 749
Population per Post Office (1994-95) n.a.
Registered establishments under Factories Act (1997) n.a.
Per capita consumption of electricity (non industrial) in kwh 219.1
Infrastructure / Facilities
1991 2001
Life Expectancy of Females at Birth 55.9 57.4
Child Sex Ratio 982 970
Girl Child Mortality (birth to age 1 year) n.a. n.a.
Girl Child Mortality (up to age 5 years) n.a. n.a.
Total Fertility Rate n.a. n.a.
Gender Ratio : All 964 973
Rural 971 979
Urban 928 941
General non SC/ ST Gender Ratio 940 n.a.
SC Gender Ratio 964 n.a.
ST Gender Ratio 975 n.a.
Workers Participation Rate - Female 41.7% 43.6%
2000
Female Enrolment Rate (Ages 6-14) 67.2%
Gender
Estimated Poverty Rate (1993-1994) n.a.
Children as main workers (1991) n.a.
Children as main and marginal workers (1991) n.a.
Percentage of safe deliveries (1998-1999) n.a.
Percentage of children fully immunised (1998-1999) n.a.
Deprivation
1991 2001
Literacy (%) : All 28.1% 41.3%
Male 36.8% 51.1%
Female 19.0% 31.4%
Rural 21.0% 35.1%
Urban 64.5% 74.9%
Access to Education 2000
Enrolment Rate (Ages 6-14) 71.3%
Gross access ratio at primary level 100.0%
Habitations with Primary Schools 100.0%
Education
2000
Habitations with SDW facility 96.1%
Habitations without 40 lpd water availability 5.4%
Number of villages electrified 637
Percentage of villages not connected with pucca roads 58.3
1991
Households without access to electricity, SDW and toilet facilities n.a.
Basic Amenities
1999
Per Capita Forest Area (in hectares) n.a.
Annual Rate of Afforestation (%) (1993-1999) n.a.
Major Non-Timber Forest Produce :
Tendu Leaves, Salai Gum
Forests

D I S T R I C T FA C T S H E E T S
144
Land Use Classification in 1998-99
1978 1998
Net Area Sown (in 000' ha.) n.a. 233.4
Gross Cropped Area (in 000' ha.) n.a. 278.7
Double Cropped Area to Net Area Sown n.a. 19.4
Net Irrigated Area (in 000' ha.) n.a. 78.0
Gross Irrigated Area (in 000' ha.) n.a. 78.0
1992-93 1998-99
Agriculture Intensity n.a. 119.4
Agriculture and Land Use over
30 Years
1978 1998
Net Sown Area to Total Geographical Area Included in West Nimar 33.3%
Gross Cropped Area to Total Area n.a. 39.8%
Net Irrigated to Net Sown Area n.a. 33.4%
Cropped Area under Food Grains n.a. 60.2%
Yield of Food Grains (in kg. per hectare) n.a. 1038
Per Capita Food Production (in kgs.) 169.7
Land Use and Agriculture
2000
Credit-Deposit Ratio 61.73
Commercial Banks (per 1000 population) 0.03
Crop lending per hectare of cultivated land n.a.
Crop lending per hectare of irrigated land n.a.
Credit
2001
Number of towns reporting slums 6
Urban population residing in slums 0.00%
Level of ground water development 47.98
Average annual rainfall (in mm) 844.00
1995 2000
Percentage area under wasteland n.a. n.a.
Habitat
1991 1998-99
Cereals Per Capita (Kg) n.a. 155.4
Pulses Per Capita (Kg) n.a. 14.3
Oilseeds Per Capita (Kg) n.a. 31.8
Average Landholding (Ha) n.a. n.a.
Gross Irrigated Area ('000 Ha) 78.0
Fertiliser Consumption Per Hectare (Kg) n.a 54.78
1993 1999
Cropping Intensity n.a. 119.4
Land Use and Agriculture
Lorenz Curve of Operational Holdings
Cumulative percentage of Land Holdings
0.00 0.25 0.50 0.75 1.00
1.00
0.80
0.60
0.40
0.20
0.00
Cum
ulat
ive
perc
enta
ge o
f Lan
d Ar
ea
Net AreaSown(33%)Cultivable
Wasteland(2%)
Fallow Land (1%)
OtherUncultivable
Land excludingFallow Land
(4%)
Land NotAvailable for
Cultivation(10%)
Forest (50%)
NA = not available

145
D I S T R I C T FA C T S H E E T S
Name of Block SC ST Road length Villages connected by all Population serviced per
per 100 sq.kms. weatherroads post office (1993-' 94)
Barwani 8.34 66.5 43.18 38.46 3913
Pati 3.5 86.85 73.64 59.79 12552
Thikri 12.71 40.73 33.72 24.47 5745
Rajpur 5.78 73.85 27.9 74.49 3850
Pansemal 5.5 71.04 54.82 25 5720
Sendhwa 4.05 85.85 23.4 25.74 7429
Newali 5.6 85.78 9.46 21.13 5639
Population in 1991 Infrastructure (in percentage) (1991)
Sex ratio Agriculture Worker labourers in participation
Name of Tehsil Total Rural Urban Urbanisation Total Rural Urban Female All Child workers (%) ratio
Barwani 277688 234466 43222 15.6% 34.7% 25.7% 77.9% 26.8% 965 968 26.40 45.85
Thikri 136341 113451 22890 16.8% 62.9% 61.3% 70.6% 49.7% 964 955 45.49 47.60
Rajpur 171026 153113 17913 10.5% 43.0% 39.5% 70.8% 31.9% 979 974 28.43 48.72
Pansemal 129044 104034 25010 19.4% 49.1% 42.2% 75.0% 36.8% 984 969 39.23 53.87
Sendhwa 281824 232883 48941 17.4% 32.1% 22.0% 75.5% 23.7% 973 971 18.36 48.67
Newali 85116 85116 - - 41.0% 41.0% 0.0% 30.4% 990 979 16.01 48.05
Population Literacy Select Gender Employment Indicators
% Net % GrossName of Block Total Net Sown Gross Per capita Agriculture irrigated area to irrigated area to Level of GW Status of
Cropped Area Cropped Net Sown Area Intensity net sown area total cropped area Development ground water
Barwani 447.01 64.2% 76.3% 0.33 119 37.07 31.21 48.679 White
Pati 234.93 80.7% 90.8% 0.3 113 13.6 12.08 39.113 White
Thikri 560.47 62.9% 73.7% 0.38 117 40.87 34.89 81.446 Grey
Rajpur 748.98 61.9% 72.5% 0.39 117 30.76 26.25 34.700 White
Pansemal 255.39 94.6% 122.0% 0.35 129 40.05 31.06 116.020 Over Exploited
Sendhwa 769.2 73.0% 79.8% 0.36 109 10.13 9.27 27.559 White
Newali 316.97 71.4% 79.8% 0.36 112 7.4 6.62 20.541 White
Agriculture and Irrigation Status ofGround Water

D I S T R I C T FA C T S H E E T S
146
Human Development Index (HDI) 0.537
Rank in Madhya Pradesh : HDI 30
Gender Related Development Index (GDI) 0.558
Rank in Madhya Pradesh : GDI 20
Human Development Indices - 2002
Area (in sq. km) 10043
Total Inhabited Villages 1328
Total Habitations 2087
Forest Villages 111
Towns (Class I to IV) and Major Towns 6
Sarni, Betul
Crop Zone :
Wheat Jowar
Soil type :
Shallow Black (Medium)
Agri Climatic Zone :
Satpura Plateau
Schedule V Areas :
All Blocks of Shahpur and Bhainsdehi Tehsils and all Blocks of Betul Tehsil except
Betul CD Block
Basic Details on the District
1981 1991
Infant Mortality Rate 148 128
1991 2001
Life Expectancy (years) 52.0 54.7
1976-81 1984-90
Crude Birth Rate 35.0 39.0
Health
Janpad Panchayats 10
Gram Panchayats 555
Tehsils 5
Tribal Blocks 7
Legislative Assembly Seats 6
Administrative Information
0.537
0.759
0.4940.359
0.000
0.200
0.400
0.600
0.800
1.000
Graph on Human Development Index
1991 2001
Population 1181501 1394421
Share of Madhya Pradesh Population 2.43% 2.31%
Urban Population 18.6% 18.6%
Population of Scheduled Castes (SC) 10.8% n.a.
Population of Scheduled Tribes (ST) 37.5% n.a.
Density of Population (per sq. kms.) 118 139
All 27.68 18.02
Rural n.a. 18.09
Urban n.a. 17.7
Decadal Growth (%) 1981-91 1991- 00 1991 1998-99
Per Capita Food Production (in kgs.) 193.57 209.72
1996 2000
FPS per lakh population 38.68 38
Food
B E T U L
HDI Education Health Income
Demography
BETUL

147
D I S T R I C T FA C T S H E E T S
1991 2001
Worker Participation Rate :
All 46.7% 44.2%
Rural 51.2% 48.0%
Urban 27.0% 27.2%
Share of Primary Sector (%) 84.8% n.a.
Share of Secondary Sector (%) 4.7% n.a.
Share of Tertiary Sector (%) 10.48% n.a.
Employment in Registered Industries (2000) 6646
Employment Rate of Growth (1991 to 2001) n.a. 11.7%
Total Employment in Farm Sector (%) 82.5% 79.53
Rural Employment in Non Farm Sector (%) 9.0% 11.7%
Agriculture Labour (%) 24.2% 37.6%
Employment
2001
Middle Schools per lakh population 40.9
High Schools per lakh population 16.6
Rural Population per Primary Health Centre 33398
Population Serviced Sub Health Centre 4190
2000
Road length per 100 sq. km. (1999) 17.1
Telephone per lakh population 965
Population per Post Office (1994-95) 5986
Registered establishments under Factories Act (1997) 101
Per capita consumption of electricity (non industrial) in kwh 213.0
Infrastructure / Facilities
1991 2001
Life Expectancy of Females at Birth 51.8 53.8
Child Sex Ratio 980 968
Girl Child Mortality (birth to age 1 year) 141 n.a.
Girl Child Mortality (up to age 5 years) 181 n.a.
Total Fertility Rate 5.6 n.a.
Gender Ratio : All 966 965
Rural 981 977
Urban 903 917
General non SC/ ST Gender Ratio 945 n.a.
SC Gender Ratio 950 n.a.
ST Gender Ratio 1002 n.a.
Workers Participation Rate - Female 39.8% 37.0%
2000
Female Enrolment Rate (Ages 6-14) 91.9%
Gender
Estimated Poverty Rate (1993-1994) 65.6%
Children as main workers (1991) 11.2%
Children as main and marginal workers (1991) 13.8%
Percentage of safe deliveries (1998-1999) 34.2
Percentage of children fully immunised (1998-1999) 78.9
Deprivation
1991 2001
Literacy (%) : All 45.9% 66.9%
Male 57.4% 77.3%
Female 33.9% 56.0%
Rural 38.8% 62.5%
Urban 76.3% 85.0%
Access to Education 2000
Enrolment Rate (Ages 6-14) 93.9%
Gross access ratio at primary level 100.0%
Habitations with Primary Schools 100.0%
Education
2000
Habitations with SDW facility 99.5%
Habitations without 40 lpd water availability 0.9%
Number of villages electrified 1320
Percentage of villages not connected with pucca roads 72.9
1991
Households without access to electricity, SDW and toilet facilities 23.99
Basic Amenities
1999
Per Capita Forest Area (in hectares) 0.267
Annual Rate of Afforestation (%) (1993-1999) 0.19
Major Non-Timber Forest Produce :
Tendu Leaves, Harra
Forests

D I S T R I C T FA C T S H E E T S
148
Land Use Classification in 1998-99
1978 1998
Net Area Sown (in 000' ha.) 388.2 407.1
Gross Cropped Area (in 000' ha.) 432.9 531.9
Double Cropped Area to Net Area Sown 11.5 30.6
Net Irrigated Area (in 000' ha.) 42.9 104.5
Gross Irrigated Area (in 000' ha.) 42.9 104.5
1992-93 1998-99
Agriculture Intensity 119.0 130.6
Agriculture and Land Use over
30 Years
1978 1998
Net Sown Area to Total Geographical Area 38.5% 40.4%
Gross Cropped Area to Total Area 43.0% 52.8%
Net Irrigated to Net Sown Area 11.1% 25.7%
Cropped Area under Food Grains 86.7% 59.1%
Yield of Food Grains (in kg. per hectare) 598 901
Per Capita Food Production (in kgs.) 209.7
Land Use and Agriculture
2000
Credit-Deposit Ratio 38.81
Commercial Banks (per 1000 population) 0.05
Crop lending per hectare of cultivated land 464.3
Crop lending per hectare of irrigated land 2492.2
Credit
2001
Number of towns reporting slums 6
Urban population residing in slums 46.54%
Level of ground water development 28.38
Average annual rainfall (in mm) 1084.00
1995 2000
Percentage area under wasteland 8.1% 12.13%
Habitat
1991 1998-99
Cereals Per Capita (Kg) 167.8 185.0
Pulses Per Capita (Kg) 25.8 24.8
Oilseeds Per Capita (Kg) 118.4 66.8
Average Landholding (Ha) 3.4 2.89
Gross Irrigated Area ('000 Ha) 104.5
Fertiliser Consumption Per Hectare (Kg) 20.2 25.52
1993 1999
Cropping Intensity 119 130.6
Land Use and Agriculture
Lorenz Curve of Operational Holdings
Cumulative percentage of Land Holdings
0.00 0.25 0.50 0.75 1.00
1.00
0.80
0.60
0.40
0.20
0.00
Cum
ulat
ive
perc
enta
ge o
f Lan
d Ar
ea
Net AreaSown(40%)
CultivableWasteland
(5%)
Fallow Land (6%)
OtherUncultivable
Land excludingFallow Land
(3%)
Land NotAvailable for
Cultivation(7%)
Forest (39%)
NA = not available

149
D I S T R I C T FA C T S H E E T S
% Net % Gross
Name of Block Total Net Sown Gross Per capita Agriculture irrigated area to irrigated area to Level of GW Status of
Cropped Area Cropped Net Sown Area Intensity net sown area total cropped area Development ground water
Betul 955.34 58.2% 90.7% 0.45 156 35.69 22.89 38.57 White
Chicholi 408.89 52.6% 64.8% 0.38 123 21.6 17.55 38.352 White
Ghoda Dongri 672.58 44.7% 51.1% 0.3 114 17.78 15.54 13.01 White
Shahpur 527.7 46.3% 50.7% 0.33 110 10.19 9.3 21.525 White
Multai 803.78 71.8% 90.4% 0.51 126 20.78 16.49 39.647 White
Prabhat Pattnam 850.82 62.1% 77.5% 0.48 125 19.68 15.76 39.849 White
Amla 660.77 61.4% 83.4% 0.36 136 38.27 28.19 37.027 White
Bhainsdehi 748.23 65.9% 77.5% 0.58 118 13.98 11.89 14.886 White
Athner 675.43 65.7% 75.6% 0.56 115 12.07 10.49 26.287 White
Bhimpura 890.55 43.1% 48.8% 0.43 113 8.08 7.13 10.124 White
Name of Block SC ST Road length Villages connected by all Population serviced per
per 100 sq.kms. weatherroads post office (1993-' 94)
Betul 9.16 38.39 20.83 33.86 4214
Chicholi 5.83 60.88 38.15 17.95 4360
Ghoda Dongri 7.37 55.41 7.43 8 6494
Shahpur 8.31 61.02 18.38 6.37 3159
Multai 10.99 11.22 25.38 63.36 3300
Prabhat Pattnam 16.05 23.66 17.75 103.45 2663
Amla 14.4 27.21 13.62 25.5 3973
Bhainsdehi 8.73 58.52 20.45 22.14 3820
Athner 8.05 41.58 11.7 17.35 4655
Bhimpura 4.34 83.79 18.49 11.84 5631
Population in 1991 Infrastructure (in percentage) (1991)
Sex ratio Agriculture Worker labourers in participation
Name of Tehsil Total Rural Urban Urbanisation Total Rural Urban Female All Child workers (%) ratio
Bhainsdehi 331403 315647 15756 4.8% 58.9% 57.7% 81.3% 47.1% 973 968 41.87 49.61
Betul 539389 351244 188145 34.9% 69.0% 59.9% 84.8% 58.9% 954 954 33.52 39.73
Multai 266125 244697 21428 8.1% 76.2% 75.4% 84.9% 66.2% 976 989 37.36 46.54
Shahpur 95904 91907 3997 4.2% 50.5% 48.6% 90.1% 36.0% 975 990 40.32 45.74
Amla 161600 132047 29553 18.3% 69.6% 65.3% 87.5% 59.0% 967 971 38.53 43.01
Population Literacy Select Gender EmploymentIndicators
Agriculture and Irrigation Status ofGround Water

D I S T R I C T FA C T S H E E T S
150
Human Development Index (HDI) 0.566
Rank in Madhya Pradesh : HDI 19
Gender Related Development Index (GDI) 0.512
Rank in Madhya Pradesh : GDI 33
Human Development Indices - 2002
Area (in sq. km) 4459
Total Inhabited Villages 877
Total Habitations 1878
Forest Villages 0
Towns (Class I to IV) and Major Towns 11
Bhind, Gohad
Crop Zone :
Wheat Jowar
Soil type :
Alluvial (Light)
Agri Climatic Zone :
Gird Region
Schedule V Areas :
No Schedule V area
Basic Details on the District
1981 1991
Infant Mortality Rate 139 102
1991 2001
Life Expectancy (years) 55.0 59.9
1976-81 1984-90
Crude Birth Rate 35.8 39.0
Health
Janpad Panchayats 6
Gram Panchayats 447
Tehsils 7
Tribal Blocks 0
Legislative Assembly Seats 6
Administrative Information
0.566
0.808
0.582
0.306
0.000
0.200
0.400
0.600
0.800
1.000
Graph on Human Development Index
1991 2001
Population 1219000 1426951
Share of Madhya Pradesh Population 2.51% 2.36%
Urban Population 20.6% 23.7%
Population of Scheduled Castes (SC) 21.3% n.a.
Population of Scheduled Tribes (ST) 0.3% n.a.
Density of Population (per sq. kms.) 273 320
All 25.18 17.06
Rural n.a. 12.5
Urban n.a. 34.65
Decadal Growth (%) 1981-91 1991- 00 1991 1998-99
Per Capita Food Production (in kgs.) 318.70 223.57
1996 2000
FPS per lakh population 27.92 28
Food
B H I N D
HDI Education Health Income
Demography
BHIND

151
D I S T R I C T FA C T S H E E T S
1991 2001
Worker Participation Rate :
All 27.4% 36.8%
Rural 28.1% 40.1%
Urban 24.6% 26.3%
Share of Primary Sector (%) 79.9% n.a.
Share of Secondary Sector (%) 4.3% n.a.
Share of Tertiary Sector (%) 15.77% n.a.
Employment in Registered Industries (2000) 18889
Employment Rate of Growth (1991 to 2001) n.a. 57.5%
Total Employment in Farm Sector (%) 79.8% 72.37
Rural Employment in Non Farm Sector (%) 10.8% 19.0%
Agriculture Labour (%) 12.6% 18.7%
Employment
2001
Middle Schools per lakh population 41.4
High Schools per lakh population 15.4
Rural Population per Primary Health Centre 57305
Population Serviced Sub Health Centre 5950
2000
Road length per 100 sq. km. (1999) 29.6
Telephone per lakh population 607
Population per Post Office (1994-95) 5276
Registered establishments under Factories Act (1997) 267
Per capita consumption of electricity (non industrial) in kwh 56.3
Infrastructure / Facilities
1991 2001
Life Expectancy of Females at Birth 50.8 54.0
Child Sex Ratio 850 829
Girl Child Mortality (birth to age 1 year) 113 n.a.
Girl Child Mortality (up to age 5 years) 185 n.a.
Total Fertility Rate 5.8 n.a.
Gender Ratio : All 816 829
Rural 813 825
Urban 827 842
General non SC/ ST Gender Ratio 821 n.a.
SC Gender Ratio 796 n.a.
ST Gender Ratio 816 n.a.
Workers Participation Rate - Female 4.2% 22.8%
2000
Female Enrolment Rate (Ages 6-14) 103.8%
Gender
Estimated Poverty Rate (1993-1994) 21.5%
Children as main workers (1991) 1.5%
Children as main and marginal workers (1991) 1.7%
Percentage of safe deliveries (1998-1999) 18.9
Percentage of children fully immunised (1998-1999) 53.8
Deprivation
1991 2001
Literacy (%) : All 49.2% 71.2%
Male 66.2% 84.1%
Female 28.2% 55.7%
Rural 45.7% 69.7%
Urban 62.7% 76.1%
Access to Education 2000
Enrolment Rate (Ages 6-14) 100.0%
Gross access ratio at primary level 100.0%
Habitations with Primary Schools 100.0%
Education
2000
Habitations with SDW facility 98.3%
Habitations without 40 lpd water availability 1.8%
Number of villages electrified 872
Percentage of villages not connected with pucca roads 43.3
1991
Households without access to electricity, SDW and toilet facilities 45.81
Basic Amenities
1999
Per Capita Forest Area (in hectares) 0.006
Annual Rate of Afforestation (%) (1993-1999) 1.83
Major Non-Timber Forest Produce :
None
Forests

D I S T R I C T FA C T S H E E T S
152
Land Use Classification in 1998-99
1978 1998
Net Area Sown (in 000' ha.) 336.1 337.3
Gross Cropped Area (in 000' ha.) 355.2 366.7
Double Cropped Area to Net Area Sown 5.7 8.7
Net Irrigated Area (in 000' ha.) 101.2 125.4
Gross Irrigated Area (in 000' ha.) 112.9 137.9
1992-93 1998-99
Agriculture Intensity 108.5 108.7
Agriculture and Land Use over
30 Years
1978 1998
Net Sown Area to Total Geographical Area 75.5% 75.8%
Gross Cropped Area to Total Area 79.8% 82.4%
Net Irrigated to Net Sown Area 30.1% 37.2%
Cropped Area under Food Grains 87.1% 59.1%
Yield of Food Grains (in kg. per hectare) 466 1426
Per Capita Food Production (in kgs.) 223.6
Land Use and Agriculture
2000
Credit-Deposit Ratio 44.4
Commercial Banks (per 1000 population) 0.03
Crop lending per hectare of cultivated land 1121.9
Crop lending per hectare of irrigated land 3227.2
Credit
2001
Number of towns reporting slums 11
Urban population residing in slums 11.24%
Level of ground water development 21.35
Average annual rainfall (in mm) 668.00
1995 2000
Percentage area under wasteland 26.8% 29.21%
Habitat
1991 1998-99
Cereals Per Capita (Kg) 249.3 175.1
Pulses Per Capita (Kg) 69.4 48.5
Oilseeds Per Capita (Kg) 43.7 93.6
Average Landholding (Ha) 2.6 2.19
Gross Irrigated Area ('000 Ha) 137.9
Fertiliser Consumption Per Hectare (Kg) 37.8 64.21
1993 1999
Cropping Intensity 108 108.7
Land Use and Agriculture
Lorenz Curve of Operational Holdings
Cumulative percentage of Land Holdings
0.00 0.25 0.50 0.75 1.00
1.00
0.80
0.60
0.40
0.20
0.00
Cum
ulat
ive
perc
enta
ge o
f Lan
d Ar
ea
Net AreaSown(76%)
Fallow Land (2%)
CultivableWasteland(2%)Other
UncultivableLand excluding
Fallow Land(5%)
Land NotAvailable for
Cultivation(13%)
Forest (2%)
NA = not available

153
D I S T R I C T FA C T S H E E T S
% Net % Gross
Name of Block Total Net Sown Gross Per capita Agriculture irrigated area to irrigated area to Level of GW Status of
Cropped Area Cropped Net Sown Area Intensity net sown area total cropped area Development ground water
Bhind 626.48 71.8% 79.4% 0.27 111 34.65 31.37 23.700 White
Ater 684.84 68.3% 75.3% 0.26 110 50.17 45.69 26.790 White
Mehgaon 925.14 83.1% 88.4% 0.37 106 28.72 29.59 21.203 White
Lahar 611.83 87.6% 91.4% 0.37 104 36.64 35.86 25.611 White
Mihona 405.83 77.1% 79.3% 0.32 103 20.75 20.17 53.804 White
Gohad 992.7 83.6% 93.8% 0.47 112 30.64 37.07 8.208 White
Agriculture and Irrigation Status ofGround Water
Name of Block SC ST Road length Villages connected by all Population serviced per
per 100 sq.kms. weatherroads post office (1993-' 94)
Bhind 20.45 0 29.05 49.00 2884
Ater 16.98 0.06 28.62 43.35 3905
Mehgaon 20.05 0.04 21.83 47.94 4049
Lahar 25.69 0.04 28.44 47.59 3195
Mihona 22.59 0 23.16 40.58
Gohad 28.47 0.65 26.9 56.41 4106
Sex ratio Agriculture Worker labourers in participation
Name of Tehsil Total Rural Urban Urbanisation Total Rural Urban Female All Child workers (%) ratio
Bhind 437481 262434 175047 40.0% 76.0% 73.2% 79.9% 62.8% 838 820 13.42 32.57
Gohad 264190 201371 62819 23.8% 65.1% 64.3% 67.8% 46.0% 803 791 21.75 32.95
Mehgaon 275988 243997 31991 11.6% 70.8% 70.2% 75.0% 54.4% 822 811 20.93 42.51
Lahar 185089 131592 53497 28.9% 69.0% 67.3% 73.2% 52.2% 830 864 20.02 40.93
Ron 63356 63356 - - 67.8% 67.8% 0.0% 52.7% 844 872 17.08 42.96
Mihona 81523 66724 14799 18.2% 71.0% 69.6% 77.3% 57.2% 845 875 27.31 41.29
Ater 119324 119324 - - 73.6% 73.6% 0.0% 59.4% 851 879 15.49 35.20
Population Literacy Select Gender EmploymentIndicators
Population in 1991 Infrastructure (in percentage) (1991)

D I S T R I C T FA C T S H E E T S
154
Human Development Index (HDI) 0.663
Rank in Madhya Pradesh : HDI 2
Gender Related Development Index (GDI) 0.547
Rank in Madhya Pradesh : GDI 24
Human Development Indices - 2002
Area (in sq. km) 2772
Total Inhabited Villages 511
Total Habitations 651
Forest Villages 1
Towns (Class I to IV) and Major Towns 2
Bhopal
Crop Zone :
Wheat Zone
Soil type :
Medium Black and Deep Black (Medium/ Heavy)
Agri Climatic Zone :
Vindhya Plateau
Schedule V Areas :
No Schedule V area
Basic Details on the District
1981 1991
Infant Mortality Rate 91 70
1991 2001
Life Expectancy (years) 62.0 64.9
1976-81 1984-90
Crude Birth Rate n.a. 32.5
Health
Janpad Panchayats 2
Gram Panchayats 194
Tehsils 2
Tribal Blocks 0
Legislative Assembly Seats 4
Administrative Information
0.6630.813
0.6650.510
0.000
0.200
0.400
0.600
0.800
1.000
Graph on Human Development Index
1991 2001
Population 1351479 1836784
Share of Madhya Pradesh Population 2.78% 3.04%
Urban Population 80.0% 80.5%
Population of Scheduled Castes (SC) 13.8% n.a.
Population of Scheduled Tribes (ST) 3.0% n.a.
Density of Population (per sq. kms.) 488 663
All 51.05 35.91
Rural n.a. 32.14
Urban n.a. 36.85
Decadal Growth (%) 1981-91 1991- 00 1991 1998-99
Per Capita Food Production (in kgs.) 108.99 103.85
1996 2000
FPS per lakh population 21.19 20
Food
B H O P A L
HDI Education Health Income
Demography
BHOPAL

155
D I S T R I C T FA C T S H E E T S
1991 2001
Worker Participation Rate :
All 31.8% 32.0%
Rural 42.7% 42.2%
Urban 29.1% 29.6%
Share of Primary Sector (%) 24.9% n.a.
Share of Secondary Sector (%) 24.5% n.a.
Share of Tertiary Sector (%) 50.65% n.a.
Employment in Registered Industries (2000) 32175
Employment Rate of Growth (1991 to 2001) n.a. 37.0%
Total Employment in Farm Sector (%) 24.5% 22.99
Rural Employment in Non Farm Sector (%) 13.5% 16.3%
Agriculture Labour (%) 9.2% 11.0%
Employment
2001
Middle Schools per lakh population 27.8
High Schools per lakh population 26.5
Rural Population per Primary Health Centre 35767
Population Serviced Sub Health Centre 5677
2000
Road length per 100 sq. km. (1999) 31.0
Telephone per lakh population 5843
Population per Post Office (1994-95) 12508
Registered establishments under Factories Act (1997) 528
Per capita consumption of electricity (non industrial) in kwh 310.7
Infrastructure / Facilities
1991 2001
Life Expectancy of Females at Birth 62.3 64.7
Child Sex Ratio 938 931
Girl Child Mortality (birth to age 1 year) 98 n.a.
Girl Child Mortality (up to age 5 years) 107 n.a.
Total Fertility Rate 3.8 n.a.
Gender Ratio : All 889 896
Rural 873 887
Urban 894 898
General non SC/ ST Gender Ratio 889 n.a.
SC Gender Ratio 895 n.a.
ST Gender Ratio 887 n.a.
Workers Participation Rate - Female 13.5% 14.7%
2000
Female Enrolment Rate (Ages 6-14) 94.0%
Gender
Estimated Poverty Rate (1993-1994) 36.5%
Children as main workers (1991) 1.8%
Children as main and marginal workers (1991) 2.5%
Percentage of safe deliveries (1998-1999) 69.7
Percentage of children fully immunised (1998-1999) 78.5
Deprivation
1991 2001
Literacy (%) : All 64.3% 75.1%
Male 73.1% 82.6%
Female 54.2% 66.7%
Rural 33.1% 53.3%
Urban 71.5% 80.0%
Access to Education 2000
Enrolment Rate (Ages 6-14) 92.4%
Gross access ratio at primary level 100.0%
Habitations with Primary Schools 100.0%
Education
2000
Habitations with SDW facility 100.0%
Habitations without 40 lpd water availability 0.0%
Number of villages electrified 511
Percentage of villages not connected with pucca roads 50.0
1991
Households without access to electricity, SDW and toilet facilities 4.45
Basic Amenities
1999
Per Capita Forest Area (in hectares) 0.016
Annual Rate of Afforestation (%) (1993-1999) 3.38
Major Non-Timber Forest Produce :
Tendu Leaves
Forests

D I S T R I C T FA C T S H E E T S
156
Land Use Classification in 1998-99
1978 1998
Net Area Sown (in 000' ha.) 150.2 158.7
Gross Cropped Area (in 000' ha.) 154.6 226.1
Double Cropped Area to Net Area Sown 2.9 42.5
Net Irrigated Area (in 000' ha.) 12.9 71.9
Gross Irrigated Area (in 000' ha.) 12.9 71.9
1992-93 1998-99
Agriculture Intensity 122.5 142.5
Agriculture and Land Use over
30 Years
1978 1998
Net Sown Area to Total Geographical Area 55.5% 57.1%
Gross Cropped Area to Total Area 57.1% 81.4%
Net Irrigated to Net Sown Area 8.6% 45.3%
Cropped Area under Food Grains 81.9% 57.7%
Yield of Food Grains (in kg. per hectare) 794 1375
Per Capita Food Production (in kgs.) 103.9
Land Use and Agriculture
2000
Credit-Deposit Ratio 52.13
Commercial Banks (per 1000 population) 0.09
Crop lending per hectare of cultivated land 2834.6
Crop lending per hectare of irrigated land 9237.2
Credit
2001
Number of towns reporting slums 2
Urban population residing in slums 8.54%
Level of ground water development 63.28
Average annual rainfall (in mm) 1079.00
1995 2000
Percentage area under wasteland 22.7% 24.67%
Habitat
1991 1998-99
Cereals Per Capita (Kg) 86.6 78.8
Pulses Per Capita (Kg) 22.3 25.0
Oilseeds Per Capita (Kg) 26.5 34.8
Average Landholding (Ha) 3.8 3.30
Gross Irrigated Area ('000 Ha) 71.9
Fertiliser Consumption Per Hectare (Kg) 32.3 63.85
1993 1999
Cropping Intensity 122 142.5
Land Use and Agriculture
Lorenz Curve of Operational Holdings
Cumulative percentage of Land Holdings
0.00 0.25 0.50 0.75 1.00
1.00
0.80
0.60
0.40
0.20
0.00
Cum
ulat
ive
perc
enta
ge o
f Lan
d Ar
ea
Net AreaSown(57%)
Fallow Land (2%)
CultivableWasteland(2%)
OtherUncultivableLand excludingFallow Land(12%)
Land NotAvailable for
Cultivation(11%)
Forest (16%)
NA = not available

157
D I S T R I C T FA C T S H E E T S
% Net % Gross
Name of Block Total Net Sown Gross Per capita Agriculture irrigated area to irrigated area to Level of GW Status of
Cropped Area Cropped Net Sown Area Intensity net sown area total cropped area Development ground water
Phanda 997.78 73.9% 109.2% 0.6 148 14.49 13.21 69.547 Grey
Berasia 1404.99 60.2% 78.8% 0.57 131 27.97 21.38 56.847 White
Name of Block SC ST Road length Villages connected by all Population serviced per
per 100 sq.kms. weatherroads post office (1993-' 94)
Phanda 19.51 6.19 22.65 14.22 1152
Berasia 23.5 2.6 14.95 14.04 3878
Population in 1991 Infrastructure (in percentage) (1991)
Sex ratio Agriculture Worker labourers in participation
Name of Tehsil Total Rural Urban Urbanisation Total Rural Urban Female All Child workers (%) ratio
Huzur 1623050 168220 1454830 89.6% 78.0% 58.3% 80.2% 70.6% 898 936 5.95 30.87
Berasia 213734 189445 24289 11.4% 51.3% 48.9% 69.2% 34.8% 881 903 40.14 40.97
Population Literacy Select Gender EmploymentIndicators
Agriculture and Irrigation Status ofGround Water

D I S T R I C T FA C T S H E E T S
158
Human Development Index (HDI) 0.449
Rank in Madhya Pradesh : HDI 43
Gender Related Development Index (GDI) 0.453
Rank in Madhya Pradesh : GDI 44
Human Development Indices - 2002
Area (in sq. km) 8687
Total Inhabited Villages 1076
Total Habitations 1594
Forest Villages 0
Towns (Class I to IV) and Major Towns 14
Chhatarpur
Crop Zone :
Wheat Jowar
Soil type :
Mixed Red and Black (Medium)
Agri Climatic Zone :
Bundelkhand Region
Schedule V Areas :
No Schedule V area
Basic Details on the District
1981 1991
Infant Mortality Rate 175 150
1991 2001
Life Expectancy (years) 47.2 50.4
1976-81 1984-90
Crude Birth Rate 39.7 42.6
Health
Janpad Panchayats 8
Gram Panchayats 558
Tehsils 7
Tribal Blocks 0
Legislative Assembly Seats 5
Administrative Information
0.4490.649
0.4240.273
0.000
0.200
0.400
0.600
0.800
1.000
Graph on Human Development Index
1991 2001
Population 1158076 1474633
Share of Madhya Pradesh Population 2.38% 2.44%
Urban Population 19.3% 22.0%
Population of Scheduled Castes (SC) 23.7% n.a.
Population of Scheduled Tribes (ST) 3.8% n.a.
Density of Population (per sq. kms.) 133 170
All 30.61 27.33
Rural n.a. 23.09
Urban n.a. 45.08
Decadal Growth (%) 1981-91 1991- 00 1991 1998-99
Per Capita Food Production (in kgs.) 268.64 312.58
1996 2000
FPS per lakh population 45.09 43
Food
C H H A T A R P U R
HDI Education Health Income
Demography
CHHATARPUR

159
D I S T R I C T FA C T S H E E T S
1991 2001
Worker Participation Rate :
All 41.0% 40.2%
Rural 43.6% 43.0%
Urban 30.2% 30.5%
Share of Primary Sector (%) 82.6% n.a.
Share of Secondary Sector (%) 6.0% n.a.
Share of Tertiary Sector (%) 11.45% n.a.
Employment in Registered Industries (2000) 947
Employment Rate of Growth (1991 to 2001) n.a. 24.9%
Total Employment in Farm Sector (%) 82.5% 75.34
Rural Employment in Non Farm Sector (%) 10.0% 15.4%
Agriculture Labour (%) 20.5% 20.4%
Employment
2001
Middle Schools per lakh population 28.3
High Schools per lakh population 12.6
Rural Population per Primary Health Centre 28057
Population Serviced Sub Health Centre 6087
2000
Road length per 100 sq. km. (1999) 25.9
Telephone per lakh population 733
Population per Post Office (1994-95) 5905
Registered establishments under Factories Act (1997) 71
Per capita consumption of electricity (non industrial) in kwh 64.1
Infrastructure / Facilities
1991 2001
Life Expectancy of Females at Birth 44.3 47.4
Child Sex Ratio 919 920
Girl Child Mortality (birth to age 1 year) 149 n.a.
Girl Child Mortality (up to age 5 years) 227 n.a.
Total Fertility Rate 6.6 n.a.
Gender Ratio : All 856 869
Rural 855 868
Urban 862 873
General non SC/ ST Gender Ratio 854 n.a.
SC Gender Ratio 854 n.a.
ST Gender Ratio 916 n.a.
Workers Participation Rate - Female 28.6% 29.7%
2000
Female Enrolment Rate (Ages 6-14) 84.3%
Gender
Estimated Poverty Rate (1993-1994) 24.9%
Children as main workers (1991) 5.5%
Children as main and marginal workers (1991) 8.5%
Percentage of safe deliveries (1998-1999) 24.4
Percentage of children fully immunised (1998-1999) 29.5
Deprivation
1991 2001
Literacy (%) : All 35.2% 53.4%
Male 46.9% 65.5%
Female 21.3% 39.4%
Rural 28.3% 47.5%
Urban 63.4% 73.6%
Access to Education 2000
Enrolment Rate (Ages 6-14) 87.7%
Gross access ratio at primary level 100.0%
Habitations with Primary Schools 100.0%
Education
2000
Habitations with SDW facility 99.6%
Habitations without 40 lpd water availability 0.4%
Number of villages electrified 1062
Percentage of villages not connected with pucca roads 61.6
1991
Households without access to electricity, SDW and toilet facilities 55.51
Basic Amenities
1999
Per Capita Forest Area (in hectares) 0.111
Annual Rate of Afforestation (%) (1993-1999) -0.54
Major Non-Timber Forest Produce :
Tendu Leaves, Baheda, Achar Guthli, Nagarmotha, Aonla, Mahua Flowers, Charota
Seeds, Jamun, Khair
Forests

D I S T R I C T FA C T S H E E T S
160
Land Use Classification in 1998-99
1978 1998
Net Area Sown (in 000' ha.) 340.2 383.5
Gross Cropped Area (in 000' ha.) 387.7 484.3
Double Cropped Area to Net Area Sown 14.0 26.3
Net Irrigated Area (in 000' ha.) 77.2 169.5
Gross Irrigated Area (in 000' ha.) 77.5 169.5
1992-93 1998-99
Agriculture Intensity 119.1 126.3
Agriculture and Land Use over
30 Years
1978 1998
Net Sown Area to Total Geographical Area 39.4% 44.4%
Gross Cropped Area to Total Area 44.9% 56.1%
Net Irrigated to Net Sown Area 22.7% 44.2%
Cropped Area under Food Grains 79.3% 71.2%
Yield of Food Grains (in kg. per hectare) 984 1273
Per Capita Food Production (in kgs.) 312.6
Land Use and Agriculture
2000
Credit-Deposit Ratio 39.42
Commercial Banks (per 1000 population) 0.02
Crop lending per hectare of cultivated land 643.4
Crop lending per hectare of irrigated land 1892.6
Credit
2001
Number of towns reporting slums 14
Urban population residing in slums 8.15%
Level of ground water development 40.12
Average annual rainfall (in mm) 1075.00
1995 2000
Percentage area under wasteland 16.6% 17.94%
Habitat
1991 1998-99
Cereals Per Capita (Kg) 205.9 235.4
Pulses Per Capita (Kg) 62.8 77.1
Oilseeds Per Capita (Kg) 15.6 30.6
Average Landholding (Ha) 2.6 2.27
Gross Irrigated Area ('000 Ha) 169.5
Fertiliser Consumption Per Hectare (Kg) 22.0 37.86
1993 1999
Cropping Intensity 119 126.3
Land Use and Agriculture
Lorenz Curve of Operational Holdings
Cumulative percentage of Land Holdings
0.00 0.25 0.50 0.75 1.00
1.00
0.80
0.60
0.40
0.20
0.00
Cum
ulat
ive
perc
enta
ge o
f Lan
d Ar
ea
Net AreaSown(45%)
Fallow Land (8%)
CultivableWasteland(9%)
OtherUncultivableLand excludingFallow Land(8%)
Land NotAvailable for
Cultivation(5%)
Forest (25%)
NA = not available

161
D I S T R I C T FA C T S H E E T S
% Net % Gross
Name of Block Total Net Sown Gross Per capita Agriculture irrigated area to irrigated area to Level of GW Status of
Cropped Area Cropped Net Sown Area Intensity net sown area total cropped area Development ground water
Chattarpur 1041.98 44.1% 60.2% 0.32 137 63.72 46.66 73.898 Grey
Rajnagar 1356.9 38.4% 52.8% 0.32 137 60.92 44.35 79.711 Grey
Nowgaon 800.83 63.3% 74.9% 0.39 118 49.05 41.47 46.507 White
Laundi 787.99 68.4% 73.3% 0.48 107 17.14 15.98 21.756 White
Gaurihar 1535.22 43.6% 44.9% 0.54 103 4.27 4.15 2.187 White
Bijawar 888.47 35.0% 43.2% 0.33 123 41.12 33.32 23.733 White
Bada Malhara 1080.85 38.2% 51.9% 0.34 136 54.85 40.34 54.712 White
Bakswaha 785.02 31.6% 34.6% 0.55 110 10.47 9.56 54.360 White
Agriculture and Irrigation Status ofGround Water
Name of Block SC ST Road length Villages connected by all Population serviced per
per 100 sq.kms. weatherroads post office (1993-' 94)
Chattarpur 24.78 2.66 29.66 27.14 4037
Rajnagar 21.1 5.76 18.35 23.19 4523
Nowgaon 26.31 0.4 35.96 37.39 4084
Laundi 29.27 1.01 21.07 22.07 3545
Gaurihar 28.55 0.18 10.92 25.19 4782
Bijawar 22.47 13.52 16.02 26.57 3962
Bada Malhara 26.78 6.85 10 30.32 4056
Bakswaha 18.27 11.97 12.61 24.53 3227
Population in 1991 Infrastructure (in percentage) (1991)
Sex ratio Agriculture Worker labourers in participation
Name of Tehsil Total Rural Urban Urbanisation Total Rural Urban Female All Child workers (%) ratio
Chattarpur 289346 180325 109021 37.7% 58.3% 44.0% 80.4% 46.7% 875 913 14.72 37.36
Rajnagar 216187 184463 31724 14.7% 46.0% 42.5% 65.9% 31.3% 880 920 17.70 40.43
Nawgaon 251377 168449 82928 33.0% 58.1% 49.1% 75.4% 44.4% 873 915 22.19 37.90
Laundi 169539 139146 30393 17.9% 54.9% 51.0% 72.0% 39.4% 855 900 22.96 41.50
Gaurihar 158241 149652 8589 5.4% 56.2% 55.8% 61.9% 38.8% 852 915 29.59 43.46
Bijawar 229092 182510 46582 20.3% 50.3% 46.8% 63.7% 36.7% 870 930 19.92 41.66
Bada Malhara 160851 145809 15042 9.4% 47.5% 45.2% 69.0% 33.2% 871 955 19.13 42.14
Population Literacy Select Gender EmploymentIndicators

1991 2001
Population 1568702 1848882
Share of Madhya Pradesh Population 3.23% 3.06%
Urban Population 23.1% 24.5%
Population of Scheduled Castes (SC) 12.2% n.a.
Population of Scheduled Tribes (ST) 34.5% n.a.
Density of Population (per sq. kms.) 133 156
D I S T R I C T FA C T S H E E T S
162
Human Development Index (HDI) 0.586
Rank in Madhya Pradesh : HDI 13
Gender Related Development Index (GDI) 0.575
Rank in Madhya Pradesh : GDI 15
Human Development Indices - 2002
Area (in sq. km) 11815
Total Inhabited Villages 1903
Total Habitations 3646
Forest Villages 49
Towns (Class I to IV) and Major Towns 22
Chhindwara, Chikhlikalan Parasia
Crop Zone :
Wheat Jowar
Soil type :
Shallow Black (Medium)
Agri Climatic Zone :
Satpura Plateau
Schedule V Areas :
All Blocks of Tamia and Jamai Tehsils and parts of Sausar and Chhindwara Tehsils
Basic Details on the District
1981 1991
Infant Mortality Rate 131 103
1991 2001
Life Expectancy (years) 55.9 60.4
1976-81 1984-90
Crude Birth Rate 32.5 37.0
Health
Janpad Panchayats 11
Gram Panchayats 808
Tehsils 9
Tribal Blocks 3
Legislative Assembly Seats 8
Administrative Information
0.5860.729
0.5910.440
0.000
0.200
0.400
0.600
0.800
1.000
Graph on Human Development Index
All 27.21 17.86
Rural n.a. 15.77
Urban n.a. 24.81
Decadal Growth (%) 1981-91 1991- 00 1991 1998-99
Per Capita Food Production (in kgs.) 320.20 243.64
1996 2000
FPS per lakh population 29.93 30
Food
C H H I N D W A R A
HDI Education Health Income
Demography
CHHINDWARA

163
D I S T R I C T FA C T S H E E T S
1991 2001
Worker Participation Rate :
All 43.5% 42.2%
Rural 48.0% 46.2%
Urban 28.3% 29.6%
Share of Primary Sector (%) 81.3% n.a.
Share of Secondary Sector (%) 5.4% n.a.
Share of Tertiary Sector (%) 13.35% n.a.
Employment in Registered Industries (2000) 17045
Employment Rate of Growth (1991 to 2001) n.a. 14.3%
Total Employment in Farm Sector (%) 76.8% 74.43
Rural Employment in Non Farm Sector (%) 12.0% 13.9%
Agriculture Labour (%) 25.9% 35.2%
Employment
2001
Middle Schools per lakh population 35.7
High Schools per lakh population 16.7
Rural Population per Primary Health Centre 20845
Population Serviced Sub Health Centre 4406
2000
Road length per 100 sq. km. (1999) 17.3
Telephone per lakh population 1115
Population per Post Office (1994-95) 6634
Registered establishments under Factories Act (1997) 283
Per capita consumption of electricity (non industrial) in kwh 190.0
Infrastructure / Facilities
1991 2001
Life Expectancy of Females at Birth 54.5 58.7
Child Sex Ratio 965 961
Girl Child Mortality (birth to age 1 year) 116 n.a.
Girl Child Mortality (up to age 5 years) 137 n.a.
Total Fertility Rate 5.3 n.a.
Gender Ratio : All 953 953
Rural 967 962
Urban 906 926
General non SC/ ST Gender Ratio 930 n.a.
SC Gender Ratio 930 n.a.
ST Gender Ratio 998 n.a.
Workers Participation Rate - Female 34.2% 32.9%
2000
Female Enrolment Rate (Ages 6-14) 84.6%
Gender
Estimated Poverty Rate (1993-1994) 31.2%
Children as main workers (1991) 7.9%
Children as main and marginal workers (1991) 10.5%
Percentage of safe deliveries (1998-1999) 43.3
Percentage of children fully immunised (1998-1999) 41.4
Deprivation
1991 2001
Literacy (%) : All 44.9% 66.0%
Male 56.7% 76.7%
Female 32.5% 54.8%
Rural 36.3% 60.8%
Urban 72.5% 81.5%
Access to Education 2000
Enrolment Rate (Ages 6-14) 86.7%
Gross access ratio at primary level 100.0%
Habitations with Primary Schools 100.0%
Education
2000
Habitations with SDW facility 99.8%
Habitations without 40 lpd water availability 0.4%
Number of villages electrified 1897
Percentage of villages not connected with pucca roads 68.8
1991
Households without access to electricity, SDW and toilet facilities 18.40
Basic Amenities
1999
Per Capita Forest Area (in hectares) 0.259
Annual Rate of Afforestation (%) (1993-1999) 0.82
Major Non-Timber Forest Produce :
Tendu Leaves, Harra, Achar Guthli, Aonla, Sal Seeds
Forests

D I S T R I C T FA C T S H E E T S
164
Land Use Classification in 1998-99
1978 1998
Net Area Sown (in 000' ha.) 476.3 495.9
Gross Cropped Area (in 000' ha.) 528.0 615.5
Double Cropped Area to Net Area Sown 10.9 24.1
Net Irrigated Area (in 000' ha.) 39.3 120.0
Gross Irrigated Area (in 000' ha.) 48.7 128.0
1992-93 1998-99
Agriculture Intensity 113.6 124.1
Agriculture and Land Use over
30 Years
1978 1998
Net Sown Area to Total Geographical Area 40.2% 41.9%
Gross Cropped Area to Total Area 44.6% 51.9%
Net Irrigated to Net Sown Area 8.3% 24.2%
Cropped Area under Food Grains 79.9% 61.9%
Yield of Food Grains (in kg. per hectare) 543 1143
Per Capita Food Production (in kgs.) 243.6
Land Use and Agriculture
2000
Credit-Deposit Ratio 44.87
Commercial Banks (per 1000 population) 0.04
Crop lending per hectare of cultivated land 636.9
Crop lending per hectare of irrigated land 3707.7
Credit
2001
Number of towns reporting slums 22
Urban population residing in slums 6.51%
Level of ground water development 35.06
Average annual rainfall (in mm) 1053.70
1995 2000
Percentage area under wasteland 8.9% 15.46%
Habitat
1991 1998-99
Cereals Per Capita (Kg) 260.1 198.6
Pulses Per Capita (Kg) 60.1 45.0
Oilseeds Per Capita (Kg) 106.4 66.8
Average Landholding (Ha) 3.0 2.33
Gross Irrigated Area ('000 Ha) 128.0
Fertiliser Consumption Per Hectare (Kg) 23.0 30.64
1993 1999
Cropping Intensity 114 124.1
Land Use and Agriculture
Lorenz Curve of Operational Holdings
Cumulative percentage of Land Holdings
0.00 0.25 0.50 0.75 1.00
1.00
0.80
0.60
0.40
0.20
0.00
Cum
ulat
ive
perc
enta
ge o
f Lan
d Ar
ea
Net AreaSown(42%)
Fallow Land (5%)
CultivableWasteland(2%)
OtherUncultivableLand excludingFallow Land(4%)
Land NotAvailable for
Cultivation(7%)
Forest (40%)
NA = not available

165
D I S T R I C T FA C T S H E E T S
% Net % Gross
Name of Block Total Net Sown Gross Per capita Agriculture irrigated area to irrigated area to Level of GW Status of
Cropped Area Cropped Net Sown Area Intensity net sown area total cropped area Development ground water
Chhindwara 608.08 71.2% 92.7% 0.35 130 33.75 25.92 81.075 Grey
Tamia 1268.02 23.6% 26.4% 0.39 112 9.88 8.65 7.203 White
Parasia 649.91 67.6% 80.3% 0.32 119 20.53 17.24 35.632 White
Mohkhera 686.59 71.0% 87.8% 0.39 124 15.16 12.83 99.860 Dark
Jamai 1071.62 32.1% 35.1% 0.25 110 9.43 8.61 13.261 White
Sausar 672.9 61.6% 67.7% 0.41 110 7.82 13.28 30.332 White
Pandhurna 822.9 69.2% 80.5% 0.48 116 23.02 19.79 43.741 White
Bichhua 453 59.9% 70.9% 0.42 118 5.58 4.99 17.928 White
Amarwara 813.88 66.1% 77.3% 0.53 117 14.86 12.65 41.280 White
Chaurai 890.55 75.4% 94.6% 0.51 125 25.39 20.22 44.129 White
Harrai 1659.76 28.4% 30.6% 0.57 108 4.92 4.59 3.228 White
Name of Block SC ST Road length Villages connected by all Population serviced per
per 100 sq.kms. weatherroads post office (1993-' 94)
Chhindwara 13.33 27.77 52.62 53.03 4833
Tamia 5.79 77.62 7.33 50.91 4481
Parasia 14.32 39.44 9.54 32.12 6066
Mohkhera 9.82 29.44 20.54 10.67 5022
Jamai 13.23 58.06 7.00 11.28 5412
Sausar 14.03 20.08 2.93 12.78 3652
Pandhurna 11.41 40.33 12.39 15.53 4131
Bichhua 10.84 55.47 20.97 4.90 6484
Amarwara 11.95 38.56 40.42 8.16 2986
Chaurai 9.87 19.58 13.25 16.02 32831
Harrai 8.01 80.44 27.65 7.48 6891
Population in 1991 Infrastructure (in percentage) (1991)
Sex ratio Agriculture Worker labourers in participation
Name of Tehsil Total Rural Urban Urbanisation Total Rural Urban Female All Child workers (%) ratio
Chhindwara 431558 277923 153635 35.6% 74.3% 68.2% 84.9% 64.5% 949 949 30.40 38.89
Amarwara 248239 226776 21463 8.6% 57.6% 55.6% 78.2% 44.6% 978 980 32.36 51.45
Sausar 169162 125658 43504 25.7% 76.1% 74.8% 79.6% 67.0% 938 945 45.19 45.52
Tamia 89034 89034 - - 52.1% 52.1% 0.0% 37.0% 963 949 34.41 50.52
Parasia 272058 151113 120945 44.5% 66.6% 56.8% 78.2% 55.3% 942 958 23.33 33.57
Jamai 214582 154200 60382 28.1% 54.6% 43.0% 81.6% 43.6% 969 1003 27.15 37.15
Pandhurna 177617 136711 40906 23.0% 69.3% 65.3% 82.5% 58.6% 951 955 45.71 46.64
Bichhua 77549 77549 - - 66.2% 66.2% 0.0% 54.0% 969 950 47.56 44.68
Chaurai 169083 157684 11399 6.7% 63.5% 62.3% 79.4% 51.1% 934 952 47.21 43.35
Population Literacy Select Gender EmploymentIndicators
Agriculture and Irrigation Status ofGround Water

D I S T R I C T FA C T S H E E T S
166
Human Development Index (HDI) 0.568
Rank in Madhya Pradesh : HDI 18
Gender Related Development Index (GDI) 0.586
Rank in Madhya Pradesh : GDI 11
Human Development Indices - 2002
Area (in sq. km) 7306
Total Inhabited Villages 1205
Total Habitations 1405
Forest Villages 1
Towns (Class I to IV) and Major Towns 5
Damoh
Crop Zone :
Wheat Zone
Soil type :
Medium Black and Deep Black (Medium/ Heavy)
Agri Climatic Zone :
Vindhya Plateau
Schedule V Areas :
No Schedule V area
Basic Details on the District
1981 1991
Infant Mortality Rate 173 123
1991 2001
Life Expectancy (years) 50.7 54.0
1976-81 1984-90
Crude Birth Rate 39.7 40.1
Health
Janpad Panchayats 7
Gram Panchayats 456
Tehsils 7
Tribal Blocks 0
Legislative Assembly Seats 4
Administrative Information
0.5680.719
0.484 0.501
0.000
0.200
0.400
0.600
0.800
1.000
Graph on Human Development Index
1991 2001
Population 898125 1081909
Share of Madhya Pradesh Population 1.85% 1.79%
Urban Population 18.1% 18.9%
Population of Scheduled Castes (SC) 20.1% n.a.
Population of Scheduled Tribes (ST) 12.4% n.a.
Density of Population (per sq. kms.) 123 148
All 24.49 20.46
Rural n.a. 19.37
Urban n.a. 25.41
Decadal Growth (%) 1981-91 1991- 00 1991 1998-99
Per Capita Food Production (in kgs.) 238.16 238.69
1996 2000
FPS per lakh population 42.54 40
Food
D A M O H
HDI Education Health Income
Demography
DAMOH

167
D I S T R I C T FA C T S H E E T S
1991 2001
Worker Participation Rate :
All 40.9% 44.8%
Rural 43.0% 47.3%
Urban 31.6% 34.2%
Share of Primary Sector (%) 63.8% n.a.
Share of Secondary Sector (%) 24.0% n.a.
Share of Tertiary Sector (%) 12.14% n.a.
Employment in Registered Industries (2000) 3178
Employment Rate of Growth (1991 to 2001) n.a. 32.0%
Total Employment in Farm Sector (%) 63.7% 57.63
Rural Employment in Non Farm Sector (%) 27.3% 34.1%
Agriculture Labour (%) 26.1% 29.7%
Employment
2001
Middle Schools per lakh population 24.9
High Schools per lakh population 8.4
Rural Population per Primary Health Centre 58506
Population Serviced Sub Health Centre 5417
2000
Road length per 100 sq. km. (1999) 21.3
Telephone per lakh population 665
Population per Post Office (1994-95) 5324
Registered establishments under Factories Act (1997) 63
Per capita consumption of electricity (non industrial) in kwh 298.7
Infrastructure / Facilities
1991 2001
Life Expectancy of Females at Birth 51.1 55.7
Child Sex Ratio 930 948
Girl Child Mortality (birth to age 1 year) 139 n.a.
Girl Child Mortality (up to age 5 years) 173 n.a.
Total Fertility Rate 5.3 n.a.
Gender Ratio : All 905 902
Rural 908 903
Urban 895 901
General non SC/ ST Gender Ratio 903 n.a.
SC Gender Ratio 885 n.a.
ST Gender Ratio 951 n.a.
Workers Participation Rate - Female 28.2% 35.6%
2000
Female Enrolment Rate (Ages 6-14) 90.9%
Gender
Estimated Poverty Rate (1993-1994) 55.3%
Children as main workers (1991) 4.9%
Children as main and marginal workers (1991) 6.4%
Percentage of safe deliveries (1998-1999) 29.1
Percentage of children fully immunised (1998-1999) 27.2
Deprivation
1991 2001
Literacy (%) : All 46.3% 62.1%
Male 60.5% 75.1%
Female 30.5% 47.5%
Rural 40.0% 57.4%
Urban 73.8% 81.1%
Access to Education 2000
Enrolment Rate (Ages 6-14) 91.6%
Gross access ratio at primary level 100.0%
Habitations with Primary Schools 100.0%
Education
2000
Habitations with SDW facility 96.9%
Habitations without 40 lpd water availability 3.2%
Number of villages electrified 1110
Percentage of villages not connected with pucca roads 62.9
1991
Households without access to electricity, SDW and toilet facilities 43.69
Basic Amenities
1999
Per Capita Forest Area (in hectares) 0.282
Annual Rate of Afforestation (%) (1993-1999) -1.04
Major Non-Timber Forest Produce :
Tendu Leaves, Khair
Forests

D I S T R I C T FA C T S H E E T S
168
Land Use Classification in 1998-99
1978 1998
Net Area Sown (in 000' ha.) 277.0 302.3
Gross Cropped Area (in 000' ha.) 304.9 389.1
Double Cropped Area to Net Area Sown 10.1 28.7
Net Irrigated Area (in 000' ha.) 12.6 81.3
Gross Irrigated Area (in 000' ha.) 16.0 83.4
1992-93 1998-99
Agriculture Intensity 115.1 128.7
Agriculture and Land Use over
30 Years
1978 1998
Net Sown Area to Total Geographical Area 38.0% 41.5%
Gross Cropped Area to Total Area 41.8% 53.4%
Net Irrigated to Net Sown Area 4.5% 26.9%
Cropped Area under Food Grains 86.8% 73.0%
Yield of Food Grains (in kg. per hectare) 643 876
Per Capita Food Production (in kgs.) 238.7
Land Use and Agriculture
2000
Credit-Deposit Ratio 57.31
Commercial Banks (per 1000 population) 0.03
Crop lending per hectare of cultivated land 596.4
Crop lending per hectare of irrigated land 2994.4
Credit
2001
Number of towns reporting slums 5
Urban population residing in slums 13.72%
Level of ground water development 33.35
Average annual rainfall (in mm) 1224.00
1995 2000
Percentage area under wasteland 14.4% 25.56%
Habitat
1991 1998-99
Cereals Per Capita (Kg) 175.5 171.4
Pulses Per Capita (Kg) 62.7 67.3
Oilseeds Per Capita (Kg) 17.0 50.2
Average Landholding (Ha) 2.8 2.31
Gross Irrigated Area ('000 Ha) 83.4
Fertiliser Consumption Per Hectare (Kg) 16.1 20.59
1993 1999
Cropping Intensity 115 128.7
Land Use and Agriculture
Lorenz Curve of Operational Holdings
Cumulative percentage of Land Holdings
0.00 0.25 0.50 0.75 1.00
1.00
0.80
0.60
0.40
0.20
0.00
Cum
ulat
ive
perc
enta
ge o
f Lan
d Ar
ea
Net AreaSown(42%)
Fallow Land (2%)
CultivableWasteland(2%)
OtherUncultivableLand excludingFallow Land(5%)
Land NotAvailable for
Cultivation(12%)
Forest (37%)
NA = not available

169
D I S T R I C T FA C T S H E E T S
% Net % Gross
Name of Block Total Net Sown Gross Per capita Agriculture irrigated area to irrigated area to Level of GW Status of
Cropped Area Cropped Net Sown Area Intensity net sown area total cropped area Development ground water
Damoh 861.28 63.3% 75.3% 0.39 119 14.65 12.71 56.351 White
Patharia 677.77 82.5% 102.3% 0.53 124 22.67 18.32 74.627 Grey
Jabera 907.79 34.9% 47.3% 0.27 135 13.53 28.53 9.558 White
Tendukheda 676.17 39.7% 51.1% 0.27 128 26.49 22.1 8.090 White
Hatta 704.96 63.3% 70.6% 0.52 112 13.84 12.76 27.171 White
Patera 647.25 62.9% 71.5% 0.46 114 15.42 13.54 18.010 White
Batiagarh 653.8 58.9% 72.1% 0.4 122 29.09 23.78 47.730 White
Agriculture and Irrigation Status ofGround Water
Name of Block SC ST Road length Villages connected by all Population serviced per
per 100 sq.kms. weatherroads post office (1993-' 94)
Damoh 21.21 11.72 26.12 29.66 3665
Patharia 22.61 4.64 15.05 25.95 4437
Jabera 18.06 23.29 27.32 35.33 4424
Tendukheda 14.87 29.6 32.24 30.77 5790
Hatta 23.4 11.65 25.67 40 5024
Patera 21.67 10.39 49.13 38.36 5220
Batiagarh 20.9 11.36 22.18 30.14 5710
Population in 1991 Infrastructure (in percentage) (1991)
Sex ratio Agriculture Worker labourers in participation
Name of Tehsil Total Rural Urban Urbanisation Total Rural Urban Female All Child workers (%) ratio
Damoh 310476 163079 147397 47.5% 70.8% 60.2% 82.0% 58.8% 897 936 22.10 40.42
Patharia 146585 129403 17182 11.7% 65.0% 63.2% 77.9% 49.3% 894 962 39.74 43.68
Jabera 141741 141741 - - 60.0% 60.0% 0.0% 43.3% 919 942 25.66 47.99
Tendukheda 128180 116952 11228 8.8% 55.7% 54.1% 72.4% 39.4% 920 960 33.30 47.24
Hatta 128761 100253 28508 22.1% 56.8% 49.5% 81.6% 43.1% 889 946 26.75 49.70
Patera 107454 107454 - - 54.1% 54.1% 0.0% 38.7% 906 959 35.46 44.36
Batiagarh 118712 118712 - - 57.3% 57.3% 0.0% 41.8% 900 952 34.64 46.66
Population Literacy Select Gender EmploymentIndicators

D I S T R I C T FA C T S H E E T S
170
Human Development Index (HDI) 0.543
Rank in Madhya Pradesh : HDI 28
Gender Related Development Index (GDI) 0.549
Rank in Madhya Pradesh : GDI 22
Human Development Indices - 2002
Area (in sq. km) 2691
Total Inhabited Villages 542
Total Habitations 710
Forest Villages 0
Towns (Class I to IV) and Major Towns 4
Datia
Crop Zone :
Wheat Jowar
Soil type :
Mixed Red and Black (Medium)
Agri Climatic Zone :
Bundelkhand Region
Schedule V Areas :
No Schedule V area
Basic Details on the District
1981 1991
Infant Mortality Rate 176 115
1991 2001
Life Expectancy (years) 52.2 55.2
1976-81 1984-90
Crude Birth Rate 36.1 39.5
Health
Janpad Panchayats 3
Gram Panchayats 250
Tehsils 3
Tribal Blocks 0
Legislative Assembly Seats 3
Administrative Information
0.543
0.803
0.5040.322
0.000
0.200
0.400
0.600
0.800
1.000
Graph on Human Development Index
1991 2001
Population 515360 627818
Share of Madhya Pradesh Population 1.06% 1.04%
Urban Population 20.4% 21.9%
Population of Scheduled Castes (SC) 24.8% n.a.
Population of Scheduled Tribes (ST) 1.5% n.a.
Density of Population (per sq. kms.) 192 233
All 26.01 21.82
Rural n.a. 19.58
Urban n.a. 30.54
Decadal Growth (%) 1981-91 1991- 00 1991 1998-99
Per Capita Food Production (in kgs.) 339.88 404.63
1996 2000
FPS per lakh population 29.94 29
Food
D A T I A
HDI Education Health Income
Demography
DATIA

171
D I S T R I C T FA C T S H E E T S
2001
Middle Schools per lakh population 38.8
High Schools per lakh population 13.6
Rural Population per Primary Health Centre 44570
Population Serviced Sub Health Centre 5635
2000
Road length per 100 sq. km. (1999) 20.2
Telephone per lakh population 947
Population per Post Office (1994-95) 4480
Registered establishments under Factories Act (1997) 49
116.5
Per capita consumption of electricity (non industrial) in kwh 120.8
Infrastructure / Facilities
1991 2001
Life Expectancy of Females at Birth 50.1 51.6
Child Sex Ratio 899 874
Girl Child Mortality (birth to age 1 year) 141 n.a.
Girl Child Mortality (up to age 5 years) 213 n.a.
Total Fertility Rate 5.8 n.a.
Gender Ratio : All 847 858
Rural 841 855
Urban 871 870
General non SC/ ST Gender Ratio 849 n.a.
SC Gender Ratio 839 n.a.
ST Gender Ratio 877 n.a.
Workers Participation Rate - Female 21.4% 43.2%
2000
Female Enrolment Rate (Ages 6-14) 93.4%
Gender
Estimated Poverty Rate (1993-1994) 17.5%
Children as main workers (1991) 2.9%
Children as main and marginal workers (1991) 4.8%
Percentage of safe deliveries (1998-1999) 32.9
Percentage of children fully immunised (1998-1999) 35.1
Deprivation
1991 2001
Literacy (%) : All 45.2% 73.5%
Male 62.5% 82.9%
Female 24.5% 62.5%
Rural 40.5% 72.0%
Urban 63.3% 78.6%
Access to Education 2000
Enrolment Rate (Ages 6-14) 94.0%
Gross access ratio at primary level 100.0%
Habitations with Primary Schools 100.0%
Education
2000
Habitations with SDW facility 100.0%
Habitations without 40 lpd water availability 0.0%
Number of villages electrified 539
Percentage of villages not connected with pucca roads 55.4
1991
Households without access to electricity, SDW and toilet facilities 24.18
Basic Amenities
1999
Per Capita Forest Area (in hectares) 0.022
Annual Rate of Afforestation (%) (1993-1999) 18.52
Major Non-Timber Forest Produce :
Tendu Leaves
Forests
1991 2001
Worker Participation Rate :
All 37.2% 50.4%
Rural 39.7% 55.1%
Urban 27.3% 33.4%
Share of Primary Sector (%) 78.9% n.a.
Share of Secondary Sector (%) 5.9% n.a.
Share of Tertiary Sector (%) 15.23% n.a.
Employment in Registered Industries (2000) 1327
Employment Rate of Growth (1991 to 2001) n.a. 65.0%
Total Employment in Farm Sector (%) 78.8% 78.19
Rural Employment in Non Farm Sector (%) 10.1% 11.6%
Agriculture Labour (%) 14.0% 16.0%
Employment

D I S T R I C T FA C T S H E E T S
172
Land Use Classification in 1998-99
1978 1998
Net Area Sown (in 000' ha.) 127.3 190.6
Gross Cropped Area (in 000' ha.) 130.0 209.2
Double Cropped Area to Net Area Sown 2.1 9.7
Net Irrigated Area (in 000' ha.) 30.0 81.4
Gross Irrigated Area (in 000' ha.) 30.1 85.5
1992-93 1998-99
Agriculture Intensity 106.0 109.7
Agriculture and Land Use over
30 Years
1978 1998
Net Sown Area to Total Geographical Area 62.6% 72.2%
Gross Cropped Area to Total Area 63.9% 79.2%
Net Irrigated to Net Sown Area 23.6% 42.7%
Cropped Area under Food Grains 92.5% 84.2%
Yield of Food Grains (in kg. per hectare) 668 1386
Per Capita Food Production (in kgs.) 404.6
Land Use and Agriculture
2000
Credit-Deposit Ratio 51.02
Commercial Banks (per 1000 population) 0.04
Crop lending per hectare of cultivated land 2017.5
Crop lending per hectare of irrigated land 4992.1
Credit
2001
Number of towns reporting slums 4
Urban population residing in slums 10.99%
Level of ground water development 42.87
Average annual rainfall (in mm) 742.60
1995 2000
Percentage area under wasteland 21.7% 30.60%
Habitat
1991 1998-99
Cereals Per Capita (Kg) 233.9 259.6
Pulses Per Capita (Kg) 106.0 145.0
Oilseeds Per Capita (Kg) 18.2 25.4
Average Landholding (Ha) 2.8 2.50
Gross Irrigated Area ('000 Ha) 85.5
Fertiliser Consumption Per Hectare (Kg) 32.5 43.03
1993 1999
Cropping Intensity 106 109.7
Land Use and Agriculture
Lorenz Curve of Operational Holdings
Cumulative percentage of Land Holdings
0.00 0.25 0.50 0.75 1.00
1.00
0.80
0.60
0.40
0.20
0.00
Cum
ulat
ive
perc
enta
ge o
f Lan
d Ar
ea
Net AreaSown(72%)
Fallow Land (3%)
CultivableWasteland(4%)
OtherUncultivableLand excludingFallow Land(3%)
Land NotAvailable for
Cultivation(10%)
Forest (8%)
NA = not available

173
D I S T R I C T FA C T S H E E T S
% Net % Gross
Name of Block Total Net Sown Gross Per capita Agriculture irrigated area to irrigated area to Level of GW Status of
Cropped Area Cropped Net Sown Area Intensity net sown area total cropped area Development ground water
Datia 1006.92 66.7% 72.5% 0.41 109 33.06 32.08 80.842 Grey
Sewda 894.05 73.5% 77.1% 0.45 105 48.46 46.24 43.416 White
Bhander 652.75 85.2% 87.1% 0.54 102 27.89 28.22 12.704 White
Agriculture and Irrigation Status ofGround Water
Name of Block SC ST Road length Villages connected by all Population serviced per
per 100 sq.kms. weatherroads post office (1993-' 94)
Datia 28.11 3.48 22.64 26.83 2894
Sewda 26.25 0.24 17.78 23.59 3378
Bhander 26.28 0.76 15.47 24.64 3539
Population in 1991 Infrastructure (in percentage) (1991)
Sex ratio Agriculture Worker labourers in participation
Name of Tehsil Total Rural Urban Urbanisation Total Rural Urban Female All Child workers (%) ratio
Sewda 208804 174668 34136 16.3% 71.3% 70.9% 73.3% 57.1% 842 856 17.92 50.06
Datia 278612 195870 82742 29.7% 74.3% 71.8% 80.1% 67.9% 869 890 13.83 47.03
Bhander 140402 119735 20667 14.7% 75.1% 74.1% 81.0% 59.7% 862 873 16.96 57.45
Population Literacy Select Gender EmploymentIndicators

D I S T R I C T FA C T S H E E T S
174
Human Development Index (HDI) 0.610
Rank in Madhya Pradesh : HDI 10
Gender Related Development Index (GDI) 0.634
Rank in Madhya Pradesh : GDI 1
Human Development Indices - 2002
Area (in sq. km) 7020
Total Inhabited Villages 1058
Total Habitations 1240
Forest Villages 19
Towns (Class I to IV) and Major Towns 11
Dewas
Crop Zone :
Cotton Jowar
Soil type :
Medium Black (Medium)
Agri Climatic Zone :
Malwa Plateau
Schedule V Areas :
No Schedule V area
Basic Details on the District
1981 1991
Infant Mortality Rate 121 90
1991 2001
Life Expectancy (years) 58.1 63.3
1976-81 1984-90
Crude Birth Rate 39.5 37.0
Health
Janpad Panchayats 6
Gram Panchayats 459
Tehsils 6
Tribal Blocks 0
Legislative Assembly Seats 5
Administrative Information
0.6100.695 0.639
0.497
0.000
0.200
0.400
0.600
0.800
1.000
Graph on Human Development Index
1991 2001
Population 1033807 1306617
Share of Madhya Pradesh Population 2.13% 2.16%
Urban Population 25.9% 27.4%
Population of Scheduled Castes (SC) 18.2% n.a.
Population of Scheduled Tribes (ST) 15.0% n.a.
Density of Population (per sq. kms.) 147 186
All 29.99 26.39
Rural n.a. 23.9
Urban n.a. 33.51
Decadal Growth (%) 1981-91 1991- 00 1991 1998-99
Per Capita Food Production (in kgs.) 286.80 332.12
1996 2000
FPS per lakh population 30.68 27
Food
D E W A S
HDI Education Health Income
Demography
DEWAS

175
D I S T R I C T FA C T S H E E T S
1991 2001
Worker Participation Rate :
All 41.0% 44.3%
Rural 44.6% 49.4%
Urban 30.8% 30.8%
Share of Primary Sector (%) 76.6% n.a.
Share of Secondary Sector (%) 10.3% n.a.
Share of Tertiary Sector (%) 13.19% n.a.
Employment in Registered Industries (2000) 53425
Employment Rate of Growth (1991 to 2001) n.a. 36.5%
Total Employment in Farm Sector (%) 76.5% 77.05
Rural Employment in Non Farm Sector (%) 10.4% 10.2%
Agriculture Labour (%) 31.8% 35.3%
Employment
2001
Middle Schools per lakh population 25.5
High Schools per lakh population 10.3
Rural Population per Primary Health Centre 37970
Population Serviced Sub Health Centre 4944
2000
Road length per 100 sq. km. (1999) 14.5
Telephone per lakh population 1483
Population per Post Office (1994-95) 6846
Registered establishments under Factories Act (1997) 314
Per capita consumption of electricity (non industrial) in kwh 458.8
Infrastructure / Facilities
1991 2001
Life Expectancy of Females at Birth 56.8 62.0
Child Sex Ratio 932 934
Girl Child Mortality (birth to age 1 year) 102 n.a.
Girl Child Mortality (up to age 5 years) 139 n.a.
Total Fertility Rate 5.0 n.a.
Gender Ratio : All 924 932
Rural 933 936
Urban 899 919
General non SC/ ST Gender Ratio 916 n.a.
SC Gender Ratio 921 n.a.
ST Gender Ratio 962 n.a.
Workers Participation Rate - Female 30.3% 36.3%
2000
Female Enrolment Rate (Ages 6-14) 80.5%
Gender
Estimated Poverty Rate (1993-1994) 26.5%
Children as main workers (1991) 4.8%
Children as main and marginal workers (1991) 6.2%
Percentage of safe deliveries (1998-1999) 99.9
Percentage of children fully immunised (1998-1999) 50
Deprivation
1991 2001
Literacy (%) : All 44.1% 61.0%
Male 61.2% 76.1%
Female 25.6% 44.9%
Rural 35.9% 54.7%
Urban 67.0% 77.4%
Access to Education 2000
Enrolment Rate (Ages 6-14) 86.5%
Gross access ratio at primary level 100.0%
Habitations with Primary Schools 100.0%
Education
2000
Habitations with SDW facility 100.0%
Habitations without 40 lpd water availability 0.1%
Number of villages electrified 1053
Percentage of villages not connected with pucca roads 73.0
1991
Households without access to electricity, SDW and toilet facilities 15.25
Basic Amenities
1999
Per Capita Forest Area (in hectares) 0.132
Annual Rate of Afforestation (%) (1993-1999) -1.67
Major Non-Timber Forest Produce :
Tendu Leaves
Forests

D I S T R I C T FA C T S H E E T S
176
Land Use Classification in 1998-99
1978 1998
Net Area Sown (in 000' ha.) 348.5 373.5
Gross Cropped Area (in 000' ha.) 387.7 590.5
Double Cropped Area to Net Area Sown 11.2 58.1
Net Irrigated Area (in 000' ha.) 37.9 158.4
Gross Irrigated Area (in 000' ha.) 38.5 158.6
1992-93 1998-99
Agriculture Intensity 121.6 158.1
Agriculture and Land Use over
30 Years
1978 1998
Net Sown Area to Total Geographical Area 49.8% 53.3%
Gross Cropped Area to Total Area 55.4% 84.3%
Net Irrigated to Net Sown Area 10.9% 42.4%
Cropped Area under Food Grains 58.5% 42.2%
Yield of Food Grains (in kg. per hectare) 766 1661
Per Capita Food Production (in kgs.) 332.1
Land Use and Agriculture
2000
Credit-Deposit Ratio 83.48
Commercial Banks (per 1000 population) 0.04
Crop lending per hectare of cultivated land 895.1
Crop lending per hectare of irrigated land 3499.3
Credit
2001
Number of towns reporting slums 11
Urban population residing in slums 26.70%
Level of ground water development 50.91
Average annual rainfall (in mm) 1067.00
1995 2000
Percentage area under wasteland 20.7% 15.41%
Habitat
1991 1998-99
Cereals Per Capita (Kg) 236.5 247.3
Pulses Per Capita (Kg) 50.3 84.9
Oilseeds Per Capita (Kg) 145.5 258.9
Average Landholding (Ha) 4.6 3.71
Gross Irrigated Area ('000 Ha) 158.6
Fertiliser Consumption Per Hectare (Kg) 42.4 55.22
1993 1999
Cropping Intensity 122 158.1
Land Use and Agriculture
Lorenz Curve of Operational Holdings
Cumulative percentage of Land Holdings
0.00 0.25 0.50 0.75 1.00
1.00
0.80
0.60
0.40
0.20
0.00
Cum
ulat
ive
perc
enta
ge o
f Lan
d Ar
ea
Net AreaSown(54%)
Fallow Land (0%)
CultivableWasteland(0%)
OtherUncultivableLand excludingFallow Land(10%)
Land NotAvailable for
Cultivation(7%)
Forest (29%)
NA = not available

177
D I S T R I C T FA C T S H E E T S
% Net % Gorss
Name of Block Total Net Sown Gross Per capita Agriculture irrigated area to irrigated area to Level of GW Status of
Cropped Area Cropped Net Sown Area Intensity net sown area total cropped area Development ground water
Dewas 887.69 88.7% 131.8% 0.5 149 37.51 25.28 78.614 Grey
Sonkatch 625.49 67.6% 97.3% 0.43 144 40.03 27.82 79.243 Grey
Tonkkhurd 640.06 72.9% 100.0% 0.48 137 22.91 16.71 43.924 White
Kannod 1302.47 52.3% 64.8% 0.53 124 23.18 18.75 29.179 White
Khategaon 1067.63 56.2% 70.6% 0.55 126 27.07 21.57 42.737 White
Bagli 1407.53 50.3% 71.2% 0.41 142 33.4 22.88 42.578 White
Agriculture and Irrigation Status ofGround Water
Name of Block SC ST Road length Villages connected by all Population serviced per
per 100 sq.kms. weatherroads post office (1993-' 94)
Dewas 21.51 4.19 26.46 51.27 2029
Sonkatch 28.73 1.86 14.07 98.46 4272
Tonkkhurd 23.81 0.89 10.78 16.98 3382
Kannod 14.08 36.03 11.67 18.34 2485
Khategaon 15.66 23.7 7.12 10.84 2945
Bagli 17.01 33.05 13 25.67 4289
Population in 1991 Infrastructure (in percentage) (1991)
Sex ratio Agriculture Worker labourers in participation
Name of Tehsil Total Rural Urban Urbanisation Total Rural Urban Female All Child workers (%) ratio
Sonkatch 150051 124103 25948 17.3% 63.7% 60.8% 77.6% 45.0% 936 936 33.32 48.32
Dewas 420710 190052 230658 54.8% 71.5% 59.2% 81.3% 57.1% 925 919 23.15 38.48
Bagli 255549 219236 36313 14.2% 51.9% 49.4% 66.1% 36.4% 948 956 41.04 47.38
Kannod 206711 163286 43425 21.0% 50.8% 46.9% 65.1% 34.0% 932 945 45.22 46.02
Khategaon 154057 133039 21018 13.6% 55.8% 52.2% 77.7% 40.4% 915 909 43.44 45.28
Tonkkhurd 119539 119539 - - 63.2% 63.2% 0.0% 43.0% 938 948 33.82 49.21
Population Literacy Select Gender EmploymentIndicators

D I S T R I C T FA C T S H E E T S
178
Human Development Index (HDI) 0.559
Rank in Madhya Pradesh : HDI 23
Gender Related Development Index (GDI) 0.533
Rank in Madhya Pradesh : GDI 28
Human Development Indices - 2002
Area (in sq. km) 8153
Total Inhabited Villages 1487
Total Habitations 6438
Forest Villages 14
Towns (Class I to IV) and Major Towns 9
Dhar, Pithampura
Crop Zone :
Cotton Jowar
Soil type :
Medium Black (Medium)
Agri Climatic Zone :
Malwa Plateau (except Kukshi and Manawar Tehsil), Nimar Plain (Kukshi and
Manawar Tehsil)
Schedule V Areas :
All Blocks of Sardarpur, Dhar, Kukshi, Manawar, Gandhwani, Dharmpuri Tehsils
Basic Details on the District
1981 1991
Infant Mortality Rate 123 84
1991 2001
Life Expectancy (years) 58.9 63.4
1976-81 1984-90
Crude Birth Rate 38.9 37.2
Health
Janpad Panchayats 13
Gram Panchayats 669
Tehsils 7
Tribal Blocks 12
Legislative Assembly Seats 6
Administrative Information
0.559 0.611 0.641
0.425
0.000
0.200
0.400
0.600
0.800
1.000
Graph on Human Development Index
1991 2001
Population 1367412 1740577
Share of Madhya Pradesh Population 2.82% 2.88%
Urban Population 13.1% 16.6%
Population of Scheduled Castes (SC) 6.9% n.a.
Population of Scheduled Tribes (ST) 53.5% n.a.
Density of Population (per sq. kms.) 168 213
All 29.31 27.29
Rural n.a. 22.28
Urban n.a. 60.39
Decadal Growth (%) 1981-91 1991- 00 1991 1998-99
Per Capita Food Production (in kgs.) 275.26 303.76
1996 2000
FPS per lakh population 29.52 28
Food
D H A R
HDI Education Health Income
Demography
DHAR

179
D I S T R I C T FA C T S H E E T S
1991 2001
Worker Participation Rate :
All 46.7% 46.6%
Rural 48.8% 49.2%
Urban 32.9% 33.8%
Share of Primary Sector (%) 84.1% n.a.
Share of Secondary Sector (%) 5.9% n.a.
Share of Tertiary Sector (%) 10.03% n.a.
Employment in Registered Industries (2000) 64550
Employment Rate of Growth (1991 to 2001) n.a. 27.0%
Total Employment in Farm Sector (%) 84.1% 81.76
Rural Employment in Non Farm Sector (%) 9.4% 9.8%
Agriculture Labour (%) 24.1% 29.6%
Employment
2001
Middle Schools per lakh population 30.1
High Schools per lakh population 10.5
Rural Population per Primary Health Centre 29047
Population Serviced Sub Health Centre 3631
2000
Road length per 100 sq. km. (1999) 25.3
Telephone per lakh population 1249
Population per Post Office (1994-95) 7449
Registered establishments under Factories Act (1997) 593
Per capita consumption of electricity (non industrial) in kwh 517.6
Infrastructure / Facilities
1991 2001
Life Expectancy of Females at Birth 58.0 60.7
Child Sex Ratio 970 941
Girl Child Mortality (birth to age 1 year) 102 n.a.
Girl Child Mortality (up to age 5 years) 127 n.a.
Total Fertility Rate 5.1 n.a.
Gender Ratio : All 951 954
Rural 960 970
Urban 892 875
General non SC/ ST Gender Ratio 918 n.a.
SC Gender Ratio 940 n.a.
ST Gender Ratio 977 n.a.
Workers Participation Rate - Female 40.3% 40.4%
2000
Female Enrolment Rate (Ages 6-14) 74.0%
Gender
Estimated Poverty Rate (1993-1994) 21.8%
Children as main workers (1991) 8.7%
Children as main and marginal workers (1991) 11.4%
Percentage of safe deliveries (1998-1999) 35.7
Percentage of children fully immunised (1998-1999) 36.5
Deprivation
1991 2001
Literacy (%) : All 34.5% 52.7%
Male 47.6% 66.2%
Female 20.7% 38.6%
Rural 29.4% 48.0%
Urban 67.4% 75.2%
Access to Education 2000
Enrolment Rate (Ages 6-14) 78.0%
Gross access ratio at primary level 100.0%
Habitations with Primary Schools 100.0%
Education
2000
Habitations with SDW facility 98.8%
Habitations without 40 lpd water availability 1.2%
Number of villages electrified 1479
Percentage of villages not connected with pucca roads 70.5
1991
Households without access to electricity, SDW and toilet facilities 15.30
Basic Amenities
1999
Per Capita Forest Area (in hectares) 0.038
Annual Rate of Afforestation (%) (1993-1999) 2.16
Major Non-Timber Forest Produce :
Tendu Leaves
Forests

D I S T R I C T FA C T S H E E T S
180
Land Use Classification in 1998-99
1978 1998
Net Area Sown (in 000' ha.) 492.1 505.3
Gross Cropped Area (in 000' ha.) 565.2 731.6
Double Cropped Area to Net Area Sown 14.9 44.8
Net Irrigated Area (in 000' ha.) 56.3 232.6
Gross Irrigated Area (in 000' ha.) 56.3 232.6
1992-93 1998-99
Agriculture Intensity 129.3 144.8
Agriculture and Land Use over
30 Years
1978 1998
Net Sown Area to Total Geographical Area 60.0% 61.7%
Gross Cropped Area to Total Area 69.0% 89.3%
Net Irrigated to Net Sown Area 11.4% 46.0%
Cropped Area under Food Grains 64.0% 48.1%
Yield of Food Grains (in kg. per hectare) 668 1431
Per Capita Food Production (in kgs.) 303.8
Land Use and Agriculture
2000
Credit-Deposit Ratio 64.33
Commercial Banks (per 1000 population) 0.03
Crop lending per hectare of cultivated land 1054.5
Crop lending per hectare of irrigated land 3380.5
Credit
2001
Number of towns reporting slums 9
Urban population residing in slums 3.43%
Level of ground water development 63.23
Average annual rainfall (in mm) 875.00
1995 2000
Percentage area under wasteland 15.9% 23.30%
Habitat
1991 1998-99
Cereals Per Capita (Kg) 237.5 271.7
Pulses Per Capita (Kg) 37.7 32.0
Oilseeds Per Capita (Kg) 114.5 168.2
Average Landholding (Ha) 3.7 3.07
Gross Irrigated Area ('000 Ha) 232.6
Fertiliser Consumption Per Hectare (Kg) 53.4 64.37
1993 1999
Cropping Intensity 129 144.8
Land Use and Agriculture
Lorenz Curve of Operational Holdings
Cumulative percentage of Land Holdings
0.00 0.25 0.50 0.75 1.00
1.00
0.80
0.60
0.40
0.20
0.00
Cum
ulat
ive
perc
enta
ge o
f Lan
d Ar
ea
Net AreaSown(62%)
Fallow Land (1%)
CultivableWasteland(2%)
OtherUncultivableLand excludingFallow Land(6%)
Land NotAvailable for
Cultivation(14%)
Forest (15%)
NA = not available

181
D I S T R I C T FA C T S H E E T S
% Net % GrossName of Block Total Net Sown Gross Per capita Agriculture irrigated area to Irrigated area to Level of GW Status of
Cropped Area Cropped Net Sown Area Intensity net sown area total cropped area Development ground water
Dhar 578.94 82.4% 130.2% 0.67 158 40.64 25.73 156.823 Over Exploited
Nalchha 783.66 56.5% 85.6% 0.39 152 31.54 20.81 119.441 Over Exploited
Tirla 343.18 73.7% 99.9% 0.45 136 23.53 17.36 63.471 White
Badnawar 1038.49 75.2% 118.5% 0.56 158 40.26 25.55 188.926 Over Exploited
Sardarpur 1279.84 61.0% 82.2% 0.46 135 26.85 19.94 65.247 Grey
Manawar 555.52 75.3% 87.5% 0.44 116 37.28 32.08 120.546 Over Exploited
Dharampuri 428.66 61.9% 75.6% 0.29 122 46.19 37.85 57.921 Grey
Gandhwani 694.73 50.6% 58.8% 0.37 116 36.28 29.79 22.973 White
Bakaner 478.78 67.6% 82.4% 0.36 122 17.62 15.15 70.854 Grey
Kukshi 343.53 68.2% 79.6% 0.4 117 19.26 16.52 31.709 White
Nisarpur 353.04 72.7% 85.1% 0.42 117 42.39 36.22 15.532 White
Bagh 502.61 51.4% 57.1% 0.38 111 9.68 8.72 8.966 White
Dahi 482.23 42.7% 52.0% 0.26 122 24.35 19.99 20.344 White
Agriculture and Irrigation Status ofGround Water
Name of Block SC ST Road length Villages connected by all Population serviced per per 100 sq.kms. weatherroads post office (1993-' 94)
Dhar 16.78 12.06 26.4 30.5 2386
Nalchha 8.9 44.31 17.6 36.0 4202
Tirla 4.41 71.57 4.5 66.0 3744
Badnawar 11.77 33.22 21.2 39.5 3021
Sardarpur 3.98 57.78 25.5 94.2 3819
Manawar 8.09 56.54 29.0 50.0 4569
Dharampuri 8.43 54.61 31.5 88.0 4031
Gandhwani 2.34 87.94 17.4 15.0 9615
Bakaner 5.1 74.96 18.4 25.2 6375
Kukshi 4.93 81.74 34.9 91.7 4515
Nisarpur 8.75 45.85 37.4 145.6 3582
Bagh 1.88 95.02 27.7 42.2 8459
Dahi 3.75 83.84 24.7 51.6 8655
Population in 1991 Infrastructure (in percentage) (1991)
Sex ratio Agriculture Worker labourers in participation
Name of Tehsil Total Rural Urban Urbanisation Total Rural Urban Female All Child workers (%) ratio
Badnawar 193634 175888 17746 9.2% 57.0% 54.9% 76.6% 40.1% 965 926 33.10 48.75
Sardarpur 230463 208733 21730 9.4% 50.3% 47.3% 77.4% 34.1% 962 929 30.44 48.03
Dhar 431852 279784 152068 35.2% 61.5% 52.9% 76.6% 46.2% 902 935 29.39 40.75
Kukshi 356188 324456 31732 8.9% 40.4% 36.8% 75.0% 29.4% 981 962 24.47 50.68
Manawar 254860 229400 25460 10.0% 52.9% 50.9% 70.0% 38.9% 977 915 34.24 48.11
Gandhwani 122159 122159 - - 42.7% 42.7% 0.0% 32.3% 987 1009 13.70 49.50
Dharampuri 151421 111922 39499 26.1% 61.6% 57.9% 71.8% 48.7% 951 926 43.93 44.27
Population Literacy Select Gender EmploymentIndicators

D I S T R I C T FA C T S H E E T S
182
Human Development Index (HDI) 0.557
Rank in Madhya Pradesh : HDI 24
Gender Related Development Index (GDI) 0.617
Rank in Madhya Pradesh : GDI 5
Human Development Indices - 2002
Area (in sq. km) 7470
Total Inhabited Villages 899
Total Habitations 3005
Forest Villages 130
Towns (Class I to IV) and Major Towns 2
No major Town
Crop Zone :
Rice Zone (in some parts)
Soil type :
Red and Yellow, Medium Black and Skeletal Medium/ Light
Agri Climatic Zone :
Northern Hills
Schedule V Areas :
Entire Dindori District
Basic Details on the District
1981 1991
Infant Mortality Rate n.a. n.a.
1991 2001
Life Expectancy (years) 58.1 62.6
1976-81 1984-90
Crude Birth Rate n.a. n.a.
Health
Janpad Panchayats 7
Gram Panchayats 398
Tehsils 2
Tribal Blocks 0
Legislative Assembly Seats 4
Administrative Information
0.5570.657 0.626
0.387
0.000
0.200
0.400
0.600
0.800
1.000
Graph on Human Development Index
1991 2001
Population 658482 579312
Share of Madhya Pradesh Population 1.36% 0.96%
Urban Population 3.5% 4.6%
Population of Scheduled Castes (SC) 5.1% n.a.
Population of Scheduled Tribes (ST) 66.7% n.a.
Density of Population (per sq. kms.) 69 78
All 24.94 13.23
Rural n.a. 13.09
Urban n.a. 16.26
Decadal Growth (%) 1981-91 1991- 00 1991 1998-99
Per Capita Food Production (in kgs.) 236.44 298.36
1996 2000
FPS per lakh population n.a. 31
Food
D I N D O R I
HDI Education Health Income
Demography
DINDORI

183
D I S T R I C T FA C T S H E E T S
1991 2001
Worker Participation Rate :
All 52.4% 57.1%
Rural 53.2% 58.3%
Urban 30.9% 31.7%
Share of Primary Sector (%) 93.2% n.a.
Share of Secondary Sector (%) 2.1% n.a.
Share of Tertiary Sector (%) 4.73% n.a.
Employment in Registered Industries (2000) n.a.
Employment Rate of Growth (1991 to 2001) n.a. 26.8%
Total Employment in Farm Sector (%) 93.1% 90.4
Rural Employment in Non Farm Sector (%) 5.6% 7.7%
Agriculture Labour (%) 21.6% 29.1%
Employment
2001
Middle Schools per lakh population 32.0
High Schools per lakh population 11.0
Rural Population per Primary Health Centre 23019
Population Serviced Sub Health Centre 3019
2000
Road length per 100 sq. km. (1999) 15.6
Telephone per lakh population 123
Population per Post Office (1994-95) n.a.
Registered establishments under Factories Act (1997) n.a.
Per capita consumption of electricity (non industrial) in kwh 7.0
Infrastructure / Facilities
1991 2001
Life Expectancy of Females at Birth 58.7 63.8
Child Sex Ratio 980 989
Girl Child Mortality (birth to age 1 year) n.a. n.a.
Girl Child Mortality (up to age 5 years) n.a. n.a.
Total Fertility Rate n.a. n.a.
Gender Ratio : All 985 994
Rural 996 996
Urban 914 944
General non SC/ ST Gender Ratio 962 n.a.
SC Gender Ratio 937 n.a.
ST Gender Ratio 1011 n.a.
Workers Participation Rate - Female 48.4% 55.0%
2000
Female Enrolment Rate (Ages 6-14) 86.2%
Gender
Estimated Poverty Rate (1993-1994) n.a.
Children as main workers (1991) n.a.
Children as main and marginal workers (1991) n.a.
Percentage of safe deliveries (1998-1999) n.a.
Percentage of children fully immunised (1998-1999) n.a.
Deprivation
1991 2001
Literacy (%) : All 37.7% 54.5%
Male 55.1% 70.4%
Female 20.2% 38.5%
Rural 30.6% 53.1%
Urban 69.6% 81.7%
Access to Education 2000
Enrolment Rate (Ages 6-14) 88.2%
Gross access ratio at primary level 100.0%
Habitations with Primary Schools 100.0%
Education
2000
Habitations with SDW facility 99.1%
Habitations without 40 lpd water availability 4.6%
Number of villages electrified 958
Percentage of villages not connected with pucca roads 71.9
1991
Households without access to electricity, SDW and toilet facilities n.a.
Basic Amenities
1999
Per Capita Forest Area (in hectares) n.a.
Annual Rate of Afforestation (%) (1993-1999) n.a.
Major Non-Timber Forest Produce :
Tendu Leaves, Harra
Forests

D I S T R I C T FA C T S H E E T S
184
Land Use Classification in 1998-99
1978 1998
Net Area Sown (in 000' ha.) n.a. 238.4
Gross Cropped Area (in 000' ha.) n.a. 308.1
Double Cropped Area to Net Area Sown n.a. 29.2
Net Irrigated Area (in 000' ha.) n.a. 1.0
Gross Irrigated Area (in 000' ha.) n.a. 1.0
1992-93 1998-99
Agriculture Intensity n.a. 129.2
Agriculture and Land Use over
30 Years
1978 1998
Net Sown Area to Total Geographical Area Included in Mandla 57.9%
Gross Cropped Area to Total Area n.a. 74.8%
Net Irrigated to Net Sown Area n.a. 0.4%
Cropped Area under Food Grains n.a. 79.0%
Yield of Food Grains (in kg. per hectare) n.a. 692
Per Capita Food Production (in kgs.) 298.4
Land Use and Agriculture
2000
Credit-Deposit Ratio 49.51
Commercial Banks (per 1000 population) 0.03
Crop lending per hectare of cultivated land n.a.
Crop lending per hectare of irrigated land n.a.
Credit
2001
Number of towns reporting slums 2
Urban population residing in slums 0.00%
Level of ground water development 0.34
Average annual rainfall (in mm) 1241.00
1995 2000
Percentage area under wasteland n.a. n.a.
Habitat
1991 1998-99
Cereals Per Capita (Kg) n.a. 270.0
Pulses Per Capita (Kg) n.a. 28.3
Oilseeds Per Capita (Kg) n.a. 46.5
Average Landholding (Ha) n.a. n.a.
Gross Irrigated Area ('000 Ha) 1.0
Fertiliser Consumption Per Hectare (Kg) n.a. 2.36
1993 1999
Cropping Intensity n.a. 129.2
Land Use and Agriculture
Lorenz Curve of Operational Holdings
Cumulative percentage of Land Holdings
0.00 0.25 0.50 0.75 1.00
1.00
0.80
0.60
0.40
0.20
0.00
Cum
ulat
ive
perc
enta
ge o
f Lan
d Ar
ea
Net AreaSown(59%)
Fallow Land (16%)Cultivable
Wasteland(3%)
OtherUncultivableLand excludingFallow Land(4%)
Land NotAvailable for
Cultivation(10%)
Forest (8%)
NA = not available

185
D I S T R I C T FA C T S H E E T S
% Net % Gross
Name of Block Total Net Sown Gross Per capita Agriculture Net irrigated area to Irrigated area to Level of GW Status of
Cropped Area Cropped Net Sown Area Intensity Net Sown area total cropped area Development ground water
Dindori 804.27 56.8% 70.8% 0.48 125 0.62 0.5 0.063 White
Amarpur 374.03 60.0% 76.0% 0.45 127 0.07 0.05 0.580 White
Karanjia 359.42 76.2% 99.6% 0.5 131 0.53 0.41 0.086 White
Samnapur 390.97 60.4% 79.7% 0.43 132 1.03 0.78 0.582 White
Bajag 368.25 66.4% 89.8% 0.42 135 1.58 1.17 0.510 White
Mehadwani 507.03 52.2% 61.9% 0.47 119 1.07 9.9 0.231 White
Shahpura 777.95 55.1% 68.6% 0.49 125 1.99 1.6 0.482 White
Agriculture and Irrigation Status ofGround Water
Name of Block SC ST Road length Villages connected by all Population serviced per
per 100 sq.kms. weatherroads post office (1993-' 94)
Dindori 6.17 60.48 29.47 18.72 4728
Amarpur 3.54 65.72 44.92 41 3149
Karanjia 4.14 73.41 19.48 24.51 4154
Samnapur 2.73 62.7 26.6 20.18 3404
Bajag 5.89 63.95 51.05 25 6450
Mehadwani 1.23 77.3 27.81 11.61 4681
Shahpura 14.56 64.62 23.52 17.03 4571
Population in 1991 Infrastructure (in percentage) (1991)
Sex ratio Agriculture Worker labourers in participation
Name of Tehsil Total Rural Urban Urbanisation Total Rural Urban Female All Child workers (%) ratio
Dindori 467220 449807 17413 3.7% 54.0% 52.9% 81.5% 38.0% 994 988 27.27 57.56
Shahpura 112092 102643 9449 8.4% 56.5% 54.0% 82.1% 40.4% 993 995 37.09 55.04
Population Literacy Select Gender Employment Indicators

D I S T R I C T FA C T S H E E T S
186
Human Development Index (HDI) 0.493
Rank in Madhya Pradesh : HDI 36
Gender Related Development Index (GDI) 0.476
Rank in Madhya Pradesh : GDI 40
Human Development Indices - 2002
Area (in sq. km) 11065
Total Inhabited Villages 2059
Total Habitations 3500
Forest Villages 1
Towns (Class I to IV) and Major Towns 10
Guna, Ashok Nagar, Raghogarh-Vijaypur
Crop Zone :
Wheat Zone
Soil type :
Medium Black and Deep Black (Medium/ Heavy)
Agri Climatic Zone :
Vindhya Plateau
Schedule V Areas :
No Schedule V area
Basic Details on the District
1981 1991
Infant Mortality Rate 157 130
1991 2001
Life Expectancy (years) 50.3 53.5
1976-81 1984-90
Crude Birth Rate 36.8 41.4
Health
Janpad Panchayats 9
Gram Panchayats 728
Tehsils 9
Tribal Blocks 0
Legislative Assembly Seats 6
Administrative Information
0.4930.702
0.4760.300
0.000
0.200
0.400
0.600
0.800
1.000
Graph on Human Development Index
1991 2001
Population 1310317 1665503
Share of Madhya Pradesh Population 2.70% 2.76%
Urban Population 19.5% 21.3%
Population of Scheduled Castes (SC) 18.1% n.a.
Population of Scheduled Tribes (ST) 12.0% n.a.
Density of Population (per sq. kms.) 118 151
All 30.77 27.11
Rural n.a. 24.27
Urban n.a. 38.8
Decadal Growth (%) 1981-91 1991- 00 1991 1998-99
Per Capita Food Production (in kgs.) 312.98 326.11
1996 2000
FPS per lakh population 16.61 18
Food
G U N A
HDI Education Health Income
Demography
GUNA

187
D I S T R I C T FA C T S H E E T S
1991 2001
Worker Participation Rate :
All 37.0% 40.9%
Rural 39.2% 44.1%
Urban 28.3% 29.4%
Share of Primary Sector (%) 79.1% n.a.
Share of Secondary Sector (%) 6.8% n.a.
Share of Tertiary Sector (%) 14.11% n.a.
Employment in Registered Industries (2000) 8276
Employment Rate of Growth (1991 to 2001) n.a. 40.5%
Total Employment in Farm Sector (%) 79.0% 78.14
Rural Employment in Non Farm Sector (%) 8.6% 10.0%
Agriculture Labour (%) 18.8% 28.1%
Employment
2001
Middle Schools per lakh population 43.0
High Schools per lakh population 7.6
Rural Population per Primary Health Centre 54615
Population Serviced Sub Health Centre 6068
2000
Road length per 100 sq. km. (1999) 12.6
Telephone per lakh population 1005
Population per Post Office (1994-95) 7500
Registered establishments under Factories Act (1997) 86
Per capita consumption of electricity (non industrial) in kwh 179.0
Infrastructure / Facilities
1991 2001
Life Expectancy of Females at Birth 47.6 50.5
Child Sex Ratio 932 929
Girl Child Mortality (birth to age 1 year) 144 n.a.
Girl Child Mortality (up to age 5 years) 198 n.a.
Total Fertility Rate 5.9 n.a.
Gender Ratio : All 875 885
Rural 875 882
Urban 876 897
General non SC/ ST Gender Ratio 867 n.a.
SC Gender Ratio 874 n.a.
ST Gender Ratio 928 n.a.
Workers Participation Rate - Female 20.5% 29.0%
2000
Female Enrolment Rate (Ages 6-14) 85.4%
Gender
Estimated Poverty Rate (1993-1994) 18.1%
Children as main workers (1991) 3.7%
Children as main and marginal workers (1991) 5.4%
Percentage of safe deliveries (1998-1999) 36.3
Percentage of children fully immunised (1998-1999) 30.7
Deprivation
1991 2001
Literacy (%) : All 34.6% 59.9%
Male 48.9% 74.7%
Female 18.0% 43.1%
Rural 27.2% 55.7%
Urban 64.1% 75.0%
Access to Education 2000
Enrolment Rate (Ages 6-14) 90.9%
Gross access ratio at primary level 100.0%
Habitations with Primary Schools 100.0%
Education
2000
Habitations with SDW facility 99.0%
Habitations without 40 lpd water availability 1.0%
Number of villages electrified 2036
Percentage of villages not connected with pucca roads 75.5
1991
Households without access to electricity, SDW and toilet facilities 29.08
Basic Amenities
1999
Per Capita Forest Area (in hectares) 0.133
Annual Rate of Afforestation (%) (1993-1999) -3.21
Major Non-Timber Forest Produce :
Tendu Leaves, Khair
Forests

D I S T R I C T FA C T S H E E T S
188
Land Use Classification in 1998-99
1978 1998
Net Area Sown (in 000' ha.) 567.0 633.7
Gross Cropped Area (in 000' ha.) 592.8 745.9
Double Cropped Area to Net Area Sown 4.6 17.7
Net Irrigated Area (in 000' ha.) 28.6 154.2
Gross Irrigated Area (in 000' ha.) 28.9 154.5
1992-93 1998-99
Agriculture Intensity 110.7 117.7
agriculture and Land Use Over
30 Years
1978 1998
Net Sown Area to Total Geographical Area 51.6% 57.7%
Gross Cropped Area to Total Area 54.0% 67.9%
Net Irrigated to Net Sown Area 5.0% 24.3%
Cropped Area under Food Grains 78.3% 65.4%
Yield of Food Grains (in kg. per hectare) 451 1061
Per Capita Food Production (in kgs.) 326.1
Land Use and Agriculture
2000
Credit-Deposit Ratio 60.83
Commercial Banks (per 1000 population) 0.03
Crop lending per hectare of cultivated land 527.8
Crop lending per hectare of irrigated land 2678.4
Credit
2001
Number of towns reporting slums 10
Urban population residing in slums 14.52%
Level of ground water development 24.82
Average annual rainfall (in mm) 1052.80
1995 2000
Percentage area under wasteland 16.8% 34.89%
Habitat
1991 1998-99
Cereals Per Capita (Kg) 215.3 201.0
Pulses Per Capita (Kg) 97.7 125.1
Oilseeds Per Capita (Kg) 47.3 61.7
Average Landholding (Ha) 3.4 2.79
Gross Irrigated Area ('000 Ha) 154.5
Fertiliser Consumption Per Hectare (Kg) 22.1 21.72
1993 1999
Cropping Intensity 111 117.7
Land Use and Agriculture
Lorenz Curve of Operational Holdings
Cumulative percentage of Land Holdings
0.00 0.25 0.50 0.75 1.00
1.00
0.80
0.60
0.40
0.20
0.00
Cum
ulat
ive
perc
enta
ge o
f Lan
d Ar
ea
Net AreaSown(58%)
Fallow Land (1%)
CultivableWasteland(8%)
OtherUncultivableLand excludingFallow Land(5%)
Land NotAvailable for
Cultivation(14%)
Forest (14%)
NA = not available

189
D I S T R I C T FA C T S H E E T S
Name of Block Total Net Sown Gross Per capita Agriculture Net irrigated area to Irrigated area to Level of GW Status of
Cropped Area Cropped Net Sown Area Intensity Net Sown area total cropped area Development ground water
Guna 1520.4 49.6% 53.7% 0.56 108 11.9 11 15.081 White
Bamori 1575.2 37.3% 47.3% 0.56 127 35.7 28.5 76.031 White
Chachaura 1149.71 67.4% 82.0% 0.56 122 20.27 16.74 16.218 Grey
Raghogarh 1113.27 58.2% 75.3% 0.48 129 33.42 26.05 30.513 White
Aron 812.75 63.9% 66.4% 0.68 104 6.27 6.02 16.340 White
Ashoknagar 1237.48 81.1% 88.2% 0.72 109 12.4 11.4 25.858 White
Isagarh 1078.35 73.9% 78.2% 0.71 106 9 8.51 9.347 White
Mungaoli 1228.93 68.1% 73.2% 0.64 107 14.24 13.28 30.513 White
Chanderi 1034 35.9% 42.0% 0.43 117 24.42 20.91 29.636 White
Name of Block SC ST Road length Villages connected by all Population serviced per
per 100 sq.kms. weatherroads post office (1993-' 94)
Guna 18.61 22.1 12.37 56.02 4975
Bamori 22.27 27.66 9.9 16.51 5202
Chachaura 13.17 12.9 11.39 68.6 6573
Raghogarh 17.4 14.31 16.62 43.85 4949
Aron 22.99 6.27 8.49 68.75 4783
Ashoknagar 27.88 3.28 8.08 54.24 4633
Isagarh 25.99 11.84 9.46 71.26 3818
Mungaoli 19.97 11.21 11.31 11.79 4870
Chanderi 15.43 17.13 13.15 40.88 4800
Population in 1991 Infrastructure (in percentage) (1991)
Sexr ratio Agriculture Worker labourers in participation
Name of Tehsil Total Rural Urban Urbanisation Total Rural Urban Female All Child workers (%) ratio
Guna 446723 309591 137132 30.7% 60.3% 51.8% 78.4% 44.8% 892 922 22.74 39.40
Ashoknagar 227363 169681 57682 25.4% 64.7% 61.1% 74.9% 47.6% 880 930 30.05 33.99
Mungaoli 182502 162966 19536 10.7% 61.3% 59.0% 80.1% 43.9% 869 929 36.63 42.95
Raghogarh 210197 161004 49193 23.4% 52.1% 47.0% 68.5% 33.7% 898 943 23.10 45.11
Chachaura 106135 88832 17303 16.3% 62.4% 58.7% 80.6% 46.7% 892 910 25.73 49.31
Aron 118130 96900 21230 18.0% 59.5% 58.9% 62.0% 44.0% 871 928 37.22 40.45
Isagarh 148597 138250 10347 7.0% 63.6% 62.7% 75.3% 46.7% 884 924 35.87 37.64
Kumbharaj 95411 81412 13999 14.7% 52.3% 49.4% 68.9% 32.5% 887 942 27.54 48.98
Chanderi 130445 102132 28313 21.7% 60.5% 56.1% 75.6% 42.6% 884 942 25.94 40.34
Population Literacy Select Gender EmploymentIndicators
Agriculture and Irrigation Status ofGround Water

D I S T R I C T FA C T S H E E T S
190
Human Development Index (HDI) 0.624
Rank in Madhya Pradesh : HDI 8
Gender Related Development Index (GDI) 0.527
Rank in Madhya Pradesh : GDI 30
Human Development Indices - 2002
Area (in sq. km) 4560
Total Inhabited Villages 706
Total Habitations 942
Forest Villages 0
Towns (Class I to IV) and Major Towns 9
Gwalior, Dabra
Crop Zone :
Wheat Jowar
Soil type :
Alluvial (Light)
Agri Climatic Zone :
Gird Region
Schedule V Areas :
No Schedule V area
Basic Details on the District
1981 1991
Infant Mortality Rate 133 70
1991 2001
Life Expectancy (years) 61.9 65.3
1976-81 1984-90
Crude Birth Rate 36.7 35.1
Health
Janpad Panchayats 5
Gram Panchayats 298
Tehsils 3
Tribal Blocks 0
Legislative Assembly Seats 6
Administrative Information
0.6240.764
0.672
0.435
0.000
0.200
0.400
0.600
0.800
1.000
Graph on Human Development Index
1991 2001
Population 1293567 1629881
Share of Madhya Pradesh Population 2.66% 2.70%
Urban Population 62.9% 60.3%
Population of Scheduled Castes (SC) 20.0% n.a.
Population of Scheduled Tribes (ST) 3.1% n.a.
Density of Population (per sq. kms.) 284 357
All 27.97 26.00
Rural n.a. 34.83
Urban n.a. 20.8
Decadal Growth (%) 1981-91 1991- 00 1991 1998-99
Per Capita Food Production (in kgs.) 200.83 217.44
1996 2000
FPS per lakh population 25.52 24
Food
G W A L I O R
HDI Education Health Income
Demography
GWALIOR

191
D I S T R I C T FA C T S H E E T S
1991 2001
Worker Participation Rate :
All 30.2% 32.5%
Rural 35.6% 38.3%
Urban 27.1% 28.7%
Share of Primary Sector (%) 43.3% n.a.
Share of Secondary Sector (%) 18.0% n.a.
Share of Tertiary Sector (%) 38.69% n.a.
Employment in Registered Industries (2000) 29954
Employment Rate of Growth (1991 to 2001) n.a. 35.5%
Total Employment in Farm Sector (%) 42.7% 40.34
Rural Employment in Non Farm Sector (%) 12.4% 19.5%
Agriculture Labour (%) 9.5% 13.4%
Employment
2001
Middle Schools per lakh population 58.8
High Schools per lakh population 24.7
Rural Population per Primary Health Centre 43103
Population Serviced Sub Health Centre 6401
2000
Road length per 100 sq. km. (1999) 29.2
Telephone per lakh population 4000
Population per Post Office (1994-95) 8161
Registered establishments under Factories Act (1997) 571
Per capita consumption of electricity (non industrial) in kwh 487.7
Infrastructure / Facilities
1991 2001
Life Expectancy of Females at Birth 61.0 61.5
Child Sex Ratio 888 849
Girl Child Mortality (birth to age 1 year) 103 n.a.
Girl Child Mortality (up to age 5 years) 126 n.a.
Total Fertility Rate 4.7 n.a.
Gender Ratio : All 831 847
Rural 813 833
Urban 842 857
General non SC/ ST Gender Ratio 833 n.a.
SC Gender Ratio 817 n.a.
ST Gender Ratio 891 n.a.
Workers Participation Rate - Female 9.8% 14.4%
2000
Female Enrolment Rate (Ages 6-14) 86.9%
Gender
Estimated Poverty Rate (1993-1994) 24.2%
Children as main workers (1991) 2.3%
Children as main and marginal workers (1991) 2.9%
Percentage of safe deliveries (1998-1999) 61.8
Percentage of children fully immunised (1998-1999) 52.6
Deprivation
1991 2001
Literacy (%) : All 58.4% 69.8%
Male 70.9% 80.8%
Female 43.1% 56.8%
Rural 35.7% 53.7%
Urban 71.2% 79.8%
Access to Education 2000
Enrolment Rate (Ages 6-14) 85.6%
Gross access ratio at primary level 100.0%
Habitations with Primary Schools 100.0%
Education
2000
Habitations with SDW facility 99.8%
Habitations without 40 lpd water availability 0.2%
Number of villages electrified 559
Percentage of villages not connected with pucca roads 37.8
1991
Households without access to electricity, SDW and toilet facilities 15.79
Basic Amenities
1999
Per Capita Forest Area (in hectares) 0.084
Annual Rate of Afforestation (%) (1993-1999) 0.98
Major Non-Timber Forest Produce :
Tendu Leaves
Forests

D I S T R I C T FA C T S H E E T S
192
Land Use Classification in 1998-99
1978 1998
Net Area Sown (in 000' ha.) 251.0 216.6
Gross Cropped Area (in 000' ha.) 272.4 258.6
Double Cropped Area to Net Area Sown 8.5 19.4
Net Irrigated Area (in 000' ha.) 88.2 123.9
Gross Irrigated Area (in 000' ha.) 104.6 156.8
1992-93 1998-99
Agriculture Intensity 108.1 119.4
Agriculture and Land Use over
30 Years
1978 1998
Net Sown Area to Total Geographical Area 48.1% 47.5%
Gross Cropped Area to Total Area 52.2% 56.7%
Net Irrigated to Net Sown Area 35.1% 57.2%
Cropped Area under Food Grains 81.1% 67.5%
Yield of Food Grains (in kg. per hectare) 1096 1939
Per Capita Food Production (in kgs.) 217.4
Land Use and Agriculture
2000
Credit-Deposit Ratio 46.04
Commercial Banks (per 1000 population) 0.06
Crop lending per hectare of cultivated land 1563.2
Crop lending per hectare of irrigated land 3708.6
Credit
2001
Number of towns reporting slums 9
Urban population residing in slums 19.69%
Level of ground water development 19.89
Average annual rainfall (in mm) 858.10
1995 2000
Percentage area under wasteland 23.7% 26.69%
Habitat
1991 1998-99
Cereals Per Capita (Kg) 167.6 194.9
Pulses Per Capita (Kg) 33.2 22.6
Oilseeds Per Capita (Kg) 50.0 36.7
Average Landholding (Ha) 2.7 2.44
Gross Irrigated Area ('000 Ha) 156.8
Fertiliser Consumption Per Hectare (Kg) 70.9 98.55
1993 1999
Cropping Intensity 108 119.4
Land Use and Agriculture
Lorenz Curve of Operational Holdings
Cumulative percentage of Land Holdings
0.00 0.25 0.50 0.75 1.00
1.00
0.80
0.60
0.40
0.20
0.00
Cum
ulat
ive
perc
enta
ge o
f Lan
d Ar
ea
Net AreaSown(47%)
Fallow Land (2%)
CultivableWasteland(5%)
OtherUncultivableLand excludingFallow Land(4%)
Land NotAvailable for
Cultivation(18%)
Forest (24%)
NA = not available

193
D I S T R I C T FA C T S H E E T S
Name of Block Total Net Sown Gross Per capita Agriculture Net irrigated area to Irrigated area to Level of GW Status of
Cropped Area Cropped Net Sown Area Intensity Net Sown area total cropped area Development ground water
Morar 807.78 54.2% 55.7% 0.42 103 36.43 36.37 33.687 White
Ghatigaon 1666.63 18.0% 18.9% 0.28 105 48.12 48.31 16.868 White
Dabra 910.88 72.7% 80.9% 0.5 111 51.11 53.87 22.561 White
Bhitarwar 850.74 76.7% 91.2% 0.49 119 57.27 61.69 14.295 White
Name of Block SC ST Road length Villages connected by all Population serviced per
per 100 sq.kms. weatherroads post office (1993-' 94)
Morar 25.46 0.98 19.68 21.62 3755
Ghatigaon 13.22 14.17 16.02 35.34 3433
Dabra 27.8 5.06 16.8 27.63 4369
Bhitarwar 25.16 5.05 17.28 32.91 3488
Population in 1991 Infrastructure (in percentage) (1991)
Sexr ratio Agriculture Worker labourers in participation
Name of Tehsil Total Rural Urban Urbanisation Total Rural Urban Female All Child workers (%) ratio
Gird (Gwalior) 1177055 311255 865800 73.6% 73.4% 52.3% 80.6% 62.1% 849 834 6.75 30.10
Bhitarwar 182798 157998 24800 13.6% 56.9% 55.7% 64.4% 37.5% 847 874 33.37 42.27
Dabra (Pichhore ) 270028 177297 92731 34.3% 62.4% 54.5% 76.9% 45.4% 839 891 21.43 36.39
Population Literacy Select Gender EmploymentIndicators
Agriculture and Irrigation Status ofGround Water

D I S T R I C T FA C T S H E E T S
194
Human Development Index (HDI) 0.588
Rank in Madhya Pradesh : HDI 12
Gender Related Development Index (GDI) 0.579
Rank in Madhya Pradesh : GDI 14
Human Development Indices - 2002
Area (in sq. km) 3330
Total Inhabited Villages 497
Total Habitations 632
Forest Villages 45
Towns (Class I to IV) and Major Towns 3
Harda
Crop Zone :
Wheat Zone
Soil type :
Deep Black (Deep)
Agri Climatic Zone :
Central Narmada Valley
Schedule V Areas :
No Schedule V area
Basic Details on the District
1981 1991
Infant Mortality Rate n.a. n.a.
1991 2001
Life Expectancy (years) 53.4 55.6
1976-81 1984-90
Crude Birth Rate n.a. n.a.
Health
Janpad Panchayats 3
Gram Panchayats 181
Tehsils 3
Tribal Blocks 0
Legislative Assembly Seats 2
Administrative Information
0.5880.738
0.510 0.516
0.000
0.200
0.400
0.600
0.800
1.000
Graph on Human Development Index
1991 2001
Population 380762 474174
Share of Madhya Pradesh Population 0.78% 0.79%
Urban Population 20.4% 21.3%
Population of Scheduled Castes (SC) 16.8% n.a.
Population of Scheduled Tribes (ST) 24.2% n.a.
Density of Population (per sq. kms.) 114 142
All 29.14 24.53
Rural n.a. 23.06
Urban n.a. 30.29
Decadal Growth (%) 1981-91 1991- 00 1991 1998-99
Per Capita Food Production (in kgs.) 338.93 459.44
1996 2000
FPS per lakh population n.a. 35
Food
H A R D A
HDI Education Health Income
Demography
HARDA

195
D I S T R I C T FA C T S H E E T S
1991 2001
Worker Participation Rate :
All 42.5% 44.9%
Rural 46.4% 49.4%
Urban 27.2% 28.3%
Share of Primary Sector (%) 81.0% n.a.
Share of Secondary Sector (%) 6.4% n.a.
Share of Tertiary Sector (%) 12.61% n.a.
Employment in Registered Industries (2000) n.a.
Employment Rate of Growth (1991 to 2001) n.a. 31.8%
Total Employment in Farm Sector (%) 80.9% 80.37
Rural Employment in Non Farm Sector (%) 9.1% 9.5%
Agriculture Labour (%) 39.0% 40.6%
Employment
2001
Middle Schools per lakh population 27.2
High Schools per lakh population 7.3
Rural Population per Primary Health Centre 53298
Population Serviced Sub Health Centre 6116
2000
Road length per 100 sq. km. (1999) 12.2
Telephone per lakh population 1512
Population per Post Office (1994-95) n.a.
Registered establishments under Factories Act (1997) n.a.
Per capita consumption of electricity (non industrial) in kwh 148.7
Infrastructure / Facilities
1991 2001
Life Expectancy of Females at Birth 52.0 53.4
Child Sex Ratio 938 926
Girl Child Mortality (birth to age 1 year) n.a. n.a.
Girl Child Mortality (up to age 5 years) n.a. n.a.
Total Fertility Rate n.a. n.a.
Gender Ratio : All 914 919
Rural 920 924
Urban 894 901
General non SC/ ST Gender Ratio 906 n.a.
SC Gender Ratio 905 n.a.
ST Gender Ratio 941 n.a.
Workers Participation Rate - Female 31.1% 36.4%
2000
Female Enrolment Rate (Ages 6-14) 83.9%
Gender
Estimated Poverty Rate (1993-1994) n.a.
Children as main workers (1991) n.a.
Children as main and marginal workers (1991) n.a.
Percentage of safe deliveries (1998-1999) n.a.
Percentage of children fully immunised (1998-1999) n.a.
Deprivation
1991 2001
Literacy (%) : All 48.8% 66.8%
Male 62.5% 78.4%
Female 33.8% 54.1%
Rural 41.9% 61.9%
Urban 74.5% 84.0%
Access to Education 2000
Enrolment Rate (Ages 6-14) 87.6%
Gross access ratio at primary level 100.0%
Habitations with Primary Schools 100.0%
Education
2000
Habitations with SDW facility 100.0%
Habitations without 40 lpd water availability 0.0%
Number of villages electrified 445
Percentage of villages not connected with pucca roads 66.5
1991
Households without access to electricity, SDW and toilet facilities n.a.
Basic Amenities
1999
Per Capita Forest Area (in hectares) n.a.
Annual Rate of Afforestation (%) (1993-1999) n.a.
Major Non-Timber Forest Produce :
Tendu Leaves
Forests

D I S T R I C T FA C T S H E E T S
196
Land Use Classification in 1998-99
1978 1998
Net Area Sown (in 000' ha.) 0.0 169.8
Gross Cropped Area (in 000' ha.) n.a. 284.9
Double Cropped Area to Net Area Sown n.a. 67.8
Net Irrigated Area (in 000' ha.) n.a. 127.2
Gross Irrigated Area (in 000' ha.) n.a. 127.2
1992-93 1998-99
Agriculture Intensity n.a. 167.8
agriculture and Land Use Over
30 Years
1978 1998
Net Sown Area to Total Geographical Area Included in Hoshangabad 51.4%
Gross Cropped Area to Total Area n.a. 86.2%
Net Irrigated to Net Sown Area n.a. 74.9%
Cropped Area under Food Grains n.a. 41.2%
Yield of Food Grains (in kg. per hectare) n.a. 1774
Per Capita Food Production (in kgs.) 459.4
Land Use and Agriculture
2000
Credit-Deposit Ratio 87.73
Commercial Banks (per 1000 population) 0.03
Crop lending per hectare of cultivated land n.a.
Crop lending per hectare of irrigated land n.a.
Credit
2001
Number of towns reporting slums 3
Urban population residing in slums 0.00%
Level of ground water development 18.57
Average annual rainfall (in mm) 1417.00
1995 2000
Percentage area under wasteland n.a. n.a.
Habitat
1991 1998-99
Cereals Per Capita (Kg) n.a. 370.0
Pulses Per Capita (Kg) n.a. 89.5
Oilseeds Per Capita (Kg) n.a. 288.9
Average Landholding (Ha) n.a. n.a.
Gross Irrigated Area ('000 Ha) 127.2
Fertiliser Consumption Per Hectare (Kg) n.a. 72.2
1993 1999
Cropping Intensity n.a. 167.8
Land Use and Agriculture
Lorenz Curve of Operational Holdings
Cumulative percentage of Land Holdings
0.00 0.25 0.50 0.75 1.00
1.00
0.80
0.60
0.40
0.20
0.00
Cum
ulat
ive
perc
enta
ge o
f Lan
d Ar
ea
Net AreaSown(51%)
Fallow Land (1%)
CultivableWasteland(2%)
OtherUncultivableLand excludingFallow Land(7%)
Land NotAvailable for
Cultivation(7%)
Forest (32%)
NA = not available

197
D I S T R I C T FA C T S H E E T S
Name of Block Total Net Sown Gross Per capita Agriculture Net irrigated area to Irrigated area to Level of GW Status of
Cropped Area Cropped Net Sown Area Intensity Net Sown area total cropped area Development ground water
Khirkiya 794.37 67.1% 89.5% 0.55 133 43.64 32.64 49.451 White
Harda 991.72 61.9% 104.8% 0.59 169 74.96 44.25 14.768 White
Timarni 706.05 75.4% 118.7% 0.62 158 67.07 42.58 9.814 White
Name of Block SC ST Road length Villages connected by all Population serviced per
per 100 sq.kms. weatherroads post office (1993-' 94)
Khirkiya 16.06 33.36 12.71 26.95 3872
Harda 21.04 23.49 12.71 22.67 3248
Timarni 19.21 19.69 15.86 26.49 3416
Population in 1991 Infrastructure (in percentage) (1991)
Sexr ratio Agriculture Worker labourers in participation
Name of Tehsil Total Rural Urban Urbanisation Total Rural Urban Female All Child workers (%) ratio
Harda 190264 125838 64426 33.9% 72.6% 66.1% 84.8% 61.3% 908 897 37.66 43.90
Khirkiya 138543 121060 17483 12.6% 60.0% 57.0% 79.7% 46.6% 927 948 39.97 47.69
Timrani 145367 126189 19178 13.2% 65.5% 62.4% 84.9% 51.8% 925 940 45.25 43.64
Population Literacy Select Gender EmploymentIndicators
Agriculture and Irrigation Status ofGround Water

D I S T R I C T FA C T S H E E T S
198
Human Development Index (HDI) 0.589
Rank in Madhya Pradesh : HDI 14
Gender Related Development Index (GDI) 0.530
Rank in Madhya Pradesh : GDI 29
Human Development Indices - 2002
Area (in sq. km) 6707
Total Inhabited Villages 923
Total Habitations 1258
Forest Villages 63
Towns (Class I to IV) and Major Towns 11
Hoshangabad, Itarsi, Piparia
Crop Zone :
Wheat Zone
Soil type :
Deep Black (Deep)
Agri Climatic Zone :
Central Narmada Valley
Schedule V Areas :
Kesla Tribal Block of Itarsi Tehsil
Basic Details on the District
1981 1991
Infant Mortality Rate 164 109
1991 2001
Life Expectancy (years) 53.4 55.6
1976-81 1984-90
Crude Birth Rate 34.9 38.0
Health
Janpad Panchayats 7
Gram Panchayats 391
Tehsils 7
Tribal Blocks 1
Legislative Assembly Seats 4
Administrative Information
0.5840.765
0.510 0.478
0.000
0.200
0.400
0.600
0.800
1.000
Graph on Human Development Index
1991 2001
Population 886449 1085011
Share of Madhya Pradesh Population 1.83% 1.80%
Urban Population 30.3% 30.9%
Population of Scheduled Castes (SC) 16.0% n.a.
Population of Scheduled Tribes (ST) 14.4% n.a.
Density of Population (per sq. kms.) 132 162
All 25.01 22.40
Rural n.a. 21.33
Urban n.a. 24.85
Decadal Growth (%) 1981-91 1991- 00 1991 1998-99
Per Capita Food Production (in kgs.) 338.93 412.27
1996 2000
FPS per lakh population 30.94 28
Food
H O S H A N G A B A D
HDI Education Health Income
Demography
HOSHANGABAD

199
D I S T R I C T FA C T S H E E T S
1991 2001
Worker Participation Rate :
All 35.3% 35.6%
Rural 38.8% 39.0%
Urban 27.3% 28.2%
Share of Primary Sector (%) 66.8% n.a.
Share of Secondary Sector (%) 10.6% n.a.
Share of Tertiary Sector (%) 22.63% n.a.
Employment in Registered Industries (2000) 10619
Employment Rate of Growth (1991 to 2001) n.a. 23.5%
Total Employment in Farm Sector (%) 66.6% 63.38
Rural Employment in Non Farm Sector (%) 14.8% 18.0%
Agriculture Labour (%) 29.6% 34.8%
Employment
2001
Middle Schools per lakh population 24.1
High Schools per lakh population 11.0
Rural Population per Primary Health Centre 46828
Population Serviced Sub Health Centre 5240
2000
Road length per 100 sq. km. (1999) 17.6
Telephone per lakh population 1626
Population per Post Office (1994-95) 5687
Registered establishments under Factories Act (1997) 289
Per capita consumption of electricity (non industrial) in kwh 128.9
Infrastructure / Facilities
1991 2001
Life Expectancy of Females at Birth 52.0 54.0
Child Sex Ratio 929 927
Girl Child Mortality (birth to age 1 year) 139 n.a.
Girl Child Mortality (up to age 5 years) 183 n.a.
Total Fertility Rate 5.4 n.a.
Gender Ratio : All 892 898
Rural 896 899
Urban 883 895
General non SC/ ST Gender Ratio 883 n.a.
SC Gender Ratio 898 n.a.
ST Gender Ratio 932 n.a.
Workers Participation Rate - Female 18.9% 20.2%
2000
Female Enrolment Rate (Ages 6-14) 87.1%
Gender
Estimated Poverty Rate (1993-1994) 39.7%
Children as main workers (1991) 4.3%
Children as main and marginal workers (1991) 5.9%
Percentage of safe deliveries (1998-1999) 42.6
Percentage of children fully immunised (1998-1999) 71
Deprivation
1991 2001
Literacy (%) : All 54.1% 70.4%
Male 67.2% 81.4%
Female 39.3% 58.0%
Rural 42.8% 63.3%
Urban 79.0% 85.2%
Access to Education 2000
Enrolment Rate (Ages 6-14) 91.4%
Gross access ratio at primary level 100.0%
Habitations with Primary Schools 100.0%
Education
2000
Habitations with SDW facility 99.4%
Habitations without 40 lpd water availability 0.6%
Number of villages electrified 877
Percentage of villages not connected with pucca roads 66.5
1991
Households without access to electricity, SDW and toilet facilities 17.74
Basic Amenities
1999
Per Capita Forest Area (in hectares) 0.318
Annual Rate of Afforestation (%) (1993-1999) -0.19
Major Non-Timber Forest Produce :
Tendu Leaves, Aonla, Baheda, Mahua Flower, Achar Guthli, Mahua Gully, Charota
Seeds, Mango Guthli
Forests

D I S T R I C T FA C T S H E E T S
200
Land Use Classification in 1998-99
1978 1998
Net Area Sown (in 000' ha.) 437.2 293.7
Gross Cropped Area (in 000' ha.) 448.1 478.3
Double Cropped Area to Net Area Sown 2.5 62.9
Net Irrigated Area (in 000' ha.) 44.0 232.5
Gross Irrigated Area (in 000' ha.) 44.0 232.5
1992-93 1998-99
Agriculture Intensity 148.2 162.9
agriculture and Land Use Over
30 Years
1978 1998
Net Sown Area to Total Geographical Area 43.8% 43.9%
Gross Cropped Area to Total Area 44.8% 71.5%
Net Irrigated to Net Sown Area 10.1% 79.2%
Cropped Area under Food Grains 67.9% 52.6%
Yield of Food Grains (in kg. per hectare) 1766 1707
Per Capita Food Production (in kgs.) 412.3
Land Use and Agriculture
2000
Credit-Deposit Ratio 60.52
Commercial Banks (per 1000 population) 0.03
Crop lending per hectare of cultivated land 1858.7
Crop lending per hectare of irrigated land 39770.0
Credit
2001
Number of towns reporting slums 11
Urban population residing in slums 7.34%
Level of ground water development 11.75
Average annual rainfall (in mm) 1294.00
1995 2000
Percentage area under wasteland 9.3% 9.59%
Habitat
1991 1998-99
Cereals Per Capita (Kg) 234.1 331.7
Pulses Per Capita (Kg) 104.8 80.6
Oilseeds Per Capita (Kg) 113.1 174.5
Average Landholding (Ha) 4.0 3.74
Gross Irrigated Area ('000 Ha) 232.5
Fertiliser Consumption Per Hectare (Kg) 87.3 72.33
1993 1999
Cropping Intensity 148 162.9
Land Use and Agriculture
Lorenz Curve of Operational Holdings
Cumulative percentage of Land Holdings
0.00 0.25 0.50 0.75 1.00
1.00
0.80
0.60
0.40
0.20
0.00
Cum
ulat
ive
perc
enta
ge o
f Lan
d Ar
ea
Net AreaSown(45%)
Fallow Land (2%)
CultivableWasteland(4%)
OtherUncultivableLand excludingFallow Land(5%)
Land NotAvailable for
Cultivation(6%)
Forest (38%)
NA = not available

201
D I S T R I C T FA C T S H E E T S
Name of Block Total Net Sown Gross Per capita Agriculture Net irrigated area to Irrigated area to Level of GW Status of
Cropped Area Cropped Net Sown Area Intensity Net Sown area total cropped area Development ground water
Hoshangabad 529.37 77.8% 129.8% 0.51 167 85.79 51.39 8.369 White
Babai 581.67 75.0% 106.8% 0.51 142 65.25 45.83 6.626 White
Kesla 666.1 34.6% 49.5% 0.3 143 53.93 37.68 6.149 White
Sohagpur 598.95 68.7% 101.9% 0.49 148 64.04 43.19 12.797 White
Bankhedi 628.1 59.3% 86.9% 0.44 146 60.84 41.53 39.461 White
Pipariya 749.21 47.5% 72.2% 0.45 152 68.18 44.84 29.900 White
Seoni Malwa 1026.28 68.1% 109.7% 0.59 161 71.71 44.52 3.407 White
Name of Block SC ST Road length Villages connected by all Population serviced per
per 100 sq.kms. weatherroads post office (1993-' 94)
Hoshangabad 16.96 5.7 37.59 22.22 3003
Babai 13.67 9.67 19.77 11.43 5048
Kesla 12.86 39.11 9.46 25.93 1332
Sohagpur 18.41 12.04 12.02 18.29 5208
Bankhedi 20.85 17.49 11.14 12.3 3784
Pipariya 18.74 18.08 28.7 26.39 3889
Seoni Malwa 16.46 19.7 19.2 27.23 3940
Population in 1991 Infrastructure (in percentage) (1991)
Sexr ratio Agriculture Worker labourers in participation
Name of Tehsil Total Rural Urban Urbanisation Total Rural Urban Female All Child workers (%) ratio
Seoni Malwa 173014 146819 26195 15.1% 70.4% 67.6% 85.5% 57.5% 908 945 42.23 40.64
Hoshangabad 163618 66261 97357 59.5% 78.9% 70.6% 84.4% 68.6% 884 906 22.55 30.33
Sohagpur 129685 107356 22329 17.2% 61.1% 56.4% 82.8% 46.3% 891 918 37.09 35.70
Itarsi 239925 120372 119553 49.8% 77.4% 66.9% 87.3% 67.3% 907 937 26.30 31.71
Babai 116302 101715 14587 12.5% 63.5% 61.5% 77.5% 48.4% 900 925 44.19 40.64
Pipariya 155975 100234 55741 35.7% 69.7% 60.9% 84.8% 57.6% 884 913 27.72 35.66
Bankhedi 106492 106492 - - 60.0% 60.0% 0.0% 45.6% 905 940 48.46 38.93
Population Literacy Select Gender EmploymentIndicators
Agriculture and Irrigation Status ofGround Water
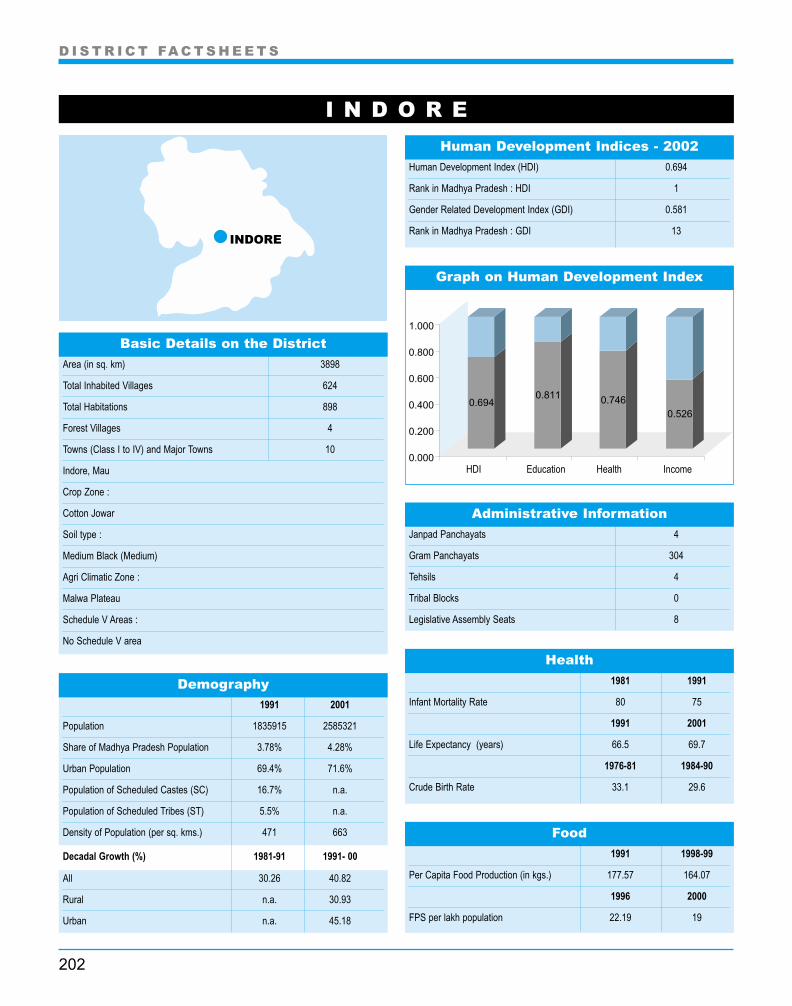
D I S T R I C T FA C T S H E E T S
202
Human Development Index (HDI) 0.694
Rank in Madhya Pradesh : HDI 1
Gender Related Development Index (GDI) 0.581
Rank in Madhya Pradesh : GDI 13
Human Development Indices - 2002
Area (in sq. km) 3898
Total Inhabited Villages 624
Total Habitations 898
Forest Villages 4
Towns (Class I to IV) and Major Towns 10
Indore, Mau
Crop Zone :
Cotton Jowar
Soil type :
Medium Black (Medium)
Agri Climatic Zone :
Malwa Plateau
Schedule V Areas :
No Schedule V area
Basic Details on the District
1981 1991
Infant Mortality Rate 80 75
1991 2001
Life Expectancy (years) 66.5 69.7
1976-81 1984-90
Crude Birth Rate 33.1 29.6
Health
Janpad Panchayats 4
Gram Panchayats 304
Tehsils 4
Tribal Blocks 0
Legislative Assembly Seats 8
Administrative Information
0.6940.811 0.746
0.526
0.000
0.200
0.400
0.600
0.800
1.000
Graph on Human Development Index
1991 2001
Population 1835915 2585321
Share of Madhya Pradesh Population 3.78% 4.28%
Urban Population 69.4% 71.6%
Population of Scheduled Castes (SC) 16.7% n.a.
Population of Scheduled Tribes (ST) 5.5% n.a.
Density of Population (per sq. kms.) 471 663
All 30.26 40.82
Rural n.a. 30.93
Urban n.a. 45.18
Decadal Growth (%) 1981-91 1991- 00 1991 1998-99
Per Capita Food Production (in kgs.) 177.57 164.07
1996 2000
FPS per lakh population 22.19 19
Food
I N D O R E
HDI Education Health Income
Demography
INDORE

203
D I S T R I C T FA C T S H E E T S
1991 2001
Worker Participation Rate :
All 34.3% 36.2%
Rural 43.9% 45.7%
Urban 30.1% 32.1%
Share of Primary Sector (%) 34.3% n.a.
Share of Secondary Sector (%) 22.8% n.a.
Share of Tertiary Sector (%) 42.85% n.a.
Employment in Registered Industries (2000) 86298
Employment Rate of Growth (1991 to 2001) n.a. 41.3%
Total Employment in Farm Sector (%) 34.2% 31.67
Rural Employment in Non Farm Sector (%) 18.5% 21.6%
Agriculture Labour (%) 14.8% 14.9%
Employment
2001
Middle Schools per lakh population 41.5
High Schools per lakh population 22.5
Rural Population per Primary Health Centre 28270
Population Serviced Sub Health Centre 6622
2000
Road length per 100 sq. km. (1999) 38.4
Telephone per lakh population 6150
Population per Post Office (1994-95) 12172
Registered establishments under Factories Act (1997) 1684
Per capita consumption of electricity (non industrial) in kwh 2210.6
Infrastructure / Facilities
1991 2001
Life Expectancy of Females at Birth 64.4 65.6
Child Sex Ratio 940 913
Girl Child Mortality (birth to age 1 year) 69 n.a.
Girl Child Mortality (up to age 5 years) 97 n.a.
Total Fertility Rate 3.6 n.a.
Gender Ratio : All 906 911
Rural 919 937
Urban 900 901
General non SC/ ST Gender Ratio 903 n.a.
SC Gender Ratio 919 n.a.
ST Gender Ratio 910 n.a.
Workers Participation Rate - Female 16.1% 18.8%
2000
Female Enrolment Rate (Ages 6-14) 93.5%
Gender
Estimated Poverty Rate (1993-1994) 32.8%
Children as main workers (1991) 2.7%
Children as main and marginal workers (1991) 3.1%
Percentage of safe deliveries (1998-1999) 72
Percentage of children fully immunised (1998-1999) 68.9
Deprivation
1991 2001
Literacy (%) : All 66.3% 74.8%
Male 78.0% 84.7%
Female 53.4% 64.0%
Rural 43.7% 58.0%
Urban 75.9% 81.2%
Access to Education 2000
Enrolment Rate (Ages 6-14) 88.6%
Gross access ratio at primary level 100.0%
Habitations with Primary Schools 100.0%
Education
2000
Habitations with SDW facility 100.0%
Habitations without 40 lpd water availability 0.1%
Number of villages electrified 620
Percentage of villages not connected with pucca roads 49.3
1991
Households without access to electricity, SDW and toilet facilities 2.55
Basic Amenities
1999
Per Capita Forest Area (in hectares) 0.019
Annual Rate of Afforestation (%) (1993-1999) -2.47
Major Non-Timber Forest Produce :
Tendu Leaves
Forests

D I S T R I C T FA C T S H E E T S
204
Land Use Classification in 1998-99
1978 1998
Net Area Sown (in 000' ha.) 257.1 257.1
Gross Cropped Area (in 000' ha.) 304.9 448.6
Double Cropped Area to Net Area Sown 18.6 74.5
Net Irrigated Area (in 000' ha.) 43.3 160.1
Gross Irrigated Area (in 000' ha.) 44.9 160.1
1992-93 1998-99
Agriculture Intensity 142.2 174.5
agriculture and Land Use Over
30 Years
1978 1998
Net Sown Area to Total Geographical Area 67.1% 67.1%
Gross Cropped Area to Total Area 79.6% 117.1%
Net Irrigated to Net Sown Area 16.8% 62.3%
Cropped Area under Food Grains 69.0% 40.1%
Yield of Food Grains (in kg. per hectare) 782 2202
Per Capita Food Production (in kgs.) 164.1
Land Use and Agriculture
2000
Credit-Deposit Ratio 101.76
Commercial Banks (per 1000 population) 0.09
Crop lending per hectare of cultivated land 2045.7
Crop lending per hectare of irrigated land 5779.0
Credit
2001
Number of towns reporting slums 10
Urban population residing in slums 14.03%
Level of ground water development 97.60
Average annual rainfall (in mm) 980.00
1995 2000
Percentage area under wasteland 18.6% 15.30%
Habitat
1991 1998-99
Cereals Per Capita (Kg) 148.0 148.1
Pulses Per Capita (Kg) 29.5 16.0
Oilseeds Per Capita (Kg) 102.9 107.8
Average Landholding (Ha) 3.7 2.96
Gross Irrigated Area ('000 Ha) 160.1
Fertiliser Consumption Per Hectare (Kg) 68.8 92.92
1993 1999
Cropping Intensity 142 174.5
Land Use and Agriculture
Lorenz Curve of Operational Holdings
Cumulative percentage of Land Holdings
0.00 0.25 0.50 0.75 1.00
1.00
0.80
0.60
0.40
0.20
0.00
Cum
ulat
ive
perc
enta
ge o
f Lan
d Ar
ea
Net AreaSown(67%)
Fallow Land (1%)
CultivableWasteland(0%)
OtherUncultivableLand excludingFallow Land(8%)
Land NotAvailable for
Cultivation(10%)
Forest (14%)
NA = not available

205
D I S T R I C T FA C T S H E E T S
Name of Block Total Net Sown Gross Per capita Agriculture Net irrigated area to Irrigated area to Level of GW Status of
Cropped Area Cropped Net Sown Area Intensity Net Sown area total cropped area Development ground water
Indore 759.71 84.0% 148.1% 0.4 176 58.44 33.13 136.005 Over Exploited
Mhow 744.54 60.5% 90.5% 0.34 150 42.25 28.25 35.842 White
Sawer 744.21 86.9% 147.0% 0.48 169 56.72 33.53 130.404 Over Exploited
Depalpur 978.81 86.3% 134.5% 0.63 156 41.5 26.63 125.679 Over Exploited
Name of Block SC ST Road length Villages connected by all Population serviced per
per 100 sq.kms. weatherroads post office (1993-' 94)
Indore 20.9 10.93 55.68 65.10 5722
Mhow 12.3 30.47 43.11 49.4 3973
Sawer 25.84 3.5 43.67 40.69 4843
Depalpur 19.71 3.87 30.45 40.23 3713
Sexr ratio Agriculture Worker labourers in participation
Name of Tehsil Total Rural Urban Urbanisation Total Rural Urban Female All Child workers (%) ratio
Depalpur 211585 170635 40950 19.4% 55.5% 51.8% 70.8% 36.1% 960 949 33.30 47.63
Sawer 188028 168931 19097 10.2% 60.7% 59.1% 74.1% 41.6% 937 940 35.90 43.02
Indore 1883662 210664 1672998 88.8% 79.3% 61.5% 81.5% 70.6% 906 904 5.57 33.17
Mhow 302046 184780 117266 38.8% 68.0% 58.4% 82.2% 54.9% 895 916 30.26 41.56
Population Literacy Select Gender EmploymentIndicators
Agriculture and Irrigation Status ofGround Water
Population in 1991 Infrastructure (in percentage) (1991)

D I S T R I C T FA C T S H E E T S
206
Human Development Index (HDI) 0.572
Rank in Madhya Pradesh : HDI 17
Gender Related Development Index (GDI) 0.508
Rank in Madhya Pradesh : GDI 34
Human Development Indices - 2002
Area (in sq. km) 5211
Total Inhabited Villages 1449
Total Habitations 1736
Forest Villages 6
Towns (Class I to IV) and Major Towns 14
Jabalpur
Crop Zone :
Wheat Zone
Soil type :
Deep Black (Deep)
Agri Climatic Zone :
Central Narmada Valley
Schedule V Areas :
No Schedule V area
Basic Details on the District
1981 1991
Infant Mortality Rate 151 101
1991 2001
Life Expectancy (years) 55.1 57.5
1976-81 1984-90
Crude Birth Rate 32.3 34.1
Health
Janpad Panchayats 7
Gram Panchayats 525
Tehsils 4
Tribal Blocks 0
Legislative Assembly Seats 9
Administrative Information
0.572
0.818
0.5420.356
0.000
0.200
0.400
0.600
0.800
1.000
Graph on Human Development Index
1991 2001
Population 1768037 2167469
Share of Madhya Pradesh Population 3.64% 3.59%
Urban Population 57.1% 57.5%
Population of Scheduled Castes (SC) 13.3% n.a.
Population of Scheduled Tribes (ST) 14.9% n.a.
Density of Population (per sq. kms.) 339 416
All 19.12 22.59
Rural n.a. 21.33
Urban n.a. 23.54
Decadal Growth (%) 1981-91 1991- 00 1991 1998-99
Per Capita Food Production (in kgs.) 152.27 129.41
1996 2000
FPS per lakh population 47.26 46
Food
J A B A L P U R
HDI Education Health Income
Demography
JABALPUR

207
D I S T R I C T FA C T S H E E T S
1991 2001
Worker Participation Rate :
All 34.6% 37.1%
Rural 43.0% 45.0%
Urban 28.2% 31.2%
Share of Primary Sector (%) 47.0% n.a.
Share of Secondary Sector (%) 22.3% n.a.
Share of Tertiary Sector (%) 30.66% n.a.
Employment in Registered Industries (2000) 37940
Employment Rate of Growth (1991 to 2001) n.a. 30.8%
Total Employment in Farm Sector (%) 46.8% 40.19
Rural Employment in Non Farm Sector (%) 17.4% 25.9%
Agriculture Labour (%) 23.2% 25.1%
Employment
2001
Middle Schools per lakh population 30.9
High Schools per lakh population 15.0
Rural Population per Primary Health Centre 57560
Population Serviced Sub Health Centre 4772
2000
Road length per 100 sq. km. (1999) 31.0
Telephone per lakh population 2892
Population per Post Office (1994-95) 7290
Registered establishments under Factories Act (1997) 1121
Per capita consumption of electricity (non industrial) in kwh 432.8
Infrastructure / Facilities
1991 2001
Life Expectancy of Females at Birth 56.5 57.3
Child Sex Ratio 951 924
Girl Child Mortality (birth to age 1 year) 117 n.a.
Girl Child Mortality (up to age 5 years) 145 n.a.
Total Fertility Rate 4.2 n.a.
Gender Ratio : All 903 910
Rural 929 924
Urban 884 900
General non SC/ ST Gender Ratio 891 n.a.
SC Gender Ratio 913 n.a.
ST Gender Ratio 955 n.a.
Workers Participation Rate - Female 19.1% 22.4%
2000
Female Enrolment Rate (Ages 6-14) 92.8%
Gender
Estimated Poverty Rate (1993-1994) 42.2%
Children as main workers (1991) 2.9%
Children as main and marginal workers (1991) 3.8%
Percentage of safe deliveries (1998-1999) 44.4
Percentage of children fully immunised (1998-1999) 50.9
Deprivation
1991 2001
Literacy (%) : All 64.6% 76.2%
Male 75.6% 91.4%
Female 52.3% 59.5%
Rural 46.5% 64.3%
Urban 77.7% 84.4%
Access to Education 2000
Enrolment Rate (Ages 6-14) 94.2%
Gross access ratio at primary level 100.0%
Habitations with Primary Schools 100.0%
Education
2000
Habitations with SDW facility 100.0%
Habitations without 40 lpd water availability 0.0%
Number of villages electrified 1339
Percentage of villages not connected with pucca roads 68.2
1991
Households without access to electricity, SDW and toilet facilities 19.74
Basic Amenities
1999
Per Capita Forest Area (in hectares) 0.095
Annual Rate of Afforestation (%) (1993-1999) -1.16
Major Non-Timber Forest Produce :
Tendu Leaves, Harra, Aonla
Forests

D I S T R I C T FA C T S H E E T S
208
Land Use Classification in 1998-99
1978 1998
Net Area Sown (in 000' ha.) 468.4 278.6
Gross Cropped Area (in 000' ha.) 562.7 368.6
Double Cropped Area to Net Area Sown 20.1 32.3
Net Irrigated Area (in 000' ha.) 26.2 92.7
Gross Irrigated Area (in 000' ha.) 32.6 96.5
1992-93 1998-99
Agriculture Intensity 122.4 132.3
agriculture and Land Use Over
30 Years
1978 1998
Net Sown Area to Total Geographical Area 46.3% 53.6%
Gross Cropped Area to Total Area 55.6% 70.9%
Net Irrigated to Net Sown Area 5.6% 33.3%
Cropped Area under Food Grains 91.6% 83.1%
Yield of Food Grains (in kg. per hectare) 599 879
Per Capita Food Production (in kgs.) 129.4
Land Use and Agriculture
2000
Credit-Deposit Ratio 46.09
Commercial Banks (per 1000 population) 0.06
Crop lending per hectare of cultivated land 802.2
Crop lending per hectare of irrigated land 3950.4
Credit
2001
Number of towns reporting slums 14
Urban population residing in slums 22.63%
Level of ground water development 30.59
Average annual rainfall (in mm) 1161.90
1995 2000
Percentage area under wasteland 17.2% 17.43%
Habitat
1991 1998-99
Cereals Per Capita (Kg) 116.5 92.6
Pulses Per Capita (Kg) 35.7 36.9
Oilseeds Per Capita (Kg) 6.9 13.6
Average Landholding (Ha) 1.9 1.66
Gross Irrigated Area ('000 Ha) 96.5
Fertiliser Consumption Per Hectare (Kg) 53.1 41.69
1993 1999
Cropping Intensity 122 132.3
Land Use and Agriculture
Lorenz Curve of Operational Holdings
Cumulative percentage of Land Holdings
0.00 0.25 0.50 0.75 1.00
1.00
0.80
0.60
0.40
0.20
0.00
Cum
ulat
ive
perc
enta
ge o
f Lan
d Ar
ea
Net AreaSown(55%)
Fallow Land (6%)
CultivableWasteland(4%)
OtherUncultivableLand excludingFallow Land(8%)
Land NotAvailable for
Cultivation(13%)
Forest (14%)
NA = not available

209
D I S T R I C T FA C T S H E E T S
Name of Block Total Net Sown Gross Per capita Agriculture Net irrigated area to Irrigated area to Level of GW Status of
Cropped Area Cropped Net Sown Area Intensity Net Sown area total cropped area Development ground water
Panagar 421.43 72.8% 93.3% 0.3 128 26.52 20.68 26.801 White
Kundam 870.4 41.7% 46.8% 0.39 112 4.09 3.64 5.474 White
Bargi (Jabalpur) 751 45.5% 52.5% 0.27 115 18.43 15.97 24.581 White
Sihora 440.05 61.0% 77.3% 0.27 127 23.71 22.02 30.391 White
Majholi 596.94 61.2% 73.3% 0.31 120 18.04 15.07 30.904 White
Patan 568.49 87.9% 105.5% 0.52 120 12.21 10.18 38.663 White
Shahpura 810.31 68.2% 83.7% 0.43 123 13.82 5.37 56.720 White
Name of Block SC ST Road length Villages connected by all Population serviced per
per 100 sq.kms. weatherroads post office (1993-' 94)
Panagar 12.92 22.75 26.8 55.8 3582
Kundam 8.12 70.98 23.7 44.0 7111
Bargi (Jabalpur) 11.69 29.2 39.0 36.2 3917
Sihora 13.41 19.12 26.4 69.1 4759
Majholi 13.45 20.36 16.4 36.5 10599
Patan 17.47 15.14 15.8 36.0 2822
Shahpura 14.44 23.74 14.3 38.0 7505
Population in 1991 Infrastructure (in percentage) (1991)
Sexr ratio Agriculture Worker labourers in participation
Name of Tehsil Total Rural Urban Urbanisation Total Rural Urban Female All Child workers (%) ratio
Sihora 302801 253606 49195 16.2% 68.5% 66.4% 78.7% 54.1% 938 972 34.04 45.93
Patan 308503 266251 42252 13.7% 64.0% 62.0% 76.4% 51.1% 906 941 54.04 42.85
Jabalpur 1449020 293963 1155057 79.7% 81.8% 69.0% 84.9% 74.1% 899 902 11.80 32.67
Kundam 107145 107145 - - 51.9% 51.9% 0.0% 37.6% 995 986 44.38 54.07
Population Literacy Select Gender EmploymentIndicators
Agriculture and Irrigation Status ofGround Water

D I S T R I C T FA C T S H E E T S
210
Human Development Index (HDI) 0.372
Rank in Madhya Pradesh : HDI 45
Gender Related Development Index (GDI) 0.450
Rank in Madhya Pradesh : GDI 43
Human Development Indices - 2002
Area (in sq. km) 6782
Total Inhabited Villages 1313
Total Habitations 9927
Forest Villages 0
Towns (Class I to IV) and Major Towns 8
Jhabua
Crop Zone :
Cotton Jowar (Petlawad Tehsil)
Soil type :
Medium Black (Medium) (Petlawad Tehsil), Medium Black Skeletal (Light/ Medium)
(except Petlawad Tehsil)
Agri Climatic Zone :
Malwa Plateau (Petlawad Tehsil), Jhabua Hills (except Petlawad Tehsil)
Schedule V Areas :
Entire Jhabua District
Basic Details on the District
1981 1991
Infant Mortality Rate 133 130
1991 2001
Life Expectancy (years) 54.7 55.8
1976-81 1984-90
Crude Birth Rate 42.2 45.4
Health
Janpad Panchayats 12
Gram Panchayats 612
Tehsils 8
Tribal Blocks 12
Legislative Assembly Seats 5
Administrative Information
0.3720.471 0.513
0.133
0.000
0.200
0.400
0.600
0.800
1.000
Graph on Human Development Index
1991 2001
Population 1130405 1396677
Share of Madhya Pradesh Population 2.33% 2.31%
Urban Population 8.7% 8.7%
Population of Scheduled Castes (SC) 3.1% n.a.
Population of Scheduled Tribes (ST) 85.7% n.a.
Density of Population (per sq. kms.) 167 206
All 42.16 23.56
Rural n.a. 23.57
Urban n.a. 23.4
Decadal Growth (%) 1981-91 1991- 00 1991 1998-99
Per Capita Food Production (in kgs.) 251.33 268.22
1996 2000
FPS per lakh population 19.66 21
Food
J H A B U A
HDI Education Health Income
Demography
JHABUA

211
D I S T R I C T FA C T S H E E T S
1991 2001
Worker Participation Rate :
All 54.0% 52.6%
Rural 56.1% 54.5%
Urban 32.5% 32.6%
Share of Primary Sector (%) 90.6% n.a.
Share of Secondary Sector (%) 2.7% n.a.
Share of Tertiary Sector (%) 6.69% n.a.
Employment in Registered Industries (2000) 4000
Employment Rate of Growth (1991 to 2001) n.a. 20.0%
Total Employment in Farm Sector (%) 90.4% 87.23
Rural Employment in Non Farm Sector (%) 5.1% 8.8%
Agriculture Labour (%) 5.9% 13.9%
Employment
2001
Middle Schools per lakh population 32.4
High Schools per lakh population 7.3
Rural Population per Primary Health Centre 39864
Population Serviced Sub Health Centre 3687
2000
Road length per 100 sq. km. (1999) 35.1
Telephone per lakh population 671
Population per Post Office (1994-95) 7952
Registered establishments under Factories Act (1997) 82
Per capita consumption of electricity (non industrial) in kwh 48.8
Infrastructure / Facilities
1991 2001
Life Expectancy of Females at Birth 51.4 51.3
Child Sex Ratio 991 970
Girl Child Mortality (birth to age 1 year) 96 n.a.
Girl Child Mortality (up to age 5 years) 179 n.a.
Total Fertility Rate 7.0 n.a.
Gender Ratio : All 977 990
Rural 983 996
Urban 920 929
General non SC/ ST Gender Ratio 918 n.a.
SC Gender Ratio 954 n.a.
ST Gender Ratio 986 n.a.
Workers Participation Rate - Female 51.8% 50.7%
2000
Female Enrolment Rate (Ages 6-14) 58.5%
Gender
Estimated Poverty Rate (1993-1994) 31.2%
Children as main workers (1991) 15.2%
Children as main and marginal workers (1991) 25.5%
Percentage of safe deliveries (1998-1999) 22.4
Percentage of children fully immunised (1998-1999) 17.4
Deprivation
1991 2001
Literacy (%) : All 19.0% 37.1%
Male 26.3% 48.8%
Female 11.5% 25.5%
Rural 13.7% 32.3%
Urban 70.0% 82.6%
Access to Education 2000
Enrolment Rate (Ages 6-14) 69.7%
Gross access ratio at primary level 100.0%
Habitations with Primary Schools 100.0%
Education
2000
Habitations with SDW facility 98.5%
Habitations without 40 lpd water availability 1.7%
Number of villages electrified 1292
Percentage of villages not connected with pucca roads 55.8
1991
Households without access to electricity, SDW and toilet facilities 28.20
Basic Amenities
1999
Per Capita Forest Area (in hectares) 0.063
Annual Rate of Afforestation (%) (1993-1999) -3.23
Major Non-Timber Forest Produce :
Tendu Leaves
Forests

D I S T R I C T FA C T S H E E T S
212
Land Use Classification in 1998-99
1978 1998
Net Area Sown (in 000' ha.) 340.4 361.9
Gross Cropped Area (in 000' ha.) 382.1 474.4
Double Cropped Area to Net Area Sown 12.3 31.1
Net Irrigated Area (in 000' ha.) 17.9 80.8
Gross Irrigated Area (in 000' ha.) 18.4 82.2
1992-93 1998-99
Agriculture Intensity 140.2 131.1
agriculture and Land Use Over
30 Years
1978 1998
Net Sown Area to Total Geographical Area 50.4% 53.6%
Gross Cropped Area to Total Area 56.5% 70.2%
Net Irrigated to Net Sown Area 5.3% 22.3%
Cropped Area under Food Grains 80.5% 81.7%
Yield of Food Grains (in kg. per hectare) 395 927
Per Capita Food Production (in kgs.) 268.2
Land Use and Agriculture
2000
Credit-Deposit Ratio 45.4
Commercial Banks (per 1000 population) 0.02
Crop lending per hectare of cultivated land 528.8
Crop lending per hectare of irrigated land 3226.4
Credit
2001
Number of towns reporting slums 8
Urban population residing in slums 0.00%
Level of ground water development 13.70
Average annual rainfall (in mm) 580.00
1995 2000
Percentage area under wasteland 17.7% 20.48%
Habitat
1991 1998-99
Cereals Per Capita (Kg) 207.0 214.4
Pulses Per Capita (Kg) 44.3 53.8
Oilseeds Per Capita (Kg) 21.1 28.2
Average Landholding (Ha) 2.6 2.23
Gross Irrigated Area ('000 Ha) 82.2
Fertiliser Consumption Per Hectare (Kg) 19.5 26.26
1993 1999
Cropping Intensity 140 131.1
Land Use and Agriculture
Lorenz Curve of Operational Holdings
Cumulative percentage of Land Holdings
0.00 0.25 0.50 0.75 1.00
1.00
0.80
0.60
0.40
0.20
0.00
Cum
ulat
ive
perc
enta
ge o
f Lan
d Ar
ea
Net AreaSown(54%)
Fallow Land (1%)
CultivableWasteland(4%)
OtherUncultivableLand excludingFallow Land(5%)
Land NotAvailable for
Cultivation(17%)
Forest (19%)
NA = not available

213
D I S T R I C T FA C T S H E E T S
Name of Block Total Net Sown Gross Per capita Agriculture Net irrigated area to Irrigated area to Level of GW Status of
Cropped Area Cropped Net Sown Area Intensity Net Sown area total cropped area Development ground water
Jhabua 439.42 59.4% 87.1% 0.25 147 13.68 9.46 6.265 White
Rama 597.84 50.8% 69.9% 0.36 138 25.11 18.76 13.822 White
Ranapur 387.81 73.5% 102.8% 0.36 140 13.69 9.84 8.083 White
Alirajpur 620.95 66.3% 82.7% 0.49 125 9.89 7.93 18.761 White
Sondhwa 900.32 37.7% 48.1% 0.22 128 7.41 5.8 3.703 White
Kattiwara 719.69 32.5% 40.0% 0.32 123 7.65 6.22 3.375 White
Jobat 393.35 67.1% 83.2% 0.44 124 12.02 9.72 12.984 White
Udaigarh 367.63 69.1% 90.1% 0.43 130 11.42 8.77 11.616 White
Bhabra 315.54 70.9% 98.4% 0.35 139 8.73 6.29 18.884 White
Petlawad 885.28 58.2% 77.8% 0.4 134 31.86 27.27 30.365 White
Thandla 447.54 66.2% 102.8% 0.3 155 35.58 24.02 21.824 White
Meghnagar 320.58 68.7% 98.5% 0.22 143 15.33 11.33 8.057 White
Name of Block SC ST Road length Villages connected by all Population serviced per
per 100 sq.kms. weatherroads post office (1993-' 94)
Jhabua 0.99 94.81 33.2 68.5 5748
Rama 1.38 94.34 23.6 58.2 7610
Ranapur 1.15 97.14 24.5 60.2 8626
Alirajpur 4.25 91.71 29.5 66.3 5616
Sondhwa 4.34 92.73 15.8 78.2 10645
Kattiwara 12.06 82.02 14.2 45.8 6026
Jobat 2.84 95.58 14.2 41.3 6731
Udaigarh 2.13 94.46 21.8 18.8 7345
Bhabra 1.32 97.01 68.1 96.3 5778
Petlawad 1.9 80.24 28.9 34.6 3234
Thandla 1.07 93.75 39.6 63.4 4425
Meghnagar 1.62 87.2 27.1 44.1 7008
Population in 1991 Infrastructure (in percentage) (1991)
Sexr ratio Agriculture Worker labourers in participation
Name of Tehsil Total Rural Urban Urbanisation Total Rural Urban Female All Child workers (%) ratio
Thandla 140447 127762 12685 9.0% 38.1% 32.8% 85.0% 25.8% 972 972 31.23 49.04
Petlawad 170466 158047 12419 7.3% 49.6% 46.7% 83.4% 33.9% 982 969 12.31 54.96
Jhabua 258121 227544 30577 11.8% 36.2% 28.5% 86.6% 25.0% 985 954 10.89 48.21
Jobat 157536 147545 9991 6.3% 31.9% 28.0% 84.8% 22.2% 1031 982 7.39 60.89
Alirajpur 367448 342287 25161 6.8% 28.5% 24.4% 78.1% 19.8% 997 982 12.30 52.79
Meghnagar 124210 113894 10316 8.3% 43.6% 40.5% 75.1% 30.2% 974 969 23.59 46.12
Bhabra 87333 78070 9263 10.6% 39.6% 36.3% 65.8% 28.6% 984 978 14.65 55.81
Ranapur 91116 80499 10617 11.7% 43.3% 38.8% 74.3% 30.1% 983 943 7.80 56.45
Population Literacy Select Gender EmploymentIndicators
Agriculture and Irrigation Status ofGround Water

D I S T R I C T FA C T S H E E T S
214
Human Development Index (HDI) 0.542
Rank in Madhya Pradesh : HDI 29
Gender Related Development Index (GDI) 0.558
Rank in Madhya Pradesh : GDI 21
Human Development Indices - 2002
Area (in sq. km) 4950
Total Inhabited Villages 882
Total Habitations 1161
Forest Villages 2
Towns (Class I to IV) and Major Towns 4
Mudwara (Katni)
Crop Zone :
Wheat Rice Zone (Katni Tehsil), Wheat Zone (except Katni Tehsil)
Soil type :
Mixed Red and Black Soils (Medium) (Katni Tehsil), Deep Black (Deep) (exceptKatni Tehsil)
Agri Climatic Zone :
Kymore Plateau and Satpura Hills (Katni Tehsil), Central Narmada Valley (Katniexcept Katni Tehsil)
Schedule V Areas :
No Schedule V area
Basic Details on the District
1981 1991
Infant Mortality Rate n.a. n.a.
1991 2001
Life Expectancy (years) 55.1 57.5
1976-81 1984-90
Crude Birth Rate n.a. n.a.
Health
Janpad Panchayats 6
Gram Panchayats 409
Tehsils 5
Tribal Blocks 0
Legislative Assembly Seats 4
Administrative Information
0.5420.739
0.5420.345
0.000
0.200
0.400
0.600
0.800
1.000
Graph on Human Development Index
1991 2001
Population 881925 1063689
Share of Madhya Pradesh Population 1.82% 1.76%
Urban Population 22.4% 21.1%
Population of Scheduled Castes (SC) 11.9% n.a.
Population of Scheduled Tribes (ST) 23.9% n.a.
Density of Population (per sq. kms.) 178 215
All 23.43 20.61
Rural n.a. 22.55
Urban n.a. 13.9
Decadal Growth (%) 1981-91 1991- 00 1991 1998-99
Per Capita Food Production (in kgs.) 152.27 219.12
1996 2000
FPS per lakh population n.a. 40
Food
K A T N I
HDI Education Health Income
Demography
KATNI

215
D I S T R I C T FA C T S H E E T S
1991 2001
Worker Participation Rate :
All 41.9% 41.7%
Rural 45.6% 44.9%
Urban 29.0% 29.9%
Share of Primary Sector (%) 72.7% n.a.
Share of Secondary Sector (%) 11.9% n.a.
Share of Tertiary Sector (%) 15.37% n.a.
Employment in Registered Industries (2000) n.a.
Employment Rate of Growth (1991 to 2001) n.a. 20.1%
Total Employment in Farm Sector (%) 70.9% 63.19
Rural Employment in Non Farm Sector (%) 16.9% 26.5%
Agriculture Labour (%) 27.6% 31.9%
Employment
2001
Middle Schools per lakh population 32.4
High Schools per lakh population 10.6
Rural Population per Primary Health Centre 44144
Population Serviced Sub Health Centre 5177
2000
Road length per 100 sq. km. (1999) 23.9
Telephone per lakh population 955
Population per Post Office (1994-95) n.a.
Registered establishments under Factories Act (1997) n.a.
Per capita consumption of electricity (non industrial) in kwh 80.4
Infrastructure / Facilities
1991 2001
Life Expectancy of Females at Birth 56.5 58.5
Child Sex Ratio 959 951
Girl Child Mortality (birth to age 1 year) n.a. n.a.
Girl Child Mortality (up to age 5 years) n.a. n.a.
Total Fertility Rate n.a. n.a.
Gender Ratio : All 939 941
Rural 950 950
Urban 904 909
General non SC/ ST Gender Ratio 926 n.a.
SC Gender Ratio 946 n.a.
ST Gender Ratio 974 n.a.
Workers Participation Rate - Female 30.7% 31.2%
2000
Female Enrolment Rate (Ages 6-14) 90.5%
Gender
Estimated Poverty Rate (1993-1994) n.a.
Children as main workers (1991) n.a.
Children as main and marginal workers (1991) n.a.
Percentage of safe deliveries (1998-1999) n.a.
Percentage of children fully immunised (1998-1999) n.a.
Deprivation
1991 2001
Literacy (%) : All 47.8% 64.7%
Male 64.0% 79.9%
Female 30.5% 48.5%
Rural 40.5% 59.8%
Urban 72.3% 81.8%
Access to Education 2000
Enrolment Rate (Ages 6-14) 91.1%
Gross access ratio at primary level 100.0%
Habitations with Primary Schools 100.0%
Education
1991
Habitations with SDW facility 99.9%
Habitations without 40 lpd water availability 0.1%
Number of villages electrified 843
Percentage of villages not connected with pucca roads 68.2
1991
Households without access to electricity, SDW and toilet facilities n.a.
Basic Amenities
1999
Per Capita Forest Area (in hectares) n.a.
Annual Rate of Afforestation (%) (1993-1999) n.a.
Major Non-Timber Forest Produce :
Tendu Leaves
Forests

D I S T R I C T FA C T S H E E T S
216
Land Use Classification in 1998-99
1978 1998
Net Area Sown (in 000' ha.) n.a. 201.2
Gross Cropped Area (in 000' ha.) n.a. 265.8
Double Cropped Area to Net Area Sown n.a. 32.1
Net Irrigated Area (in 000' ha.) n.a. 45.7
Gross Irrigated Area (in 000' ha.) n.a. 54.2
1992-93 1998-99
Agriculture Intensity n.a. 132.1
Agriculture and Land Use over
30 Years
1978 1998
Net Sown Area to Total Geographical Area Included in Jabalpur 40.8%
Gross Cropped Area to Total Area n.a. 53.9%
Net Irrigated to Net Sown Area n.a. 22.7%
Cropped Area under Food Grains n.a. 92.7%
Yield of Food Grains (in kg. per hectare) n.a. 911
Per Capita Food Production (in kgs.) 219.1
Land Use and Agriculture
2000
Credit-Deposit Ratio 29.33
Commercial Banks (per 1000 population) 0.05
Crop lending per hectare of cultivated land n.a.
Crop lending per hectare of irrigated land n.a.
Credit
2001
Number of towns reporting slums 4
Urban population residing in slums 16.29%
Level of ground water development 15.76
Average annual rainfall (in mm) 1027.00
1995 2000
Percentage area under wasteland n.a. n.a.
Habitat
1991 1998-99
Cereals Per Capita (Kg) n.a. 195.1
Pulses Per Capita (Kg) n.a. 24.0
Oilseeds Per Capita (Kg) n.a. 6.0
Average Landholding (Ha) n.a. n.a.
Gross Irrigated Area ('000 Ha) 54.2
Fertiliser Consumption Per Hectare (Kg) n.a. 36.3
1993 1999
Cropping Intensity n.a. 132.1
Land Use and Agriculture
Lorenz Curve of Operational Holdings
Cumulative percentage of Land Holdings
0.00 0.25 0.50 0.75 1.00
1.00
0.80
0.60
0.40
0.20
0.00
Cum
ulat
ive
perc
enta
ge o
f Lan
d Ar
ea
Net AreaSown(41%)
Fallow Land (9%)
CultivableWasteland(7%)
OtherUncultivableLand excludingFallow Land(9%)
Land NotAvailable for
Cultivation(14%)
Forest (20%)
NA = not available

217
D I S T R I C T FA C T S H E E T S
Name of Block Total Net Sown Gross Per capita Agriculture Net irrigated area to Irrigated area to Level of GW Status of
Cropped Area Cropped Net Sown Area Intensity Net Sown area total cropped area Development ground water
Bahoriband 930.55 37.8% 48.9% 0.25 129 24.1 26 26.775 White
Dhimarkheda 855.25 35.9% 45.2% 0.24 126 17.15 13.62 6.169 White
Rithi 587.15 49.5% 61.4% 0.34 124 22.8 18.39 21.000 White
Katni 492.52 45.7% 59.9% 0.25 131 30.18 29.05 13.596 White
Badwara 838.5 44.3% 51.1% 0.3 115 22.08 19.15 25.634 White
Vijairaghavgarh 659.6 52.0% 61.5% 0.28 118 20.31 18.65 4.249 White
Name of Block SC ST Road length Villages connected by all Population serviced per
per 100 sq.kms. weatherroads post office (1993-' 94)
Bahoriband 13.17 21.67 6.98 44.39 6188
Dhimarkheda 11.27 31.75 9.94 25.53 3819
Rithi 13.66 25.43 11.58 54.13 3570
Katni 12.21 28.22 24.77 89.43 2758
Badwara 10.23 33.5 14.55 63.12 5160
Vijairaghavgarh 11.09 26.62 21.53 62.07 5171
Population in 1991 Infrastructure (in percentage) (1991)
Sexr ratio Agriculture Worker labourers in participation
Name of Tehsil* Total Rural Urban Urbanisation Total Rural Urban Female All Child workers (%) ratio
Bahoriband 163437 163437 - - 61.5% 61.5% 0.0% 45.7% 954 970 39.55 43.53
Dhimarkhara 151991 151991 - - 59.2% 59.2% 0.0% 42.4% 943 970 38.46 46.37
Murwara 569654 371993 197661 34.7% 66.7% 58.0% 81.9% 52.0% 935 938 27.32 39.60
Vijayraghavgrah 178607 151310 27297 15.3% 65.8% 63.0% 80.4% 44.7% 946 957 32.52 42.65
Population Literacy Select Gender EmploymentIndicators
*Data for Tehsil Rithi not available separately as it was formed on 18.7.01
Agriculture and Irrigation Status ofGround Water

D I S T R I C T FA C T S H E E T S
218
Human Development Index (HDI) 0.563
Rank in Madhya Pradesh : HDI 21
Gender Related Development Index (GDI) 0.517
Rank in Madhya Pradesh : GDI 31
Human Development Indices - 2002
Area (in sq. km) 10779
Total Inhabited Villages 1060
Total Habitations 2252
Forest Villages 118
Towns (Class I to IV) and Major Towns 7
Burhanpur, Khandwa
Crop Zone :
Cotton Jowar
Soil type :
Medium Black (Medium)
Agri Climatic Zone :
Nimar Plain
Schedule V Areas :
Khalwa Block of Khaknar Tehsil and Khaknar Block of Nepanagar Tehsil
Basic Details on the District
1981 1991
Infant Mortality Rate 154 100
1991 2001
Life Expectancy (years) 55.4 57.7
1976-81 1984-90
Crude Birth Rate 37.1 38.5
Health
Janpad Panchayats 9
Gram Panchayats 591
Tehsils 6
Tribal Blocks 2
Legislative Assembly Seats 7
Administrative Information
0.5630.705
0.5440.440
0.000
0.200
0.400
0.600
0.800
1.000
Graph on Human Development Index
1991 2001
Population 1431662 1708170
Share of Madhya Pradesh Population 2.95% 2.83%
Urban Population 27.5% 26.9%
Population of Scheduled Castes (SC) 11.4% n.a.
Population of Scheduled Tribes (ST) 26.8% n.a.
Density of Population (per sq. kms.) 133 159
All 24.11 19.31
Rural n.a. 20.27
Urban n.a. 16.78
Decadal Growth (%) 1981-91 1991- 00 1991 1998-99
Per Capita Food Production (in kgs.) 164.70 171.45
1996 2000
FPS per lakh population 28.53 27
Food
E A S T - N I M A R
HDI Education Health Income
Demography
KHANDWA
E A S T- N I M A R

219
D I S T R I C T FA C T S H E E T S
1991 2001
Worker Participation Rate :
All 43.7% 43.9%
Rural 49.3% 49.1%
Urban 28.9% 29.7%
Share of Primary Sector (%) 76.7% n.a.
Share of Secondary Sector (%) 9.8% n.a.
Share of Tertiary Sector (%) 13.54% n.a.
Employment in Registered Industries (2000) 27453
Employment Rate of Growth (1991 to 2001) n.a. 19.9%
Total Employment in Farm Sector (%) 76.6% 75.38
Rural Employment in Non Farm Sector (%) 8.8% 10.6%
Agriculture Labour (%) 33.3% 39.3%
Employment
2001
Middle Schools per lakh population 22.0
High Schools per lakh population 6.3
Rural Population per Primary Health Centre 27127
Population Serviced Sub Health Centre 4605
2000
Road length per 100 sq. km. (1999) 17.7
Telephone per lakh population 1405
Population per Post Office (1994-95) 6969
Registered establishments under Factories Act (1997) 325
Per capita consumption of electricity (non industrial) in kwh 238.0
Infrastructure / Facilities
1991 2001
Life Expectancy of Females at Birth 55.9 57.8
Child Sex Ratio 951 944
Girl Child Mortality (birth to age 1 year) 131 n.a.
Girl Child Mortality (up to age 5 years) 153 n.a.
Total Fertility Rate 5.2 n.a.
Gender Ratio : All 938 936
Rural 940 936
Urban 931 936
General non SC/ ST Gender Ratio 930 n.a.
SC Gender Ratio 919 n.a.
ST Gender Ratio 963 n.a.
Workers Participation Rate - Female 33.7% 34.3%
2000
Female Enrolment Rate (Ages 6-14) 85.2%
Gender
Estimated Poverty Rate (1993-1994) 50.0%
Children as main workers (1991) 8.5%
Children as main and marginal workers (1991) 10.6%
Percentage of safe deliveries (1998-1999) 42.8
Percentage of children fully immunised (1998-1999) 56.7
Deprivation
1991 2001
Literacy (%) : All 45.5% 61.7%
Male 58.5% 74.1%
Female 31.5% 48.5%
Rural 36.4% 55.6%
Urban 68.4% 77.5%
Access to Education 2000
Enrolment Rate (Ages 6-14) 88.0%
Gross access ratio at primary level 100.0%
Habitations with Primary Schools 100.0%
Education
2000
Habitations with SDW facility 99.6%
Habitations without 40 lpd water availability 0.5%
Number of villages electrified 1055
Percentage of villages not connected with pucca roads 51.0
1991
Households without access to electricity, SDW and toilet facilities 14.95
Basic Amenities
1999
Per Capita Forest Area (in hectares) 0.211
Annual Rate of Afforestation (%) (1993-1999) -2.59
Major Non-Timber Forest Produce :
Tendu Leaves
Forests

D I S T R I C T FA C T S H E E T S
220
Land Use Classification in 1998-99
1978 1998
Net Area Sown (in 000' ha.) 438.0 438.3
Gross Cropped Area (in 000' ha.) 465.4 543.6
Double Cropped Area to Net Area Sown 6.3 24.0
Net Irrigated Area (in 000' ha.) 42.5 151.4
Gross Irrigated Area (in 000' ha.) 42.5 160.2
1992-93 1998-99
Agriculture Intensity 110.0 124.0
agriculture and Land Use Over
30 Years
1978 1998
Net Sown Area to Total Geographical Area 39.2% 39.2%
Gross Cropped Area to Total Area 41.7% 48.6%
Net Irrigated to Net Sown Area 9.7% 34.5%
Cropped Area under Food Grains 56.0% 44.2%
Yield of Food Grains (in kg. per hectare) 829 1176
Per Capita Food Production (in kgs.) 171.4
Land Use and Agriculture
2000
Credit-Deposit Ratio 70.2
Commercial Banks (per 1000 population) 0.04
Crop lending per hectare of cultivated land 1441.1
Crop lending per hectare of irrigated land 5338.6
Credit
2001
Number of towns reporting slums 7
Urban population residing in slums 66.41%
Level of ground water development 39.87
Average annual rainfall (in mm) 880.00
1995 2000
Percentage area under wasteland 10.8% 15.75%
Habitat
1991 1998-99
Cereals Per Capita (Kg) 142.1 144.0
Pulses Per Capita (Kg) 22.6 27.5
Oilseeds Per Capita (Kg) 16.1 54.2
Average Landholding (Ha) 3.8 3.19
Gross Irrigated Area ('000 Ha) 160.2
Fertiliser Consumption Per Hectare (Kg) 56.1 65
1993 1999
Cropping Intensity 110 124.0
Land Use and Agriculture
Lorenz Curve of Operational Holdings
Cumulative percentage of Land Holdings
0.00 0.25 0.50 0.75 1.00
1.00
0.80
0.60
0.40
0.20
0.00
Cum
ulat
ive
perc
enta
ge o
f Lan
d Ar
ea
Net AreaSown(39%)
Fallow Land (2%)
CultivableWasteland(0%)
OtherUncultivableLand excludingFallow Land(6%)
Land NotAvailable for
Cultivation(7%)
Forest (46%)
NA = not available

221
D I S T R I C T FA C T S H E E T S
Name of Block Total Net Sown Gross Per capita Agriculture Net irrigated area to Irrigated area to Level of GW Status of
Cropped Area Cropped Net Sown Area Intensity Net Sown area total cropped area Development ground water
Khandwa 635.65 73.6% 78.9% 0.48 107 13.61 12.7 51.542 White
Punasa 761.06 67.9% 74.1% 0.46 109 20.33 18.63 53.643 White
Chhegaon Makhan 620.87 75.8% 79.5% 0.47 105 10.92 10.41 67.068 Grey
Pandhana 681.66 106.7% 116.2% 0.52 109 13.66 12.54 36.899 White
Burhanpur 640.64 75.3% 86.1% 0.31 114 29.73 39.07 32.046 White
Khaknar 742.03 74.5% 81.0% 0.41 109 16.18 18.21 43.026 White
Harsud 567.9 69.7% 78.8% 0.58 113 19.07 16.86 30.101 White
Baladi 532.72 53.4% 61.6% 0.51 115 20.09 17.42 15.243 White
Khalawa 751.81 72.6% 79.5% 0.54 110 13.84 18.31 40.693 White
Name of Block SC ST Road length Villages connected by all Population serviced per
per 100 sq.kms. weatherroads post office (1993-' 94)
Khandwa 19.43 20.16 38.39 47.32 1445
Punasa 13.91 31.28 34.56 90.32 3974
Chhegaon Makhan 19.26 19.34 34.31 75.86 7708
Pandhana 10.8 42.58 34.13 45.45 8276
Burhanpur 14.22 18.09 44.49 39.06 5511
Khaknar 5.92 49.72 36.39 30.37 5205
Harsud 14.58 16.83 26.76 43 2946
Baladi 14.92 23.55 12.39 29.79 6143
Khalawa 6.92 60.47 42.7 16.22 4807
Population in 1991 Infrastructure (in percentage) (1991)
Sexr ratio Agriculture Worker labourers in participation
Name of Tehsil* Total Rural Urban Urbanisation Total Rural Urban Female All Child workers (%) ratio
Khandwa 621120 431861 189259 30.5% 69.3% 63.9% 81.2% 56.3% 928 938 35.06 42.51
Harsud 321847 305978 15869 4.9% 51.9% 50.3% 81.0% 35.5% 931 961 40.61 48.80
Burhanpur 484554 272007 212547 43.9% 63.7% 55.6% 73.8% 52.2% 943 928 40.07 40.33
Pandhana 129542 118543 10999 8.5% 60.1% 58.6% 75.9% 44.2% 941 960 45.72 47.39
Nepanagar 151107 119449 31658 21.0% 44.5% 34.3% 78.2% 33.6% 951 961 44.17 47.66
Population Literacy Select Gender EmploymentIndicators
* Data for Tehsil Khaknar not available separately as it was formed on 18.7.01
Agriculture and Irrigation Status ofGround Water

D I S T R I C T FA C T S H E E T S
222
Human Development Index (HDI) 0.498
Rank in Madhya Pradesh : HDI 35
Gender Related Development Index (GDI) 0.543
Rank in Madhya Pradesh : GDI 26
Human Development Indices - 2002
Area (in sq. km) 8030
Total Inhabited Villages 1170
Total Habitations 2716
Forest Villages 34
Towns (Class I to IV) and Major Towns 8
Khargone
Crop Zone :
Cotton Jowar
Soil type :
Medium Black (Medium)
Agri Climatic Zone :
Nimar Plain
Schedule V Areas :
All Blocks of Khargone Bhagwanpura, Segaon, Jhiranya, Bhikangaown and
Mahsehwar Tehsils
Basic Details on the District
1981 1991
Infant Mortality Rate 129 104
1991 2001
Life Expectancy (years) 55.9 59.6
1976-81 1984-90
Crude Birth Rate 41.7 38.4
Health
Janpad Panchayats 9
Gram Panchayats 560
Tehsils 8
Tribal Blocks 7
Legislative Assembly Seats 6
Administrative Information
0.4980.700
0.576
0.217
0.000
0.200
0.400
0.600
0.800
1.000
Graph on Human Development Index
1991 2001
Population 1195723 1529954
Share of Madhya Pradesh Population 2.46% 2.53%
Urban Population 15.0% 15.5%
Population of Scheduled Castes (SC) 11.7% n.a.
Population of Scheduled Tribes (ST) 33.3% n.a.
Density of Population (per sq. kms.) 149 191
All 23.04 27.95
Rural n.a. 27.18
Urban n.a. 32.34
Decadal Growth (%) 1981-91 1991- 00 1991 1998-99
Per Capita Food Production (in kgs.) 207.58 197.41
1996 2000
FPS per lakh population 23.92 26
Food
W E S T - N I M A R
HDI Education Health Income
Demography
KHARGAON
W E S T- N I M A R

223
D I S T R I C T FA C T S H E E T S
1991 2001
Worker Participation Rate :
All 44.8% 46.0%
Rural 47.4% 48.7%
Urban 30.1% 31.4%
Share of Primary Sector (%) 83.5% n.a.
Share of Secondary Sector (%) 5.3% n.a.
Share of Tertiary Sector (%) 11.18% n.a.
Employment in Registered Industries (2000) 33150
Employment Rate of Growth (1991 to 2001) n.a. 31.6%
Total Employment in Farm Sector (%) 83.4% 81.5
Rural Employment in Non Farm Sector (%) 9.2% 10.9%
Agriculture Labour (%) 32.4% 34.9%
Employment
2001
Middle Schools per lakh population 27.0
High Schools per lakh population 9.0
Rural Population per Primary Health Centre 24388
Population Serviced Sub Health Centre 4352
2000
Road length per 100 sq. km. (1999) 25.8
Telephone per lakh population 1045
Population per Post Office (1994-95) 7364
Registered establishments under Factories Act (1997) 459
Per capita consumption of electricity (non industrial) in kwh 404.5
Infrastructure / Facilities
1991 2001
Life Expectancy of Females at Birth 55.1 59.5
Child Sex Ratio 954 968
Girl Child Mortality (birth to age 1 year) 124 n.a.
Girl Child Mortality (up to age 5 years) 156 n.a.
Total Fertility Rate 5.3 n.a.
Gender Ratio : All 941 948
Rural 946 953
Urban 909 924
General non SC/ ST Gender Ratio 925 n.a.
SC Gender Ratio 931 n.a.
ST Gender Ratio 970 n.a.
Workers Participation Rate - Female 37.1% 39.4%
2000
Female Enrolment Rate (Ages 6-14) 80.4%
Gender
Estimated Poverty Rate (1993-1994) 75.6%
Children as main workers (1991) 9.8%
Children as main and marginal workers (1991) 12.6%
Percentage of safe deliveries (1998-1999) 34.5
Percentage of children fully immunised (1998-1999) 31.8
Deprivation
1991 2001
Literacy (%) : All 41.2% 63.4%
Male 55.4% 75.2%
Female 26.1% 50.9%
Rural 36.2% 60.4%
Urban 68.5% 78.9%
Access to Education 2000
Enrolment Rate (Ages 6-14) 83.2%
Gross access ratio at primary level 100.0%
Habitations with Primary Schools 100.0%
Education
2000
Habitations with SDW facility 99.6%
Habitations without 40 lpd water availability 1.8%
Number of villages electrified 1142
Percentage of villages not connected with pucca roads 58.3
1991
Households without access to electricity, SDW and toilet facilities 20.51
Basic Amenities
1999
Per Capita Forest Area (in hectares) 0.136
Annual Rate of Afforestation (%) (1993-1999) -5.39
Major Non-Timber Forest Produce :
Tendu Leaves
Forests
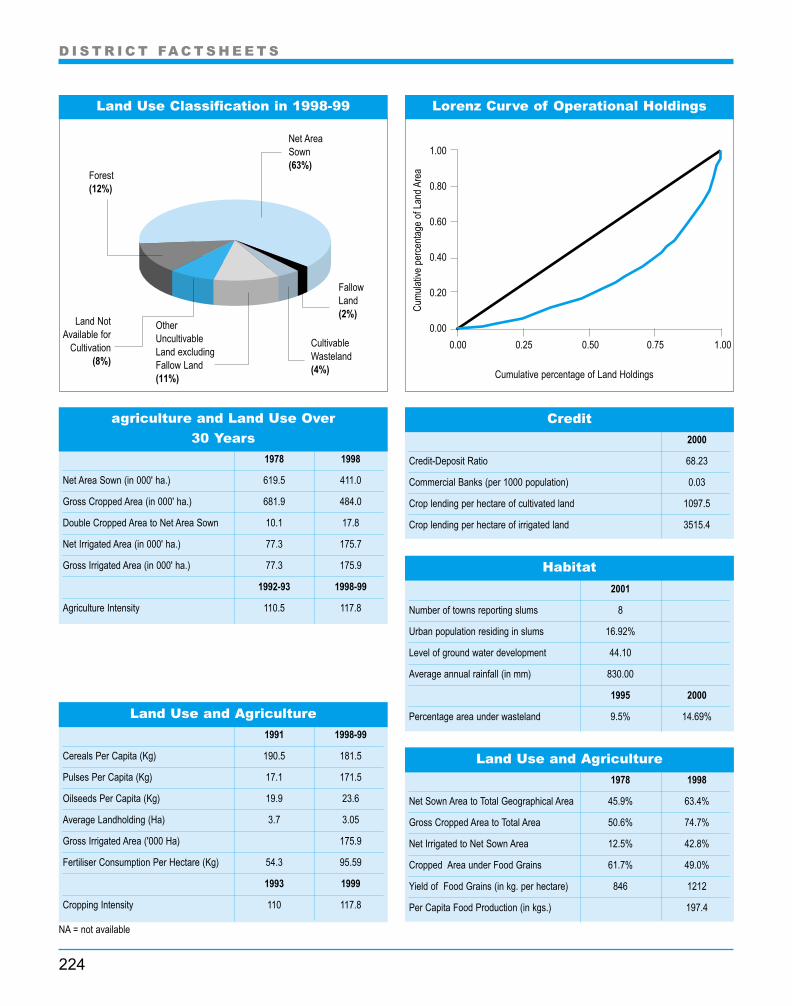
D I S T R I C T FA C T S H E E T S
224
Land Use Classification in 1998-99
1978 1998
Net Area Sown (in 000' ha.) 619.5 411.0
Gross Cropped Area (in 000' ha.) 681.9 484.0
Double Cropped Area to Net Area Sown 10.1 17.8
Net Irrigated Area (in 000' ha.) 77.3 175.7
Gross Irrigated Area (in 000' ha.) 77.3 175.9
1992-93 1998-99
Agriculture Intensity 110.5 117.8
agriculture and Land Use Over
30 Years
1978 1998
Net Sown Area to Total Geographical Area 45.9% 63.4%
Gross Cropped Area to Total Area 50.6% 74.7%
Net Irrigated to Net Sown Area 12.5% 42.8%
Cropped Area under Food Grains 61.7% 49.0%
Yield of Food Grains (in kg. per hectare) 846 1212
Per Capita Food Production (in kgs.) 197.4
Land Use and Agriculture
2000
Credit-Deposit Ratio 68.23
Commercial Banks (per 1000 population) 0.03
Crop lending per hectare of cultivated land 1097.5
Crop lending per hectare of irrigated land 3515.4
Credit
2001
Number of towns reporting slums 8
Urban population residing in slums 16.92%
Level of ground water development 44.10
Average annual rainfall (in mm) 830.00
1995 2000
Percentage area under wasteland 9.5% 14.69%
Habitat
1991 1998-99
Cereals Per Capita (Kg) 190.5 181.5
Pulses Per Capita (Kg) 17.1 171.5
Oilseeds Per Capita (Kg) 19.9 23.6
Average Landholding (Ha) 3.7 3.05
Gross Irrigated Area ('000 Ha) 175.9
Fertiliser Consumption Per Hectare (Kg) 54.3 95.59
1993 1999
Cropping Intensity 110 117.8
Land Use and Agriculture
Lorenz Curve of Operational Holdings
Cumulative percentage of Land Holdings
0.00 0.25 0.50 0.75 1.00
1.00
0.80
0.60
0.40
0.20
0.00
Cum
ulat
ive
perc
enta
ge o
f Lan
d Ar
ea
Net AreaSown(63%)
Fallow Land (2%)
CultivableWasteland(4%)
OtherUncultivableLand excludingFallow Land(11%)
Land NotAvailable for
Cultivation(8%)
Forest (12%)
NA = not available

225
D I S T R I C T FA C T S H E E T S
Name of Block Total Net Sown Gross Per capita Agriculture Net irrigated area to Irrigated area to Level of GW Status of
Cropped Area Cropped Net Sown Area Intensity Net Sown area total cropped area Development ground water
Khargone 528.42 71.2% 0.0% 0.43 0 30.42 27.01 59.100 White
Gogawan 436.63 76.7% 87.2% 0.47 114 29.86 26.26 50.265 White
Bhagwanpura 489.18 72.3% 80.1% 0.37 111 18.65 16.83 40.137 White
Segaon 356.97 71.6% 80.5% 0.43 112 23.44 20.85 33.807 White
Bhikangaon 930.15 62.7% 68.2% 0.52 109 19.68 18.09 35.483 White
Jhiranya 653.14 70.2% 74.8% 0.41 107 40.23 9.6 38.498 White
Maheshwar 786.44 56.5% 64.1% 0.33 113 39.82 35.21 47.952 White
Barwaha 1164.14 61.6% 70.4% 0.38 114 44.33 38.78 67.128 Grey
Kasrawad 1010.3 59.1% 68.1% 0.43 115 36.58 31.74 27.370 White
Name of Block SC ST Road length Villages connected by all Population serviced per
per 100 sq.kms. weatherroads post office (1993-' 94)
Khargone 14.64 13.56 45.8 81.72 2233
Gogawan 11.69 22.3 45.12 89.74 5468
Bhagwanpura 3.51 82.7 27.39 45 8035
Segaon 4.61 72.38 34.74 62.26 2758
Bhikangaon 7.97 42.22 28.6 32.03 4455
Jhiranya 4.44 77.55 17.76 32.81 11252
Maheshwar 20.01 25.26 38.48 49.12 5349
Barwaha 19.24 14.47 23.62 127.05 5837
Kasrawad 14.54 19.05 31.67 39.08 6994
Population in 1991 Infrastructure (in percentage) (1991)
Sexr ratio Agriculture Worker labourers in participation
Name of Tehsil Total Rural Urban Urbanisation Total Rural Urban Female All Child workers (%) ratio
Barwaha 300276 231184 69092 23.0% 71.2% 68.0% 81.4% 57.8% 934 941 36.98 45.30
Maheshwar 198015 167024 30991 15.7% 73.1% 72.0% 78.9% 61.2% 954 964 45.22 46.86
Kasrawad 204728 185693 19035 9.3% 69.6% 69.7% 68.4% 56.3% 933 964 41.13 46.99
Khargone 304811 200831 103980 34.1% 70.9% 66.8% 78.7% 57.8% 931 950 32.14 41.93
Bhikangaon 152883 138586 14297 9.4% 64.5% 62.7% 80.8% 51.6% 953 964 35.45 48.19
Segaon 68952 68952 - - 63.3% 63.3% 0.0% 51.6% 973 1000 24.25 50.25
Bhagwanpura 148625 148625 - - 36.4% 36.4% 0.0% 26.8% 983 1003 26.48 46.59
Jhiranya 151664 151664 - - 32.4% 32.4% 0.0% 21.4% 979 995 26.62 48.57
Population Literacy Select Gender EmploymentIndicators
Agriculture and Irrigation Status ofGround Water

D I S T R I C T FA C T S H E E T S
226
Human Development Index (HDI) 0.578
Rank in Madhya Pradesh : HDI 16
Gender Related Development Index (GDI) 0.563
Rank in Madhya Pradesh : GDI 19
Human Development Indices - 2002
Area (in sq. km) 5800
Total Inhabited Villages 1214
Total Habitations 3258
Forest Villages 40
Towns (Class I to IV) and Major Towns 5
Mandla
Crop Zone :
Rice Zone (in some parts)
Soil type :
Red and Yellow, Medium Black and Skeletal Medium/ Light
Agri Climatic Zone :
Northern Hills
Schedule V Areas :
Entire Mandla District
Basic Details on the District
1981 1991
Infant Mortality Rate 131 88
1991 2001
Life Expectancy (years) 58.1 62.6
1976-81 1984-90
Crude Birth Rate 31.7 36.5
Health
Janpad Panchayats 9
Gram Panchayats 423
Tehsils 4
Tribal Blocks 7
Legislative Assembly Seats 3
Administrative Information
0.5780.720
0.626
0.388
0.000
0.200
0.400
0.600
0.800
1.000
Graph on Human Development Index
1991 2001
Population 632781 893908
Share of Madhya Pradesh Population 1.30% 1.48%
Urban Population 12.0% 10.3%
Population of Scheduled Castes (SC) 5.4% n.a.
Population of Scheduled Tribes (ST) 54.8% n.a.
Density of Population (per sq. kms.) 134 154
All 24.17 14.66
Rural n.a. 13.96
Urban n.a. 21.15
Decadal Growth (%) 1981-91 1991- 00 1991 1998-99
Per Capita Food Production (in kgs.) 236.44 174.64
1996 2000
FPS per lakh population 34.70 39
Food
M A N D L A
HDI Education Health Income
Demography
MANDLA

227
D I S T R I C T FA C T S H E E T S
1991 2001
Worker Participation Rate :
All 49.9% 51.9%
Rural 52.7% 54.3%
Urban 29.5% 30.8%
Share of Primary Sector (%) 87.4% n.a.
Share of Secondary Sector (%) 3.5% n.a.
Share of Tertiary Sector (%) 9.12% n.a.
Employment in Registered Industries (2000) 2774
Employment Rate of Growth (1991 to 2001) n.a. 15.9%
Total Employment in Farm Sector (%) 87.4% 85.33
Rural Employment in Non Farm Sector (%) 7.6% 9.9%
Agriculture Labour (%) 27.1% 41.4%
Employment
2001
Middle Schools per lakh population 18.6
High Schools per lakh population 12.2
Rural Population per Primary Health Centre 28639
Population Serviced Sub Health Centre 3730
2000
Road length per 100 sq. km. (1999) 30.2
Telephone per lakh population 458
Population per Post Office (1994-95) 6560
Registered establishments under Factories Act (1997) 78
Per capita consumption of electricity (non industrial) in kwh 15.5
Infrastructure / Facilities
1991 2001
Life Expectancy of Females at Birth 58.7 63.7
Child Sex Ratio 978 985
Girl Child Mortality (birth to age 1 year) 104 n.a.
Girl Child Mortality (up to age 5 years) 129 n.a.
Total Fertility Rate 5.0 n.a.
Gender Ratio : All 990 1002
Rural 990 1008
Urban 935 949
General non SC/ ST Gender Ratio 950 n.a.
SC Gender Ratio 946 n.a.
ST Gender Ratio 1012 n.a.
Workers Participation Rate - Female 45.5% 48.2%
2000
Female Enrolment Rate (Ages 6-14) 91.7%
Gender
Estimated Poverty Rate (1993-1994) 53.7%
Children as main workers (1991) 8.5%
Children as main and marginal workers (1991) 10.3%
Percentage of safe deliveries (1998-1999) 17.6
Percentage of children fully immunised (1998-1999) 77.1
Deprivation
1991 2001
Literacy (%) : All 37.0% 59.8%
Male 50.5% 74.4%
Female 23.5% 45.4%
Rural 37.6% 56.7%
Urban 79.0% 85.8%
Access to Education 2000
Enrolment Rate (Ages 6-14) 94.3%
Gross access ratio at primary level 100.0%
Habitations with Primary Schools 100.0%
Education
2000
Habitations with SDW facility 98.7%
Habitations without 40 lpd water availability 5.4%
Number of villages electrified 1032
Percentage of villages not connected with pucca roads 71.9
1991
Households without access to electricity, SDW and toilet facilities 47.28
Basic Amenities
1999
Per Capita Forest Area (in hectares) 0.665
Annual Rate of Afforestation (%) (1993-1999) 1.31
Major Non-Timber Forest Produce :
Tendu Leaves, Baheda, Safed Musli, Achar Guthli, Nagarmotha, Harra, Bel, Aonla,Dhawai Flower, Imli, Mango Guthli, Charota Seeds, Vaividang, Kusum Seeds, KosaCotton, Bhilwa Seeds, Mahua Seeds, Karanj Seeds, Mahul Leaves
Forests

D I S T R I C T FA C T S H E E T S
228
Land Use Classification in 1998-99
1978 1998
Net Area Sown (in 000' ha.) 420.3 198.0
Gross Cropped Area (in 000' ha.) 517.9 262.3
Double Cropped Area to Net Area Sown 23.2 32.5
Net Irrigated Area (in 000' ha.) 3.6 13.6
Gross Irrigated Area (in 000' ha.) 3.6 14.8
1992-93 1998-99
Agriculture Intensity 119.7 132.5
agriculture and Land Use Over
30 Years
1978 1998
Net Sown Area to Total Geographical Area 31.7% 21.7%
Gross Cropped Area to Total Area 39.1% 28.7%
Net Irrigated to Net Sown Area 0.9% 6.9%
Cropped Area under Food Grains 83.4% 87.0%
Yield of Food Grains (in kg. per hectare) 176 666
Per Capita Food Production (in kgs.) 174.6
Land Use and Agriculture
2000
Credit-Deposit Ratio 44.16
Commercial Banks (per 1000 population) 0.04
Crop lending per hectare of cultivated land 950.7
Crop lending per hectare of irrigated land 43048.8
Credit
2001
Number of towns reporting slums 5
Urban population residing in slums 0.00%
Level of ground water development 2.31
Average annual rainfall (in mm) 1370.00
1995 2000
Percentage area under wasteland 10.8% 17.00%
Habitat
1991 1998-99
Cereals Per Capita (Kg) 208.5 156.7
Pulses Per Capita (Kg) 28.0 17.9
Oilseeds Per Capita (Kg) 37.6 16.6
Average Landholding (Ha) 2.7 2.35
Gross Irrigated Area ('000 Ha) 147.6
Fertiliser Consumption Per Hectare (Kg) 5.3 10.99
1993 1999
Cropping Intensity 120 132.5
Land Use and Agriculture
Lorenz Curve of Operational Holdings
Cumulative percentage of Land Holdings
0.00 0.25 0.50 0.75 1.00
1.00
0.80
0.60
0.40
0.20
0.00
Cum
ulat
ive
perc
enta
ge o
f Lan
d Ar
ea
Net AreaSown(22%)
Fallow Land (6%)
CultivableWasteland(2%)
OtherUncultivableLand excludingFallow Land(2%)
Land NotAvailable for
Cultivation(5%)
Forest (63%)
NA = not available

229
D I S T R I C T FA C T S H E E T S
Name of Block Total Net Sown Gross Per capita Agriculture Net irrigated area to Irrigated area to Level of GW Status of
Cropped Area Cropped Net Sown Area Intensity Net Sown area total cropped area Development ground water
Mandla 515.19 55.8% 58.2% 0.26 104 8.39 13.95 7.401 White
Mohgaon 327.91 54.7% 74.5% 0.32 136 0.12 0.25 9.722 White
Ghughri 654.77 42.5% 53.6% 0.41 126 0.32 0.46 0.157 White
Nainpur 671.39 55.2% 68.9% 0.37 125 13.85 12.81 3.587 White
Bichhiya 677.51 48.2% 63.6% 0.29 132 9.59 10.44 3.784 White
Mawai 534.21 53.0% 62.0% 0.46 117 0.07 0.06 0.321 White
Niwas 399.44 52.2% 63.9% 0.39 122 6.24 5.1 0.561 White
Narayanganj 395.38 45.5% 56.9% 0.3 125 2.89 2.31 0.586 White
Bijadandi 449.74 43.5% 59.8% 0.38 137 0.88 0.64 0.285 White
Name of Block SC ST Road length Villages connected by all Population serviced per
per 100 sq.kms. weatherroads post office (1993-' 94)
Mandla 4.47 48.36 47.75 57.31 4067
Mohgaon 3.76 64.1 20.01 24.14 9375
Ghughri 2.13 76.9 11.15 22.92 5603
Nainpur 6.23 54.44 26.96 22.36 7197
Bichhiya 7.51 52.81 23.32 20.83 6634
Mawai 1.52 74.24 22.09 17.48 4746
Niwas 7.82 62.39 29.29 23 6735
Narayanganj 2.73 70.67 27.82 15.5 6649
Bijadandi 1.63 82.8 13.56 19.57 6493
Population in 1991 Infrastructure (in percentage) (1991)
Sexr ratio Agriculture Worker labourers in participation
Name of Tehsil Total Rural Urban Urbanisation Total Rural Urban Female All Child workers (%) ratio
Niwas 195488 195488 - - 56.7% 56.7% 0.0% 41.7% 1011 992 45.14 55.13
Mandla 344386 274150 70236 20.4% 61.9% 55.4% 86.1% 48.0% 998 981 37.67 49.76
Nainpur 136207 114438 21769 16.0% 65.9% 62.0% 85.0% 52.2% 1002 971 46.60 47.61
Bichhiya 217827 217827 - - 55.7% 55.7% 0.0% 40.3% 1001 997 40.57 54.93
Population Literacy Select Gender EmploymentIndicators
Agriculture and Irrigation Status ofGround Water

D I S T R I C T FA C T S H E E T S
230
Human Development Index (HDI) 0.632
Rank in Madhya Pradesh : HDI 5
Gender Related Development Index (GDI) 0.622
Rank in Madhya Pradesh : GDI 4
Human Development Indices - 2002
Area (in sq. km) 5535
Total Inhabited Villages 899
Total Habitations 1187
Forest Villages 0
Towns (Class I to IV) and Major Towns 9
Mandsaur
Crop Zone :
Cotton Jowar
Soil type :
Medium Black (Medium)
Agri Climatic Zone :
Malwa Plateau
Schedule V Areas :
No Schedule V area
Basic Details on the District
1981 1991
Infant Mortality Rate 140 104
1991 2001
Life Expectancy (years) 54.5 58.5
1976-81 1984-90
Crude Birth Rate 36.2 33.5
Health
Janpad Panchayats 5
Gram Panchayats 423
Tehsils 5
Tribal Blocks 0
Legislative Assembly Seats 4
Administrative Information
0.6320.795
0.558 0.544
0.000
0.200
0.400
0.600
0.800
1.000
Graph on Human Development Index
1991 2001
Population 956869 1183369
Share of Madhya Pradesh Population 1.97% 1.96%
Urban Population 20.1% 18.6%
Population of Scheduled Castes (SC) 17.8% n.a.
Population of Scheduled Tribes (ST) 2.8% n.a.
Density of Population (per sq. kms.) 173 214
All 23.42 23.67
Rural n.a. 25.85
Urban n.a. 14.97
Decadal Growth (%) 1981-91 1991- 00 1991 1998-99
Per Capita Food Production (in kgs.) 397.76 321.65
1996 2000
FPS per lakh population 29.79 30
Food
M A N D S A U R
HDI Education Health Income
Demography
MANDSAUR

231
D I S T R I C T FA C T S H E E T S
1991 2001
Worker Participation Rate :
All 46.2% 48.2%
Rural 49.7% 51.4%
Urban 32.3% 34.6%
Share of Primary Sector (%) 81.5% n.a.
Share of Secondary Sector (%) 6.1% n.a.
Share of Tertiary Sector (%) 12.43% n.a.
Employment in Registered Industries (2000) 17655
Employment Rate of Growth (1991 to 2001) n.a. 29.1%
Total Employment in Farm Sector (%) 81.3% 80.1
Rural Employment in Non Farm Sector (%) 9.3% 11.4%
Agriculture Labour (%) 21.0% 28.7%
Employment
2001
Middle Schools per lakh population 39.0
High Schools per lakh population 9.7
Rural Population per Primary Health Centre 20929
Population Serviced Sub Health Centre 6292
2000
Road length per 100 sq. km. (1999) 19.5
Telephone per lakh population 1482
Population per Post Office (1994-95) 5290
Registered establishments under Factories Act (1997) 466
Per capita consumption of electricity (non industrial) in kwh 298.9
Infrastructure / Facilities
1991 2001
Life Expectancy of Females at Birth 54.2 57.9
Child Sex Ratio 949 946
Girl Child Mortality (birth to age 1 year) 112 n.a.
Girl Child Mortality (up to age 5 years) 153 n.a.
Total Fertility Rate 4.1 n.a.
Gender Ratio : All 947 956
Rural 950 960
Urban 933 942
General non SC/ ST Gender Ratio 949 n.a.
SC Gender Ratio 941 n.a.
ST Gender Ratio 921 n.a.
Workers Participation Rate - Female 37.6% 40.4%
2000
Female Enrolment Rate (Ages 6-14) 89.7%
Gender
Estimated Poverty Rate (1993-1994) 23.9%
Children as main workers (1991) 7.4%
Children as main and marginal workers (1991) 9.3%
Percentage of safe deliveries (1998-1999) 46.4
Percentage of children fully immunised (1998-1999) 40.4
Deprivation
1991 2001
Literacy (%) : All 47.7% 70.7%
Male 67.0% 85.8%
Female 27.2% 54.9%
Rural 41.7% 68.1%
Urban 71.0% 81.4%
Access to Education 2000
Enrolment Rate (Ages 6-14) 92.3%
Gross access ratio at primary level 100.0%
Habitations with Primary Schools 100.0%
Education
2000
Habitations with SDW facility 99.8%
Habitations without 40 lpd water availability 0.7%
Number of villages electrified 899
Percentage of villages not connected with pucca roads 63.7
1991
Households without access to electricity, SDW and toilet facilities 25.17
Basic Amenities
1999
Per Capita Forest Area (in hectares) 0.101
Annual Rate of Afforestation (%) (1993-1999) -1.24
Major Non-Timber Forest Produce :
—
Forests

D I S T R I C T FA C T S H E E T S
232
Land Use Classification in 1998-99
1978 1998
Net Area Sown (in 000' ha.) 512.6 350.9
Gross Cropped Area (in 000' ha.) 684.8 570.1
Double Cropped Area to Net Area Sown 33.6 62.5
Net Irrigated Area (in 000' ha.) 101.3 155.8
Gross Irrigated Area (in 000' ha.) 103.6 157.5
1992-93 1998-99
Agriculture Intensity 150.3 162.5
agriculture and Land Use Over
30 Years
1978 1998
Net Sown Area to Total Geographical Area 54.2% 63.6%
Gross Cropped Area to Total Area 72.4% 103.3%
Net Irrigated to Net Sown Area 19.8% 44.4%
Cropped Area under Food Grains 65.6% 41.5%
Yield of Food Grains (in kg. per hectare) 614 1543
Per Capita Food Production (in kgs.) 321.7
Land Use and Agriculture
2000
Credit-Deposit Ratio 55.41
Commercial Banks (per 1000 population) 0.04
Crop lending per hectare of cultivated land 1009.9
Crop lending per hectare of irrigated land 3239.1
Credit
2001
Number of towns reporting slums 9
Urban population residing in slums 9.53%
Level of ground water development 97.42
Average annual rainfall (in mm) 1012.00
1995 2000
Percentage area under wasteland 26.7% 28.79%
Habitat
1991 1998-99
Cereals Per Capita (Kg) 322.7 245.7
Pulses Per Capita (Kg) 75.0 75.9
Oilseeds Per Capita (Kg) 64.6 257.7
Average Landholding (Ha) 2.8 2.43
Gross Irrigated Area ('000 Ha) 157.3
Fertiliser Consumption Per Hectare (Kg) 65.9 56.47
1993 1999
Cropping Intensity 150 162.5
Land Use and Agriculture
Lorenz Curve of Operational Holdings
Cumulative percentage of Land Holdings
0.00 0.25 0.50 0.75 1.00
1.00
0.80
0.60
0.40
0.20
0.00
Cum
ulat
ive
perc
enta
ge o
f Lan
d Ar
ea
Net AreaSown(63%)
Fallow Land (0%)
CultivableWasteland(4%)
OtherUncultivableLand excludingFallow Land(7%)
Land NotAvailable for
Cultivation(19%)
Forest (7%)
NA = not available

233
D I S T R I C T FA C T S H E E T S
Name of Block Total Net Sown Gross Per capita Agriculture Net irrigated area to Irrigated area to Level of GW Status of
Cropped Area Cropped Net Sown Area Intensity Net Sown area total cropped area Development ground water
Mandsaur 1239.87 74.9% 119.6% 0.43 160 37.95 23.92 142.105 Over Exploited
Sitamau 1258.34 68.6% 96.5% 0.46 141 26.2 18.71 113.669 Over Exploited
Malhargarh 761.95 78.7% 113.0% 0.47 144 36.64 25.57 111.458 Over Exploited
Garoth 1100.8 71.9% 98.0% 0.53 136 28.97 21.74 62.147 White
Bhanpura 678.13 58.9% 79.6% 0.47 135 28.91 21.98 67.306 Grey
Name of Block SC ST Road length Villages connected by all Population serviced per
per 100 sq.kms. weatherroads post office (1993-' 94)
Mandsaur 18.4 5.17 20.57 43.18 3359
Sitamau 21.51 1.17 14.7 19.4 3563
Malhargarh 20.11 4.78 21.92 30.59 3190
Garoth 21.43 0.63 14.9 14.51 4137
Bhanpura 16.41 5.46 17.84 26.83 3384
Population in 1991 Infrastructure (in percentage) (1991)
Sexr ratio Agriculture Worker labourers in participation
Name of Tehsil Total Rural Urban Urbanisation Total Rural Urban Female All Child workers (%) ratio
Bhanpura 132731 116238 16493 12.4% 65.3% 63.0% 81.1% 48.2% 939 924 31.43 46.78
Malhargarh 185085 153954 31131 16.8% 75.2% 73.9% 81.8% 60.6% 970 952 29.09 50.52
Garoth 224005 187982 36023 16.1% 62.4% 59.3% 78.5% 43.0% 953 961 30.82 46.80
Mandsaur 396868 272771 124097 31.3% 73.7% 69.7% 82.1% 58.9% 954 941 24.09 44.74
Sitamau 244680 231791 12889 5.3% 72.5% 71.9% 82.6% 58.1% 961 946 31.58 54.27
Population Literacy Select Gender EmploymentIndicators
Agriculture and Irrigation Status ofGround Water

D I S T R I C T FA C T S H E E T S
234
Human Development Index (HDI) 0.520
Rank in Madhya Pradesh : HDI 32
Gender Related Development Index (GDI) 0.436
Rank in Madhya Pradesh : GDI 45
Human Development Indices - 2002
Area (in sq. km) 4989
Total Inhabited Villages 760
Total Habitations 4034
Forest Villages 0
Towns (Class I to IV) and Major Towns 6
Morena
Crop Zone :
Wheat Jowar
Soil type :
Alluvial (Light)
Agri Climatic Zone :
Gird Region
Schedule V Areas :
No Schedule V area
Basic Details on the District
1981 1991
Infant Mortality Rate 143 100
1991 2001
Life Expectancy (years) 55.3 57.4
1976-81 1984-90
Crude Birth Rate 40.6 41.2
Health
Janpad Panchayats 7
Gram Panchayats 475
Tehsils 6
Tribal Blocks 0
Legislative Assembly Seats 12
Administrative Information
0.520
0.766
0.540
0.255
0.000
0.200
0.400
0.600
0.800
1.000
Graph on Human Development Index
1991 2001
Population 1279094 1587264
Share of Madhya Pradesh Population 2.63% 2.63%
Urban Population 22.6% 21.6%
Population of Scheduled Castes (SC) 21.0% n.a.
Population of Scheduled Tribes (ST) 0.7% n.a.
Density of Population (per sq. kms.) 256 318
All 30.58 24.09
Rural n.a. 25.6
Urban n.a. 18.92
Decadal Growth (%) 1981-91 1991- 00 1991 1998-99
Per Capita Food Production (in kgs.) 229.75 252.86
1996 2000
FPS per lakh population 14.59 14
Food
M O R E N A
HDI Education Health Income
Demography
MORENA

235
D I S T R I C T FA C T S H E E T S
1991 2001
Worker Participation Rate :
All 28.7% 37.1%
Rural 29.9% 40.0%
Urban 24.8% 26.6%
Share of Primary Sector (%) 79.6% n.a.
Share of Secondary Sector (%) 5.5% n.a.
Share of Tertiary Sector (%) 14.93% n.a.
Employment in Registered Industries (2000) 12718
Employment Rate of Growth (1991 to 2001) n.a. 60.3%
Total Employment in Farm Sector (%) 79.2% 68.45
Rural Employment in Non Farm Sector (%) 8.9% 22.0%
Agriculture Labour (%) 6.4% 11.5%
Employment
2001
Middle Schools per lakh population 39.5
High Schools per lakh population 13.8
Rural Population per Primary Health Centre 65477
Population Serviced Sub Health Centre 6347
2000
Road length per 100 sq. km. (1999) 20.6
Telephone per lakh population 851
Population per Post Office (1994-95) 7453
Registered establishments under Factories Act (1997) 182
Per capita consumption of electricity (non industrial) in kwh 188.5
Infrastructure / Facilities
1991 2001
Life Expectancy of Females at Birth 53.0 53.2
Child Sex Ratio 857 829
Girl Child Mortality (birth to age 1 year) 116 n.a.
Girl Child Mortality (up to age 5 years) 163 n.a.
Total Fertility Rate 6.0 n.a.
Gender Ratio : All 808 822
Rural 806 816
Urban 814 842
General non SC/ ST Gender Ratio 809 n.a.
SC Gender Ratio 801 n.a.
ST Gender Ratio 898 n.a.
Workers Participation Rate - Female 7.4% 23.6%
2000
Female Enrolment Rate (Ages 6-14) 98.4%
Gender
Estimated Poverty Rate (1993-1994) 20.5%
Children as main workers (1991) 3.1%
Children as main and marginal workers (1991) 3.8%
Percentage of safe deliveries (1998-1999) 33
Percentage of children fully immunised (1998-1999) 18.6
Deprivation
1991 2001
Literacy (%) : All 45.9% 65.6%
Male 63.5% 81.0%
Female 23.8% 46.8%
Rural 41.1% 62.5%
Urban 62.1% 76.3%
Access to Education 2000
Enrolment Rate (Ages 6-14) 98.7%
Gross access ratio at primary level 100.0%
Habitations with Primary Schools 100.0%
Education
2000
Habitations with SDW facility 99.4%
Habitations without 40 lpd water availability 0.6%
Number of villages electrified 753
Percentage of villages not connected with pucca roads 43.9
1991
Households without access to electricity, SDW and toilet facilities 32.32
Basic Amenities
1999
Per Capita Forest Area (in hectares) 0.299
Annual Rate of Afforestation (%) (1993-1999) -0.19
Major Non-Timber Forest Produce :
Tendu Leaves, Khair
Forests

D I S T R I C T FA C T S H E E T S
236
Land Use Classification in 1998-99
1978 1998
Net Area Sown (in 000' ha.) 373.8 265.8
Gross Cropped Area (in 000' ha.) 419.0 320.3
Double Cropped Area to Net Area Sown 12.1 20.5
Net Irrigated Area (in 000' ha.) 162.8 156.2
Gross Irrigated Area (in 000' ha.) 166.2 158.4
1992-93 1998-99
Agriculture Intensity 111.0 120.5
agriculture and Land Use Over
30 Years
1978 1998
Net Sown Area to Total Geographical Area 32.0% 53.0%
Gross Cropped Area to Total Area 35.9% 63.8%
Net Irrigated to Net Sown Area 43.6% 58.7%
Cropped Area under Food Grains 75.1% 50.5%
Yield of Food Grains (in kg. per hectare) 1638 2376
Per Capita Food Production (in kgs.) 252.9
Land Use and Agriculture
2000
Credit-Deposit Ratio 63.6
Commercial Banks (per 1000 population) 0.03
Crop lending per hectare of cultivated land 1109.2
Crop lending per hectare of irrigated land 2458.3
Credit
2001
Number of towns reporting slums 6
Urban population residing in slums 35.14%
Level of ground water development 22.02
Average annual rainfall (in mm) 709.20
1995 2000
Percentage area under wasteland 23.3% 22.72%
Habitat
1991 1998-99
Cereals Per Capita (Kg) 205.7 239.0
Pulses Per Capita (Kg) 24.1 13.9
Oilseeds Per Capita (Kg) 162.1 114.5
Average Landholding (Ha) 1.9 1.77
Gross Irrigated Area ('000 Ha) 158.4
Fertiliser Consumption Per Hectare (Kg) 87.7 78.22
1993 1999
Cropping Intensity 111 120.5
Land Use and Agriculture
Lorenz Curve of Operational Holdings
Cumulative percentage of Land Holdings
0.00 0.25 0.50 0.75 1.00
1.00
0.80
0.60
0.40
0.20
0.00
Cum
ulat
ive
perc
enta
ge o
f Lan
d Ar
ea
Net AreaSown(52%)
Fallow Land (1%)
CultivableWasteland(4%)
OtherUncultivableLand excludingFallow Land(6%)
Land NotAvailable for
Cultivation(27%)
Forest (10%)
NA = not available

237
D I S T R I C T FA C T S H E E T S
Name of Block Total Net Sown Gross Per capita Agriculture Net irrigated area to Irrigated area to Level of GW Status of
Cropped Area Cropped Net Sown Area Intensity Net Sown area total cropped area Development ground water
Morena 958.44 71.7% 79.9% 0.34 111 51.95 47.73 21.469 White
Ambah 511.28 70.7% 85.2% 0.23 121 57.91 48.53 27.240 White
Porsa 536.69 65.3% 76.7% 0.24 117 60.3 51.56 20.130 White
Joura 665.86 57.2% 67.0% 0.24 117 59.32 52.05 29.613 White
Pahadgarh 917.34 32.9% 36.9% 0.27 112 63.3 56.52 13.773 White
Sabalgarh 753.76 39.5% 46.8% 0.26 118 65.75 56.39 14.848 White
Kailaras 251.22 106.6% 122.6% 0.25 115 78.21 68.95 28.312 White
Name of Block SC ST Road length Villages connected by all Population serviced per
per 100 sq.kms. weatherroads post office (1993-' 94)
Morena 20.11 0.29 24.62 25.14 3654
Ambah 23.97 0.02 25.62 52.05 3180
Porsa 21.81 0.01 20.7 43.06 3433
Joura 18.62 0.43 17.87 37.14 4587
Pahadgarh 19 2.7 11.45 24.39 5027
Sabalgarh 23.81 1.51 21.23 61.67 4904
Kailaras 19.09 1.71 14.77 26.67 5075
Population in 1991 Infrastructure (in percentage) (1991)
Sexr ratio Agriculture Worker labourers in participation
Name of Tehsil Total Rural Urban Urbanisation Total Rural Urban Female All Child workers (%) ratio
Ambah 220815 184372 36443 16.5% 71.9% 70.7% 78.2% 55.5% 828 788 10.95 36.33
Morena 474181 298069 176112 37.1% 67.6% 61.6% 77.3% 49.8% 805 808 10.99 33.53
Joura 356110 322631 33479 9.4% 59.7% 58.4% 71.8% 38.6% 807 846 14.65 38.50
Sabalgarh 181892 139754 42138 23.2% 63.6% 60.7% 73.2% 44.0% 846 857 10.27 37.70
Kailaras 154550 132620 21930 14.2% 58.8% 56.2% 73.9% 35.9% 834 855 10.24 43.70
Porsa 199716 166619 33097 16.6% 71.4% 69.8% 79.5% 55.4% 850 851 10.04 38.47
Population Literacy Select Gender EmploymentIndicators
Agriculture and Irrigation Status ofGround Water

D I S T R I C T FA C T S H E E T S
238
Human Development Index (HDI) 0.610
Rank in Madhya Pradesh : HDI 11
Gender Related Development Index (GDI) 0.588
Rank in Madhya Pradesh : GDI 10
Human Development Indices - 2002
Area (in sq. km) 5133
Total Inhabited Villages 1040
Total Habitations 1550
Forest Villages 12
Towns (Class I to IV) and Major Towns 5
Narsinghpur, Gaderwara
Crop Zone :
Wheat Zone
Soil type :
Deep Black (Deep)
Agri Climatic Zone :
Central Narmada Valley
Schedule V Areas :
No Schedule V area
Basic Details on the District
1981 1991
Infant Mortality Rate 151 110
1991 2001
Life Expectancy (years) 53.3 56.9
1976-81 1984-90
Crude Birth Rate 33.9 34.6
Health
Janpad Panchayats 6
Gram Panchayats 422
Tehsils 5
Tribal Blocks 0
Legislative Assembly Seats 4
Administrative Information
0.610
0.833
0.531 0.466
0.000
0.200
0.400
0.600
0.800
1.000
Graph on Human Development Index
1991 2001
Population 785496 957399
Share of Madhya Pradesh Population 1.62% 1.59%
Urban Population 14.9% 16.0%
Population of Scheduled Castes (SC) 16.6% n.a.
Population of Scheduled Tribes (ST) 12.9% n.a.
Density of Population (per sq. kms.) 153 187
All 20.76 21.88
Rural n.a. 20.28
Urban n.a. 31.09
Decadal Growth (%) 1981-91 1991- 00 1991 1998-99
Per Capita Food Production (in kgs.) 399.87 380.55
1996 2000
FPS per lakh population 31.61 30
Food
N A R S I M H A P U R
HDI Education Health Income
Demography
NARSIMHAPUR

239
D I S T R I C T FA C T S H E E T S
1991 2001
Worker Participation Rate :
All 39.6% 42.1%
Rural 41.4% 44.3%
Urban 29.2% 30.8%
Share of Primary Sector (%) 79.8% n.a.
Share of Secondary Sector (%) 6.7% n.a.
Share of Tertiary Sector (%) 13.49% n.a.
Employment in Registered Industries (2000) 2549
Employment Rate of Growth (1991 to 2001) n.a. 29.7%
Total Employment in Farm Sector (%) 79.7% 76.84
Rural Employment in Non Farm Sector (%) 12.0% 14.4%
Agriculture Labour (%) 38.9% 42.9%
Employment
2001
Middle Schools per lakh population 33.0
High Schools per lakh population 12.8
Rural Population per Primary Health Centre 42331
Population Serviced Sub Health Centre 5585
2000
Road length per 100 sq. km. (1999) 22.3
Telephone per lakh population 1207
Population per Post Office (1994-95) 4670
Registered establishments under Factories Act (1997) 134
Per capita consumption of electricity (non industrial) in kwh 365.3
Infrastructure / Facilities
1991 2001
Life Expectancy of Females at Birth 51.4 54.4
Child Sex Ratio 924 917
Girl Child Mortality (birth to age 1 year) 121 n.a.
Girl Child Mortality (up to age 5 years) 159 n.a.
Total Fertility Rate 4.6 n.a.
Gender Ratio : All 913 909
Rural 915 910
Urban 897 906
General non SC/ ST Gender Ratio 905 n.a.
SC Gender Ratio 909 n.a.
ST Gender Ratio 959 n.a.
Workers Participation Rate - Female 25.4% 29.0%
2000
Female Enrolment Rate (Ages 6-14) 91.9%
Gender
Estimated Poverty Rate (1993-1994) 22.8%
Children as main workers (1991) 4.1%
Children as main and marginal workers (1991) 5.4%
Percentage of safe deliveries (1998-1999) 27.8
Percentage of children fully immunised (1998-1999) 68.7
Deprivation
1991 2001
Literacy (%) : All 55.7% 78.3%
Male 68.4% 86.8%
Female 41.6% 69.0%
Rural 51.4% 77.1%
Urban 79.3% 84.9%
Access to Education 2000
Enrolment Rate (Ages 6-14) 93.0%
Gross access ratio at primary level 100.0%
Habitations with Primary Schools 100.0%
Education
2000
Habitations with SDW facility 99.7%
Habitations without 40 lpd water availability 0.3%
Number of villages electrified 1038
Percentage of villages not connected with pucca roads 67.1
1991
Households without access to electricity, SDW and toilet facilities 9.58
Basic Amenities
1999
Per Capita Forest Area (in hectares) 0.144
Annual Rate of Afforestation (%) (1993-1999) 1.21
Major Non-Timber Forest Produce :
Tendu Leaves
Forests

D I S T R I C T FA C T S H E E T S
240
Land Use Classification in 1998-99
1978 1998
Net Area Sown (in 000' ha.) 273.0 297.7
Gross Cropped Area (in 000' ha.) 286.2 413.0
Double Cropped Area to Net Area Sown 4.8 38.7
Net Irrigated Area (in 000' ha.) 21.5 157.9
Gross Irrigated Area (in 000' ha.) 21.5 157.9
1992-93 1998-99
Agriculture Intensity 126.5 138.7
agriculture and Land Use Over
30 Years
1978 1998
Net Sown Area to Total Geographical Area 53.2% 58.0%
Gross Cropped Area to Total Area 55.7% 80.4%
Net Irrigated to Net Sown Area 7.9% 53.0%
Cropped Area under Food Grains 91.2% 65.2%
Yield of Food Grains (in kg. per hectare) 951 1301
Per Capita Food Production (in kgs.) 380.6
Land Use and Agriculture
2000
Credit-Deposit Ratio 74.51
Commercial Banks (per 1000 population) 0.04
Crop lending per hectare of cultivated land 410.0
Crop lending per hectare of irrigated land 1113.7
Credit
2001
Number of towns reporting slums 5
Urban population residing in slums 0.00%
Level of ground water development 45.27
Average annual rainfall (in mm) 1105.20
1995 2000
Percentage area under wasteland 12.3% 19.08%
Habitat
1991 1998-99
Cereals Per Capita (Kg) 181.8 178.6
Pulses Per Capita (Kg) 218.1 201.9
Oilseeds Per Capita (Kg) 72.2 172.1
Average Landholding (Ha) 2.7 2.51
Gross Irrigated Area ('000 Ha) 157.9
Fertiliser Consumption Per Hectare (Kg) 38.8 33.19
1993 1999
Cropping Intensity 126 138.7
Land Use and Agriculture
Lorenz Curve of Operational Holdings
Cumulative percentage of Land Holdings
0.00 0.25 0.50 0.75 1.00
1.00
0.80
0.60
0.40
0.20
0.00
Cum
ulat
ive
perc
enta
ge o
f Lan
d Ar
ea
Net AreaSown(58%)
Fallow Land (2%)
CultivableWasteland(3%)
OtherUncultivableLand excludingFallow Land(5%)
Land NotAvailable for
Cultivation(5%)
Forest (27%)
NA = not available

241
D I S T R I C T FA C T S H E E T S
Name of Block Total Net Sown Gross Per capita Agriculture Net irrigated area to Irrigated area to Level of GW Status of
Cropped Area Cropped Net Sown Area Intensity Net Sown area total cropped area Development ground water
Narsinghpur 835.48 60.2% 79.5% 0.45 132 40.46 30.65 71.066 White
Gotegaon 804.99 71.4% 102.4% 0.45 143 46.4 32.38 59.252 White
Kareli 644.34 62.4% 80.2% 0.43 129 35.21 27.45 27.193 White
Saikheda 522.99 81.0% 103.1% 0.45 127 38.81 30.49 49.096 White
Babai Chichli 830.64 47.7% 66.3% 0.36 139 50.8 36.17 46.117 White
Chawarpatha 827.36 77.3% 91.4% 0.48 118 27.4 23.18 44.723 White
Name of Block SC ST Road length Villages connected by all Population serviced per
per 100 sq.kms. weatherroads post office (1993-' 94)
Narsinghpur 17.85 21.44 16.76 22.66 2519
Gotegaon 20.15 18.93 24.6 64.94 3836
Kareli 14.96 13.9 16.92 63.83 2422
Saikheda 15.7 5.19 4.78 8.82 3892
Babai Chichli 17.71 13.13 1.81 18.37 4397
Chawarpatha 15.75 10.25 10.52 72.68 2930
Population in 1991 Infrastructure (in percentage) (1991)
Sexr ratio Agriculture Worker labourers in participation
Name of Tehsil Total Rural Urban Urbanisation Total Rural Urban Female All Child workers (%) ratio
Gadarwara 368315 319895 48420 13.1% 75.0% 74.0% 81.2% 65.1% 899 904 43.45 40.80
Narsinghpur 192030 135799 56231 29.3% 82.4% 80.1% 87.7% 74.2% 921 920 37.52 42.19
Gotegaon 173985 150568 23417 13.5% 78.0% 76.5% 87.0% 67.7% 921 940 46.10 44.57
Kareli 138370 113335 25035 18.1% 79.8% 79.0% 83.5% 70.9% 906 906 44.11 41.72
Tendukhera 84699 84699 - - 81.8% 81.8% 0.0% 73.5% 911 943 43.94 43.29
Population Literacy Select Gender EmploymentIndicators
Agriculture and Irrigation Status ofGround Water

D I S T R I C T FA C T S H E E T S
242
Human Development Index (HDI) 0.626
Rank in Madhya Pradesh : HDI 7
Gender Related Development Index (GDI) 0.591
Rank in Madhya Pradesh : GDI 8
Human Development Indices - 2002
Area (in sq. km) 4256
Total Inhabited Villages 676
Total Habitations 808
Forest Villages 28
Towns (Class I to IV) and Major Towns 8
Neemuch
Crop Zone :
Cotton Jowar
Soil type :
Medium Black (Medium)
Agri Climatic Zone :
Malwa Plateau
Schedule V Areas :
No Schedule V area
Basic Details on the District
1981 1991
Infant Mortality Rate n.a. n.a.
1991 2001
Life Expectancy (years) 54.5 58.5
1976-81 1984-90
Crude Birth Rate n.a. n.a.
Health
Janpad Panchayats 3
Gram Panchayats 214
Tehsils 3
Tribal Blocks 0
Legislative Assembly Seats 4
Administrative Information
0.6260.751
0.558 0.570
0.000
0.200
0.400
0.600
0.800
1.000
Graph on Human Development Index
1991 2001
Population 598339 725457
Share of Madhya Pradesh Population 1.23% 1.20%
Urban Population 28.0% 27.9%
Population of Scheduled Castes (SC) 12.8% n.a.
Population of Scheduled Tribes (ST) 7.9% n.a.
Density of Population (per sq. kms.) 141 170
All 22.58 21.25
Rural n.a. 21.4
Urban n.a. 20.85
Decadal Growth (%) 1981-91 1991- 00 1991 1998-99
Per Capita Food Production (in kgs.) 397.76 295.40
1996 2000
FPS per lakh population n.a. 27
Food
N E E M U C H
HDI Education Health Income
Demography
NEEMUCH

243
D I S T R I C T FA C T S H E E T S
1991 2001
Worker Participation Rate :
All 47.1% 48.0%
Rural 52.8% 53.6%
Urban 32.5% 33.6%
Share of Primary Sector (%) 78.5% n.a.
Share of Secondary Sector (%) 7.1% n.a.
Share of Tertiary Sector (%) 14.45% n.a.
Employment in Registered Industries (2000) n.a.
Employment Rate of Growth (1991 to 2001) n.a. 23.5%
Total Employment in Farm Sector (%) 78.1% 75.36
Rural Employment in Non Farm Sector (%) 9.5% 12.1%
Agriculture Labour (%) 17.2% 24.6%
Employment
2001
Middle Schools per lakh population 38.5
High Schools per lakh population 12.1
Rural Population per Primary Health Centre 29067
Population Serviced Sub Health Centre 4983
2000
Road length per 100 sq. km. (1999) 16.2
Telephone per lakh population 2620
Population per Post Office (1994-95) n.a.
Registered establishments under Factories Act (1997) n.a.
Per capita consumption of electricity (non industrial) in kwh 276.6
Infrastructure / Facilities
1991 2001
Life Expectancy of Females at Birth 54.2 56.9
Child Sex Ratio 948 928
Girl Child Mortality (birth to age 1 year) n.a. n.a.
Girl Child Mortality (up to age 5 years) n.a. n.a.
Total Fertility Rate n.a. n.a.
Gender Ratio : All 943 950
Rural 952 960
Urban 922 925
General non SC/ ST Gender Ratio 943 n.a.
SC Gender Ratio 950 n.a.
ST Gender Ratio 930 n.a.
Workers Participation Rate - Female 39.4% 40.1%
2000
Female Enrolment Rate (Ages 6-14) 91.0%
Gender
Estimated Poverty Rate (1993-1994) n.a.
Children as main workers (1991) n.a.
Children as main and marginal workers (1991) n.a.
Percentage of safe deliveries (1998-1999) n.a.
Percentage of children fully immunised (1998-1999) n.a.
Deprivation
1991 2001
Literacy (%) : All 50.3% 66.5%
Male 69.3% 83.0%
Female 30.0% 49.1%
Rural 42.2% 61.5%
Urban 70.6% 79.0%
Access to Education 2000
Enrolment Rate (Ages 6-14) 92.5%
Gross access ratio at primary level 100.0%
Habitations with Primary Schools 100.0%
Education
2000
Habitations with SDW facility 100.0%
Habitations without 40 lpd water availability 0.0%
Number of villages electrified 674
Percentage of villages not connected with pucca roads 63.7
1991
Households without access to electricity, SDW and toilet facilities n.a.
Basic Amenities
1999
Per Capita Forest Area (in hectares) n.a.
Annual Rate of Afforestation (%) (1993-1999) n.a.
Major Non-Timber Forest Produce :
Tendu Leaves
Forests

D I S T R I C T FA C T S H E E T S
244
Land Use Classification in 1998-99
1978 1998
Net Area Sown (in 000' ha.) n.a. 188.6
Gross Cropped Area (in 000' ha.) n.a. 305.5
Double Cropped Area to Net Area Sown n.a. 62.0
Net Irrigated Area (in 000' ha.) n.a. 73.1
Gross Irrigated Area (in 000' ha.) n.a. 73.3
1992-93 1998-99
Agriculture Intensity n.a. 162.0
agriculture and Land Use Over
30 Years
1978 1998
Net Sown Area to Total Geographical Area Included in Mandsaur 47.9%
Gross Cropped Area to Total Area n.a. 77.5%
Net Irrigated to Net Sown Area n.a. 38.7%
Cropped Area under Food Grains n.a. 42.4%
Yield of Food Grains (in kg. per hectare) n.a. 1592
Per Capita Food Production (in kgs.) 295.4
Land Use and Agriculture
2000
Credit-Deposit Ratio 34.49
Commercial Banks (per 1000 population) 0.05
Crop lending per hectare of cultivated land n.a.
Crop lending per hectare of irrigated land n.a.
Credit
2001
Number of towns reporting slums 8
Urban population residing in slums 11.59%
Level of ground water development 71.49
Average annual rainfall (in mm) 823.00
1995 2000
Percentage area under wasteland n.a. n.a.
Habitat
1991 1998-99
Cereals Per Capita (Kg) n.a. 205.6
Pulses Per Capita (Kg) n.a. 89.8
Oilseeds Per Capita (Kg) n.a. 160.2
Average Landholding (Ha) n.a. n.a.
Gross Irrigated Area ('000 Ha) 73.3
Fertiliser Consumption Per Hectare (Kg) n.a. 75.03
1993 1999
Cropping Intensity n.a. 162.0
Land Use and Agriculture
Lorenz Curve of Operational Holdings
Cumulative percentage of Land Holdings
0.00 0.25 0.50 0.75 1.00
1.00
0.80
0.60
0.40
0.20
0.00
Cum
ulat
ive
perc
enta
ge o
f Lan
d Ar
ea
Net AreaSown(48%)
Fallow Land (0%)
CultivableWasteland(4%)Other
UncultivableLand excludingFallow Land(5%)
Land NotAvailable for
Cultivation(26%)
Forest (11%)
NA = not available

245
D I S T R I C T FA C T S H E E T S
Name of Block Total Net Sown Gross Per capita Agriculture Net irrigated area to Irrigated area to Level of GW Status of
Cropped Area Cropped Net Sown Area Intensity Net Sown area total cropped area Development ground water
Neemuch 798.31 75.2% 110.7% 0.49 147 37.7 25.67 159.890 Over Exploited
Jawad 1441.72 40.4% 59.8% 0.39 148 46.81 31.95 46.575 White
Manasa 1396.02 51.8% 75.8% 0.45 146 34.77 23.81 67.669 Grey
Name of Block SC ST Road length Villages connected by all Population serviced per
per 100 sq.kms. weatherroads post office (1993-' 94)
Neemuch 14.47 6.97 25.55 18.42 3144
Jawad 11.55 15.02 18.8 28.36 4019
Manasa 13.12 7.63 16.69 43.58 3470
Population in 1991 Infrastructure (in percentage) (1991)
Sexr ratio Agriculture Worker labourers in participation
Name of Tehsil Total Rural Urban Urbanisation Total Rural Urban Female All Child workers (%) ratio
Neemuch 271742 148532 123210 45.3% 71.7% 64.2% 80.5% 56.4% 940 935 22.64 41.99
Jawad 218390 179730 38660 17.7% 64.2% 61.5% 76.5% 46.3% 955 914 20.25 52.14
Manasa 235325 194942 40383 17.2% 62.4% 59.3% 76.9% 43.3% 958 934 30.48 51.09
Population Literacy Select Gender EmploymentIndicators
Agriculture and Irrigation Status ofGround Water

D I S T R I C T FA C T S H E E T S
246
Human Development Index (HDI) 0.470
Rank in Madhya Pradesh : HDI 41
Gender Related Development Index (GDI) 0.462
Rank in Madhya Pradesh : GDI 42
Human Development Indices - 2002
Area (in sq. km) 7135
Total Inhabited Villages 939
Total Habitations 1339
Forest Villages 0
Towns (Class I to IV) and Major Towns 6
Panna
Crop Zone :
Wheat Rice Zone (in some parts), Wheat Jowar (in some parts)
Soil type :
Mixed Red and Black Soils (Medium)
Agri Climatic Zone :
Chhattisgarh Plains (in some parts), Kymore Plateau and Satpura Hills (in some
parts) , Bundelkhand Region (in some parts)
Schedule V Areas :
No Schedule V area
Basic Details on the District
1981 1991
Infant Mortality Rate 175 133
1991 2001
Life Expectancy (years) 48.5 53.0
1976-81 1984-90
Crude Birth Rate 39.4 42.2
Health
Janpad Panchayats 5
Gram Panchayats 378
Tehsils 5
Tribal Blocks 0
Legislative Assembly Seats 3
Administrative Information
0.470
0.700
0.466
0.243
0.000
0.200
0.400
0.600
0.800
1.000
Graph on Human Development Index
1991 2001
Population 687945 854235
Share of Madhya Pradesh Population 1.42% 1.41%
Urban Population 13.0% 12.7%
Population of Scheduled Castes (SC) 20.4% n.a.
Population of Scheduled Tribes (ST) 14.9% n.a.
Density of Population (per sq. kms.) 96 120
All 27.40 24.17
Rural n.a. 24.69
Urban n.a. 20.74
Decadal Growth (%) 1981-91 1991- 00 1991 1998-99
Per Capita Food Production (in kgs.) 278.80 237.40
1996 2000
FPS per lakh population 40.68 38
Food
P A N N A
HDI Education Health Income
Demography
PANNA

247
D I S T R I C T FA C T S H E E T S
1991 2001
Worker Participation Rate :
All 41.6% 43.5%
Rural 43.2% 45.5%
Urban 30.7% 29.7%
Share of Primary Sector (%) 86.3% n.a.
Share of Secondary Sector (%) 4.4% n.a.
Share of Tertiary Sector (%) 9.28% n.a.
Employment in Registered Industries (2000) 1427
Employment Rate of Growth (1991 to 2001) n.a. 29.9%
Total Employment in Farm Sector (%) 84.4% 78.94
Rural Employment in Non Farm Sector (%) 10.1% 15.8%
Agriculture Labour (%) 27.0% 31.0%
Employment
2001
Middle Schools per lakh population 39.7
High Schools per lakh population 9.0
Rural Population per Primary Health Centre 49739
Population Serviced Sub Health Centre 5329
2000
Road length per 100 sq. km. (1999) 16.2
Telephone per lakh population 533
Population per Post Office (1994-95) 4955
Registered establishments under Factories Act (1997) 25
Per capita consumption of electricity (non industrial) in kwh 49.4
Infrastructure / Facilities
1991 2001
Life Expectancy of Females at Birth 46.6 50.0
Child Sex Ratio 948 931
Girl Child Mortality (birth to age 1 year) 129 n.a.
Girl Child Mortality (up to age 5 years) 207 n.a.
Total Fertility Rate 5.9 n.a.
Gender Ratio : All 897 907
Rural 901 910
Urban 869 886
General non SC/ ST Gender Ratio 888 n.a.
SC Gender Ratio 887 n.a.
ST Gender Ratio 948 n.a.
Workers Participation Rate - Female 28.7% 34.8%
2000
Female Enrolment Rate (Ages 6-14) 83.7%
Gender
Estimated Poverty Rate (1993-1994) 23.8%
Children as main workers (1991) 5.6%
Children as main and marginal workers (1991) 7.9%
Percentage of safe deliveries (1998-1999) 13.5
Percentage of children fully immunised (1998-1999) 10.7
Deprivation
1991 2001
Literacy (%) : All 33.7% 61.6%
Male 46.3% 74.0%
Female 19.4% 47.8%
Rural 29.3% 59.2%
Urban 62.3% 77.7%
Access to Education 2000
Enrolment Rate (Ages 6-14) 86.8%
Gross access ratio at primary level 100.0%
Habitations with Primary Schools 100.0%
Education
2000
Habitations with SDW facility 98.8%
Habitations without 40 lpd water availability 1.2%
Number of villages electrified 921
Percentage of villages not connected with pucca roads 65.0
1991
Households without access to electricity, SDW and toilet facilities 59.63
Basic Amenities
1999
Per Capita Forest Area (in hectares) 0.332
Annual Rate of Afforestation (%) (1993-1999) -1.31
Major Non-Timber Forest Produce :
Tendu Leaves, Harra, Aonla, Achar Guthli
Forests

D I S T R I C T FA C T S H E E T S
248
Land Use Classification in 1998-99
1978 1998
Net Area Sown (in 000' ha.) 212.7 243.2
Gross Cropped Area (in 000' ha.) 243.1 284.0
Double Cropped Area to Net Area Sown 14.3 16.8
Net Irrigated Area (in 000' ha.) 14.2 50.3
Gross Irrigated Area (in 000' ha.) 15.8 50.3
1992-93 1998-99
Agriculture Intensity 112.8 116.8
agriculture and Land Use Over
30 Years
1978 1998
Net Sown Area to Total Geographical Area 30.3% 34.6%
Gross Cropped Area to Total Area 34.6% 40.4%
Net Irrigated to Net Sown Area 6.7% 20.7%
Cropped Area under Food Grains 83.8% 88.9%
Yield of Food Grains (in kg. per hectare) 598 769
Per Capita Food Production (in kgs.) 237.4
Land Use and Agriculture
2000
Credit-Deposit Ratio 43.87
Commercial Banks (per 1000 population) 0.02
Crop lending per hectare of cultivated land 650.8
Crop lending per hectare of irrigated land 4221.2
Credit
2001
Number of towns reporting slums 6
Urban population residing in slums 0.00%
Level of ground water development 19.61
Average annual rainfall (in mm) 1213.00
1995 2000
Percentage area under wasteland 8.2% 17.91%
Habitat
1991 1998-99
Cereals Per Capita (Kg) 219.1 163.9
Pulses Per Capita (Kg) 59.7 2.7
Oilseeds Per Capita (Kg) 14.1 13.1
Average Landholding (Ha) 2.4 2.03
Gross Irrigated Area ('000 Ha) 50.3
Fertiliser Consumption Per Hectare (Kg) 21.3 26.18
1993 1999
Cropping Intensity 113 116.8
Land Use and Agriculture
Lorenz Curve of Operational Holdings
Cumulative percentage of Land Holdings
0.00 0.25 0.50 0.75 1.00
1.00
0.80
0.60
0.40
0.20
0.00
Cum
ulat
ive
perc
enta
ge o
f Lan
d Ar
ea
Net AreaSown(34%)
Fallow Land (4%)
CultivableWasteland(9%)
OtherUncultivableLand excludingFallow Land(2%)
Land NotAvailable for
Cultivation(9%)
Forest (42%)
NA = not available

249
D I S T R I C T FA C T S H E E T S
Name of Block Total Net Sown Gross Per capita Agriculture Net irrigated area to Irrigated area to Level of GW Status of
Cropped Area Cropped Net Sown Area Intensity Net Sown area total cropped area Development ground water
Panna 1350.47 29.0% 33.8% 0.35 117 27.7 23.77 12.675 White
Gunnor 967.58 65.6% 66.5% 0.48 101 7.86 7.75 7.544 White
Pawai 1277.82 44.0% 49.9% 0.44 113 9.95 8.78 6.556 White
Shahnagar 1646.82 25.9% 31.3% 0.34 121 12.56 10.4 8.585 White
Ajaigarh 603.2 54.9% 62.6% 0.32 114 32.21 28.27 97.515 Dark
Name of Block SC ST Road length Villages connected by all Population serviced per
per 100 sq.kms. weatherroads post office (1993-' 94)
Panna 19.88 21.69 21.99 29.47 2626
Gunnor 24.19 9.07 24.49 10.76 4747
Pawai 22.76 13.88 11.11 19.4 4245
Shahnagar 16.85 28.68 9.11 14.02 4589
Ajaigarh 20.73 8.56 23.38 36.13 4517
Population in 1991 Infrastructure (in percentage) (1991)
Sexr ratio Agriculture Worker labourers in participation
Name of Tehsil Total Rural Urban Urbanisation Total Rural Urban Female All Child workers (%) ratio
Ajaigarh 145418 131439 13979 9.6% 55.3% 53.6% 70.0% 39.7% 874 879 21.62 44.99
Panna 213257 142709 70548 33.1% 62.5% 52.6% 81.3% 50.1% 896 931 26.97 38.26
Pawai 165952 153949 12003 7.2% 60.1% 59.3% 69.9% 46.1% 897 945 34.53 45.06
Gunnor 178953 167339 11614 6.5% 63.6% 63.0% 72.3% 50.4% 914 947 35.17 46.66
Shahnagar 150655 150655 - - 65.7% 65.7% 0.0% 51.1% 959 954 35.93 44.07
Population Literacy Select Gender EmploymentIndicators
Agriculture and Irrigation Status ofGround Water

D I S T R I C T FA C T S H E E T S
250
Human Development Index (HDI) 0.645
Rank in Madhya Pradesh : HDI 3
Gender Related Development Index (GDI) 0.584
Rank in Madhya Pradesh : GDI 12
Human Development Indices - 2002
Area (in sq. km) 8466
Total Inhabited Villages 1429
Total Habitations 1925
Forest Villages 31
Towns (Class I to IV) and Major Towns 9
Mandideep
Crop Zone :
Wheat Zone
Soil type :
Medium Black and Deep Black (Medium/ Heavy)
Agri Climatic Zone :
Vindhya Plateau
Schedule V Areas :
No Schedule V area
Basic Details on the District
1981 1991
Infant Mortality Rate 152 124
1991 2001
Life Expectancy (years) 51.5 55.3
1976-81 1984-90
Crude Birth Rate 39.6 39.1
Health
Janpad Panchayats 7
Gram Panchayats 501
Tehsils 7
Tribal Blocks 0
Legislative Assembly Seats 4
Administrative Information
0.6450.797
0.5050.632
0.000
0.200
0.400
0.600
0.800
1.000
Graph on Human Development Index
1991 2001
Population 876461 1120159
Share of Madhya Pradesh Population 1.80% 1.86%
Urban Population 15.7% 18.5%
Population of Scheduled Castes (SC) 16.6% n.a.
Population of Scheduled Tribes (ST) 14.4% n.a.
Density of Population (per sq. kms.) 104 132
All 23.35 27.80
Rural n.a. 23.65
Urban n.a. 50.08
Decadal Growth (%) 1981-91 1991- 00 1991 1998-99
Per Capita Food Production (in kgs.) 439.61 418.37
1996 2000
FPS per lakh population 39.86 38
Food
R A I S E N
HDI Education Health Income
Demography
RAISEN

251
D I S T R I C T FA C T S H E E T S
1991 2001
Worker Participation Rate :
All 37.4% 36.6%
Rural 38.7% 38.1%
Urban 30.0% 29.7%
Share of Primary Sector (%) 78.6% n.a.
Share of Secondary Sector (%) 9.0% n.a.
Share of Tertiary Sector (%) 12.34% n.a.
Employment in Registered Industries (2000) 24295
Employment Rate of Growth (1991 to 2001) n.a. 25.1%
Total Employment in Farm Sector (%) 78.1% 72
Rural Employment in Non Farm Sector (%) 13.7% 18.1%
Agriculture Labour (%) 37.6% 37.9%
Employment
2001
Middle Schools per lakh population 33.0
High Schools per lakh population 11.2
Rural Population per Primary Health Centre 39710
Population Serviced Sub Health Centre 5219
2000
Road length per 100 sq. km. (1999) 11.2
Telephone per lakh population 938
Population per Post Office (1994-95) 4719
Registered establishments under Factories Act (1997) 172
Per capita consumption of electricity (non industrial) in kwh 131.8
Infrastructure / Facilities
1991 2001
Life Expectancy of Females at Birth 52.4 57.2
Child Sex Ratio 928 943
Girl Child Mortality (birth to age 1 year) 159 n.a.
Girl Child Mortality (up to age 5 years) 170 n.a.
Total Fertility Rate 5.3 n.a.
Gender Ratio : All 879 880
Rural 884 884
Urban 855 864
General non SC/ ST Gender Ratio 873 n.a.
SC Gender Ratio 867 n.a.
ST Gender Ratio 927 n.a.
Workers Participation Rate - Female 22.0% 21.8%
2000
Female Enrolment Rate (Ages 6-14) 91.7%
Gender
Estimated Poverty Rate (1993-1994) 34.1%
Children as main workers (1991) 3.6%
Children as main and marginal workers (1991) 4.9%
Percentage of safe deliveries (1998-1999) 29.4
Percentage of children fully immunised (1998-1999) 70.6
Deprivation
1991 2001
Literacy (%) : All 40.8% 72.8%
Male 54.0% 82.2%
Female 25.5% 61.9%
Rural 36.1% 71.5%
Urban 65.1% 78.3%
Access to Education 2000
Enrolment Rate (Ages 6-14) 93.5%
Gross access ratio at primary level 100.0%
Habitations with Primary Schools 100.0%
Education
2000
Habitations with SDW facility 99.8%
Habitations without 40 lpd water availability 0.5%
Number of villages electrified 1349
Percentage of villages not connected with pucca roads 74.7
1991
Households without access to electricity, SDW and toilet facilities 26.72
Basic Amenities
1999
Per Capita Forest Area (in hectares) 0.251
Annual Rate of Afforestation (%) (1993-1999) 0.84
Major Non-Timber Forest Produce :
Tendu Leaves
Forests

D I S T R I C T FA C T S H E E T S
252
Land Use Classification in 1998-99
1978 1998
Net Area Sown (in 000' ha.) 402.8 426.2
Gross Cropped Area (in 000' ha.) 407.5 551.4
Double Cropped Area to Net Area Sown 1.2 29.4
Net Irrigated Area (in 000' ha.) 15.7 147.7
Gross Irrigated Area (in 000' ha.) 15.7 147.7
1992-93 1998-99
Agriculture Intensity 121.9 129.4
agriculture and Land Use Over
30 Years
1978 1998
Net Sown Area to Total Geographical Area 47.5% 50.2%
Gross Cropped Area to Total Area 48.0% 65.0%
Net Irrigated to Net Sown Area 3.9% 34.7%
Cropped Area under Food Grains 84.4% 70.8%
Yield of Food Grains (in kg. per hectare) 722 1143
Per Capita Food Production (in kgs.) 418.4
Land Use and Agriculture
2000
Credit-Deposit Ratio 82.91
Commercial Banks (per 1000 population) 0.02
Crop lending per hectare of cultivated land 612.5
Crop lending per hectare of irrigated land 2459.3
Credit
2001
Number of towns reporting slums 9
Urban population residing in slums 0.00%
Level of ground water development 34.38
Average annual rainfall (in mm) 1330.40
1995 2000
Percentage area under wasteland 8.0% 9.86%
Habitat
1991 1998-99
Cereals Per Capita (Kg) 286.9 237.1
Pulses Per Capita (Kg) 152.7 56.4
Oilseeds Per Capita (Kg) 103.4 147.0
Average Landholding (Ha) 4.1 3.57
Gross Irrigated Area ('000 Ha) 147.7
Fertiliser Consumption Per Hectare (Kg) 28.0 36.63
1993 1999
Cropping Intensity 122 129.4
Land Use and Agriculture
Lorenz Curve of Operational Holdings
Cumulative percentage of Land Holdings
0.00 0.25 0.50 0.75 1.00
1.00
0.80
0.60
0.40
0.20
0.00
Cum
ulat
ive
perc
enta
ge o
f Lan
d Ar
ea
Net AreaSown(51%)
Fallow Land (0%)
CultivableWasteland(2%)
OtherUncultivableLand excludingFallow Land(3%)
Land NotAvailable for
Cultivation(5%)
Forest (39%)
NA = not available

253
D I S T R I C T FA C T S H E E T S
Name of Block Total Net Sown Gross Per capita Agriculture Net irrigated area to Irrigated area to Level of GW Status of
Cropped Area Cropped Net Sown Area Intensity Net Sown area total cropped area Development ground water
Sanchi 751.72 81.3% 111.9% 0.51 138 37.65 27.36 30.270 White
Obedullaganj 1527.57 35.7% 47.4% 0.51 133 34.79 26.23 44.267 White
Begamganj 874.05 63.1% 70.9% 0.69 112 13.04 11.62 51.133 White
Gairatganj 825.14 60.3% 70.0% 0.65 116 13.63 11.73 52.185 White
Silwani 1067.13 48.7% 57.7% 0.52 118 20.54 17.34 44.907 White
Baraily 1229.28 71.5% 97.2% 0.51 136 47.26 34.74 26.353 White
Udaipura 681.18 89.2% 96.8% 0.58 108 13.36 12.31 28.599 White
Name of Block SC ST Road length Villages connected by all Population serviced per
per 100 sq.kms. weatherroads post office (1993-' 94)
Sanchi 19.95 11.46 25.67 0.27 2512
Obedullaganj 13.02 28.99 12.57 19.28 3533
Begamganj 19.07 10.51 6.86 8.25 2674
Gairatganj 20.75 11.73 8.6 16.36 5072
Silwani 11.81 33.64 9.46 8.13 7663
Baraily 20.39 8.57 13.42 22.62 3015
Udaipura 17.32 10.56 11.3 15.48 2924
Population in 1991 Infrastructure (in percentage) (1991)
Sexr ratio Agriculture Worker labourers in participation
Name of Tehsil Total Rural Urban Urbanisation Total Rural Urban Female All Child workers (%) ratio
Raisen 193118 150780 42338 21.9% 70.9% 68.7% 78.3% 59.0% 891 958 35.66 34.84
Gairatganj 104760 96665 8095 7.7% 82.1% 81.9% 84.7% 75.1% 873 951 36.05 38.91
Begamganj 126743 96180 30563 24.1% 81.7% 82.7% 78.6% 74.4% 866 1031 28.72 40.55
Goharganj 213415 144846 68569 32.1% 69.1% 64.8% 78.1% 56.9% 870 925 34.07 36.64
Baraily 218944 175459 43485 19.9% 72.7% 71.3% 77.8% 61.1% 876 919 42.00 33.51
Silwani 125992 125992 - - 70.6% 70.6% 0.0% 60.4% 905 934 46.09 38.69
Udaipura 137187 123397 13790 10.1% 68.0% 67.0% 76.9% 55.5% 885 907 44.12 36.48
Population Literacy Select Gender EmploymentIndicators
Agriculture and Irrigation Status ofGround Water

D I S T R I C T FA C T S H E E T S
254
Human Development Index (HDI) 0.504
Rank in Madhya Pradesh : HDI 34
Gender Related Development Index (GDI) 0.548
Rank in Madhya Pradesh : GDI 25
Human Development Indices - 2002
Area (in sq. km) 6154
Total Inhabited Villages 1664
Total Habitations 2163
Forest Villages 5
Towns (Class I to IV) and Major Towns 12
Beaora
Crop Zone :
Cotton Jowar
Soil type :
Medium Black (Medium)
Agri Climatic Zone :
Malwa Plateau
Schedule V Areas :
No Schedule V area
Basic Details on the District
1981 1991
Infant Mortality Rate 164 122
1991 2001
Life Expectancy (years) 50.8 54.2
1976-81 1984-90
Crude Birth Rate 34.8 37.7
Health
Janpad Panchayats 6
Gram Panchayats 569
Tehsils 6
Tribal Blocks 0
Legislative Assembly Seats 5
Administrative Information
0.5040.617
0.487 0.408
0.000
0.200
0.400
0.600
0.800
1.000
Graph on Human Development Index
1991 2001
Population 992764 1253246
Share of Madhya Pradesh Population 2.04% 2.08%
Urban Population 16.8% 17.3%
Population of Scheduled Castes (SC) 18.0% n.a.
Population of Scheduled Tribes (ST) 3.3% n.a.
Density of Population (per sq. kms.) 161 204
All 23.88 26.24
Rural n.a. 25.45
Urban n.a. 30.16
Decadal Growth (%) 1981-91 1991- 00 1991 1998-99
Per Capita Food Production (in kgs.) 282.04 316.09
1996 2000
FPS per lakh population 27.84 28
Food
R A J G A R H
HDI Education Health Income
Demography
RAJGARH

255
D I S T R I C T FA C T S H E E T S
1991 2001
Worker Participation Rate :
All 47.0% 50.0%
Rural 50.4% 53.7%
Urban 30.1% 32.0%
Share of Primary Sector (%) 82.4% n.a.
Share of Secondary Sector (%) 6.6% n.a.
Share of Tertiary Sector (%) 11.05% n.a.
Employment in Registered Industries (2000) 7747
Employment Rate of Growth (1991 to 2001) n.a. 34.3%
Total Employment in Farm Sector (%) 82.3% 81.89
Rural Employment in Non Farm Sector (%) 9.2% 10.5%
Agriculture Labour (%) 21.4% 27.6%
Employment
2001
Middle Schools per lakh population 33.8
High Schools per lakh population 10.8
Rural Population per Primary Health Centre 33422
Population Serviced Sub Health Centre 6242
2000
Road length per 100 sq. km. (1999) 17.3
Telephone per lakh population 799
Population per Post Office (1994-95) 6588
Registered establishments under Factories Act (1997) 124
Per capita consumption of electricity (non industrial) in kwh 245.0
Infrastructure / Facilities
1991 2001
Life Expectancy of Females at Birth 49.0 53.0
Child Sex Ratio 931 944
Girl Child Mortality (birth to age 1 year) 144 n.a.
Girl Child Mortality (up to age 5 years) 198 n.a.
Total Fertility Rate 5.3 n.a.
Gender Ratio : All 923 931
Rural 927 935
Urban 906 914
General non SC/ ST Gender Ratio 924 n.a.
SC Gender Ratio 922 n.a.
ST Gender Ratio 924 n.a.
Workers Participation Rate - Female 38.3% 44.9%
2000
Female Enrolment Rate (Ages 6-14) 69.2%
Gender
Estimated Poverty Rate (1993-1994) 28.7%
Children as main workers (1991) 7.2%
Children as main and marginal workers (1991) 11.2%
Percentage of safe deliveries (1998-1999) 25.7
Percentage of children fully immunised (1998-1999) 63.1
Deprivation
1991 2001
Literacy (%) : All 31.8% 54.0%
Male 46.7% 69.5%
Female 15.6% 37.4%
Rural 25.7% 50.0%
Urban 62.0% 72.7%
Access to Education 2000
Enrolment Rate (Ages 6-14) 83.3%
Gross access ratio at primary level 100.0%
Habitations with Primary Schools 100.0%
Education
1999
Per Capita Forest Area (in hectares) 0.009
Annual Rate of Afforestation (%) (1993-1999) -11.83
Major Non-Timber Forest Produce :
Tendu Leaves
Forests
2000
Habitations with SDW facility 100.0%
Habitations without 40 lpd water availability 0.0%
Number of villages electrified 1664
Percentage of villages not connected with pucca roads 87.0
1991
Households without access to electricity, SDW and toilet facilities 29.85
Basic Amenities

D I S T R I C T FA C T S H E E T S
256
Land Use Classification in 1998-99
1978 1998
Net Area Sown (in 000' ha.) 394.6 414.8
Gross Cropped Area (in 000' ha.) 437.1 603.4
Double Cropped Area to Net Area Sown 10.8 45.5
Net Irrigated Area (in 000' ha.) 33.1 169.3
Gross Irrigated Area (in 000' ha.) 33.6 169.5
1992-93 1998-99
Agriculture Intensity 122.0 145.5
agriculture and Land Use Over
30 Years
1978 1998
Net Sown Area to Total Geographical Area 64.5% 67.3%
Gross Cropped Area to Total Area 71.5% 97.9%
Net Irrigated to Net Sown Area 8.4% 40.8%
Cropped Area under Food Grains 65.9% 47.8%
Yield of Food Grains (in kg. per hectare) 571 1312
Per Capita Food Production (in kgs.) 316.1
Land Use and Agriculture
2000
Credit-Deposit Ratio 87.55
Commercial Banks (per 1000 population) 0.03
Crop lending per hectare of cultivated land 891.0
Crop lending per hectare of irrigated land 3334.1
Credit
2001
Number of towns reporting slums 12
Urban population residing in slums 0.00%
Level of ground water development 69.18
Average annual rainfall (in mm) 1134.00
1995 2000
Percentage area under wasteland 64.2% 29.57%
Habitat
1991 1998-99
Cereals Per Capita (Kg) 205.5 227.8
Pulses Per Capita (Kg) 76.6 161.6
Oilseeds Per Capita (Kg) 95.4 248.6
Average Landholding (Ha) 3.2 2.43
Gross Irrigated Area ('000 Ha) 169.5
Fertiliser Consumption Per Hectare (Kg) 29.8 47.8
1993 1999
Cropping Intensity 122 145.5
Land Use and Agriculture
Lorenz Curve of Operational Holdings
Cumulative percentage of Land Holdings
0.00 0.25 0.50 0.75 1.00
1.00
0.80
0.60
0.40
0.20
0.00
Cum
ulat
ive
perc
enta
ge o
f Lan
d Ar
ea
Net AreaSown(67%)
Fallow Land (1%)
CultivableWasteland(4%)
OtherUncultivableLand excludingFallow Land(14%)
Land NotAvailable for
Cultivation(11%)
Forest (3%)
NA = not available

257
D I S T R I C T FA C T S H E E T S
Name of Block Total Net Sown Gross Per capita Agriculture Net irrigated area to Irrigated area to Level of GW Status of
Cropped Area Cropped Net Sown Area Intensity Net Sown area total cropped area Development ground water
Rajgarh 1043.57 59.8% 71.7% 0.48 120 18.87 15.73 59.007 White
Khilchipur 772.67 61.7% 74.1% 0.43 120 18.74 15.62 107.807 Over Exploited
Jirapur 808.02 67.4% 89.3% 0.5 132 31.47 24.21 84.223 Grey
Narsinghgarh 1268.22 78.8% 107.3% 0.53 136 31.32 22.99 75.817 Grey
Biaora 1133.73 65.9% 86.0% 0.51 130 29.86 22.89 52.399 White
Sarangpur 871.96 80.0% 107.3% 0.5 134 30.88 23.04 63.390 White
Name of Block SC ST Road length Villages connected by all Population serviced per
per 100 sq.kms. weatherroads post office (1993-' 94)
Rajgarh 17.04 3.63 11.69 28.57 6437
Khilchipur 11.92 2.63 16.7 14.06 5264
Jirapur 20 0.65 12.38 18.69 4777
Narsinghgarh 21.27 2.8 17.27 17.28 3396
Biaora 18.24 4.1 13.67 15.52 5642
Sarangpur 21.46 7.71 17.66 25.79 9305
Population in 1991 Infrastructure (in percentage) (1991)
Sexr ratio Agriculture Worker labourers in participation
Name of Tehsil Total Rural Urban Urbanisation Total Rural Urban Female All Child workers (%) ratio
Khilchipur 148716 133395 15321 10.3% 47.1% 44.0% 73.2% 31.3% 949 968 24.09 48.26
Rajgarh 192184 158972 33212 17.3% 45.4% 38.0% 78.8% 30.7% 935 938 28.06 49.58
Biaora 227103 181686 45417 20.0% 50.7% 44.8% 73.8% 34.0% 918 950 22.86 52.77
Sarangpur 229166 175931 53235 23.2% 63.4% 61.7% 68.8% 46.8% 931 933 32.25 45.53
Narsinghgarh 295041 249775 45266 15.3% 59.4% 57.0% 72.2% 41.2% 924 928 32.11 49.20
Jirapur 161036 136337 24699 15.3% 52.5% 49.1% 71.1% 35.6% 946 969 23.29 55.85
Population Literacy Select Gender EmploymentIndicators
Agriculture and Irrigation Status ofGround Water

D I S T R I C T FA C T S H E E T S
258
Human Development Index (HDI) 0.630
Rank in Madhya Pradesh : HDI 6
Gender Related Development Index (GDI) 0.633
Rank in Madhya Pradesh : GDI 2
Human Development Indices - 2002
Area (in sq. km) 4861
Total Inhabited Villages 1051
Total Habitations 1355
Forest Villages 0
Towns (Class I to IV) and Major Towns 9
Ratlam, Jawra
Crop Zone :
Cotton Jowar
Soil type :
Medium Black (Medium)
Agri Climatic Zone :
Malwa Plateau
Schedule V Areas :
All Blocks of Sailana and Bajna Tehsils
Basic Details on the District
1981 1991
Infant Mortality Rate 141 100
1991 2001
Life Expectancy (years) 55.2 58.1
1976-81 1984-90
Crude Birth Rate 36.1 35.2
Health
Janpad Panchayats 6
Gram Panchayats 406
Tehsils 6
Tribal Blocks 2
Legislative Assembly Seats 5
Administrative Information
0.6300.756
0.551 0.584
0.000
0.200
0.400
0.600
0.800
1.000
Graph on Human Development Index
1991 2001
Population 971888 1214536
Share of Madhya Pradesh Population 2.00% 2.01%
Urban Population 31.9% 30.2%
Population of Scheduled Castes (SC) 13.7% n.a.
Population of Scheduled Tribes (ST) 23.3% n.a.
Density of Population (per sq. kms.) 200 250
All 24.17 24.97
Rural n.a. 27.94
Urban n.a. 18.62
Decadal Growth (%) 1981-91 1991- 00 1991 1998-99
Per Capita Food Production (in kgs.) 281.72 359.94
1996 2000
FPS per lakh population 27.97 28
Food
R A T L A M
HDI Education Health Income
Demography
RATLAM

259
D I S T R I C T FA C T S H E E T S
1991 2001
Worker Participation Rate :
All 46.0% 45.0%
Rural 53.3% 51.3%
Urban 30.3% 30.6%
Share of Primary Sector (%) 74.2% n.a.
Share of Secondary Sector (%) 9.1% n.a.
Share of Tertiary Sector (%) 16.70% n.a.
Employment in Registered Industries (2000) 18472
Employment Rate of Growth (1991 to 2001) n.a. 22.5%
Total Employment in Farm Sector (%) 74.1% 74.76
Rural Employment in Non Farm Sector (%) 7.9% 9.2%
Agriculture Labour (%) 18.1% 28.2%
Employment
2001
Middle Schools per lakh population 41.4
High Schools per lakh population 11.2
Rural Population per Primary Health Centre 32582
Population Serviced Sub Health Centre 5103
2000
Road length per 100 sq. km. (1999) 17.9
Telephone per lakh population 2417
Population per Post Office (1994-95) 5884
Registered establishments under Factories Act (1997) 237
Per capita consumption of electricity (non industrial) in kwh 853.3
Infrastructure / Facilities
1991 2001
Life Expectancy of Females at Birth 56.5 59.3
Child Sex Ratio 961 960
Girl Child Mortality (birth to age 1 year) 132 n.a.
Girl Child Mortality (up to age 5 years) 151 n.a.
Total Fertility Rate 4.6 n.a.
Gender Ratio : All 948 959
Rural 956 965
Urban 932 943
General non SC/ ST Gender Ratio 942 n.a.
SC Gender Ratio 941 n.a.
ST Gender Ratio 972 n.a.
Workers Participation Rate - Female 36.6% 36.1%
2000
Female Enrolment Rate (Ages 6-14) 87.8%
Gender
Estimated Poverty Rate (1993-1994) 19.1%
Children as main workers (1991) 8.3%
Children as main and marginal workers (1991) 12.1%
Percentage of safe deliveries (1998-1999) 60.4
Percentage of children fully immunised (1998-1999) 48.8
Deprivation
1991 2001
Literacy (%) : All 44.2% 67.7%
Male 58.4% 80.1%
Female 19.1% 54.7%
Rural 30.6% 61.0%
Urban 72.1% 82.2%
Access to Education 2000
Enrolment Rate (Ages 6-14) 91.4%
Gross access ratio at primary level 100.0%
Habitations with Primary Schools 100.0%
Education
2000
Habitations with SDW facility 100.0%
Habitations without 40 lpd water availability 1.2%
Number of villages electrified 1051
Percentage of villages not connected with pucca roads 73.0
1991
Households without access to electricity, SDW and toilet facilities 9.44
Basic Amenities
1999
Per Capita Forest Area (in hectares) 0.016
Annual Rate of Afforestation (%) (1993-1999) -4.58
Major Non-Timber Forest Produce :
Tendu Leaves
Forests

D I S T R I C T FA C T S H E E T S
260
Land Use Classification in 1998-99
1978 1998
Net Area Sown (in 000' ha.) 300.7 325.0
Gross Cropped Area (in 000' ha.) 361.1 518.6
Double Cropped Area to Net Area Sown 20.1 59.5
Net Irrigated Area (in 000' ha.) 40.4 145.5
Gross Irrigated Area (in 000' ha.) 41.1 146.6
1992-93 1998-99
Agriculture Intensity 148.6 159.5
agriculture and Land Use Over
30 Years
1978 1998
Net Sown Area to Total Geographical Area 61.8% 66.8%
Gross Cropped Area to Total Area 74.2% 106.6%
Net Irrigated to Net Sown Area 13.4% 44.8%
Cropped Area under Food Grains 65.0% 45.9%
Yield of Food Grains (in kg. per hectare) 603 1757
Per Capita Food Production (in kgs.) 359.9
Land Use and Agriculture
2000
Credit-Deposit Ratio 40.65
Commercial Banks (per 1000 population) 0.05
Crop lending per hectare of cultivated land 970.6
Crop lending per hectare of irrigated land 3475.4
Credit
2001
Number of towns reporting slums 9
Urban population residing in slums 31.59%
Level of ground water development 90.54
Average annual rainfall (in mm) 895.00
1995 2000
Percentage area under wasteland 22.0% 32.50%
Habitat
1991 1998-99
Cereals Per Capita (Kg) 208.3 296.6
Pulses Per Capita (Kg) 73.5 90.9
Oilseeds Per Capita (Kg) 83.5 270.1
Average Landholding (Ha) 3.0 2.67
Gross Irrigated Area ('000 Ha) 146.6
Fertiliser Consumption Per Hectare (Kg) 59.8 88.4
1993 1999
Cropping Intensity 149 159.5
Land Use and Agriculture
Lorenz Curve of Operational Holdings
Cumulative percentage of Land Holdings
0.00 0.25 0.50 0.75 1.00
1.00
0.80
0.60
0.40
0.20
0.00
Cum
ulat
ive
perc
enta
ge o
f Lan
d Ar
ea
Net AreaSown(67%)
Fallow Land (1%)
CultivableWasteland(5%)
OtherUncultivableLand excludingFallow Land(6%)
Land NotAvailable for
Cultivation(14%)
Forest (7%)
NA = not available

261
D I S T R I C T FA C T S H E E T S
Name of Block Total Net Sown Gross Per capita Agriculture Net irrigated area to Irrigated area to Level of GW Status of
Cropped Area Cropped Net Sown Area Intensity Net Sown area total cropped area Development ground water
Ratlam 1268.87 71.4% 104.5% 0.49 146 36.4 24.89 93.922 Dark
Sailana 533.24 52.4% 64.3% 0.42 123 17.14 13.95 34.545 White
Bajna 681.17 44.2% 51.2% 0.34 116 12.98 11.22 14.577 White
Jaora 731.48 77.3% 128.3% 0.52 166 35.94 21.64 151.723 Over Exploited
Piploda 602.5 80.0% 133.5% 0.52 167 39.51 23.94 110.053 Over Exploited
Alot 940.96 70.6% 108.8% 0.54 154 32.17 21.04 73.095 Grey
Name of Block SC ST Road length Villages connected by all Population serviced per
per 100 sq.kms. weatherroads post office (1993-' 94)
Ratlam 13.75 32.8 23.64 52.69 2783
Sailana 1.85 85.7 24.94 22.65 5097
Bajna 1.54 91.02 21.58 32.73 3846
Jaora 26.45 4.51 23.79 41.5 3491
Piploda 16.91 14.5 20.91 41.57 3402
Alot 23.09 0.72 14.98 24.35 3435
Population in 1991 Infrastructure (in percentage) (1991)
Sexr ratio Agriculture Worker labourers in participation
Name of Tehsil Total Rural Urban Urbanisation Total Rural Urban Female All Child workers (%) ratio
Ratlam 471754 229799 241955 51.3% 76.5% 65.6% 86.3% 65.4% 948 954 23.14 39.53
Sailana 102062 91159 10903 10.7% 52.9% 48.4% 86.3% 38.0% 981 986 31.35 49.59
Bajna 122537 122537 - - 35.0% 35.0% 0.0% 21.9% 989 973 38.78 55.22
Jaora 210230 137588 72642 34.6% 69.6% 67.8% 72.8% 55.9% 954 959 27.58 43.24
Piploda 121937 114635 7302 6.0% 69.6% 69.5% 71.0% 54.3% 967 948 34.49 51.64
Alot 186016 151421 34595 18.6% 69.0% 68.0% 73.3% 55.1% 955 955 25.37 47.59
Population Literacy Select Gender EmploymentIndicators
Agriculture and Irrigation Status ofGround Water

D I S T R I C T FA C T S H E E T S
262
Human Development Index (HDI) 0.478
Rank in Madhya Pradesh : HDI 39
Gender Related Development Index (GDI) 0.500
Rank in Madhya Pradesh : GDI 36
Human Development Indices - 2002
Area (in sq. km) 6314
Total Inhabited Villages 2352
Total Habitations 6985
Forest Villages 0
Towns (Class I to IV) and Major Towns 12
Rewa
Crop Zone :
Wheat Rice Zone
Soil type :
Mixed Red and Black Soils (Medium)
Agri Climatic Zone :
Kymore Plateau and Satpura Hills
Schedule V Areas :
No Schedule V area
Basic Details on the District
1981 1991
Infant Mortality Rate 155 128
1991 2001
Life Expectancy (years) 50.6 53.6
1976-81 1984-90
Crude Birth Rate 36.0 40.9
Health
Janpad Panchayats 9
Gram Panchayats 815
Tehsils 7
Tribal Blocks 0
Legislative Assembly Seats 7
Administrative Information
0.478
0.705
0.476
0.254
0.000
0.200
0.400
0.600
0.800
1.000
Graph on Human Development Index
1991 2001
Population 1554987 1972333
Share of Madhya Pradesh Population 3.20% 3.27%
Urban Population 15.2% 16.2%
Population of Scheduled Castes (SC) 14.8% n.a.
Population of Scheduled Tribes (ST) 12.4% n.a.
Density of Population (per sq. kms.) 246 312
All 28.77 26.84
Rural n.a. 25.31
Urban n.a. 35.33
Decadal Growth (%) 1981-91 1991- 00 1991 1998-99
Per Capita Food Production (in kgs.) 260.97 204.44
1996 2000
FPS per lakh population 36.21 37
Food
R E W A
HDI Education Health Income
Demography
REWA

263
D I S T R I C T FA C T S H E E T S
1991 2001
Worker Participation Rate :
All 37.7% 43.8%
Rural 39.1% 46.2%
Urban 30.0% 31.2%
Share of Primary Sector (%) 79.7% n.a.
Share of Secondary Sector (%) 6.9% n.a.
Share of Tertiary Sector (%) 13.35% n.a.
Employment in Registered Industries (2000) 7533
Employment Rate of Growth (1991 to 2001) n.a. 47.1%
Total Employment in Farm Sector (%) 79.5% 78.3
Rural Employment in Non Farm Sector (%) 13.9% 14.8%
Agriculture Labour (%) 36.9% 34.9%
Employment
2001
Middle Schools per lakh population 37.5
High Schools per lakh population 22.6
Rural Population per Primary Health Centre 55062
Population Serviced Sub Health Centre 6164
2000
Road length per 100 sq. km. (1999) 37.1
Telephone per lakh population 768
Population per Post Office (1994-95) 5189
Registered establishments under Factories Act (1997) 138
Per capita consumption of electricity (non industrial) in kwh 148.2
Infrastructure / Facilities
1991 2001
Life Expectancy of Females at Birth 48.6 51.0
Child Sex Ratio 935 926
Girl Child Mortality (birth to age 1 year) 127 n.a.
Girl Child Mortality (up to age 5 years) 198 n.a.
Total Fertility Rate 5.8 n.a.
Gender Ratio : All 932 939
Rural 946 950
Urban 858 883
General non SC/ ST Gender Ratio 937 n.a.
SC Gender Ratio 923 n.a.
ST Gender Ratio 912 n.a.
Workers Participation Rate - Female 28.5% 37.7%
2000
Female Enrolment Rate (Ages 6-14) 83.7%
Gender
Estimated Poverty Rate (1993-1994) 29.4%
Children as main workers (1991) 4.0%
Children as main and marginal workers (1991) 5.5%
Percentage of safe deliveries (1998-1999) 20.8
Percentage of children fully immunised (1998-1999) 65
Deprivation
1991 2001
Literacy (%) : All 44.4% 62.3%
Male 60.7% 76.0%
Female 26.9% 47.8%
Rural 40.5% 59.5%
Urban 65.0% 76.3%
Access to Education 2000
Enrolment Rate (Ages 6-14) 86.8%
Gross access ratio at primary level 100.0%
Habitations with Primary Schools 100.0%
Education
2000
Habitations with SDW facility 99.9%
Habitations without 40 lpd water availability 0.1%
Number of villages electrified 2154
Percentage of villages not connected with pucca roads 55.4
1991
Households without access to electricity, SDW and toilet facilities 53.69
Basic Amenities
1999
Per Capita Forest Area (in hectares) 0.030
Annual Rate of Afforestation (%) (1993-1999) 0.12
Major Non-Timber Forest Produce :
Tendu Leaves, Aonla, Mahua Flower, Mahua Guthli
Forests

D I S T R I C T FA C T S H E E T S
264
Land Use Classification in 1998-99
1978 1998
Net Area Sown (in 000' ha.) 366.9 371.8
Gross Cropped Area (in 000' ha.) 467.9 500.4
Double Cropped Area to Net Area Sown 27.5 34.6
Net Irrigated Area (in 000' ha.) 22.1 87.3
Gross Irrigated Area (in 000' ha.) 22.1 87.4
1992-93 1998-99
Agriculture Intensity 129.7 134.6
agriculture and Land Use Over
30 Years
1978 1998
Net Sown Area to Total Geographical Area 58.3% 59.1%
Gross Cropped Area to Total Area 74.4% 79.6%
Net Irrigated to Net Sown Area 6.0% 23.5%
Cropped Area under Food Grains 89.6% 88.1%
Yield of Food Grains (in kg. per hectare) 316 872
Per Capita Food Production (in kgs.) 204.4
Land Use and Agriculture
2000
Credit-Deposit Ratio 30.32
Commercial Banks (per 1000 population) 0.03
Crop lending per hectare of cultivated land 503.9
Crop lending per hectare of irrigated land 3007.6
Credit
2001
Number of towns reporting slums 12
Urban population residing in slums 4.07%
Level of ground water development 23.99
Average annual rainfall (in mm) 1035.00
1995 2000
Percentage area under wasteland 10.8% 12.68%
Habitat
1991 1998-99
Cereals Per Capita (Kg) 217.4 158.1
Pulses Per Capita (Kg) 43.5 39.1
Oilseeds Per Capita (Kg) 5.0 11.3
Average Landholding (Ha) 2.4 2.07
Gross Irrigated Area ('000 Ha) 87.4
Fertiliser Consumption Per Hectare (Kg) 66.1 42.54
1993 1999
Cropping Intensity 130 134.6
Land Use and Agriculture
Lorenz Curve of Operational Holdings
Cumulative percentage of Land Holdings
0.00 0.25 0.50 0.75 1.00
1.00
0.80
0.60
0.40
0.20
0.00
Cum
ulat
ive
perc
enta
ge o
f Lan
d Ar
ea
Net AreaSown(59%)
Fallow Land (7%)
CultivableWasteland(1%)
OtherUncultivableLand excludingFallow Land(6%)
Land NotAvailable for
Cultivation(16%)
Forest (11%)
NA = not available

265
D I S T R I C T FA C T S H E E T S
Name of Block Total Net Sown Gross Per capita Agriculture Net irrigated area to Irrigated area to Level of GW Status of
Cropped Area Cropped Net Sown Area Intensity Net Sown area total cropped area Development ground water
Rewa 621.92 70.6% 90.8% 0.26 129 25.82 20.08 40.765 White
Raipur(Karchulian) 627 65.2% 87.5% 0.25 134 8.66 6.45 13.510 White
Mauganj 488.29 62.2% 85.0% 0.28 137 13.24 9.96 39.276 White
Hanumana 927.57 68.2% 87.0% 0.41 128 11.7 9.17 1.750 White
Naigarhi 362.78 55.4% 106.7% 0.19 193 13.87 7.19 27.768 White
Teonthar 754.84 65.4% 81.4% 0.34 125 31.85 25.58 12.202 White
Jawa 787.34 43.9% 53.7% 0.24 122 25.26 20.67 11.905 White
Sirmour 827.26 62.7% 80.3% 0.29 128 24.24 18.94 38.034 White
Gangev 577.04 74.0% 90.3% 0.28 122 13 10.66 54.070 White
Name of Block SC ST Road length Villages connected by all Population serviced per
per 100 sq.kms. weatherroads post office (1993-' 94)
Rewa 14.56 10.05 36.68 100.00 5252
Raipur(Karchulian) 14.97 10.92 21.53 115.38 5891
Mauganj 15.86 11.33 19.46 54.15 5785
Hanumana 14.63 19.66 15.63 43.8 6364
Naigarhi 19.34 6.27 33.63 65.19 4797
Teonthar 13.52 18.73 19.47 34.62 3632
Jawa 16.65 18.65 9.53 65.09 4353
Sirmour 14.72 14.87 24.78 118.67 3426
Gangev 15.71 9.49 7.28 86.72 3945
Population in 1991 Infrastructure (in percentage) (1991)
Sexr ratio Agriculture Worker labourers in participation
Name of Tehsil Total Rural Urban Urbanisation Total Rural Urban Female All Child workers (%) ratio
Teonthar 393239 368887 24352 6.2% 59.8% 59.1% 71.0% 44.7% 908 904 36.79 46.05
Sirmour 448940 404820 44120 9.8% 62.8% 61.9% 71.3% 48.5% 967 921 35.43 47.09
Mauganj 295500 263744 31756 10.7% 57.6% 57.0% 63.0% 42.2% 966 929 38.74 45.37
Huzur 396389 203460 192929 48.7% 73.2% 65.0% 81.4% 61.6% 895 917 24.03 33.23
Hanumana 205557 190684 14873 7.2% 51.9% 50.9% 65.1% 35.6% 959 969 36.66 44.90
Gurh 107952 95507 12445 11.5% 58.5% 57.2% 68.0% 42.6% 960 944 39.47 50.38
Raipur (Karchulian) 124756 124756 - - 63.3% 63.3% 0.0% 48.6% 965 942 35.71 46.77
Population Literacy Select Gender EmploymentIndicators
Agriculture and Irrigation Status ofGround Water

D I S T R I C T FA C T S H E E T S
266
Human Development Index (HDI) 0.565
Rank in Madhya Pradesh : HDI 20
Gender Related Development Index (GDI) 0.545
Rank in Madhya Pradesh : GDI 25
Human Development Indices - 2002
Area (in sq. km) 10252
Total Inhabited Villages 1868
Total Habitations 2230
Forest Villages 17
Towns (Class I to IV) and Major Towns 13
Sagar, Bina, Khurai
Crop Zone :
Wheat Zone
Soil type :
Medium Black and Deep Black (Medium/ Heavy)
Agri Climatic Zone :
Vindhya Plateau
Schedule V Areas :
No Schedule V area
Basic Details on the District
1981 1991
Infant Mortality Rate 160 116
1991 2001
Life Expectancy (years) 51.9 54.0
1976-81 1984-90
Crude Birth Rate 37.3 39.6
Health
Janpad Panchayats 11
Gram Panchayats 753
Tehsils 8
Tribal Blocks 0
Legislative Assembly Seats 8
Administrative Information
0.5650.755
0.484 0.456
0.000
0.200
0.400
0.600
0.800
1.000
Graph on Human Development Index
1991 2001
Population 1647736 2021783
Share of Madhya Pradesh Population 3.39% 3.35%
Urban Population 29.2% 29.2%
Population of Scheduled Castes (SC) 21.1% n.a.
Population of Scheduled Tribes (ST) 8.5% n.a.
Density of Population (per sq. kms.) 161 197
All 24.53 22.70
Rural n.a. 22.64
Urban n.a. 22.85
Decadal Growth (%) 1981-91 1991- 00 1991 1998-99
Per Capita Food Production (in kgs.) 215.87 222.65
1996 2000
FPS per lakh population 35.66 34
Food
S A G A R
HDI Education Health Income
Demography
SAGAR

267
D I S T R I C T FA C T S H E E T S
1991 2001
Worker Participation Rate :
All 39.1% 41.5%
Rural 41.8% 44.5%
Urban 32.5% 34.3%
Share of Primary Sector (%) 57.4% n.a.
Share of Secondary Sector (%) 25.6% n.a.
Share of Tertiary Sector (%) 17.04% n.a.
Employment in Registered Industries (2000) 4912
Employment Rate of Growth (1991 to 2001) n.a. 30.4%
Total Employment in Farm Sector (%) 57.0% 52.34
Rural Employment in Non Farm Sector (%) 27.0% 33.3%
Agriculture Labour (%) 22.7% 25.7%
Employment
2001
Middle Schools per lakh population 25.7
High Schools per lakh population 11.1
Rural Population per Primary Health Centre 49325
Population Serviced Sub Health Centre 5838
2000
Road length per 100 sq. km. (1999) 19.7
Telephone per lakh population 994
Population per Post Office (1994-95) 8569
Registered establishments under Factories Act (1997) 309
Per capita consumption of electricity (non industrial) in kwh 215.0
Infrastructure / Facilities
1991 2001
Life Expectancy of Females at Birth 52.2 54.0
Child Sex Ratio 935 929
Girl Child Mortality (birth to age 1 year) 132 n.a.
Girl Child Mortality (up to age 5 years) 169 n.a.
Total Fertility Rate 5.5 n.a.
Gender Ratio : All 881 884
Rural 884 880
Urban 874 895
General non SC/ ST Gender Ratio 878 n.a.
SC Gender Ratio 869 n.a.
ST Gender Ratio 931 n.a.
Workers Participation Rate - Female 26.2% 30.3%
2000
Female Enrolment Rate (Ages 6-14) 88.7%
Gender
Estimated Poverty Rate (1993-1994) 51.7%
Children as main workers (1991) 3.9%
Children as main and marginal workers (1991) 5.3%
Percentage of safe deliveries (1998-1999) 43
Percentage of children fully immunised (1998-1999) 32.4
Deprivation
1991 2001
Literacy (%) : All 53.4% 68.1%
Male 67.0% 80.0%
Female 37.8% 54.5%
Rural 44.0% 61.6%
Urban 75.5% 82.9%
Access to Education 2000
Enrolment Rate (Ages 6-14) 90.0%
Gross access ratio at primary level 100.0%
Habitations with Primary Schools 100.0%
Education
2000
Habitations with SDW facility 99.7%
Habitations without 40 lpd water availability 0.5%
Number of villages electrified 1777
Percentage of villages not connected with pucca roads 73.1
1991
Households without access to electricity, SDW and toilet facilities 35.12
Basic Amenities
1999
Per Capita Forest Area (in hectares) 0.137
Annual Rate of Afforestation (%) (1993-1999) 2.19
Major Non-Timber Forest Produce :
Tendu Leaves
Forests

D I S T R I C T FA C T S H E E T S
268
Land Use Classification in 1998-99
1978 1998
Net Area Sown (in 000' ha.) 508.1 532.0
Gross Cropped Area (in 000' ha.) 529.4 689.0
Double Cropped Area to Net Area Sown 4.2 29.5
Net Irrigated Area (in 000' ha.) 18.0 168.4
Gross Irrigated Area (in 000' ha.) 20.0 168.4
1992-93 1998-99
Agriculture Intensity 114.9 129.5
agriculture and Land Use Over
30 Years
1978 1998
Net Sown Area to Total Geographical Area 49.7% 52.0%
Gross Cropped Area to Total Area 51.7% 67.4%
Net Irrigated to Net Sown Area 3.5% 31.7%
Cropped Area under Food Grains 80.1% 65.5%
Yield of Food Grains (in kg. per hectare) 612 958
Per Capita Food Production (in kgs.) 222.6
Land Use and Agriculture
2000
Credit-Deposit Ratio 46.51
Commercial Banks (per 1000 population) 0.04
Crop lending per hectare of cultivated land 613.6
Crop lending per hectare of irrigated land 2967.1
Credit
2001
Number of towns reporting slums 13
Urban population residing in slums 5.30%
Level of ground water development 34.91
Average annual rainfall (in mm) 1125.00
1995 2000
Percentage area under wasteland 20.1% 20.45%
Habitat
1991 1998-99
Cereals Per Capita (Kg) 164.5 153.6
Pulses Per Capita (Kg) 51.3 44.9
Oilseeds Per Capita (Kg) 44.8 52.8
Average Landholding (Ha) 2.9 2.50
Gross Irrigated Area ('000 Ha) 168.4
Fertiliser Consumption Per Hectare (Kg) 26.9 35.97
1993 1999
Cropping Intensity 115 129.5
Land Use and Agriculture
Lorenz Curve of Operational Holdings
Cumulative percentage of Land Holdings
0.00 0.25 0.50 0.75 1.00
1.00
0.80
0.60
0.40
0.20
0.00
Cum
ulat
ive
perc
enta
ge o
f Lan
d Ar
ea
Net AreaSown(52%)
Fallow Land (2%)
CultivableWasteland(2%)
OtherUncultivableLand excludingFallow Land(9%)
Land NotAvailable for
Cultivation(7%)
Forest (28%)
NA = not available

269
D I S T R I C T FA C T S H E E T S
Name of Block Total Net Sown Gross Per capita Agriculture Net irrigated area to Irrigated area to Level of GW Status of
Cropped Area Cropped Net Sown Area Intensity Net Sown area total cropped area Development ground water
Sagar 837.13 62.0% 74.1% 0.35 119 24.92 20.87 56.688 White
Rahatgarh 816.12 66.6% 78.6% 0.46 118 22.1 18.72 34.668 White
Jaisingnagar 731.96 60.4% 74.7% 0.45 124 24.27 19.62 39.506 White
Rehli 842.5 67.9% 86.3% 0.42 127 29.39 23.14 44.843 White
Deori 812.47 54.1% 70.1% 0.43 130 31.34 24.19 30.052 White
Kesli 696.39 49.5% 61.6% 0.41 124 21.12 17.17 28.468 White
Banda 807.22 57.7% 66.3% 0.38 115 29.62 29.81 31.873 White
Shahgarh 488.65 43.2% 54.0% 0.28 125 42.8 34.22 13.719 White
Khurai 747.97 83.8% 90.3% 0.64 108 7.82 7.7 33.067 White
Malthone 680.79 69.4% 73.9% 0.46 106 1.9 2.1 17.876 White
Bina 671.57 81.3% 89.7% 0.63 110 13.57 12.3 37.394 White
Name of Block SC ST Road length Villages connected by all Population serviced per
per 100 sq.kms. weatherroads post office (1993-' 94)
Sagar 25.29 8.59 31.42 33.13 4887
Rahatgarh 23.31 6.71 14.34 20.31 5132
Jaisingnagar 21.88 6.18 1.23 19.31 4661
Rehli 18.08 11.03 21.96 9.77 7561
Deori 14.79 20.19 3.82 12.62 4766
Kesli 11.58 27.76 17.81 5.33 6934
Banda 22.26 11.02 30.97 35.76 6748
Shahgarh 22.19 13.02 25.78 21.50 5466
Khurai 28.94 6.53 15.64 19.30 4877
Malthone 21.4 9.63 8.67 8.47 7260
Bina 24.77 8.28 21.14 19.48 9560
Population in 1991 Infrastructure (in percentage) (1991)
Sexr ratio Agriculture Worker labourers in participation
Name of Tehsil Total Rural Urban Urbanisation Total Rural Urban Female All Child workers (%) ratio
Khurai 294214 252691 41523 14.1% 64.4% 61.5% 81.3% 49.2% 890 932 37.43 42.37
Banda 283694 242931 40763 14.4% 60.2% 56.9% 79.0% 44.3% 877 928 21.35 44.62
Sagar 693691 352742 340949 49.1% 75.8% 66.4% 85.0% 64.1% 879 920 14.08 39.34
Rahatgarh 105633 80416 25217 23.9% 65.2% 65.7% 63.5% 51.4% 876 952 24.54 44.92
Rehli 117636 91723 25913 22.0% 61.9% 57.4% 77.3% 47.4% 886 925 27.48 43.39
Garhakota 101419 74058 27361 27.0% 64.4% 58.5% 79.9% 48.9% 892 934 27.17 43.22
Deori 151275 127463 23812 15.7% 65.9% 62.6% 83.0% 53.1% 892 930 34.83 44.66
Bina 173816 107992 65824 37.9% 70.2% 60.4% 85.0% 56.9% 892 941 38.28 34.69
Kesli 100405 100405 - - 59.8% 59.8% 0.0% 45.5% 894 944 43.81 44.81
Population Literacy Select Gender EmploymentIndicators
Agriculture and Irrigation Status ofGround Water

D I S T R I C T FA C T S H E E T S
270
Human Development Index (HDI) 0.583
Rank in Madhya Pradesh : HDI 38
Gender Related Development Index (GDI) 0.476
Rank in Madhya Pradesh : GDI 41
Human Development Indices - 2002
Area (in sq. km) 7502
Total Inhabited Villages 1784
Total Habitations 3999
Forest Villages 0
Towns (Class I to IV) and Major Towns 11
Satna
Crop Zone :
Wheat Rice Zone
Soil type :
Mixed Red and Black Soils (Medium)
Agri Climatic Zone :
Kymore Plateau and Satpura Hills
Schedule V Areas :
No Schedule V area
Basic Details on the District
1981 1991
Infant Mortality Rate 175 143
1991 2001
Life Expectancy (years) 46.6 49.6
1976-81 1984-90
Crude Birth Rate 37.3 40.7
Health
Janpad Panchayats 11
Gram Panchayats 710
Tehsils 8
Tribal Blocks 0
Legislative Assembly Seats 7
Administrative Information
0.483
0.732
0.4100.307
0.000
0.200
0.400
0.600
0.800
1.000
Graph on Human Development Index
1991 2001
Population 1465384 1868648
Share of Madhya Pradesh Population 3.02% 3.09%
Urban Population 19.7% 20.6%
Population of Scheduled Castes (SC) 17.8% n.a.
Population of Scheduled Tribes (ST) 13.8% n.a.
Density of Population (per sq. kms.) 195 249
All 27.05 27.52
Rural n.a. 26.09
Urban n.a. 33.35
Decadal Growth (%) 1981-91 1991- 00 1991 1998-99
Per Capita Food Production (in kgs.) 225.33 220.12
1996 2000
FPS per lakh population 47.37 42
Food
S A T N A
HDI Education Health Income
Demography
SATNA

271
D I S T R I C T FA C T S H E E T S
1991 2001
Worker Participation Rate :
All 40.3% 39.9%
Rural 42.4% 41.9%
Urban 32.1% 31.9%
Share of Primary Sector (%) 74.2% n.a.
Share of Secondary Sector (%) 12.7% n.a.
Share of Tertiary Sector (%) 13.07% n.a.
Employment in Registered Industries (2000) 16970
Employment Rate of Growth (1991 to 2001) n.a. 26.0%
Total Employment in Farm Sector (%) 73.1% 65.98
Rural Employment in Non Farm Sector (%) 17.6% 23.7%
Agriculture Labour (%) 29.2% 31.8%
Employment
2001
Middle Schools per lakh population 44.0
High Schools per lakh population 20.2
Rural Population per Primary Health Centre 32957
Population Serviced Sub Health Centre 5748
2000
Road length per 100 sq. km. (1999) 38.6
Telephone per lakh population 990
Population per Post Office (1994-95) 5675
Registered establishments under Factories Act (1997) 358
Per capita consumption of electricity (non industrial) in kwh 198.2
Infrastructure / Facilities
1991 2001
Life Expectancy of Females at Birth 45.3 47.8
Child Sex Ratio 939 929
Girl Child Mortality (birth to age 1 year) 147 n.a.
Girl Child Mortality (up to age 5 years) 207 n.a.
Total Fertility Rate 5.7 n.a.
Gender Ratio : All 918 926
Rural 929 938
Urban 875 883
General non SC/ ST Gender Ratio 914 n.a.
SC Gender Ratio 922 n.a.
ST Gender Ratio 933 n.a.
Workers Participation Rate - Female 30.0% 30.5%
2000
Female Enrolment Rate (Ages 6-14) 87.3%
Gender
Estimated Poverty Rate (1993-1994) 28.8%
Children as main workers (1991) 4.4%
Children as main and marginal workers (1991) 5.8%
Percentage of safe deliveries (1998-1999) 16.9
Percentage of children fully immunised (1998-1999) 35.9
Deprivation
1991 2001
Literacy (%) : All 44.7% 65.1%
Male 60.0% 77.8%
Female 27.8% 51.4%
Rural 39.5% 61.6%
Urban 65.0% 78.3%
Access to Education 2000
Enrolment Rate (Ages 6-14) 89.4%
Gross access ratio at primary level 100.0%
Habitations with Primary Schools 100.0%
Education
2000
Habitations with SDW facility 99.9%
Habitations without 40 lpd water availability 0.1%
Number of villages electrified 1661
Percentage of villages not connected with pucca roads 55.0
1991
Households without access to electricity, SDW and toilet facilities 46.88
Basic Amenities
1999
Per Capita Forest Area (in hectares) 0.091
Annual Rate of Afforestation (%) (1993-1999) -0.80
Major Non-Timber Forest Produce :
Tendu Leaves
Forests

D I S T R I C T FA C T S H E E T S
272
Land Use Classification in 1998-99
1978 1998
Net Area Sown (in 000' ha.) 347.5 362.3
Gross Cropped Area (in 000' ha.) 424.3 488.1
Double Cropped Area to Net Area Sown 22.1 34.8
Net Irrigated Area (in 000' ha.) 14.9 106.5
Gross Irrigated Area (in 000' ha.) 14.9 106.5
1992-93 1998-99
Agriculture Intensity 123.0 134.8
agriculture and Land Use Over
30 Years
1978 1998
Net Sown Area to Total Geographical Area 46.8% 48.8%
Gross Cropped Area to Total Area 57.2% 65.7%
Net Irrigated to Net Sown Area 4.3% 29.4%
Cropped Area under Food Grains 89.8% 84.6%
Yield of Food Grains (in kg. per hectare) 514 948
Per Capita Food Production (in kgs.) 220.1
Land Use and Agriculture
2000
Credit-Deposit Ratio 40.28
Commercial Banks (per 1000 population) 0.03
Crop lending per hectare of cultivated land 669.4
Crop lending per hectare of irrigated land 3685.3
Credit
2001
Number of towns reporting slums 11
Urban population residing in slums 9.22%
Level of ground water development 27.13
Average annual rainfall (in mm) 896.30
1995 2000
Percentage area under wasteland 15.1% 25.53%
Habitat
1991 1998-99
Cereals Per Capita (Kg) 193.1 183.6
Pulses Per Capita (Kg) 32.3 75.3
Oilseeds Per Capita (Kg) 7.2 15.7
Average Landholding (Ha) 2.0 1.80
Gross Irrigated Area ('000 Ha) 106.5
Fertiliser Consumption Per Hectare (Kg) 45.7 40.52
1993 1999
Cropping Intensity 123 134.8
Land Use and Agriculture
Lorenz Curve of Operational Holdings
Cumulative percentage of Land Holdings
0.00 0.25 0.50 0.75 1.00
1.00
0.80
0.60
0.40
0.20
0.00
Cum
ulat
ive
perc
enta
ge o
f Lan
d Ar
ea
Net AreaSown(50%)
Fallow Land (4%)
CultivableWasteland(6%)
OtherUncultivableLand excludingFallow Land(3%)
Land NotAvailable for
Cultivation(10%)
Forest (27%)
NA = not available

273
D I S T R I C T FA C T S H E E T S
Name of Block Total Net Sown Gross Per capita Agriculture Net irrigated area to Irrigated area to Level of GW Status of
Cropped Area Cropped Net Sown Area Intensity Net Sown area total cropped area Development ground water
Satna (Suhawal) 654.52 78.6% 92.2% 0.38 117 17.37 21.83 37.849 White
Chitrakut (Majhgawan) 1550.93 31.2% 35.6% 0.28 114 14.24 16.07 16.683 White
Rampur Baghelan 796.25 72.5% 95.3% 0.35 132 31.55 25.58 30.121 White
Nagod 915.85 57.5% 69.2% 0.37 120 19.84 16.93 34.389 White
Uchehra 871.41 36.6% 44.5% 0.29 121 31.32 25.8 27.321 White
Amarpatan 624.19 63.1% 85.6% 0.3 136 21.82 16.1 34.647 White
Ramnagar 600.67 46.2% 60.6% 0.24 131 9.93 7.57 22.627 White
Maihar 1124.88 46.1% 59.3% 0.26 129 19.14 14.95 19.619 White
Name of Block SC ST Road length Villages connected by all Population serviced per
per 100 sq.kms. weatherroads post office (1993-' 94)
Satna (Suhawal) 26.29 10.45 15.28 85.36 2611
Chitrakut (Majhgawan) 17.99 18.88 28.82 82.27 3147
Rampur Baghelan 16.42 11.2 15.95 25.73 3535
Nagod 24.51 8.95 9.5 19.57 4347
Uchehra 17.73 19.73 14.69 17.44 5596
Amarpatan 13.66 13.28 37.33 93.13 6660
Ramnagar 13.28 24.8 22.81 53.24 4017
Maihar 16.18 21.09 23.56 93.94 6339
Population in 1991 Infrastructure (in percentage) (1991)
Sexr ratio Agriculture Worker labourers in participation
Name of Tehsil* Total Rural Urban Urbanisation Total Rural Urban Female All Child workers (%) ratio
Raghurajnagar 660470 379906 280564 42.5% 68.9% 61.0% 79.1% 56.2% 900 923 23.84 36.64
Nagod 199459 179985 19474 9.8% 65.2% 63.5% 81.0% 52.3% 920 916 30.37 39.87
Amarpatan 188013 171648 16365 8.7% 66.3% 65.4% 75.8% 52.4% 949 934 40.74 41.34
Maihar 294618 260271 34347 11.7% 60.2% 58.0% 76.0% 45.1% 941 938 32.05 41.11
Rampur Baghelan 233069 214891 18178 7.8% 66.0% 65.6% 70.6% 52.4% 950 926 38.42 39.76
Uchehra 159668 143006 16662 10.4% 60.5% 58.5% 76.8% 46.1% 931 949 30.53 47.39
Ramnagar 133351 133351 - - 59.3% 59.3% 0.0% 43.8% 962 940 46.37 42.15
Population Literacy Select Gender EmploymentIndicators
*Data for Tehsil Majhgawan not available separately as it was formed on 18.6.01
Agriculture and Irrigation Status ofGround Water
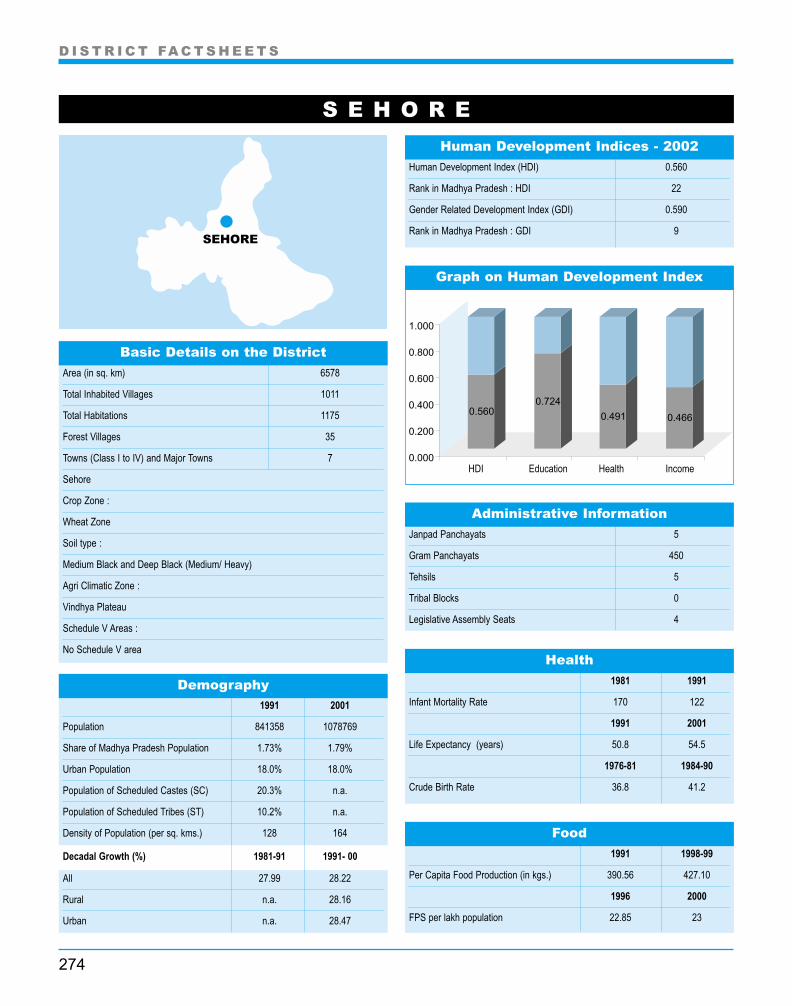
D I S T R I C T FA C T S H E E T S
274
Human Development Index (HDI) 0.560
Rank in Madhya Pradesh : HDI 22
Gender Related Development Index (GDI) 0.590
Rank in Madhya Pradesh : GDI 9
Human Development Indices - 2002
Area (in sq. km) 6578
Total Inhabited Villages 1011
Total Habitations 1175
Forest Villages 35
Towns (Class I to IV) and Major Towns 7
Sehore
Crop Zone :
Wheat Zone
Soil type :
Medium Black and Deep Black (Medium/ Heavy)
Agri Climatic Zone :
Vindhya Plateau
Schedule V Areas :
No Schedule V area
Basic Details on the District
1981 1991
Infant Mortality Rate 170 122
1991 2001
Life Expectancy (years) 50.8 54.5
1976-81 1984-90
Crude Birth Rate 36.8 41.2
Health
Janpad Panchayats 5
Gram Panchayats 450
Tehsils 5
Tribal Blocks 0
Legislative Assembly Seats 4
Administrative Information
0.5600.724
0.491 0.466
0.000
0.200
0.400
0.600
0.800
1.000
Graph on Human Development Index
1991 2001
Population 841358 1078769
Share of Madhya Pradesh Population 1.73% 1.79%
Urban Population 18.0% 18.0%
Population of Scheduled Castes (SC) 20.3% n.a.
Population of Scheduled Tribes (ST) 10.2% n.a.
Density of Population (per sq. kms.) 128 164
All 27.99 28.22
Rural n.a. 28.16
Urban n.a. 28.47
Decadal Growth (%) 1981-91 1991- 00 1991 1998-99
Per Capita Food Production (in kgs.) 390.56 427.10
1996 2000
FPS per lakh population 22.85 23
Food
S E H O R E
HDI Education Health Income
Demography
SEHORE

275
D I S T R I C T FA C T S H E E T S
1991 2001
Worker Participation Rate :
All 42.0% 41.9%
Rural 44.9% 45.0%
Urban 29.0% 28.1%
Share of Primary Sector (%) 81.4% n.a.
Share of Secondary Sector (%) 5.9% n.a.
Share of Tertiary Sector (%) 12.64% n.a.
Employment in Registered Industries (2000) 4259
Employment Rate of Growth (1991 to 2001) n.a. 28.0%
Total Employment in Farm Sector (%) 81.4% 81.26
Rural Employment in Non Farm Sector (%) 9.6% 9.7%
Agriculture Labour (%) 30.7% 36.2%
Employment
2001
Middle Schools per lakh population 44.1
High Schools per lakh population 14.6
Rural Population per Primary Health Centre 52020
Population Serviced Sub Health Centre 5818
2000
Road length per 100 sq. km. (1999) 13.7
Telephone per lakh population 1174
Population per Post Office (1994-95) 5599
Registered establishments under Factories Act (1997) 70
Per capita consumption of electricity (non industrial) in kwh 249.6
Infrastructure / Facilities
1991 2001
Life Expectancy of Females at Birth 52.4 57.4
Child Sex Ratio 915 934
Girl Child Mortality (birth to age 1 year) 117 n.a.
Girl Child Mortality (up to age 5 years) 195 n.a.
Total Fertility Rate 6.0 n.a.
Gender Ratio : All 898 908
Rural 901 910
Urban 884 900
General non SC/ ST Gender Ratio 894 n.a.
SC Gender Ratio 893 n.a.
ST Gender Ratio 932 n.a.
Workers Participation Rate - Female 32.4% 34.2%
2000
Female Enrolment Rate (Ages 6-14) 86.4%
Gender
Estimated Poverty Rate (1993-1994) 34.0%
Children as main workers (1991) 4.7%
Children as main and marginal workers (1991) 6.6%
Percentage of safe deliveries (1998-1999) 51.7
Percentage of children fully immunised (1998-1999) 39.7
Deprivation
1991 2001
Literacy (%) : All 40.4% 63.8%
Male 56.9% 78.1%
Female 22.0% 48.0%
Rural 34.7% 60.6%
Urban 65.8% 77.8%
Access to Education 2000
Enrolment Rate (Ages 6-14) 89.5%
Gross access ratio at primary level 100.0%
Habitations with Primary Schools 100.0%
Education
2000
Habitations with SDW facility 100.0%
Habitations without 40 lpd water availability 0.0%
Number of villages electrified 1008
Percentage of villages not connected with pucca roads 71.4
1991
Households without access to electricity, SDW and toilet facilities 22.47
Basic Amenities
1999
Per Capita Forest Area (in hectares) 0.127
Annual Rate of Afforestation (%) (1993-1999) -0.36
Major Non-Timber Forest Produce :
Tendu Leaves
Forests

D I S T R I C T FA C T S H E E T S
276
Land Use Classification in 1998-99
1978 1998
Net Area Sown (in 000' ha.) 347.5 376.7
Gross Cropped Area (in 000' ha.) 368.0 578.0
Double Cropped Area to Net Area Sown 5.9 53.4
Net Irrigated Area (in 000' ha.) 28.4 171.5
Gross Irrigated Area (in 000' ha.) 29.8 171.5
1992-93 1998-99
Agriculture Intensity 128.1 153.4
agriculture and Land Use Over
30 Years
1978 1998
Net Sown Area to Total Geographical Area 52.9% 57.4%
Gross Cropped Area to Total Area 56.1% 88.1%
Net Irrigated to Net Sown Area 8.2% 45.5%
Cropped Area under Food Grains 70.2% 48.1%
Yield of Food Grains (in kg. per hectare) 812 1578
Per Capita Food Production (in kgs.) 427.1
Land Use and Agriculture
2000
Credit-Deposit Ratio 73.62
Commercial Banks (per 1000 population) 0.05
Crop lending per hectare of cultivated land 794.8
Crop lending per hectare of irrigated land 2543.6
Credit
2001
Number of towns reporting slums 7
Urban population residing in slums 16.80%
Level of ground water development 57.91
Average annual rainfall (in mm) 1262.16
1995 2000
Percentage area under wasteland 20.8% 24.02%
Habitat
1991 1998-99
Cereals Per Capita (Kg) 288.0 301.1
Pulses Per Capita (Kg) 102.6 63.3
Oilseeds Per Capita (Kg) 216.7 247.6
Average Landholding (Ha) 4.1 3.46
Gross Irrigated Area ('000 Ha) 171.5
Fertiliser Consumption Per Hectare (Kg) 33.8 56.57
1993 1999
Cropping Intensity 128 153.4
Land Use and Agriculture
Lorenz Curve of Operational Holdings
Cumulative percentage of Land Holdings
0.00 0.25 0.50 0.75 1.00
1.00
0.80
0.60
0.40
0.20
0.00
Cum
ulat
ive
perc
enta
ge o
f Lan
d Ar
ea
Net AreaSown(57%)
Fallow Land (1%)
CultivableWasteland(2%)
OtherUncultivableLand excludingFallow Land(7%)
Land NotAvailable for
Cultivation(7%)
Forest (26%)
NA = not available

277
D I S T R I C T FA C T S H E E T S
Name of Block Total Net Sown Gross Per capita Agriculture Net irrigated area to Irrigated area to Level of GW Status of
Cropped Area Cropped Net Sown Area Intensity Net Sown area total cropped area Development ground water
Sehore 1516.15 71.9% 101.7% 0.55 141 36.65 25.94 92.329 Dark
Ichhawar 1024.15 46.7% 65.6% 0.51 141 29.06 20.79 47.182 White
Ashta 1343.54 72.6% 109.7% 0.5 151 33.92 22.45 92.037 Dark
Budni 896.32 53.2% 74.9% 0.58 141 49.42 35.68 15.035 White
Nasrullaganj 1064.16 65.1% 87.5% 0.62 134 36.87 27.49 25.922 White
Name of Block SC ST Road length Villages connected by all Population serviced per
per 100 sq.kms. weatherroads post office (1993-' 94)
Sehore 18.94 3.14 13.59 72.22 3956
Ichhawar 20.88 17.34 9.37 20.44 4693
Ashta 31.7 2.02 16.08 11.87 4316
Budni 13.23 17.39 16.18 22.92 2745
Nasrullaganj 15.9 29.98 9.77 21.82 4123
Population in 1991 Infrastructure (in percentage) (1991)
Sexr ratio Agriculture Worker labourers in participation
Name of Tehsil Total Rural Urban Urbanisation Total Rural Urban Female All Child workers (%) ratio
Sehore 355625 262510 93115 26.2% 64.4% 58.4% 80.1% 48.6% 906 923 32.85 39.28
Ashta 300063 252285 47778 15.9% 62.9% 60.6% 74.5% 45.3% 920 951 31.37 44.98
Ichhawar 132084 119396 12688 9.6% 55.8% 54.3% 70.0% 37.5% 912 932 38.25 45.33
Nasrullaganj 166624 149384 17240 10.3% 65.9% 64.4% 77.5% 52.4% 908 944 45.73 42.18
Budni 124373 100770 23603 19.0% 70.1% 67.8% 79.5% 57.5% 880 914 42.98 38.25
Population Literacy Select Gender EmploymentIndicators
Agriculture and Irrigation Status ofGround Water

D I S T R I C T FA C T S H E E T S
278
Human Development Index (HDI) 0.550
Rank in Madhya Pradesh : HDI 26
Gender Related Development Index (GDI) 0.563
Rank in Madhya Pradesh : GDI 18
Human Development Indices - 2002
Area (in sq. km) 8758
Total Inhabited Villages 1585
Total Habitations 2564
Forest Villages 36
Towns (Class I to IV) and Major Towns 4
Seoni
Crop Zone :
Wheat Rice Zone
Soil type :
Mixed Red and Black Soils (Medium)
Agri Climatic Zone :
Kymore Plateau and Satpura Hills
Schedule V Areas :
Lakhnadon, Ghansore and Kurai Tehsils/ Tribal Blocks
Basic Details on the District
1981 1991
Infant Mortality Rate 133 98
1991 2001
Life Expectancy (years) 55.8 59.9
1976-81 1984-90
Crude Birth Rate 33.3 35.7
Health
Janpad Panchayats 8
Gram Panchayats 598
Tehsils 6
Tribal Blocks 5
Legislative Assembly Seats 5
Administrative Information
0.5500.741
0.582
0.326
0.000
0.200
0.400
0.600
0.800
1.000
Graph on Human Development Index
1991 2001
Population 1000831 1165893
Share of Madhya Pradesh Population 2.06% 1.93%
Urban Population 9.5% 10.4%
Population of Scheduled Castes (SC) 10.8% n.a.
Population of Scheduled Tribes (ST) 37.0% n.a.
Density of Population (per sq. kms.) 114 133
All 23.60 16.49
Rural n.a. 15.36
Urban n.a. 27.31
Decadal Growth (%) 1981-91 1991- 00 1991 1998-99
Per Capita Food Production (in kgs.) 272.67 236.29
1996 2000
FPS per lakh population 32.57 32
Food
S E O N I
HDI Education Health Income
Demography
SEONI

279
D I S T R I C T FA C T S H E E T S
1991 2001
Worker Participation Rate :
All 49.2% 48.8%
Rural 51.4% 51.1%
Urban 27.9% 29.5%
Share of Primary Sector (%) 87.3% n.a.
Share of Secondary Sector (%) 3.4% n.a.
Share of Tertiary Sector (%) 9.27% n.a.
Employment in Registered Industries (2000) 1804
Employment Rate of Growth (1991 to 2001) n.a. 15.6%
Total Employment in Farm Sector (%) 87.3% 83.16
Rural Employment in Non Farm Sector (%) 8.3% 11.9%
Agriculture Labour (%) 33.8% 41.7%
Employment
2001
Middle Schools per lakh population 35.8
High Schools per lakh population 11.0
Rural Population per Primary Health Centre 36041
Population Serviced Sub Health Centre 3680
2000
Road length per 100 sq. km. (1999) 20.8
Telephone per lakh population 675
Population per Post Office (1994-95) 5668
Registered establishments under Factories Act (1997) 99
Per capita consumption of electricity (non industrial) in kwh 85.0
Infrastructure / Facilities
1991 2001
Life Expectancy of Females at Birth 55.6 60.2
Child Sex Ratio 972 979
Girl Child Mortality (birth to age 1 year) 118 n.a.
Girl Child Mortality (up to age 5 years) 148 n.a.
Total Fertility Rate 5.0 n.a.
Gender Ratio : All 974 982
Rural 980 988
Urban 920 935
General non SC/ ST Gender Ratio 957 n.a.
SC Gender Ratio 949 n.a.
ST Gender Ratio 1005 n.a.
Workers Participation Rate - Female 43.9% 43.5%
2000
Female Enrolment Rate (Ages 6-14) 89.3%
Gender
Estimated Poverty Rate (1993-1994) 36.8%
Children as main workers (1991) 8.2%
Children as main and marginal workers (1991) 10.7%
Percentage of safe deliveries (1998-1999) 42.6
Percentage of children fully immunised (1998-1999) 69
Deprivation
1991 2001
Literacy (%) : All 44.5% 65.9%
Male 57.5% 77.5%
Female 31.1% 54.1%
Rural 40.8% 63.4%
Urban 78.7% 86.1%
Access to Education 2000
Enrolment Rate (Ages 6-14) 90.6%
Gross access ratio at primary level 100.0%
Habitations with Primary Schools 100.0%
Education
2000
Habitations with SDW facility 100.0%
Habitations without 40 lpd water availability 0.2%
Number of villages electrified 1542
Percentage of villages not connected with pucca roads 75.0
1991
Households without access to electricity, SDW and toilet facilities 30.94
Basic Amenities
1999
Per Capita Forest Area (in hectares) 0.279
Annual Rate of Afforestation (%) (1993-1999) 0.91
Major Non-Timber Forest Produce :
Tendu Leaves, Harra
Forests

D I S T R I C T FA C T S H E E T S
280
Land Use Classification in 1998-99
1978 1998
Net Area Sown (in 000' ha.) 369.7 371.7
Gross Cropped Area (in 000' ha.) 395.9 463.6
Double Cropped Area to Net Area Sown 7.1 24.7
Net Irrigated Area (in 000' ha.) 22.6 73.3
Gross Irrigated Area (in 000' ha.) 25.8 73.3
1992-93 1998-99
Agriculture Intensity 114.3 124.7
agriculture and Land Use Over
30 Years
1978 1998
Net Sown Area to Total Geographical Area 42.5% 42.5%
Gross Cropped Area to Total Area 45.5% 53.0%
Net Irrigated to Net Sown Area 6.1% 19.7%
Cropped Area under Food Grains 83.4% 71.3%
Yield of Food Grains (in kg. per hectare) 434 808
Per Capita Food Production (in kgs.) 236.3
Land Use and Agriculture
2000
Credit-Deposit Ratio 48.02
Commercial Banks (per 1000 population) 0.03
Crop lending per hectare of cultivated land 519.0
Crop lending per hectare of irrigated land 4219.0
Credit
2001
Number of towns reporting slums 4
Urban population residing in slums 23.45%
Level of ground water development 15.03
Average annual rainfall (in mm) 1170.00
1995 2000
Percentage area under wasteland 20.2% 18.45%
Habitat
1991 1998-99
Cereals Per Capita (Kg) 228.8 200.9
Pulses Per Capita (Kg) 43.9 114.3
Oilseeds Per Capita (Kg) 70.5 48.3
Average Landholding (Ha) 3.0 2.65
Gross Irrigated Area ('000 Ha) 73.3
Fertiliser Consumption Per Hectare (Kg) 11.7 14.37
1993 1999
Cropping Intensity 114 124.7
Land Use and Agriculture
Lorenz Curve of Operational Holdings
Cumulative percentage of Land Holdings
0.00 0.25 0.50 0.75 1.00
1.00
0.80
0.60
0.40
0.20
0.00
Cum
ulat
ive
perc
enta
ge o
f Lan
d Ar
ea
Net AreaSown(43%)
Fallow Land (7%)
CultivableWasteland(4%)Other
UncultivableLand excludingFallow Land(3%)
Land NotAvailable for
Cultivation(6%)
Forest (37%)
NA = not available

281
D I S T R I C T FA C T S H E E T S
Name of Block Total Net Sown Gross Per capita Agriculture Net irrigated area to Irrigated area to Level of GW Status of
Cropped Area Cropped Net Sown Area Intensity Net Sown area total cropped area Development ground water
Seoni 1290.22 70.2% 92.8% 0.5 132 23.43 17.72 23.249 White
Barghat 555.76 69.4% 93.1% 0.26 134 34.04 25.36 40.769 White
Kurai 646.94 42.4% 50.5% 0.32 119 15.64 13.13 10.888 White
Keolari 693.77 66.9% 83.8% 0.39 125 23.62 18.87 11.353 White
Lakhnadon 1087.21 59.5% 65.7% 0.48 110 7.17 6.49 8.023 White
Chhapara 658.92 56.1% 67.4% 0.49 120 16.17 13.47 9.153 White
Kahnapas (Ghansaur) 765.8 52.4% 58.7% 0.4 112 3.54 3.16 23.815 White
Dhanaura 500.19 64.6% 74.3% 0.56 115 27.87 16.84 7.035 White
Name of Block SC ST Road length Villages connected by all Population serviced per
per 100 sq.kms. weatherroads post office (1993-' 94)
Seoni 16.09 26.04 21.16 97.56 3778
Barghat 7.09 23.54 37.48 65.94 4422
Kurai 8.22 47.96 12.68 24.46 2965
Keolari 11.2 28.92 36.03 102.73 3284
Lakhnadon 12.69 50.56 14.72 27.21 4604
Chhapara 10.41 50.79 32.02 17.86 5849
Kahnapas (Ghansaur) 7.36 59.32 12.27 16.81 4402
Dhanaura 9.73 57.04 10 23.68 4910
Population in 1991 Infrastructure (in percentage) (1991)
Sexr ratio Agriculture Worker labourers in participation
Name of Tehsil Total Rural Urban Urbanisation Total Rural Urban Female All Child workers (%) ratio
Lakhnadon 276343 262000 14343 5.2% 59.5% 58.2% 82.1% 45.9% 970 989 43.38 49.60
Seoni 296725 206926 89799 30.3% 70.7% 63.1% 87.3% 60.5% 953 940 33.11 43.07
Kurai 102973 102973 - - 62.6% 62.6% 0.0% 49.4% 1006 988 43.15 53.60
Keolari 135088 135088 - - 69.5% 69.5% 0.0% 58.8% 1000 1006 42.96 50.85
Barghat 169241 158816 10425 6.2% 70.5% 69.6% 83.7% 59.7% 1028 978 40.81 51.86
Ghansaur 185523 179393 6130 3.3% 62.2% 61.5% 82.9% 49.2% 984 1001 50.09 49.96
Population Literacy Select Gender EmploymentIndicators
Agriculture and Irrigation Status ofGround Water

D I S T R I C T FA C T S H E E T S
282
Human Development Index (HDI) 0.525
Rank in Madhya Pradesh : HDI 31
Gender Related Development Index (GDI) 0.535
Rank in Madhya Pradesh : GDI 27
Human Development Indices - 2002
Area (in sq. km) 9952
Total Inhabited Villages 1390
Total Habitations 5511
Forest Villages 0
Towns (Class I to IV) and Major Towns 16
Shahdol, Budhar Dhanpuri
Crop Zone :
Rice Zone
Soil type :
Red and Yellow, Medium Black and Skeletal Medium/ Light
Agri Climatic Zone :
Northern Hills
Schedule V Areas :
All Blocks of Pushprajgarh, Annuppur, Jaithhari, Kotma, Jaitpur, Sohapur andJaisingh Nagar Tehsils
Basic Details on the District
1981 1991
Infant Mortality Rate 155 110
1991 2001
Life Expectancy (years) 53.3 57.1
1976-81 1984-90
Crude Birth Rate 32.8 39.3
Health
Janpad Panchayats 9
Gram Panchayats 670
Tehsils 8
Tribal Blocks 9
Legislative Assembly Seats 6
Administrative Information
0.5250.700
0.5350.338
0.000
0.200
0.400
0.600
0.800
1.000
Graph on Human Development Index
1991 2001
Population 1323054 1572748
Share of Madhya Pradesh Population 2.72% 2.60%
Urban Population 22.5% 25.3%
Population of Scheduled Castes (SC) 7.5% n.a.
Population of Scheduled Tribes (ST) 46.3% n.a.
Density of Population (per sq. kms.) 133 158
All 28.96 18.87
Rural n.a. 14.62
Urban n.a. 33.49
Decadal Growth (%) 1981-91 1991- 00 1991 1998-99
Per Capita Food Production (in kgs.) 179.26 151.78
1996 2000
FPS per lakh population 42.59 46
Food
S H A H D O L
HDI Education Health Income
Demography
SHAHDOL

283
D I S T R I C T FA C T S H E E T S
1991 2001
Worker Participation Rate :
All 43.3% 43.7%
Rural 47.7% 49.0%
Urban 28.3% 28.3%
Share of Primary Sector (%) 84.4% n.a.
Share of Secondary Sector (%) 5.0% n.a.
Share of Tertiary Sector (%) 10.61% n.a.
Employment in Registered Industries (2000) 6775
Employment Rate of Growth (1991 to 2001) n.a. 19.9%
Total Employment in Farm Sector (%) 78.1% 73.6
Rural Employment in Non Farm Sector (%) 10.7% 13.9%
Agriculture Labour (%) 24.8% 34.5%
Employment
2001
Middle Schools per lakh population 31.3
High Schools per lakh population 10.7
Rural Population per Primary Health Centre 24992
Population Serviced Sub Health Centre 2844
2000
Road length per 100 sq. km. (1999) 24.8
Telephone per lakh population 739
Population per Post Office (1994-95) 6432
Registered establishments under Factories Act (1997) 144
Per capita consumption of electricity (non industrial) in kwh 161.0
Infrastructure / Facilities
1991 2001
Life Expectancy of Females at Birth 54.2 57.1
Child Sex Ratio 986 970
Girl Child Mortality (birth to age 1 year) 111 n.a.
Girl Child Mortality (up to age 5 years) 154 n.a.
Total Fertility Rate 5.3 n.a.
Gender Ratio : All 940 958
Rural 964 979
Urban 862 897
General non SC/ ST Gender Ratio 903 n.a.
SC Gender Ratio 936 n.a.
ST Gender Ratio 979 n.a.
Workers Participation Rate - Female 32.0% 34.1%
2000
Female Enrolment Rate (Ages 6-14) 93.5%
Gender
Estimated Poverty Rate (1993-1994) 33.4%
Children as main workers (1991) 5.6%
Children as main and marginal workers (1991) 7.9%
Percentage of safe deliveries (1998-1999) 39.7
Percentage of children fully immunised (1998-1999) 24.8
Deprivation
1991 2001
Literacy (%) : All 35.5% 57.8%
Male 48.9% 69.6%
Female 20.9% 45.4%
Rural 27.0% 50.7%
Urban 64.2% 77.4%
Access to Education 2000
Enrolment Rate (Ages 6-14) 94.6%
Gross access ratio at primary level 100.0%
Habitations with Primary Schools 100.0%
Education
2000
Habitations with SDW facility 98.8%
Habitations without 40 lpd water availability 1.2%
Number of villages electrified 1299
Percentage of villages not connected with pucca roads 65.1
1991
Households without access to electricity, SDW and toilet facilities 52.73
Basic Amenities
1999
Per Capita Forest Area (in hectares) 0.276
Annual Rate of Afforestation (%) (1993-1999) -0.73
Major Non-Timber Forest Produce :
Tendu Leaves, Harra
Forests

D I S T R I C T FA C T S H E E T S
284
Land Use Classification in 1998-99
1978 1998
Net Area Sown (in 000' ha.) 473.1 360.0
Gross Cropped Area (in 000' ha.) 548.2 427.0
Double Cropped Area to Net Area Sown 15.9 18.6
Net Irrigated Area (in 000' ha.) 5.3 17.9
Gross Irrigated Area (in 000' ha.) 5.5 17.9
1992-93 1998-99
Agriculture Intensity 113.4 118.6
agriculture and Land Use Over
30 Years
1978 1998
Net Sown Area to Total Geographical Area 34.1% 38.5%
Gross Cropped Area to Total Area 39.6% 45.6%
Net Irrigated to Net Sown Area 1.1% 5.0%
Cropped Area under Food Grains 85.8% 87.2%
Yield of Food Grains (in kg. per hectare) 126 620
Per Capita Food Production (in kgs.) 151.8
Land Use and Agriculture
2000
Credit-Deposit Ratio 19.28
Commercial Banks (per 1000 population) 0.03
Crop lending per hectare of cultivated land 1151.2
Crop lending per hectare of irrigated land 21518.8
Credit
2001
Number of towns reporting slums 16
Urban population residing in slums 3.73%
Level of ground water development 4.82
Average annual rainfall (in mm) 1326.00
1995 2000
Percentage area under wasteland 10.9% 7.22%
Habitat
1991 1998-99
Cereals Per Capita (Kg) 165.3 139.9
Pulses Per Capita (Kg) 14.0 26.3
Oilseeds Per Capita (Kg) 11.8 9.7
Average Landholding (Ha) 2.4 2.10
Gross Irrigated Area ('000 Ha) 17.9
Fertiliser Consumption Per Hectare (Kg) 6.8 9.01
1993 1999
Cropping Intensity 113 118.6
Land Use and Agriculture
Lorenz Curve of Operational Holdings
Cumulative percentage of Land Holdings
0.00 0.25 0.50 0.75 1.00
1.00
0.80
0.60
0.40
0.20
0.00
Cum
ulat
ive
perc
enta
ge o
f Lan
d Ar
ea
Net AreaSown(38%)
Fallow Land (10%)
CultivableWasteland(6%)
OtherUncultivableLand excludingFallow Land(2%)
Land NotAvailable for
Cultivation(11%)
Forest (33%)
NA = not available

285
D I S T R I C T FA C T S H E E T S
Name of Block Total Net Sown Gross Per capita Agriculture Net irrigated area to Irrigated area to Level of GW Status of
Cropped Area Cropped Net Sown Area Intensity Net Sown area total cropped area Development ground water
Pushprajgarh 1764.14 48.1% 62.3% 0.5 130 1.76 1.35 0.850 White
Sohagpur 777.01 44.1% 50.3% 0.27 114 9.33 8.11 7.263 White
Anuppur 541.9 51.7% 55.3% 0.32 107 1.46 1.36 1.872 White
Kotma 362.64 49.8% 51.6% 0.44 104 2.32 2.24 0.845 White
Jaithari 883.88 50.8% 58.5% 0.35 115 3.68 3.19 16.223 White
Pali (Gohparu) 914.49 29.2% 32.3% 0.34 110 4.68 4.24 1.573 White
Burhar 1234.08 73.9% 82.8% 0.66 112 1.21 1.08 1.240 White
Beohari 1019.89 34.5% 44.0% 0.27 128 16.92 13.26 9.502 White
Jaisinghnagar 1508.5 24.1% 26.6% 0.28 110 6.13 5.56 5.414 White
Name of Block SC ST Road length Villages connected by all Population serviced per
per 100 sq.kms. weatherroads post office (1993-' 94)
Pushprajgarh 2.74 78.32 8.05 85.39 4801
Sohagpur 5.38 54.74 14.41 68.59 5310
Anuppur 11.39 36.72 9.41 80 3514
Kotma 11.01 42.28 15.17 82.86 2949
Jaithari 7.37 49.19 10.63 18.66 4015
Pali (Gohparu) 6.93 64.16 6.44 83.5 3743
Burhar 8.45 58.66 7.45 71.2 4173
Beohari 7.87 43.01 21.86 25.79 4781
Jaisinghnagar 7.89 52.85 5.63 22.16 4591
Population in 1991 Infrastructure (in percentage) (1991)
Sexr ratio Agriculture Worker labourers in participation
Name of Tehsil Total Rural Urban Urbanisation Total Rural Urban Female All Child workers (%) ratio
Beohari 168459 137506 30953 18.4% 61.8% 58.9% 73.6% 46.9% 947 954 39.23 41.53
Sohagpur 473168 302633 170535 36.0% 57.9% 44.2% 80.7% 50.2% 943 907 33.48 41.53
Pushprajgarh 194632 187558 7074 3.6% 55.0% 54.1% 77.7% 41.0% 987 1075 26.29 56.74
Anuppur 276386 158752 117634 42.6% 64.5% 56.0% 75.5% 50.5% 944 979 30.88 34.26
Kotma 106160 49413 56747 53.5% 65.4% 53.1% 75.6% 51.4% 950 992 19.86 37.89
Jaithari 83949 76149 7800 9.3% 53.7% 51.5% 74.0% 38.8% 976 985 33.76 47.33
Jaitpur 108762 108762 - - 47.5% 47.5% 0.0% 32.6% 987 1007 45.94 51.92
Jaishinghnagar 161232 153840 7392 4.6% 48.7% 47.8% 66.5% 34.5% 975 998 48.41 49.58
Population Literacy Select Gender EmploymentIndicators
Agriculture and Irrigation Status ofGround Water

D I S T R I C T FA C T S H E E T S
286
Human Development Index (HDI) 0.617
Rank in Madhya Pradesh : HDI 9
Gender Related Development Index (GDI) 0.627
Rank in Madhya Pradesh : GDI 3
Human Development Indices - 2002
Area (in sq. km) 6196
Total Inhabited Villages 1068
Total Habitations 1268
Forest Villages 0
Towns (Class I to IV) and Major Towns 12
Shajapur, Shujalpur
Crop Zone :
Cotton Jowar
Soil type :
Medium Black (Medium)
Agri Climatic Zone :
Malwa Plateau
Schedule V Areas :
No Schedule V area
Basic Details on the District
1981 1991
Infant Mortality Rate 160 105
1991 2001
Life Expectancy (years) 54.3 58.3
1976-81 1984-90
Crude Birth Rate 34.0 36.6
Health
Janpad Panchayats 8
Gram Panchayats 509
Tehsils 8
Tribal Blocks 0
Legislative Assembly Seats 5
Administrative Information
0.6170.792
0.555 0.505
0.000
0.200
0.400
0.600
0.800
1.000
Graph on Human Development Index
1991 2001
Population 1033248 1290230
Share of Madhya Pradesh Population 2.13% 2.14%
Urban Population 17.7% 18.6%
Population of Scheduled Castes (SC) 22.3% n.a.
Population of Scheduled Tribes (ST) 2.4% n.a.
Density of Population (per sq. kms.) 167 208
All 22.97 24.87
Rural n.a. 23.58
Urban n.a. 30.87
Decadal Growth (%) 1981-91 1991- 00 1991 1998-99
Per Capita Food Production (in kgs.) 391.87 404.81
1996 2000
FPS per lakh population 26.82 29
Food
S H A J A P U R
HDI Education Health Income
Demography
SHAJAPUR

287
D I S T R I C T FA C T S H E E T S
1991 2001
Worker Participation Rate :
All 44.7% 48.8%
Rural 47.6% 52.2%
Urban 31.0% 33.9%
Share of Primary Sector (%) 82.9% n.a.
Share of Secondary Sector (%) 5.8% n.a.
Share of Tertiary Sector (%) 11.31% n.a.
Employment in Registered Industries (2000) 6550
Employment Rate of Growth (1991 to 2001) n.a. 36.5%
Total Employment in Farm Sector (%) 82.8% 81.21
Rural Employment in Non Farm Sector (%) 9.6% 11.1%
Agriculture Labour (%) 30.8% 32.0%
Employment
2001
Middle Schools per lakh population 36.2
High Schools per lakh population 9.9
Rural Population per Primary Health Centre 50042
Population Serviced Sub Health Centre 6075
2000
Road length per 100 sq. km. (1999) 23.3
Telephone per lakh population 958
Population per Post Office (1994-95) 6296
Registered establishments under Factories Act (1997) 214
Per capita consumption of electricity (non industrial) in kwh 694.1
Infrastructure / Facilities
1991 2001
Life Expectancy of Females at Birth 55.0 59.6
Child Sex Ratio 928 936
Girl Child Mortality (birth to age 1 year) 118 n.a.
Girl Child Mortality (up to age 5 years) 184 n.a.
Total Fertility Rate 5.1 n.a.
Gender Ratio : All 918 927
Rural 920 929
Urban 910 921
General non SC/ ST Gender Ratio 921 n.a.
SC Gender Ratio 913 n.a.
ST Gender Ratio 889 n.a.
Workers Participation Rate - Female 34.7% 42.0%
2000
Female Enrolment Rate (Ages 6-14) 93.7%
Gender
Estimated Poverty Rate (1993-1994) 21.3%
Children as main workers (1991) 6.0%
Children as main and marginal workers (1991) 8.4%
Percentage of safe deliveries (1998-1999) 47.3
Percentage of children fully immunised (1998-1999) 63.2
Deprivation
1991 2001
Literacy (%) : All 39.2% 71.1%
Male 57.0% 83.7%
Female 19.8% 57.6%
Rural 33.7% 69.4%
Urban 64.4% 78.5%
Access to Education 2000
Enrolment Rate (Ages 6-14) 95.3%
Gross access ratio at primary level 100.0%
Habitations with Primary Schools 100.0%
Education
2000
Habitations with SDW facility 100.0%
Habitations without 40 lpd water availability 0.0%
Number of villages electrified 1065
Percentage of villages not connected with pucca roads 74.2
1991
Households without access to electricity, SDW and toilet facilities 19.78
Basic Amenities
1999
Per Capita Forest Area (in hectares) 0.000
Annual Rate of Afforestation (%) (1993-1999) 0.00
Major Non-Timber Forest Produce :
Tendu Leaves, Harra, Sal Seed
Forests

D I S T R I C T FA C T S H E E T S
288
Land Use Classification in 1998-99
1978 1998
Net Area Sown (in 000' ha.) 411.2 442.3
Gross Cropped Area (in 000' ha.) 459.4 720.4
Double Cropped Area to Net Area Sown 11.7 62.9
Net Irrigated Area (in 000' ha.) 39.8 215.9
Gross Irrigated Area (in 000' ha.) 41.3 216.1
1992-93 1998-99
Agriculture Intensity 129.5 162.9
agriculture and Land Use Over
30 Years
1978 1998
Net Sown Area to Total Geographical Area 66.6% 71.6%
Gross Cropped Area to Total Area 74.4% 116.6%
Net Irrigated to Net Sown Area 9.7% 48.8%
Cropped Area under Food Grains 62.4% 45.5%
Yield of Food Grains (in kg. per hectare) 657 1524
Per Capita Food Production (in kgs.) 404.8
Land Use and Agriculture
2000
Credit-Deposit Ratio 81.34
Commercial Banks (per 1000 population) 0.04
Crop lending per hectare of cultivated land 823.3
Crop lending per hectare of irrigated land 2908.1
Credit
2001
Number of towns reporting slums 12
Urban population residing in slums 0.00%
Level of ground water development 101.39
Average annual rainfall (in mm) 977.00
1995 2000
Percentage area under wasteland 64.2% 35.05%
Habitat
1991 1998-99
Cereals Per Capita (Kg) 309.0 278.3
Pulses Per Capita (Kg) 82.8 14.7
Oilseeds Per Capita (Kg) 156.3 292.8
Average Landholding (Ha) 3.7 3.15
Gross Irrigated Area ('000 Ha) 216.1
Fertiliser Consumption Per Hectare (Kg) 43.8 47.55
1993 1999
Cropping Intensity 130 162.9
Land Use and Agriculture
Lorenz Curve of Operational Holdings
Cumulative percentage of Land Holdings
0.00 0.25 0.50 0.75 1.00
1.00
0.80
0.60
0.40
0.20
0.00
Cum
ulat
ive
perc
enta
ge o
f Lan
d Ar
ea
Net AreaSown(72%)
Fallow Land (1%)
CultivableWasteland(3%)
OtherUncultivableLand excludingFallow Land(10%)
Land NotAvailable for
Cultivation(13%)
Forest (1%)
NA = not available

289
D I S T R I C T FA C T S H E E T S
Name of Block Total Net Sown Gross Per capita Agriculture Net irrigated area to Irrigated area to Level of GW Status of
Cropped Area Cropped Net Sown Area Intensity Net Sown area total cropped area Development ground water
Shajapur 882.63 65.7% 91.5% 0.39 139 36.33 26.27 67.284 Grey
Moman Barodia 904.06 76.5% 104.7% 0.48 137 30.53 22.46 129.496 Over Exploited
Agar 720.65 56.4% 79.2% 0.5 140 33.33 23.82 88.691 Dark
Badod 735.75 63.4% 83.8% 0.656 132 23.74 17.97 121.260 Over Exploited
Susner 642.9 64.3% 90.0% 0.52 140 36.18 26.38 110.620 Over Exploited
Nalkheda 561.61 72.4% 96.2% 0.6 133 30.58 23.23 93.892 Dark
Shujalpur 714.26 95.9% 139.8% 0.68 146 37.6 25.83 127.696 Over Exploited
Kala Pipal 887.72 75.2% 117.4% 0.45 156 47.01 30.13 90.285 Dark
Name of Block SC ST Road length Villages connected by all Population serviced per
per 100 sq.kms. weatherroads post office (1993-' 94)
Shajapur 27.35 2 21.07 34.29 4333
Moman Barodia 26.38 5.74 1.44 37.97 3756
Agar 29.97 1.01 16.51 71.74 3694
Badod 24.52 0.05 15.49 21.58 6409
Susner 24.04 2.94 18.2 20.72 6159
Nalkheda 24.22 7.64 11.57 23.16 4259
Shujalpur 23.78 1.27 25.62 24.19 2796
Kala Pipal 18.43 1.33 18.81 19.83 4894
Population in 1991 Infrastructure (in percentage) (1991)
Sexr ratio Agriculture Worker labourers in participation
Name of Tehsil Total Rural Urban Urbanisation Total Rural Urban Female All Child workers (%) ratio
Susner 122715 95701 27014 22.0% 66.1% 62.2% 79.6% 51.2% 940 930 31.37 50.29
Agar 140585 100733 39852 28.3% 62.6% 56.2% 78.1% 46.8% 932 953 30.47 48.14
Shajapur 254293 178072 76221 30.0% 76.5% 74.2% 81.8% 64.8% 921 920 32.75 43.68
Shujalpur 204825 141103 63722 31.1% 80.5% 81.3% 78.9% 70.4% 917 925 27.73 48.16
Moman Barodia 179534 179534 - - 71.1% 71.1% 0.0% 56.4% 929 945 39.99 50.98
Badod 114061 102297 11764 10.3% 54.6% 52.1% 76.9% 36.6% 940 941 27.80 51.84
Nalkheda 102554 81787 20767 20.2% 65.7% 65.6% 65.8% 50.9% 937 978 32.90 51.90
Kala Pipal 171663 171663 - - 77.2% 77.2% 0.0% 64.8% 921 929 31.27 50.74
Population Literacy Select Gender EmploymentIndicators
Agriculture and Irrigation Status ofGround Water

D I S T R I C T FA C T S H E E T S
290
Human Development Index (HDI) 0.514
Rank in Madhya Pradesh : HDI 33
Gender Related Development Index (GDI) 0.569
Rank in Madhya Pradesh : GDI 17
Human Development Indices - 2002
Area (in sq. km) 6606
Total Inhabited Villages 533
Total Habitations 795
Forest Villages 9
Towns (Class I to IV) and Major Towns 3
Sheopur
Crop Zone :
Wheat Jowar
Soil type :
Alluvial (Light)
Agri Climatic Zone :
Gird Region
Schedule V Areas :
Karahal Tehsil/ Tribal Block
Basic Details on the District
1981 1991
Infant Mortality Rate n.a. n.a.
1991 2001
Life Expectancy (years) 55.3 57.4
1976-81 1984-90
Crude Birth Rate n.a. n.a.
Health
Janpad Panchayats 3
Gram Panchayats 219
Tehsils 3
Tribal Blocks 0
Legislative Assembly Seats 2
Administrative Information
0.514 0.589 0.5400.412
0.000
0.200
0.400
0.600
0.800
1.000
Graph on Human Development Index
1991 2001
Population 431480 559715
Share of Madhya Pradesh Population 0.89% 0.93%
Urban Population 14.4% 15.8%
Population of Scheduled Castes (SC) 16.6% n.a.
Population of Scheduled Tribes (ST) 20.1% n.a.
Density of Population (per sq. kms.) 65 85
All 33.32 29.72
Rural n.a. 27.63
Urban n.a. 42.08
Decadal Growth (%) 1981-91 1991- 00 1991 1998-99
Per Capita Food Production (in kgs.) 229.75 468.63
1996 2000
FPS per lakh population n.a. 25
Food
S H E O P U R
HDI Education Health Income
Demography
SHEOPUR

291
D I S T R I C T FA C T S H E E T S
1991 2001
Worker Participation Rate :
All 39.7% 41.1%
Rural 41.9% 43.4%
Urban 27.3% 28.7%
Share of Primary Sector (%) 86.8% n.a.
Share of Secondary Sector (%) 3.6% n.a.
Share of Tertiary Sector (%) 9.54% n.a.
Employment in Registered Industries (2000) n.a.
Employment Rate of Growth (1991 to 2001) n.a. 34.1%
Total Employment in Farm Sector (%) 86.8% 81.15
Rural Employment in Non Farm Sector (%) 6.0% 11.0%
Agriculture Labour (%) 14.5% 27.4%
Employment
2001
Middle Schools per lakh population 22.0
High Schools per lakh population 6.4
Rural Population per Primary Health Centre 58892
Population Serviced Sub Health Centre 5294
2000
Road length per 100 sq. km. (1999) 10.3
Telephone per lakh population 535
Population per Post Office (1994-95) n.a.
Registered establishments under Factories Act (1997) n.a.
Per capita consumption of electricity (non industrial) in kwh 85.8
Infrastructure / Facilities
1991 2001
Life Expectancy of Females at Birth 53.0 54
Child Sex Ratio 941 931.2
Girl Child Mortality (birth to age 1 year) n.a. n.a.
Girl Child Mortality (up to age 5 years) n.a. n.a.
Total Fertility Rate n.a. n.a.
Gender Ratio : All 880 893
Rural 880 896
Urban 880 878
General non SC/ ST Gender Ratio 870 n.a.
SC Gender Ratio 858 n.a.
ST Gender Ratio 932 n.a.
Workers Participation Rate - Female 26.5% 31.6%
2000
Female Enrolment Rate (Ages 6-14) 77.5%
Gender
Estimated Poverty Rate (1993-1994) n.a.
Children as main workers (1991) n.a.
Children as main and marginal workers (1991) n.a.
Percentage of safe deliveries (1998-1999) n.a.
Percentage of children fully immunised (1998-1999) n.a.
Deprivation
1991 2001
Literacy (%) : All 27.6% 46.6%
Male 40.7% 62.2%
Female 12.3% 29.0%
Rural 22.6% 42.9%
Urban 55.8% 66.0%
Access to Education 2000
Enrolment Rate (Ages 6-14) 83.5%
Gross access ratio at primary level 100.0%
Habitations with Primary Schools 100.0%
Education
2000
Habitations with SDW facility 99.7%
Habitations without 40 lpd water availability 0.3%
Number of villages electrified 478
Percentage of villages not connected with pucca roads 43.9
1991
Households without access to electricity, SDW and toilet facilities n.a.
Basic Amenities
1999
Per Capita Forest Area (in hectares) n.a.
Annual Rate of Afforestation (%) (1993-1999) n.a.
Major Non-Timber Forest Produce :
Tendu Leaves
Forests

D I S T R I C T FA C T S H E E T S
292
Land Use Classification in 1998-99
1978 1998
Net Area Sown (in 000' ha.) n.a. 151.9
Gross Cropped Area (in 000' ha.) n.a. 205.2
Double Cropped Area to Net Area Sown n.a. 35.2
Net Irrigated Area (in 000' ha.) n.a. 98.4
Gross Irrigated Area (in 000' ha.) n.a. 103.9
1992-93 1998-99
Agriculture Intensity n.a. 135.2
Agriculture and Land Use over
30 Years
1978 1998
Net Sown Area to Total Geographical Area Included in Morena 22.8%
Gross Cropped Area to Total Area n.a. 30.8%
Net Irrigated to Net Sown Area n.a. 64.8%
Cropped Area under Food Grains n.a. 45.8%
Yield of Food Grains (in kg. per hectare) n.a. 2652
Per Capita Food Production (in kgs.) 468.6
Land Use and Agriculture
2000
Credit-Deposit Ratio 77.62
Commercial Banks (per 1000 population) 0.02
Crop lending per hectare of cultivated land n.a.
Crop lending per hectare of irrigated land n.a.
Credit
2001
Number of towns reporting slums 3
Urban population residing in slums 0.00%
Level of ground water development 3.77
Average annual rainfall (in mm) 723.70
1995 2000
Percentage area under wasteland n.a. n.a.
Habitat
1991 1998-99
Cereals Per Capita (Kg) n.a. 443.2
Pulses Per Capita (Kg) n.a. 293.8
Oilseeds Per Capita (Kg) n.a. 239.4
Average Landholding (Ha) n.a. n.a.
Gross Irrigated Area ('000 Ha) 103.9
Fertiliser Consumption Per Hectare (Kg) n.a. 55.08
1993 1999
Cropping Intensity n.a. 135.2
Land Use and Agriculture
Lorenz Curve of Operational Holdings
Cumulative percentage of Land Holdings
0.00 0.25 0.50 0.75 1.00
1.00
0.80
0.60
0.40
0.20
0.00
Cum
ulat
ive
perc
enta
ge o
f Lan
d Ar
ea
Net AreaSown(23%)Fallow
Land (1%)
CultivableWasteland(6%)
OtherUncultivableLand excludingFallow Land(6%)
Land NotAvailable for
Cultivation(21%)
Forest (43%)
NA = not available

293
D I S T R I C T FA C T S H E E T S
Name of Block SC ST Road length Villages connected by all Population serviced per
per 100 sq.kms. weatherroads post office (1993-' 94)
Vijaypur 18.39 18.41 6.03 31.11 4275
Sheopurkalan 20.43 11.71 20.76 10.71 5536
Karahal 6.61 58.2 8.81 14.29 5797
Population in 1991 Infrastructure (in percentage) (1991)
Sex ratio Agriculture Worker labourers in participation
Name of Tehsil Total Rural Urban Urbanisation Total Rural Urban Female All Child workers (%) ratio
Sheopurkala 285311 211286 74025 25.9% 49.6% 43.9% 65.5% 32.7% 913 921 28.38 38.17
Vijaypur 187494 172939 14555 7.8% 49.7% 48.1% 68.3% 29.5% 854 912 16.80 43.49
Karahal 86910 86910 - - 29.3% 29.3% 0.0% 14.9% 918 998 46.76 45.53
Population Literacy Select Gender EmploymentIndicators
% Net % Gross
Name of Block Total Net Sown Gross Per capita Agriculture irrigated area to irrigated area to Level of GW Status of
Cropped Area Cropped Net Sown Area Intensity Net Sown area total cropped area Development ground water
Vijaypur 2736.08 16.0% 17.6% 0.33 110 36.47 33.35 16.640 White
Sheopurkalan 1426.01 65.2% 71.4% 0.56 110 75.71 71.84 4.540 White
Karahal 2303.7 10.8% 11.2% 0.36 104 23.83 23.81 0.110 White
Agriculture and Irrigation Status ofGround Water

D I S T R I C T FA C T S H E E T S
294
Human Development Index (HDI) 0.473
Rank in Madhya Pradesh : HDI 40
Gender Related Development Index (GDI) 0.512
Rank in Madhya Pradesh : GDI 32
Human Development Indices - 2002
Area (in sq. km) 10278
Total Inhabited Villages 1326
Total Habitations 2062
Forest Villages 15
Towns (Class I to IV) and Major Towns 7
Shivpuri
Crop Zone :
Wheat Jowar
Soil type :
Alluvial (Light) (except Picchore and Karera Tehsil), Mixed Red and Black (Medium)(Picchore and Karera Tehsil)
Agri Climatic Zone :
Gird Region (except Picchore and Karera Tehsil), Bundelkhand Region (Picchoreand Karera Tehsil)
Schedule V Areas :
No Schedule V area
Basic Details on the District
1981 1991
Infant Mortality Rate 178 164
1991 2001
Life Expectancy (years) 46.1 47.3
1976-81 1984-90
Crude Birth Rate 39.7 42.6
Health
Janpad Panchayats 8
Gram Panchayats 605
Tehsils 7
Tribal Blocks 0
Legislative Assembly Seats 5
Administrative Information
0.473
0.703
0.372 0.343
0.000
0.200
0.400
0.600
0.800
1.000
Graph on Human Development Index
1991 2001
Population 1132977 1440666
Share of Madhya Pradesh Population 2.33% 2.39%
Urban Population 15.2% 16.6%
Population of Scheduled Castes (SC) 19.4% n.a.
Population of Scheduled Tribes (ST) 11.3% n.a.
Density of Population (per sq. kms.) 110 140
All 30.84 27.16
Rural n.a. 24.99
Urban n.a. 39.29
Decadal Growth (%) 1981-91 1991- 00 1991 1998-99
Per Capita Food Production (in kgs.) 315.43 294.38
1996 2000
FPS per lakh population 20.49 22
Food
S H I V P U R I
HDI Education Health Income
Demography
SHIVPURI

295
D I S T R I C T FA C T S H E E T S
1991 2001
Worker Participation Rate :
All 42.5% 45.3%
Rural 45.0% 48.8%
Urban 28.1% 28.0%
Share of Primary Sector (%) 84.6% n.a.
Share of Secondary Sector (%) 3.8% n.a.
Share of Tertiary Sector (%) 11.65% n.a.
Employment in Registered Industries (2000) 1787
Employment Rate of Growth (1991 to 2001) n.a. 35.7%
Total Employment in Farm Sector (%) 83.5% 82.9
Rural Employment in Non Farm Sector (%) 8.3% 9.2%
Agriculture Labour (%) 12.3% 17.7%
Employment
2001
Middle Schools per lakh population 37.1
High Schools per lakh population 8.8
Rural Population per Primary Health Centre 92384
Population Serviced Sub Health Centre 6035
2000
Road length per 100 sq. km. (1999) 13.7
Telephone per lakh population 943
Population per Post Office (1994-95) 5704
Registered establishments under Factories Act (1997) 48
Per capita consumption of electricity (non industrial) in kwh 326.0
Infrastructure / Facilities
1991 2001
Life Expectancy of Females at Birth 42.9 43.8
Child Sex Ratio 914 908
Girl Child Mortality (birth to age 1 year) 139 n.a.
Girl Child Mortality (up to age 5 years) 234 n.a.
Total Fertility Rate 6.3 n.a.
Gender Ratio : All 849 858
Rural 848 855
Urban 853 874
General non SC/ ST Gender Ratio 836 n.a.
SC Gender Ratio 840 n.a.
ST Gender Ratio 950 n.a.
Workers Participation Rate - Female 30.4% 37.3%
2000
Female Enrolment Rate (Ages 6-14) 88.8%
Gender
Estimated Poverty Rate (1993-1994) 16.1%
Children as main workers (1991) 5.6%
Children as main and marginal workers (1991) 8.0%
Percentage of safe deliveries (1998-1999) 39.3
Percentage of children fully immunised (1998-1999) 38.8
Deprivation
1991 2001
Literacy (%) : All 33.0% 59.5%
Male 47.5% 74.8%
Female 15.6% 41.5%
Rural 27.1% 56.1%
Urban 65.1% 75.8%
Access to Education 2000
Enrolment Rate (Ages 6-14) 91.5%
Gross access ratio at primary level 100.0%
Habitations with Primary Schools 100.0%
Education
2000
Habitations with SDW facility 100.0%
Habitations without 40 lpd water availability 0.0%
Number of villages electrified 1300
Percentage of villages not connected with pucca roads 69.5
1991
Households without access to electricity, SDW and toilet facilities 29.18
Basic Amenities
1999
Per Capita Forest Area (in hectares) 0.176
Annual Rate of Afforestation (%) (1993-1999) -0.62
Major Non-Timber Forest Produce :
Tendu Leaves, Aonla, Baheda, Satawar, Giloy, Bel, Arjun Bark, Katehri, Gudmar,
Safed Musli, Malkangni, Gokhru, Nagarnotha, Adusa, Bhringraj, Palash Flower.
Forests

D I S T R I C T FA C T S H E E T S
296
Land Use Classification in 1998-99
1978 1998
Net Area Sown (in 000' ha.) 354.2 413.5
Gross Cropped Area (in 000' ha.) 397.7 532.3
Double Cropped Area to Net Area Sown 12.3 28.7
Net Irrigated Area (in 000' ha.) 70.4 166.8
Gross Irrigated Area (in 000' ha.) 71.1 169.6
1992-93 1998-99
Agriculture Intensity 117.8 128.7
Agriculture and Land Use over
30 Years
1978 1998
Net Sown Area to Total Geographical Area 34.8% 40.6%
Gross Cropped Area to Total Area 39.1% 52.3%
Net Irrigated to Net Sown Area 19.9% 40.3%
Cropped Area under Food Grains 71.5% 57.3%
Yield of Food Grains (in kg. per hectare) 1031 1326
Per Capita Food Production (in kgs.) 294.4
Land Use and Agriculture
2000
Credit-Deposit Ratio 45.99
Commercial Banks (per 1000 population) 0.02
Crop lending per hectare of cultivated land 543.4
Crop lending per hectare of irrigated land 1748.6
Credit
2001
Number of towns reporting slums 7
Urban population residing in slums 20.96%
Level of ground water development 51.14
Average annual rainfall (in mm) 871.00
1995 2000
Percentage area under wasteland 17.2% 20.64%
Habitat
1991 1998-99
Cereals Per Capita (Kg) 272.6 202.7
Pulses Per Capita (Kg) 52.8 9.8
Oilseeds Per Capita (Kg) 61.4 102.0
Average Landholding (Ha) 3.0 2.63
Gross Irrigated Area ('000 Ha) 169.6
Fertiliser Consumption Per Hectare (Kg) 18.6 27.38
1993 1999
Cropping Intensity 118 128.7
Land Use and Agriculture
Lorenz Curve of Operational Holdings
Cumulative percentage of Land Holdings
0.00 0.25 0.50 0.75 1.00
1.00
0.80
0.60
0.40
0.20
0.00
Cum
ulat
ive
perc
enta
ge o
f Lan
d Ar
ea
Net AreaSown(40%)
Fallow Land (4%)
CultivableWasteland(9%)
OtherUncultivableLand excludingFallow Land(5%)
Land NotAvailable for
Cultivation(10%)
Forest (32%)
NA = not available

297
D I S T R I C T FA C T S H E E T S
& Net % Gross
Name of Block Total Net Sown Gross Per capita Agriculture irrigated area to irrigated area to Level of GW Status of
Cropped Area Cropped Net Sown Area Intensity net sown area total cropped area Development ground water
Shivpuri 1687.99 29.9% 34.1% 0.46 114 30.8 27.22 30.140 White
Kolaras 981.66 50.8% 57.8% 0.57 114 19.62 7.92 61.175 White
Karera 848.74 55.5% 73.6% 0.35 133 57.36 43.26 68.768 Grey
Narwar 834.18 52.8% 64.1% 0.34 121 56.49 48.79 75.379 Grey
Pohri 1566.81 39.9% 43.8% 0.46 110 15.63 15.62 30.110 White
Pichhore 908.66 41.5% 58.6% 0.32 141 26.43 31.76 62.187 White
Kahniyadhana 922.1 55.6% 76.0% 0.36 137 45.87 33.62 62.159 White
Badarwas 875.63 75.6% 82.1% 0.64 109 18.19 16.81 39.174 White
Agriculture and Irrigation Status ofGround Water
Name of Block SC ST Road length Villages connected by all Population serviced per
per 100 sq.kms. weatherroads post office (1993-' 94)
Shivpuri 20.11 19.1 9.18 38.30 3151
Kolaras 22.72 15.81 11.71 11.76 5130
Karera 22.27 5.39 10.01 20 4354
Narwar 22.4 2.69 11.39 14.6 4145
Pohri 19.86 15.84 6.45 30.77 4835
Pichhore 17.44 14.03 15.3 47.58 4229
Kahniyadhana 16.68 14.58 16.59 21.69 4898
Badarwas 18.15 17.72 11.08 27.61 4338
Population in 1991 Infrastructure (in percentage) (1991)
Sex ratio Agriculture Worker labourers in participation
Name of Tehsil Total Rural Urban Urbanisation Total Rural Urban Female All Child workers (%) ratio
Pohri 168838 168838 - - 54.8% 54.8% 0.0% 32.5% 856 918 17.62 49.34
Shivpuri 281123 134264 146859 52.2% 64.7% 50.0% 77.3% 49.2% 864 900 16.30 35.84
Karera 195814 172323 23491 12.0% 61.2% 59.0% 77.0% 44.3% 847 902 10.49 49.37
Kolaras 279292 253210 26082 9.3% 56.5% 54.9% 71.7% 37.5% 870 935 30.68 43.27
Pichhore 162506 147609 14897 9.2% 57.1% 55.2% 75.0% 39.3% 862 901 16.35 43.79
Narwar 163332 147584 15748 9.6% 68.6% 68.5% 70.1% 52.4% 828 875 12.98 50.77
Khaniyadhana 189761 177166 12595 6.6% 52.7% 51.3% 71.7% 33.7% 866 916 15.54 51.14
Population Literacy Select Gender EmploymentIndicators

D I S T R I C T FA C T S H E E T S
298
Human Development Index (HDI) 0.555
Rank in Madhya Pradesh : HDI 25
Gender Related Development Index (GDI) 0.570
Rank in Madhya Pradesh : GDI 16
Human Development Indices - 2002
Area (in sq. km) 10526
Total Inhabited Villages 1822
Total Habitations 5933
Forest Villages 12
Towns (Class I to IV) and Major Towns 6
Singrauli, Sidhi
Crop Zone :
Rice Zone
Soil type :
Red and Yellow, Medium Black and Skeletal Medium/ Light
Agri Climatic Zone :
Northern Hills
Schedule V Areas :
Kusmi Tehsil/ Tribal Blocks
Basic Details on the District
1981 1991
Infant Mortality Rate 147 105
1991 2001
Life Expectancy (years) 54.2 58.0
1976-81 1984-90
Crude Birth Rate 38.3 44.3
Health
Janpad Panchayats 8
Gram Panchayats 716
Tehsils 9
Tribal Blocks 1
Legislative Assembly Seats 6
Administrative Information
0.555 0.634 0.550 0.481
0.000
0.200
0.400
0.600
0.800
1.000
Graph on Human Development Index
1991 2001
Population 1373434 1830553
Share of Madhya Pradesh Population 2.83% 3.03%
Urban Population 6.5% 14.3%
Population of Scheduled Castes (SC) 11.4% n.a.
Population of Scheduled Tribes (ST) 30.4% n.a.
Density of Population (per sq. kms.) 130 174
All 38.67 33.28
Rural n.a. 22.15
Urban n.a. 194.2
Decadal Growth (%) 1981-91 1991- 00 1991 1998-99
Per Capita Food Production (in kgs.) 196.01 177.74
1996 2000
FPS per lakh population 42.18 38
Food
S I D H I
HDI Education Health Income
Demography
SIDHI

299
D I S T R I C T FA C T S H E E T S
1991 2001
Worker Participation Rate :
All 43.0% 41.4%
Rural 43.8% 43.4%
Urban 31.1% 28.9%
Share of Primary Sector (%) 87.5% n.a.
Share of Secondary Sector (%) 4.3% n.a.
Share of Tertiary Sector (%) 8.19% n.a.
Employment in Registered Industries (2000) 5072
Employment Rate of Growth (1991 to 2001) n.a. 28.2%
Total Employment in Farm Sector (%) 85.3% 82.22
Rural Employment in Non Farm Sector (%) 10.8% 11.1%
Agriculture Labour (%) 24.1% 31.4%
Employment
2001
Middle Schools per lakh population 40.8
High Schools per lakh population 17.5
Rural Population per Primary Health Centre 37361
Population Serviced Sub Health Centre 5196
2000
Road length per 100 sq. km. (1999) 32.1
Telephone per lakh population 385
Population per Post Office (1994-95) 7965
Registered establishments under Factories Act (1997) 48
Per capita consumption of electricity (non industrial) in kwh 46.4
Infrastructure / Facilities
1991 2001
Life Expectancy of Females at Birth 53.9 56.1
Child Sex Ratio 977 950
Girl Child Mortality (birth to age 1 year) 106 n.a.
Girl Child Mortality (up to age 5 years) 163 n.a.
Total Fertility Rate 6.7 n.a.
Gender Ratio : All 922 932
Rural 934 947
Urban 767 851
General non SC/ ST Gender Ratio 906 n.a.
SC Gender Ratio 940 n.a.
ST Gender Ratio 945 n.a.
Workers Participation Rate - Female 33.8% 34.2%
2000
Female Enrolment Rate (Ages 6-14) 79.8%
Gender
Estimated Poverty Rate (1993-1994) 36.4%
Children as main workers (1991) 5.6%
Children as main and marginal workers (1991) 8.5%
Percentage of safe deliveries (1998-1999) 10.4
Percentage of children fully immunised (1998-1999) 40.8
Deprivation
1991 2001
Literacy (%) : All 29.2% 52.8%
Male 43.2% 68.0%
Female 13.6% 36.4%
Rural 26.5% 49.3%
Urban 66.4% 73.1%
Access to Education 2000
Enrolment Rate (Ages 6-14) 84.5%
Gross access ratio at primary level 100.0%
Habitations with Primary Schools 100.0%
Education
2000
Habitations with SDW facility 99.5%
Habitations without 40 lpd water availability 0.5%
Number of villages electrified 1804
Percentage of villages not connected with pucca roads 56.9
1991
Households without access to electricity, SDW and toilet facilities 56.52
Basic Amenities
1999
Per Capita Forest Area (in hectares) 0.233
Annual Rate of Afforestation (%) (1993-1999) 0.45
Major Non-Timber Forest Produce :
Tendu Leaves, Aonla, Mahua Flower, Mahua Guthli, Achar Guthli, Imli
Forests

D I S T R I C T FA C T S H E E T S
300
Land Use Classification in 1998-99
1978 1998
Net Area Sown (in 000' ha.) 344.1 377.1
Gross Cropped Area (in 000' ha.) 456.7 508.5
Double Cropped Area to Net Area Sown 32.7 34.9
Net Irrigated Area (in 000' ha.) 7.7 50.2
Gross Irrigated Area (in 000' ha.) 7.8 50.2
1992-93 1998-99
Agriculture Intensity 125.2 134.9
agriculture and Land Use Over
30 Years
1978 1998
Net Sown Area to Total Geographical Area 33.1% 36.3%
Gross Cropped Area to Total Area 43.9% 48.9%
Net Irrigated to Net Sown Area 2.2% 13.3%
Cropped Area under Food Grains 87.9% 88.8%
Yield of Food Grains (in kg. per hectare) 303 681
Per Capita Food Production (in kgs.) 177.7
Land Use and Agriculture
2000
Credit-Deposit Ratio 20.64
Commercial Banks (per 1000 population) 0.03
Crop lending per hectare of cultivated land 220.3
Crop lending per hectare of irrigated land 2263.6
Credit
2001
Number of towns reporting slums 6
Urban population residing in slums 1.20%
Level of ground water development 8.71
Average annual rainfall (in mm) 1248.00
1995 2000
Percentage area under wasteland 7.3% 13.00%
Habitat
1991 1998-99
Cereals Per Capita (Kg) 159.0 150.6
Pulses Per Capita (Kg) 37.0 72.8
Oilseeds Per Capita (Kg) 9.4 6.9
Average Landholding (Ha) 4.1 2.02
Gross Irrigated Area ('000 Ha) 50.2
Fertiliser Consumption Per Hectare (Kg) 9.2 15.47
1993 1999
Cropping Intensity 125 134.9
Land Use and Agriculture
Lorenz Curve of Operational Holdings
Cumulative percentage of Land Holdings
0.00 0.25 0.50 0.75 1.00
1.00
0.80
0.60
0.40
0.20
0.00
Cum
ulat
ive
perc
enta
ge o
f Lan
d Ar
ea
Net AreaSown(36%)
Fallow Land (6%)
CultivableWasteland(6%)
OtherUncultivableLand excludingFallow Land(0%)
Land NotAvailable for
Cultivation(10%)
Forest (42%)
NA = not available

301
D I S T R I C T FA C T S H E E T S
Name of Block Total Net Sown Gross Per capita Agriculture Net irrigated area to Irrigated area to Level of GW Status of
Cropped Area Cropped Net Sown Area Intensity Net Sown area total cropped area Development ground water
Sidhi 1011.64 65.0% 67.2% 0.35 103 5.82 19.67 4.321 White
Sihawal 744.47 54.3% 71.6% 0.24 132 10.67 8.09 14.374 White
Kusmi 1437.6 12.5% 14.2% 0.35 114 9.22 8.08 1.076 White
Majholi 734.6 53.3% 65.4% 0.38 123 10.62 8.65 9.362 White
Rampur Naekin 778.87 51.6% 65.9% 0.23 128 10.3 8.05 10.793 White
Deosar 1112.95 51.9% 62.0% 0.33 119 7.99 6.69 4.182 White
Chitrangi 1876.58 29.3% 45.2% 0.28 154 4.35 2.83 5.438 White
Baidhan 1040.67 56.9% 73.3% 0.25 129 9.08 7.04 15.449 White
Name of Block SC ST Road length Villages connected by all Population serviced per
per 100 sq.kms. weatherroads post office (1993-' 94)
Sidhi 12.8 31.05 35.09 72.95 5217
Sihawal 10.31 19.07 12.09 71.92 4917
Kusmi 6.09 64.71 6.12 99.24 4262
Majholi 7.31 33.4 23.14 88.46 6008
Rampur Naekin 11.71 21.14 41.86 71.22 5561
Deosar 12.34 44.28 26.15 81.4 9706
Chitrangi 10.54 43.28 12.47 19.66 8428
Baidhan 14.53 23.14 17.39 36.16 7296
Population in 1991 Infrastructure (in percentage) (1991)
Sexr ratio Agriculture Worker labourers in participation
Name of Tehsil Total Rural Urban Urbanisation Total Rural Urban Female All Child workers (%) ratio
Gopadbanas 231518 185854 45664 19.7% 59.5% 53.8% 81.1% 45.3% 914 926 30.88 40.04
Deosar 243817 243817 - - 43.1% 43.1% 0.0% 25.7% 951 984 30.92 46.24
Singrauli 418124 232544 185580 44.4% 57.0% 44.6% 71.6% 38.4% 906 942 17.39 37.70
Sinhawal 216361 216361 - - 54.7% 54.7% 0.0% 38.7% 965 956 36.28 39.14
Kusmi 65086 65086 - - 43.9% 43.9% 0.0% 29.3% 958 1008 38.02 47.03
Majholi 128836 128836 - - 53.6% 53.6% 0.0% 38.5% 941 937 38.37 42.60
Rampur Naekin 166346 156445 9901 6.0% 56.3% 55.7% 65.7% 42.1% 945 953 44.11 41.66
Chitrangi 258409 251266 7143 2.8% 43.4% 42.2% 80.8% 26.0% 924 940 40.41 39.24
Churhat 102056 88954 13102 12.8% 61.1% 60.1% 67.5% 46.4% 945 942 31.75 44.41
Population Literacy Select Gender EmploymentIndicators
Agriculture and Irrigation Status ofGround Water

D I S T R I C T FA C T S H E E T S
302
Human Development Index (HDI) 0.468
Rank in Madhya Pradesh : HDI 42
Gender Related Development Index (GDI) 0.486
Rank in Madhya Pradesh : GDI 38
Human Development Indices - 2002
Area (in sq. km) 5048
Total Inhabited Villages 863
Total Habitations 1799
Forest Villages 8
Towns (Class I to IV) and Major Towns 12
Tikamgarh
Crop Zone :
Wheat Jowar
Soil type :
Mixed Red and Black (Medium)
Agri Climatic Zone :
Bundelkhand Region
Schedule V Areas :
No Schedule V area
Basic Details on the District
1981 1991
Infant Mortality Rate 182 132
1991 2001
Life Expectancy (years) 48.7 52.8
1976-81 1984-90
Crude Birth Rate 40.4 42.1
Health
Janpad Panchayats 6
Gram Panchayats 443
Tehsils 6
Tribal Blocks 0
Legislative Assembly Seats 4
Administrative Information
0.4680.646
0.4630.296
0.000
0.200
0.400
0.600
0.800
1.000
Graph on Human Development Index
1991 2001
Population 940829 1203160
Share of Madhya Pradesh Population 1.94% 1.99%
Urban Population 16.9% 17.7%
Population of Scheduled Castes (SC) 22.8% n.a.
Population of Scheduled Tribes (ST) 4.1% n.a.
Density of Population (per sq. kms.) 186 238
All 27.66 27.88
Rural n.a. 26.73
Urban n.a. 33.56
Decadal Growth (%) 1981-91 1991- 00 1991 1998-99
Per Capita Food Production (in kgs.) 379.77 308.36
1996 2000
FPS per lakh population 40.61 41
Food
T I K A M G A R H
HDI Education Health Income
Demography
TIKAMGARH

303
D I S T R I C T FA C T S H E E T S
1991 2001
Worker Participation Rate :
All 42.8% 47.1%
Rural 45.2% 49.5%
Urban 30.9% 35.9%
Share of Primary Sector (%) 86.4% n.a.
Share of Secondary Sector (%) 4.6% n.a.
Share of Tertiary Sector (%) 8.99% n.a.
Employment in Registered Industries (2000) 921
Employment Rate of Growth (1991 to 2001) n.a. 40.7%
Total Employment in Farm Sector (%) 86.3% 81.53
Rural Employment in Non Farm Sector (%) 8.0% 12.1%
Agriculture Labour (%) 11.7% 16.8%
Employment
2001
Middle Schools per lakh population 30.9
High Schools per lakh population 11.7
Rural Population per Primary Health Centre 55044
Population Serviced Sub Health Centre 6351
2000
Road length per 100 sq. km. (1999) 28.3
Telephone per lakh population 401
Population per Post Office (1994-95) 5705
Registered establishments under Factories Act (1997) 32
Per capita consumption of electricity (non industrial) in kwh 132.6
Infrastructure / Facilities
1991 2001
Life Expectancy of Females at Birth 44.4 48.1
Child Sex Ratio 918 918
Girl Child Mortality (birth to age 1 year) 153 n.a.
Girl Child Mortality (up to age 5 years) 205 n.a.
Total Fertility Rate 6.1 n.a.
Gender Ratio : All 871 886
Rural 868 883
Urban 887 900
General non SC/ ST Gender Ratio 872 n.a.
SC Gender Ratio 856 n.a.
ST Gender Ratio 934 n.a.
Workers Participation Rate - Female 33.0% 41.2%
2000
Female Enrolment Rate (Ages 6-14) 78.2%
Gender
Estimated Poverty Rate (1993-1994) 21.3%
Children as main workers (1991) 5.0%
Children as main and marginal workers (1991) 7.7%
Percentage of safe deliveries (1998-1999) 29.5
Percentage of children fully immunised (1998-1999) 17.3
Deprivation
1991 2001
Literacy (%) : All 24.8% 55.8%
Male 47.5% 68.8%
Female 20.0% 41.0%
Rural 30.6% 53.0%
Urban 55.4% 68.5%
Access to Education 2000
Enrolment Rate (Ages 6-14) 91.4%
Gross access ratio at primary level 100.0%
Habitations with Primary Schools 100.0%
Education
2000
Habitations with SDW facility 91.7%
Habitations without 40 lpd water availability 8.4%
Number of villages electrified 862
Percentage of villages not connected with pucca roads 59.1
1991
Households without access to electricity, SDW and toilet facilities 56.20
Basic Amenities
1999
Per Capita Forest Area (in hectares) 0.020
Annual Rate of Afforestation (%) (1993-1999) -1.84
Major Non-Timber Forest Produce :
Tendu Leaves, Ber, Mahua Flower, Mahua Guthli, Charota Seeds, Nagarmotha,Palash Gum
Forests

D I S T R I C T FA C T S H E E T S
304
Land Use Classification in 1998-99
1978 1998
Net Area Sown (in 000' ha.) 224.1 263.5
Gross Cropped Area (in 000' ha.) 284.6 398.6
Double Cropped Area to Net Area Sown 27.0 51.3
Net Irrigated Area (in 000' ha.) 88.2 178.0
Gross Irrigated Area (in 000' ha.) 90.6 216.4
1992-93 1998-99
Agriculture Intensity 140.9 151.3
agriculture and Land Use Over
30 Years
1978 1998
Net Sown Area to Total Geographical Area 44.5% 52.3%
Gross Cropped Area to Total Area 56.5% 79.1%
Net Irrigated to Net Sown Area 39.4% 67.5%
Cropped Area under Food Grains 79.8% 62.3%
Yield of Food Grains (in kg. per hectare) 1196 1421
Per Capita Food Production (in kgs.) 308.4
Land Use and Agriculture
2000
Credit-Deposit Ratio 41.2
Commercial Banks (per 1000 population) 0.01
Crop lending per hectare of cultivated land 688.0
Crop lending per hectare of irrigated land 1603.9
Credit
2001
Number of towns reporting slums 12
Urban population residing in slums 14.12%
Level of ground water development 63.18
Average annual rainfall (in mm) 1101.00
1995 2000
Percentage area under wasteland 27.7% 41.64%
Habitat
1991 1998-99
Cereals Per Capita (Kg) 334.0 253.0
Pulses Per Capita (Kg) 45.8 40.9
Oilseeds Per Capita (Kg) 36.2 104.5
Average Landholding (Ha) 1.9 1.69
Gross Irrigated Area ('000 Ha) 216.4
Fertiliser Consumption Per Hectare (Kg) 39.4 56.21
1993 1999
Cropping Intensity 141 151.3
Land Use and Agriculture
Lorenz Curve of Operational Holdings
Cumulative percentage of Land Holdings
0.00 0.25 0.50 0.75 1.00
1.00
0.80
0.60
0.40
0.20
0.00
Cum
ulat
ive
perc
enta
ge o
f Lan
d Ar
ea
Net AreaSown(53%)
Fallow Land (5%)
CultivableWasteland(4%)
OtherUncultivableLand excludingFallow Land(8%)
Land NotAvailable for
Cultivation(17%)
Forest (13%)
NA = not available

305
D I S T R I C T FA C T S H E E T S
Name of Block Total Net Sown Gross Per capita Agriculture Net irrigated area to Irrigated area to Level of GW Status of
Cropped Area Cropped Net Sown Area Intensity Net Sown area total cropped area Development ground water
Tikamgarh 809.33 59.9% 76.7% 0.4 128 43.89 49.61 58.513 White
Baldeogarh 821.84 55.4% 84.8% 0.33 153 56.09 43.29 63.350 White
Niwari 581.28 83.4% 106.8% 0.38 128 43.89 40.5 66.350 Grey
Prithvipur 512.81 90.3% 120.0% 0.45 133 45.57 42.98 72.973 Grey
Jatara 910.44 79.5% 103.4% 0.44 130 38.24 35.84 59.341 White
Palera 754.76 82.8% 103.9% 0.49 125 39.51 33.12 63.245 White
Name of Block SC ST Road length Villages connected by all Population serviced per
per 100 sq.kms. weatherroads post office (1993-' 94)
Tikamgarh 22.62 4.85 31.75 33.13 3382
Baldeogarh 19.65 4.87 27.13 34.44 3681
Niwari 26.03 3.64 23.4 26.52 3326
Prithvipur 20.65 5.64 25.74 22.05 4473
Jatara 23.41 4.58 30.42 27.27 5197
Palera 27.97 4.14 20.14 31.34 3858
Population in 1991 Infrastructure (in percentage) (1991)
Sexr ratio Agriculture Worker labourers in participation
Name of Tehsil Total Rural Urban Urbanisation Total Rural Urban Female All Child workers (%) ratio
Niwari 184662 149012 35650 19.3% 62.4% 61.6% 65.4% 46.3% 883 890 19.01 46.27
Jatara 239960 213699 26261 10.9% 51.4% 49.7% 65.3% 36.3% 884 925 18.42 48.62
Tikamgarh 249357 164375 84982 34.1% 61.4% 52.9% 76.7% 48.3% 897 934 17.48 41.61
Baldeogarh 193189 173192 19997 10.4% 47.8% 46.1% 62.3% 33.2% 884 926 17.36 49.57
Prithvipur 159527 128688 30839 19.3% 55.4% 54.7% 58.3% 40.0% 887 921 11.41 49.49
Palera 176465 161819 14646 8.3% 55.9% 55.2% 63.7% 40.5% 880 903 16.20 48.67
Population Literacy Select Gender EmploymentIndicators
Agriculture and Irrigation Status ofGround Water

D I S T R I C T FA C T S H E E T S
306
Human Development Index (HDI) 0.632
Rank in Madhya Pradesh : HDI 4
Gender Related Development Index (GDI) 0.615
Rank in Madhya Pradesh : GDI 6
Human Development Indices - 2002
Area (in sq. km) 6091
Total Inhabited Villages 1092
Total Habitations 1166
Forest Villages 0
Towns (Class I to IV) and Major Towns 7
Ujjain, Nagda
Crop Zone :
Cotton Jowar
Soil type :
Medium Black (Medium)
Agri Climatic Zone :
Malwa Plateau
Schedule V Areas :
No Schedule V area
Basic Details on the District
1981 1991
Infant Mortality Rate 121 99
1991 2001
Life Expectancy (years) 56.9 59.8
1976-81 1984-90
Crude Birth Rate 34.8 32.1
Health
Janpad Panchayats 6
Gram Panchayats 517
Tehsils 7
Tribal Blocks 0
Legislative Assembly Seats 7
Administrative Information
0.6320.763
0.580 0.555
0.000
0.200
0.400
0.600
0.800
1.000
Graph on Human Development Index
1991 2001
Population 1383086 1709885
Share of Madhya Pradesh Population 2.85% 2.83%
Urban Population 39.5% 38.7%
Population of Scheduled Castes (SC) 24.6% n.a.
Population of Scheduled Tribes (ST) 2.1% n.a.
Density of Population (per sq. kms.) 227 281
All 23.82 23.63
Rural n.a. 25.25
Urban n.a. 21.15
Decadal Growth (%) 1981-91 1991- 00 1991 1998-99
Per Capita Food Production (in kgs.) 380.38 363.79
1996 2000
FPS per lakh population 34.02 31
Food
U J J A I N
HDI Education Health Income
Demography
UJJAIN

307
D I S T R I C T FA C T S H E E T S
1991 2001
Worker Participation Rate :
All 39.8% 44.1%
Rural 46.9% 52.4%
Urban 28.9% 31.0%
Share of Primary Sector (%) 65.9% n.a.
Share of Secondary Sector (%) 13.6% n.a.
Share of Tertiary Sector (%) 20.47% n.a.
Employment in Registered Industries (2000) 33961
Employment Rate of Growth (1991 to 2001) n.a. 37.0%
Total Employment in Farm Sector (%) 65.8% 67.77
Rural Employment in Non Farm Sector (%) 9.8% 10.3%
Agriculture Labour (%) 23.8% 25.3%
Employment
2001
Middle Schools per lakh population 37.7
High Schools per lakh population 10.3
Rural Population per Primary Health Centre 49884
Population Serviced Sub Health Centre 6162
2000
Road length per 100 sq. km. (1999) 18.3
Telephone per lakh population 2235
Population per Post Office (1994-95) 7570
Registered establishments under Factories Act (1997) 428
Per capita consumption of electricity (non industrial) in kwh 818.3
Infrastructure / Facilities
1991 2001
Life Expectancy of Females at Birth 55.2 57.2
Child Sex Ratio 946 933
Girl Child Mortality (birth to age 1 year) 74 n.a.
Girl Child Mortality (up to age 5 years) 156 n.a.
Total Fertility Rate 4.2 n.a.
Gender Ratio : All 929 940
Rural 936 949
Urban 918 926
General non SC/ ST Gender Ratio 929 n.a.
SC Gender Ratio 930 n.a.
ST Gender Ratio 915 n.a.
Workers Participation Rate - Female 26.2% 33.7%
2000
Female Enrolment Rate (Ages 6-14) 81.6%
Gender
Estimated Poverty Rate (1993-1994) 20.1%
Children as main workers (1991) 5.0%
Children as main and marginal workers (1991) 6.6%
Percentage of safe deliveries (1998-1999) 68.2
Percentage of children fully immunised (1998-1999) 57.6
Deprivation
1991 2001
Literacy (%) : All 49.1% 71.2%
Male 64.3% 83.7%
Female 32.6% 57.9%
Rural 33.5% 64.3%
Urban 72.1% 81.5%
Access to Education 2000
Enrolment Rate (Ages 6-14) 87.1%
Gross access ratio at primary level 100.0%
Habitations with Primary Schools 100.0%
Education
2000
Habitations with SDW facility 100.0%
Habitations without 40 lpd water availability 0.0%
Number of villages electrified 1092
Percentage of villages not connected with pucca roads 76.2
1991
Households without access to electricity, SDW and toilet facilities 9.00
Basic Amenities
1999
Per Capita Forest Area (in hectares) 0.000
Annual Rate of Afforestation (%) (1993-1999) 0.00
Major Non-Timber Forest Produce :
Tendu Leaves
Forests

D I S T R I C T FA C T S H E E T S
308
Land Use Classification in 1998-99
1978 1998
Net Area Sown (in 000' ha.) 456.1 480.2
Gross Cropped Area (in 000' ha.) 513.3 819.6
Double Cropped Area to Net Area Sown 12.5 70.7
Net Irrigated Area (in 000' ha.) 44.2 261.3
Gross Irrigated Area (in 000' ha.) 45.2 261.5
1992-93 1998-99
Agriculture Intensity 143.5 170.7
agriculture and Land Use Over
30 Years
1978 1998
Net Sown Area to Total Geographical Area 74.6% 78.7%
Gross Cropped Area to Total Area 83.9% 134.4%
Net Irrigated to Net Sown Area 9.7% 54.4%
Cropped Area under Food Grains 76.6% 40.0%
Yield of Food Grains (in kg. per hectare) 648 1817
Per Capita Food Production (in kgs.) 363.8
Land Use and Agriculture
2000
Credit-Deposit Ratio 57.03
Commercial Banks (per 1000 population) 0.06
Crop lending per hectare of cultivated land 900.4
Crop lending per hectare of irrigated land 2906.3
Credit
2001
Number of towns reporting slums 7
Urban population residing in slums 21.90%
Level of ground water development 98.48
Average annual rainfall (in mm) 935.00
1995 2000
Percentage area under wasteland 19.0% 18.05%
Habitat
1991 1998-99
Cereals Per Capita (Kg) 296.7 305.9
Pulses Per Capita (Kg) 83.7 38.7
Oilseeds Per Capita (Kg) 207.0 350.4
Average Landholding (Ha) 4.3 3.62
Gross Irrigated Area ('000 Ha) 261.5
Fertiliser Consumption Per Hectare (Kg) 54.2 53.56
1993 1999
Cropping Intensity 143 170.7
Land Use and Agriculture
Lorenz Curve of Operational Holdings
Cumulative percentage of Land Holdings
0.00 0.25 0.50 0.75 1.00
1.00
0.80
0.60
0.40
0.20
0.00
Cum
ulat
ive
perc
enta
ge o
f Lan
d Ar
ea
Net AreaSown(78%)
Fallow Land (1%)
CultivableWasteland(2%)
OtherUncultivableLand excludingFallow Land(11%)
Land NotAvailable for
Cultivation(7%)
Forest (1%)
NA = not available

309
D I S T R I C T FA C T S H E E T S
Name of Block Total Net Sown Gross Per capita Agriculture Net irrigated area to Irrigated area to Level of GW Status of
Cropped Area Cropped Net Sown Area Intensity Net Sown area total cropped area Development ground water
Ujjain 671.28 84.8% 125.6% 0.53 148 45.49 30.84 143.260 Over Exploited
Ghatiya 612.55 81.8% 116.6% 0.55 143 39.29 27.57 103.468 Over Exploited
Badnagar 1225.3 83.6% 128.4% 0.64 154 42.63 27.83 174.852 Over Exploited
Khachrod 1233.11 78.6% 120.6% 0.57 153 33.32 21.75 71.701 Grey
Mahidpur 1133.57 77.5% 106.4% 0.59 137 28.09 20.48 54.824 White
Tarana 1040.03 77.7% 106.7% 0.51 137 29.39 21.39 79.679 Grey
Name of Block SC ST Road length Villages connected by all Population serviced per
per 100 sq.kms. weatherroads post office (1993-' 94)
Ujjain 33.3 0.73 29.05 76.47 3567
Ghatiya 30.94 0.94 13.71 50 5677
Badnagar 22.77 6.61 14.53 76.34 4307
Khachrod 32.49 3.07 5.68 21.36 5147
Mahidpur 29.49 0.93 10.59 22.62 4834
Tarana 33.63 1.86 9.71 70.39 4984
Population in 1991 Infrastructure (in percentage) (1991)
Sexr ratio Agriculture Worker labourers in participation
Name of Tehsil Total Rural Urban Urbanisation Total Rural Urban Female All Child workers (%) ratio
Khachrod 141421 111524 29897 21.1% 62.4% 58.6% 76.1% 44.9% 962 926 25.80 51.21
Mahidpur 217246 181483 35763 16.5% 50.8% 46.0% 75.0% 32.0% 940 954 26.32 52.47
Tarana 217181 195726 21455 9.9% 71.7% 71.0% 78.4% 56.8% 946 945 38.56 48.54
Badnagar 236642 202579 34063 14.4% 86.1% 86.1% 86.2% 79.0% 948 947 33.02 47.74
Ujjain 563636 132967 430669 76.4% 78.0% 61.7% 82.9% 67.8% 927 911 13.61 34.76
Ghatiya 118459 118459 - - 58.8% 58.8% 0.0% 39.9% 942 937 32.07 53.52
Nagda 215300 104820 110480 51.3% 68.5% 56.9% 79.0% 53.1% 941 935 19.04 41.85
Population Literacy Select Gender EmploymentIndicators
Agriculture and Irrigation Status ofGround Water

D I S T R I C T FA C T S H E E T S
310
Human Development Index (HDI) 0.492
Rank in Madhya Pradesh : HDI 37
Gender Related Development Index (GDI) 0.508
Rank in Madhya Pradesh : GDI 35
Human Development Indices - 2002
Area (in sq. km) 4076
Total Inhabited Villages 646
Total Habitations 1823
Forest Villages 2
Towns (Class I to IV) and Major Towns 4
none
Crop Zone :
Rice Zone
Soil type :
Red and Yellow, Medium Black and Skeletal Medium/ Light
Agri Climatic Zone :
Northern Hills
Schedule V Areas :
Pali 2 Tribal Block of Pali Tehsil
Basic Details on the District
1981 1991
Infant Mortality Rate n.a. n.a.
1991 2001
Life Expectancy (years) 53.3 57.1
1976-81 1984-90
Crude Birth Rate n.a. n.a.
Health
Janpad Panchayats 2
Gram Panchayats 223
Tehsils 2
Tribal Blocks 0
Legislative Assembly Seats 2
Administrative Information
0.4920.695
0.535
0.245
0.000
0.200
0.400
0.600
0.800
1.000
Graph on Human Development Index
1991 2001
Population 420815 515851
Share of Madhya Pradesh Population 0.87% 0.85%
Urban Population 16.6% 16.1%
Population of Scheduled Castes (SC) 8.2% n.a.
Population of Scheduled Tribes (ST) 46.3% n.a.
Density of Population (per sq. kms.) 103 127
All 31.83 22.58
Rural n.a. 23.39
Urban n.a. 18.55
Decadal Growth (%) 1981-91 1991- 00 1991 1998-99
Per Capita Food Production (in kgs.) 179.26 158.50
1996 2000
FPS per lakh population n.a. 39
Food
U M A R I A
HDI Education Health Income
Demography
UMARIA
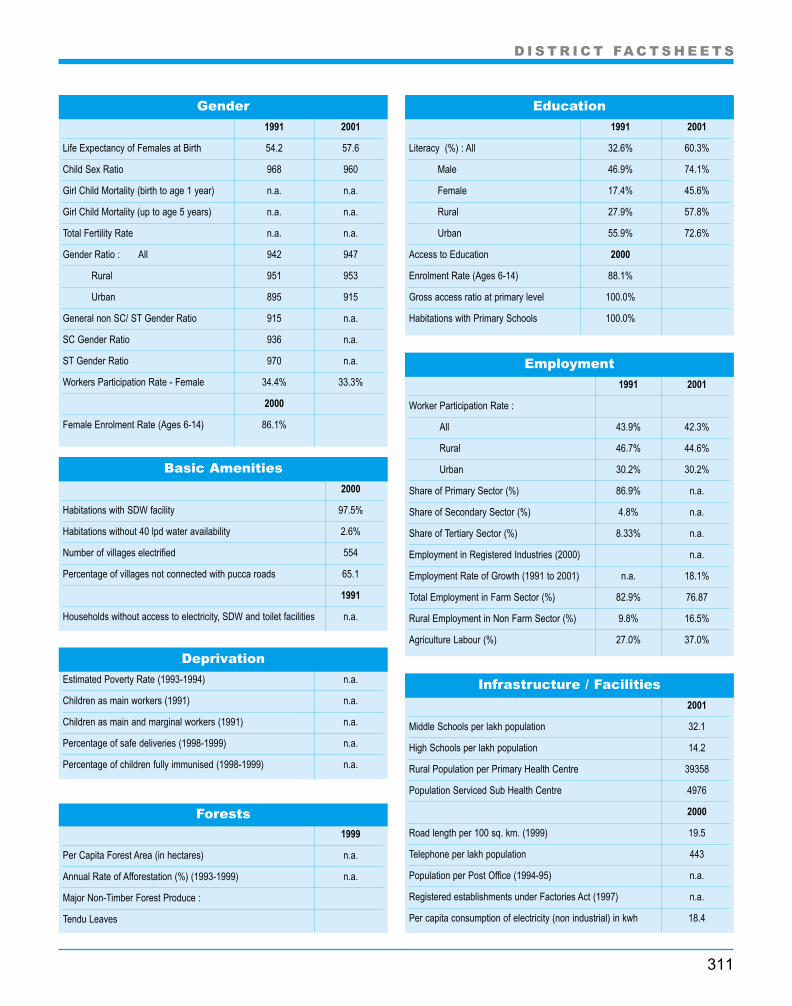
311
D I S T R I C T FA C T S H E E T S
1991 2001
Worker Participation Rate :
All 43.9% 42.3%
Rural 46.7% 44.6%
Urban 30.2% 30.2%
Share of Primary Sector (%) 86.9% n.a.
Share of Secondary Sector (%) 4.8% n.a.
Share of Tertiary Sector (%) 8.33% n.a.
Employment in Registered Industries (2000) n.a.
Employment Rate of Growth (1991 to 2001) n.a. 18.1%
Total Employment in Farm Sector (%) 82.9% 76.87
Rural Employment in Non Farm Sector (%) 9.8% 16.5%
Agriculture Labour (%) 27.0% 37.0%
Employment
2001
Middle Schools per lakh population 32.1
High Schools per lakh population 14.2
Rural Population per Primary Health Centre 39358
Population Serviced Sub Health Centre 4976
2000
Road length per 100 sq. km. (1999) 19.5
Telephone per lakh population 443
Population per Post Office (1994-95) n.a.
Registered establishments under Factories Act (1997) n.a.
Per capita consumption of electricity (non industrial) in kwh 18.4
Infrastructure / Facilities
1991 2001
Life Expectancy of Females at Birth 54.2 57.6
Child Sex Ratio 968 960
Girl Child Mortality (birth to age 1 year) n.a. n.a.
Girl Child Mortality (up to age 5 years) n.a. n.a.
Total Fertility Rate n.a. n.a.
Gender Ratio : All 942 947
Rural 951 953
Urban 895 915
General non SC/ ST Gender Ratio 915 n.a.
SC Gender Ratio 936 n.a.
ST Gender Ratio 970 n.a.
Workers Participation Rate - Female 34.4% 33.3%
2000
Female Enrolment Rate (Ages 6-14) 86.1%
Gender
Estimated Poverty Rate (1993-1994) n.a.
Children as main workers (1991) n.a.
Children as main and marginal workers (1991) n.a.
Percentage of safe deliveries (1998-1999) n.a.
Percentage of children fully immunised (1998-1999) n.a.
Deprivation
1991 2001
Literacy (%) : All 32.6% 60.3%
Male 46.9% 74.1%
Female 17.4% 45.6%
Rural 27.9% 57.8%
Urban 55.9% 72.6%
Access to Education 2000
Enrolment Rate (Ages 6-14) 88.1%
Gross access ratio at primary level 100.0%
Habitations with Primary Schools 100.0%
Education
2000
Habitations with SDW facility 97.5%
Habitations without 40 lpd water availability 2.6%
Number of villages electrified 554
Percentage of villages not connected with pucca roads 65.1
1991
Households without access to electricity, SDW and toilet facilities n.a.
Basic Amenities
1999
Per Capita Forest Area (in hectares) n.a.
Annual Rate of Afforestation (%) (1993-1999) n.a.
Major Non-Timber Forest Produce :
Tendu Leaves
Forests

D I S T R I C T FA C T S H E E T S
312
Land Use Classification in 1998-99
1978 1998
Net Area Sown (in 000' ha.) n.a. 110.9
Gross Cropped Area (in 000' ha.) n.a. 142.0
Double Cropped Area to Net Area Sown n.a. 28.0
Net Irrigated Area (in 000' ha.) n.a. 16.3
Gross Irrigated Area (in 000' ha.) n.a. 16.3
1992-93 1998-99
Agriculture Intensity n.a. 128.0
agriculture and Land Use Over
30 Years
1978 1998
Net Sown Area to Total Geographical Area Included in Shahdol 24.6%
Gross Cropped Area to Total Area n.a. 31.5%
Net Irrigated to Net Sown Area n.a. 14.7%
Cropped Area under Food Grains n.a. 87.5%
Yield of Food Grains (in kg. per hectare) n.a. 632
Per Capita Food Production (in kgs.) 158.5
Land Use and Agriculture
2000
Credit-Deposit Ratio 19.75
Commercial Banks (per 1000 population) 0.03
Crop lending per hectare of cultivated land n.a.
Crop lending per hectare of irrigated land n.a.
Credit
2001
Number of towns reporting slums 4
Urban population residing in slums 0.00%
Level of ground water development 6.96
Average annual rainfall (in mm) 1326.00
1995 2000
Percentage area under wasteland n.a. n.a.
Habitat
1991 1998-99
Cereals Per Capita (Kg) n.a. 141.1
Pulses Per Capita (Kg) n.a. 191.4
Oilseeds Per Capita (Kg) n.a. 9.1
Average Landholding (Ha) n.a. n.a.
Gross Irrigated Area ('000 Ha) 16.3
Fertiliser Consumption Per Hectare (Kg) n.a. 16.66
1993 1999
Cropping Intensity n.a. 128.0
Land Use and Agriculture
Lorenz Curve of Operational Holdings
Cumulative percentage of Land Holdings
0.00 0.25 0.50 0.75 1.00
1.00
0.80
0.60
0.40
0.20
0.00
Cum
ulat
ive
perc
enta
ge o
f Lan
d Ar
ea
Net AreaSown(25%)
Fallow Land (8%)
CultivableWasteland(3%)
OtherUncultivableLand excludingFallow Land(4%)
Land NotAvailable for
Cultivation(8%)
Forest (52%)
NA = not available

313
D I S T R I C T FA C T S H E E T S
Name of Block Total Net Sown Gross Per capita Agriculture Net irrigated area to Irrigated area to Level of GW Status of
Cropped Area Cropped Net Sown Area Intensity Net Sown area total cropped area Development ground water
Umaria 1601.14 34.2% 42.9% 0.36 125 11.34 9.04 7.487 White
Manpur 1837.75 20.2% 25.2% 0.26 124 18.08 14.55 9.319 White
Pali 853.38 16.7% 19.8% 0.26 118 6.65 5.65 1.862 White
Name of Block SC ST Road length Villages connected by all Population serviced per
per 100 sq.kms. weatherroads post office (1993-' 94)
Umaria 6.48 54.84 7.18 47.46 5462
Manpur 9.96 38.56 11.15 10.19 4623
Pali 4.08 72.55 6.44 83.5 5395
Population in 1991 Infrastructure (in percentage) (1991)
Sexr ratio Agriculture Worker labourers in participation
Name of Tehsil* Total Rural Urban Urbanisation Total Rural Urban Female All Child workers (%) ratio
Bandhavgarh 515851 432939 82912 16.1% 60.3% 57.8% 72.6% 45.6% 947 960 36.99 42.31
Population Literacy Select Gender EmploymentIndicators
*Data for Tehsil Pali not available separately as it was formed on 16.4.01
Agriculture and Irrigation Status ofGround Water

D I S T R I C T FA C T S H E E T S
314
Human Development Index (HDI) 0.549
Rank in Madhya Pradesh : HDI 27
Gender Related Development Index (GDI) 0.482
Rank in Madhya Pradesh : GDI 39
Human Development Indices - 2002
Area (in sq. km) 7371
Total Inhabited Villages 1522
Total Habitations 1962
Forest Villages 1
Towns (Class I to IV) and Major Towns 5
Vidisha, Basoda, Sironj
Crop Zone :
Wheat Zone
Soil type :
Medium Black and Deep Black (Medium/ Heavy)
Agri Climatic Zone :
Vindhya Plateau
Schedule V Areas :
No Schedule V area
Basic Details on the District
1981 1991
Infant Mortality Rate 158 124
1991 2001
Life Expectancy (years) 50.4 54.7
1976-81 1984-90
Crude Birth Rate 42.8 40.1
Health
Janpad Panchayats 7
Gram Panchayats 549
Tehsils 7
Tribal Blocks 0
Legislative Assembly Seats 5
Administrative Information
0.5490.721
0.495 0.431
0.000
0.200
0.400
0.600
0.800
1.000
Graph on Human Development Index
1991 2001
Population 970388 1214759
Share of Madhya Pradesh Population 2.00% 2.01%
Urban Population 20.1% 21.4%
Population of Scheduled Castes (SC) 20.3% n.a.
Population of Scheduled Tribes (ST) 4.4% n.a.
Density of Population (per sq. kms.) 132 165
All 23.92 25.18
Rural n.a. 23.11
Urban n.a. 33.42
Decadal Growth (%) 1981-91 1991- 00 1991 1998-99
Per Capita Food Production (in kgs.) 409.63 531.94
1996 2000
FPS per lakh population 32.60 31
Food
V I D I S H A
HDI Education Health Income
Demography
VIDISHA

315
D I S T R I C T FA C T S H E E T S
1991 2001
Worker Participation Rate :
All 37.5% 37.1%
Rural 40.0% 39.4%
Urban 27.7% 28.6%
Share of Primary Sector (%) 79.3% n.a.
Share of Secondary Sector (%) 6.2% n.a.
Share of Tertiary Sector (%) 14.58% n.a.
Employment in Registered Industries (2000) 2754
Employment Rate of Growth (1991 to 2001) n.a. 23.9%
Total Employment in Farm Sector (%) 78.0% 74.7
Rural Employment in Non Farm Sector (%) 10.3% 12.9%
Agriculture Labour (%) 33.3% 37.1%
Employment
2001
Middle Schools per lakh population 40.7
High Schools per lakh population 11.5
Rural Population per Primary Health Centre 47724
Population Serviced Sub Health Centre 6628
2000
Road length per 100 sq. km. (1999) 14.3
Telephone per lakh population 1047
Population per Post Office (1994-95) 6596
Registered establishments under Factories Act (1997) 74
Per capita consumption of electricity (non industrial) in kwh 69.1
Infrastructure / Facilities
1991 2001
Life Expectancy of Females at Birth 49.0 53.4
Child Sex Ratio 939 942
Girl Child Mortality (birth to age 1 year) 102 n.a.
Girl Child Mortality (up to age 5 years) 198 n.a.
Total Fertility Rate 5.6 n.a.
Gender Ratio : All 874 876
Rural 872 873
Urban 881 887
General non SC/ ST Gender Ratio 874 n.a.
SC Gender Ratio 865 n.a.
ST Gender Ratio 916 n.a.
Workers Participation Rate - Female 20.8% 21.0%
2000
Female Enrolment Rate (Ages 6-14) 90.3%
Gender
Estimated Poverty Rate (1993-1994) 34.3%
Children as main workers (1991) 3.9%
Children as main and marginal workers (1991) 5.5%
Percentage of safe deliveries (1998-1999) 27.8
Percentage of children fully immunised (1998-1999) 44
Deprivation
1991 2001
Literacy (%) : All 44.1% 62.1%
Male 58.0% 74.7%
Female 27.8% 47.4%
Rural 37.2% 57.5%
Urban 70.2% 78.1%
Access to Education 2000
Enrolment Rate (Ages 6-14) 92.0%
Gross access ratio at primary level 100.0%
Habitations with Primary Schools 100.0%
Education
2000
Habitations with SDW facility 100.0%
Habitations without 40 lpd water availability 0.0%
Number of villages electrified 1478
Percentage of villages not connected with pucca roads 71.0
1991
Households without access to electricity, SDW and toilet facilities 38.91
Basic Amenities
1999
Per Capita Forest Area (in hectares) 0.067
Annual Rate of Afforestation (%) (1993-1999) -3.33
Major Non-Timber Forest Produce :
Tendu Leaves, Baheda, Aonla, Charota Seeds, Safed Musli, Chironji
Forests

D I S T R I C T FA C T S H E E T S
316
Land Use Classification in 1998-99
1978 1998
Net Area Sown (in 000' ha.) 502.0 530.6
Gross Cropped Area (in 000' ha.) 514.0 637.7
Double Cropped Area to Net Area Sown 2.4 20.2
Net Irrigated Area (in 000' ha.) 9.7 143.9
Gross Irrigated Area (in 000' ha.) 9.7 143.9
1992-93 1998-99
Agriculture Intensity 110.9 120.2
agriculture and Land Use Over
30 Years
1978 1998
Net Sown Area to Total Geographical Area 68.7% 72.7%
Gross Cropped Area to Total Area 70.4% 87.3%
Net Irrigated to Net Sown Area 1.9% 27.1%
Cropped Area under Food Grains 87.0% 77.5%
Yield of Food Grains (in kg. per hectare) 385 1250
Per Capita Food Production (in kgs.) 531.9
Land Use and Agriculture
2000
Credit-Deposit Ratio 80.94
Commercial Banks (per 1000 population) 0.04
Crop lending per hectare of cultivated land 1158.2
Crop lending per hectare of irrigated land 7402.0
Credit
2001
Number of towns reporting slums 5
Urban population residing in slums 13.73%
Level of ground water development 18.87
Average annual rainfall (in mm) 1133.80
1995 2000
Percentage area under wasteland 13.1% 15.37%
Habitat
1991 1998-99
Cereals Per Capita (Kg) 264.0 316.9
Pulses Per Capita (Kg) 145.6 7.4
Oilseeds Per Capita (Kg) 60.1 82.8
Average Landholding (Ha) 5.0 4.40
Gross Irrigated Area ('000 Ha) 143.9
Fertiliser Consumption Per Hectare (Kg) 29.9 43.93
1993 1999
Cropping Intensity 111 120.2
Land Use and Agriculture
Lorenz Curve of Operational Holdings
Cumulative percentage of Land Holdings
0.00 0.25 0.50 0.75 1.00
1.00
0.80
0.60
0.40
0.20
0.00
Cum
ulat
ive
perc
enta
ge o
f Lan
d Ar
ea
Net AreaSown(74%)
Fallow Land (1%)
CultivableWasteland(1%)
OtherUncultivableLand excludingFallow Land(4%)
Land NotAvailable for
Cultivation(6%)
Forest (14%)
NA = not available

317
D I S T R I C T FA C T S H E E T S
Name of Block Total Net Sown Gross Per capita Agriculture Net irrigated area to Irrigated area to Level of GW Status of
Cropped Area Cropped Net Sown Area Intensity Net Sown area total cropped area Development ground water
Vidisha 1037.71 85.3% 112.7% 0.74 132 47.93 36.25 14.385 White
Gyaraspur 871.9 70.1% 76.9% 0.7 110 14.49 13.21 37.255 White
Basoda 1218.44 76.3% 83.0% 0.66 109 18.5 17.01 17.410 White
Nateran 1068.08 68.2% 77.4% 0.58 114 16.96 14.93 21.401 White
Kurwai 834.31 83.3% 90.5% 0.67 109 15.39 14.18 25.203 White
Sironj 1223.31 72.4% 78.1% 0.7 108 15.84 14.7 10.839 White
Lateri 934.88 55.1% 59.0% 0.66 107 7.9 7.39 15.054 White
Name of Block SC ST Road length Villages connected by all Population serviced per
per 100 sq.kms. weatherroads post office (1993-' 94)
Vidisha 22.05 3.97 20.53 24.00 2516
Gyaraspur 19.4 6.07 7.34 10.75 4153
Basoda 22.23 6.5 16.82 17.58 5002
Nateran 20.08 3.6 14.32 15.73 13744
Kurwai 23.76 7.07 13.42 23.19 4883
Sironj 23.31 2.15 8.67 10.37 5026
Lateri 19.91 8.93 7.88 6.11 5186
Population in 1991 Infrastructure (in percentage) (1991)
Sexr ratio Agriculture Worker labourers in participation
Name of Tehsil Total Rural Urban Urbanisation Total Rural Urban Female All Child workers (%) ratio
Lateri 112145 98078 14067 12.5% 47.1% 45.1% 60.8% 30.5% 861 930 42.63 35.18
Sironj 193286 151186 42100 21.8% 53.3% 49.7% 65.9% 38.1% 873 940 35.47 36.13
Kurwai 136891 123154 13737 10.0% 66.6% 65.7% 74.6% 51.7% 879 949 41.07 37.60
Basoda 242091 177173 64918 26.8% 62.5% 55.3% 81.3% 48.3% 878 941 34.03 44.21
Vidisha 268191 142734 125457 46.8% 75.2% 68.4% 82.7% 63.2% 881 939 28.67 31.68
Nateran 155271 155271 - - 53.8% 53.8% 0.0% 36.4% 873 934 45.83 36.72
Gyaraspur 106884 106884 - - 64.7% 64.7% 0.0% 49.4% 879 980 42.77 38.55
Population Literacy Select Gender EmploymentIndicators
Agriculture and Irrigation Status ofGround Water

318

319
EDUCATION
SECTORAL FACTSHEET
Table ED1 highlights the districtwise number of literate and
literacy rates for 2001. It also gives information on the gender ratio
among the literate. The ratio of male to female literacy rate shows
the relative deprivation of females in literacy rates to males.
Literacy Rate 2001: Madhya Pradesh
and India Year Madhya Pradesh India
Share of India's Literate 2001
Persons 5.6%
Male 5.9%
Female 5.3%
Gender Ratio among Literates 2001 601 667
Literacy Rate 2001
Persons 64.1% 65.38%
Male 76.80% 75.96%
Female 50.3% 54.28%
Male/ Female Literacy Rate 2001 1.53 1.39
Share of India’s Literate
All Male Female Gender Ratio of Literates
Lit
erac
y R
ates
Madhya Pradesh India
64%77%
50% 54%
76%65%
1.531.39
Source: Census of India 2001
LITERATE POPULATION
A person who can both read and write with understanding in
any language is treated as literate. A person who can merely
read but cannot write is not literate. It is not necessary that a
person who is literate should have received any formal
education or should have passed any minimum educational
standard. All children of the age of 6 years or less are treated
as illiterate even if they might be going to school and may have
picked up reading and writing a few words.
LITERACY RATE
Literacy rate is calculated as the percentage of literate
population over total population above the age of 7 years.
GENDER RATIO AMONG LITERATE
Gender ratio is the number of females in a population for
every 1000 males. It is calculated by multiplying the female
population in an area by 1000, and dividing this number by
the male population in that area.
MALE/ FEMALE LITERACY RATE
It is the ratio of male to female literacy rates.

320
ED1: LITERATE POPULATION AND LITERACY RATE IN DISTRICTS OF MADHYA PRADESH, 2001
1445760 714938 730822 218596 113806 1047901081039 547837 533202 240538 122132 1184061394421 709525 684896 230225 116965 1132601426951 780122 646829 247881 135553 1123281836784 968964 867820 282284 146186 1360981474633 788845 685788 284631 148218 1364131848882 946582 902300 292830 149277 1435531081909 568704 513205 191638 98335 93303
627818 337842 289976 106833 56982 498511306617 676414 630203 228631 118195 1104361740577 890853 849724 334269 172222 162047
579312 290572 288740 95513 48017 474961708170 882371 825799 302400 155547 1468531665503 883433 782070 320800 166278 1545221629881 882258 747623 248337 134299 114038
474174 247129 227045 84952 44104 408481085011 571796 513215 172326 89423 829032585321 1352849 1232472 366526 191608 1749182167469 1134870 1032599 301227 156498 1447291396677 701742 694935 320703 165784 1549191063689 548077 515612 186455 95565 90890
893908 446487 447421 143700 72368 713321183369 604942 578427 193750 99573 941771587264 871243 716021 290670 158897 131773
957399 501407 455992 150158 78333 71825725457 371972 353485 114370 59323 55047854235 447923 406312 167421 86673 80748
1120159 595730 524429 208148 107112 1010361253246 648850 604396 229273 117960 1113131214536 620119 594417 213248 108793 1044551972333 1017402 954931 367825 190983 1768422021783 1073032 948751 364967 189146 1758211868648 970114 898534 338527 175428 1630991078769 565387 513382 204334 105625 987091165893 588135 577758 193281 97636 956451572748 803416 769332 264989 134505 1304841290230 669419 620811 231765 119691 112074
559715 295630 264085 110469 57202 532671440666 775473 665193 276520 144863 1316571830553 947276 883277 373889 191719 1821701203160 637842 565318 223003 116238 1067651709885 881509 828376 276442 142995 133447
515851 264998 250853 95643 48788 468551214759 647632 567127 229353 118071 1112821529954 785212 744742 287618 146158 141460
60385118 31456873 28928245 10618323 5504422 5113901
BalaghatBarwaniBetulBhindBhopalChhatarpurChhindwaraDamoh DatiaDewasDharDindoriEast Nimar (Khandwa)GunaGwaliorHardaHoshangabadIndoreJabalpurJhabuaKatniMandlaMandsaurMorenaNarsimhapurNeemuchPannaRaisenRajgarhRatlamRewaSagarSatnaSehoreSeoniShahdolShajapurSheopurShivpuriSidhiTikamgarhUjjainUmariaVidishaWest Nimar (Khargone)Madhya Pradesh
Total Population Population in Age-Group 0-6
Persons Male Female Persons Male FemaleDistrict
Source: Census of India, 2001

321
ED1: LITERATE POPULATION AND LITERACY RATE IN DISTRICTS OF MADHYA PRADESH, 2001
844438 487446 356992 732 68.8% 81.09% 57.0% 1.42347540 217490 130050 598 41.3% 51.09% 31.4% 1.63778512 458125 320387 699 66.9% 77.31% 56.0% 1.38839687 541802 297885 550 71.2% 84.06% 55.7% 1.51
1167150 679308 487842 718 75.1% 82.56% 66.7% 1.24635943 419619 216324 516 53.4% 65.50% 39.4% 1.66
1027515 611572 415943 680 66.0% 76.70% 54.8% 1.40552533 353031 199502 565 62.1% 75.05% 47.5% 1.58382989 232957 150032 644 73.5% 82.94% 62.5% 1.33657999 424632 233367 550 61.0% 76.07% 44.9% 1.69741182 475600 265582 558 52.7% 66.18% 38.6% 1.71263614 170774 92840 544 54.5% 70.41% 38.5% 1.83867506 538477 329029 611 61.7% 74.09% 48.5% 1.53805920 535722 270198 504 59.9% 74.70% 43.1% 1.73964234 604587 359647 595 69.8% 80.83% 56.8% 1.42260066 159265 100801 633 66.8% 78.45% 54.1% 1.45642131 392448 249683 636 70.4% 81.36% 58.0% 1.40
1660100 983693 676407 688 74.8% 84.71% 64.0% 1.321422240 894197 528043 591 76.2% 91.40% 59.5% 1.54
399010 261288 137722 527 37.1% 48.75% 25.5% 1.91567376 361460 205916 570 64.7% 79.88% 48.5% 1.65448979 278274 170705 613 59.8% 74.38% 45.4% 1.64699186 433462 265724 613 70.7% 85.77% 54.9% 1.56850320 576809 273511 474 65.6% 80.97% 46.8% 1.73632373 367206 265167 722 78.3% 86.79% 69.0% 1.26406193 259612 146581 565 66.5% 83.04% 49.1% 1.69423150 267387 155763 583 61.6% 74.02% 47.8% 1.55663621 401569 262052 653 72.8% 82.18% 61.9% 1.33553410 369133 184277 499 54.0% 69.53% 37.4% 1.86677400 409592 267808 654 67.7% 80.10% 54.7% 1.47
1000012 627819 372193 593 62.3% 75.97% 47.8% 1.591128023 706797 421226 596 68.1% 79.96% 54.5% 1.47996436 618459 377977 611 65.1% 77.82% 51.4% 1.51558115 359260 198855 554 63.8% 78.14% 48.0% 1.63640752 380126 260626 686 65.9% 77.50% 54.1% 1.43755303 465252 290051 623 57.8% 69.55% 45.4% 1.53752942 460030 292912 637 71.1% 83.68% 57.6% 1.45209385 148278 61107 412 46.6% 62.19% 29.0% 2.15693228 471584 221644 470 59.5% 74.78% 41.5% 1.80769407 514018 255389 497 52.8% 68.03% 36.4% 1.87546945 359046 187899 523 55.8% 68.83% 41.0% 1.68
1020307 618139 402168 651 71.2% 83.70% 57.9% 1.45253200 160239 92961 580 60.3% 74.11% 45.6% 1.63611927 395638 216289 547 62.1% 74.71% 47.4% 1.57787810 480791 307019 639 63.4% 75.23% 50.9% 1.48
31906109 19932013 11974096 601 64.1% 76.80% 50.3% 1.53
BalaghatBarwaniBetulBhindBhopalChhatarpurChhindwaraDamoh DatiaDewasDharDindoriEast Nimar (Khandwa)GunaGwaliorHardaHoshangabadIndoreJabalpurJhabuaKatniMandlaMandsaurMorenaNarsimhapurNeemuchPannaRaisenRajgarhRatlamRewaSagarSatnaSehoreSeoniShahdolShajapurSheopurShivpuriSidhiTikamgarhUjjainUmariaVidishaWest Nimar (Khargone)Madhya Pradesh
Literate Population Literacy Rate
Gender Male/Ratio Female
among LiteracyPersons Male Female Literates Persons Male Female Rate
Source: Census of India, 2001
District

322
ED 2: LITERACY RATE BY SEX AND LOCATION IN DISTRICTS OF MADHYA PRADESH, 1991-2001
Table ED 2 gives the literacy rates for the districts of Madhya
Pradesh as per the 1991 and 2001 census. The literacy rates are
segregated into male/ female and rural/ urban categories.
LITERACY RATE
Literacy rate is calculated as a percentage of literate population over population above the
age of 7 years.
Year Madhya Pradesh India
Literacy Rate All 1991
Persons 44.67 52.21
Male 58.54 64.13
Female 29.35 39.29
Literacy Rate Rural 1991
Persons 35.53 44.69
Male 50.49 57.87
Female 19.17 30.62
Literacy Rate Urban 1991
Persons 70.67 73.08
Male 80.98 81.09
Female 58.93 64.05
Literacy Rate All 2001
Persons 64.11 65.38
Male 76.80 75.85
Female 50.28 54.16
Literacy Rate Rural 2001
Persons 58.10 59.40
Male 72.10 71.40
Female 42.96 46.70
Literacy Rate Urban 2001
Persons 79.67 80.30
Male 87.78 86.70
Female 70.62 73.10
Share of India’s Literate
Source: Census of India 2001

323
ED 2: LITERACY RATE BY SEX AND LOCATION IN DISTRICTS OF MADHYA PRADESH, 1991-2001
53.23 67.63 38.95 50.80 65.57 36.27 75.75 85.92 64.8528.08 36.77 19.01 21.02 28.99 12.77 64.48 76.03 51.9745.89 57.42 33.90 38.78 50.61 26.71 76.29 85.24 66.2349.23 66.20 28.20 45.68 63.48 23.55 62.74 76.63 45.7464.27 73.14 54.17 33.12 48.53 15.15 71.55 78.98 63.1535.20 46.87 21.32 28.27 40.14 14.12 63.44 74.46 50.4844.90 56.65 32.52 36.30 48.58 23.58 72.45 81.82 62.0446.27 60.49 30.46 40.01 54.90 23.52 73.77 84.83 61.2745.19 62.50 24.45 40.49 59.15 17.91 63.33 75.73 49.0344.08 61.15 25.57 35.90 54.28 16.20 67.03 79.99 52.4734.54 47.62 20.71 29.36 42.48 15.64 67.42 78.93 54.3437.74 55.05 20.21 30.57 45.32 15.81 69.63 82.17 55.9545.49 58.53 31.53 36.40 50.79 21.04 68.41 77.93 58.1334.58 48.86 17.99 27.23 41.95 10.12 64.09 76.61 49.5758.36 70.87 43.08 35.65 52.10 14.92 71.16 81.68 58.5348.84 62.54 33.76 41.86 56.28 26.11 74.54 85.04 62.6054.11 67.19 39.29 42.83 57.41 26.42 78.98 88.61 67.9566.32 77.99 53.35 43.70 63.00 22.53 75.92 84.28 66.5664.60 75.64 52.29 46.45 61.63 30.00 77.67 85.48 68.7219.01 26.29 11.52 13.74 20.49 6.83 69.99 80.68 58.3647.81 63.97 30.53 40.45 58.21 21.71 72.26 82.57 60.7337.02 50.45 23.48 37.57 53.29 21.73 79.02 88.50 68.8147.66 66.98 27.24 41.68 62.52 19.72 71.03 84.24 56.8645.93 63.53 23.79 41.12 59.70 17.68 62.07 76.47 44.1555.65 68.44 41.59 51.37 64.89 36.55 79.30 87.85 69.7350.27 69.34 30.04 42.25 63.26 20.16 70.57 84.48 55.4633.68 46.29 19.41 29.27 42.08 14.85 62.33 73.13 49.6740.76 54.02 25.47 36.13 49.82 20.45 65.10 75.75 52.4231.81 46.73 15.62 25.65 40.65 9.46 62.00 76.14 46.2744.15 58.36 19.13 30.56 46.41 13.94 72.07 82.57 60.7644.38 60.67 26.88 40.54 57.35 22.81 64.98 77.51 50.1153.44 67.02 37.78 44.01 58.96 26.83 75.49 85.77 63.5444.65 60.03 27.80 39.52 55.55 22.19 65.04 77.26 50.8940.43 56.90 21.99 34.72 52.37 15.07 65.76 76.66 53.2244.49 57.50 31.14 40.76 54.12 27.14 78.68 87.43 69.1135.45 48.93 20.93 26.99 40.45 12.91 64.24 76.12 50.1339.20 56.99 19.77 33.72 52.20 13.58 64.37 78.79 48.4327.55 40.73 12.27 22.63 35.59 7.61 55.81 70.38 38.9933.03 47.50 15.64 27.11 41.86 9.36 65.14 78.13 49.5929.15 43.23 13.61 26.54 40.47 11.40 66.43 78.64 49.5824.78 47.52 19.96 30.57 43.54 15.39 55.35 67.23 41.8849.06 64.25 32.64 33.49 51.89 13.76 72.13 82.38 60.9132.63 46.85 17.43 27.88 42.28 12.66 55.87 68.41 41.6444.08 58.04 27.81 37.23 52.34 19.54 70.24 79.96 59.0641.23 55.43 26.09 36.19 50.71 20.82 68.52 80.42 55.3244.67 58.54 29.35 35.53 50.49 19.17 70.67 80.98 58.93
BalaghatBarwaniBetulBhindBhopalChhatarpurChhindwaraDamoh DatiaDewasDharDindoriEast Nimar (Khandwa)GunaGwaliorHardaHoshangabadIndoreJabalpurJhabuaKatniMandlaMandsaurMorenaNarsimhapurNeemuchPannaRaisenRajgarhRatlamRewaSagarSatnaSehoreSeoniShahdolShajapurSheopurShivpuriSidhiTikamgarhUjjainUmariaVidishaWest Nimar (Khargone)Madhya Pradesh
Literacy Rate 1991
Total Rural Urban
Persons Male Female Person Male Female Person Male Female
District
Source: Census of India 1991, 2001
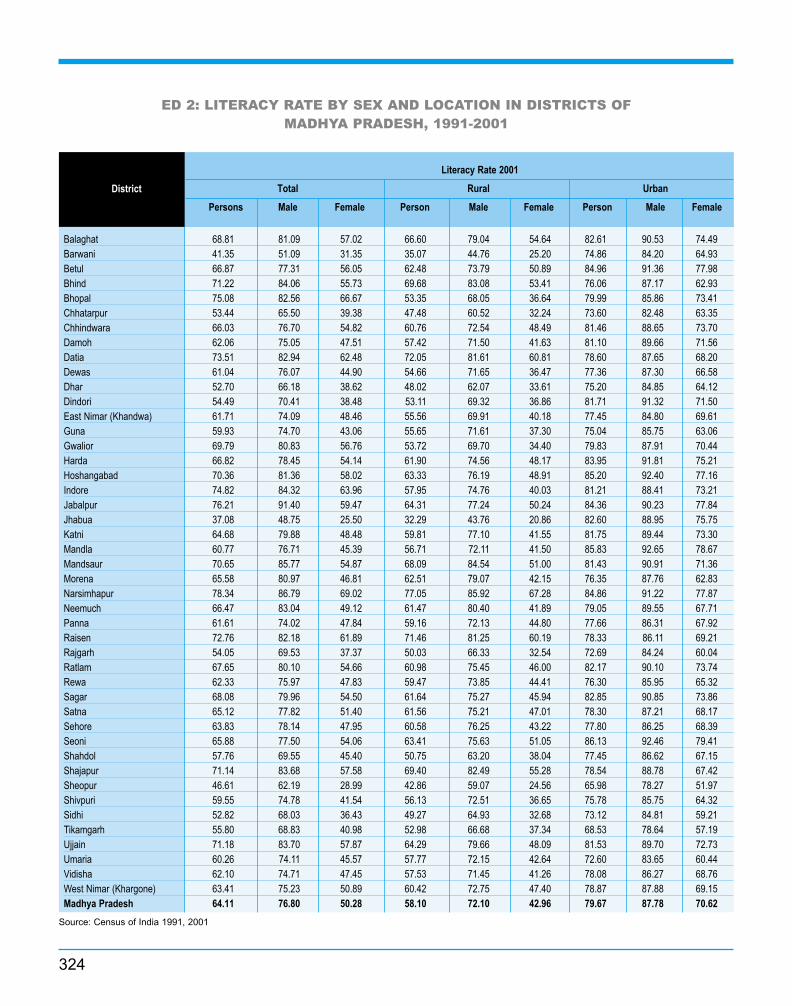
ED 2: LITERACY RATE BY SEX AND LOCATION IN DISTRICTS OF MADHYA PRADESH, 1991-2001
68.81 81.09 57.02 66.60 79.04 54.64 82.61 90.53 74.4941.35 51.09 31.35 35.07 44.76 25.20 74.86 84.20 64.9366.87 77.31 56.05 62.48 73.79 50.89 84.96 91.36 77.9871.22 84.06 55.73 69.68 83.08 53.41 76.06 87.17 62.9375.08 82.56 66.67 53.35 68.05 36.64 79.99 85.86 73.4153.44 65.50 39.38 47.48 60.52 32.24 73.60 82.48 63.3566.03 76.70 54.82 60.76 72.54 48.49 81.46 88.65 73.7062.06 75.05 47.51 57.42 71.50 41.63 81.10 89.66 71.5673.51 82.94 62.48 72.05 81.61 60.81 78.60 87.65 68.2061.04 76.07 44.90 54.66 71.65 36.47 77.36 87.30 66.5852.70 66.18 38.62 48.02 62.07 33.61 75.20 84.85 64.1254.49 70.41 38.48 53.11 69.32 36.86 81.71 91.32 71.5061.71 74.09 48.46 55.56 69.91 40.18 77.45 84.80 69.6159.93 74.70 43.06 55.65 71.61 37.30 75.04 85.75 63.0669.79 80.83 56.76 53.72 69.70 34.40 79.83 87.91 70.4466.82 78.45 54.14 61.90 74.56 48.17 83.95 91.81 75.2170.36 81.36 58.02 63.33 76.19 48.91 85.20 92.40 77.1674.82 84.32 63.96 57.95 74.76 40.03 81.21 88.41 73.2176.21 91.40 59.47 64.31 77.24 50.24 84.36 90.23 77.8437.08 48.75 25.50 32.29 43.76 20.86 82.60 88.95 75.7564.68 79.88 48.48 59.81 77.10 41.55 81.75 89.44 73.3060.77 76.71 45.39 56.71 72.11 41.50 85.83 92.65 78.6770.65 85.77 54.87 68.09 84.54 51.00 81.43 90.91 71.3665.58 80.97 46.81 62.51 79.07 42.15 76.35 87.76 62.8378.34 86.79 69.02 77.05 85.92 67.28 84.86 91.22 77.8766.47 83.04 49.12 61.47 80.40 41.89 79.05 89.55 67.7161.61 74.02 47.84 59.16 72.13 44.80 77.66 86.31 67.9272.76 82.18 61.89 71.46 81.25 60.19 78.33 86.11 69.2154.05 69.53 37.37 50.03 66.33 32.54 72.69 84.24 60.0467.65 80.10 54.66 60.98 75.45 46.00 82.17 90.10 73.7462.33 75.97 47.83 59.47 73.85 44.41 76.30 85.95 65.3268.08 79.96 54.50 61.64 75.27 45.94 82.85 90.85 73.8665.12 77.82 51.40 61.56 75.21 47.01 78.30 87.21 68.1763.83 78.14 47.95 60.58 76.25 43.22 77.80 86.25 68.3965.88 77.50 54.06 63.41 75.63 51.05 86.13 92.46 79.4157.76 69.55 45.40 50.75 63.20 38.04 77.45 86.62 67.1571.14 83.68 57.58 69.40 82.49 55.28 78.54 88.78 67.4246.61 62.19 28.99 42.86 59.07 24.56 65.98 78.27 51.9759.55 74.78 41.54 56.13 72.51 36.65 75.78 85.75 64.3252.82 68.03 36.43 49.27 64.93 32.68 73.12 84.81 59.2155.80 68.83 40.98 52.98 66.68 37.34 68.53 78.64 57.1971.18 83.70 57.87 64.29 79.66 48.09 81.53 89.70 72.7360.26 74.11 45.57 57.77 72.15 42.64 72.60 83.65 60.4462.10 74.71 47.45 57.53 71.45 41.26 78.08 86.27 68.7663.41 75.23 50.89 60.42 72.75 47.40 78.87 87.88 69.1564.11 76.80 50.28 58.10 72.10 42.96 79.67 87.78 70.62
BalaghatBarwaniBetulBhindBhopalChhatarpurChhindwaraDamoh DatiaDewasDharDindoriEast Nimar (Khandwa)GunaGwaliorHardaHoshangabadIndoreJabalpurJhabuaKatniMandlaMandsaurMorenaNarsimhapurNeemuchPannaRaisenRajgarhRatlamRewaSagarSatnaSehoreSeoniShahdolShajapurSheopurShivpuriSidhiTikamgarhUjjainUmariaVidishaWest Nimar (Khargone)Madhya Pradesh
Literacy Rate 2001
Total Rural Urban
Persons Male Female Person Male Female Person Male Female
District
Source: Census of India 1991, 2001
324

325
ED 3: ELEMENTARY EDUCATION INFRASTRUCTURE AND ENROLMENT IN ELEMENTARYSCHOOL IN DISTRICTS OF MADHYA PRADESH, 2000
PRIMARY SCHOOL
Classes first to fifth constitute the primary school in Madhya
Pradesh.
MIDDLE SCHOOL
Classes sixth to eighth constitute the middle school in Madhya
Pradesh.
ELEMENTARY SCHOOL
Classes first to eighth constitute the elementary school in
Madhya Pradesh.
ELEMENTARY INSTITUTIONS PER 10 SQ. KM.
Gives an idea of the physical access to school and is
calculated by dividing the total number of elementary
institutions by the total geographical area and multiplying the
quotient by 10.
CHILDREN PER INSTITUTION
Gives an idea of the basic provisioning of school and is
obtained by dividing the total number of children enrolled in
elementary school by the total number of elementary
institutions.
Table ED 3 gives information on the educational infrastructure and
enrolment in districts of Madhya Pradesh. This includes the
number of educational institutions and stage wise enrolment of
boys and girls at primary level and middle levels. Total enrolment
of boys and girls has also been calculated. Information is also
given on the number of educational institutions per 10 square
kilometers, to get an idea of the physical access of schools, and
estimated population of children in the age group of 6-14 years to
number of schools to indicate basic provision of educational
institutions.
Year Madhya Pradesh India
No. of Institutions 2000
Primary School 1917 36495
Middle School 210 198004
Enrolment Boys 2000
Primary School 6459172 64103289
Middle School 2259128 25082351
Enrolment Girls 2000
Primary School 4996763 49509252
Middle School 1341093 16982847
Number of Institutions
Source: Lok Sampark Abhiyaan II for M.P. and www.nic.in\ departments\
ministry of education for India

ED 3: ELEMENTARY EDUCATION INFRASTRUCTURE AND ENROLMENT IN ELEMENTARYSCHOOL IN DISTRICTS OF MADHYA PRADESH, 2000
2128 213713 108781 104932 525 101034 52126 489082126 129985 71763 58222 472 22032 13176 88561998 213741 112938 100803 579 54679 29881 247981769 233572 130162 103410 584 81370 49812 31558
797 214135 113361 100774 253 90542 50044 404981887 200507 110237 90270 459 41510 28369 131412689 260647 139756 120891 656 71881 39019 328621417 168571 90307 78264 478 47624 29149 18475
796 96484 51836 44648 306 25689 16835 88541490 176478 95904 80574 379 54481 34832 196493212 227299 125924 101375 651 57809 33207 246021376 78499 41581 36918 288 20649 11838 88111745 215031 118339 96692 435 45936 27709 182272680 211767 120401 91366 666 52083 34500 175831419 177029 98890 78139 401 53304 31709 21595
526 66649 37536 29113 156 23510 14361 91491128 134458 71088 63370 393 42395 24791 176041037 234243 125227 109016 584 105184 57473 477111584 254842 131201 123641 521 52577 30234 223433876 232243 136637 95606 478 28848 17915 109331283 141134 77410 63724 325 44760 28139 166212081 136537 71043 65494 507 41914 24918 169961244 145712 77392 68320 350 39310 25801 135091768 248569 136612 111957 406 81841 52954 288871224 120499 63964 56535 328 36996 21489 15507
867 83488 45413 38075 295 24489 15068 94211589 122108 67738 54370 445 25958 16351 96071805 164689 87669 77020 507 35103 22505 125981874 167024 91886 75138 551 44323 25377 189461667 168491 94633 73858 428 33488 22029 114593565 285620 157555 128065 509 95985 54943 410422133 220102 117704 102398 638 69768 43252 265162679 237815 124691 113124 663 91710 54859 368511380 166178 89403 76775 489 48142 29341 188012180 182713 93785 88928 560 48550 26660 218902935 206434 107744 98690 534 81685 44551 371341528 183558 100120 83438 600 47635 33411 14224
779 83375 48617 34758 161 13948 10257 36912262 253319 143872 109447 568 41693 30951 107423187 273640 149285 124355 728 63885 40023 238621786 180945 98906 82039 465 44154 33204 109501452 284811 156357 128454 439 69817 41907 27910
821 80103 42777 37326 150 27555 15904 116511830 186126 100278 85848 459 35866 23760 121062620 200623 108913 91710 674 52661 31783 20878
82219 8263506 4485636 3777870 21043 2314373 1396417 917956
BalaghatBarwaniBetulBhindBhopalChhatarpurChhindwaraDamoh DatiaDewasDharDindoriEast Nimar (Khandwa)GunaGwaliorHardaHoshangabadIndoreJabalpurJhabuaKatniMandlaMandsaurMorenaNarsimhapurNeemuchPannaRaisenRajgarhRatlamRewaSagarSatnaSehoreSeoniShahdolShajapurSheopurShivpuriSidhiTikamgarhUjjainUmariaVidishaWest Nimar (Khargone)Madhya Pradesh
Primary Middle
No of Total No of TotalInstitutions* Enrolment Boys Girls Institutions Enrolment Boys Girls
District
* Figures for Primary Institutions include Government Primary Schools and EGS SchoolsSource: Lok Sampark Abhiyaan II
326

327
ED 3: ELEMENTARY EDUCATION INFRASTRUCTURE AND ENROLMENT IN ELEMENTARYSCHOOL IN DISTRICTS OF MADHYA PRADESH, 2000
314747 160907 153840 2.31 0.57 2.87 118.6152017 84939 67078 3.92 0.87 4.79 58.5268420 142819 125601 1.99 0.58 2.57 104.2314942 179974 134968 3.97 1.31 5.28 133.8304677 163405 141272 2.88 0.91 3.79 290.2242017 138606 103411 2.17 0.53 2.70 103.2332528 178775 153753 2.28 0.56 2.83 99.4216195 119456 96739 1.94 0.65 2.59 114.1122173 68671 53502 2.96 1.14 4.10 110.9230959 130736 100223 2.12 0.54 2.66 123.6285108 159131 125977 3.94 0.80 4.74 73.8
99148 53419 45729 1.84 0.39 2.23 59.6260967 146048 114919 1.62 0.40 2.02 119.7263850 154901 108949 2.42 0.60 3.02 78.9230333 130599 99734 3.11 0.88 3.99 126.6
90159 51897 38262 1.58 0.47 2.05 132.2176853 95879 80974 1.68 0.59 2.27 116.3339427 182700 156727 2.66 1.50 4.16 209.4307419 161435 145984 3.04 1.00 4.04 146.0261091 154552 106539 5.72 0.70 6.42 60.0185894 105549 80345 2.59 0.66 3.25 115.6178451 95961 82490 3.59 0.87 4.46 69.0185022 103193 81829 2.25 0.63 2.88 116.1330410 189566 140844 3.54 0.81 4.36 152.0157495 85453 72042 2.38 0.64 3.02 101.5107977 60481 47496 2.04 0.69 2.73 92.9148066 84089 63977 2.23 0.62 2.85 72.8199792 110174 89618 2.13 0.60 2.73 86.4211347 117263 94084 3.05 0.90 3.94 87.2201979 116662 85317 3.43 0.88 4.31 96.4381605 212498 169107 5.65 0.81 6.45 93.7289870 160956 128914 2.08 0.62 2.70 104.6329525 179550 149975 3.57 0.88 4.45 98.6214320 118744 95576 2.10 0.74 2.84 114.7231263 120445 110818 2.49 0.64 3.13 84.4288119 152295 135824 2.95 0.54 3.49 83.1231193 133531 97662 2.47 0.97 3.43 108.697323 58874 38449 1.18 0.24 1.42 103.5
295012 174823 120189 2.20 0.55 2.75 104.2337525 189308 148217 3.03 0.69 3.72 86.2225099 132110 92989 3.54 0.92 4.46 100.0354628 198264 156364 2.38 0.72 3.10 187.5107658 58681 48977 2.01 0.37 2.38 110.9221992 124038 97954 2.48 0.62 3.11 97.0253284 140696 112588 3.26 0.84 4.10 76.9
10577879 5882053 4695826 2.67 0.68 3.35 102.4
BalaghatBarwaniBetulBhindBhopalChhatarpurChhindwaraDamoh DatiaDewasDharDindoriEast Nimar (Khandwa)GunaGwaliorHardaHoshangabadIndoreJabalpurJhabuaKatniMandlaMandsaurMorenaNarsimhapurNeemuchPannaRaisenRajgarhRatlamRewaSagarSatnaSehoreSeoniShahdolShajapurSheopurShivpuriSidhiTikamgarhUjjainUmariaVidishaWest Nimar (Khargone)Madhya Pradesh
Total Enrolment in Elementary Elementry Institutions per 10School sq. kms
Total Boys Girls Primary Middle Total Children (6 to 14 Enrolment years per Elementary
Institution
District
* Figures for Primary Institutions include Government Primary Schools and EGS SchoolsSource: Lok Sampark Abhiyaan II

328
Table EL 1 gives the total workers, main workers and marginal
workers as per the 1991 and 2001 census. The growth in total
workers and main workers between 1991 and 2001 is also
presented in the table. The data on workers is segregated into
male/ female categories. Information on Worker Participation Rate
(WPR) for 1991 and 2001 is also given in the table along with the
change in WPR for all areas. The WPR is segregated into male/
female and rural/ urban categories.
EMPLOYMENT
Work Participation Rate 2001: Madhya
Pradesh and India
WPR- WPR WPR WPR WPRTotal Rural Urban Males Females
Madhya Pradesh India
Source: Census of India 2001
Per
cen
tage
MAIN WORKERS
Census records a person as a Main Worker if he/she has
worked for a major part of the year preceding the
enumeration.
MARGINAL WORKERS
Census records a person as a marginal workers if he/ she has
worked anytime at all in the year preceding the enumeration
but has not worked for a major part of the year.
GROWTH IN WORKERS
This shows the change (growth or decline) in number of
workers and is shown as the percentage increase in workers
between 1991 and 2001 to total workers enumerated in the
year 1991.
WORKER PARTICIPATION RATE/ RATIO (WPR)
This figure is the total number of main and marginal workers
in an area to the total population residing in that area.
Year Madhya Pradesh India
Workers
Main Workers 2001 19077568 313173394
Marginal Workers 2001 6678917 89338796
Share of India
MP Main Workers 6.1%
MP Marginal Workers 7.5%
WPR 2001 42.8% 39.3%
WPR Rural 2001 47.1% 42.0%
WPR Urban 2001 30.6% 32.2%
WPR Males 2001 51.6% 51.9%
WPR Females 2001 33.1% 25.7%
60
50
40
30
20
10
0
SECTORAL FACTSHEET

329
EL 1: EMPLOYMENT INDICATORS IN DISTRICTS OF MADHYA PRADESH, 1991 & 2001
726560 388930 337630 679990 369239 310751523096 290376 232720 395069 224739 170330615971 362554 253417 551244 319965 231279525495 378181 147314 333580 310772 22808589490 461931 127559 430144 344245 85899593112 389746 203366 475008 322254 152754779222 481976 297246 681654 419983 261671485195 302284 182911 367699 247499 120200316247 190876 125371 191608 141079 50529579217 350191 229026 424290 273953 150337811705 468082 343623 638941 370583 268358330918 171928 158990 261029 144027 116987749860 466724 283136 625480 391976 233504681951 455214 226737 485405 359971 125434529841 422036 107805 390993 333663 57330213034 130427 82607 161674 105133 56541386643 282795 103848 313145 234240 78905890961 670133 220828 630518 489691 140827799035 569665 229370 610995 450613 160382732960 381826 351134 610818 321466 289352443390 282699 160691 369336 238053 131283463641 248082 215559 400112 215557 184506570771 337128 233643 442208 267397 174811589236 420048 169188 367476 325182 42294403220 271098 132122 310812 215426 95386348228 206363 141865 281933 167597 114336371694 230148 141546 286201 192974 93227409791 295500 114291 327593 237432 90161626352 354797 271555 466269 283640 182629547359 332704 214655 447002 273738 173264863608 502694 360914 586990 373171 213819839313 552051 287262 643835 441397 202438745213 471117 274096 591259 381101 210158452390 276858 175532 353498 224620 128878569211 318165 251046 492327 275542 216785687868 425442 262426 573519 368555 204964630091 369233 260858 461488 289755 171733230027 146531 83496 171491 118065 53426652718 404832 247886 481166 323182 157984757408 455278 302130 590887 368434 222453566468 333353 233115 402469 257850 144619754308 474794 279514 550423 375652 174771218229 134758 83471 184818 114706 70112450975 331977 118998 363901 269770 94131704463 410762 293701 535352 320137 215215
25756485 16202287 9554198 19941649 13094024 6847561
BalaghatBarwaniBetulBhindBhopalChhatarpurChhindwaraDamoh DatiaDewasDharDindoriEast Nimar (Khandwa)GunaGwaliorHardaHoshangabadIndoreJabalpurJhabuaKatniMandlaMandsaurMorenaNarsimhapurNeemuchPannaRaisenRajgarhRatlamRewaSagarSatnaSehoreSeoniShahdolShajapurSheopurShivpuriSidhiTikamgarhUjjainUmariaVidishaWest Nimar (Khargone)
Madhya Pradesh
Total Workers 2001 Total Workers 1991
Persons Male Female Persons Male Female
District
Source: Census of India, 1991, 2001

330
EL 1: EMPLOYMENT INDICATORS IN DISTRICTS OF MADHYA PRADESH, 1991 & 2001
6.85% 5.33% 8.65% 474993 309013 16598032.41% 29.21% 36.63% 389939 254006 13593311.74% 13.31% 9.57% 417646 297277 12036957.53% 21.69% 545.89% 396595 334430 6216537.04% 34.19% 48.50% 499202 416035 8316724.86% 20.94% 33.13% 441466 349133 9233314.31% 14.76% 13.60% 559050 412308 14674231.95% 22.14% 52.17% 347723 262380 8534365.05% 35.30% 148.12% 226149 165602 6054736.51% 27.83% 52.34% 428109 307326 12078327.04% 26.31% 28.05% 595638 407395 18824326.77% 19.37% 35.90% 260917 146914 11400319.89% 19.07% 21.26% 626895 427345 19955040.49% 26.46% 80.76% 496244 400370 9587435.51% 26.49% 88.04% 441803 384419 5738431.77% 24.06% 46.10% 151586 114645 3694123.47% 20.73% 31.61% 293477 246173 4730441.31% 36.85% 56.81% 765760 614764 15099630.78% 26.42% 43.01% 624689 489415 13527420.00% 18.78% 21.35% 487963 310015 17794820.05% 18.75% 22.40% 295073 226682 6839115.88% 15.09% 16.83% 321257 198699 12255829.07% 26.08% 33.65% 454612 305692 14892060.35% 29.17% 300.03% 450067 376175 7389229.73% 25.84% 38.51% 309808 237791 7201723.51% 23.13% 24.08% 281932 185234 9669829.87% 19.26% 51.83% 259533 196504 6302925.09% 24.46% 26.76% 307259 254682 5257734.33% 25.09% 48.69% 438389 303013 13537622.45% 21.54% 23.89% 404655 292979 11167647.12% 34.71% 68.79% 585601 410159 17544230.36% 25.07% 41.90% 637546 488122 14942426.04% 23.62% 30.42% 554459 406282 14817727.98% 23.26% 36.20% 308690 234248 7444215.62% 15.47% 15.80% 381256 263248 11800819.94% 15.44% 28.04% 458818 342316 11650236.53% 27.43% 51.90% 436725 324881 11184434.13% 24.11% 56.28% 153331 128353 2497835.65% 25.26% 56.91% 507427 364063 14336428.18% 23.57% 35.82% 544083 397594 14648940.75% 29.28% 61.19% 395969 298742 9722737.04% 26.39% 59.93% 587288 421230 16605818.08% 17.48% 19.05% 142523 106270 3625323.93% 23.06% 26.42% 345555 292383 5317231.59% 28.31% 36.47% 589868 377382 21248629.16% 23.74% 39.53% 19077568 14081689 4995879
BalaghatBarwaniBetulBhindBhopalChhatarpurChhindwaraDamoh DatiaDewasDharDindoriEast Nimar (Khandwa)GunaGwaliorHardaHoshangabadIndoreJabalpurJhabuaKatniMandlaMandsaurMorenaNarsimhapurNeemuchPannaRaisenRajgarhRatlamRewaSagarSatnaSehoreSeoniShahdolShajapurSheopurShivpuriSidhiTikamgarhUjjainUmariaVidishaWest Nimar (Khargone)
Madhya Pradesh
Growth in Workers 1991-2001 Main Workers, 2001
Persons Male Female Persons Male Female
District
Source: Census of India, 1991, 2001

331
EL 1: EMPLOYMENT INDICATORS IN DISTRICTS OF MADHYA PRADESH, 1991 & 2001
587389 364340 223049 -19.13% -15.19% -25.59%323851 220455 103396 20.41% 15.22% 31.47%496013 314903 181110 -15.80% -5.60% -33.54%321461 309345 12116 23.37% 8.11% 413.08%407199 340918 66281 22.59% 22.03% 25.48%397833 316930 80903 10.97% 10.16% 14.13%587232 414182 173050 -4.80% -0.45% -15.20%321609 243922 77687 8.12% 7.57% 9.85%161844 138186 23658 39.73% 19.84% 155.93%379062 270821 108241 12.94% 13.48% 11.59%564849 365533 199316 5.45% 11.45% -5.56%309369 184199 125170 -15.66% -20.24% -8.92%568445 386872 181573 10.28% 10.46% 9.90%413413 355213 58200 20.04% 12.71% 64.73%366108 331016 35092 20.68% 16.13% 63.52%139709 103790 35919 8.50% 10.46% 2.85%286281 231575 54706 2.51% 6.30% -13.53%607467 486970 120497 26.06% 26.24% 25.31%576726 446869 129857 8.32% 9.52% 4.17%444263 306453 137810 9.84% 1.16% 29.13%317872 234473 83399 -7.17% -3.32% -18.00%291292 171216 120076 10.29% 16.05% 2.07%393490 264243 129247 15.53% 15.69% 15.22%349567 323845 25722 28.75% 16.16% 187.27%283414 213046 70368 9.31% 11.61% 2.34%258474 165700 92774 9.08% 11.79% 4.23%242893 189720 53173 6.85% 3.58% 18.54%294415 234011 60404 4.36% 8.83% -12.96%367871 277826 90045 19.17% 9.07% 50.34%385923 267693 118230 4.85% 9.45% -5.54%524958 365867 159091 11.55% 12.11% 10.28%568652 434406 134246 12.12% 12.37% 11.31%527001 374794 152207 5.21% 8.40% -2.65%305946 221592 84354 0.90% 5.71% -11.75%414419 270878 143541 -8.00% -2.82% -17.79%496959 363062 133897 -7.67% -5.71% -12.99%396024 285145 110879 10.28% 13.94% 0.87%144442 117089 27353 6.15% 9.62% -8.68%399019 318990 80029 27.17% 14.13% 79.14%495867 361303 134564 9.72% 10.04% 8.86%330150 253522 76628 19.94% 17.84% 26.88%502205 371299 130906 16.94% 13.45% 26.85%158848 112278 46570 -10.28% -5.35% -22.15%321146 265224 55922 7.60% 10.24% -4.92%486942 316538 170404 21.14% 19.22% 24.70%
17517912 12906252 4611660 8.90% 9.11% 8.33%
BalaghatBarwaniBetulBhindBhopalChhatarpurChhindwaraDamoh DatiaDewasDharDindoriEast Nimar (Khandwa)GunaGwaliorHardaHoshangabadIndoreJabalpurJhabuaKatniMandlaMandsaurMorenaNarsimhapurNeemuchPannaRaisenRajgarhRatlamRewaSagarSatnaSehoreSeoniShahdolShajapurSheopurShivpuriSidhiTikamgarhUjjainUmariaVidishaWest Nimar (Khargone)
Madhya Pradesh
Main Workers 1991 Growth in Main Workers 1991-2001
Persons Male Female Persons Male Female
District
Source: Census of India, 1991, 2001

332
EL 1: EMPLOYMENT INDICATORS IN DISTRICTS OF MADHYA PRADESH, 1991 & 2001
251567 79917 171650 92601 4899 87702133157 36370 96787 71218 4284 66934198325 65277 133048 55231 5062 50169128900 43751 85149 12119 1427 10692
90288 45896 44392 22945 3327 19618151646 40613 111033 77175 5324 71851220172 69668 150504 94422 5801 88621137472 39904 97568 46090 3577 42513
90098 25274 64824 29764 2893 26871151108 42865 108243 45228 3132 42096216067 60687 155380 74092 5050 69042
70001 25014 44987 35904 2134 33770122965 39379 83586 57035 5104 51931185707 54844 130863 71992 4758 67234
88038 37617 50421 24885 2647 2223861448 15782 45666 21965 1343 2062293166 36622 56544 26864 2665 24199
125201 55369 69832 23051 2721 20330174346 80250 94096 34269 3744 30525244997 71811 173186 166555 15013 151542148317 56017 92300 51464 3580 47884142384 49383 93001 24529 2016 22513116159 31436 84723 48718 3154 45564139169 43873 95296 17909 1337 16572
93412 33307 60105 27398 2380 2501866296 21129 45167 23459 1897 21562
112161 33644 78517 43308 3254 40054102532 40818 61714 33178 3421 29757187963 51784 136179 98398 5814 92584142704 39725 102979 61079 6045 55034278007 92535 185472 62032 7304 54728201767 63929 137838 75183 6991 68192190754 64835 125919 64258 6307 57951143700 42610 101090 47552 3028 44524187955 54917 133038 77908 4664 73244229050 83126 145924 76560 5493 71067193366 44352 149014 65464 4610 60854
76696 18178 58518 27049 976 26073145291 40769 104522 82147 4192 77955213325 57684 155641 95020 7131 87889170499 34611 135888 72319 4328 67991167020 53564 113456 48218 4353 43865
75706 28488 47218 25970 2428 23542105420 39594 65826 42755 4546 38209114595 33380 81215 48410 3599 44811
6678917 2120598 4558319 2423690 187753 2235937
BalaghatBarwaniBetulBhindBhopalChhatarpurChhindwaraDamoh DatiaDewasDharDindoriEast Nimar (Khandwa)GunaGwaliorHardaHoshangabadIndoreJabalpurJhabuaKatniMandlaMandsaurMorenaNarsimhapurNeemuchPannaRaisenRajgarhRatlamRewaSagarSatnaSehoreSeoniShahdolShajapurSheopurShivpuriSidhiTikamgarhUjjainUmariaVidishaWest Nimar (Khargone)
Madhya Pradesh
Marginal Workers 2001 Marginal Workers 1991
Persons Male Female Persons Male Female
District
Source: Census of India, 1991, 2001

333
EL 1: EMPLOYMENT INDICATORS IN DISTRICTS OF MADHYA PRADESH, 1991 & 2001
50.25 54.40 46.19 49.78 54.12 45.4648.39 53.00 43.65 47.46 53.03 41.6844.17 51.10 37.00 46.66 53.24 39.8436.83 48.48 22.77 27.37 46.29 4.1632.04 47.61 14.67 31.83 48.13 13.5040.22 49.41 29.66 41.02 51.65 28.6042.15 50.93 32.95 43.45 52.28 34.1944.85 53.15 35.64 40.94 52.50 28.1750.37 56.50 43.23 37.18 50.56 21.3844.33 51.78 36.33 41.04 50.98 30.2946.63 52.54 40.44 46.73 52.87 40.2757.08 59.09 55.05 51.02 55.88 46.0843.90 52.89 34.30 43.69 53.05 33.7140.94 51.52 28.99 37.04 51.52 20.5132.51 47.84 14.42 30.23 47.24 9.7644.93 52.78 36.38 42.46 52.86 31.0935.63 49.46 20.23 35.93 50.00 18.8836.20 52.07 18.80 34.34 50.83 16.1437.08 50.45 22.37 34.56 48.51 19.1152.57 54.39 50.72 54.04 56.22 51.8041.68 51.58 31.17 41.88 52.35 30.7351.87 55.56 48.18 51.32 55.02 47.5748.23 55.73 40.39 46.21 54.40 37.5737.12 48.21 23.63 28.73 45.96 7.4042.12 54.07 28.97 39.57 52.45 25.4548.00 55.48 40.13 47.12 54.43 39.3743.51 51.38 34.84 41.60 53.20 28.6736.58 49.60 21.79 37.38 50.91 21.9949.98 54.68 44.93 46.97 54.95 38.3245.05 53.63 36.09 45.99 54.88 36.6243.77 49.47 37.72 37.75 46.36 28.5141.51 51.45 30.28 39.07 50.38 26.2339.86 48.54 30.49 40.35 49.88 29.9641.94 48.97 34.19 42.02 50.67 32.3848.82 54.10 43.45 49.19 54.34 43.9143.74 52.96 34.12 43.35 54.04 31.9748.84 55.16 42.02 44.66 53.79 34.7241.10 49.57 31.62 39.74 51.44 26.4545.31 52.20 37.26 42.47 52.74 30.3741.37 48.06 34.20 43.02 51.55 33.7747.08 52.26 41.24 42.78 51.28 33.0244.11 53.86 33.73 39.80 52.39 26.2442.30 50.85 33.27 43.92 52.93 34.3537.12 51.26 20.98 37.50 52.09 20.8046.01 52.30 39.39 44.77 51.96 37.1342.75 51.62 33.10 41.06 51.56 29.55
BalaghatBarwaniBetulBhindBhopalChhatarpurChhindwaraDamoh DatiaDewasDharDindoriEast Nimar (Khandwa)GunaGwaliorHardaHoshangabadIndoreJabalpurJhabuaKatniMandlaMandsaurMorenaNarsimhapurNeemuchPannaRaisenRajgarhRatlamRewaSagarSatnaSehoreSeoniShahdolShajapurSheopurShivpuriSidhiTikamgarhUjjainUmariaVidishaWest Nimar (Khargone)
Madhya Pradesh
WPR - All 2001 WPR - All 1991
Persons Male Female Persons Male Female
District
Source: Census of India, 1991, 2001

334
EL 1: EMPLOYMENT INDICATORS IN DISTRICTS OF MADHYA PRADESH, 1991 & 2001
0.47 0.28 0.73 52.9% 55.5% 50.4%0.93 -0.03 1.97 50.9% 53.4% 48.3%
-2.49 -2.14 -2.84 48.0% 52.7% 43.3%9.46 2.19 18.61 40.1% 50.3% 27.8%0.21 -0.52 1.17 42.2% 49.6% 33.9%
-0.80 -2.24 1.06 43.0% 50.5% 34.3%-1.30 -1.35 -1.24 46.2% 52.5% 39.7%3.91 0.65 7.47 47.3% 54.6% 39.3%
13.19 5.94 21.85 55.1% 58.7% 50.9%3.29 0.80 6.04 49.4% 53.3% 45.3%
-0.10 -0.33 0.17 49.2% 52.7% 45.6%6.06 3.21 8.97 58.3% 59.6% 57.0%0.21 -0.16 0.59 49.1% 54.7% 43.2%3.90 0.00 8.48 44.1% 53.0% 34.0%2.28 0.60 4.66 38.3% 50.2% 24.0%2.47 -0.08 5.29 49.4% 54.6% 43.9%
-0.30 -0.54 1.35 39.0% 50.9% 25.7%1.86 1.24 2.66 45.7% 53.5% 37.4%2.52 1.94 3.26 45.0% 53.4% 35.8%
-1.47 -1.83 -1.08 54.5% 55.0% 53.9%-0.20 -0.77 0.44 44.9% 52.5% 36.8%0.55 0.54 0.61 54.3% 56.6% 52.0%2.02 1.33 2.82 51.4% 56.6% 45.9%8.39 2.25 16.23 40.0% 49.5% 28.4%2.55 1.62 3.52 44.3% 55.1% 32.3%0.88 1.05 0.76 53.6% 57.2% 49.8%1.91 -1.82 6.17 45.5% 52.3% 38.0%
-0.80 -1.31 -0.20 38.1% 50.3% 24.4%3.01 -0.27 6.61 53.7% 56.1% 51.3%
-0.94 -1.25 -0.53 51.3% 55.5% 46.9%6.02 3.11 9.21 46.2% 50.5% 41.7%2.44 1.07 4.05 44.5% 53.0% 34.9%
-0.49 -1.34 0.53 41.9% 49.0% 34.4%-0.08 -1.70 1.81 45.0% 49.8% 39.7%-0.37 -0.24 -0.46 51.1% 55.0% 47.0%0.39 -1.08 2.15 49.0% 55.2% 42.6%4.18 1.37 7.30 52.2% 56.2% 48.0%1.36 -1.87 5.17 43.4% 50.3% 35.7%2.84 -0.54 6.89 48.8% 53.6% 43.1%
-1.65 -3.49 0.43 43.4% 48.6% 38.0%4.30 0.98 8.22 49.5% 53.3% 45.1%4.31 1.47 7.49 52.4% 57.0% 47.6%
-1.62 -2.08 -1.08 44.6% 51.8% 37.1%-0.38 -0.83 0.18 39.4% 52.6% 24.4%1.24 0.34 2.26 48.7% 52.9% 44.3%1.69 0.06 3.55 47.1% 53.1% 40.7%
BalaghatBarwaniBetulBhindBhopalChhatarpurChhindwaraDamoh DatiaDewasDharDindoriEast Nimar (Khandwa)GunaGwaliorHardaHoshangabadIndoreJabalpurJhabuaKatniMandlaMandsaurMorenaNarsimhapurNeemuchPannaRaisenRajgarhRatlamRewaSagarSatnaSehoreSeoniShahdolShajapurSheopurShivpuriSidhiTikamgarhUjjainUmariaVidishaWest Nimar (Khargone)
Madhya Pradesh
Change in WPR 1991-2001 WPR - Rural 2001
Persons Male Female Persons Male Female
District
Source: Census of India, 1991, 2001

335
EL 1: EMPLOYMENT INDICATORS IN DISTRICTS OF MADHYA PRADESH, 1991 & 2001
51.8% 55.0% 48.7% 33.1% 47.8% 17.9% 30.2% 45.6% 13.7%50.2% 53.9% 46.3% 33.8% 50.5% 16.1% 32.1% 48.1% 14.9%51.2% 55.2% 47.0% 27.2% 44.5% 8.3% 27.0% 44.9% 7.2%28.1% 47.3% 4.5% 26.3% 42.6% 6.9% 24.6% 42.5% 2.9%42.7% 52.3% 31.8% 29.6% 47.1% 10.1% 29.1% 47.1% 9.0%43.6% 53.1% 32.5% 30.5% 45.5% 13.2% 30.2% 45.7% 12.4%48.0% 54.7% 41.1% 29.6% 46.2% 11.7% 28.3% 44.4% 10.5%43.0% 54.1% 30.7% 34.2% 47.1% 19.7% 31.6% 45.1% 16.4%39.7% 52.0% 25.1% 33.4% 48.6% 16.0% 27.3% 44.7% 7.2%44.6% 51.9% 36.8% 30.8% 47.8% 12.4% 30.8% 48.4% 11.3%48.8% 53.3% 44.1% 33.8% 52.0% 13.0% 32.9% 49.8% 14.0%53.2% 56.8% 49.7% 31.7% 49.4% 13.0% 30.9% 46.6% 13.7%49.3% 55.3% 42.9% 29.7% 48.0% 10.2% 28.9% 47.1% 9.3%39.2% 52.9% 23.4% 29.4% 46.0% 10.8% 28.3% 45.7% 8.5%35.6% 50.9% 16.8% 28.7% 46.3% 8.2% 27.1% 45.1% 5.7%46.4% 54.8% 37.1% 28.3% 46.1% 8.5% 27.2% 45.2% 7.1%38.8% 52.0% 24.1% 28.2% 46.3% 8.0% 27.3% 45.4% 6.8%43.9% 53.6% 33.4% 32.1% 51.5% 10.7% 30.1% 49.6% 8.5%43.0% 52.8% 32.6% 31.2% 48.2% 12.1% 28.2% 45.4% 8.7%56.1% 57.1% 55.0% 32.6% 47.9% 16.2% 32.5% 47.3% 16.4%45.6% 53.7% 37.1% 29.9% 48.2% 9.7% 29.0% 47.9% 8.1%52.7% 55.6% 49.8% 30.8% 47.0% 13.7% 29.5% 45.2% 12.8%49.7% 55.7% 43.5% 34.6% 51.9% 16.2% 32.3% 49.4% 13.9%29.9% 46.9% 8.8% 26.6% 43.3% 6.8% 24.8% 42.7% 2.7%41.4% 53.4% 28.2% 30.8% 48.4% 11.3% 29.2% 46.9% 9.4%52.8% 56.4% 49.0% 33.6% 51.2% 14.6% 32.5% 49.5% 14.1%43.2% 54.2% 31.0% 29.7% 45.1% 12.4% 30.7% 46.4% 12.6%38.7% 51.7% 24.1% 29.7% 46.5% 10.3% 30.0% 46.8% 10.4%50.4% 56.5% 43.7% 32.0% 48.1% 14.3% 30.1% 47.2% 11.3%53.3% 57.8% 48.6% 30.6% 49.3% 10.9% 30.3% 48.6% 10.6%39.1% 46.9% 30.9% 31.2% 44.2% 16.4% 30.0% 43.4% 14.4%41.8% 52.0% 30.2% 34.3% 47.7% 19.3% 32.5% 46.5% 16.6%42.4% 50.5% 33.6% 31.9% 47.0% 14.9% 32.1% 47.4% 14.6%44.9% 51.6% 37.4% 28.1% 45.2% 9.0% 29.0% 46.3% 9.5%51.4% 55.3% 47.4% 29.5% 46.3% 11.5% 27.9% 45.0% 9.3%47.7% 56.4% 38.7% 28.3% 46.6% 8.0% 28.3% 46.3% 7.5%47.6% 55.0% 39.5% 33.9% 50.7% 15.6% 31.0% 48.1% 12.3%41.9% 52.6% 29.6% 28.7% 45.5% 9.6% 27.3% 44.5% 7.7%45.0% 54.0% 34.5% 28.0% 45.1% 8.5% 28.1% 45.9% 7.2%43.8% 51.6% 35.5% 28.9% 45.1% 10.0% 31.1% 50.5% 5.9%45.2% 52.5% 36.8% 35.9% 47.3% 23.2% 30.9% 45.3% 14.8%46.9% 55.7% 37.5% 31.0% 49.0% 11.6% 28.9% 47.4% 8.8%46.7% 54.3% 38.6% 30.2% 46.1% 12.9% 30.2% 46.3% 12.1%40.0% 53.7% 24.2% 28.6% 46.3% 8.7% 27.7% 45.5% 7.5%47.4% 52.7% 41.8% 31.4% 49.0% 12.3% 30.1% 47.9% 10.4%45.1% 53.3% 36.1% 30.6% 47.6% 11.7% 29.3% 46.6% 9.7%
BalaghatBarwaniBetulBhindBhopalChhatarpurChhindwaraDamoh DatiaDewasDharDindoriEast Nimar (Khandwa)GunaGwaliorHardaHoshangabadIndoreJabalpurJhabuaKatniMandlaMandsaurMorenaNarsimhapurNeemuchPannaRaisenRajgarhRatlamRewaSagarSatnaSehoreSeoniShahdolShajapurSheopurShivpuriSidhiTikamgarhUjjainUmariaVidishaWest Nimar (Khargone)
Madhya Pradesh
WPR - Rural 1991 WPR - Urban 2001 WPR - Urban 1991
Persons Male Female Persons Male Female Persons Male Female
District
Source: Census of India, 1991, 2001

336
Table EL 2 gives information on the percentage of total, main and
marginal workers to the total population for 1991 and 2001. The
information is segregated by sex and residence.
TABLE EL 2: PERCENTAGE OF TOTAL WORKERS, MAIN WORKERS AND MARGINAL
WORKERS TO TOTAL POPULATION BY RESIDENCE AND SEX IN DISTRICTS OF
MADHYA PRADESH, 1991, 2001
MAIN WORKERS
Census records a person as a Main workers if he/ she has
worked for a major part of the year preceding the
enumeration.
MARGINAL WORKERS
Census records a person as marginal workers if he/ she has
worked anytime during the preceding year, but has not
worked for a major part of the year.
Year Madhya Pradesh India
Share of Population 2001
Main Workers 31.7% 30.5%
Share of India 6.1%
Marginal Workers 11.1% 8.7%
Share of India 7.5%
Male Main Workers 44.9% 45.3%
Male Marginal Workers 6.8% 6.6%
Female Main Workers 17.3% 14.7%
Female Marginal Workers 15.8% 11.0%
Rural Main Workers 33.3% 31.0%
Rural Marginal Workers 13.8% 10.9%
Urban Main Workers 27.1% 29.3%
Urban Marginal Workers 3.5% 2.9%

337
EL 2: PERCENTAGE OF TOTAL WORKERS, MAIN WORKERS AND MARGINAL WORKERS TO TOTAL POPULATION BY RESIDENCE AND SEX IN DISTRICTS OF
MADHYA PRADESH, 1991, 2001
49.78 50.25 43.00 32.85 6.78 17.4047.46 48.39 38.90 36.07 8.56 12.3246.66 44.17 41.98 29.95 4.68 14.2227.37 36.82 26.38 27.79 0.99 9.0331.83 32.04 30.13 27.13 1.70 4.9141.02 40.22 34.35 29.94 6.67 10.2843.45 42.15 37.43 30.24 6.02 11.9140.94 44.85 35.81 32.14 5.13 12.7137.18 50.37 31.40 36.02 5.78 14.3541.04 44.32 36.67 32.76 4.37 11.5646.73 46.63 41.31 34.22 5.42 12.4151.02 57.08 45.29 45.00 5.73 12.0843.69 43.90 39.71 36.70 3.98 7.2037.04 40.94 31.55 29.79 5.49 11.1530.23 32.51 28.30 27.11 1.93 5.4042.46 44.93 36.69 31.97 5.77 12.9635.33 35.64 32.30 27.05 3.03 8.5934.34 36.20 33.09 31.11 1.25 5.0934.56 37.08 32.62 28.99 1.94 8.0954.04 52.57 39.30 35.00 14.74 17.5741.88 41.68 36.04 27.74 5.84 13.9451.32 51.87 47.33 35.94 3.99 15.9346.21 48.23 41.12 38.42 5.09 9.8128.73 37.12 27.33 28.35 1.40 8.7739.57 42.12 36.08 32.36 3.49 9.7647.12 48.00 43.20 38.86 3.92 9.1441.60 43.51 35.31 30.38 6.29 13.1337.38 36.58 33.59 27.43 3.79 9.1546.97 49.98 37.06 34.98 9.91 15.0045.99 45.05 39.71 33.30 6.28 11.7537.75 43.77 33.76 29.68 3.99 14.0939.07 41.51 34.51 31.53 4.56 9.9840.35 39.86 35.96 29.66 4.39 10.2042.01 41.94 36.36 28.62 5.65 13.3249.19 48.82 41.41 32.70 7.78 16.1243.35 43.74 37.56 29.18 5.79 14.5644.66 48.84 38.33 33.85 6.33 14.9939.74 41.10 33.47 27.40 6.27 13.7042.47 45.31 35.22 35.22 7.25 10.0943.02 41.37 36.10 29.72 6.92 11.6542.78 47.08 35.09 32.91 7.69 14.1739.80 44.11 36.31 34.34 3.49 9.7743.92 42.31 37.75 27.63 6.17 14.6837.50 37.13 33.09 28.45 4.41 8.6844.77 46.01 40.72 38.53 4.05 7.4841.06 42.75 36.07 31.66 4.99 11.09
BalaghatBarwaniBetulBhindBhopalChhatarpurChhindwaraDamoh DatiaDewasDharDindoriEast Nimar (Khandwa)GunaGwaliorHardaHoshangabadIndoreJabalpurJhabuaKatniMandlaMandsaurMorenaNarsimhapurNeemuchPannaRaisenRajgarhRatlamRewaSagarSatnaSehoreSeoniShahdolShajapurSheopurShivpuriSidhiTikamgarhUjjainUmariaVidishaWest Nimar (Khargone)
Madhya Pradesh
Workers
Total Workers Main Workers Marginal Workers
1991 2001 1991 2001 1991 2001
District
Census of India, 1991, 2001
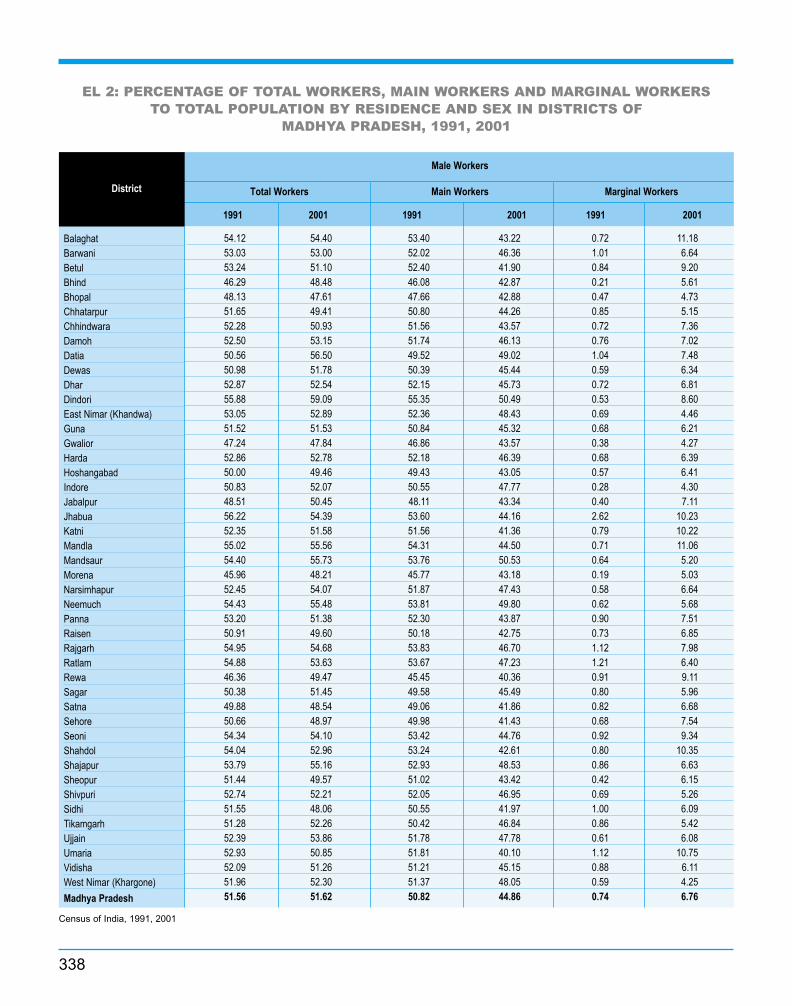
338
EL 2: PERCENTAGE OF TOTAL WORKERS, MAIN WORKERS AND MARGINAL WORKERS TO TOTAL POPULATION BY RESIDENCE AND SEX IN DISTRICTS OF
MADHYA PRADESH, 1991, 2001
54.12 54.40 53.40 43.22 0.72 11.1853.03 53.00 52.02 46.36 1.01 6.6453.24 51.10 52.40 41.90 0.84 9.2046.29 48.48 46.08 42.87 0.21 5.6148.13 47.61 47.66 42.88 0.47 4.7351.65 49.41 50.80 44.26 0.85 5.1552.28 50.93 51.56 43.57 0.72 7.3652.50 53.15 51.74 46.13 0.76 7.0250.56 56.50 49.52 49.02 1.04 7.4850.98 51.78 50.39 45.44 0.59 6.3452.87 52.54 52.15 45.73 0.72 6.8155.88 59.09 55.35 50.49 0.53 8.6053.05 52.89 52.36 48.43 0.69 4.4651.52 51.53 50.84 45.32 0.68 6.2147.24 47.84 46.86 43.57 0.38 4.2752.86 52.78 52.18 46.39 0.68 6.3950.00 49.46 49.43 43.05 0.57 6.4150.83 52.07 50.55 47.77 0.28 4.3048.51 50.45 48.11 43.34 0.40 7.1156.22 54.39 53.60 44.16 2.62 10.2352.35 51.58 51.56 41.36 0.79 10.2255.02 55.56 54.31 44.50 0.71 11.0654.40 55.73 53.76 50.53 0.64 5.2045.96 48.21 45.77 43.18 0.19 5.0352.45 54.07 51.87 47.43 0.58 6.6454.43 55.48 53.81 49.80 0.62 5.6853.20 51.38 52.30 43.87 0.90 7.5150.91 49.60 50.18 42.75 0.73 6.8554.95 54.68 53.83 46.70 1.12 7.9854.88 53.63 53.67 47.23 1.21 6.4046.36 49.47 45.45 40.36 0.91 9.1150.38 51.45 49.58 45.49 0.80 5.9649.88 48.54 49.06 41.86 0.82 6.6850.66 48.97 49.98 41.43 0.68 7.5454.34 54.10 53.42 44.76 0.92 9.3454.04 52.96 53.24 42.61 0.80 10.3553.79 55.16 52.93 48.53 0.86 6.6351.44 49.57 51.02 43.42 0.42 6.1552.74 52.21 52.05 46.95 0.69 5.2651.55 48.06 50.55 41.97 1.00 6.0951.28 52.26 50.42 46.84 0.86 5.4252.39 53.86 51.78 47.78 0.61 6.0852.93 50.85 51.81 40.10 1.12 10.7552.09 51.26 51.21 45.15 0.88 6.1151.96 52.30 51.37 48.05 0.59 4.2551.56 51.62 50.82 44.86 0.74 6.76
BalaghatBarwaniBetulBhindBhopalChhatarpurChhindwaraDamoh DatiaDewasDharDindoriEast Nimar (Khandwa)GunaGwaliorHardaHoshangabadIndoreJabalpurJhabuaKatniMandlaMandsaurMorenaNarsimhapurNeemuchPannaRaisenRajgarhRatlamRewaSagarSatnaSehoreSeoniShahdolShajapurSheopurShivpuriSidhiTikamgarhUjjainUmariaVidishaWest Nimar (Khargone)
Madhya Pradesh
Male Workers
Total Workers Main Workers Marginal Workers
1991 2001 1991 2001 1991 2001
District
Census of India, 1991, 2001

339
EL 2: PERCENTAGE OF TOTAL WORKERS, MAIN WORKERS AND MARGINAL WORKERS TO TOTAL POPULATION BY RESIDENCE AND SEX IN DISTRICTS OF
MADHYA PRADESH, 1991, 2001
45.46 46.19 32.63 22.71 12.83 23.4841.68 43.64 25.30 25.49 16.38 18.1539.84 37.00 31.20 17.57 8.64 19.43
4.16 22.77 2.21 9.61 1.95 13.1613.50 14.67 10.42 9.56 3.08 5.1128.60 29.65 15.15 13.46 13.45 16.1934.19 32.95 22.61 16.27 11.58 16.6828.17 35.64 18.21 16.63 9.96 19.0121.38 43.23 10.01 20.88 11.37 22.3530.29 36.33 21.81 19.16 8.48 17.1740.27 40.44 29.91 22.15 10.36 18.2946.08 55.05 35.07 39.47 11.01 15.5833.71 34.30 26.21 24.17 7.50 10.1320.51 28.99 9.52 12.26 10.99 16.73
9.76 14.42 5.97 7.68 3.79 6.7431.09 36.38 19.75 16.27 11.34 20.1118.88 20.24 13.09 9.22 5.79 11.0216.14 18.80 13.81 12.86 2.33 5.9419.11 22.37 15.47 13.19 3.64 9.1851.80 50.71 24.67 25.70 27.13 25.0130.73 31.16 19.52 13.26 11.21 17.9047.57 48.18 40.27 27.39 7.30 20.7937.57 40.39 27.78 25.74 9.79 14.65
7.40 23.63 4.50 10.32 2.90 13.3125.45 28.97 18.77 15.79 6.68 13.1839.37 40.13 31.95 27.35 7.42 12.7828.67 34.84 16.35 15.51 12.32 19.3321.99 21.79 14.73 10.02 7.26 11.7738.32 44.93 18.89 22.40 19.43 22.5336.62 36.09 24.99 18.78 11.63 17.3128.51 37.72 21.21 18.34 7.30 19.3826.23 30.28 17.40 15.75 8.83 14.5329.96 30.49 21.70 16.48 8.26 14.0132.38 34.19 21.19 14.50 11.19 19.6943.90 43.45 29.07 20.42 14.83 23.0331.97 34.12 20.89 15.15 11.08 18.9734.72 42.02 22.42 18.02 12.30 24.0026.45 31.62 13.54 9.46 12.91 22.1630.37 37.26 15.38 21.55 14.99 15.7133.77 34.20 20.43 16.58 13.34 17.6233.02 41.24 17.50 17.20 15.52 24.0426.24 33.73 19.65 20.04 6.59 13.6934.35 33.27 22.82 14.45 11.53 18.8220.80 20.98 12.36 9.37 8.44 11.6137.13 39.39 29.40 28.50 7.73 10.8929.55 33.10 19.90 17.31 9.65 15.79
BalaghatBarwaniBetulBhindBhopalChhatarpurChhindwaraDamoh DatiaDewasDharDindoriEast Nimar (Khandwa)GunaGwaliorHardaHoshangabadIndoreJabalpurJhabuaKatniMandlaMandsaurMorenaNarsimhapurNeemuchPannaRaisenRajgarhRatlamRewaSagarSatnaSehoreSeoniShahdolShajapurSheopurShivpuriSidhiTikamgarhUjjainUmariaVidishaWest Nimar (Khargone)
Madhya Pradesh
Female Workers
Total Workers Main Workers Marginal Workers
1991 2001 1991 2001 1991 2001
District
Census of India, 1991, 2001

340
EL 2: PERCENTAGE OF TOTAL WORKERS, MAIN WORKERS AND MARGINAL WORKERS TO TOTAL POPULATION BY RESIDENCE AND SEX IN DISTRICTS OF
MADHYA PRADESH, 1991, 2001
51.84 52.91 44.46 33.79 7.38 19.1250.19 50.88 40.29 36.98 9.90 13.9051.15 48.05 45.50 31.32 5.65 16.7328.09 40.10 26.92 29.44 1.17 10.6642.73 42.23 35.80 29.25 6.93 12.9843.59 42.97 35.75 30.91 7.84 12.0648.00 46.22 40.47 31.78 7.53 14.4443.01 47.33 37.20 32.74 5.81 14.5939.73 55.13 32.83 38.03 6.90 17.1044.62 49.42 39.13 35.11 5.49 14.3148.81 49.18 42.69 35.04 6.12 14.1451.97 58.31 45.99 45.92 5.98 12.3949.32 49.13 44.09 40.16 5.23 8.9739.16 44.08 32.51 30.79 6.65 13.2935.59 38.30 30.97 28.67 4.62 9.6346.36 49.44 39.36 33.91 7.00 15.5338.81 38.96 34.67 27.76 4.14 11.2043.90 45.72 40.57 34.70 3.33 11.0243.04 44.95 39.37 30.39 3.67 14.5656.08 54.46 40.26 35.58 15.82 18.8845.60 44.85 38.35 27.95 7.25 16.9053.67 54.28 49.43 36.92 4.24 17.3649.71 51.36 43.67 40.07 6.04 11.2929.89 40.02 28.18 29.73 1.71 10.2941.39 44.28 37.41 33.36 3.98 10.9252.80 53.57 47.92 42.60 4.88 10.9743.24 45.51 36.28 31.13 6.96 14.3838.75 38.15 34.44 27.75 4.31 10.4050.37 53.75 38.70 36.75 11.67 17.0053.34 51.31 44.65 36.01 8.69 15.3039.14 46.21 34.69 30.44 4.45 15.7741.77 44.51 36.04 31.98 5.73 12.5342.38 41.93 37.28 30.03 5.10 11.9044.87 44.99 38.17 29.67 6.70 15.3251.42 51.06 42.93 33.50 8.49 17.5647.72 48.96 40.56 30.60 7.16 18.3647.60 52.25 40.23 35.06 7.37 17.1941.85 43.42 34.84 27.83 7.01 15.5945.05 48.75 36.70 37.44 8.35 11.3143.84 43.45 36.46 30.46 7.38 12.9945.18 49.49 36.32 33.94 8.86 15.5546.90 52.40 41.47 38.69 5.43 13.7146.66 44.62 39.70 28.49 6.96 16.1339.97 39.45 34.64 29.24 5.33 10.2147.37 48.70 42.71 40.34 4.66 8.3645.05 47.11 38.66 33.30 6.39 13.81
BalaghatBarwaniBetulBhindBhopalChhatarpurChhindwaraDamoh DatiaDewasDharDindoriEast Nimar (Khandwa)GunaGwaliorHardaHoshangabadIndoreJabalpurJhabuaKatniMandlaMandsaurMorenaNarsimhapurNeemuchPannaRaisenRajgarhRatlamRewaSagarSatnaSehoreSeoniShahdolShajapurSheopurShivpuriSidhiTikamgarhUjjainUmariaVidishaWest Nimar (Khargone)
Madhya Pradesh
Rural Workers
Total Workers Main Workers Marginal Workers
1991 2001 1991 2001 1991 2001
District
Census of India, 1991, 2001

341
EL 2: PERCENTAGE OF TOTAL WORKERS, MAIN WORKERS AND MARGINAL WORKERS TO TOTAL POPULATION BY RESIDENCE AND SEX IN DISTRICTS OF
MADHYA PRADESH, 1991, 2001
55.04 55.45 54.29 43.41 0.75 12.0453.93 53.45 52.79 46.08 1.14 7.3755.23 52.66 54.25 42.26 0.98 10.4047.27 50.27 47.04 44.29 0.23 5.9852.29 49.61 51.09 41.71 1.20 7.9053.08 50.49 52.12 44.91 0.96 5.5854.72 52.49 53.90 44.19 0.82 8.3054.15 54.55 53.33 46.68 0.82 7.8752.03 58.71 50.93 50.15 1.10 8.5651.91 53.31 51.23 46.09 0.68 7.2253.34 52.65 52.54 45.17 0.80 7.4856.34 59.58 55.79 50.85 0.55 8.7355.33 54.71 54.49 49.62 0.84 5.0952.93 53.01 52.15 46.00 0.78 7.0150.89 50.19 50.17 44.45 0.72 5.7454.83 54.60 54.05 47.52 0.78 7.0852.00 50.86 51.31 43.20 0.69 7.6653.56 53.51 53.14 46.51 0.42 7.0052.76 53.43 52.19 42.17 0.57 11.2657.09 55.03 54.29 44.13 2.80 10.9053.68 52.51 52.76 40.40 0.92 12.1156.12 56.57 55.46 44.67 0.66 11.9055.65 56.61 54.95 50.94 0.70 5.6746.92 49.54 46.71 44.15 0.21 5.3953.43 55.15 52.79 48.05 0.64 7.1056.39 57.17 55.69 50.87 0.70 6.3054.24 52.31 53.29 44.43 0.95 7.8851.68 50.32 50.91 42.86 0.77 7.4656.54 56.07 55.27 47.37 1.27 8.7057.84 55.54 56.26 48.09 1.58 7.4546.91 50.53 45.91 40.54 1.00 9.9952.01 52.98 51.09 45.76 0.92 7.2250.50 48.96 49.57 41.34 0.93 7.6251.64 49.81 50.89 41.67 0.75 8.1455.35 55.02 54.36 45.07 0.99 9.9556.43 55.21 55.48 42.61 0.95 12.6055.03 56.18 54.11 48.94 0.92 7.2452.61 50.34 52.19 43.58 0.42 6.7653.96 53.61 53.20 48.23 0.76 5.3851.63 48.58 50.57 42.01 1.06 6.5752.49 53.32 51.56 47.77 0.93 5.5555.67 56.98 54.85 49.63 0.82 7.3554.29 51.79 53.11 40.48 1.18 11.3153.75 52.61 52.75 45.89 1.00 6.7252.68 52.93 52.03 48.42 0.65 4.5153.27 53.08 52.39 45.23 0.88 7.85
BalaghatBarwaniBetulBhindBhopalChhatarpurChhindwaraDamoh DatiaDewasDharDindoriEast Nimar (Khandwa)GunaGwaliorHardaHoshangabadIndoreJabalpurJhabuaKatniMandlaMandsaurMorenaNarsimhapurNeemuchPannaRaisenRajgarhRatlamRewaSagarSatnaSehoreSeoniShahdolShajapurSheopurShivpuriSidhiTikamgarhUjjainUmariaVidishaWest Nimar (Khargone)
Madhya Pradesh
Rural Male Workers
Total Workers Main Workers Marginal Workers
1991 2001 1991 2001 1991 2001
District
Census of India, 1991, 2001

342
EL 2: PERCENTAGE OF TOTAL WORKERS, MAIN WORKERS AND MARGINAL WORKERS TO TOTAL POPULATION BY RESIDENCE AND SEX IN DISTRICTS OF
MADHYA PRADESH, 1991, 2001
48.67 50.45 34.72 24.46 13.95 25.9946.34 48.27 27.41 27.70 18.93 20.5746.99 43.32 36.59 20.12 10.40 23.20
4.50 27.78 2.18 11.45 2.32 16.3331.78 33.91 18.29 15.21 13.49 18.7032.50 34.30 16.61 14.79 15.89 19.5141.07 39.71 26.59 18.88 14.48 20.8330.75 39.34 19.44 17.30 11.31 22.0425.09 50.94 11.30 23.86 13.79 27.0836.80 45.27 26.16 23.39 10.64 21.8844.09 45.59 32.44 24.59 11.65 21.0047.55 57.04 36.07 40.97 11.48 16.0742.93 43.17 33.02 30.06 9.91 13.1123.42 33.95 10.07 13.54 13.35 20.4116.77 24.04 7.34 9.73 9.43 14.3137.15 43.85 23.38 19.17 13.77 24.6824.10 25.71 16.10 10.57 8.00 15.1433.39 37.39 26.90 22.09 6.49 15.3032.58 35.80 25.56 17.67 7.02 18.1355.05 53.88 25.98 26.96 29.07 26.9237.11 36.79 23.19 14.84 13.92 21.9551.21 52.02 43.37 29.23 7.84 22.7943.46 45.89 31.80 28.75 11.66 17.14
8.76 28.36 5.21 12.06 3.55 16.3028.23 32.33 20.60 17.22 7.63 15.1149.03 49.83 39.75 33.99 9.28 15.8431.03 38.05 17.41 16.52 13.62 21.5324.11 24.37 15.80 10.65 8.31 13.7243.70 51.26 20.83 25.39 22.87 25.8748.63 46.92 32.50 23.48 16.13 23.4430.92 41.68 22.82 19.86 8.10 21.8230.19 34.87 19.02 16.32 11.17 18.5533.63 34.43 24.04 17.97 9.59 16.4637.36 39.69 24.05 16.48 13.31 23.2147.41 47.04 31.25 21.78 16.16 25.2638.68 42.58 25.07 18.34 13.61 24.2439.52 48.01 25.13 20.10 14.39 27.9129.62 35.71 15.13 10.26 14.49 25.4534.54 43.07 17.25 24.81 17.29 18.2635.50 38.01 21.36 18.25 14.14 19.7636.76 45.14 18.76 18.27 18.00 26.8737.52 47.58 27.17 27.16 10.35 20.4238.65 37.09 25.61 15.91 13.04 21.1824.17 24.35 13.88 10.15 10.29 14.2041.76 44.28 32.86 31.87 8.90 12.4136.13 40.68 23.76 20.44 12.37 20.24
BalaghatBarwaniBetulBhindBhopalChhatarpurChhindwaraDamoh DatiaDewasDharDindoriEast Nimar (Khandwa)GunaGwaliorHardaHoshangabadIndoreJabalpurJhabuaKatniMandlaMandsaurMorenaNarsimhapurNeemuchPannaRaisenRajgarhRatlamRewaSagarSatnaSehoreSeoniShahdolShajapurSheopurShivpuriSidhiTikamgarhUjjainUmariaVidishaWest Nimar (Khargone)
Madhya Pradesh
Rural Female Workers
Total Workers Main Workers Marginal Workers
1991 2001 1991 2001 1991 2001
District
Census of India, 1991, 2001

343
EL 2: PERCENTAGE OF TOTAL WORKERS, MAIN WORKERS AND MARGINAL WORKERS TO TOTAL POPULATION BY RESIDENCE AND SEX IN DISTRICTS OF
MADHYA PRADESH, 1991, 2001
30.17 33.06 29.10 26.76 1.07 6.3032.13 33.81 31.15 30.73 0.98 3.0827.01 27.18 26.58 23.94 0.43 3.2424.56 26.28 24.24 22.48 0.32 3.8029.10 29.58 28.71 26.62 0.39 2.9630.24 30.47 28.50 26.48 1.74 3.9928.30 29.60 27.32 25.51 0.98 4.0931.58 34.16 29.53 29.57 2.05 4.5927.27 33.42 25.86 28.86 1.41 4.5630.81 30.80 29.61 26.52 1.20 4.2832.94 33.83 32.13 30.11 0.81 3.7230.88 31.70 30.40 26.18 0.48 5.5228.86 29.72 28.17 27.32 0.69 2.4028.33 29.36 27.59 26.12 0.74 3.2427.07 28.70 26.73 26.08 0.34 2.6227.22 28.27 26.27 24.79 0.95 3.4827.32 28.22 26.85 25.47 0.47 2.7530.14 32.14 29.79 29.58 0.35 2.5628.17 31.15 27.54 27.93 0.63 3.2232.53 32.65 29.24 28.83 3.29 3.8228.96 29.86 28.04 26.94 0.92 2.9229.54 30.80 27.89 27.38 1.65 3.4232.27 34.57 30.96 31.18 1.31 3.3924.76 26.62 24.40 23.39 0.36 3.2329.16 30.76 28.49 27.10 0.67 3.6632.49 33.58 31.04 29.19 1.45 4.3930.67 29.71 28.80 25.23 1.87 4.4830.04 29.68 29.04 26.04 1.00 3.6430.14 31.98 28.90 26.55 1.24 5.4330.29 30.64 29.16 27.08 1.13 3.5630.01 31.20 28.57 25.75 1.44 5.4532.53 34.27 30.79 30.45 1.74 3.8232.10 31.93 30.63 28.24 1.47 3.6929.01 28.06 28.14 23.82 0.87 4.2427.90 29.47 26.91 25.80 0.99 3.6728.33 28.34 27.28 24.97 1.05 3.3731.03 33.86 29.51 28.55 1.52 5.3127.27 28.72 25.39 25.08 1.88 3.6428.07 28.04 26.94 24.11 1.13 3.9331.14 28.94 30.88 25.30 0.26 3.6430.95 35.86 29.06 28.13 1.89 7.7328.94 31.00 28.43 27.47 0.51 3.5330.15 30.23 27.96 23.12 2.19 7.1127.68 28.61 26.94 25.54 0.74 3.0730.05 31.35 29.46 28.66 0.59 2.6929.26 30.64 28.41 27.12 0.85 3.52
BalaghatBarwaniBetulBhindBhopalChhatarpurChhindwaraDamoh DatiaDewasDharDindoriEast Nimar (Khandwa)GunaGwaliorHardaHoshangabadIndoreJabalpurJhabuaKatniMandlaMandsaurMorenaNarsimhapurNeemuchPannaRaisenRajgarhRatlamRewaSagarSatnaSehoreSeoniShahdolShajapurSheopurShivpuriSidhiTikamgarhUjjainUmariaVidishaWest Nimar (Khargone)
Madhya Pradesh
Urban Workers
Total Workers Main Workers Marginal Workers
1991 2001 1991 2001 1991 2001
District
Census of India, 1991, 2001

344
EL 2: PERCENTAGE OF TOTAL WORKERS, MAIN WORKERS AND MARGINAL WORKERS TO TOTAL POPULATION BY RESIDENCE AND SEX IN DISTRICTS OF
MADHYA PRADESH, 1991, 2001
45.62 47.78 45.22 42.01 0.40 5.7748.10 50.48 47.80 48.01 0.30 2.4744.88 44.46 44.63 40.37 0.25 4.0942.47 42.65 42.34 38.24 0.13 4.4147.07 47.13 46.79 43.17 0.28 3.9645.66 45.53 45.26 41.94 0.40 3.5944.40 46.20 43.99 41.69 0.41 4.5145.14 47.14 44.67 43.80 0.47 3.3444.75 48.55 43.95 44.95 0.80 3.6048.36 47.75 48.04 43.73 0.32 4.0249.84 52.02 49.62 48.41 0.22 3.6146.61 49.37 46.33 43.51 0.28 5.8647.07 47.98 46.76 45.22 0.31 2.7645.70 45.99 45.42 42.79 0.28 3.2045.05 46.27 44.88 42.99 0.17 3.2845.23 46.13 44.97 42.26 0.26 3.8745.44 46.34 45.15 42.74 0.29 3.6049.65 51.47 49.42 48.29 0.23 3.1845.38 48.23 45.10 44.20 0.28 4.0347.35 47.87 46.55 44.45 0.80 3.4247.85 48.18 47.52 44.85 0.33 3.3345.20 47.04 44.08 43.05 1.12 3.9949.43 51.91 49.02 48.79 0.41 3.1242.68 43.32 42.57 39.59 0.11 3.7346.91 48.41 46.66 44.16 0.25 4.2549.46 51.18 49.04 47.08 0.42 4.1046.39 45.07 45.86 40.08 0.53 4.9946.82 46.48 46.27 42.30 0.55 4.1847.17 48.11 46.77 43.55 0.40 4.5648.63 49.27 48.19 45.25 0.44 4.0243.41 44.21 42.98 39.51 0.43 4.7046.47 47.70 45.97 44.83 0.50 2.8747.44 47.00 47.03 43.82 0.41 3.1846.29 45.18 45.89 40.35 0.40 4.8345.02 46.31 44.73 42.14 0.29 4.1746.27 46.58 45.94 42.62 0.33 3.9648.05 50.68 47.50 46.73 0.55 3.9544.52 45.49 44.09 42.57 0.43 2.9245.89 45.09 45.62 40.44 0.27 4.6550.51 45.08 50.39 41.76 0.12 3.3245.25 47.27 44.74 42.43 0.51 4.8447.42 48.99 47.14 44.90 0.28 4.0946.31 46.05 45.50 38.18 0.81 7.8745.48 46.25 45.10 42.39 0.38 3.8647.92 48.97 47.69 46.09 0.23 2.8846.61 47.64 46.28 43.87 0.33 3.77
BalaghatBarwaniBetulBhindBhopalChhatarpurChhindwaraDamoh DatiaDewasDharDindoriEast Nimar (Khandwa)GunaGwaliorHardaHoshangabadIndoreJabalpurJhabuaKatniMandlaMandsaurMorenaNarsimhapurNeemuchPannaRaisenRajgarhRatlamRewaSagarSatnaSehoreSeoniShahdolShajapurSheopurShivpuriSidhiTikamgarhUjjainUmariaVidishaWest Nimar (Khargone)
Madhya Pradesh
Urban Male Workers
Total Workers Main Workers Marginal Workers
1991 2001 1991 2001 1991 2001
District
Census of India, 1991, 2001

345
EL 2: PERCENTAGE OF TOTAL WORKERS, MAIN WORKERS AND MARGINAL WORKERS TO TOTAL POPULATION BY RESIDENCE AND SEX IN DISTRICTS OF
MADHYA PRADESH, 1991, 2001
13.69 17.92 11.91 11.08 1.78 6.8414.92 16.10 13.20 12.37 1.72 3.73
7.22 8.34 6.59 6.02 0.63 2.322.90 6.85 2.35 3.76 0.55 3.098.98 10.05 8.47 8.21 0.51 1.84
12.35 13.22 9.05 8.79 3.30 4.4310.53 11.66 8.93 8.03 1.60 3.6316.43 19.74 12.61 13.76 3.82 5.98
7.21 16.02 5.08 10.35 2.13 5.6711.28 12.40 9.10 7.84 2.18 4.5614.00 13.05 12.53 9.21 1.47 3.8413.67 12.99 12.97 7.82 0.70 5.17
9.31 10.20 8.21 8.19 1.10 2.018.49 10.83 7.23 7.55 1.26 3.285.72 8.19 5.19 6.34 0.53 1.857.07 8.45 5.35 5.41 1.72 3.046.80 7.99 6.13 6.19 0.67 1.808.46 10.73 7.98 8.85 0.48 1.888.72 12.05 7.69 9.75 1.03 2.30
16.41 16.25 10.41 12.01 6.00 4.248.07 9.70 6.50 7.24 1.57 2.46
12.79 13.68 10.57 10.86 2.22 2.8213.89 16.16 11.61 12.49 2.28 3.67
2.75 6.78 2.09 4.13 0.66 2.659.36 11.29 8.22 8.28 1.14 3.01
14.08 14.56 11.52 9.85 2.56 4.7112.57 12.38 9.16 8.47 3.41 3.9110.41 10.26 8.88 7.24 1.53 3.0211.33 14.34 9.18 7.94 2.15 6.4010.61 10.90 8.73 7.84 1.88 3.0614.38 16.42 11.77 10.13 2.61 6.2916.59 19.26 13.43 14.39 3.16 4.8714.57 14.86 11.90 10.59 2.67 4.27
9.45 9.05 8.05 5.47 1.40 3.589.30 11.45 7.54 8.31 1.76 3.147.53 8.00 5.63 5.30 1.90 2.70
12.31 15.61 9.74 8.81 2.57 6.807.68 9.63 4.14 5.16 3.54 4.477.16 8.54 5.02 5.43 2.14 3.115.86 9.99 5.41 5.97 0.45 4.02
14.82 23.18 11.36 12.23 3.46 10.958.80 11.57 8.04 8.64 0.76 2.93
12.10 12.94 8.36 6.66 3.74 6.287.47 8.73 6.33 6.54 1.14 2.19
10.39 12.30 9.40 9.81 0.99 2.499.70 11.70 8.25 8.46 1.45 3.24
BalaghatBarwaniBetulBhindBhopalChhatarpurChhindwaraDamoh DatiaDewasDharDindoriEast Nimar (Khandwa)GunaGwaliorHardaHoshangabadIndoreJabalpurJhabuaKatniMandlaMandsaurMorenaNarsimhapurNeemuchPannaRaisenRajgarhRatlamRewaSagarSatnaSehoreSeoniShahdolShajapurSheopurShivpuriSidhiTikamgarhUjjainUmariaVidishaWest Nimar (Khargone)
Madhya Pradesh
Urban Female Workers
Total Workers Main Workers Marginal Workers
1991 2001 1991 2001 1991 2001
District
Census of India, 1991, 2001

346
Table EL 3 gives the percentage of main workers employed in primary,
secondary and tertiary sector and the farm and non-farm sectors in 1991.
Besides this the table also details the percentage main workers employed
in different industrial categories.
TABLE EL 3: EMPLOYMENT INDICATORS IN DISTRICTS OF MADHYA PRADESH, 1991
PRIMARY SECTOR
Related with agriculture and allied activities and mining and
quarrying.
SECONDARY SECTOR
Related with construction and all types of manufacturing
activities.
TERTIARY SECTOR
Related with all types of services.
NON-FARM SECTOR
This is employment in all types of activities not based on
farming and agriculture, and includes secondary sector, terti-
ary sector and mining and quarrying from the primary sector.
CLASSIFICATION OF WORKERS
Census classifies workers in nine industrial categories. These
are explained below.
CULTIVATORS
For purpose of census a person is working as cultivator if he
or she is engaged as employer, single worker or family worker
in cultivation of land owned or held from government or held
from private person or institutions for payment in money,
kind or share. Cultivation includes agriculture operations for
all produce except fruit growing, vegetable growing, or
keeping of orchards or groves or working of plantations.
AGRICULTURE LABOURERS
Person working on another persons land for wages in money,
kind or share are enumerated as agricultural labourers. An
agricultural labourer has no risk in the cultivation and he has
no right of lease or contract on land on which he works.
LIVESTOCK, FORESTRY, FISHING, HUNTING, AND PLANTATION,ORCHARDS AND ALLIED ACTIVITIES
Worker involved in any of these activities and activities allied
with agriculture but not concerned with agriculture
operations.
HOUSEHOLD INDUSTRY (MANUFACTURING, PROCESSING,SERVICING AND REPAIRS IN HOUSEHOLD INDUSTRY)Persons working in an industry located at home or within the
village in rural areas and only within the precincts of the
house where the household lives in urban areas.
OTHER CATEGORIES ARE SELF EXPLANATORY
Mining and Quarrying; Non household Industry;
Construction; Trade and Commerce; Transport, Storage and
Communications; Other Services.
Source: Census of India, 1991
Year Madhya Pradesh India
Employment Share 1991
Primary 75.4% 67.5%
Secondary 9.2% 12.0%
Tertiary 15.4% 20.5%
Non-Farm 25.4% 33.1%
As % of Main Workers 1991
Cultivators 49.5% 38.7%
Agriculture Labourers 23.7% 26.1%

347
EL 3: EMPLOYMENT INDICATORS IN DISTRICTS OF MADHYA PRADESH, 1991
83.5% 7.8% 8.6% 17.9 87.2% 7.2% 5.6% 14.086.8% 3.9% 9.3% 13.2 94.0% 1.8% 4.2% 6.184.8% 4.7% 10.5% 17.5 91.5% 3.1% 5.4% 9.079.9% 4.3% 15.8% 20.2 89.3% 2.1% 8.6% 10.824.9% 24.5% 50.6% 75.5 87.1% 5.9% 7.0% 13.582.6% 6.0% 11.5% 17.5 90.1% 4.4% 5.5% 10.081.3% 5.4% 13.4% 23.2 89.7% 3.3% 6.9% 12.063.8% 24.0% 12.1% 36.3 72.8% 20.9% 6.3% 27.378.9% 5.9% 15.2% 21.2 90.0% 3.3% 6.8% 10.176.6% 10.3% 13.2% 23.5 89.6% 4.2% 6.2% 10.484.1% 5.9% 10.0% 15.9 90.6% 3.8% 5.6% 9.493.2% 2.1% 4.7% 6.9 94.4% 1.9% 3.7% 5.676.7% 9.8% 13.5% 23.4 91.3% 3.4% 5.3% 8.879.1% 6.8% 14.1% 21.0 91.5% 3.3% 5.2% 8.643.3% 18.0% 38.7% 57.3 88.6% 3.6% 7.8% 12.481.0% 6.4% 12.6% 19.1 91.0% 3.8% 5.2% 9.166.8% 10.6% 22.6% 33.4 85.4% 6.0% 8.6% 14.834.3% 22.8% 42.9% 65.8 81.7% 8.0% 10.3% 18.547.0% 22.3% 30.7% 53.2 82.7% 10.3% 6.9% 17.490.6% 2.7% 6.7% 9.6 95.2% 1.6% 3.2% 5.172.7% 11.9% 15.4% 29.1 85.0% 8.6% 6.5% 16.987.4% 3.5% 9.1% 12.6 92.4% 2.6% 4.9% 7.681.5% 6.1% 12.4% 18.7 90.9% 3.5% 5.6% 9.379.6% 5.5% 14.9% 20.8 91.4% 2.5% 6.2% 8.979.8% 6.7% 13.5% 20.3 88.0% 4.6% 7.4% 12.078.5% 7.1% 14.4% 21.9 90.9% 4.1% 5.0% 9.586.3% 4.4% 9.3% 15.6 91.6% 3.3% 5.0% 10.178.6% 9.0% 12.3% 21.9 86.9% 5.7% 7.4% 13.782.4% 6.6% 11.1% 17.7 90.8% 4.2% 4.9% 9.274.2% 9.1% 16.7% 25.9 92.1% 3.4% 4.5% 7.979.7% 6.9% 13.4% 20.5 86.3% 5.1% 8.6% 13.957.4% 25.6% 17.0% 43.0 73.4% 20.6% 6.0% 27.074.2% 12.7% 13.1% 26.9 83.7% 9.2% 7.1% 17.681.4% 5.9% 12.6% 18.6 90.4% 3.6% 6.0% 9.687.3% 3.4% 9.3% 12.7 91.7% 2.4% 5.9% 8.384.4% 5.0% 10.6% 21.9 92.3% 3.0% 4.6% 10.782.9% 5.8% 11.3% 17.2 90.4% 3.9% 5.7% 9.686.8% 3.6% 9.5% 13.2 94.0% 1.8% 4.2% 6.084.6% 3.8% 11.6% 16.5 92.6% 2.1% 5.3% 8.387.5% 4.3% 8.2% 14.7 90.6% 3.6% 5.8% 10.886.4% 4.6% 9.0% 13.7 92.1% 3.3% 4.7% 8.065.9% 13.6% 20.5% 34.2 90.3% 4.2% 5.5% 9.886.9% 4.8% 8.3% 17.1 91.0% 4.0% 5.0% 9.879.3% 6.2% 14.6% 22.0 91.1% 3.3% 5.6% 10.383.5% 5.3% 11.2% 16.6 90.8% 3.2% 6.0% 9.275.4% 9.2% 15.4% 25.4 89.2% 4.9% 5.9% 11.3
BalaghatBarwaniBetulBhindBhopalChhatarpurChhindwaraDamoh DatiaDewasDharDindoriEast Nimar (Khandwa)GunaGwaliorHardaHoshangabadIndoreJabalpurJhabuaKatniMandlaMandsaurMorenaNarsimhapurNeemuchPannaRaisenRajgarhRatlamRewaSagarSatnaSehoreSeoniShahdolShajapurSheopurShivpuriSidhiTikamgarhUjjainUmariaVidishaWest Nimar (Khargone)
Madhya Pradesh
Employment Share: All Employment Share: Rural
Primary Secondary Tertiary Non-Farm Sector Primary Secondary Tertiary Non-Farm SectorDistrict
Source: Census of India, 1991

348
EL 3: EMPLOYMENT INDICATORS IN DISTRICTS OF MADHYA PRADESH, 1991
30.9% 16.6% 52.4% 74.8 52.8% 27.5% 1.8%34.8% 19.3% 46.0% 65.3 62.7% 23.3% 0.8%35.0% 16.9% 48.2% 81.5 56.8% 24.2% 1.5%39.7% 13.9% 46.4% 60.6 66.5% 12.6% 0.6%
5.5% 30.2% 64.3% 94.9 13.6% 9.2% 1.6%43.2% 14.0% 42.8% 56.8 59.6% 20.5% 2.4%39.4% 15.6% 44.9% 78.2 50.0% 25.9% 0.9%12.8% 42.0% 45.2% 87.5 36.2% 26.1% 1.4%24.0% 19.0% 57.0% 76.2 63.8% 14.0% 0.9%27.2% 33.3% 39.6% 73.0 43.5% 31.8% 1.2%26.8% 24.1% 49.2% 73.3 59.2% 24.1% 0.7%39.9% 12.1% 48.0% 60.9 70.7% 21.6% 0.8%16.5% 36.1% 47.5% 83.6 41.5% 33.3% 1.9%18.5% 24.0% 57.6% 81.6 58.9% 18.8% 1.3%12.4% 27.9% 59.8% 87.9 31.8% 9.5% 1.4%22.4% 21.7% 55.9% 77.6 40.4% 39.0% 1.6%11.6% 24.1% 64.3% 88.5 34.4% 29.6% 2.6%5.9% 31.8% 62.4% 94.2 18.5% 14.8% 0.9%8.6% 35.2% 56.2% 91.7 21.7% 23.2% 1.9%
24.7% 18.1% 57.1% 75.3 84.1% 5.9% 0.4%14.5% 27.9% 57.6% 86.9 42.4% 27.6% 0.9%23.4% 14.1% 62.6% 76.8 59.2% 27.1% 1.1%28.6% 20.7% 50.7% 71.5 59.0% 21.0% 1.3%32.8% 17.6% 49.5% 68.2 72.2% 6.4% 0.6%17.7% 22.6% 59.6% 82.4 39.8% 38.9% 1.0%29.2% 18.9% 51.9% 71.2 59.4% 17.2% 1.6%41.2% 13.6% 45.2% 61.6 55.4% 27.0% 2.0%25.8% 30.3% 43.8% 74.3 38.9% 37.6% 1.5%26.3% 22.1% 51.7% 73.9 58.1% 21.4% 2.8%15.5% 27.8% 56.6% 84.5 55.0% 18.1% 1.1%35.2% 19.2% 45.6% 65.0 41.1% 36.9% 1.4%12.0% 39.7% 48.3% 88.1 32.7% 22.7% 1.7%27.6% 30.0% 42.4% 72.6 42.3% 29.2% 1.6%26.0% 20.3% 53.7% 74.1 49.8% 30.7% 0.9%19.8% 19.2% 61.0% 80.3 51.9% 33.8% 1.6%43.8% 15.2% 41.1% 79.2 52.6% 24.8% 0.7%35.1% 17.8% 47.1% 64.9 50.1% 30.8% 1.9%28.5% 18.6% 52.9% 71.7 70.8% 14.5% 1.4%23.4% 16.7% 59.9% 78.8 70.1% 12.3% 1.1%34.0% 16.9% 49.1% 82.6 60.0% 24.1% 1.2%51.6% 12.9% 35.5% 48.6 73.5% 11.7% 1.1%11.6% 34.5% 53.9% 88.7 40.8% 23.8% 1.2%57.5% 10.6% 31.9% 68.8 54.6% 27.0% 1.3%18.9% 20.9% 60.2% 81.4 43.5% 33.3% 1.2%23.3% 23.0% 53.7% 76.7 49.7% 32.4% 1.3%19.8% 26.6% 53.7% 82.1 49.5% 23.7% 1.3%
BalaghatBarwaniBetulBhindBhopalChhatarpurChhindwaraDamoh DatiaDewasDharDindoriEast Nimar (Khandwa)GunaGwaliorHardaHoshangabadIndoreJabalpurJhabuaKatniMandlaMandsaurMorenaNarsimhapurNeemuchPannaRaisenRajgarhRatlamRewaSagarSatnaSehoreSeoniShahdolShajapurSheopurShivpuriSidhiTikamgarhUjjainUmariaVidishaWest Nimar (Khargone)
Madhya Pradesh
Employment Share: Urban All All All
Primary Secondary Tertiary Non-Farm Cultivators: Share Agricultural Agriculture Allied:Sector of Main Workers Labour: Share Share of Main
of Main Workers Workers
District
Source: Census of India, 1991

349
EL 3: EMPLOYMENT INDICATORS IN DISTRICTS OF MADHYA PRADESH, 1991
1.4% 3.4% 3.7% 0.7% 3.0% 0.7% 5.0%0.0% 1.0% 2.3% 0.7% 3.9% 1.2% 4.2%2.4% 1.3% 2.0% 1.4% 3.1% 1.3% 6.1%0.1% 1.1% 2.0% 1.2% 3.9% 1.0% 10.9%0.4% 1.1% 14.5% 8.8% 15.9% 6.9% 27.8%0.1% 2.9% 1.9% 1.2% 4.1% 1.1% 6.2%4.4% 1.7% 2.2% 1.5% 4.2% 1.3% 7.8%0.2% 14.9% 7.6% 1.5% 4.8% 1.4% 5.9%0.1% 1.8% 2.5% 1.6% 4.6% 1.0% 9.6%0.1% 1.9% 7.1% 1.3% 4.1% 1.4% 7.6%0.0% 1.0% 3.8% 1.1% 3.6% 1.2% 5.3%0.1% 1.2% 0.6% 0.3% 1.2% 0.2% 3.2%0.1% 1.2% 6.8% 1.8% 5.5% 2.0% 6.0%0.1% 2.5% 2.6% 1.7% 4.4% 1.1% 8.6%0.6% 1.8% 11.7% 4.6% 11.0% 3.9% 23.8%0.0% 1.9% 2.7% 1.8% 4.9% 1.7% 6.0%0.2% 2.4% 5.1% 3.0% 6.7% 3.7% 12.3%0.1% 1.3% 17.5% 4.0% 16.6% 6.3% 19.9%0.2% 4.4% 14.8% 3.1% 10.0% 4.4% 16.2%0.2% 0.9% 0.8% 1.0% 2.2% 0.6% 3.9%1.8% 2.6% 8.3% 1.1% 6.1% 3.1% 6.1%0.1% 1.5% 1.3% 0.7% 2.7% 0.7% 5.7%0.2% 1.4% 3.2% 1.5% 5.4% 1.4% 5.7%0.4% 0.7% 3.1% 1.8% 4.4% 1.9% 8.6%0.1% 3.5% 2.1% 1.1% 4.8% 1.2% 7.5%0.3% 1.1% 4.4% 1.6% 5.5% 2.3% 6.7%1.8% 2.3% 1.3% 0.9% 3.0% 0.7% 5.6%0.6% 2.3% 5.3% 1.4% 4.1% 1.2% 7.0%0.1% 2.6% 2.6% 1.4% 4.2% 1.1% 5.7%0.0% 1.7% 5.4% 2.1% 6.7% 2.7% 7.4%0.2% 3.0% 2.6% 1.3% 3.7% 1.2% 8.5%0.3% 19.9% 3.8% 1.9% 5.6% 2.1% 9.3%1.1% 6.1% 5.2% 1.3% 4.9% 1.7% 6.4%0.0% 1.9% 2.5% 1.6% 4.1% 1.4% 7.1%0.0% 1.3% 1.3% 0.8% 3.0% 0.9% 5.4%6.3% 1.7% 2.3% 1.0% 3.2% 1.1% 6.3%0.0% 1.9% 2.3% 1.6% 4.4% 1.1% 5.7%0.1% 0.9% 1.6% 1.1% 3.4% 1.0% 5.1%1.0% 1.0% 1.5% 1.3% 3.7% 1.0% 7.0%2.2% 1.7% 1.5% 1.1% 2.3% 0.7% 5.3%0.1% 2.3% 1.5% 0.8% 2.9% 0.7% 5.3%0.1% 1.8% 9.3% 2.5% 7.2% 2.5% 10.8%4.0% 2.0% 1.3% 1.5% 2.5% 0.7% 5.1%1.2% 1.7% 2.8% 1.6% 5.5% 1.4% 7.6%0.0% 1.3% 2.8% 1.2% 4.0% 1.2% 5.9%0.8% 2.8% 4.7% 1.7% 5.2% 1.8% 8.3%
BalaghatBarwaniBetulBhindBhopalChhatarpurChhindwaraDamoh DatiaDewasDharDindoriEast Nimar (Khandwa)GunaGwaliorHardaHoshangabadIndoreJabalpurJhabuaKatniMandlaMandsaurMorenaNarsimhapurNeemuchPannaRaisenRajgarhRatlamRewaSagarSatnaSehoreSeoniShahdolShajapurSheopurShivpuriSidhiTikamgarhUjjainUmariaVidishaWest Nimar (Khargone)
Madhya Pradesh
All All All All All All All
Mining: Share Household Non Household Construction: Trade And Transport etc.: Other Services: of Main Manufacturing: Manufacturing: Share of Main Commerce: Share Share of Main Share of MainWorkers Share of Main Share of Main Workers of Main Workers Workers Workers
Workers Workers
District
Source: Census of India, 1991

350
Table EL 4 gives the numbers and percentages of total, main, marginal and
non-workers for the year 2001. These are segregated by residence and
sex.
EL 4 : NUMBERS AND PERCENTAGE OF TOTAL, MAIN, MARGINAL AND NON-WORKERS BY RURAL AND URBAN AND MALE AND FEMALE IN DISTRICTS OF
MADHYA PRADESH, 2001
MAIN WORKERS
Census records a person as a Main worker if he/ she has
worked for a major part of the year preceding the
enumeration.
MARGINAL WORKERS
Census records a person as a marginal worker if he/ she has
worked anytime during the preceding year, but has not
worked for a major part of the year.
NON-WORKERS
Persons who are not working as marginal or main workers.
NUMBERS (NOS)The actual number enumerated in the census
PERCENTAGES
The percentage is taken as number of workers over the total
population for that category

351
EL 4: NUMBERS AND PERCENTAGE OF TOTAL, MAIN, MARGINAL AND NON-WORKERS BY RURAL AND URBAN AND MALE AND FEMALE IN DISTRICTS OF
MADHYA PRADESH, 2001
726560 50.2% 474993 32.9% 251567 17.4% 719380523096 48.4% 389939 36.1% 133157 12.3% 557943615971 44.2% 417646 30.0% 198325 14.2% 778450525495 36.8% 396595 27.8% 128900 9.0% 901456589490 32.0% 499202 27.1% 90288 4.9% 1250261593112 40.2% 441466 29.9% 151646 10.3% 881521779222 42.2% 559050 30.2% 220172 11.9% 1069360485195 44.8% 347723 32.1% 137472 12.7% 596734316247 50.4% 226149 36.0% 90098 14.4% 311582579217 44.3% 428109 32.8% 151108 11.6% 727514811705 46.6% 595638 34.2% 216067 12.4% 928872330918 57.1% 260917 45.0% 70001 12.1% 248856749860 43.9% 626895 36.7% 122965 7.2% 958067681951 40.9% 496244 29.8% 185707 11.1% 983627529841 32.5% 441803 27.1% 88038 5.4% 1100040213034 44.9% 151586 32.0% 61448 13.0% 261140386643 35.6% 293477 27.0% 93166 8.6% 698368890961 36.2% 765760 31.1% 125201 5.1% 1570483799035 37.1% 624689 29.0% 174346 8.1% 1355749732960 52.6% 487963 35.0% 244997 17.6% 661385443390 41.7% 295073 27.7% 148317 13.9% 620299463641 51.9% 321257 35.9% 142384 15.9% 430267570771 48.2% 454612 38.4% 116159 9.8% 612598589236 37.1% 450067 28.4% 139169 8.8% 998029403220 42.1% 309808 32.4% 93412 9.8% 554179348228 48.0% 281932 38.9% 66296 9.1% 377229371694 43.5% 259533 30.4% 112161 13.1% 482541409791 36.6% 307259 27.4% 102532 9.2% 710368626352 50.0% 438389 35.0% 187963 15.0% 626894547359 45.0% 404655 33.3% 142704 11.7% 667746863608 43.8% 585601 29.7% 278007 14.1% 1109408839313 41.5% 637546 31.5% 201767 10.0% 1182470745213 39.9% 554459 29.7% 190754 10.2% 1124229452390 41.9% 308690 28.6% 143700 13.3% 626380569211 48.8% 381256 32.7% 187955 16.1% 596682687868 43.7% 458818 29.2% 229050 14.6% 884696630091 48.8% 436725 33.8% 193366 15.0% 660139230027 41.1% 153331 27.4% 76696 13.7% 329688652718 45.3% 507427 35.2% 145291 10.1% 787964757408 41.4% 544083 29.7% 213325 11.7% 1073229566468 47.1% 395969 32.9% 170499 14.2% 636692754308 44.1% 587288 34.3% 167020 9.8% 955811218229 42.3% 142523 27.6% 75706 14.7% 297621450975 37.1% 345555 28.4% 105420 8.7% 763784704463 46.0% 589868 38.5% 114595 7.5% 826523
25756485 42.7% 19077568 31.7% 6678917 11.1% 34496254
BalaghatBarwaniBetulBhindBhopalChhatarpurChhindwaraDamoh DatiaDewasDharDindoriEast Nimar (Khandwa)GunaGwaliorHardaHoshangabadIndoreJabalpurJhabuaKatniMandlaMandsaurMorenaNarsimhapurNeemuchPannaRaisenRajgarhRatlamRewaSagarSatnaSehoreSeoniShahdolShajapurSheopurShivpuriSidhiTikamgarhUjjainUmariaVidishaWest Nimar (Khargone)
Madhya Pradesh
Workers
Total Workers Main Workers Marginal Workers Non Workers (Main+Marginal)
Nos % Nos % Nos % Nos
District
Source: Paper 3 of Madhya Pradesh, Census of India 2001, Registrar General of India, New Delhi

352
EL 4: NUMBERS AND PERCENTAGE OF TOTAL, MAIN, MARGINAL AND NON-WORKERS BY RURAL AND URBAN AND MALE AND FEMALE IN DISTRICTS OF
MADHYA PRADESH, 2001
388930 54.4% 309013 43.2% 79917 11.2% 326073290376 53.0% 254006 46.4% 36370 6.6% 257461362554 51.1% 297277 41.9% 65277 9.2% 346970378181 48.5% 334430 42.9% 43751 5.6% 401941461931 47.6% 416035 42.9% 45896 4.7% 508209389746 49.4% 349133 44.3% 40613 5.1% 399124481976 50.9% 412308 43.6% 69668 7.4% 464432302284 53.2% 262380 46.1% 39904 7.0% 266435190876 56.5% 165602 49.0% 25274 7.5% 146976350191 51.8% 307326 45.4% 42865 6.3% 326107468082 52.5% 407395 45.7% 60687 6.8% 422771171928 59.1% 146914 50.5% 25014 8.6% 119015466724 52.9% 427345 48.4% 39379 4.5% 415664455214 51.5% 400370 45.3% 54844 6.2% 428268422036 47.8% 384419 43.6% 37617 4.3% 460222130427 52.8% 114645 46.4% 15782 6.4% 116702282795 49.5% 246173 43.1% 36622 6.4% 289001670133 52.1% 614764 47.8% 55369 4.3% 616801569665 50.4% 489415 43.3% 80250 7.1% 559587381826 54.4% 310015 44.2% 71811 10.2% 320152282699 51.6% 226682 41.4% 56017 10.2% 265378248082 55.6% 198699 44.5% 49383 11.1% 198405337128 55.7% 305692 50.5% 31436 5.2% 267814420048 48.2% 376175 43.2% 43873 5.0% 451195271098 54.1% 237791 47.4% 33307 6.6% 230309206363 55.5% 185234 49.8% 21129 5.7% 165609230148 51.4% 196504 43.9% 33644 7.5% 217775295500 49.6% 254682 42.8% 40818 6.9% 300230354797 54.7% 303013 46.7% 51784 8.0% 294053332704 53.6% 292979 47.2% 39725 6.4% 287691502694 49.5% 410159 40.4% 92535 9.1% 513483552051 51.4% 488122 45.5% 63929 6.0% 520981471117 48.5% 406282 41.9% 64835 6.7% 499400276858 49.0% 234248 41.4% 42610 7.5% 288530318165 54.1% 263248 44.8% 54917 9.3% 269974425442 53.0% 342316 42.6% 83126 10.3% 377930369233 55.2% 324881 48.5% 44352 6.6% 300186146531 49.6% 128353 43.4% 18178 6.1% 149099404832 52.2% 364063 46.9% 40769 5.3% 370651455278 48.1% 397594 42.0% 57684 6.1% 491976333353 52.3% 298742 46.8% 34611 5.4% 304489474794 53.9% 421230 47.8% 53564 6.1% 406752134758 50.9% 106270 40.1% 28488 10.8% 130240331977 51.3% 292383 45.1% 39594 6.1% 315655410762 52.3% 377382 48.1% 33380 4.3% 374563
16202287 51.6% 14081689 44.9% 2120598 6.8% 15184279
BalaghatBarwaniBetulBhindBhopalChhatarpurChhindwaraDamoh DatiaDewasDharDindoriEast Nimar (Khandwa)GunaGwaliorHardaHoshangabadIndoreJabalpurJhabuaKatniMandlaMandsaurMorenaNarsimhapurNeemuchPannaRaisenRajgarhRatlamRewaSagarSatnaSehoreSeoniShahdolShajapurSheopurShivpuriSidhiTikamgarhUjjainUmariaVidishaWest Nimar (Khargone)
Madhya Pradesh
Male Workers
Male Workers Male Main Workers Male Marginal Workers Non Workers
(Main+Marginal)
Nos % Nos % Nos % Nos
District
Source: Paper 3 of Madhya Pradesh, Census of India 2001, Registrar General of India, New Delhi

353
EL 4: NUMBERS AND PERCENTAGE OF TOTAL, MAIN, MARGINAL AND NON-WORKERS BY RURAL AND URBAN AND MALE AND FEMALE IN DISTRICTS OF
MADHYA PRADESH, 2001
337630 46.2% 165980 22.7% 171650 23.5% 393307232720 43.6% 135933 25.5% 96787 18.2% 300482253417 37.0% 120369 17.6% 133048 19.4% 431480147314 22.8% 62165 9.6% 85149 13.2% 499515127559 14.7% 83167 9.6% 44392 5.1% 742052203366 29.7% 92333 13.5% 111033 16.2% 482397297246 32.9% 146742 16.3% 150504 16.7% 604928182911 35.6% 85343 16.6% 97568 19.0% 330299125371 43.2% 60547 20.9% 64824 22.4% 164606229026 36.3% 120783 19.2% 108243 17.2% 401407343623 40.4% 188243 22.2% 155380 18.3% 506101158990 55.0% 114003 39.5% 44987 15.6% 129841283136 34.3% 199550 24.2% 83586 10.1% 542403226737 29.0% 95874 12.3% 130863 16.7% 555359107805 14.4% 57384 7.7% 50421 6.7% 639818
82607 36.4% 36941 16.3% 45666 20.1% 144438103848 20.2% 47304 9.2% 56544 11.0% 409367220828 18.8% 150996 12.9% 69832 5.9% 953682229370 22.4% 135274 13.2% 94096 9.2% 796162351134 50.7% 177948 25.7% 173186 25.0% 341233160691 31.2% 68391 13.3% 92300 17.9% 354921215559 48.2% 122558 27.4% 93001 20.8% 231862233643 40.4% 148920 25.7% 84723 14.6% 344784169188 23.6% 73892 10.3% 95296 13.3% 546834132122 29.0% 72017 15.8% 60105 13.2% 323870141865 40.1% 96698 27.4% 45167 12.8% 211620141546 34.8% 63029 15.5% 78517 19.3% 264766114291 21.8% 52577 10.0% 61714 11.8% 410138271555 44.9% 135376 22.4% 136179 22.5% 332841214655 36.1% 111676 18.8% 102979 17.3% 380055360914 37.7% 175442 18.3% 185472 19.4% 595925287262 30.3% 149424 15.7% 137838 14.5% 661489274096 30.5% 148177 16.5% 125919 14.0% 624829175532 34.2% 74442 14.5% 101090 19.7% 337850251046 43.5% 118008 20.4% 133038 23.0% 326708262426 34.1% 116502 15.1% 145924 19.0% 506766260858 42.0% 111844 18.0% 149014 24.0% 359953
83496 31.6% 24978 9.5% 58518 22.2% 180589247886 37.3% 143364 21.6% 104522 15.7% 417313302130 34.2% 146489 16.6% 155641 17.6% 581253233115 41.2% 97227 17.2% 135888 24.0% 332203279514 33.7% 166058 20.0% 113456 13.7% 549059
83471 33.3% 36253 14.5% 47218 18.8% 167381118998 21.0% 53172 9.4% 65826 11.6% 448129293701 39.4% 212486 28.5% 81215 10.9% 451960
9554198 33.1% 4995879 17.3% 4558319 15.8% 19311975
BalaghatBarwaniBetulBhindBhopalChhatarpurChhindwaraDamoh DatiaDewasDharDindoriEast Nimar (Khandwa)GunaGwaliorHardaHoshangabadIndoreJabalpurJhabuaKatniMandlaMandsaurMorenaNarsimhapurNeemuchPannaRaisenRajgarhRatlamRewaSagarSatnaSehoreSeoniShahdolShajapurSheopurShivpuriSidhiTikamgarhUjjainUmariaVidishaWest Nimar (Khargone)
Madhya Pradesh
Female Workers
Female Workers Female Main Workers Female Marginal Workers Non Workers
(Main+Marginal)
Nos % Nos % Nos % Nos
District
Source: Paper 3 of Madhya Pradesh, Census of India 2001, Registrar General of India, New Delhi

354
EL 4: NUMBERS AND PERCENTAGE OF TOTAL, MAIN, MARGINAL AND NON-WORKERS BY RURAL AND URBAN AND MALE AND FEMALE IN DISTRICTS OF
MADHYA PRADESH, 2001
662449 52.9% 423096 33.8% 239353 19.1% 589557469681 50.9% 341394 37.0% 128287 13.9% 453382545600 48.0% 355672 31.3% 189928 16.7% 589942436628 40.1% 320585 29.4% 116043 10.7% 652170151043 42.2% 104609 29.2% 46434 13.0% 206622494313 43.0% 355592 30.9% 138721 12.1% 656041645380 46.2% 443706 31.8% 201674 14.4% 750968415396 47.3% 287311 32.7% 128085 14.6% 462196270285 55.1% 186464 38.0% 83821 17.1% 219999469115 49.4% 333294 35.1% 135821 14.3% 480140714197 49.2% 508841 35.0% 205356 14.1% 738145322402 58.3% 253885 45.9% 68517 12.4% 230510613095 49.1% 501181 40.2% 111914 9.0% 634743577801 44.1% 403571 30.8% 174230 13.3% 733042247651 38.3% 185383 28.7% 62268 9.6% 398899184454 49.4% 126522 33.9% 57932 15.5% 188633291884 39.0% 207955 27.8% 83929 11.2% 457365336085 45.7% 255095 34.7% 80990 11.0% 399087416230 45.0% 281403 30.4% 134827 14.6% 509714693449 54.5% 453071 35.6% 240378 18.9% 579867376218 44.9% 234459 28.0% 141759 16.9% 462513435304 54.3% 296066 36.9% 139238 17.4% 366599494498 51.4% 385816 40.1% 108682 11.3% 468238497879 40.0% 369806 29.7% 128073 10.3% 746186356122 44.3% 268318 33.4% 87804 10.9% 448174280309 53.6% 222894 42.6% 57415 11.0% 242895339562 45.5% 232245 31.1% 107317 14.4% 406529348393 38.1% 253394 27.7% 94999 10.4% 564926556900 53.7% 380741 36.7% 176159 17.0% 479196434578 51.3% 304962 36.0% 129616 15.3% 412448763624 46.2% 503073 30.4% 260551 15.8% 888882636644 44.5% 457453 32.0% 179191 12.5% 793777622102 41.9% 445586 30.0% 176516 11.9% 861750397832 45.0% 262368 29.7% 135464 15.3% 486513533643 51.1% 350119 33.5% 183524 17.6% 511553575034 49.0% 359383 30.6% 215651 18.4% 599395549045 52.2% 368396 35.1% 180649 17.2% 501845204586 43.4% 131118 27.8% 73468 15.6% 266549585505 48.8% 449639 37.4% 135866 11.3% 615505681748 43.4% 477943 30.5% 203805 13.0% 887487490302 49.5% 336228 33.9% 154074 15.6% 500483548918 52.4% 405291 38.7% 143627 13.7% 498640193164 44.6% 123354 28.5% 69810 16.1% 239775376504 39.4% 279080 29.2% 97424 10.2% 577976630048 48.7% 521847 40.3% 108201 8.4% 663581
20865600 47.1% 14748209 33.3% 6117391 13.8% 23422437
BalaghatBarwaniBetulBhindBhopalChhatarpurChhindwaraDamoh DatiaDewasDharDindoriEast Nimar (Khandwa)GunaGwaliorHardaHoshangabadIndoreJabalpurJhabuaKatniMandlaMandsaurMorenaNarsimhapurNeemuchPannaRaisenRajgarhRatlamRewaSagarSatnaSehoreSeoniShahdolShajapurSheopurShivpuriSidhiTikamgarhUjjainUmariaVidishaWest Nimar (Khargone)
Madhya Pradesh
Rural Workers
Rural Workers Rural Main Workers Rural Marginal Workers Non-Workers
(Main+Marginal)
Nos % Nos % Nos % Nos
District
Source: Paper 3 of Madhya Pradesh, Census of India 2001, Registrar General of India, New Delhi

355
EL 4: NUMBERS AND PERCENTAGE OF TOTAL, MAIN, MARGINAL AND NON-WORKERS BY RURAL AND URBAN AND MALE AND FEMALE IN DISTRICTS OF
MADHYA PRADESH, 2001
341951 55.5% 267710 43.4% 74241 12.0% 274721249291 53.4% 214933 46.1% 34358 7.4% 217151302517 52.7% 242760 42.3% 59757 10.4% 271959299909 50.3% 264241 44.3% 35668 6.0% 296677
94018 49.6% 79039 41.7% 14979 7.9% 95486310933 50.5% 276542 44.9% 34391 5.6% 304845373485 52.5% 314416 44.2% 59069 8.3% 338103251607 54.6% 215298 46.7% 36309 7.9% 209617155170 58.7% 132541 50.1% 22629 8.6% 109141261335 53.3% 225943 46.1% 35392 7.2% 228883388129 52.7% 332988 45.2% 55141 7.5% 349031165106 59.6% 140902 50.8% 24204 8.7% 112019352641 54.7% 319827 49.6% 32814 5.1% 291957369225 53.0% 320365 46.0% 48860 7.0% 327267176998 50.2% 156773 44.5% 20225 5.7% 175670105898 54.6% 92174 47.5% 13724 7.1% 88061200704 50.9% 170461 43.2% 30243 7.7% 193938203091 53.5% 176535 46.5% 26556 7.0% 176421256799 53.4% 202702 42.2% 54097 11.3% 223824351781 55.0% 282119 44.1% 69662 10.9% 287439225919 52.5% 173825 40.4% 52094 12.1% 204302225873 56.6% 178372 44.7% 47501 11.9% 173401278150 56.6% 250261 50.9% 27889 5.7% 213167339321 49.5% 302395 44.2% 36926 5.4% 345556232217 55.1% 202325 48.0% 29892 7.1% 188867152589 57.2% 135764 50.9% 16825 6.3% 114308204302 52.3% 173519 44.4% 30783 7.9% 186268243943 50.3% 207759 42.9% 36184 7.5% 240851300208 56.1% 253597 47.4% 46611 8.7% 235172239400 55.5% 207294 48.1% 32106 7.4% 191629427362 50.5% 342843 40.5% 84519 10.0% 418430403190 53.0% 348224 45.8% 54966 7.2% 357780374862 49.0% 316549 41.3% 58313 7.6% 390859230632 49.8% 192961 41.7% 37671 8.1% 232429289275 55.0% 236956 45.1% 52319 10.0% 236475327669 55.2% 252862 42.6% 74807 12.6% 265788306102 56.2% 266665 48.9% 39437 7.2% 238748125077 50.3% 108277 43.6% 16800 6.8% 123387347168 53.6% 312341 48.2% 34827 5.4% 300438391623 48.6% 338634 42.0% 52989 6.6% 414434280503 53.3% 251305 47.8% 29198 5.6% 245539306273 57.0% 266776 49.6% 39497 7.3% 231270114821 51.8% 89739 40.5% 25082 11.3% 106883268186 52.6% 233912 45.9% 34274 6.7% 241522350373 52.9% 320549 48.4% 29824 4.5% 311641
12195626 53.1% 10391973 45.2% 1803653 7.8% 10781354
BalaghatBarwaniBetulBhindBhopalChhatarpurChhindwaraDamoh DatiaDewasDharDindoriEast Nimar (Khandwa)GunaGwaliorHardaHoshangabadIndoreJabalpurJhabuaKatniMandlaMandsaurMorenaNarsimhapurNeemuchPannaRaisenRajgarhRatlamRewaSagarSatnaSehoreSeoniShahdolShajapurSheopurShivpuriSidhiTikamgarhUjjainUmariaVidishaWest Nimar (Khargone)
Madhya Pradesh
Male Rural Workers
Male Rural Workers Male Rural Main Workers Male Rural Marginal Workers Non Workers
(Main+Marginal)
Nos % Nos % Nos % Nos
District
Source: Paper 3 of Madhya Pradesh, Census of India 2001, Registrar General of India, New Delhi

356
EL 4: NUMBERS AND PERCENTAGE OF TOTAL, MAIN, MARGINAL AND NON-WORKERS BY RURAL AND URBAN AND MALE AND FEMALE IN DISTRICTS OF
MADHYA PRADESH, 2001
320498 50.4% 155386 24.5% 165112 26.0% 314836220390 48.3% 126461 27.7% 93929 20.6% 236231243083 43.3% 112912 20.1% 130171 23.2% 317983136719 27.8% 56344 11.4% 80375 16.3% 355493
57025 33.9% 25570 15.2% 31455 18.7% 111136183380 34.3% 79050 14.8% 104330 19.5% 351196271895 39.7% 129290 18.9% 142605 20.8% 412865163789 39.3% 72013 17.3% 91776 22.0% 252579115115 50.9% 53923 23.9% 61192 27.1% 110858207780 45.3% 107351 23.4% 100429 21.9% 251257326068 45.6% 175853 24.6% 150215 21.0% 389114157296 57.0% 112983 41.0% 44313 16.1% 118491260454 43.2% 181354 30.1% 79100 13.1% 342786208576 34.0% 83206 13.5% 125370 20.4% 405775
70653 24.0% 28610 9.7% 42043 14.3% 22322978556 43.9% 34348 19.2% 44208 24.7% 10057291180 25.7% 37494 10.6% 53686 15.1% 263427
132994 37.4% 78560 22.1% 54434 15.3% 222666159431 35.8% 78701 17.7% 80730 18.1% 285890341668 53.9% 170952 27.0% 170716 26.9% 292428150299 36.8% 60634 14.8% 89665 21.9% 258211209431 52.0% 117694 29.2% 91737 22.8% 193198216348 45.9% 135555 28.8% 80793 17.1% 255071158558 28.4% 67411 12.1% 91147 16.3% 400630123905 32.3% 65993 17.2% 57912 15.1% 259307127720 49.8% 87130 34.0% 40590 15.8% 128587135260 38.0% 58726 16.5% 76534 21.5% 220261104450 24.4% 45635 10.6% 58815 13.7% 324075256692 51.3% 127144 25.4% 129548 25.9% 244024195178 46.9% 97668 23.5% 97510 23.4% 220819336262 41.7% 160230 19.9% 176032 21.8% 470452233454 34.9% 109229 16.3% 124225 18.6% 435997247240 34.4% 129037 18.0% 118203 16.5% 470891167200 39.7% 69407 16.5% 97793 23.2% 254084244368 47.0% 113163 21.8% 131205 25.3% 275078247365 42.6% 106521 18.3% 140844 24.2% 333607242943 48.0% 101731 20.1% 141212 27.9% 263097
79509 35.7% 22841 10.3% 56668 25.4% 143162238337 43.1% 137298 24.8% 101039 18.3% 315067290125 38.0% 139309 18.3% 150816 19.8% 473053209799 45.1% 84923 18.3% 124876 26.9% 254944242645 47.6% 138515 27.2% 104130 20.4% 267370
78343 37.1% 33615 15.9% 44728 21.2% 132892108318 24.4% 45168 10.2% 63150 14.2% 336454279675 44.3% 201298 31.9% 78377 12.4% 351940
8669974 40.7% 4356236 20.4% 4313738 20.2% 12641083
BalaghatBarwaniBetulBhindBhopalChhatarpurChhindwaraDamoh DatiaDewasDharDindoriEast Nimar (Khandwa)GunaGwaliorHardaHoshangabadIndoreJabalpurJhabuaKatniMandlaMandsaurMorenaNarsimhapurNeemuchPannaRaisenRajgarhRatlamRewaSagarSatnaSehoreSeoniShahdolShajapurSheopurShivpuriSidhiTikamgarhUjjainUmariaVidishaWest Nimar (Khargone)
Madhya Pradesh
Rural Female Workers
Rural Female Workers Rural Female Main Workers Rural Female Marginal Workers Non Workers
(Main+Marginal)
Nos % Nos % Nos % Nos
District
Source: Paper 3 of Madhya Pradesh, Census of India 2001, Registrar General of India, New Delhi

357
EL 4: NUMBERS AND PERCENTAGE OF TOTAL, MAIN, MARGINAL AND NON-WORKERS BY RURAL AND URBAN AND MALE AND FEMALE IN DISTRICTS OF
MADHYA PRADESH, 2001
64111 33.1% 51897 26.8% 12214 6.3% 12982353415 33.8% 48545 30.7% 4870 3.1% 10456170371 27.2% 61974 23.9% 8397 3.2% 18850888867 26.3% 76010 22.5% 12857 3.8% 249286
438447 29.6% 394593 26.6% 43854 3.0% 104363998799 30.5% 85874 26.5% 12925 4.0% 225480
133842 29.6% 115344 25.5% 18498 4.1% 31839269799 34.2% 60412 29.6% 9387 4.6% 13453845962 33.4% 39685 28.9% 6277 4.6% 91583
110102 30.8% 94815 26.5% 15287 4.3% 24737497508 33.8% 86797 30.1% 10711 3.7% 190727
8516 31.7% 7032 26.2% 1484 5.5% 18346136765 29.7% 125714 27.3% 11051 2.4% 323324104150 29.4% 92673 26.1% 11477 3.2% 250585282190 28.7% 256420 26.1% 25770 2.6% 701141
28580 28.3% 25064 24.8% 3516 3.5% 7250794759 28.2% 85522 25.5% 9237 2.8% 241003
554876 32.1% 510665 29.6% 44211 2.6% 1171396382805 31.2% 343286 27.9% 39519 3.2% 846035
39511 32.6% 34892 28.8% 4619 3.8% 8151867172 29.9% 60614 26.9% 6558 2.9% 15778628337 30.8% 25191 27.4% 3146 3.4% 6366876273 34.6% 68796 31.2% 7477 3.4% 14436091357 26.6% 80261 23.4% 11096 3.2% 25184347098 30.8% 41490 27.1% 5608 3.7% 10600567919 33.6% 59038 29.2% 8881 4.4% 13433432132 29.7% 27288 25.2% 4844 4.5% 7601261398 29.7% 53865 26.0% 7533 3.6% 14544269452 32.0% 57648 26.5% 11804 5.4% 147698
112781 30.6% 99693 27.1% 13088 3.6% 25529899984 31.2% 82528 25.7% 17456 5.4% 220526
202669 34.3% 180093 30.5% 22576 3.8% 388693123111 31.9% 108873 28.2% 14238 3.7% 26247954558 28.1% 46322 23.8% 8236 4.2% 13986735568 29.5% 31137 25.8% 4431 3.7% 85129
112834 28.3% 99435 25.0% 13399 3.4% 28530181046 33.9% 68329 28.5% 12717 5.3% 15829425441 28.7% 22213 25.1% 3228 3.6% 6313967213 28.0% 57788 24.1% 9425 3.9% 17245975660 28.9% 66140 25.3% 9520 3.6% 18574276166 35.9% 59741 28.1% 16425 7.7% 136209
205390 31.0% 181997 27.5% 23393 3.5% 45717125065 30.2% 19169 23.1% 5896 7.1% 5784674471 28.6% 66475 25.5% 7996 3.1% 18580874415 31.4% 68021 28.7% 6394 2.7% 162942
4890885 30.6% 4329359 27.1% 561526 3.5% 11073817
BalaghatBarwaniBetulBhindBhopalChhatarpurChhindwaraDamoh DatiaDewasDharDindoriEast Nimar (Khandwa)GunaGwaliorHardaHoshangabadIndoreJabalpurJhabuaKatniMandlaMandsaurMorenaNarsimhapurNeemuchPannaRaisenRajgarhRatlamRewaSagarSatnaSehoreSeoniShahdolShajapurSheopurShivpuriSidhiTikamgarhUjjainUmariaVidishaWest Nimar (Khargone)
Madhya Pradesh
Urban Workers
Urban Workers Urban Main Workers Urban Marginal Workers Non Workers
(Main+Marginal)
Nos % Nos % Nos % Nos
District
Source: Paper 3 of Madhya Pradesh, Census of India 2001, Registrar General of India, New Delhi

358
EL 4: NUMBERS AND PERCENTAGE OF TOTAL, MAIN, MARGINAL AND NON-WORKERS BY RURAL AND URBAN AND MALE AND FEMALE IN DISTRICTS OF
MADHYA PRADESH, 2001
46979 47.8% 41303 42.0% 5676 5.8% 5135241085 50.5% 39073 48.0% 2012 2.5% 4031060037 44.5% 54517 40.4% 5520 4.1% 7501178272 42.6% 70189 38.2% 8083 4.4% 105264
367913 47.1% 336996 43.2% 30917 4.0% 41272378813 45.5% 72591 41.9% 6222 3.6% 94279
108491 46.2% 97892 41.7% 10599 4.5% 12632950677 47.1% 47082 43.8% 3595 3.3% 5681835706 48.6% 33061 45.0% 2645 3.6% 3783588856 47.8% 81383 43.7% 7473 4.0% 9722479953 52.0% 74407 48.4% 5546 3.6% 73740
6822 49.4% 6012 43.5% 810 5.9% 6996114083 48.0% 107518 45.2% 6565 2.8% 12370785989 46.0% 80005 42.8% 5984 3.2% 101001
245038 46.3% 227646 43.0% 17392 3.3% 28455224529 46.1% 22471 42.3% 2058 3.9% 2864182091 46.3% 75712 42.7% 6379 3.6% 95063
467042 51.5% 438229 48.3% 28813 3.2% 440380312866 48.2% 286713 44.2% 26153 4.0% 335763
30045 47.9% 27896 44.5% 2149 3.4% 3271356780 48.2% 52857 44.8% 3923 3.3% 6107622209 47.0% 20327 43.1% 1882 4.0% 2500458978 51.9% 55431 48.8% 3547 3.1% 5464780727 43.3% 73780 39.6% 6947 3.7% 10563938881 48.4% 35466 44.2% 3415 4.3% 4144253774 51.2% 49470 47.1% 4304 4.1% 5130125846 45.1% 22985 40.1% 2861 5.0% 3150751557 46.5% 46923 42.3% 4634 4.2% 5937954589 48.1% 49416 43.5% 5173 4.6% 5888193304 49.3% 85685 45.2% 7619 4.0% 9606275332 44.2% 67316 39.5% 8016 4.7% 95053
148861 47.7% 139898 44.8% 8963 2.9% 16320196255 47.0% 89733 43.8% 6522 3.2% 10854146226 45.2% 41287 40.3% 4939 4.8% 5610128890 46.3% 26292 42.1% 2598 4.2% 3349997773 46.6% 89454 42.6% 8319 4.0% 11214263131 50.7% 58216 46.7% 4915 3.9% 6143821454 45.5% 20076 42.6% 1378 2.9% 2571257664 45.1% 51722 40.4% 5942 4.6% 7021363655 45.1% 58960 41.8% 4695 3.3% 7754252850 47.3% 47437 42.4% 5413 4.8% 58950
168521 49.0% 154454 44.9% 14067 4.1% 17548219937 46.1% 16531 38.2% 3406 7.9% 2335763791 46.3% 58471 42.4% 5320 3.9% 7413360389 49.0% 56833 46.1% 3556 2.9% 62922
4006661 47.6% 3689716 43.9% 316945 3.8% 4402925
BalaghatBarwaniBetulBhindBhopalChhatarpurChhindwaraDamoh DatiaDewasDharDindoriEast Nimar (Khandwa)GunaGwaliorHardaHoshangabadIndoreJabalpurJhabuaKatniMandlaMandsaurMorenaNarsimhapurNeemuchPannaRaisenRajgarhRatlamRewaSagarSatnaSehoreSeoniShahdolShajapurSheopurShivpuriSidhiTikamgarhUjjainUmariaVidishaWest Nimar (Khargone)
Madhya Pradesh
Urban Male Workers
Urban Male Workers Urban Male Main Workers Urban Male Marginal Workers Non Workers
(Main+Marginal)
Nos % Nos % Nos % Nos
District
Source: Paper 3 of Madhya Pradesh, Census of India 2001, Registrar General of India, New Delhi

359
EL 4: NUMBERS AND PERCENTAGE OF TOTAL, MAIN, MARGINAL AND NON-WORKERS BY RURAL AND URBAN AND MALE AND FEMALE IN DISTRICTS OF
MADHYA PRADESH, 2001
17132 17.9% 10594 11.1% 6538 6.8% 7847112330 16.1% 9472 12.4% 2858 3.7% 6425110334 8.3% 7457 6.0% 2877 2.3% 11349710595 6.9% 5821 3.8% 4774 3.1% 14402270534 10.1% 57597 8.2% 12937 1.8% 63091619986 13.2% 13283 8.8% 6703 4.4% 13120125351 11.7% 17452 8.0% 7899 3.6% 19206319122 19.7% 13330 13.8% 5792 6.0% 7772010256 16.0% 6624 10.3% 3632 5.7% 5374821246 12.4% 13432 7.8% 7814 4.6% 15015017555 13.0% 12390 9.2% 5165 3.8% 116987
1694 13.0% 1020 7.8% 674 5.2% 1135022682 10.2% 18196 8.2% 4486 2.0% 19961718161 10.8% 12668 7.6% 5493 3.3% 14958437152 8.2% 28774 6.3% 8378 1.8% 416589
4051 8.5% 2593 5.4% 1458 3.0% 4386612668 8.0% 9810 6.2% 2858 1.8% 14594087834 10.7% 72436 8.8% 15398 1.9% 73101669939 12.1% 56573 9.8% 13366 2.3% 510272
9466 16.2% 6996 12.0% 2470 4.2% 4880510392 9.7% 7757 7.2% 2635 2.5% 96710
6128 13.7% 4864 10.9% 1264 2.8% 3866417295 16.2% 13365 12.5% 3930 3.7% 8971310630 6.8% 6481 4.1% 4149 2.6% 146204
8217 11.3% 6024 8.3% 2193 3.0% 6456314145 14.6% 9568 9.8% 4577 4.7% 83033
6286 12.4% 4303 8.5% 1983 3.9% 445059841 10.3% 6942 7.2% 2899 3.0% 86063
14863 14.3% 8232 7.9% 6631 6.4% 8881719477 10.9% 14008 7.8% 5469 3.1% 15923624652 16.4% 15212 10.1% 9440 6.3% 12547353808 19.3% 40195 14.4% 13613 4.9% 22549226856 14.9% 19140 10.6% 7716 4.3% 153938
8332 9.0% 5035 5.5% 3297 3.6% 837666678 11.5% 4845 8.3% 1833 3.1% 51630
15061 8.0% 9981 5.3% 5080 2.7% 17315917915 15.6% 10113 8.8% 7802 6.8% 96856
3987 9.6% 2137 5.2% 1850 4.5% 374279549 8.5% 6066 5.4% 3483 3.1% 102246
12005 10.0% 7180 6.0% 4825 4.0% 10820023316 23.2% 12304 12.2% 11012 10.9% 7725936869 11.6% 27543 8.6% 9326 2.9% 281689
5128 12.9% 2638 6.7% 2490 6.3% 3448910680 8.7% 8004 6.5% 2676 2.2% 11167514026 12.3% 11188 9.8% 2838 2.5% 100020
884224 11.7% 639643 8.5% 244581 3.2% 6670892
BalaghatBarwaniBetulBhindBhopalChhatarpurChhindwaraDamoh DatiaDewasDharDindoriEast Nimar (Khandwa)GunaGwaliorHardaHoshangabadIndoreJabalpurJhabuaKatniMandlaMandsaurMorenaNarsimhapurNeemuchPannaRaisenRajgarhRatlamRewaSagarSatnaSehoreSeoniShahdolShajapurSheopurShivpuriSidhiTikamgarhUjjainUmariaVidishaWest Nimar (Khargone)
Madhya Pradesh
Urban Female Workers
Urban Female Workers Urban Female Main Workers Urban Female Marginal Workers Non Workers
(Main+Marginal)
Nos % Nos % Nos % Nos
District
Source: Paper 3 of Madhya Pradesh, Census of India 2001, Registrar General of India, New Delhi

360
Table EL 5 gives the number of workers and the sector share of
employment of main and marginal workers in 2001. Cultivators per
100 hectare of cultivable land are also calculated in the table.
EL 5: SECTOR SHARE OF EMPLOYMENT OF MAIN AND MARGINAL WORKERS, 2001
CULTIVATORS
For purpose of census a person is working as cultivator if he
or she is engaged as employer, single worker or family worker
in cultivation of land owned or held from government or held
from private person or institutions for payment in money,
kind or share. Cultivation includes agriculture operations for
all produce except fruit growing, vegetable growing, or keep-
ing orchards or groves or working of plantations.
AGRICULTURE LABOURERS
Person working on another persons land for wages in money,
kind or share are enumerated as agricultural labourers. An
agricultural labourer has no risk in the cultivation and he has
no right of lease or contract on land on which he works.
HOUSEHOLD INDUSTRY (MANUFACTURING, PROCESSING,SERVICING AND REPAIRS IN HOUSEHOLD INDUSTRY)Persons working in an industry located at home or within the
village in rural areas and only within the precincts of the
house where the household lives in urban areas.
OTHER WORKERS
All other workers not classified in the above categories and who
are working are classified here. These include manufacturing
outside households, construction, all types of services etc.
CULTIVATORS PER 100 HECTARE OF CULTIVABLE LAND
Total number of cultivators in an area divided by the total
cultivable land in that area in 100 hectares.
NUMBERS
The total number of workers in a particular employment
classification.
PERCENTAGES
This denotes workers in this particular category divided by the
total number of workers
Share of Workers in Different Categories to
Total Workers 2001: MP and India
Cultivators Agriculture Household Other Labourers Industry Workers
42.9
31.728.726.7
3.9 4.1
24.5 24.5
50
40
30
20
10
0
Madhya Pradesh India

361
EL 5: SECTOR SHARE OF EMPLOYMENT OF MAIN AND MARGINAL WORKERS, 2001
726560 287752 39.6% 87 282489 38.9% 30561 4.2% 125758 17.3%523096 296571 56.7% 119 145826 27.9% 6409 1.2% 74290 14.2%615971 258482 42.0% 50 231435 37.6% 10513 1.7% 115541 18.8%525495 282154 53.7% 80 98114 18.7% 11042 2.1% 134185 25.5%589490 70506 12.0% 42 65025 11.0% 10938 1.9% 443021 75.2%593112 325847 54.9% 61 121007 20.4% 26210 4.4% 120048 20.2%779222 305562 39.2% 53 274442 35.2% 11915 1.5% 187303 24.0%485195 135623 28.0% 40 144022 29.7% 111978 23.1% 93572 19.3%316247 196728 62.2% 94 50538 16.0% 6256 2.0% 62725 19.8%579217 241715 41.7% 64 204559 35.3% 8767 1.5% 124176 21.4%811705 423040 52.1% 80 240563 29.6% 9841 1.2% 138261 17.0%330918 202843 61.3% 64 96288 29.1% 6158 1.9% 25629 7.7%749860 270724 36.1% 59 294538 39.3% 12886 1.7% 171712 22.9%681951 341184 50.0% 47 191709 28.1% 19650 2.9% 129408 19.0%529841 142987 27.0% 58 70764 13.4% 15529 2.9% 300561 56.7%213034 84644 39.7% 47 86570 40.6% 3767 1.8% 38053 17.9%386643 110612 28.6% 33 134450 34.8% 9342 2.4% 132239 34.2%890961 149046 16.7% 57 133103 14.9% 29781 3.3% 579031 65.0%799035 120224 15.0% 36 200852 25.1% 76560 9.6% 401399 50.2%732960 537242 73.3% 135 102101 13.9% 7009 1.0% 86608 11.8%443390 138541 31.2% 50 141638 31.9% 40429 9.1% 122782 27.7%463641 203695 43.9% 77 191960 41.4% 7257 1.6% 60729 13.1%570771 293500 51.4% 78 163723 28.7% 7511 1.3% 106037 18.6%589236 335299 56.9% 116 68011 11.5% 10548 1.8% 175378 29.8%403220 136802 33.9% 42 173007 42.9% 15049 3.7% 78362 19.4%348228 176851 50.8% 86 85548 24.6% 4745 1.4% 81084 23.3%371694 178233 48.0% 54 115199 31.0% 12758 3.4% 65504 17.6%409791 139626 34.1% 31 155450 37.9% 18589 4.5% 96126 23.5%626352 340264 54.3% 77 172634 27.6% 11833 1.9% 101621 16.2%547359 254675 46.5% 72 154545 28.2% 9184 1.7% 128955 23.6%863608 374785 43.4% 88 301399 34.9% 40849 4.7% 146575 17.0%839313 223277 26.6% 39 216008 25.7% 204805 24.4% 195223 23.3%745213 254509 34.2% 58 237174 31.8% 65616 8.8% 187914 25.2%452390 203907 45.1% 52 163725 36.2% 7062 1.6% 77696 17.2%569211 235977 41.5% 51 237352 41.7% 8606 1.5% 87276 15.3%687868 268774 39.1% 52 237501 34.5% 17776 2.6% 163817 23.8%630091 310165 49.2% 67 201501 32.0% 9703 1.5% 108722 17.3%230027 123555 53.7% 60 63105 27.4% 2882 1.3% 40485 17.6%652718 425280 65.2% 78 115792 17.7% 8704 1.3% 102942 15.8%757408 385176 50.9% 78 237517 31.4% 18351 2.4% 116364 15.4%566468 366452 64.7% 118 95407 16.8% 18581 3.3% 86028 15.2%754308 320461 42.5% 65 190788 25.3% 16117 2.1% 226942 30.1%218229 87019 39.9% 55 80730 37.0% 6790 3.1% 43690 20.0%450975 169585 37.6% 31 167265 37.1% 10567 2.3% 103558 23.0%704463 328606 46.6% 74 245504 34.8% 10643 1.5% 119710 17.0%
25756485 11058500 42.9% 64 7380878 28.7% 1010067 3.9% 6307040 24.5%
BalaghatBarwaniBetulBhindBhopalChhatarpurChhindwaraDamoh DatiaDewasDharDindoriEast Nimar (Khandwa)GunaGwaliorHardaHoshangabadIndoreJabalpurJhabuaKatniMandlaMandsaurMorenaNarsimhapurNeemuchPannaRaisenRajgarhRatlamRewaSagarSatnaSehoreSeoniShahdolShajapurSheopurShivpuriSidhiTikamgarhUjjainUmariaVidishaWest Nimar (Khargone)
Madhya Pradesh
Category of Workers (Main + Marginal)
Total Workers Cultivators Cultivators per 100 Agricultural Workers in Other Workers(Main+Marginal) Hectares Hectares of Labourers Household
Cultivable Land Industry
Nos Nos % Land Nos % Nos % Nos %
District
Source: Paper 3 of Madhya Pradesh, Census of India 2001, Registrar General of India, New Delhi

362
EL 5: SECTOR SHARE OF EMPLOYMENT OF MAIN AND MARGINAL WORKERS, 2001
388930 154890 39.8% 119059 30.6% 14115 3.6% 100866 25.9%290376 160400 55.2% 65747 22.6% 3994 1.4% 60235 20.7%362554 161960 44.7% 95984 26.5% 6961 1.9% 97649 26.9%378181 222980 59.0% 58124 15.4% 5589 1.5% 91488 24.2%461931 47720 10.3% 34067 7.4% 6588 1.4% 373556 80.9%389746 219261 56.3% 55485 14.2% 13294 3.4% 101706 26.1%481976 195483 40.6% 120086 24.9% 8325 1.7% 158082 32.8%302284 104075 34.4% 82342 27.2% 39983 13.2% 75884 25.1%190876 116404 61.0% 22851 12.0% 3188 1.7% 48433 25.4%350191 142633 40.7% 93237 26.6% 5797 1.7% 108524 31.0%468082 237786 50.8% 105806 22.6% 6524 1.4% 117966 25.2%171928 107811 62.7% 41145 23.9% 3560 2.1% 19412 11.3%466724 168516 36.1% 140943 30.2% 8515 1.8% 148750 31.9%455214 242483 53.3% 91620 20.1% 10303 2.3% 110808 24.3%422036 110691 26.2% 36912 8.7% 8360 2.0% 266073 63.0%130427 52212 40.0% 42086 32.3% 2543 1.9% 33586 25.8%282795 88900 31.4% 74798 26.4% 6081 2.2% 113016 40.0%670133 90699 13.5% 64498 9.6% 20668 3.1% 494268 73.8%569665 87214 15.3% 105675 18.6% 36506 6.4% 340270 59.7%381826 279228 73.1% 37680 9.9% 4083 1.1% 60835 15.9%282699 95728 33.9% 66430 23.5% 18482 6.5% 102059 36.1%248082 115410 46.5% 80745 32.5% 4380 1.8% 47547 19.2%337128 169166 50.2% 71171 21.1% 5135 1.5% 91656 27.2%420048 258872 61.6% 40429 9.6% 5112 1.2% 115635 27.5%271098 104178 38.4% 92635 34.2% 9395 3.5% 64890 23.9%206363 95206 46.1% 36977 17.9% 2991 1.4% 71189 34.5%230148 118238 51.4% 54460 23.7% 7104 3.1% 50346 21.9%295500 113486 38.4% 92097 31.2% 8727 3.0% 81190 27.5%354797 190127 53.6% 70113 19.8% 7416 2.1% 87141 24.6%332704 153967 46.3% 61487 18.5% 6393 1.9% 110857 33.3%502694 208699 41.5% 146344 29.1% 23038 4.6% 124613 24.8%552051 175763 31.8% 131421 23.8% 77294 14.0% 167573 30.4%471117 167378 35.5% 117244 24.9% 28440 6.0% 158055 33.5%276858 128025 46.2% 76852 27.8% 4825 1.7% 67156 24.3%318165 139188 43.7% 101751 32.0% 5644 1.8% 71582 22.5%425442 174099 40.9% 101400 23.8% 11132 2.6% 138811 32.6%369233 178845 48.4% 89085 24.1% 6160 1.7% 95143 25.8%146531 83245 56.8% 29009 19.8% 1622 1.1% 32655 22.3%404832 259191 64.0% 52168 12.9% 5353 1.3% 88120 21.8%455278 230311 50.6% 111103 24.4% 12103 2.7% 101761 22.4%333353 217992 65.4% 37807 11.3% 9041 2.7% 68513 20.6%474794 186046 39.2% 85347 18.0% 9595 2.0% 193806 40.8%134758 57899 43.0% 36488 27.1% 4090 3.0% 36281 26.9%331977 138486 41.7% 98964 29.8% 5752 1.7% 88775 26.7%410762 184230 44.9% 116315 28.3% 7168 1.7% 103049 25.1%
16202287 6935121 42.8% 3485987 21.5% 501369 3.1% 5279810 32.6%
BalaghatBarwaniBetulBhindBhopalChhatarpurChhindwaraDamoh DatiaDewasDharDindoriEast Nimar (Khandwa)GunaGwaliorHardaHoshangabadIndoreJabalpurJhabuaKatniMandlaMandsaurMorenaNarsimhapurNeemuchPannaRaisenRajgarhRatlamRewaSagarSatnaSehoreSeoniShahdolShajapurSheopurShivpuriSidhiTikamgarhUjjainUmariaVidishaWest Nimar (Khargone)
Madhya Pradesh
Category of Workers (Main + Marginal)
Total Workers Cultivators Agricultural Labourers Workers in Household Other Workers
(Main+Marginal) Industry
Nos Nos % Nos % Nos % Nos %
District
Source: Paper 3 of Madhya Pradesh, Census of India 2001, Registrar General of India, New Delhi

363
EL 5: SECTOR SHARE OF EMPLOYMENT OF MAIN AND MARGINAL WORKERS, 2001
337630 132862 39.4% 163430 48.4% 16446 4.9% 24892 7.4%232720 136171 58.5% 80079 34.4% 2415 1.0% 14055 6.0%253417 96522 38.1% 135451 53.4% 3552 1.4% 17892 7.1%147314 59174 40.2% 39990 27.1% 5453 3.7% 42697 29.0%127559 22786 17.9% 30958 24.3% 4350 3.4% 69465 54.5%203366 106586 52.4% 65522 32.2% 12916 6.4% 18342 9.0%297246 110079 37.0% 154356 51.9% 3590 1.2% 29221 9.8%182911 31548 17.2% 61680 33.7% 71995 39.4% 17688 9.7%125371 80324 64.1% 27687 22.1% 3068 2.4% 14292 11.4%229026 99082 43.3% 111322 48.6% 2970 1.3% 15652 6.8%343623 185254 53.9% 134757 39.2% 3317 1.0% 20295 5.9%158990 95032 59.8% 55143 34.7% 2598 1.6% 6217 3.9%283136 102208 36.1% 153595 54.2% 4371 1.5% 22962 8.1%226737 98701 43.5% 100089 44.1% 9347 4.1% 18600 8.2%107805 32296 30.0% 33852 31.4% 7169 6.6% 34488 32.0%
82607 32432 39.3% 44484 53.9% 1224 1.5% 4467 5.4%103848 21712 20.9% 59652 57.4% 3261 3.1% 19223 18.5%220828 58347 26.4% 68605 31.1% 9113 4.1% 84763 38.4%229370 33010 14.4% 95177 41.5% 40054 17.5% 61129 26.7%351134 258014 73.5% 64421 18.3% 2926 0.8% 25773 7.3%160691 42813 26.6% 75208 46.8% 21947 13.7% 20723 12.9%215559 88285 41.0% 111215 51.6% 2877 1.3% 13182 6.1%233643 124334 53.2% 92552 39.6% 2376 1.0% 14381 6.2%169188 76427 45.2% 27582 16.3% 5436 3.2% 59743 35.3%132122 32624 24.7% 80372 60.8% 5654 4.3% 13472 10.2%141865 81645 57.6% 48571 34.2% 1754 1.2% 9895 7.0%141546 59995 42.4% 60739 42.9% 5654 4.0% 15158 10.7%114291 26140 22.9% 63353 55.4% 9862 8.6% 14936 13.1%271555 150137 55.3% 102521 37.8% 4417 1.6% 14480 5.3%214655 100708 46.9% 93058 43.4% 2791 1.3% 18098 8.4%360914 166086 46.0% 155055 43.0% 17811 4.9% 21962 6.1%287262 47514 16.5% 84587 29.4% 127511 44.4% 27650 9.6%274096 87131 31.8% 119930 43.8% 37176 13.6% 29859 10.9%175532 75882 43.2% 86873 49.5% 2237 1.3% 10540 6.0%251046 96789 38.6% 135601 54.0% 2962 1.2% 15694 6.3%262426 94675 36.1% 136101 51.9% 6644 2.5% 25006 9.5%260858 131320 50.3% 112416 43.1% 3543 1.4% 13579 5.2%
83496 40310 48.3% 34096 40.8% 1260 1.5% 7830 9.4%247886 166089 67.0% 63624 25.7% 3351 1.4% 14822 6.0%302130 154865 51.3% 126414 41.8% 6248 2.1% 14603 4.8%233115 148460 63.7% 57600 24.7% 9540 4.1% 17515 7.5%279514 134415 48.1% 105441 37.7% 6522 2.3% 33136 11.9%
83471 29120 34.9% 44242 53.0% 2700 3.2% 7409 8.9%118998 31099 26.1% 68301 57.4% 4815 4.0% 14783 12.4%293701 144376 49.2% 129189 44.0% 3475 1.2% 16661 5.7%
9554198 4123379 43.2% 3894891 40.8% 508698 5.3% 1027230 10.8%
BalaghatBarwaniBetulBhindBhopalChhatarpurChhindwaraDamoh DatiaDewasDharDindoriEast Nimar (Khandwa)GunaGwaliorHardaHoshangabadIndoreJabalpurJhabuaKatniMandlaMandsaurMorenaNarsimhapurNeemuchPannaRaisenRajgarhRatlamRewaSagarSatnaSehoreSeoniShahdolShajapurSheopurShivpuriSidhiTikamgarhUjjainUmariaVidishaWest Nimar (Khargone)
Madhya Pradesh
Category of Female Workers (Main + Marginal)
Female Workers Cultivators Agricultural Labourers Workers in Household Other Workers
(Main+Marginal) Industry
Nos Nos % Nos % Nos % Nos %
District
Source: Paper 3 of Madhya Pradesh, Census of India 2001, Registrar General of India, New Delhi

364
EL 5: SECTOR SHARE OF EMPLOYMENT OF MAIN AND MARGINAL WORKERS, 2001
662449 280728 42.4% 274464 41.4% 28604 4.3% 78653 11.9%469681 292167 62.2% 136743 29.1% 4255 0.9% 36516 7.8%545600 254360 46.6% 227293 41.7% 8489 1.6% 55458 10.2%436628 264428 60.6% 89059 20.4% 7825 1.8% 75316 17.2%151043 65823 43.6% 60544 40.1% 1863 1.2% 22813 15.1%494313 306864 62.1% 111155 22.5% 19764 4.0% 56530 11.4%645380 296694 46.0% 258731 40.1% 7834 1.2% 82121 12.7%415396 131857 31.7% 141790 34.1% 90790 21.9% 50959 12.3%270285 190276 70.4% 48533 18.0% 3847 1.4% 27629 10.2%469115 231720 49.4% 189425 40.4% 5535 1.2% 42435 9.0%714197 414724 58.1% 229593 32.1% 7446 1.0% 62434 8.7%322402 202162 62.7% 95452 29.6% 5621 1.7% 19167 5.9%613095 265413 43.3% 282837 46.1% 7308 1.2% 57537 9.4%577801 331647 57.4% 188112 32.6% 9041 1.6% 49001 8.5%247651 133312 53.8% 66150 26.7% 3507 1.4% 44682 18.0%184454 82520 44.7% 84451 45.8% 2582 1.4% 14901 8.1%291884 106888 36.6% 132317 45.3% 6037 2.1% 46642 16.0%336085 139461 41.5% 123920 36.9% 6075 1.8% 66629 19.8%416230 114873 27.6% 193682 46.5% 37472 9.0% 70203 16.9%693449 531614 76.7% 101067 14.6% 4657 0.7% 56111 8.1%376218 136384 36.3% 140158 37.3% 37209 9.9% 62467 16.6%435304 202275 46.5% 189742 43.6% 6467 1.5% 36820 8.5%494498 282267 57.1% 156001 31.5% 4695 0.9% 51535 10.4%497879 323869 65.0% 64665 13.0% 7443 1.5% 101902 20.5%356122 134209 37.7% 170706 47.9% 10573 3.0% 40634 11.4%280309 167724 59.8% 78712 28.1% 2756 1.0% 31117 11.1%339562 174309 51.3% 111758 32.9% 10959 3.2% 42536 12.5%348393 134498 38.6% 150906 43.3% 13374 3.8% 49615 14.2%556900 332115 59.6% 166368 29.9% 8795 1.6% 49622 8.9%434578 245494 56.5% 149175 34.3% 4552 1.0% 35357 8.1%763624 362206 47.4% 288740 37.8% 29787 3.9% 82891 10.9%636644 213172 33.5% 211497 33.2% 140560 22.1% 71415 11.2%622102 244563 39.3% 229935 37.0% 50518 8.1% 97086 15.6%397832 199706 50.2% 159613 40.1% 4912 1.2% 33601 8.4%533643 234483 43.9% 235904 44.2% 6953 1.3% 56303 10.6%575034 262798 45.7% 232063 40.4% 13880 2.4% 66293 11.5%549045 296841 54.1% 191390 34.9% 7649 1.4% 53165 9.7%204586 120386 58.8% 61654 30.1% 2131 1.0% 20415 10.0%585505 418618 71.5% 112786 19.3% 6689 1.1% 47412 8.1%681748 374919 55.0% 231440 33.9% 16356 2.4% 59033 8.7%490302 343469 70.1% 87345 17.8% 12026 2.5% 47462 9.7%548918 309086 56.3% 183564 33.4% 7058 1.3% 49210 9.0%193164 84545 43.8% 76672 39.7% 5361 2.8% 26586 13.8%376504 163674 43.5% 164341 43.6% 7116 1.9% 41373 11.0%630048 325263 51.6% 236245 37.5% 7419 1.2% 61121 9.7%
20865600 10724404 51.4% 7116698 34.1% 693790 3.3% 2330708 11.2%
BalaghatBarwaniBetulBhindBhopalChhatarpurChhindwaraDamoh DatiaDewasDharDindoriEast Nimar (Khandwa)GunaGwaliorHardaHoshangabadIndoreJabalpurJhabuaKatniMandlaMandsaurMorenaNarsimhapurNeemuchPannaRaisenRajgarhRatlamRewaSagarSatnaSehoreSeoniShahdolShajapurSheopurShivpuriSidhiTikamgarhUjjainUmariaVidishaWest Nimar (Khargone)
Madhya Pradesh
Category of Rural Workers (Main + Marginal)
Rural Workers Cultivators Agricultural Labourers Workers in Household Other Workers(Main+Marginal) Industry
Nos Nos % Nos % Nos % Nos %
District
Source: Paper 3 of Madhya Pradesh, Census of India 2001, Registrar General of India, New Delhi

365
EL 5: SECTOR SHARE OF EMPLOYMENT OF MAIN AND MARGINAL WORKERS, 2001
341951 150810 44.1% 115476 33.8% 13030 3.8% 62635 18.3%249291 157198 63.1% 61557 24.7% 2548 1.0% 27988 11.2%302517 158765 52.5% 93887 31.0% 5522 1.8% 44343 14.7%299909 206846 69.0% 51400 17.1% 3205 1.1% 38458 12.8%
94018 43599 46.4% 31197 33.2% 1226 1.3% 17996 19.1%310933 205299 66.0% 50047 16.1% 10159 3.3% 45428 14.6%373485 188511 50.5% 111729 29.9% 5534 1.5% 67711 18.1%251607 100797 40.1% 80862 32.1% 31840 12.7% 38108 15.1%155170 111592 71.9% 21744 14.0% 2101 1.4% 19733 12.7%261335 135157 51.7% 85711 32.8% 3509 1.3% 36958 14.1%388129 231588 59.7% 100240 25.8% 4833 1.2% 51468 13.3%165106 107234 64.9% 40708 24.7% 3204 1.9% 13960 8.5%352641 164235 46.6% 135004 38.3% 4876 1.4% 48526 13.8%369225 234997 63.6% 89566 24.3% 5032 1.4% 39630 10.7%176998 102186 57.7% 34217 19.3% 2104 1.2% 38491 21.7%105898 50426 47.6% 40962 38.7% 1796 1.7% 12714 12.0%200704 85466 42.6% 73531 36.6% 4034 2.0% 37673 18.8%203091 83161 40.9% 59797 29.4% 3812 1.9% 56321 27.7%256799 82435 32.1% 101363 39.5% 16706 6.5% 56295 21.9%351781 276139 78.5% 37228 10.6% 2573 0.7% 35841 10.2%225919 93953 41.6% 65639 29.1% 16773 7.4% 49554 21.9%225873 114409 50.7% 79503 35.2% 3853 1.7% 28108 12.4%278150 162685 58.5% 67775 24.4% 3228 1.2% 44462 16.0%339321 249107 73.4% 37916 11.2% 3224 1.0% 49074 14.5%232217 101823 43.8% 91283 39.3% 6628 2.9% 32483 14.0%152589 90034 59.0% 34319 22.5% 1676 1.1% 26560 17.4%204302 115023 56.3% 52478 25.7% 6061 3.0% 30740 15.0%243943 108832 44.6% 89041 36.5% 6369 2.6% 39701 16.3%300208 184733 61.5% 67488 22.5% 5580 1.9% 42407 14.1%239400 147944 61.8% 59210 24.7% 3111 1.3% 29135 12.2%427362 200406 46.9% 139975 32.8% 17286 4.0% 69695 16.3%403190 166887 41.4% 128213 31.8% 50816 12.6% 57274 14.2%374862 160213 42.7% 113558 30.3% 21770 5.8% 79321 21.2%230632 124527 54.0% 74244 32.2% 3390 1.5% 28471 12.3%289275 138160 47.8% 101049 34.9% 4497 1.6% 45569 15.8%327669 169142 51.6% 98217 30.0% 8569 2.6% 51741 15.8%306102 170007 55.5% 84738 27.7% 4882 1.6% 46475 15.2%125077 80481 64.3% 28450 22.7% 1216 1.0% 14930 11.9%347168 254240 73.2% 50712 14.6% 4141 1.2% 38075 11.0%391623 223526 57.1% 107723 27.5% 10741 2.7% 49633 12.7%280503 203580 72.6% 34572 12.3% 6418 2.3% 35933 12.8%306273 178354 58.2% 81999 26.8% 4431 1.4% 41489 13.5%114821 56069 48.8% 34408 30.0% 3132 2.7% 21212 18.5%268186 133071 49.6% 96915 36.1% 3899 1.5% 34301 12.8%350373 181570 51.8% 111613 31.9% 4951 1.4% 52239 14.9%
12195626 6685217 54.8% 3347264 27.4% 334286 2.7% 1828859 15.0%
BalaghatBarwaniBetulBhindBhopalChhatarpurChhindwaraDamoh DatiaDewasDharDindoriEast Nimar (Khandwa)GunaGwaliorHardaHoshangabadIndoreJabalpurJhabuaKatniMandlaMandsaurMorenaNarsimhapurNeemuchPannaRaisenRajgarhRatlamRewaSagarSatnaSehoreSeoniShahdolShajapurSheopurShivpuriSidhiTikamgarhUjjainUmariaVidishaWest Nimar (Khargone)
Madhya Pradesh
Category of Rural Male Workers (Main + Marginal)
Male Workers Cultivators Agricultural Labourers Workers in Household Other Workers(Main+Marginal) Industry
Nos Nos % Nos % Nos % Nos %
District
Source: Paper 3 of Madhya Pradesh, Census of India 2001, Registrar General of India, New Delhi

366
EL 5: SECTOR SHARE OF EMPLOYMENT OF MAIN AND MARGINAL WORKERS, 2001
320498 129918 40.5% 158988 49.6% 15574 4.9% 16018 5.0%220390 134969 61.2% 75186 34.1% 1707 0.8% 8528 3.9%243083 95595 39.3% 133406 54.9% 2967 1.2% 11115 4.6%136719 57582 42.1% 37659 27.5% 4620 3.4% 36858 27.0%
57025 22224 39.0% 29347 51.5% 637 1.1% 4817 8.4%183380 101565 55.4% 61108 33.3% 9605 5.2% 11102 6.1%271895 108183 39.8% 147002 54.1% 2300 0.8% 14410 5.3%163789 31060 19.0% 60928 37.2% 58950 36.0% 12851 7.8%115115 78684 68.4% 26789 23.3% 1746 1.5% 7896 6.9%207780 96563 46.5% 103714 49.9% 2026 1.0% 5477 2.6%326068 183136 56.2% 129353 39.7% 2613 0.8% 10966 3.4%157296 94928 60.3% 54744 34.8% 2417 1.5% 5207 3.3%260454 101178 38.8% 147833 56.8% 2432 0.9% 9011 3.5%208576 96650 46.3% 98546 47.2% 4009 1.9% 9371 4.5%
70653 31126 44.1% 31933 45.2% 1403 2.0% 6191 8.8%78556 32094 40.9% 43489 55.4% 786 1.0% 2187 2.8%91180 21422 23.5% 58786 64.5% 2003 2.2% 8969 9.8%
132994 56300 42.3% 64123 48.2% 2263 1.7% 10308 7.8%159431 32438 20.3% 92319 57.9% 20766 13.0% 13908 8.7%341668 255475 74.8% 63839 18.7% 2084 0.6% 20270 5.9%150299 42431 28.2% 74519 49.6% 20436 13.6% 12913 8.6%209431 87866 42.0% 110239 52.6% 2614 1.2% 8712 4.2%216348 119582 55.3% 88226 40.8% 1467 0.7% 7073 3.3%158558 74762 47.2% 26749 16.9% 4219 2.7% 52828 33.3%123905 32386 26.1% 79423 64.1% 3945 3.2% 8151 6.6%127720 77690 60.8% 44393 34.8% 1080 0.8% 4557 3.6%135260 59286 43.8% 59280 43.8% 4898 3.6% 11796 8.7%104450 25666 24.6% 61865 59.2% 7005 6.7% 9914 9.5%256692 147382 57.4% 98880 38.5% 3215 1.3% 7215 2.8%195178 97550 50.0% 89965 46.1% 1441 0.7% 6222 3.2%336262 161800 48.1% 148765 44.2% 12501 3.7% 13196 3.9%233454 46285 19.8% 83284 35.7% 89744 38.4% 14141 6.1%247240 84350 34.1% 116377 47.1% 28748 11.6% 17765 7.2%167200 75179 45.0% 85369 51.1% 1522 0.9% 5130 3.1%244368 96323 39.4% 134855 55.2% 2456 1.0% 10734 4.4%247365 93656 37.9% 133846 54.1% 5311 2.1% 14552 5.9%242943 126834 52.2% 106652 43.9% 2767 1.1% 6690 2.8%
79509 39905 50.2% 33204 41.8% 915 1.2% 5485 6.9%238337 164378 69.0% 62074 26.0% 2548 1.1% 9337 3.9%290125 151393 52.2% 123717 42.6% 5615 1.9% 9400 3.2%209799 139889 66.7% 52773 25.2% 5608 2.7% 11529 5.5%242645 130732 53.9% 101565 41.9% 2627 1.1% 7721 3.2%
78343 28476 36.3% 42264 53.9% 2229 2.8% 5374 6.9%108318 30603 28.3% 67426 62.2% 3217 3.0% 7072 6.5%279675 143693 51.4% 124632 44.6% 2468 0.9% 8882 3.2%
8669974 4039187 46.6% 3769434 43.5% 359504 4.1% 501849 5.8%
BalaghatBarwaniBetulBhindBhopalChhatarpurChhindwaraDamoh DatiaDewasDharDindoriEast Nimar (Khandwa)GunaGwaliorHardaHoshangabadIndoreJabalpurJhabuaKatniMandlaMandsaurMorenaNarsimhapurNeemuchPannaRaisenRajgarhRatlamRewaSagarSatnaSehoreSeoniShahdolShajapurSheopurShivpuriSidhiTikamgarhUjjainUmariaVidishaWest Nimar (Khargone)
Madhya Pradesh
Category of Rural Female Workers (Main + Marginal)
Female Workers Cultivators Agricultural Labourers Workers in Household Other Workers(Main+Marginal) Industry
Nos Nos % Nos % Nos % Nos %
District
Source: Paper 3 of Madhya Pradesh, Census of India 2001, Registrar General of India, New Delhi

367
EL 5: SECTOR SHARE OF EMPLOYMENT OF MAIN AND MARGINAL WORKERS, 2001
64111 7024 11.0% 8025 12.5% 1957 3.1% 47105 73.5%53415 4404 8.2% 9083 17.0% 2154 4.0% 37774 70.7%70371 4122 5.9% 4142 5.9% 2024 2.9% 60083 85.4%88867 17726 19.9% 9055 10.2% 3217 3.6% 58869 66.2%
438447 4683 1.1% 4481 1.0% 9075 2.1% 420208 95.8%98799 18983 19.2% 9852 10.0% 6446 6.5% 63518 64.3%
133842 8868 6.6% 15711 11.7% 4081 3.0% 105182 78.6%69799 3766 5.4% 2232 3.2% 21188 30.4% 42613 61.1%45962 6452 14.0% 2005 4.4% 2409 5.2% 35096 76.4%
110102 9995 9.1% 15134 13.7% 3232 2.9% 81741 74.2%97508 8316 8.5% 10970 11.3% 2395 2.5% 75827 77.8%
8516 681 8.0% 836 9.8% 537 6.3% 6462 75.9%136765 5311 3.9% 11701 8.6% 5578 4.1% 114175 83.5%104150 9537 9.2% 3597 3.5% 10609 10.2% 80407 77.2%282190 9675 3.4% 4614 1.6% 12022 4.3% 255879 90.7%
28580 2124 7.4% 2119 7.4% 1185 4.1% 23152 81.0%94759 3724 3.9% 2133 2.3% 3305 3.5% 85597 90.3%
554876 9585 1.7% 9183 1.7% 23706 4.3% 512402 92.3%382805 5351 1.4% 7170 1.9% 39088 10.2% 331196 86.5%
39511 5628 14.2% 1034 2.6% 2352 6.0% 30497 77.2%67172 2157 3.2% 1480 2.2% 3220 4.8% 60315 89.8%28337 1420 5.0% 2218 7.8% 790 2.8% 23909 84.4%76273 11233 14.7% 7722 10.1% 2816 3.7% 54502 71.5%91357 11430 12.5% 3346 3.7% 3105 3.4% 73476 80.4%47098 2593 5.5% 2301 4.9% 4476 9.5% 37728 80.1%67919 9127 13.4% 6836 10.1% 1989 2.9% 49967 73.6%32132 3924 12.2% 3441 10.7% 1799 5.6% 22968 71.5%61398 5128 8.4% 4544 7.4% 5215 8.5% 46511 75.8%69452 8149 11.7% 6266 9.0% 3038 4.4% 51999 74.9%
112781 9181 8.1% 5370 4.8% 4632 4.1% 93598 83.0%99984 12579 12.6% 12659 12.7% 11062 11.1% 63684 63.7%
202669 10105 5.0% 4511 2.2% 64245 31.7% 123808 61.1%123111 9946 8.1% 7239 5.9% 15098 12.3% 90828 73.8%54558 4201 7.7% 4112 7.5% 2150 3.9% 44095 80.8%35568 1494 4.2% 1448 4.1% 1653 4.6% 30973 87.1%
112834 5976 5.3% 5438 4.8% 3896 3.5% 97524 86.4%81046 13324 16.4% 10111 12.5% 2054 2.5% 55557 68.5%25441 3169 12.5% 1451 5.7% 751 3.0% 20070 78.9%67213 6662 9.9% 3006 4.5% 2015 3.0% 55530 82.6%75660 10257 13.6% 6077 8.0% 1995 2.6% 57331 75.8%76166 22983 30.2% 8062 10.6% 6555 8.6% 38566 50.6%
205390 11375 5.5% 7224 3.5% 9059 4.4% 177732 86.5%25065 2474 9.9% 4058 16.2% 1429 5.7% 17104 68.2%74471 5911 7.9% 2924 3.9% 3451 4.6% 62185 83.5%74415 3343 4.5% 9259 12.4% 3224 4.3% 58589 78.7%
4890885 334096 6.8% 264180 5.4% 316277 6.5% 3976332 81.3%
BalaghatBarwaniBetulBhindBhopalChhatarpurChhindwaraDamoh DatiaDewasDharDindoriEast Nimar (Khandwa)GunaGwaliorHardaHoshangabadIndoreJabalpurJhabuaKatniMandlaMandsaurMorenaNarsimhapurNeemuchPannaRaisenRajgarhRatlamRewaSagarSatnaSehoreSeoniShahdolShajapurSheopurShivpuriSidhiTikamgarhUjjainUmariaVidishaWest Nimar (Khargone)
Madhya Pradesh
Category of Urban Workers (Main + Marginal)
Urban Workers
(Main+Marginal) Cultivators Agricultural Labourers Workers in Household Other WorkersIndustry
Nos Nos % Nos % Nos % Nos %
District
Source: Paper 3 of Madhya Pradesh, Census of India 2001, Registrar General of India, New Delhi

368
EL 5: SECTOR SHARE OF EMPLOYMENT OF MAIN AND MARGINAL WORKERS, 2001
46979 4080 8.7% 3583 7.6% 1085 2.3% 38231 81.4%41085 3202 7.8% 4190 10.2% 1446 3.5% 32247 78.5%60037 3195 5.3% 2097 3.5% 1439 2.4% 53306 88.8%78272 16134 20.6% 6724 8.6% 2384 3.0% 53030 67.8%
367913 4121 1.1% 2870 0.8% 5362 1.5% 355560 96.6%78813 13962 17.7% 5438 6.9% 3135 4.0% 56278 71.4%
108491 6972 6.4% 8357 7.7% 2791 2.6% 90371 83.3%50677 3278 6.5% 1480 2.9% 8143 16.1% 37776 74.5%35706 4812 13.5% 1107 3.1% 1087 3.0% 28700 80.4%88856 7476 8.4% 7526 8.5% 2288 2.6% 71566 80.5%79953 6198 7.8% 5566 7.0% 1691 2.1% 66498 83.2%
6822 577 8.5% 437 6.4% 356 5.2% 5452 79.9%114083 4281 3.8% 5939 5.2% 3639 3.2% 100224 87.9%85989 7486 8.7% 2054 2.4% 5271 6.1% 71178 82.8%
245038 8505 3.5% 2695 1.1% 6256 2.6% 227582 92.9%24529 1786 7.3% 1124 4.6% 747 3.0% 20872 85.1%82091 3434 4.2% 1267 1.5% 2047 2.5% 75343 91.8%
467042 7538 1.6% 4701 1.0% 16856 3.6% 437947 93.8%312866 4779 1.5% 4312 1.4% 19800 6.3% 283975 90.8%
30045 3089 10.3% 452 1.5% 1510 5.0% 24994 83.2%56780 1775 3.1% 791 1.4% 1709 3.0% 52505 92.5%22209 1001 4.5% 1242 5.6% 527 2.4% 19439 87.5%58978 6481 11.0% 3396 5.8% 1907 3.2% 47194 80.0%80727 9765 12.1% 2513 3.1% 1888 2.3% 66561 82.5%38881 2355 6.1% 1352 3.5% 2767 7.1% 32407 83.3%53774 5172 9.6% 2658 4.9% 1315 2.4% 44629 83.0%25846 3215 12.4% 1982 7.7% 1043 4.0% 19606 75.9%51557 4654 9.0% 3056 5.9% 2358 4.6% 41489 80.5%54589 5394 9.9% 2625 4.8% 1836 3.4% 44734 81.9%93304 6023 6.5% 2277 2.4% 3282 3.5% 81722 87.6%75332 8293 11.0% 6369 8.5% 5752 7.6% 54918 72.9%
148861 8876 6.0% 3208 2.2% 26478 17.8% 110299 74.1%96255 7165 7.4% 3686 3.8% 6670 6.9% 78734 81.8%46226 3498 7.6% 2608 5.6% 1435 3.1% 38685 83.7%28890 1028 3.6% 702 2.4% 1147 4.0% 26013 90.0%97773 4957 5.1% 3183 3.3% 2563 2.6% 87070 89.1%63131 8838 14.0% 4347 6.9% 1278 2.0% 48668 77.1%21454 2764 12.9% 559 2.6% 406 1.9% 17725 82.6%57664 4951 8.6% 1456 2.5% 1212 2.1% 50045 86.8%63655 6785 10.7% 3380 5.3% 1362 2.1% 52128 81.9%52850 14412 27.3% 3235 6.1% 2623 5.0% 32580 61.6%
168521 7692 4.6% 3348 2.0% 5164 3.1% 152317 90.4%19937 1830 9.2% 2080 10.4% 958 4.8% 15069 75.6%63791 5415 8.5% 2049 3.2% 1853 2.9% 54474 85.4%60389 2660 4.4% 4702 7.8% 2217 3.7% 50810 84.1%
4006661 249904 6.2% 138723 3.5% 167083 4.2% 3450951 86.1%
BalaghatBarwaniBetulBhindBhopalChhatarpurChhindwaraDamoh DatiaDewasDharDindoriEast Nimar (Khandwa)GunaGwaliorHardaHoshangabadIndoreJabalpurJhabuaKatniMandlaMandsaurMorenaNarsimhapurNeemuchPannaRaisenRajgarhRatlamRewaSagarSatnaSehoreSeoniShahdolShajapurSheopurShivpuriSidhiTikamgarhUjjainUmariaVidishaWest Nimar (Khargone)
Madhya Pradesh
Category of Urban Male Workers (Main + Marginal)
Urban Male Workers
(Main+Marginal) Cultivators Agricultural Labourers Workers in Household Other WorkersIndustry
Nos Nos % Nos % Nos % Nos %
District
Source: Paper 3 of Madhya Pradesh, Census of India 2001, Registrar General of India, New Delhi
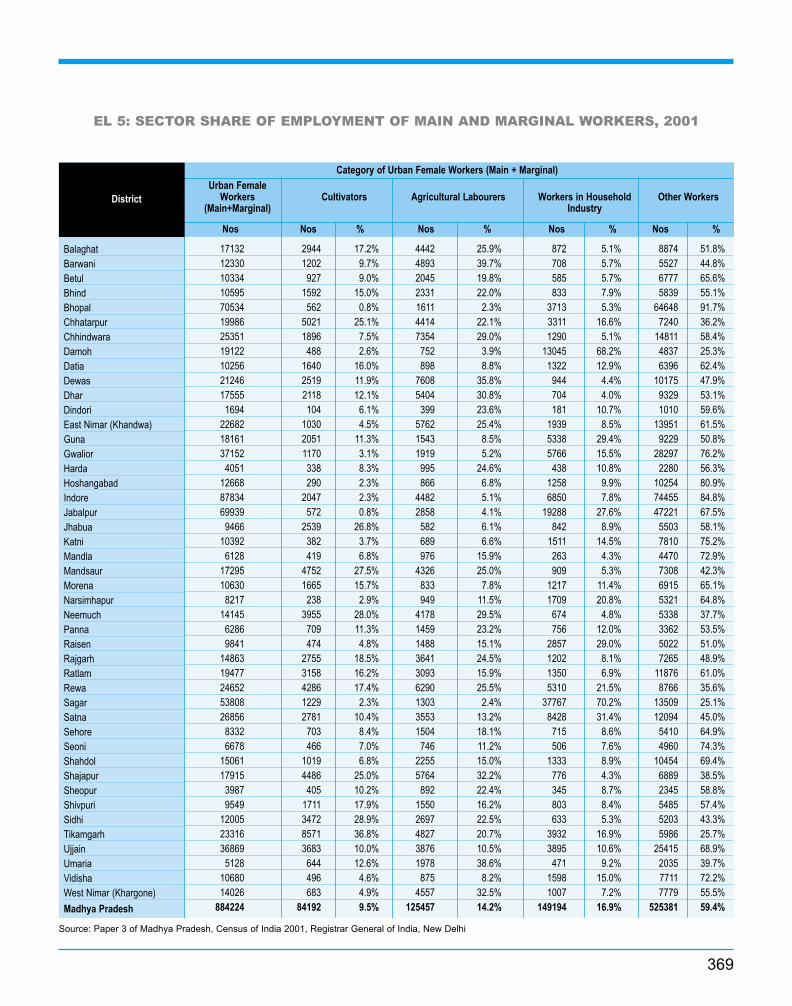
369
EL 5: SECTOR SHARE OF EMPLOYMENT OF MAIN AND MARGINAL WORKERS, 2001
17132 2944 17.2% 4442 25.9% 872 5.1% 8874 51.8%12330 1202 9.7% 4893 39.7% 708 5.7% 5527 44.8%10334 927 9.0% 2045 19.8% 585 5.7% 6777 65.6%10595 1592 15.0% 2331 22.0% 833 7.9% 5839 55.1%70534 562 0.8% 1611 2.3% 3713 5.3% 64648 91.7%19986 5021 25.1% 4414 22.1% 3311 16.6% 7240 36.2%25351 1896 7.5% 7354 29.0% 1290 5.1% 14811 58.4%19122 488 2.6% 752 3.9% 13045 68.2% 4837 25.3%10256 1640 16.0% 898 8.8% 1322 12.9% 6396 62.4%21246 2519 11.9% 7608 35.8% 944 4.4% 10175 47.9%17555 2118 12.1% 5404 30.8% 704 4.0% 9329 53.1%
1694 104 6.1% 399 23.6% 181 10.7% 1010 59.6%22682 1030 4.5% 5762 25.4% 1939 8.5% 13951 61.5%18161 2051 11.3% 1543 8.5% 5338 29.4% 9229 50.8%37152 1170 3.1% 1919 5.2% 5766 15.5% 28297 76.2%
4051 338 8.3% 995 24.6% 438 10.8% 2280 56.3%12668 290 2.3% 866 6.8% 1258 9.9% 10254 80.9%87834 2047 2.3% 4482 5.1% 6850 7.8% 74455 84.8%69939 572 0.8% 2858 4.1% 19288 27.6% 47221 67.5%
9466 2539 26.8% 582 6.1% 842 8.9% 5503 58.1%10392 382 3.7% 689 6.6% 1511 14.5% 7810 75.2%
6128 419 6.8% 976 15.9% 263 4.3% 4470 72.9%17295 4752 27.5% 4326 25.0% 909 5.3% 7308 42.3%10630 1665 15.7% 833 7.8% 1217 11.4% 6915 65.1%
8217 238 2.9% 949 11.5% 1709 20.8% 5321 64.8%14145 3955 28.0% 4178 29.5% 674 4.8% 5338 37.7%
6286 709 11.3% 1459 23.2% 756 12.0% 3362 53.5%9841 474 4.8% 1488 15.1% 2857 29.0% 5022 51.0%
14863 2755 18.5% 3641 24.5% 1202 8.1% 7265 48.9%19477 3158 16.2% 3093 15.9% 1350 6.9% 11876 61.0%24652 4286 17.4% 6290 25.5% 5310 21.5% 8766 35.6%53808 1229 2.3% 1303 2.4% 37767 70.2% 13509 25.1%26856 2781 10.4% 3553 13.2% 8428 31.4% 12094 45.0%
8332 703 8.4% 1504 18.1% 715 8.6% 5410 64.9%6678 466 7.0% 746 11.2% 506 7.6% 4960 74.3%
15061 1019 6.8% 2255 15.0% 1333 8.9% 10454 69.4%17915 4486 25.0% 5764 32.2% 776 4.3% 6889 38.5%
3987 405 10.2% 892 22.4% 345 8.7% 2345 58.8%9549 1711 17.9% 1550 16.2% 803 8.4% 5485 57.4%
12005 3472 28.9% 2697 22.5% 633 5.3% 5203 43.3%23316 8571 36.8% 4827 20.7% 3932 16.9% 5986 25.7%36869 3683 10.0% 3876 10.5% 3895 10.6% 25415 68.9%
5128 644 12.6% 1978 38.6% 471 9.2% 2035 39.7%10680 496 4.6% 875 8.2% 1598 15.0% 7711 72.2%14026 683 4.9% 4557 32.5% 1007 7.2% 7779 55.5%
884224 84192 9.5% 125457 14.2% 149194 16.9% 525381 59.4%
BalaghatBarwaniBetulBhindBhopalChhatarpurChhindwaraDamoh DatiaDewasDharDindoriEast Nimar (Khandwa)GunaGwaliorHardaHoshangabadIndoreJabalpurJhabuaKatniMandlaMandsaurMorenaNarsimhapurNeemuchPannaRaisenRajgarhRatlamRewaSagarSatnaSehoreSeoniShahdolShajapurSheopurShivpuriSidhiTikamgarhUjjainUmariaVidishaWest Nimar (Khargone)
Madhya Pradesh
Category of Urban Female Workers (Main + Marginal)
Urban Female Workers Cultivators Agricultural Labourers Workers in Household Other Workers
(Main+Marginal) Industry
Nos Nos % Nos % Nos % Nos %
District
Source: Paper 3 of Madhya Pradesh, Census of India 2001, Registrar General of India, New Delhi

370
EL 6 gives the land use classification in Madhya Pradesh in the years
1978-79, 1988-89 and 1998-99, with a breakup of the Total Geographical
Area into Net Sown Area, Forest, Land not available for Cultivation, Other
Uncultivated Land excluding Fallow Land, Cultivable Wasteland and Fallow
Land. The above categories have further been divided into sub-groups. The
Total Cropped Area, the Net Sown Area along with cropping intensity has
also been given. The table also gives information on the percentage
change in Net-Cropped Area and Gross Cropped over periods of ten years
between 1978-79 to 1988-89 and between 1988-89 to 1998-99. Gross and
Net Cropped Area as a percentage of Total Geographical Area are also
calculated along with Area Sown more than once as a percentage of Net
Sown Area.
EL 6: LAND USE CLASSIFICATION IN DISTRICTS OF MADHYA PRADESH OVER 30 YEARS
GEOGRAPHICAL AREA
The latest figure of geographical area for the State/ Union
Territory/ Districts furnished by the Office of the Surveyor
General of India's data.
FORESTS
This includes all lands classed as forest under any legal enact-
ment dealing with forests or administered as forests, whether
state-owned or private, and whether wooded or maintained as
potential forest land. The area of crops raised in the forest and
grazing lands or areas open for grazing within the forests
remain included under the forest area.
AREA UNDER NON-AGRICULTURAL USES
This includes all lands occupied by buildings, roads and rail-
ways or under water, e.g. rivers and canals and other lands put
to uses other than agriculture.
BARREN AND UN-CULTURABLE LAND
This includes all barren and unculturable land like mountains,
deserts, etc. Land which cannot be brought under cultivation
except at an exorbitant cost, should be classed as unculturable
whether such land is in isolated blocks or within cultivated
holdings.
PERMANENT PASTURES AND OTHER GRAZING LANDS
This includes all grazing lands whether they are permanent
pastures and meadows or not. Village common grazing land
is included under this head.
LAND UNDER MISCELLANEOUS TREE CROPS, ETC.This includes all cultivable land which is not included in 'Net
area sown' but is put to some agricultural uses. Lands under
Casurina trees, thatching grasses, bamboo bushes and other
groves for fuel, etc. which are not included under 'Orchards'
are classed under this category.
CULTURABLE WASTE LAND
This includes lands available for cultivation, whether not
taken up for cultivation or taken up for cultivation once but
not cultivated during the current year and the last five years
or more in succession for one reason or other. Such lands
may be either fallow or covered with shrubs and jungles,
which are not put to any use. They may be assessed or
unassessed and may lie in isolated blocks or within cultivated
holdings. Land once cultivated but not cultivated for five
years in succession is also included in this category at the end
of the five years.

371
FALLOW LANDS OTHER THAN CURRENT FALLOW
This includes all lands which were taken up for cultivation but
are temporarily out of cultivation for a period of not less than
one year and not more than five years.
CURRENT FALLOW
This represents cropped area, which are kept fallow during the
current year. For example, if any seeding area is not cropped
against the same year it may be treated as current fallow.
NET AREA SOWN
This represents the total area sown with crops and orchards.
Area sown more than once; in the same year is counted only
once.
GROSS CROPPED AREA
This represents the total area covered with crops, i.e. the sum
total of areas covered by all the individual crops; areas sown
with crops more than once during the year being counted as
separate areas for each crop.
AREA SOWN MORE THAN ONCE
This is obtained by deducting 'Net Area Sown' from 'Total
Cropped Area'.Source: Agricultural Statistics 2000, Directorate of Agriculture, Madhya Pradesh
for M.P. and Land Statistics at a Glance, Directorate of Economics and Statistics,
Department of Agriculture and Co-operation, Government of India for India
Year Madhya IndiaPradesh
Geographical Area ('000 hectares) 1998-99 30745 306044
Share of India 10% 27.99 22.54
As percentage of geographical area
Forests 1998-99 6 7.45
Area under non-agricultural uses 1998-99 4.38 6.39
Barren and unculturable land 1998-99 5.52 3.63
Permanent Pastures and Other Grazing Land 1998-99 0.06 1.18
Land under Miscellaneous Tree Crops 1998-99 3.82 4.56
Culturable Wasteland 1998-99 1.76 3.24
Current Fallow 1998-99 1.62 4.42
Net Area Sown as % of total geographical area 1998-99 48.84 46.59
Share of India 10.53%
Gross Area Sown as % of total geographical area 1998-99 66.24 62.94
Share of India 10.57%
Area sown more than once as percentage of
net sown area 1998-99 17.41 35.08
Cropping Intensity 1998-99 135.4 135.1

372
EL 6: LAND USE CLASSIFICATION IN DISTRICTS OF MADHYA PRADESH OVER 30 YEARS
922300 924500 275400 276500 2727581007800 1007800 388200 408800 407097
445200 445204 336100 336500 337327270800 277880 150200 157000 158691863100 863036 340200 348100 383463
1184900 1184923 476300 491300 495929728600 728583 277000 280100 302295203500 263959 127300 131700 190614700300 700812 348500 359200 373533819500 819541 492100 499500 505275
1117200 1118357 438000 448400 4383391098200 1098160 567000 615000 633720
521900 456449 251000 262600 216621999300 668689 437200 454900 293651
330579 Included in Hoshangabad 169827383100 383097 257100 250300 257102
1012500 519757 468400 436200 278647493015 Included in Jabalpur 201172
675700 675716 340400 353300 3618791326000 912455 420300 410100 198014
412039 Included in Mandla 238383946400 552098 512600 541600 350922
393915 Included in Mandsaur 1886191168300 501686 373800 414400 265843
666650 Included in Morena 151856513600 513651 273000 288000 297735702900 702924 212700 219000 243240848700 848746 402800 418400 426247611700 616300 394600 406400 414756486400 486474 300700 314100 325030628800 628745 366900 357100 371843
1023200 1022759 508100 513200 531983742400 742432 347500 353100 362254656300 656368 347500 365600 376745870800 875401 369700 367900 371743
1386000 935677 473100 446000 359966450329 Included in Shahdol 110914
617800 617836 411200 430000 4422681017300 1017346 354200 383200 4135341039200 1039194 344100 348400 377053
504000 504002 224100 234400 263475611600 609874 456100 462400 480179730200 730197 502000 517300 530639
1348500 648302 619500 629300 411013700201 Included in West Nimar 233384
11463430734000 30745658 14184900 14529300 15015578
BalaghatBetulBhindBhopalChhatarpurChhindwaraDamohDatiaDewasDharEast Nimar (Khandwa)GunaGwaliorHoshangabadHardaIndoreJabalpurKatniJhabuaMandlaDindoriMandsaurNeemuchMorenaSheopurNarsimhapurPannaRaisenRajgarhRatlamRewaSagarSatnaSehoreSeoniShahdolUmariaShajapurShivpuriSidhiTikamgarhUjjainVidishaWest Nimar(Khargone)BarwaniNon-reportedMadhya Pradesh
Geographical Geographical Net Area SownArea uptil Area after formation
1990 of new districts 1978-79 1988-89 1998-99District
Source: Commissioner of Land Records, Madhya Pradesh, Gwalior

373
EL 6: LAND USE CLASSIFICATION IN DISTRICTS OF MADHYA PRADESH OVER 30 YEARS
0.4 -1.4 29.9 30.0 29.55.3 -0.4 38.5 40.6 40.40.1 0.2 75.5 75.6 75.84.5 1.1 55.5 58.0 57.12.3 10.2 39.4 40.3 44.43.1 0.9 40.2 41.5 41.91.1 7.9 38.0 38.4 41.53.5 44.7 62.6 64.7 72.23.1 4.0 49.8 51.3 53.31.5 1.2 60.0 61.0 61.72.4 -2.2 39.2 40.1 39.28.5 3.0 51.6 56.0 57.74.6 -17.5 48.1 50.3 47.54.0 -35.4 43.8 45.5 43.9
Included in Hoshangabad 51.4-2.6 2.7 67.1 65.3 67.1-6.9 -36.1 46.3 43.1 53.6
Included in Jabalpur 40.83.8 2.4 50.4 52.3 53.6
-2.4 -51.7 31.7 30.9 21.7Included in Mandla 57.9
5.7 -35.2 54.2 57.2 63.6Included in Mandsaur 47.9
10.9 -35.8 32.0 35.5 53.0Included in Morena 22.8
5.5 3.4 53.2 56.1 58.03.0 11.1 30.3 31.2 34.63.9 1.9 47.5 49.3 50.23.0 2.1 64.5 66.4 67.34.5 3.5 61.8 64.6 66.8
-2.7 4.1 58.3 56.8 59.11.0 3.7 49.7 50.2 52.01.6 2.6 46.8 47.6 48.85.2 3.0 52.9 55.7 57.4
-0.5 1.0 42.5 42.2 42.5-5.7 -19.3 34.1 32.2 38.5
Included in Shahdol 24.64.6 2.9 66.6 69.6 71.68.2 7.9 34.8 37.7 40.61.2 8.2 33.1 33.5 36.34.6 12.4 44.5 46.5 52.31.4 3.8 74.6 75.6 78.73.0 2.6 68.7 70.8 72.71.6 -34.7 45.9 46.7 63.4
Included in West Nimar 33.32.4 3.3 46.2 47.3 48.8
BalaghatBetulBhindBhopalChhatarpurChhindwaraDamohDatiaDewasDharEast Nimar (Khandwa)GunaGwaliorHoshangabadHardaIndoreJabalpurKatniJhabuaMandlaDindoriMandsaurNeemuchMorenaSheopurNarsimhapurPannaRaisenRajgarhRatlamRewaSagarSatnaSehoreSeoniShahdolUmariaShajapurShivpuriSidhiTikamgarhUjjainVidishaWest Nimar(Khargone)BarwaniMadhya Pradesh
% Change in Net Cropped Area % of Net Area Sown To Geographical Area
over Period of Ten Years
1978-79 to1988-89 1988-89 to 1998-99 1978-79 1988-89 19998-99
District
Source: Commissioner of Land Records, Madhya Pradesh, Gwalior

374
EL 6: LAND USE CLASSIFICATION IN DISTRICTS OF MADHYA PRADESH OVER 30 YEARS
374800 363500 343698 -3.0 -5.4432900 480000 531856 10.9 10.8355200 361900 366728 1.9 1.3154600 180000 226141 16.4 25.6387700 405600 484283 4.6 19.4528000 566800 615518 7.3 8.6304900 308000 389105 1.0 26.3130000 138700 209157 6.7 50.8387700 439000 590470 13.2 34.5565200 601300 731587 6.4 21.7465400 492800 543613 5.9 10.3592800 657400 745883 10.9 13.5272400 287400 258598 5.5 -10.0448100 574600 478346 28.2 -16.8
Included in Hoshangabad 284926 Included in Hoshangabad304900 365500 448557 19.9 22.7562700 508100 368594 -9.7 -27.5
Included in Jabalpur 265787 Included in Jabalpur382100 396500 474361 3.8 19.6517900 488400 262330 -5.7 -46.3
Included in Mandla 308075 Included in Mandla684800 763900 570096 11.6 -25.4
Included in Mandsaur 305471 Included in Mandsaur419000 471800 320256 12.6 -32.1
Included in Morena 205239 Included in Morena286200 324900 412968 13.5 27.1243100 243900 284009 0.3 16.4407500 467600 551415 14.7 17.9437100 489000 603373 11.9 23.4361100 412900 518582 14.3 25.6467900 432500 500385 -7.6 15.7529400 563200 689048 6.4 22.3424300 414000 488145 -2.4 17.9368000 447900 578036 21.7 29.1395900 406900 463649 2.8 13.9548200 507700 426988 -7.4 -15.9
Included in Shahdol 142005 Included in Shahdol459400 546700 720420 19.0 31.8397700 444800 532335 11.8 19.7456700 449000 508521 -1.7 13.3284600 316200 398616 11.1 26.1513300 603000 819551 17.5 35.9514000 558000 637749 8.6 14.3681900 691300 483999 1.4 -30.0
Included in West Nimar 278695 Included in West Nimar114634
16047400 17170700 20481798 7.0 18.6
BalaghatBetulBhindBhopalChhatarpurChhindwaraDamohDatiaDewasDharEast Nimar (Khandwa)GunaGwaliorHoshangabadHardaIndoreJabalpurKatniJhabuaMandlaDindoriMandsaurNeemuchMorenaSheopurNarsimhapurPannaRaisenRajgarhRatlamRewaSagarSatnaSehoreSeoniShahdolUmariaShajapurShivpuriSidhiTikamgarhUjjainVidishaWest Nimar(Khargone)BarwaniNon-reportedMadhya Pradesh
% Change in Gross Cropped Area
Gross Cropped Area over Period of 10 Years
1978-79 1988-89 1998-99 1978-79 to 1988 1988-89 to 1998-99
District
Source: Commissioner of Land Records, Madhya Pradesh, Gwalior

375
EL 6: LAND USE CLASSIFICATION IN DISTRICTS OF MADHYA PRADESH OVER 30 YEARS
40.6 39.4 37.2 99400 87000 7094043.0 47.6 52.8 44700 71200 12475979.8 81.3 82.4 19100 25400 2940157.1 66.5 81.4 4400 23000 6745044.9 47.0 56.1 47500 57500 10082044.6 47.8 51.9 51700 75500 11958941.8 42.3 53.4 27900 27900 8681063.9 68.2 79.2 2700 7000 1854355.4 62.7 84.3 39200 79800 21693769.0 73.4 89.3 73100 101800 22631241.7 44.1 48.6 27400 44400 10527454.0 59.9 67.9 25800 42400 11216352.2 55.1 56.7 21400 24800 4197744.8 57.5 71.5 10900 119700 184695
Included in Hoshangabad 86.2 Included in Hoshangabad 11509979.6 95.4 117.1 47800 115200 19145555.6 50.2 70.9 94300 71900 89947
Included in Jabalpur 53.9 Included in Jabalpur 6461556.5 58.7 70.2 41700 43200 11248239.1 36.8 28.7 97600 78300 64316
Included in Mandla 74.8 Included in Mandla 6969272.4 80.7 103.3 172200 222300 219174
Included in Mandsaur 77.5 Included in Mandsaur 11685235.9 40.4 63.8 45200 57400 54413
Included in Morena 30.8 Included in Morena 5338355.7 63.3 80.4 13200 36900 11523334.6 34.7 40.4 30400 24900 4076948.0 55.1 65.0 4700 49200 12516871.5 79.9 97.9 42500 82600 18861774.2 84.9 106.6 60400 98800 19355274.4 68.8 79.6 101000 75400 12854251.7 55.0 67.4 21300 50000 15706557.2 55.8 65.7 76800 60900 12589156.1 68.2 88.1 20500 82300 20129145.5 46.7 53.0 26200 39000 9190639.6 36.6 45.6 75100 61700 67022
Included in Shahdol 31.5 Included in Shahdol 3109174.4 88.5 116.6 48200 116700 27815239.1 43.7 52.3 43500 61600 11880143.9 43.2 48.9 112600 100600 13146856.5 62.7 79.1 60500 81800 13514183.9 98.6 134.4 57200 140600 33937270.4 76.4 87.3 12000 40700 10711050.6 51.3 74.7 62400 62000 72986
Included in West Nimar 39.8 Included in West Nimar 4531152.2 55.9 66.2 1862500 2641400 5351586
BalaghatBetulBhindBhopalChhatarpurChhindwaraDamohDatiaDewasDharEast Nimar (Khandwa)GunaGwaliorHoshangabadHardaIndoreJabalpurKatniJhabuaMandlaDindoriMandsaurNeemuchMorenaSheopurNarsimhapurPannaRaisenRajgarhRatlamRewaSagarSatnaSehoreSeoniShahdolUmariaShajapurShivpuriSidhiTikamgarhUjjainVidishaWest Nimar(Khargone)BarwaniMadhya Pradesh
% Of Gross Area Sown to Area Sown More Than Once
Geographical Area
1978-79 1988-89 1998-99 1978-79 1988-89 1998-99
District
Source: Commissioner of Land Records, Madhya Pradesh, Gwalior

376
EL 6: LAND USE CLASSIFICATION IN DISTRICTS OF MADHYA PRADESH OVER 30 YEARS
36.1 31.5 26.0 127.8 126.0 490000 421100 50559111.5 17.4 30.6 119.0 130.6 1008000 394900 3955795.7 7.5 8.7 108.5 108.7 445000 7400 89052.9 14.6 42.5 122.5 142.5 271000 38700 44106
14.0 16.5 26.3 119.1 126.3 87000 85900 21429910.9 15.4 24.1 113.6 124.1 444000 446800 47888610.1 10.0 28.7 115.1 128.7 266000 266800 267003
2.1 5.3 9.7 106.0 109.7 204000 22600 2077211.2 22.2 58.1 121.6 158.1 203000 204100 20568914.9 20.4 44.8 129.3 144.8 75000 136700 119424
6.3 9.9 24.0 110.0 124.0 508000 512200 5118434.6 6.9 17.7 110.7 117.7 1098000 153000 1520868.5 9.4 19.4 108.1 119.4 522000 109300 1095302.5 26.3 62.9 148.2 162.9 999000 360300 253202
Included in Hoshangabad 67.8 167.8 Incl. in Hoshangabad 10465318.6 46.0 74.5 142.2 174.5 52000 52200 5220820.1 16.5 32.3 122.4 132.3 169000 157400 73711
Included in Jabalpur 32.1 132.1 Included in Jabalpur 10002812.3 12.2 31.1 140.2 131.1 114000 118300 13087323.2 19.1 32.5 119.7 132.5 571000 571200 583195
Included in Mandla 29.2 129.2 Included in Mandla 3482633.6 41.0 62.5 150.3 162.5 107000 106500 36815
Included in Mandsaur 62.0 162.0 Included in Mandsaur 6803812.1 13.9 20.5 111.0 120.5 1169000 331100 50669
Included in Morena 35.2 135.2 Included in Morena 2828184.8 12.8 38.7 126.5 138.7 137000 136200 136207
14.3 11.4 16.8 112.8 116.8 238000 238600 2993821.2 11.8 29.4 121.9 129.4 848000 333800 333407
10.8 20.3 45.5 122.0 145.5 612000 14500 1880120.1 31.5 59.5 148.6 159.5 35000 34500 3453027.5 21.1 34.6 129.7 134.6 66000 67000 66987
4.2 9.7 29.5 114.9 129.5 291000 290600 28880922.1 17.2 34.8 123.0 134.8 131000 133500 203485
5.9 22.5 53.4 128.1 153.4 656000 172100 1718287.1 10.6 24.7 114.3 124.7 320000 322500 327752
15.9 13.8 18.6 113.4 118.6 591000 556800 304334Included in Shahdol 28.0 128.0 Included in Shahdol 237235
11.7 27.1 62.9 129.5 162.9 3000 2700 679312.3 16.1 28.7 117.8 128.7 1017000 233300 33027232.7 28.9 34.9 125.2 134.9 432000 446300 43796127.0 34.9 51.3 140.9 151.3 65000 66700 6664812.5 30.4 70.7 143.5 170.7 8000 7800 3149
2.4 7.9 20.2 110.9 120.2 730000 105100 10582510.1 9.9 17.8 110.5 117.8 472000 470400 74928
included in West Nimar 19.4 119.4 Incl. in West Nimar 353459-114634
13.1 18.2 35.6 121.1 135.4 15454000 8128900 8491907
BalaghatBetulBhindBhopalChhatarpurChhindwaraDamohDatiaDewasDharEast Nimar (Khandwa)GunaGwaliorHoshangabadHardaIndoreJabalpurKatniJhabuaMandlaDindoriMandsaurNeemuchMorenaSheopurNarsimhapurPannaRaisenRajgarhRatlamRewaSagarSatnaSehoreSeoniShahdolUmariaShajapurShivpuriSidhiTikamgarhUjjainVidishaWest Nimar (Khargone)BarwaniNon-reportedMadhya Pradesh
% Of Area Sown More Than Once to Net Cropping Intensity Forest
1978-79 1988-89 1998-99 1992-93 1998-99 1977-78 1988-89 1998-99
District
Source: Commissioner of Land Records, Madhya Pradesh, Gwalior

377
EL 6: LAND USE CLASSIFICATION IN DISTRICTS OF MADHYA PRADESH OVER 30 YEARS
44000 45600 46333 15000 78700 9493 59000 124300 5582643000 45700 46460 26000 25500 25376 69000 71200 7183628000 30200 35357 31000 28400 24033 59000 58600 5939024000 25500 26833 3000 3000 3822 27000 28500 3065545000 46200 43990 105000 104100 1742 150000 150300 4573248000 51600 52060 42000 47600 27435 90000 99200 7949525000 35600 31930 36000 45700 58734 61000 81300 9066420000 11000 13649 4000 11400 11488 24000 22400 2513731000 31800 35049 15000 13800 11024 46000 45600 4607340000 44900 48758 108000 50700 66917 148000 95600 11567544000 53200 59786 21000 14900 14611 65000 68100 7439753000 54400 60273 106000 101700 96779 159000 158100 15705233000 34000 31844 58000 54500 51813 91000 88500 8365741000 33000 19124 31000 33300 24282 72000 66300 43406
Incl. in Hoshangabad 14240 Incl. in Hoshangabad 8813 Incl. in Hoshangabad 2305325000 28600 32804 3000 2800 4575 28000 31400 3737953000 58200 31241 73000 81600 38836 126000 139800 70077
Incl. in Jabalpur 33786 Incl. in Jabalpur 34828 Incl. in Jabalpur 6861437000 43400 54191 105000 88900 57762 142000 132300 11195349000 62400 38562 67000 61100 8332 116000 123500 46894
Incl. in Mandla 29997 Incl. in Mandla 12678 Incl. in Mandla 42675106000 98400 69477 98000 96900 34398 204000 195300 103875
Incl. in Mandsaur 41573 Incl. in Mandsaur 59649 Incl. in Mandsaur 10122265000 64900 39243 210000 203600 94069 275000 268500 133312
Incl. in Morena 27091 Incl. in Morena 112033 Incl. in Morena 13912423000 22700 23884 1000 1000 1028 24000 23700 2491234000 37200 40807 96000 89600 22845 130000 126800 6365235000 37800 38676 3000 3700 3536 38000 41500 4221233000 37500 39901 27000 29900 30621 60000 67400 7052221000 26100 27180 34000 42800 41856 55000 68900 6903652000 59900 58319 42000 36700 41816 94000 96600 10013543000 44100 51860 15000 19700 17237 58000 63800 6909758000 57100 61193 84000 83300 14995 142000 140400 7618833000 35500 38703 5000 4100 6453 38000 39600 4515635000 39800 45944 7000 5700 5170 42000 45500 5111481000 85400 69955 69000 39000 30498 150000 124400 100453
Incl. in Shahdol 28687 Incl. in Shahdol 8779 Incl. in Shahdol 3746640000 42400 49474 55000 51300 33651 95000 93700 8312566000 60300 59568 101000 72300 37103 167000 132600 9667151000 56900 73741 102000 57100 32204 153000 114000 10594532000 32600 39650 41000 54000 46244 73000 86600 8589434000 32100 41498 12000 6400 3118 46000 43500 4461636000 34500 36303 11000 11200 10266 47000 45700 4656949000 50500 35426 53000 59100 16935 102000 109600 52361
Incl. in West Nimar 20318 Incl. in West Nimar 49561 Incl. in West Nimar 698791610000 1691000 1844738 1915000 1815100 1347438 3525000 3513100 3192176
BalaghatBetulBhindBhopalChhatarpurChhindwaraDamohDatiaDewasDharEast Nimar (Khandwa)GunaGwaliorHoshangabadHardaIndoreJabalpurKatniJhabuaMandlaDindoriMandsaurNeemuchMorenaSheopurNarsimhapurPannaRaisenRajgarhRatlamRewaSagarSatnaSehoreSeoniShahdolUmariaShajapurShivpuriSidhiTikamgarhUjjainVidishaWest Nimar(Khargone)BarwaniMadhya Pradesh
Land Not Avallable For Cultivation
Land Put To Non Agricultural Uses Barren and Uncultivable Land Total
1977-78 1988-89 1998-99 1977-78 1988-89 1998-99 1977-78 1988-89 1998-99
District
Source: Commissioner of Land Records, Madhya Pradesh, Gwalior

378
EL 6: LAND USE CLASSIFICATION IN DISTRICTS OF MADHYA PRADESH OVER 30 YEARS
36000 45900 32266 4000 1900 602 40000 47800 3286821000 26300 27327 0 0 4 21000 26300 2733124000 25100 21580 1000 400 610 25000 25500 2219036000 33000 34262 0 100 26 36000 33100 3428890000 95700 66024 0 300 321 90000 96000 6634553000 58100 51428 0 100 31 57000 58200 5145965000 44200 35780 1000 400 150 66000 44600 35930
6000 6200 7921 2000 100 126 8000 6300 804788000 83500 70646 0 0 23 88000 83500 7066960000 55400 53111 0 0 38 60000 55400 5314974000 66800 69785 1000 400 205 75000 67200 6999078000 59000 55482 0 0 22 78000 59000 5550428000 21800 16613 0 100 69 28000 21900 1668260000 56600 30705 1000 2200 3380 61000 58800 34085
Included in Hoshangabad 20849 Included in Hoshangabad 695 Included in Hoshangabad 2154435000 29500 31796 0 100 75 35000 29600 3187199000 102300 42438 9000 1600 144 108000 103900 42582
Included in Jabalpur 45224 Included in Jabalpur 652 Included in Jabalpur 4587650000 42500 33536 0 0 4 50000 42500 3354045000 41500 18090 0 100 45 45000 41600 18135
Included in Mandla 15123 Included in Mandla 18 Included in Mandla 1514154000 53200 36810 0 100 73 54000 53300 36883
Included in Mandsaur 18116 Included in Mandsaur 3 Included in Mandsaur 1811964000 68100 28724 0 0 0 64000 68100 28724
Included in Morena 40195 Included in Morena 0 Included in Morena 4019539000 29500 26272 0 200 160 39000 29700 2643213000 10200 11817 0 0 35 13000 10200 1185227000 27900 28960 0 100 105 27000 28000 2906591000 89100 83470 0 100 41 91000 89200 8351142000 32600 30859 0 300 117 42000 32900 3097642000 40000 35743 1000 1500 1616 43000 41500 37359
102000 122700 93501 3000 600 1420 105000 123300 9492125000 21500 20022 9000 4700 3410 34000 26200 2343266000 62400 46979 0 0 10 66000 62400 4698938000 34000 29602 1000 0 32 39000 3400 2963444000 39400 17222 1000 1500 837 45000 40900 18059
Included in Shahdol 17557 Included in Shahdol 285 Included in Shahdol 1784270000 58700 63497 0 100 56 70000 58800 6355368000 60200 45839 32000 41100 1396 100000 101300 47235
0 0 0 0 0 1 0 0 171000 55300 40956 0 400 18 71000 55700 4097474000 76800 68125 0 100 109 74000 76900 6823443000 39500 31884 0 0 80 43000 39500 31964
106000 96600 74138 0 100 68 106000 96700 74206Included in West Nimar 28210 Included in West Nimar 0 Included in West Nimar 28210
2027000 1911100 1698484 66000 58700 17112 2097000 1939200 1715596
BalaghatBetulBhindBhopalChhatarpurChhindwaraDamohDatiaDewasDharEast Nimar (Khandwa)GunaGwaliorHoshangabadHardaIndoreJabalpurKatniJhabuaMandlaDindoriMandsaurNeemuchMorenaSheopurNarsimhapurPannaRaisenRajgarhRatlamRewaSagarSatnaSehoreSeoniShahdolUmariaShajapurShivpuriSidhiTikamgarhUjjainVidishaWest Nimar(Khargone)BarwaniMadhya Pradesh
Other Uncultivated Land Excluding Fallow Lands
Permanent Pasture & Land Under Miscellaneous TotalOther Grazing Land Trees Crops & Groves
1977-78 1988-89 1998-99 1977-78 1988-89 1998-99 1977-78 1988-89 1998-99
District
Source: Commissioner of Land Records, Madhya Pradesh, Gwalior

379
EL 6: LAND USE CLASSIFICATION IN DISTRICTS OF MADHYA PRADESH OVER 30 YEARS
12000 8300 10079 9000 7000 7800 8000 8700 1014931000 31200 22369 7000 8000 13498 5000 6000 13774
5000 7300 5344 2000 1500 1397 3000 600 30178000 2700 1099 4000 2700 1106 4000 3900 3539
26000 35200 28589 45000 34900 27146 41000 33400 2487522000 11700 10201 10000 5600 5604 4000 4200 356521000 19700 9926 10000 8000 3591 5000 5400 431213000 11400 7371 1000 0 0 3000 2100 4418
5000 3200 2222 2000 200 546 2000 300 2549000 6400 7385 9000 7400 5844 11000 8800 60144000 1000 213 0 800 229 1000 500 156
52000 77500 64409 28000 11900 14053 40000 4600 823616000 13700 11790 7000 6300 5892 7000 5800 486423000 19300 14652 10000 7800 8664 8000 7000 6354
Included in Hoshangabad 4234 Included in Hoshangabad 2038 Included in Hoshangabad 11945000 5000 0 1000 300 0 3000 200 0
29000 29600 8657 19000 22700 6399 16000 19700 6945Included in Jabalpur 11831 Included in Jabalpur 11304 Included in Jabalpur 10275
6000 3800 2166 0 4600 25506 6000 7800 028000 28100 5832 8000 7200 5009 4000 4800 4975
Included in Mandla 8074 Included in Mandla 3272 Included in Mandla 215723000 4900 3351 17000 14100 6490 22000 25000 11377
Included in Mandsaur 582 Included in Mandsaur 5096 Included in Mandsaur 1112241000 27600 9700 20000 18100 4067 37000 24700 3798
Included in Morena 21412 Included in Morena 8892 Included in Morena 127509000 800 5894 8000 7100 5633 6000 7100 5726
32000 37500 44514 17000 18800 9320 23000 15600 614217000 9500 5001 10000 5500 3742 11000 6100 509929000 19100 17095 1000 6700 5505 12000 600 113810000 11700 9851 10000 12200 4989 27000 6600 9185
6000 6900 6188 2000 2200 1342 4000 1800 147922000 3700 12731 7000 200 1887 9000 100 178326000 25600 24089 13000 11500 11055 12000 11000 1121314000 2800 11808 4000 1300 0 5000 2500 017000 15100 12575 9000 10600 10919 7000 7600 9980
6000 27900 22696 2000 18400 13945 2000 20000 23054Included in Shahdol 4596 Included in Shahdol 3952 Included in Shahdol 3060
16000 10800 5814 7000 9100 6154 10000 8200 703638000 45100 50664 38000 33300 20566 77000 47600 1825018000 22200 30096 12000 16200 14639 18000 20400 1545310000 4800 4163 15000 6200 5131 21000 9700 1015213000 8200 5250 3000 4300 3729 4000 2600 152017000 8000 5064 5000 4400 2415 3000 2800 278014000 11200 7230 8000 3000 4127 13000 17200 14301
Included in West Nimar 2442 Included in West Nimar 1832 Included in West Nimar 6304693000 618500 559249 380000 340100 304325 494000 361000 311775
BalaghatBetulBhindBhopalChhatarpurChhindwaraDamohDatiaDewasDharEast Nimar (Khandwa)GunaGwaliorHoshangabadHardaIndoreJabalpurKatniJhabuaMandlaDindoriMandsaurNeemuchMorenaSheopurNarsimhapurPannaRaisenRajgarhRatlamRewaSagarSatnaSehoreSeoniShahdolUmariaShajapurShivpuriSidhiTikamgarhUjjainVidishaWest Nimar(Khargone)BarwaniMadhya Pradesh
Cultivable Waste Land
Land That Can be Brought Under Land That Can be brought UnderCultivation Immediately Cultivation After Some Un-Economical Patches Of Land
1977-78 1988-89 1998-99 1977-78 1988-89 1998-99 1977-78 1988-89 1998-99
District
Source: Commissioner of Land Records, Madhya Pradesh, Gwalior

380
EL 6: LAND USE CLASSIFICATION IN DISTRICTS OF MADHYA PRADESH OVER 30 YEARS
29000 24000 28028 13000 16200 13903 16000 12400 1552643000 45200 49641 25000 33200 25332 33000 28200 3098410000 9400 9758 4000 5100 3559 3000 2700 407516000 9300 5744 1000 2800 1547 2000 1400 2849112000 103500 80610 33000 48600 32233 53000 30700 4035436000 21500 19370 34000 32300 31583 37000 35600 2820136000 33100 17829 8000 12300 6522 14000 10400 834017000 13500 11789 3000 3500 3594 5000 3500 40069000 3700 3022 2000 2000 529 5000 2200 1297
29000 22600 19243 8000 5600 3129 9000 4100 33466000 2300 598 8000 11300 8185 13000 7700 15005
120000 94000 86698 10000 9600 5532 12000 9400 756830000 25800 22546 7000 7700 3338 6000 6000 407541000 34100 29670 10000 15700 4953 19000 9200 9722
Included in Hoshangabad 7466 Included in Hoshangabad 1045 Included in Hoshangabad 29919000 5500 0 1000 2700 1340 2000 1400 3197
64000 72000 22001 34000 49200 16448 49000 54000 16291Included in Jabalpur 33410 Included in Jabalpur 20339 Included in Jabalpur 23576
12000 16200 27672 13000 7100 5175 9000 6000 462440000 40100 15816 62000 67800 25499 75000 71700 24902
Included in Mandla 13503 Included in Mandla 35586 Included in Mandla 3192562000 44000 21218 5000 2600 1196 4000 3000 1189
Included in Mandsaur 16800 Included in Mandsaur 549 Included in Mandsaur 56898000 70400 17565 12000 9700 2309 15000 6100 3264
Included in Morena 43054 Included in Morena 4380 Included in Morena 522323000 22200 17253 7000 8700 4709 10000 5100 640372000 71900 59976 12000 19200 12049 23000 17200 1277338000 21100 13842 3000 3800 1204 5000 2100 276942000 26400 23738 4000 4800 1584 9000 3000 338847000 30500 24025 4000 3300 1222 5000 2300 165512000 10900 9009 20000 28500 20307 25000 27200 2310538000 4000 16401 9000 15100 7418 15000 13200 1413051000 48100 46357 17000 18700 15450 21000 22400 1526623000 6600 11808 2000 8800 1059 3000 1200 278333000 33300 33474 24000 30200 33081 39000 37400 2860310000 66300 59695 61000 71500 47928 62000 80100 45242
Included in Shahdol 11608 Included in Shahdol 18245 Included in Shahdol 1701933000 28100 19004 3000 3000 1018 6000 1500 2075
153000 126000 89480 24000 26200 20789 33000 14900 1936548000 58800 60188 36000 32100 33039 30000 39600 2500746000 20700 19446 13000 19200 14354 17000 20700 1321120000 15100 10499 4000 3300 995 5000 2500 220225000 15200 10259 3000 3200 2106 5000 4200 283535000 31400 25658 6000 7200 2493 12000 3900 7643
Included in West Nimar 10578 Included in West Nimar 1759 Included in West Nimar 29321568000 1326800 1175349 545000 651800 498614 706000 604200 541504
BalaghatBetulBhindBhopalChhatarpurChhindwaraDamohDatiaDewasDharEast Nimar (Khandwa)GunaGwaliorHoshangabadHardaIndoreJabalpurKatniJhabuaMandlaDindoriMandsaurNeemuchMorenaSheopurNarsimhapurPannaRaisenRajgarhRatlamRewaSagarSatnaSehoreSeoniShahdolUmariaShajapurShivpuriSidhiTikamgarhUjjainVidishaWest Nimar(Khargone)BarwaniMadhya Pradesh
Cultivable Waste Land Fallow Land
Total Current Old
1977-78 1988-89 1998-99 1977-78 1988-89 1998-99 1977-78 1988-89 1998-99
District
Source: Commissioner of Land Records, Madhya Pradesh, Gwalior

381
EL 6: LAND USE CLASSIFICATION IN DISTRICTS OF MADHYA PRADESH OVER 30 YEARS
29000 28600 2942958000 61400 56316
7000 7800 76343000 4200 4396
86000 79300 7258771000 67900 5978422000 22700 14862
8000 7000 76007000 4200 1826
17000 9700 647521000 19000 2319022000 19000 1310013000 13700 741329000 24900 14675
Included in Hoshangabad 40363000 4100 4537
83000 103200 32739Included in Jabalpur 43915
22000 13100 9799137000 139500 50401
Included in Mandla 675119000 5600 2385
Included in Mandsaur 111727000 15800 5573
Included in Morena 960317000 13800 1111235000 36400 24822
8000 5900 397313000 7800 4972
9000 5600 287745000 55700 4341224000 28300 2154838000 41100 30716
5000 10000 384263000 67600 61684
123000 151600 93170Included in Shahdol 35264
9000 4500 309357000 41100 4015466000 71700 5804630000 39900 27565
9000 5800 31978000 7400 4941
18000 11100 10136Included in West Nimar 4691
1251000 1256000 1040118
BalaghatBetulBhindBhopalChhatarpurChhindwaraDamohDatiaDewasDharEast Nimar (Khandwa)GunaGwaliorHoshangabadHardaIndoreJabalpurKatniJhabuaMandlaDindoriMandsaurNeemuchMorenaSheopurNarsimhapurPannaRaisenRajgarhRatlamRewaSagarSatnaSehoreSeoniShahdolUmariaShajapurShivpuriSidhiTikamgarhUjjainVidishaWest Nimar(Khargone)BarwaniMadhya Pradesh
Follow LandTotal
1977-78 1988-89 1998-99
District
Source: Commissioner of Land Records, Madhya Pradesh, Gwalior

382
Table EL 7 lays special focus on the wastelands classifying them into
various sub-categories according to the National Remote Sensing Agency
(NRSA) imagery 2000. The table gives comprehensive and reliable data on
different categories of wastelands providing credible information for
decision making.
EL 7: WASTELANDS IN MADHYA PRADESH, 2000- NRSA IMAGERY
WASTELANDS
It is described as degraded land which can be brought undervegetative cover with reasonable effort, and which is currentlyunder utilised and land which is deteriorating due to lack ofappropriate water and soil management or on account of nat-ural causes. Wastelands can result from inherent/ imposedconstraints such as, by location, environment, chemical andphysical properties of the soil or financial or managementconstraints.
GULLIED/ RAVINOUS LAND
The gullies are formed as a result of localized surface runoffaffecting the friable unconsolidated material in the formationof perceptible channels resulting in undulating terrain. Thegullies are the first stage of excessive land dissection followedby the networking, which leads to the development of ravi-nous land. The word 'ravine' is usually associated not with anisolated gully but a network of deep gullies formed generallyin thick alluvium and entering a nearby river, flowing muchlower than the surrounding high grounds. The ravines, areextensive systems of gullies developed along river courses.
LAND WITH OR WITHOUT SCRUB
They occupy (relatively) higher topography like uplands orhigh grounds with or without scrub. These lands are general-ly prone to degradation or erosion. These exclude hilly andmountainous terrain.
WATERLOGGED/ MARSHY AREA
Waterlogged land is that land where the water is at or near thesurface and water stands for most of the year. Such lands usu-ally occupy topographically low-lying areas. It excludes lakes,ponds and tanks. Marshy land is that which is permanently orperiodically inundated by water and is characterised by
vegetation, which includes grasses and weeds. Marshes areclassified into salt/ brackish or fresh water depending on thesalinity of water. These exclude Mangroves.
SALINE/ ALKALINE AREA
The salt affected land is generally characterised as the land thathas adverse effect on the growth of most plants due to theaction or presence of excess soluble or high exchangeable sodium. Alkaline land has an exchangeable sodium percentage(ESP) of about 15, which is generally considered as the limitbetween normal and alkali soils. The predominant salts are carbonates and bicarbonates of Sodium. Coastal saline soilsmay be with or without ingress or inundation by sea water.
SHIFTING CULTIVATION
It is the result of cyclic land use practice of felling of trees andburning of forest areas for growing crops. Such lands are alsoknown as Jhum lands. This results in extensive loss of soilleading to land degradation.
DEGRADED NOTIFIED FOREST LAND
It is described as a forest where the vegetative (crown) densityis less than 20 percent of the canopy cover. It is the result ofboth biotic and abiotic influences.
DEGRADED PASTURES/ GRAZING LAND
Pastureland is an area of land covered with natural grass alongwith other vegetation, often grown for fodder to feed cattleand other animals. Such lands are found in riverbeds, onuplands, hill slopes etc. Such lands can also be called as per-manent pastures or meadows. Grazing lands are those wherecertain pockets of land are fenced for allowing cattle to graze.Overgrazing of these lands due to pressure of livestock andruminants lead to their degradation.

383
SANDY AREA (INLAND AND COASTAL)These are areas, which have stabilized accumulations of sandin-situ or transported in coastal riverine or inland (desert)areas. These occur either in the form of sand dunes, beaches,channel (river/stream) islands etc.
MINING/INDUSTRIAL WASTE
It is an area associated with Mining or Industry with excavated material or waste dumps or storage dumps ofearthen material or industrial material. Such waste dumps aresome times covered with or without vegetation.
BARREN ROCKY/ STONY WASTE/ SHEET ROCK AREA
It is defined as the rock exposures of varying lithology oftenbarren and devoid of soil cover and vegetation and not suitable for cultivation. They occur amidst hill forests as openings or scattered as isolated exposures or loose fragmentsof boulders or as sheet rocks on plateau and plains. It includesquarry or gravel pit or brick kilns.
SNOW COVERED/ GLACIAL AREA
It is defined as a solid form of water consisting of minute particles of ice. It includes permanently snow covered areas. Source: Wasteland Atlas of India 2000.
Year Madhya IndiaPradesh
Wastelands as percentage of geographical area 2000 19.31 20.17
Share of India 9.32%
As percentage of total wastelands
Gullied/ Ravinous land 2000 12.33 3.22
Land with/ without scrub 2000 52.29 30.39
Waterlogged/ marshy land 2000 0.08 2.59
Saline/ Alkaline area 2000 0.27 3.21
Shifting cultivation area 2000 0.00 5.50
Degraded notified forest land 2000 29.72 22.03
Degraded Pastures/ Grazing Land 2000 0.45 4.07
Degraded land under plantation crop 2000 1.15 0.91
Sands Inland/ Coastal 2000 0.00 7.83
Mining/ Industrial Wasteland 2000 0.16 0.20
Barren/ Rocky area 2000 3.29 10.11
Steep/ Sloping area 2000 0.25 1.20
Snow/ Glacial area 2000 0.00 8.74

384
EL 7: WASTELANDS IN MADHYA PRADESH, 2000- NRSA IMAGERY
9229.00 0.00% 4.72% 0.00% 0.00% 0.00% 1.67%10043.00 0.01% 7.08% 0.00% 0.00% 0.00% 3.66%
4459.00 25.42% 0.34% 0.70% 2.53% 0.00% 0.11%2772.00 0.12% 18.94% 0.45% 0.00% 0.00% 4.68%8687.00 1.87% 11.99% 0.00% 0.00% 0.00% 3.12%
11815.00 0.12% 7.08% 0.00% 0.00% 0.00% 8.19%7306.00 0.43% 17.30% 0.00% 0.00% 0.00% 7.78%2038.00 12.37% 9.99% 0.10% 1.99% 0.00% 4.67%7020.00 2.89% 8.73% 0.00% 0.00% 0.00% 3.01%8153.00 1.50% 12.62% 0.00% 0.00% 0.00% 7.64%
10779.00 0.28% 6.53% 0.00% 0.00% 0.00% 8.85%11065.00 6.36% 11.66% 0.00% 0.00% 0.00% 14.55%5214.00 6.00% 8.30% 0.00% 0.01% 0.00% 11.66%
10037.00 0.15% 6.53% 0.00% 0.00% 0.00% 2.40%Included in Hoshangabad
3898.00 5.20% 6.02% 0.00% 0.00% 0.00% 3.21%10160.00 1.22% 13.05% 0.00% 0.00% 0.00% 2.90%
Included in Jabalpur6782.00 0.00% 8.49% 0.00% 0.00% 0.00% 10.91%
13269.00 0.07% 14.96% 0.01% 0.00% 0.00% 1.56%Included in Mandla
9791.00 3.49% 12.29% 0.00% 0.05% 0.00% 10.61%Included in Mandsaur
11594.00 8.86% 6.10% 0.00% 0.00% 0.00% 7.12%Included in Morena
5133.00 4.96% 6.95% 0.00% 0.00% 0.00% 4.12%7135.00 0.39% 11.87% 0.00% 0.00% 0.00% 5.32%8466.00 1.31% 1.66% 0.00% 0.00% 0.00% 3.66%6154.00 5.17% 21.15% 0.00% 0.00% 0.00% 2.11%4861.00 4.89% 20.26% 0.00% 0.02% 0.00% 5.98%6314.00 1.24% 7.11% 0.00% 0.00% 0.00% 1.26%
10252.00 0.21% 13.91% 0.00% 0.00% 0.00% 6.08%7502.00 0.54% 9.49% 0.00% 0.00% 0.00% 13.19%6578.00 0.00% 13.28% 0.00% 0.00% 0.00% 10.40%8758.00 0.00% 8.35% 0.00% 0.00% 0.00% 9.93%
14028.00 0.28% 5.21% 0.00% 0.00% 0.00% 1.52%Included in Shahdol
6196.00 10.79% 22.72% 0.00% 0.00% 0.00% 0.71%10278.00 0.15% 13.69% 0.02% 0.00% 0.00% 5.89%10526.00 0.52% 5.23% 0.00% 0.03% 0.00% 6.54%
5048.00 0.60% 26.93% 0.00% 0.00% 0.00% 7.08%6091.00 9.04% 8.74% 0.00% 0.00% 0.00% 0.08%7371.00 2.63% 7.12% 0.00% 0.00% 0.00% 2.93%
13450.00 0.04% 7.45% 0.00% 0.00% 0.00% 7.12%Included in West Nimar
308252.00 2.38% 10.10% 0.02% 0.05% 0.00% 5.74%
BalaghatBetulBhindBhopalChattarpurChhindwaraDamohDatiaDewasDharEast Nimar (Khandwa)GunaGwaliorHoshangabadHardaIndoreJabalpurKatniJhabuaMandlaDindoriMandsaurNeemuchMorenaSheopurNarsinghpurPannaRaisenRajgarhRatlamRewaSagarSatnaSehoreSeoniShahdolUmariaShajapurShivpuriSidhiTikamgarhUjjainVidishaWest Nimar (Khargone)BarwaniMadhya Pradesh
As Percentage of Total Geographical Area
Total Gullied/ Land with Waterlogged/ Saline/Alkaline Shifting DegradedGeographical Ravinous /without Marshy Land Area Cultivation Notifled
Area Land scrub Area Forest Land
District
Source: Wasteland Atlas of India, 2000, Ministry of Rural Development, Department of Land Resources, Gol National Remote Sensing Agency, Department of Space,
Gol

385
EL 7: WASTELANDS IN MADHYA PRADESH, 2000- NRSA IMAGERY
0.00% 0.00% 0.00% 0.10% 0.05% 0.00% 0.00% 603.77 6.54%1.38% 0.00% 0.00% 0.00% 0.00% 0.00% 0.00% 1218.24 12.13%0.00% 0.01% 0.00% 0.00% 0.10% 0.00% 0.00% 1302.58 29.21%0.11% 0.00% 0.00% 0.06% 0.30% 0.00% 0.00% 683.78 24.67%0.00% 0.11% 0.00% 0.00% 0.63% 0.22% 0.00% 1558.20 17.94%0.00% 0.00% 0.00% 0.03% 0.04% 0.00% 0.00% 1826.33 15.46%0.00% 0.00% 0.00% 0.06% 0.00% 0.00% 0.00% 1867.30 25.56%0.13% 0.00% 0.00% 0.00% 1.35% 0.00% 0.00% 623.62 30.60%0.05% 0.61% 0.00% 0.00% 0.13% 0.00% 0.00% 1081.93 15.41%0.12% 0.00% 0.00% 0.21% 1.18% 0.01% 0.00% 1899.57 23.30%0.00% 0.00% 0.00% 0.00% 0.09% 0.00% 0.00% 1697.69 15.75%0.00% 1.52% 0.00% 0.03% 0.77% 0.00% 0.00% 3860.26 34.89%0.00% 0.00% 0.00% 0.00% 0.72% 0.00% 0.00% 1391.54 26.69%0.00% 0.00% 0.00% 0.00% 0.51% 0.01% 0.00% 962.97 9.59%
Included in Hoshangabad
0.04% 0.30% 0.00% 0.02% 0.46% 0.03% 0.00% 596.23 15.30%0.19% 0.00% 0.00% 0.01% 0.05% 0.02% 0.00% 1771.00 17.43%
Included in Jabalpur
0.22% 0.00% 0.00% 0.01% 0.84% 0.00% 0.00% 1388.76 20.48%0.00% 0.00% 0.00% 0.00% 0.38% 0.00% 0.00% 2255.25 17.00%
Included in Mandla
0.18% 0.32% 0.01% 0.05% 1.69% 0.11% 0.00% 2818.60 28.79%Included in Mandsaur
0.00% 0.00% 0.00% 0.00% 0.59% 0.05% 0.00% 2634.53 22.72%Included in Morena
0.00% 2.55% 0.00% 0.00% 0.50% 0.00% 0.00% 979.22 19.08%0.00% 0.00% 0.00% 0.00% 0.01% 0.32% 0.00% 1278.21 17.91%0.00% 0.84% 0.00% 0.00% 2.30% 0.08% 0.00% 834.55 9.86%0.00% 0.02% 0.00% 0.00% 1.10% 0.02% 0.00% 1819.51 29.57%0.00% 0.45% 0.03% 0.00% 0.87% 0.00% 0.00% 1579.92 32.50%0.55% 0.00% 0.00% 0.00% 2.07% 0.45% 0.00% 800.50 12.68%0.00% 0.00% 0.00% 0.00% 0.25% 0.00% 0.00% 2096.28 20.45%0.00% 0.00% 0.00% 0.51% 1.57% 0.24% 0.00% 1915.52 25.53%0.24% 0.00% 0.00% 0.00% 0.04% 0.06% 0.00% 1579.83 24.02%0.00% 0.02% 0.00% 0.00% 0.15% 0.00% 0.00% 1615.67 18.45%0.00% 0.00% 0.00% 0.00% 0.20% 0.00% 0.00% 1012.86 7.22%
Included in Shahdol
0.04% 0.00% 0.00% 0.00% 0.79% 0.00% 0.00% 2171.79 35.05%0.00% 0.00% 0.00% 0.00% 0.86% 0.03% 0.00% 2121.47 20.64%0.00% 0.00% 0.00% 0.07% 0.47% 0.15% 0.00% 1368.85 13.00%0.02% 0.33% 0.00% 0.00% 6.65% 0.02% 0.00% 2102.03 41.64%0.09% 0.01% 0.00% 0.00% 0.09% 0.00% 0.00% 1099.57 18.05%0.00% 2.39% 0.00% 0.00% 0.29% 0.00% 0.00% 1132.61 15.37%0.00% 0.00% 0.00% 0.00% 0.03% 0.05% 0.00% 1976.46 14.69%
Included in West Nimar
0.09% 0.22% 0.00% 0.03% 0.64% 0.05% 0.00% 59527.00 19.31%
BalaghatBetulBhindBhopalChattarpurChhindwaraDamohDatiaDewasDharEast Nimar (Khandwa)GunaGwaliorHoshangabadHardaIndoreJabalpurKatniJhabuaMandlaDindoriMandsaurNeemuchMorenaSheopurNarsinghpurPannaRaisenRajgarhRatlamRewaSagarSatnaSehoreSeoniShahdolUmariaShajapurShivpuriSidhiTikamgarhUjjainVidishaWest Nimar (Khargone)BarwaniMadhya Pradesh
As Percentage of Total Geographical Area
Degraded Degraded Sandslnland/ Mining/ Barren Steep Snow/ Total WastelandPastures/ Land under Coastal Industrial Rocky Sloping Glacial AreaGrazing Plantation Wasteland Area Area Area Area Area (ha) % of total
Land Crop area
District
Source: Wasteland Atlas of India, 2000, Ministry of Rural Development, Department of Land Resources, Gol National Remote Sensing Agency, Department of Space, Gol

386
Table EL 8 provides information on the ownership of land by social
categories. The gini-coefficient of ownership of operational holdings for
1990-1991 and 1995-96 are critical indicator of the level of inequality in
the districts, primarily in rural areas. The information on the tenancy
status of operational holdings is from the agriculture and land settlement
statistics. The table also gives the share of land held by the scheduled
castes and the scheduled tribes. The table also shows trends in average
landholding size since 1981 in 5 yearly intervals, thus giving a comparative
picture. It also gives percentage decline in the holdings across a 15 year
period from 1980-81 to 1995-96.
GINI CO-EFFICIENT OF LAND OWNING
Gini coefficient of land owning is a measure that shows how close the size distribution of land
holdings is to absolute equality or inequality. Named for Corrado Gini, the Gini coefficient is a ratio of
the area between the 45º line and the Lorenz curve and the area of the entire triangle. As the coefficient
approaches zero, the size distribution of land holdings approaches absolute equality. Conversely, as the
coefficient approaches one, the size distribution of landholdings approaches inequality.
EL 8: LAND OWNERSHIP BY SOCIAL CATEGORIES, AVERAGE LANDHOLDING SIZE, GINICOEFFICIENT OF OPERATIONAL HOLDINGS- 1990, 1995 AND TENANCY STATUS, 1990

387
EL 8: LAND OWNERSHIP BY SOCIAL CATEGORIES, AVERAGE LANDHOLDING SIZE, GINICOEFFICIENT OF OPERATIONAL HOLDINGS- 1990, 1995 AND TENANCY STATUS, 1990
231953 313230 73.5% 73.6% 68.2% 69.3%175986 509283 53.8% 54.3% 54.2% 54.8%156828 342728 83.2% 84.2% 88.5% 88.5%
48942 161745 81.5% 83.5% 88.2% 88.9%209585 476483 75.6% 76.0% 82.7% 82.1%234035 545748 53.0% 53.2% 49.5% 50.9%141701 327363 73.1% 74.6% 81.3% 83.2%
55652 138962 75.4% 76.2% 82.8% 84.3%115023 426196 71.2% 73.5% 83.3% 83.4%170419 523635 39.2% 39.6% 53.3% 52.8%152622 487290 66.7% 67.4% 69.7% 69.5%228753 638329 70.1% 71.4% 79.9% 80.5%114475 279794 76.5% 77.4% 82.7% 83.7%136736 511587 77.2% 77.4% 84.7% 84.6%
Included with Hoshangabad92421 273580 82.0% 84.3% 91.3% 91.0%
344869 572309 70.9% 69.5% 72.1% 71.0%Included with Jabalpur
168837 375959 6.5% 5.6% 6.8% 6.5%239521 564052 31.3% 30.6% 23.5% 23.2%
Included with Mandla228857 556864 78.0% 81.1% 85.2% 87.5%
Included with Mandsaur246339 435725 78.1% 79.1% 82.1% 82.7%
Included with Morena124752 313751 80.4% 79.5% 81.8% 83.6%141395 286987 71.5% 71.7% 79.4% 78.6%123146 439595 76.9% 77.5% 84.6% 83.1%190880 463093 81.4% 81.3% 89.0% 87.5%130461 348338 54.0% 56.0% 67.6% 68.1%210688 436870 89.8% 89.9% 95.7% 95.6%224035 559511 75.2% 76.1% 85.0% 84.4%220963 396860 78.2% 78.4% 85.9% 85.4%118520 409690 75.5% 76.8% 83.8% 84.4%166024 439870 51.3% 51.3% 51.2% 50.1%281827 593108 43.6% 44.0% 43.7% 43.6%
Included with Shahdol152825 481406 77.0% 78.2% 88.2% 88.6%181365 476288 71.3% 72.8% 79.0% 79.4%211877 428318 59.5% 61.2% 67.3% 66.7%168604 285407 76.7% 76.7% 79.9% 79.5%144424 523310 72.2% 74.5% 84.6% 85.4%122593 539562 78.2% 79.9% 89.4% 89.8%228270 695179 51.5% 50.6% 56.1% 54.7%
Included with West Nimar6636203 16578005 67.1% 72.3%
BalaghatBetulBhindBhopalChhatarpurChhindwaraDamohDatiaDewasDharEast NimarGunaGwaliorHoshangabadHardaIndoreJabalpur KatniJhabuaMandla DindoriMandsaur NeemuchMorena SheopurNarsimhapurPannaRaisenRajgarhRatlamRewaSagarSatnaSehoreSeoniShahdol UmariaShajapurShivpuriSidhiTikamgarhUjjainVidishaWest NimarBarwaniMadhya Pradesh
total Operational Area under Opera- Share of Others
Land Holdings tional Landholdings
(Hectare) Owners Owners Land Land
1995 19995 1990 1995 1990 1995
District
Source: Commissioner of Land Records, Madhya Pradesh, Gwalior

388
EL 8: LAND OWNERSHIP BY SOCIAL CATEGORIES, AVERAGE LANDHOLDING SIZE, GINICOEFFICIENT OF OPERATIONAL HOLDINGS- 1990, 1995 AND TENANCY STATUS, 1990
6.9% 6.8% 4.1% 4.2% 8.4% 19.6%9.4% 9.3% 6.9% 7.2% 9.4% 36.9%
16.8% 15.8% 11.5% 11.5% 18.4% 0.0%16.7% 14.3% 10.7% 9.8% 14.2% 1.8%20.7% 20.6% 14.3% 15.1% 20.4% 3.7%
9.8% 10.0% 7.8% 8.2% 10.8% 37.1%15.0% 13.8% 9.0% 7.7% 16.3% 11.8%23.8% 23.1% 16.8% 15.4% 17.1% 0.8%16.1% 14.9% 7.4% 7.3% 16.0% 12.7%
5.0% 3.8% 2.7% 2.2% 7.4% 55.9%9.0% 8.2% 6.5% 6.3% 11.4% 24.3%
17.5% 17.6% 12.0% 12.0% 16.2% 12.4%19.9% 19.3% 15.0% 14.0% 17.9% 3.6%
9.9% 9.7% 5.7% 5.7% 14.5% 12.9%Included with Hoshangabad
11.8% 10.6% 5.4% 6.0% 15.4% 6.2%9.0% 12.7% 6.1% 11.8% 11.8% 20.2%
Included with Jabalpur1.9% 1.5% 1.2% 1.0% 4.5% 91.7%5.4% 5.8% 3.7% 4.1% 6.0% 63.3%
Included with Mandla14.6% 14.1% 9.5% 9.3% 15.3% 7.4%
Included with Mandsaur16.0% 15.3% 12.1% 11.6% 17.5% 5.8%
Included with Morena9.6% 10.0% 6.1% 6.5% 14.1% 10.0%
16.9% 17.1% 11.4% 12.1% 16.3% 11.6%11.6% 11.9% 6.8% 7.7% 14.6% 11.4%15.2% 15.1% 8.5% 9.6% 15.6% 3.4%14.0% 13.2% 8.6% 8.4% 12.9% 32.0%
5.5% 5.7% 1.8% 1.9% 13.9% 4.6%16.8% 16.1% 9.5% 9.9% 18.4% 8.0%10.9% 11.3% 6.5% 7.1% 15.9% 10.9%17.2% 16.1% 10.6% 9.8% 17.2% 7.3%10.4% 9.6% 9.4% 8.9% 10.3% 38.3%
5.5% 5.5% 3.2% 3.5% 7.6% 50.9%Included with Shahdol
20.3% 19.4% 10.2% 10.0% 19.7% 2.7%18.2% 17.8% 13.8% 13.7% 16.7% 10.5%
8.5% 8.6% 4.2% 4.3% 11.0% 32.0%19.9% 19.9% 17.0% 17.3% 18.6% 3.4%24.7% 22.7% 13.4% 12.7% 23.5% 3.1%17.8% 16.7% 8.9% 8.5% 17.4% 4.0%
5.3% 5.0% 3.3% 3.3% 9.6% 43.3%Included with West Nimar
12.3% 8.3% 14.5%
BalaghatBetulBhindBhopalChhatarpurChhindwaraDamohDatiaDewasDharEast NimarGunaGwaliorHoshangabadHardaIndoreJabalpur KatniJhabuaMandla DindoriMandsaur NeemuchMorena SheopurNarsimhapurPannaRaisenRajgarhRatlamRewaSagarSatnaSehoreSeoniShahdol UmariaShajapurShivpuriSidhiTikamgarhUjjainVidishaWest NimarBarwaniMadhya Pradesh
Share of SC
Owners Owners Land Land SC Population share Owners
1990 1995 1990 1995 1991 1990
District
Source: Commissioner of Land Records, Madhya Pradesh, Gwalior

389
EL 8: LAND OWNERSHIP BY SOCIAL CATEGORIES, AVERAGE LANDHOLDING SIZE, GINICOEFFICIENT OF OPERATIONAL HOLDINGS- 1990, 1995 AND TENANCY STATUS, 1990
19.6% 27.7% 26.5% 18.1% 0.720 0.55236.4% 39.0% 38.0% 32.3% 0.544 0.526
0.0% 0.0% 0.0% 0.8% 0.514 0.5202.2% 1.1% 1.3% 3.1% 0.517 0.4983.4% 3.0% 2.9% 3.8% 0.511 0.487
36.8% 42.7% 41.0% 32.3% 0.518 0.49611.6% 9.7% 9.2% 10.4% 0.585 0.5690.7% 0.3% 0.3% 2.1% 0.517 0.505
11.6% 9.3% 9.3% 13.0% 0.535 0.53956.5% 44.0% 45.0% 45.2% 0.507 0.50524.4% 23.8% 24.2% 26.8% 0.484 0.46411.0% 8.2% 7.5% 10.8% 0.540 0.5293.3% 2.3% 2.3% 4.0% 0.542 0.539
12.8% 9.6% 9.7% 16.2% 0.541 0.526Included with Hoshangabad
5.1% 3.3% 2.9% 8.0% 0.537 0.53317.8% 21.8% 17.1% 22.5% 0.567 0.533
Included with Jabalpur92.9% 92.0% 92.5% 66.6% 0.460 0.44463.6% 72.8% 72.7% 49.3% 0.557 0.541
Included with Mandla4.9% 5.3% 3.2% 4.8% 0.501 0.506
Included with Mandsaur5.6% 5.8% 5.7% 5.8% 0.493 0.488
Included with Morena10.5% 12.1% 9.9% 9.9% 0.506 0.50311.3% 9.1% 9.3% 10.8% 0.524 0.52010.7% 8.6% 9.2% 11.5% 0.527 0.510
3.6% 2.5% 2.9% 3.2% 0.536 0.53430.8% 23.8% 23.4% 21.3% 0.512 0.507
4.4% 2.5% 2.5% 11.0% 0.633 0.6147.8% 5.4% 5.7% 9.0% 0.566 0.552
10.3% 7.6% 7.5% 12.6% 0.584 0.5687.1% 5.6% 5.8% 8.2% 0.523 0.516
39.0% 39.4% 41.0% 28.7% 0.562 0.54450.6% 53.1% 52.9% 42.7% 0.590 0.559
Included with Shahdol2.3% 1.6% 1.4% 2.5% 0.542 0.5389.4% 7.3% 6.9% 9.7% 0.487 0.499
30.2% 28.6% 29.0% 25.0% 0.611 0.5843.5% 3.1% 3.2% 3.8% 0.473 0.4692.8% 2.0% 1.8% 2.5% 0.536 0.5333.4% 1.7% 1.7% 4.2% 0.555 0.554
44.5% 40.6% 41.9% 43.5% 0.471 0.466Included with West Nimar
20.6% 19.4% 19.9%
BalaghatBetulBhindBhopalChhatarpurChhindwaraDamohDatiaDewasDharEast NimarGunaGwaliorHoshangabadHardaIndoreJabalpur KatniJhabuaMandla DindoriMandsaur NeemuchMorena SheopurNarsimhapurPannaRaisenRajgarhRatlamRewaSagarSatnaSehoreSeoniShahdol UmariaShajapurShivpuriSidhiTikamgarhUjjainVidishaWest NimarBarwaniMadhya Pradesh
Share of ST
Owners Owners Land ST Population Ginie Coefficient of Share Land Holdings
1990 1995 1990 1995 1991 1990
District
Source: Commissioner of Land Records, Madhya Pradesh, Gwalior

390
EL 8: LAND OWNERSHIP BY SOCIAL CATEGORIES, AVERAGE LANDHOLDING SIZE, GINICOEFFICIENT OF OPERATIONAL HOLDINGS- 1990, 1995 AND TENANCY STATUS, 1990
1.9 1.6 1.5 1.4 -0.5794.3 3.6 3.4 2.9 -1.4482.9 2.6 2.6 2.2 -0.7545.7 4.5 3.0 3.3 -2.3813.4 2.9 2.6 2.3 -1.0903.8 3.4 3.0 2.3 -1.4643.0 2.6 2.4 2.3 -0.7263.5 3.0 2.8 2.5 -0.9596.0 5.0 4.6 3.7 -2.2935.0 4.1 3.7 3.1 -1.8845.1 4.2 3.8 3.2 -1.9254.5 3.5 3.4 2.8 -1.7033.6 2.9 2.7 2.4 -1.1355.6 4.6 4.0 3.7 -1.846
Included with Hoshangabad5.5 4.3 3.7 3.0 -2.5292.6 2.1 1.9 1.7 -0.908
Included with Jabalpur3.8 3.1 2.6 2.2 -1.5483.7 3.1 2.7 2.4 -1.297
Included with Mandla3.5 3.1 2.8 2.4 -1.082
Included with Mandsaur2.4 2.1 1.9 1.8 -0.627
Included with Morena3.6 2.9 2.7 2.5 -1.0913.3 2.8 2.4 2.0 -1.2385.8 4.9 4.1 3.6 -2.2294.4 3.5 3.2 2.4 -1.9333.9 3.2 3.0 2.7 -1.1813.4 2.8 2.4 2.1 -1.3553.4 3.0 2.9 2.5 -0.8692.6 2.2 2.0 1.8 -0.7596.2 4.8 4.1 3.5 -2.6964.0 3.5 3.0 2.6 -1.3403.0 2.7 2.4 2.1 -0.845
Included with Shahdol4.8 4.2 3.7 3.2 -1.6753.9 3.2 3.0 2.6 -1.2663.0 2.6 2.3 2.0 -0.9322.0 1.9 1.9 1.7 -0.2996.0 4.9 4.3 3.6 -2.3766.7 5.3 5.0 4.4 -2.2685.0 4.2 3.7 3.0 -1.967
Included with West Nimar
BalaghatBetulBhindBhopalChhatarpurChhindwaraDamohDatiaDewasDharEast NimarGunaGwaliorHoshangabadHardaIndoreJabalpur KatniJhabuaMandla DindoriMandsaur NeemuchMorena SheopurNarsimhapurPannaRaisenRajgarhRatlamRewaSagarSatnaSehoreSeoniShahdol UmariaShajapurShivpuriSidhiTikamgarhUjjainVidishaWest NimarBarwaniMadhya Pradesh
Average Size of land Holdings
1980-81 1985-86 1990-91 1995-96 Change
District
Source: Commissioner of Land Records, Madhya Pradesh, Gwalior

391
EL 8: LAND OWNERSHIP BY SOCIAL CATEGORIES, AVERAGE LANDHOLDING SIZE, GINICOEFFICIENT OF OPERATIONAL HOLDINGS- 1990, 1995 AND TENANCY STATUS, 1990
98.2% 98.0% 0.0% 0.0% 0.2% 0.1% 1.5% 1.7% 0.1% 0.1% 1.9%
1.0% 0.4% 71.1% 47.0% 27.9% 33.3% 42.3% 8.6% 13.0% 0.4% 1.5%
89.2% 84.3% 0.0% 0.0% 0.8% 0.2% 10.0% 14.3% 0.0% 1.2% 15.5%
9.0% 7.2% 53.2% 39.7% 37.9% 44.0% 57.6% 12.2% 22.2% 1.0% 5.3%
95.0% 95.1% 0.0% 0.0% 2.3% 1.2% 3.1% 2.6% 0.0% 1.0% 3.6%
96.1% 96.0% 0.4% 0.3% 1.2% 0.5% 2.2% 2.5% 0.4% 0.3% 3.2%
97.9% 97.8% 0.0% 0.0% 0.6% 0.2% 1.5% 1.8% 0.0% 0.1% 2.0%
93.8% 92.2% 0.0% 0.0% 1.2% 0.3% 5.0% 6.5% 0.2% 0.7% 7.5%
92.4% 92.0% 0.3% 0.2% 2.4% 0.6% 5.0% 9.1% 0.5% 0.7% 7.2%
90.8% 90.5% 0.2% 0.2% 2.2% 0.7% 6.9% 6.8% 0.8% 1.1% 8.6%
94.4% 94.8% 0.6% 0.8% 3.1% 1.1% 2.0% 2.3% 0.7% 0.4% 3.4%
82.3% 75.8% 0.1% 0.0% 2.6% 1.1% 15.0% 20.1% 0.1% 2.9% 23.1%
90.9% 88.7% 0.1% 0.1% 1.6% 0.4% 7.5% 9.8% 0.1% 1.1% 11.0%
98.7% 98.4% 0.3% 0.3% 0.4% 0.2% 0.6% 0.7% 0.3% 0.1% 1.1%
Included with Hoshangabad
97.7% 98.2% 0.2% 0.1% 0.0% 0.0% 2.1% 0.7% 1.0% 0.1% 1.7%
99.3% 99.2% 0.1% 0.1% 0.4% 0.3% 0.3% 0.3% 0.0% 0.1% 0.4%
Included with Jabalpur
77.2% 77.1% 0.3% 0.1% 6.3% 2.0% 16.2% 16.1% 0.4% 4.3% 20.8%
90.1% 90.9% 0.0% 0.0% 3.6% 0.6% 6.3% 7.5% 0.0% 1.1% 8.5%
Included with Mandla
82.8% 77.7% 0.3% 0.2% 2.8% 1.0% 14.1% 17.8% 0.2% 3.0% 21.1%
Included with Mandsaur
90.0% 87.8% 0.0% 0.1% 3.1% 1.5% 6.8% 8.9% 0.1% 1.7% 10.7%
Included with Morena
98.8% 98.5% 0.0% 0.0% 0.9% 1.2% 0.2% 0.2% 0.0% 0.1% 0.3%
95.8% 96.2% 0.0% 0.0% 2.1% 0.9% 2.1% 2.3% 0.0% 0.6% 2.8%
5.8% 3.9% 69.4% 55.3% 24.1% 36.4% 51.5% 7.5% 16.6% 0.5% 5.2%
1.7% 0.6% 52.1% 25.8% 46.3% 60.1% 63.3% 15.2% 20.6% 0.5% 4.9%
87.9% 87.2% 0.3% 0.2% 2.3% 0.5% 9.6% 10.1% 0.9% 1.1% 12.1%
98.8% 97.9% 0.0% 0.0% 0.4% 0.1% 0.8% 1.7% 0.0% 0.2% 2.0%
97.6% 95.8% 0.0% 0.0% 0.6% 0.2% 1.7% 3.4% 0.1% 0.5% 3.9%
97.2% 97.5% 0.0% 0.0% 1.6% 0.7% 1.2% 1.4% 0.1% 0.3% 1.8%
2.7% 1.8% 54.9% 34.1% 42.4% 54.4% 86.0% 10.9% 22.6% 1.0% 9.1%
95.6% 95.4% 0.1% 0.1% 0.7% 0.2% 3.6% 3.9% 0.1% 0.4% 4.4%
82.8% 87.2% 0.0% 0.0% 4.9% 1.7% 12.4% 9.3% 0.0% 1.7% 11.1%
Included with Shahdol
91.5% 87.9% 0.4% 0.3% 0.8% 0.2% 7.3% 10.2% 0.4% 1.0% 11.6%
85.9% 80.9% 0.1% 0.0% 1.8% 0.6% 12.2% 15.9% 0.4% 2.1% 18.5%
77.2% 79.2% 0.1% 0.1% 10.9% 5.4% 11.8% 12.0% 0.0% 3.3% 15.3%
93.8% 94.8% 0.0% 0.0% 2.9% 1.5% 3.3% 2.8% 0.0% 1.0% 3.7%
95.9% 94.5% 0.3% 0.1% 0.4% 0.2% 3.5% 4.3% 0.5% 0.3% 5.1%
1.7% 0.9% 79.4% 63.1% 18.6% 31.2% 50.3% 4.0% 10.9% 2.6% 28.7%
97.7% 97.7% 0.1% 0.1% 1.2% 0.8% 0.9% 1.0% 0.2% 0.2% 1.4%
Included with West Nimar
92.4% 90.6% 0.2% 0.2% 1.9% 0.8% 5.5% 7.0% 0.2% 1.2% 8.4%
BalaghatBetulBhindBhopalChhatarpurChhindwaraDamohDatiaDewasDharEast NimarGunaGwaliorHoshangabadHardaIndoreJabalpur KatniJhabuaMandla DindoriMandsaur NeemuchMorena SheopurNarsimhapurPannaRaisenRajgarhRatlamRewaSagarSatnaSehoreSeoniShahdol UmariaShajapurShivpuriSidhiTikamgarhUjjainVidishaWest NimarBarwaniMadhya Pradesh
Teancy Status of Operational Holdings, 1991 Teancy Status of Operational Holdings, 1991
Self Operated Wholly Leased in Wholly Otherwise Partly Owned, Partly Leased in &
Holdings Holdings Operated Holdings Partly Otherwise Operated Holdings
Number Area Number Area Number Area
District
Source: Commissioner of Land Records, Madhya Pradesh, Gwalior
Number Owned Leased Otherwise Total
Area in Area Area Area

392
Table EL 9 gives the Area, Production, Yield and per capita availability of
Cereals, Pulses, Food Grains and Oilseeds for the years 1978-79, 1988-89
and 1998-99. Area, Production and Yields for Kharif and Rabi Crops on the
whole and the per capita production of Cereals, Pulses Food Grains and
Oilseeds is given in the Table.
YIELD:
Yield of any crop group is obtained by dividing the production
in kgs. by the area in hectares.
PER CAPITA PRODUCTION
Per capita production of any crop group is obtained by
dividing the production in kgs. by the total population.
EL 9: AREA, PRODUCTION, YIELD AND PER CAPITA AVAILABILITY OF FOOD GRAINS INDISTRICTS OF MADHYA PRADESH OVER 30 YEARS
Source: Agricultural Statistics 2000, Directorate of Agriculture, Madhya Pradesh
for M.P. and Indian Economic Survey, 2000 for India
Year Madhya IndiaPradesh
Cereals
Area ('000 hectares) 1998-99 8537.2 106100
Production ('000 tonnes) 11933.5 188600
Share of India 6.33%
Yield (kg/hectare) 1397.8 1778
Pulses
Area 1998-99 4222.2 23500
Production 3374.9 14900
Share of India 22.65%
Yield 799.3 634
Foodgrains
Area 1998-99 12759.4 129600
Production 15308.4 203500
Share of India 7.52%
Yield 1199.8 1571
Oilseeds
Area 1998-99 5765.8 26200
Production 5440.9 24700
Share of India 22.03%
Yield 943.7 944
Yields of crops 1998-99: Madhya
Pradesh and India
Cereals Pulses Foodgrains Oilseeds
Kg/
Hec
tare
1398
1778
799
634
1200
1571
944 944
Madhya Pradesh India

393
EL 9: AREA, PRODUCTION, YIELD AND PER CAPITA AVAILABILITY OF FOOD GRAINS INDISTRICTS OF MADHYA PRADESH OVER 30 YEARS
922300 924500 272.2 363.9 1336.9 66.3 40.7 613.91007800 1007800 378.7 220 580.9 138.7 165.3 1191.8
445200 445204 75.7 82.83 1094.2 272.5 355.9 1306.1270800 277880 84.7 65.8 776.9 125.2 174.5 1393.8863100 863036 173.8 87.2 501.7 275.3 395.3 1435.9
1184900 1184923 441.2 350.1 793.5 143.4 242.4 1690.4728600 728583 152.2 97.9 643.2 228.2 203.3 890.9203500 263959 37.6 27.9 742.0 162.4 235.5 1450.1700300 700812 328.5 368.5 1121.8 214.7 375.2 1747.6819500 819541 468 398.6 851.7 218.9 384.7 1757.4
1117200 1118357 401.1 212.8 530.5 101.1 167.7 1658.81098200 1098160 215.5 163.5 758.7 412.6 453.3 1098.6
521900 456449 51 77.8 1525.5 198.1 322.5 1628.0999300 668689 230.8 209.6 908.1 231.6 402.1 1736.2
330579 163.8 141.9 866.3 108.9 197.9 1817.3383100 383097 225.9 272.6 1206.7 169.9 384.5 2263.1
1012500 519757 139.1 90 647.0 220.4 207.9 943.3493015 135.9 101.1 743.9 125.1 129.6 1036.0
675700 675716 350.6 264.4 754.1 103.6 132.6 1279.9946400 552098 167.4 105.5 630.2 91.8 63.8 695.0
412039 204.3 129.9 635.8 103.1 65.0 630.51326000 912455 298.6 400.7 1341.9 163.5 256.6 1569.4
393915 153.7 158.3 1029.9 103.5 159.9 1544.91168300 501686 77.2 100.2 1297.9 233.0 469.5 2015.0
666650 73.3 84.6 1154.2 124.7 292.1 2342.4513600 513651 165.7 207 1249.2 236.3 322.0 1362.7702900 702924 97.7 54.5 557.8 183.0 150.5 822.4848700 848746 161.8 184.3 1139.1 370.8 418.8 1129.4611700 616300 349 426.9 1223.2 170.5 249.8 1465.1486400 486474 272.8 403.9 1480.6 171.9 331.4 1927.9628800 628745 218.8 123.5 564.4 275.4 282.4 1025.4
1023200 1022759 204.3 116.7 571.2 440.5 418.3 949.6742400 742432 184.5 90.3 489.4 296.0 329.7 1113.9656300 656368 268.1 280.3 1045.5 257.3 421.4 1637.8870800 875401 283.5 208.5 735.4 173.2 115.3 665.7
1386000 935677 334.7 195.2 583.2 89.6 50.1 559.2450329 89.2 50.7 568.4 52.0 32.3 621.2
617800 617836 381.8 450.9 1181.0 256.2 414.1 1616.31017300 1017346 195.4 169.4 866.9 285.6 377.8 1322.81039200 1039194 320 187.8 586.9 183.0 131.5 718.6
504000 504002 175.5 153.2 872.9 188.0 321.5 1710.1611600 609874 430.5 587.3 1364.2 315.5 584.1 1851.3730200 730197 125.9 111.6 886.4 481.6 602.6 1251.2
1348500 648302 389.6 190.8 489.7 69.3 133.1 1920.6700201 223 135.9 609.4 41.9 78.1 1864.0
97.6 58.1 16.1 4.430734000 30745658 10270.2 8962.43 872.7 8890.2 12047.0 1355.1
BalaghatBetulBhindBhopalChhatarpurChhindwaraDamohDatiaDewasDharEast Nimar (Khandwa)GunaGwaliorHoshangabadHardaIndoreJabalpurKatniJhabuaMandlaDindoriMandsaurNeemuchMorenaSheopur NarsimhapurPannaRaisenRajgarhRatlamRewaSagarSatnaSehoreSeoniShahdolUmariaShajapurShivpuriSidhiTikamgarhUjjainVidishaWest Nimar (Khargone)BarwaniNon ReportedMadhya Pradesh
Geographical Area Major Radi Crops Major Rabi Crops
Geographical Areaafter formation of Area (000 Production Yield (Kg per Area ('000 Production Yield (Kg per
uptil 1990 new districts Hectares (000 Tonnes) Hecater) Hecater) ('000 tonnes) Hecatre)
1998-99 1998-99 1998-99 1998-99 1998-99 1998-99
District
Source: Commissioner of Land Records, Gwalior, Madhya Pradesh

394
EL 9: AREA, PRODUCTION, YIELD AND PER CAPITA AVAILABILITY OF FOOD GRAINS INDISTRICTS OF MADHYA PRADESH OVER 30 YEARS
271 248 915 281.9 385 1366 279.3 371.2 1329.0272.4 83.7 307 262.6 179.1 682 244.7 249.5 1019.6188.8 233.5 1237 180.5 297.2 1647 137.1 242.1 1766.1
94.7 70.3 742 88.1 108.9 1236 83.3 136.2 1635.1220 213.9 972 204.4 215.6 1055 197.5 330.8 1674.9275 109.8 399 297.2 334.8 1127 296.6 355.4 1198.2
185.8 143.7 773 165.5 117.3 709 161.2 178.7 1108.670.6 60 850 65.7 88.5 1347 79.1 156.7 1981.0
172.1 149.6 869 175.5 245.7 1400 144.3 308.3 2136.5222.2 180.5 812 246.3 322.8 1311 260.6 450.7 1729.5186.2 124.4 668 194.6 139.3 716 176.0 237.4 1348.9365.5 247.3 677 322.7 266.2 825 269.2 319.1 1185.4150.4 170.4 1133 143.1 284.6 1989 134.0 303.3 2263.4197.9 135.8 686 205 256 1249 171.4 345.6 2016.3
Included in Hoshangabad 82.7 167.9 2030.2135.8 122.9 905 142.1 247.6 1742 132.3 357.5 2702.2381.6 245.5 643 337.2 251.3 745 182.7 192.6 1054.2
Included in Jabalpur 208.1 199.9 960.6193 111.1 576 218.6 218.8 1001 223.0 287.1 1287.4
380.6 202.5 532 363.5 198.1 545 190.5 136.3 715.5Included in Mandla 208.7 152.6 731.2
307.8 317.9 1033 306 469.8 1535 140.4 278.7 1985.0Included in Mandsaur 69.7 143.5 2058.8
220.3 291 1321 194.9 420.3 2156 143.2 363.3 2537.0Included in Morena 82.1 235.5 2868.5
85.1 75.5 887 83.7 118.5 1416 100.3 164.4 1639.1163.5 109.7 671 158.4 130.5 824 157.0 134.1 854.1179.9 166.9 928 180.7 229.6 1271 186.2 252.9 1358.2229.3 183.4 800 189.9 169 890 179.3 272.5 1519.8
150 118.5 790 164.2 230.4 1403 146.1 344.5 2358.0340.3 191.3 562 316.3 202.9 641 340.4 297.4 873.7319.2 260.1 815 287.2 191.6 667 245.9 298.1 1212.3322.4 250.5 777 307.3 206 670 302.1 326.8 1081.8184.7 140 758 161.4 212 1314 167.3 309.1 1847.6
256 113.3 443 258.2 203.9 790 261.6 227.2 868.5418.9 243 580 396.4 253.3 639 331.8 212.5 640.4
Included in Shahdol 105.3 69.9 663.8211.4 216.1 1022 210.8 291.5 1383 173.5 343.5 1979.8
218 147.5 677 192.1 259.1 1349 174.0 278.3 1599.4322.4 181.2 562 316.4 155.8 492 362.6 260.3 717.9185.6 203.8 1098 176.5 248 1405 163.1 289.8 1776.8256.4 222.5 868 252.1 350.9 1392 189.3 501.4 2648.7318.4 258.2 811 265.3 239.6 903 243.5 368.1 1511.7287.9 196 681 313.3 339.1 1082 186.4 264.3 1417.9
Included in West Nimar 129.8 159.4 1228.090.3 25.6 94.1 59.1 94.0 59.1
9031.4 6764.9 749.0 8719.7 8981.9 1030.1 8537.2 1397.8
BalaghatBetulBhindBhopalChhatarpurChhindwaraDamohDatiaDewasDharEast Nimar (Khandwa)GunaGwaliorHoshangabadHardaIndoreJabalpurKatniJhabuaMandlaDindoriMandsaurNeemuchMorenaSheopur NarsimhapurPannaRaisenRajgarhRatlamRewaSagarSatnaSehoreSeoniShahdolUmariaShajapurShivpuriSidhiTikamgarhUjjainVidishaWest Nimar (Khargone)BarwaniNon ReportedMadhya Pradesh
Cereals
Area ('000 Production Yield (Kg Area (000 Production Yield (Kg per Area ('000 Production Yield (Kg per
Hectares ('000 tonnes) per Hectares Hectares ('000 tonnes) Hecater) Hectares) ('000 tonnes) Hecatre)
1978-79 1978-79 1978-79 1988-89 1988-89 1988-89 1998-99 1998-99 1998-99
District
Source: Commissioner of Land Records, Gwalior, Madhya Pradesh

395
EL 9: AREA, PRODUCTION, YIELD AND PER CAPITA AVAILABILITY OF FOOD GRAINS INDISTRICTS OF MADHYA PRADESH OVER 30 YEARS
3 27 51.2 13.0 253.9 42.7 18.3 429.027 36 103.0 22.5 218.4 76.8 38.8 505.028 16 120.7 93.7 776.3 113.8 102.2 898.043 20 31.9 20.1 630.1 37.3 29.8 799.011 18 87.6 49.9 569.6 106.1 64.7 610.07 31 147.1 43.2 293.7 104.8 146.6 1399.0
35 33 78.9 35.6 451.2 97.7 47.0 481.039 12 49.7 24.6 495.0 55.4 43.9 792.015 7 54.7 30.4 555.8 46.6 40.1 861.0
2 17 139.6 58.0 415.5 107.3 47.1 439.029 26 74.6 23.1 309.7 83.9 43.3 516.013 32 98.4 53.1 539.6 168.1 94.2 560.016 6 70.6 38.7 548.2 66.0 58.2 882.0
8 10 106.3 65.5 616.2 133.1 122.5 920.036 9 Included in Hoshangabad
6 2 74.7 47.2 631.9 54.4 50.9 936.034 35 134.0 59.2 441.8 126.4 78.1 618.033 37 Included in Jabalpur20 28 114.6 37.3 325.5 114.6 51.5 449.042 43 51.2 19.3 377.0 42.3 21.2 501.040 41 Included in Mandla21 11 141.3 93.0 639.1 229.2 117.3 512.041 8 Included in Mandsaur
5 4 94.3 63.5 673.4 42.0 46.8 1114.030 1 Included in Morena37 19 175.9 106.1 603.2 182.3 146.9 806.044 40 40.1 20.9 521.2 51.9 31.2 601.026 25 163.9 102.6 626.0 184.7 146.7 794.023 22 58.9 31.3 531.4 97.4 77.1 792.0
9 5 84.7 37.6 443.9 100.2 56.7 566.018 38 78.9 40.3 510.8 82.0 45.1 550.017 30 104.9 57.6 549.1 134.5 55.4 412.012 34 58.6 22.0 375.4 66.7 35.6 534.014 14 73.7 41.8 567.2 88.5 75.7 855.031 39 74.0 23.5 317.6 65.0 37.1 571.032 45 51.3 17.4 339.2 48.5 19.4 400.045 44 Included in Shahdol10 13 75.3 41.5 551.1 98.8 85.3 863.022 21 66.2 29.9 451.7 96.7 73.0 755.025 42 78.9 37.6 476.6 79.4 44.3 558.019 15 41.6 21.3 512.0 63.9 45.3 709.0
1 3 136.7 50.9 372.3 111.2 59.9 539.04 23 128.8 77.1 598.6 204.9 124.0 605.0
24 24 132.6 31.9 240.6 108.0 46.0 426.038 29 Included in West Nimar
11.7 2.7 230.8 10.2 2.23461.1 1682.2 486.0 3723.3 2469.4 663.2
BalaghatBetulBhindBhopalChhatarpurChhindwaraDamohDatiaDewasDharEast Nimar (Khandwa)GunaGwaliorHoshangabadHardaIndoreJabalpurKatniJhabuaMandlaDindoriMandsaurNeemuchMorenaSheopur NarsimhapurPannaRaisenRajgarhRatlamRewaSagarSatnaSehoreSeoniShahdolUmariaShajapurShivpuriSidhiTikamgarhUjjainVidishaWest Nimar (Khargone)BarwaniNon ReportedMadhya Pradesh
Cereals Pulses
Rank in Rank in Area ('000 Production Yield (Kg per Area ('000 Pruduction Yield (Kg per
Production Yield Hectares) ('000 tonnes) Hecatre Hecater) ('000 tonnes) Hecatre)
1998-99 1998-99 1978-79 1978-79 1978-79 1988-89 1988-89 1988-89
District
Source: Commissioner of Land Records, Gwalior, Madhya Pradesh

396
EL 9: AREA, PRODUCTION, YIELD AND PER CAPITA AVAILABILITY OF FOOD GRAINS INDISTRICTS OF MADHYA PRADESH OVER 30 YEARS
33.0 18.0 545.5 39 36 322.2 261.0 810.1 324.669.4 33.4 481.3 35 38 375.4 106.2 282.9 339.479.7 67.0 840.7 22 21 309.5 327.2 1057.2 294.347.2 43.2 915.3 30 15 126.6 90.4 714.1 125.4
147.4 108.4 735.4 9 25 307.6 263.8 857.6 310.584.6 80.5 951.5 17 13 422.1 153.0 362.5 402.0
122.8 70.1 570.8 21 35 264.7 179.3 677.4 263.297.1 87.5 901.1 13 17 120.3 84.6 703.2 121.1
105.0 105.8 1007.6 10 9 226.8 180.0 793.7 222.191.4 53.1 581.0 27 33 361.8 238.5 659.2 353.664.4 45.3 703.4 29 26 260.8 147.5 565.6 278.5
218.7 198.6 908.1 2 16 463.9 300.4 647.6 490.840.5 35.1 866.7 34 19 221.0 209.1 946.2 209.180.2 84.0 1047.4 16 7 304.2 201.3 661.7 338.134.8 40.6 1166.7 31 2 Included in Hoshangabad
47.6 38.6 810.9 33 22 210.5 170.1 808.1 196.5123.5 76.7 621.1 18 31 515.6 304.7 591.0 463.638.3 24.6 642.3 36 29 Included in Jabalpur
164.4 72.0 438.0 20 42 307.6 148.4 482.4 333.237.7 15.6 413.8 41 43 431.8 221.8 513.7 405.834.8 16.0 459.8 40 39 Included in Mandla96.0 86.1 896.9 15 18 449.1 410.9 914.9 535.259.8 62.7 1048.5 25 6 Included in Mandsaur18.6 21.1 1134.4 37 4 314.6 354.5 1126.8 236.9
154.4 156.1 1011.0 5 8 Included in Morena168.9 185.8 1100.1 4 5 261.0 181.6 695.8 266.010.2 2.2 215.7 45 45 203.6 130.6 641.5 210.395.5 60.1 629.3 26 30 343.8 269.5 783.9 365.4
204.3 193.3 946.2 3 14 288.2 214.7 745.0 287.3108.9 105.6 969.7 11 11 234.7 156.1 665.1 264.491.8 73.6 801.7 19 23 419.2 231.6 552.5 398.3
100.5 87.1 866.7 14 20 424.1 317.7 749.1 421.7205.3 134.0 652.7 6 28 381.0 272.5 715.2 374.0111.1 65.0 585.1 23 32 258.4 181.8 703.6 249.9110.6 129.3 1169.1 7 1 330.1 136.8 414.4 323.269.2 40.0 578.0 32 34 470.2 260.4 553.8 444.9
138.8 94.8 683.0 12 27 Included in Shahdol40.4 18.1 448.0 38 41 286.7 257.6 898.5 309.611.8 13.5 1144.1 43 3 284.2 177.4 624.2 288.8
130.8 125.9 962.5 8 12 401.3 218.8 545.2 395.888.8 46.9 528.2 28 37 227.2 225.1 990.8 240.485.4 63.4 742.4 24 24 393.1 273.4 695.5 363.318.9 8.6 455.0 44 40 447.2 335.3 749.8 470.2
250.9 249.7 995.2 1 10 420.5 227.9 542.0 421.337.9 14.7 387.9 42 44 Included in West Nimar50.9 23.2 102.0 28.3 104.3
4222.2 3374.9 799.3 12492.6 8449.8 676.4 12443.0
BalaghatBetulBhindBhopalChhatarpurChhindwaraDamohDatiaDewasDharEast Nimar (Khandwa)GunaGwaliorHoshangabadHardaIndoreJabalpurKatniJhabuaMandlaDindoriMandsaurNeemuchMorenaSheopur NarsimhapurPannaRaisenRajgarhRatlamRewaSagarSatnaSehoreSeoniShahdolUmariaShajapurShivpuriSidhiTikamgarhUjjainVidishaWest Nimar (Khargone)BarwaniNon ReportedMadhya Pradesh
Foodgrains
Area ('000 Production Yield (Kg per Rank in Rank in Area ('000 Production Yield (Kg Area ('000
Hectares) ('000 tonnes) Hectares) Production Yield Hecater) ('000 tonnes) per hecatre) Hectares
1998-99 1998-99 1998-99 1998-99 1998-99 1978-79 1978-79 1978-79 1988-89
District
Source: Commissioner of Land Records, Gwalior, Madhya Pradesh

397
EL 9: AREA, PRODUCTION, YIELD AND PER CAPITA AVAILABILITY OF FOOD GRAINS INDISTRICTS OF MADHYA PRADESH OVER 30 YEARS
403.3 1242.0 312.3 389.2 1246 17 24217.9 642.0 314.1 282.9 901 29 34399.4 1357.0 216.8 309.1 1426 26 15138.7 1106.0 130.5 179.4 1375 41 18280.3 903.0 344.9 439.2 1273 7 22481.4 1198.0 381.2 435.9 1143 9 27164.3 624.0 284.0 248.8 876 34 36132.4 1093.0 176.2 244.2 1386 35 17285.8 1287.0 249.3 414.1 1661 13 9369.9 1046.0 352.0 503.8 1431 4 14182.6 656.0 240.4 282.7 1176 30 26360.4 734.0 487.9 517.7 1061 3 29342.8 1639.0 174.5 338.4 1939 25 4378.5 1119.0 251.6 429.6 1707 11 8
Included in Hoshangabad 117.5 208.5 1774 38 6298.5 1519.0 179.9 396.1 2202 15 3329.4 711.0 306.2 269.3 879 31 35
Included in Jabalpur 246.4 224.5 911 37 33270.3 811.0 387.4 359.1 927 22 32219.3 540.0 228.2 151.9 666 43 42
Included in Mandla 243.5 168.6 692 42 40587.1 1097.0 236.4 364.8 1543 21 12
Included in Mandsaur 129.5 206.2 1592 39 10467.1 1972.0 161.8 384.4 2376 19 2
Included in Morena 93.9 249.0 2652 33 1265.4 998.0 269.2 350.2 1301 24 21161.7 769.0 252.5 194.2 769 40 39376.3 1030.0 390.5 446.2 1143 6 28246.1 857.0 288.2 378.1 1312 20 20287.1 1086.0 237.9 418.1 1757 12 7248.0 623.0 440.9 384.5 872 18 37247.0 586.0 451.2 432.1 958 10 30241.6 646.0 413.2 391.8 948 16 31287.7 1151.0 277.9 438.4 1578 8 11241.0 746.0 330.8 267.2 808 32 38272.7 613.0 372.2 230.6 620 36 44
Included in Shahdol 124.2 78.5 632 44 43376.8 1217.0 327.9 499.6 1524 5 13332.1 1150.0 304.8 404.2 1326 14 19200.1 506.0 451.4 307.2 681 27 41293.3 1220.0 248.5 353.2 1421 23 16410.8 1131.0 328.1 596.2 1817 2 5363.6 773.0 494.4 617.8 1250 1 23385.1 914.0 237.3 287.5 1212 28 25
Included in West Nimar 167.7 174.1 1038 42 3061.3 104.2 61.3
11607.1 932.8 12759.4 15308.4 1199.8
BalaghatBetulBhindBhopalChhatarpurChhindwaraDamohDatiaDewasDharEast Nimar (Khandwa)GunaGwaliorHoshangabadHardaIndoreJabalpurKatniJhabuaMandlaDindoriMandsaurNeemuchMorenaSheopur NarsimhapurPannaRaisenRajgarhRatlamRewaSagarSatnaSehoreSeoniShahdolUmariaShajapurShivpuriSidhiTikamgarhUjjainVidishaWest Nimar (Khargone)BarwaniNon ReportedMadhya Pradesh
Foodgrains
Production Yield (Kg per Area ('000 Production Yield (Kg Rank in Rank in
('000 tonnes) Hectares) Production Y ield per Hecater) Production yield
1998-99 1998-99 1998-99 1998-99 1978-79 1978-79 1988-89
District
Source: Commissioner of Land Records, Gwalior, Madhya Pradesh

398
EL 9: AREA, PRODUCTION, YIELD AND PER CAPITA AVAILABILITY OF FOOD GRAINS INDISTRICTS OF MADHYA PRADESH OVER 30 YEARS
44.1 7.4 167.8 31.3 10.1 323.0 24.9 9.7 389.628.8 6.7 232.6 121.6 83.8 689.0 198.9 90.1 453.041.6 11.3 271.6 60.5 37.0 612.0 131.3 129.4 985.53.8 2.3 605.3 36.2 27.1 749.0 79.1 60.2 761.1
36.2 7.2 198.9 47.1 17.8 378.0 104.1 43.0 413.172.7 12.7 174.7 133.6 120.6 903.0 182.6 119.6 655.025.0 6.9 276.0 33.5 13.9 415.0 96.4 52.3 542.57.9 1.4 177.2 13.2 6.0 455.0 22.4 15.3 683.0
23.6 26.9 1139.8 109.7 90.3 823.0 260.7 322.8 1238.265.3 42.2 646.2 122.2 104.5 855.0 261.4 279.0 1067.329.5 9.6 325.4 42.3 27.9 660.0 139.0 89.3 642.439.1 14.6 373.4 67.9 48.4 713.0 139.7 97.9 700.830.7 7.9 257.3 62.9 53.1 844.0 73.3 57.1 779.071.2 18.8 264.0 167.7 119.8 714.0 210.7 181.8 862.8
Included in Hoshangabad 151.2 131.1 867.112.9 20.0 1550.4 120.0 95.4 795.0 215.6 260.2 1206.934.9 8.0 229.2 32.8 11.1 338.0 53.2 28.4 533.8
Included in Jabalpur 14.6 6.1 417.828.2 12.8 453.9 26.0 26.7 1027.0 50.4 37.8 750.081.9 23.8 290.6 77.0 29.0 377.0 30.0 14.4 480.0
Included in Mandla 63.9 26.3 411.652.3 28.7 548.8 77.7 71.7 923.0 225.6 292.3 1295.7
Included in Mandsaur 127.6 111.8 876.286.3 34.1 395.1 218.3 263.0 1205.0 146.0 174.0 1191.8
Included in Morena 104.0 127.2 1223.111.6 2.7 232.8 46.9 39.9 851 128.4 158.4 1233.636.3 10.0 275.5 30.4 10.6 349.0 28.1 10.7 380.830.9 8.5 275.1 82.1 62.4 760.0 142.1 156.8 1103.431.8 21.3 669.8 125.9 85.7 681.0 230.9 297.4 1288.015.0 11.3 753.3 42.5 38.6 908.0 185.4 313.8 1692.643.0 6.5 151.2 28.6 6.1 213.0 53.3 21.3 399.637.7 16.4 435.0 86.7 56.8 655.0 193.4 102.5 530.037.7 6.2 164.5 33.5 7.9 236.0 67.2 27.9 415.225.8 15.4 596.9 127.7 96.7 757.0 244.4 254.1 1039.756.2 9.3 165.5 76.0 43.6 574.0 125.3 54.6 435.875.7 14.4 190.2 60.3 15.2 252.0 52.1 14.7 282.1
Included in Shahdol 17.0 4.5 264.737.8 28.8 761.9 164.8 132.0 801.0 308.8 361.4 1170.345.9 18.5 403.1 90.7 79.5 877.0 175.1 140.1 800.152.5 8.4 160.0 49.2 11.4 232.0 51.6 12.0 232.615.2 2.6 171.1 33.3 30.9 928.0 114.7 119.7 1043.632.6 26.9 825.2 169.1 158.1 935.0 417.5 574.3 1375.625.4 10.4 409.4 58.2 49.2 845.0 113.0 96.2 851.360.7 34.8 573.3 56.0 61.4 1096.0 54.8 34.4 628.0
Included in West Nimar 49.7 32.6 656.06.2 1.6 6.5 1.3 6.5 1.2 -
1494.0 557.3 373.0 2969.9 2244.5 755.7 5765.8 5440.9 943.7
BalaghatBetulBhindBhopalChhatarpurChhindwaraDamohDatiaDewasDharEast Nimar (Khandwa)GunaGwaliorHoshangabadHardaIndoreJabalpurKatniJhabuaMandlaDindoriMandsaurNeemuchMorenaSheopur NarsimhapurPannaRaisenRajgarhRatlamRewaSagarSatnaSehoreSeoniShahdolUmariaShajapurShivpuriSidhiTikamgarhUjjainVidishaWest Nimar (Khargone)BarwaniNon ReportedMadhya Pradesh
Oilseeds
Area ('000 Production Yield (Kg per Area ('000 Production Yield (Kg per Area '(000 Production Yield (Kg
Hectares) ('000 tonnes) Hectares) Hectares) ('000 tonnes) Hecatre) Hectares) ('000 tonnes) per Hecatre)
1978-79 1978-79 1978-79 1988-89 1988-89 1988-89 1998-89 1998-89 1998-89
District
Source: Commissioner of Land Records, Gwalior, Madhya Pradesh

399
EL 9: AREA, PRODUCTION, YIELD AND PER CAPITA AVAILABILITY OF FOOD GRAINS INDISTRICTS OF MADHYA PRADESH OVER 30 YEARS
42 40 259.7 12.6 272.3 6.824 33 185.0 24.8 209.7 66.816 15 175.1 48.5 223.6 93.626 22 78.8 25.0 103.9 34.830 37 235.4 77.1 312.6 30.619 26 198.6 45.0 243.6 66.829 29 171.4 67.3 238.7 50.237 25 259.6 145.0 404.6 25.43 5 247.3 84.9 332.1 258.97 12 271.7 32.0 303.8 168.2
25 27 144.0 27.5 171.4 54.222 24 201.0 125.1 326.1 61.727 21 194.9 22.6 217.4 36.710 18 331.7 80.6 412.3 174.515 17 370.0 89.5 459.4 288.98 8 148.1 16.0 164.1 107.8
33 30 92.6 36.9 129.4 13.643 35 195.1 24.0 219.1 6.031 23 214.4 53.8 268.2 28.239 32 156.7 17.9 174.6 16.635 38 270.0 28.3 298.4 46.56 3 245.7 75.9 321.7 257.7
20 16 205.6 89.8 295.4 160.211 9 239.0 13.9 252.9 114.517 7 443.2 293.8 468.6 239.412 6 178.6 201.9 380.6 172.141 41 163.9 2.7 237.4 13.113 11 237.1 56.4 418.4 147.05 4 227.8 161.6 316.1 248.64 1 296.6 90.9 359.9 270.1
36 39 158.1 39.1 204.4 11.321 31 153.6 44.9 222.6 52.834 36 183.6 75.3 220.1 15.79 14 301.1 63.3 427.1 247.6
28 34 200.9 114.3 236.3 48.338 42 139.9 26.3 151.8 9.744 43 141.1 191.4 158.5 9.12 10 278.3 14.7 404.8 292.8
14 20 202.7 9.8 294.4 102.040 44 150.6 72.8 177.7 6.918 13 253.0 40.9 308.4 104.51 2 305.9 38.7 363.8 350.4
23 19 316.9 7.4 531.9 82.832 28 181.5 171.5 197.4 23.633 26 155.4 14.3 169.7 31.8
206.4 58.4 264.8 94.1
BalaghatBetulBhindBhopalChhatarpurChhindwaraDamohDatiaDewasDharEast Nimar (Khandwa)GunaGwaliorHoshangabadHardaIndoreJabalpurKatniJhabuaMandlaDindoriMandsaurNeemuchMorenaSheopur NarsimhapurPannaRaisenRajgarhRatlamRewaSagarSatnaSehoreSeoniShahdolUmariaShajapurShivpuriSidhiTikamgarhUjjainVidishaWest Nimar (Khargone)BarwaniNon ReportedMadhya Pradesh
Oilseeds Per Capita Production (1998/99) in Kgs.
Rank in Rank in
Production yield
1998-99 1998-99 Cereals Pulses Foodgrains Oilseeds
District
Source: Commissioner of Land Records, Gwalior, Madhya Pradesh

400
EL 10 gives net and gross irrigated area in the years 1978-79, 1988-89 and
1998-99. It also gives the gross or net irrigated categorised based on
source of irrigation in the same years. This gives us an idea about the
source of water being used for irrigation.
NET IRRIGATED AREA
This represents the irrigated area by all the sources. Area irri-
gated more than once in the same year is counted only once.
GROSS IRRIGATED AREA
This represents the total area irrigated by all the sources, i.e.
the sum total of irrigated areas covered by all the individual
sources. Areas irrigated more than once during the year are
counted separately.
AREA IRRIGATED MORE THAN ONCE
This is obtained by deducting 'Net Irrigated Area' from 'Gross
Irrigated Area'.
EL 10: NET AND GROSS AREA IRRIGATED OVER 30 YEARS AND SOURCEWISE NETIRRIGATED AREA, 1998-99 IN DISTRICTS OF MADHYA PRADESH
Source: Agriculture Statistics 2000, Directorate of Agriculture, Madhya Pradesh
for M.P. and Land Statistics at a Glance, Directorate of Economics and Statistics,
Department of Agriculture and Co-operation, Government of India for India.
Year Madhya IndiaPradesh
Area irrigated by canals as % of net 1998-99 18.1% 31.10%
irrigated area (hectares)
Area irrigated by tanks as % of net 1998-99 2.5% 5.16%
irrigated area (hectares)
Area irrigated by wells as % of net 1998-99 44.2% 58.01%
irrigated area (hectares)
Area irrigated by other sources as % 1998-99 35.1% 5.74%
of net irrigated area (hectares)
% Net Irrigated area to net sown 1998-99 36.7% 40.0%
area (hectares) (provisional)
% Gross irrigated area to gross area 1998-99 27.8% 39.2%
sown (hectares) (provisional)
Percentage of Irrigated Area by Source 1998-99:
Madhya Pradesh and India
Net Gross irrigated Canals Tanks Wells Other SourcesIrrigated to to sown
Sown
37 40
28
39
18
31
3 5
44
58
35
6
Madhya Pradesh India

401
EL 10: NET AND GROSS AREA IRRIGATED OVER 30 YEARS AND SOURCEWISE NETIRRIGATED AREA, 1998-99 IN DISTRICTS OF MADHYA PRADESH
124100 133700 137472 113700 119800 12144242900 60700 104503 42900 60700 104503112900 112700 137899 101200 98700 12538212900 24500 71900 12900 24500 7190077500 101300 169515 77200 101000 16951548700 65000 127987 39300 65000 12004616000 29200 83443 12600 25800 8133630100 40500 85508 30000 40300 8139138500 79100 158563 37900 78800 15840556300 110100 232642 56300 110000 23264242500 75000 160229 42500 65500 15143428900 63600 154451 28600 63200 154156
104600 116900 156814 88200 99000 12394044000 194800 232517 44000 194800 232517
Included in Hoshangabad 127238 Included in Hoshangabad 12723844900 83500 160059 43300 78700 16005932600 59200 96516 26200 53600 92731
Included in Jabalpur 54243 Included in Jabalpur 4573618400 28400 82171 17900 27600 80835
103600 143600 157529 101300 140700 155833Included in Mandsaur 73250 Included in Mandsaur 73071
3600 11800 14756 3600 10100 13591Included in Mandla 1027 Included in Mandla 951
166200 210200 158359 162800 204800 156170Included in Morena 103901 Included in Morena 98385
21500 54200 157860 21500 54200 15786015800 19900 50319 14200 19900 5031915700 60700 147732 15700 60700 14773233600 74000 169465 33100 74000 16928041100 66400 146600 40400 65200 14554922100 45100 87398 22100 45100 8730620000 55500 168442 18000 54900 16843914900 42200 106516 14900 42200 10651629800 68900 171530 28400 68900 17153025800 36100 73316 22600 36100 733165500 16200 17871 5300 16200 17871
Included in Shahdol 16301 Included in Shahdol 1630141300 97500 216147 39800 96400 21592271100 100200 169565 70400 97000 1667567800 22400 50189 7700 22400 50189
90600 119600 216417 88200 111600 17797245200 112300 261530 44200 111500 2612599700 50900 143913 9700 50900 143913
77300 131200 175898 77300 131100 175747Included in West Nimar 77993 Included in West Nimar 77993
1738000 2917100 5667494 1655900 2820900 5514979
BalaghatBetulBhindBhopalChhatarpurChhindwaraDamohDatiaDewasDharEast Nimar (Khandwa)GunaGwaliorHoshangabadHardaIndoreJabalpurKatniJhabuaMandsaurNeemuchMandlaDindoriMorenaSheopur NarsimhapurPannaRaisenRajgarhRatlamRewaSagarSatnaSehoreSeoniShahdolUmariaShajapurShivpuriSidhiTikamgarhUjjainVidishaWest Nimar (Khargone)BarwaniMadhya Pradesh
Gross Irrigated Area Net Irrigated Area
1978-79 1988-89 1998-99 1978-79 1988-89 1998-99
District
Source: Commissioner of Land Records, Gwalior, Madhya Pradesh

402
EL 10: NET AND GROSS AREA IRRIGATED OVER 30 YEARS AND SOURCEWISE NETIRRIGATED AREA, 1998-99 IN DISTRICTS OF MADHYA PRADESH
41.3 43.3 44.5 33.1 36.8 40.010.6 14.8 25.7 9.9 12.6 19.630.0 29.3 37.2 31.8 31.1 37.68.6 15.6 45.3 8.3 13.6 31.8
22.8 29.0 44.2 20.0 25.0 35.08.1 13.2 24.2 9.2 11.5 20.84.5 9.2 26.9 5.2 9.5 21.4
23.4 30.6 42.7 23.2 29.2 40.910.9 21.9 42.4 9.9 18.0 26.911.5 22.0 46.0 10.0 18.3 31.89.7 14.6 34.5 9.1 15.2 29.55.1 10.3 24.3 4.9 9.7 20.7
35.1 37.7 57.2 38.4 40.7 60.610.0 42.8 79.2 9.8 33.9 48.6
Included in Hoshangabad 74.9 Included in Hoshangabad 44.716.9 31.4 62.3 14.7 22.8 35.75.7 12.3 33.3 5.8 11.7 26.2
Included in Jabalpur 22.7 Included in Jabalpur 20.45.3 7.8 22.3 4.8 7.2 17.3
19.9 26.0 44.4 15.1 18.8 27.6Included in Mandsaur 38.7 Included in Mandsaur 24.0
0.9 2.5 6.9 0.7 2.4 5.6Included in Mandla 0.4 Included in Mandla 0.3
42.8 49.4 58.7 39.7 44.6 49.4Included in Morena 64.8 Included in Morena 50.6
7.9 18.8 53.0 7.5 16.7 38.26.6 9.1 20.7 6.5 8.2 17.73.9 14.5 34.7 3.9 13.0 26.88.4 18.2 40.8 7.7 15.1 28.1
13.5 20.8 44.8 11.4 16.1 28.36.0 12.6 23.5 4.7 10.4 17.53.6 10.7 31.7 3.8 9.9 24.44.3 12.0 29.4 3.5 10.2 21.88.2 18.8 45.5 8.1 15.4 29.76.0 9.8 19.7 6.5 8.9 15.81.1 3.6 5.0 1.0 3.2 4.2
Included in Shahdol 14.7 Included in Shahdol 11.59.8 22.4 48.8 9.0 17.8 30.0
20.0 25.3 40.3 17.9 22.5 31.92.3 6.4 13.3 1.7 5.0 9.9
40.3 49.7 67.5 31.8 37.8 54.39.7 24.1 54.4 8.8 18.6 31.91.9 9.8 27.1 1.9 9.1 22.6
12.5 20.8 42.8 11.3 19.0 36.3Included in West Nimar 33.4 Included in West Nimar 28.0
11.7 19.4 36.7 10.8 17.0 27.8
BalaghatBetulBhindBhopalChhatarpurChhindwaraDamohDatiaDewasDharEast Nimar (Khandwa)GunaGwaliorHoshangabadHardaIndoreJabalpurKatniJhabuaMandsaurNeemuchMandlaDindoriMorenaSheopur NarsimhapurPannaRaisenRajgarhRatlamRewaSagarSatnaSehoreSeoniShahdolUmariaShajapurShivpuriSidhiTikamgarhUjjainVidishaWest Nimar (Khargone)BarwaniMadhya Pradesh
% of Net Irrigated Area to Net Sown Area % of Gross Irrigated Area to Gross
Area Sown
1978-79 1988-89 1998-99 1978-79 1988-89 1998-99
District
Source: Commissioner of Land Records, Gwalior, Madhya Pradesh

403
EL 10: NET AND GROSS AREA IRRIGATED OVER 30 YEARS AND SOURCEWISE NETIRRIGATED AREA, 1998-99 IN DISTRICTS OF MADHYA PRADESH
30.3 33.0 35.3 72941 28311 15015 51759.9 12.6 19.6 16882 291 64019 23311
28.5 27.3 34.2 62225 30 50486 126418.3 13.6 31.8 6320 584 26756 38240
19.9 24.9 35.0 21831 6728 123733 172237.4 11.5 19.5 8225 310 92609 189024.1 8.4 20.9 8680 458 19984 52214
23.1 29.1 38.9 25130 - 53024 32379.8 17.9 26.8 4226 2682 64439 87058
10.0 18.3 31.8 9956 7487 80076 1351239.1 13.3 27.9 5556 977 108439 364624.8 9.6 20.7 18856 1886 50645 82769
32.4 34.4 47.9 63734 151 37493 225629.8 33.9 48.6 138207 1016 45787 47507
Included in Hoshangabad 44.7 70905 168 38411 1775414.2 21.5 35.7 3968 5569 14490 1360324.7 10.5 25.2 8161 40 30514 54016
Included in Jabalpur 17.2 8973 749 18964 170504.7 7.0 17.0 13324 7398 23875 36238
14.8 18.4 27.3 1511 1740 135980 16602Included in Mandsaur 23.9 2320 918 54973 14860
0.7 2.1 5.2 10066 162 2279 1084Included in Mandla 0.3 632 - 127 192
38.9 43.4 48.8 67072 1155 79884 8059Included in Morena 47.9 47971 994 10334 39086
7.5 16.7 38.2 1190 312 100618 557405.8 8.2 17.7 6684 3818 11012 288053.9 13.0 26.8 50625 1696 20060 753517.6 15.1 28.1 6406 848 129277 3274911.2 15.8 28.1 3740 6539 72776 624944.7 10.4 17.4 17526 3360 27371 390493.4 9.7 24.4 7242 1800 81973 774243.5 10.2 21.8 7375 645 29174 693227.7 15.4 29.7 36632 4341 65260 652975.7 8.9 15.8 35871 6756 21632 90571.0 3.2 4.2 5400 1212 3347 7912
Included in Shahdol 11.5 2877 302 3346 97768.7 17.6 30.0 9793 10860 122171 73098
17.7 21.8 31.3 12326 6204 108610 396161.7 5.0 9.9 12566 577 22382 14664
31.0 36.9 44.6 26033 9293 127961 146858.6 18.5 31.9 2328 8903 86921 1631071.9 9.1 22.6 33218 1164 24558 8497311.3 19.0 36.3 17124 272 100426 57925
Included in West Nimar 28.0 6973 133 38913 3197410.3 16.5 27.1 999601 138839 2440124 1936415
BalaghatBetulBhindBhopalChhatarpurChhindwaraDamohDatiaDewasDharEast Nimar (Khandwa)GunaGwaliorHoshangabadHardaIndoreJabalpurKatniJhabuaMandsaurNeemuchMandlaDindoriMorenaSheopur NarsimhapurPannaRaisenRajgarhRatlamRewaSagarSatnaSehoreSeoniShahdolUmariaShajapurShivpuriSidhiTikamgarhUjjainVidishaWest Nimar (Khargone)BarwaniMadhya Pradesh
% of Net Irrigated Area to Gross Area Sown Sourcewise Net Irrigated Area
Canals Tanks Wells Sources
1978-79 1988-89 1998-99 1998-99 1998-99 1998-99 1998-99
District
Source: Commissioner of Land Records, Gwalior, Madhya Pradesh

404
Table EL 11 gives the livestock population in terms of animals per capita,
milch animals per capita and the draught animal per operational holding.
ANIMALS PER CAPITA
Animals per capita is obtained by dividing the total number of
animals by the total population. Animals included here are
cattle, buffalo, sheep, goat, horses and ponies, mules, donkeys,
camel and pigs
MILCH ANIMALS PER CAPITA
Milch animals per capita is obtained by dividing the milch
animals which is the sum of cows and the female buffaloes by
the total population.
DRAUGHT ANIMALS PER OPERATION HOLDING
Draught animals are animals which used for pulling load.
Draught animals per operational holding are obtained by
dividing the sum of bull, bullocks and male buffaloes by the
number of operational holdings.
EL 11: LIVESTOCK POPULATION IN DISTRICTS OF MADHYA PRADESH, 1998-99

405
EL 11: LIVESTOCK POPULATION IN DISTRICTS OF MADHYA PRADESH, 1998-99
197125 0.14 288957 1.25 876459 0.61215593 0.16 266054 1.51 824185 0.61221056 0.16 73257 0.47 692846 0.50
69819 0.04 37424 0.76 232585 0.13270626 0.19 247140 1.18 1203379 0.86256002 0.14 288046 1.23 1120883 0.63172875 0.17 155223 1.10 672050 0.64111455 0.18 57854 1.04 384518 0.64180329 0.14 141660 1.23 633125 0.51266673 0.16 240439 1.41 1128007 0.68312589 0.19 226977 1.49 976674 0.59241913 0.15 202943 0.89 893260 0.56185995 0.12 58959 0.52 622625 0.40166248 0.16 175544 1.28 503474 0.48
76126 0.17 97583 Included in Hoshangabad 257916 0.57191828 0.08 67566 0.73 524359 0.22121001 0.06 98055 0.85 463358 0.22143942 0.14 195119 Included in Jablapur 660862 0.65213813 0.16 326466 1.93 1129291 0.84
98805 0.11 154683 1.32 461430 0.5394324 0.17 161327 Included in Mandla 423424 0.75
182370 0.16 89117 0.65 581994 0.51145024 0.21 60516 Included in Mandsaur 444666 0.64249316 0.16 82121 0.70 760557 0.50141239 0.27 89559 Included in Morena 507383 0.95130138 0.14 93891 0.75 453296 0.49170891 0.21 168615 1.19 641001 0.78157310 0.15 124674 1.01 518066 0.49264041 0.22 149053 0.78 783987 0.66137679 0.12 113605 0.87 573604 0.49273582 0.15 338335 1.61 1131207 0.60259234 0.13 191139 0.85 887720 0.46274332 0.15 280697 1.27 1087208 0.61183362 0.18 129632 1.09 558207 0.54174851 0.15 214043 1.29 737488 0.65289312 0.19 452808 1.61 1031000 0.68
94952 0.19 103000 Included in Shahdol 329993 0.67249121 0.20 120069 0.79 736371 0.60301802 0.22 212584 1.17 1118503 0.81309972 0.18 365754 1.73 1372498 0.79197851 0.17 176711 1.05 828922 0.72235004 0.14 106629 0.74 662900 0.40199602 0.17 118326 0.97 552125 0.48235824 0.16 365609 1.60 899732 0.62137997 0.13 150687 Included in West Nimar 615536 0.60
8802943 0.15 7604763 1.15 31883138 0.56
BalaghatBetulBhindBhopalChhatarpurChhindwaraDamohDatiaDewasDharEast Nimar (Khandwa)GunaGwaliorHoshangabadHardaIndoreJabalpurKatniJhabuaMandlaDindoriMandsaurNeemuchMorenaSheopurNarsimhapurPannaRaisenRajgarhRatlamRewaSagarSatnaSehoreSeoniShahdolUmariaShajapurShivpuriSidhiTikamgarhUjjainVidishaWest Nimar (Khargone)BarwaniMadhya Pradesh
Milch Animals Milch Animals Draught Animals Draught Animals Total Animals Animals per
per Capita per Capita-1998-99
Operational Holding
District
Source: Commissioner of Land Records, Gwalior,

406
Table EL 12 gives rural credit scene in districts of Madhya Pradesh. Apart
from presenting the number of bank branches in Madhya Pradesh
including the Commercial Banks, Regional Rural Banks, District Central
Co-operative Banks, District Land Development Banks and the number of
rural bank branches, the details of priority sector lending including loans
for agriculture, non-farm sector, small scale industries and other priority
sectors are given in the table. Based on the deposits and advances in
1998-99 and 1999-2000, the credit deposit ratios for the respective years
and the growth in credit deposit ratio between the two years are
calculated.
POPULATION PER BRANCH
It shows the reach of bank branches and is calculated by divid-
ing the total population by the total number of bank branches.
CREDIT DEPOSIT RATIO
It is the proportion of assets created by bank from the deposits
received. The higher the ratio, the higher the loan assets
created from deposit.
AGRICULTURAL CREDIT PER HECTARE OF GROSS CROPPED AREA
It is calculated as loans given out for agricultural purposes
divided by the Gross Cropped Area in hectares.
AGRICULTURAL CREDIT PER HECTARE OF GROSS IRRIGATED AREA
It is calculated as loans given out for agricultural purposes
divided by the Gross Irrigated Area in hectare.
EL 12: CREDIT DEPOSIT RATIO, CREDIT FLOW TO AGRICULTURE AND RURAL CREDIT INDISTRICTS OF MADHYA PRADESH
Source: Banking Statistics, Quarterly Handout, March 1999 and March 2000,
RBI, Mumbai
Year Madhya IndiaPradesh
CD Ratio 1998-99 58.97 55.48
1999-2000 57.81 57.05

407
EL 12: CREDIT DEPOSIT RATIO, CREDIT FLOW TO AGRICULTURE AND RURAL CREDIT INDISTRICTS OF MADHYA PRADESH
55 26 17 5 103 12 8534 16 15 7 72 11.56 4367 17 9 93 12.7 7337 15 19 10 81 15.05 51
168 5 23 5 201 6.72 3430 40 15 10 95 12.19 4769 35 26 9 139 19.96 10436 24 17 7 84 10.69 4925 13 8 6 52 9.91 3445 35 21 11 112 9.23 7756 55 30 14 155 8.83 11217 14 5 2 38 15.35 3575 30 31 16 152 9.42 9753 30 15 13 111 11.8 9195 19 10 7 131 10.79 4812 14 5 3 34 11.2 1636 37 13 8 94 9.43 48
222 13 30 11 276 6.65 62136 11 15 5 167 10.79 48
26 34 17 5 82 13.79 7152 10 9 2 73 11.61 4733 17 12 3 65 10.89 5541 17 19 9 86 11.13 7050 11 9 8 78 16.4 3741 20 15 7 83 9.46 5934 14 12 7 67 8.93 5420 18 9 7 54 12.74 4626 41 15 9 91 9.63 5335 38 16 18 107 9.28 6565 13 23 10 111 8.76 7358 47 16 6 127 12.24 10371 31 24 12 138 11.94 7347 59 15 9 130 11.45 8752 8 19 15 94 8.95 4134 26 16 6 82 12.21 7148 31 13 4 96 13.96 6446 24 25 9 104 9.94 8212 8 8 4 32 13.48 2431 27 14 11 83 13.65 5947 36 12 6 101 13.58 9617 42 17 7 83 11.33 8393 25 28 14 160 8.64 8016 11 5 1 33 12.22 2448 18 23 16 105 9.24 7146 29 51 12 138 8.66 100
2357 1087 774 382 4594 10.87 2842
BalaghatBarwaniBetulBhindBhopalChhatarpurChhindwaraDamoh DatiaDewasDharDindoriEast Nimar (Khandwa)GunaGwaliorHardaHoshangabadIndoreJabalpurJhabuaKatniMandlaMandsaurMorenaNarsimhapurNeemuchPannaRaisenRajgarhRatlamRewaSagarSatnaSehoreSeoniShahdolShajapurSheopurShivpuriSidhiTikamgarhUjjainUmariaVidishaWest Nimar (Khargone)
Madhya Pradesh
Districtwise Branch Network of Banks (1999-2000)
Commercial Regional Rural District Central District Land Population per Number of RuralBanks Banks Cooperative Development Branch Branches
Banks Bank (DLDB) Total (in '000s
District
Source: Madhya Pradesh State Focus paper, 2001-02, National Bank for Agriculture and Rural Development, Bhopal

408
EL 12: CREDIT DEPOSIT RATIO, CREDIT FLOW TO AGRICULTURE AND RURAL CREDIT INDISTRICTS OF MADHYA PRADESH
1802.28 484.14 2286.42 358.12 841.85 3486.39 23940 12960 54.143114.40 479.00 3593.40 697.31 675.02 4965.73 20883.87 11918.94 57.071373.25 1134.12 2507.37 249.44 820.66 3577.47 38354 16125 42.042555.13 1461.92 4017.05 191.37 302.89 4511.31 32816.56 14187 43.235122.18 1163.89 6286.07 2077.97 3800.05 12164.09 270900 150579 55.581960.71 1123.62 3084.33 110.03 596.39 3790.75 32925.9 12893.3 39.162904.34 954.73 3859.07 374.97 2030.65 6264.69 54214 26906 49.631594.44 732.00 2326.44 112.83 599.07 3038.34 19930 10929 54.841982.95 1033.54 3016.49 77.86 360.24 3454.59 12500.8 6324.8 50.602909.67 2252.75 5162.42 713.47 761.43 6637.32 35959.62 31834.4 88.535615.00 1959.00 7574.00 353.00 1460.0 9387.00 42687 25875 60.62
53.11 96.44 149.55 57.83 378.81 586.19 5262.32 2738.21 52.036447.91 1260.55 7708.46 1196.79 1607.14 10512.39 53958.58 36379.31 67.421541.79 2376.80 3918.59 184.92 1214.86 5318.37 36831 24359 66.143012.70 1925.91 4938.61 1565.82 2544.48 9048.91 138319.2 45656.4 33.012939.46 586.33 3525.79 107.82 404.53 4038.14 10939.65 10629.64 97.173615.17 1215.13 4830.3 191.38 980.83 6002.51 35584.78 21996.49 61.815677.43 3484.94 9162.37 6820.12 11094.56 27077.05 343918 321682 93.53
991.91 1526.74 2518.65 658.56 3304.23 6481.44 195379.48 98235.46 50.281876.84 595.27 2472.11 110.47 679.69 3262.27 21197 10095 47.62
364.73 520.89 885.62 496.55 635.52 2017.69 31798.35 9251.1 29.09253.37 188.07 441.44 47.17 179.61 668.22 15578.32 7399.53 47.50
2748.12 2107.16 4855.28 249.20 799.90 5904.38 31272 18551 59.321722.60 2191.80 3914.40 614.64 2260.81 6789.85 28919.63 18909.66 65.39
913.58 764.15 1677.73 153.06 260.43 2091.22 23017.55 18153.83 78.871244.86 998.56 2243.42 68.78 313.84 2626.04 22168 6918 31.21
984.03 855.93 1839.96 34.10 324.78 2198.84 15129 6521 43.102124.76 1258.48 3383.24 123.61 2134.35 5641.20 19337.45 13969.3 72.243186.23 2143.95 5330.18 219.68 879.26 6429.12 21970 20023 91.143229.17 1716.47 4945.64 423.68 1067.31 6436.63 54417.36 22624.83 41.581268.99 1232.31 2501.30 509.89 992.16 4003.35 64590 21969 34.012339.15 1913.32 4252.47 527.31 1645.33 6425.11 60044.66 28347.57 47.212229.43 1011.57 3241.00 405.00 524.00 4170.00 61754 22071 35.742919.60 1619.90 4539.50 46.19 456.76 5042.45 24346.63 18810.76 77.261918.56 483.00 2401.56 54.47 503.21 2959.24 20730 10361 49.98
239.71 495.82 735.53 206.00 631.50 1573.03 43262.05 8590.2 19.863522.24 2314.72 5836.96 147.12 817.28 6801.36 23633 20569 87.04
893.64 986.94 1880.58 22.64 103.33 2006.55 12657.64 7547.47 59.631600.91 1315.53 2916.44 138.33 292.67 3347.44 31270.42 13539.25 43.30
501.07 591.39 1092.46 171.81 523.74 1788.01 41281.99 10625.34 25.742162.16 595.27 2757.43 171.92 872.16 3801.51 22357.06 8746.37 39.124673.49 2587.35 7260.84 2097.80 3979.13 13337.77 81272 55699 68.53
137.58 212.40 349.98 48.07 174.99 573.04 9889.88 2068.23 20.914380.74 2944.09 7324.83 69.89 984.41 8379.13 28622.39 23143.83 80.867016.97 763.76 7780.73 1948.09 1255.24 10984.06 34101.14 24072.48 70.59
109666.36 57659.65 167326.01 25205.08 57069.1 249600.19 2264319.28 1335310.7 58.97
BalaghatBarwaniBetulBhindBhopalChhatarpurChhindwaraDamoh DatiaDewasDharDindoriEast Nimar (Khandwa)GunaGwaliorHardaHoshangabadIndoreJabalpurJhabuaKatniMandlaMandsaurMorenaNarsimhapurNeemuchPannaRaisenRajgarhRatlamRewaSagarSatnaSehoreSeoniShahdolShajapurSheopurShivpuriSidhiTikamgarhUjjainUmariaVidishaWest Nimar (Khargone)
Madhya Pradesh
Priority Sector Lending in 1999-2000 (Amount in Rs. Lakhs) 1998-999
Total Crop Total Agriculture Total Loans Loans for Non Other Grand Deposits Advances CreditLoans Term Loans for Agriculture Farm Sector Priority Total Deposit
and SSI Total Ratio
District
Source: Madhya Pradesh State Focus paper, 2001-02, National Bank for Agriculture and Rural Development, Bhopal
(Amount in Rs. lakhs)

409
EL 12: CREDIT DEPOSIT RATIO, CREDIT FLOW TO AGRICULTURE AND RURAL CREDIT INDISTRICTS OF MADHYA PRADESH
28095 13915 49.53 17.36 7.37 665.2 1663.225304.4 15619.52 61.73 21.17 31.05 1289.4 4607.3
44330 17205 38.81 15.58 6.70 471.4 2399.337140.82 16488.84 44.40 13.18 16.22 1095.4 2913.0
356726 185956 52.13 31.68 23.49 2779.7 8742.838611 15219.9 39.42 17.27 18.05 636.9 1819.565453 29366 44.87 20.73 9.14 627.0 3015.223416 13420 57.31 17.49 22.79 597.9 2788.1
17334.55 8844.8 51.02 38.67 39.84 1442.2 3527.742865.2 35784.05 83.48 19.20 12.41 874.3 3255.8
49437 31801 64.33 15.81 22.90 1035.3 3255.65666.69 2805.58 49.51 7.68 2.46 48.5 14561.8
59154.98 41526.8 70.20 9.63 14.15 1418.0 4810.942612 25919 60.83 15.70 6.40 525.4 2537.1
165905.5 76383.9 46.04 19.94 67.30 1909.8 3149.312958.68 11368.82 87.73 18.46 6.95 1237.4 2771.041831.82 25316.94 60.52 17.56 15.10 1009.8 2077.4
376194 382810 101.76 9.38 19.00 2042.6 5724.4223255 102888 46.09 14.27 4.74 683.3 2609.6
23252 10556 45.40 9.69 4.57 521.1 3008.538385.02 11257.84 29.33 20.71 21.69 333.2 1632.719300.59 8523.71 44.16 23.89 15.19 168.3 2991.638042.09 21078.31 55.41 21.65 13.62 851.7 3082.137074.87 23577.9 63.60 28.20 24.69 1222.3 2471.925515.19 19011.12 74.51 10.85 4.72 406.3 1062.8
27234.4 9392 34.49 22.85 35.76 734.4 3062.717423 7643 43.87 15.16 17.21 647.9 3656.6
22044.76 18276.45 82.91 14.00 30.83 613.6 2290.126377 23094 87.55 20.06 15.34 883.4 3145.3
62961.87 25595.02 40.65 15.70 13.13 953.7 3373.673872.94 22400.31 30.32 14.37 1.96 499.9 2862.068666.68 31936.28 46.51 14.36 12.66 617.2 2524.6
72722 29295 40.28 17.76 32.73 663.9 3042.729120.81 21437.75 73.62 19.61 13.97 785.3 2646.5
24209 11626 48.02 16.78 12.21 518.0 3275.653542.98 10325.72 19.28 23.76 20.20 172.3 4115.828455.62 23145.75 81.34 20.41 12.53 810.2 2700.5
8715.87 6765.37 77.62 -31.14 -10.36 916.3 1810.034556.33 15893.66 45.99 10.51 17.39 547.9 1720.057405.47 11850.29 20.64 39.06 11.53 214.8 2176.726753.93 11021.91 41.20 19.67 26.02 691.8 1274.1
94624 53962 57.03 16.43 -3.12 886.0 2776.312106.59 2390.49 19.75 22.41 15.58 246.5 2147.034065.13 27597.89 80.94 19.12 19.25 1148.5 5089.840394.49 27561.42 68.23 18.45 14.49 1607.6 4423.4
2664744.27 1540566.34 57.81 17.68 15.37 821.5 2952.4
BalaghatBarwaniBetulBhindBhopalChhatarpurChhindwaraDamoh DatiaDewasDharDindoriEast Nimar (Khandwa)GunaGwaliorHardaHoshangabadIndoreJabalpurJhabuaKatniMandlaMandsaurMorenaNarsimhapurNeemuchPannaRaisenRajgarhRatlamRewaSagarSatnaSehoreSeoniShahdolShajapurSheopurShivpuriSidhiTikamgarhUjjainUmariaVidishaWest Nimar (Khargone)
Madhya Pradesh
1998-999 Average Agricultural Credit
Deposits Advances (1199-2000) given per hectare of
Credit % Growth in % Growth in Gross Cropped IrrigatedDeposit Ratio Deposits Advances Area Area
District
Source: Madhya Pradesh State Focus paper, 2001-02, National Bank for Agriculture and Rural Development, Bhopal
(Amount in Rs. lakhs)

410
Table GE 1 gives information on the Total Population, Population in
the age group of 0-6 years and Population in 7+ age groups. Based
on it the Overall Gender Ratio, Juvenile Sex Ratio and Sex Ratio in
the 7+ age groups are presented. The districts are ranked on
based on all the above. The changes in Overall Gender Ratio,
Juvenile Sex Ratio, and Sex Ratio in 7+ age groups between 1991
and 2001 are also calculated and the districts ranked based on the
above.
GENDER
Overall Gender Ratio and Juvenile Sex
Ratio 2001: Madhya Pradesh and India
Overall Gender Ratio Juvenile Sex Ration
920
933
929927
935
930
925
920
915
910
Madhya Pradesh India
Source: Census of India 2001
Fem
ales
per
th
ousa
nd
mal
es
OVERALL GENDER RATIO
Overall Gender Ratio is the number of females in a populationfor every 1000 males. It is calculated by multiplying the femalepopulation in an area by 1000, and dividing this number bythe male population in that area.
JUVENILE SEX RATIO
Juvenile Sex Ratio is the number of females in the age groupof 0-6 years in a population for every 1000 males in the sameage group. It is calculated by multiplying the female popula-tion in the age group of 0-6 years in an area by 1000, anddividing this number by the male population in the age groupof 0-6 years in that area.
SEX RATIO IN 7+ AGE GROUP
Sex Ratio in the 7+ age group is the number of females in theage group of 7+ years in a population for every 1000 males inthe same age group. It is calculated by multiplying the femalepopulation in the age group of 7+ years in an area by 1000,and dividing this number by the male population in the agegroup of 7+ years in that area.
CHANGE
Change in Gender Ratio between two points of time.
Year Madhya Pradesh India
Overall Gender Ratio 2001 920 933
Juvenile Sex Ratio 2001 929 927
Sex Ratio in age group 7+ years 2001 905
SECTORAL FACTSHEET

411
GE 1: POPULATION AND SEX RATIO IN DIFFERENT AGE GROUPS IN DISTRICTS OF MADHYA PRADESH
1445760 714938 730822 218596 110719 1078771081039 547837 533202 240538 122132 1184061394421 709525 684896 230225 116965 1132601426951 780122 646829 247881 135553 1123281836784 968964 867820 282284 146186 1360981474633 788845 685788 284631 148218 1364131848882 946582 902300 292830 149277 1435531081909 568704 513205 191638 98335 93303
627818 337842 289976 106833 56982 498511306617 676414 630203 228631 118195 1104361740577 890853 849724 334269 172222 162047
579312 290572 288740 95513 48017 474961708170 882371 825799 302400 155547 1468531665503 883433 782070 320800 166278 1545221629881 882258 747623 248337 134299 114038
474174 247129 227045 84952 44104 408481085011 571796 513215 172326 89423 829032585321 1352849 1232472 366526 191608 1749182167469 1134870 1032599 301227 156498 1447291396677 701742 694935 314541 159649 1548921063689 548077 515612 186455 95565 90890
893908 446487 447421 143700 72368 713321183369 604942 578427 193750 99573 941771587264 871243 716021 290670 158897 131773
957399 501407 455992 150158 78333 71825725457 371972 353485 114370 59323 55047854235 447923 406312 167421 86673 80748
1120159 595730 524429 208148 107112 1010361253246 648850 604396 229273 117960 1113131214536 620119 594417 213248 108793 1044551972333 1017402 954931 367825 190983 1768422021783 1073032 948751 364967 189146 1758211868648 970114 898534 338527 175428 1630991078769 565387 513382 204334 105625 987091165893 588135 577758 193281 97636 956451572748 803416 769332 264989 134505 1304841290230 669419 620811 231765 119691 112074
559715 295630 264085 110469 57202 532671440666 775473 665193 276520 144863 1316571830553 947276 883277 373889 191719 1821701203160 637842 565318 223003 116238 1067651709885 881509 828376 276442 142995 133447
515851 264998 250853 95643 48788 468551214759 647632 567127 229353 118071 1112821529954 785212 744742 287618 146158 141460
60385118 31456873 28928245 10618323 5504422 5113901
BalaghatBarwaniBetulBhindBhopalChhatarpurChhindwaraDamoh DatiaDewasDharDindoriEast Nimar (Khandwa)GunaGwaliorHardaHoshangabadIndoreJabalpurJhabuaKatniMandlaMandsaurMorenaNarsimhapurNeemuchPannaRaisenRajgarhRatlamRewaSagarSatnaSehoreSeoniShahdolShajapurSheopurShivpuriSidhiTikamgarhUjjainUmariaVidishaWest Nimar (Khargone)Madhya Pradesh
Total Population Population in Age-Group 0-6
Persons Males Females Persons Males Females
District
Source: Census of India 2001, Madhya Pradesh, Series-24

412
GE 1: POPULATION AND SEX RATIO IN DIFFERENT AGE GROUPS IN DISTRICTS OF MADHYA PRADESH
1227164 604219 622945 1002 1 1022 1840501 425705 414796 964 7 973 6
1164196 592560 571636 966 6 965 71179070 644569 534501 889 33 829 331554500 822778 731722 816 44 896 441190002 640627 549375 856 40 869 401556052 797305 758747 953 8 953 12
890271 470369 419902 905 28 902 31520985 280860 240125 847 42 858 41
1077986 558219 519767 924 20 932 211406308 718631 687677 951 9 954 11
483799 242555 241244 993 2 994 31405770 726824 678946 938 17 936 191344703 717155 627548 875 37 885 361381544 747959 633585 831 43 847 43
389222 203025 186197 914 25 919 25912685 482373 430312 892 32 898 32
2218795 1161241 1057554 906 27 911 261866242 978372 887870 903 29 910 271082136 542093 540043 977 4 990 4
877234 452512 424722 939 16 941 16750208 374119 376089 983 3 1002 2989619 505369 484250 947 11 956 10
1296594 712346 584248 808 45 822 45807241 423074 384167 913 26 909 28611087 312649 298438 943 12 950 13686814 361250 325564 897 31 907 30912011 488618 423393 879 36 880 38
1023973 530890 493083 923 21 931 221001288 511326 489962 948 10 959 81604508 826419 778089 932 18 939 181656816 883886 772930 881 34 884 371530121 794686 735435 918 23 926 24
874435 459762 414673 898 30 908 29972612 490499 482113 974 5 982 5
1307759 668911 638848 940 15 958 91058465 549728 508737 918 24 927 23
449246 238428 210818 880 35 893 341164146 630610 533536 849 41 858 421456664 755557 701107 922 22 932 20
980157 521604 458553 871 39 886 351433443 738514 694929 929 19 940 17
420208 216210 203998 942 13 947 15985406 529561 455845 874 38 876 39
1242336 639054 603282 941 14 948 1449766795 25952451 23814344 912 920
BalaghatBarwaniBetulBhindBhopalChhatarpurChhindwaraDamoh DatiaDewasDharDindoriEast Nimar (Khandwa)GunaGwaliorHardaHoshangabadIndoreJabalpurJhabuaKatniMandlaMandsaurMorenaNarsimhapurNeemuchPannaRaisenRajgarhRatlamRewaSagarSatnaSehoreSeoniShahdolShajapurSheopurShivpuriSidhiTikamgarhUjjainUmariaVidishaWest Nimar (Khargone)Madhya Pradesh
Population in Age-Group 7+ Gender Ratio
Rank in Rank inPersons Males Females 1991 1991 2001 2001
District
Source: Census of India 2001, Madhya Pradesh, Series-24

413
GE 1: POPULATION AND SEX RATIO IN DIFFERENT AGE GROUPS IN DISTRICTS OF MADHYA PRADESH
20 1 975 8 974 35 -1 439 20 982 3 969 4 -13 30
-1 42 980 4 968 5 -12 296 30 850 27 829 26 -22 21
13 7 938 45 931 45 -7 3513 10 919 38 920 36 1 11
1 40 965 12 962 7 -4 17-3 44 930 33 949 12 19 211 11 899 42 875 41 -24 368 25 932 30 934 22 2 103 36 970 10 941 18 -29 411 41 980 5 989 1 9 6
-2 43 951 17 944 14 -6 2010 17 932 31 929 29 -2 1516 4 888 43 849 43 -38 42
4 34 938 26 926 32 -12 285 31 929 34 927 31 -2 145 32 940 23 913 39 -27 387 29 951 16 925 34 -26 37
13 9 991 1 970 21 -21 441 38 959 14 951 10 -8 24
19 2 978 6 986 42 8 4510 18 949 18 946 13 -4 1614 6 857 44 829 44 -28 40-3 45 924 37 917 38 -7 227 27 948 20 928 30 -20 34
11 14 948 19 932 24 -17 331 39 928 36 943 16 16 38 24 931 32 944 15 12 5
10 16 961 13 960 9 -1 137 28 935 29 926 33 -9 253 35 935 28 930 28 -5 198 23 939 24 930 27 -9 26
10 15 915 40 935 20 19 19 22 972 9 980 2 8 8
18 3 986 2 970 3 -16 329 19 928 35 936 19 9 7
13 8 941 22 931 25 -10 279 21 914 41 909 40 -5 18
11 13 977 7 950 11 -27 3915 5 918 39 919 37 1 1211 12 946 21 933 23 -13 315 33 968 11 960 8 -7 232 37 939 25 943 17 3 98 26 954 15 968 6 14 47 941 929 -12
BalaghatBarwaniBetulBhindBhopalChhatarpurChhindwaraDamoh DatiaDewasDharDindoriEast Nimar (Khandwa)GunaGwaliorHardaHoshangabadIndoreJabalpurJhabuaKatniMandlaMandsaurMorenaNarsimhapurNeemuchPannaRaisenRajgarhRatlamRewaSagarSatnaSehoreSeoniShahdolShajapurSheopurShivpuriSidhiTikamgarhUjjainUmariaVidishaWest Nimar (Khargone)Madhya Pradesh
Juvenile Sex Ratio
Ranking Rank in Rank in RankingChange by Change 1991 1991 2001 2001 Change by Change
District
Source: Census of India 2001, Madhya Pradesh, Series-24

414
GE 1: POPULATION AND SEX RATIO IN DIFFERENT AGE GROUPS IN DISTRICTS OF MADHYA PRADESH
1008 1 1031 1 33 3959 7 974 6 16 15962 6 965 7 2 39879 33 829 33 10 26807 44 889 44 22 7840 40 858 40 17 13949 8 952 13 2 40899 27 893 31 -7 45835 41 855 41 20 10921 20 931 20 10 27946 9 957 10 11 24997 2 995 4 -2 43934 16 934 19 0 41861 37 875 36 14 16819 43 847 42 28 4908 25 917 25 9 29884 31 892 32 8 33899 28 911 26 12 23893 29 907 28 14 18973 5 996 3 35 2935 15 939 18 4 37984 3 1005 2 52 1946 10 958 9 12 22795 45 820 45 25 6910 24 908 27 -2 44942 12 955 12 12 21883 32 901 30 18 12867 35 867 38 -1 42921 21 929 21 7 34946 11 958 8 13 20931 17 942 16 11 25867 34 874 37 7 35913 23 925 23 13 19893 30 902 29 9 31974 4 983 5 9 30929 18 955 11 26 5916 22 925 24 10 28863 36 884 34 21 9832 42 846 43 14 17906 26 928 22 22 8859 38 879 35 20 11925 19 941 17 16 14935 14 944 15 9 32858 39 861 39 3 38937 13 944 14 7 36905 918 12
BalaghatBarwaniBetulBhindBhopalChhatarpurChhindwaraDamoh DatiaDewasDharDindoriEast Nimar (Khandwa)GunaGwaliorHardaHoshangabadIndoreJabalpurJhabuaKatniMandlaMandsaurMorenaNarsimhapurNeemuchPannaRaisenRajgarhRatlamRewaSagarSatnaSehoreSeoniShahdolShajapurSheopurShivpuriSidhiTikamgarhUjjainUmariaVidishaWest Nimar (Khargone)Madhya Pradesh
Age 7+ Sex Ratio
Rank in Rank in Ranking1991 1991 2001 2001 Change by Change
District
Source: Census of India 2001, Madhya Pradesh, Series-24

415
Table GE 2 gives information on the Gender Ratio in the districts
of Madhya Pradesh in the last 10 decades and the changes in
Gender Ratio between 1981-1991 and 1991-2001. The percentage
change in Gender Ratio between 1991 and 2001 is also calculated.
The table also ranks the districts based on their Gender Ratio
in 2001.
GE 2: GENDER RATIO OVER 100 YEARS IN DISTRICTS OF MADHYA PRADESH
GENDER RATIO
Gender ratio is the number of females in a population forevery 1000 males. It is calculated by multiplying the femalepopulation in an area by 1000, and dividing this number bythe male population in that area.
CHANGE
Change in gender ratio between two points of time
% CHANGE
The change in gender ratio between two points of timeexpressed as a percent of the gender ratio of the earlier timeperiod
Source: Census of India 2001
Year Madhya Pradesh India
Gender Ratio 2001 920 933
Change between 1991 and 2001
(in points) 8 6
Gender Ratio Over 100 Years:
Madhya Pradesh and India19
01
1911
1921
1931
1941
1951
1961
1971
1981
1991
2001
935
930
925
920
915
910
Madhya Pradesh India Linear (Madhya Pradesh
Fem
ales
per
th
ousa
nd
mal
es
CENSUS YEAR

416
GE 2: SEX RATIO OVER 100 YEARS IN DISTRICTS OF MADHYA PRADESH
1065 1037 1032 1028 1021 989 1009 1000967 961 957 970 974 968 967
1040 1011 1025 1020 1003 997 994 982851 835 835 839 843 849 834937 903 897 881 895 816 840
943 943 923 920 911 893 891 8641046 1020 1026 1011 997 995 980 968
988 982 954 974 981 980 965 941935 922 912 914 912 903 882986 941 946 947 960 937 929
1004 987 979 971 963 962 9621028 1017 1011 1015 1010 1011 1011 999
948 948 930 929 946 948 939 934918 908 901 905 919 899 884861 822 834 853 885 853 834
996 981 965 957 972 957 955 9391007 985 967 962 968 956 925 902
891 848 838 861 900 882 8801019 977 953 953 905 914 897 887
1001 971 958 956 949 958 9691041 1031 1016 1010 996 989 975 9651027 1017 1012 1013 1008 1048 1002 994
946 949 947 941 945 940 925 925843 819 823 830 832 831 822
1040 1013 990 992 972 969 952 926927 944 950 944 941 967 924 920990 974 966 968 965 941 938 923
993 952 952 933 913 907 900928 906 906 912 924 917 907961 948 946 957 966 941 941
1014 1012 1012 992 996 979 987 973973 960 941 942 979 934 920 892
1041 1034 1016 1006 986 976 965 950962 928 929 919 922 914 905
1069 1053 1045 1046 1030 1015 1006 9861004 1018 999 996 987 969 963 953
942 932 927 946 966 943 931854 829 831 837 908 861 886912 892 899 903 908 888 864
999 1006 1000 995 987 971 977 961941 957 932 926 921 911 906 877
920 918 913 935 952 921 918994 1012 996 992 987 968 936 962939 940 908 917 905 915 890 882
962 956 952 966 969 951 939972 967 949 947 946 945 932 920
BalaghatBarwaniBetulBhindBhopalChhatarpurChhindwaraDamoh DatiaDewasDharDindoriEast Nimar (Khandwa)GunaGwaliorHardaHoshangabadIndoreJabalpurJhabuaKatniMandlaMandsaurMorenaNarsimhapurNeemuchPannaRaisenRajgarhRatlamRewaSagarSatnaSehoreSeoniShahdolShajapurSheopurShivpuriSidhiTikamgarhUjjainUmariaVidishaWest Nimar (Khargone)Madhya Pradesh
Gender Gender Gender Gender Gender Gender Gender GenderRatio in Ratio in Ratio in Ratio in Ratio in Ratio in Ratio in Ratio in
1901 1911 1921 1931 1941 1951 1961 1971
District
Source: Census of India 2001, Madhya Pradesh, Series-24

417
GE 2: SEX RATIO OVER 100 YEARS IN DISTRICTS OF MADHYA PRADESH
1006 1002 -4 1022 20 2.00% 1969 964 -5 973 9 0.93% 21973 966 -7 965 -1 -0.10% 42827 816 -11 829 13 1.59% 6874 889 15 895 6 0.67% 29864 856 -8 869 13 1.52% 7965 953 -12 953 0 0.00% 41925 905 -20 902 -3 -0.33% 44854 847 -7 858 11 1.30% 10929 924 -5 931 7 0.76% 26966 951 -15 953 2 0.21% 37999 985 -14 993 8 0.81% 25939 938 -1 935 -3 -0.32% 43882 875 -7 885 10 1.14% 12844 831 -13 847 16 1.93% 2930 914 -16 918 4 0.44% 34899 892 -7 897 5 0.56% 32898 906 8 911 5 0.55% 33894 903 9 909 6 0.66% 30985 977 -8 990 13 1.33% 9956 939 -17 940 1 0.11% 40
1006 990 -16 1002 12 1.21% 11941 947 6 956 9 0.95% 19817 808 -9 821 13 1.61% 5930 913 -17 909 -4 -0.44% 45940 943 3 950 7 0.74% 28913 897 -16 907 10 1.11% 13908 879 -29 880 1 0.11% 39931 923 -8 931 8 0.87% 23948 948 0 958 10 1.05% 17969 932 -37 938 6 0.64% 31891 881 -10 884 3 0.34% 36936 918 -18 926 8 0.87% 22907 898 -9 908 10 1.11% 14982 974 -8 982 8 0.82% 24944 940 -4 957 17 1.81% 3929 918 -11 927 9 0.98% 18887 880 -7 893 13 1.48% 8855 849 -6 857 8 0.94% 20951 922 -29 932 10 1.08% 15883 871 -12 886 15 1.72% 4926 929 3 939 10 1.08% 16963 942 -21 946 4 0.42% 35881 874 -7 875 1 0.11% 38944 941 -3 948 7 0.74% 27921 912 -9 920 8 0.88%
BalaghatBarwaniBetulBhindBhopalChhatarpurChhindwaraDamoh DatiaDewasDharDindoriEast Nimar (Khandwa)GunaGwaliorHardaHoshangabadIndoreJabalpurJhabuaKatniMandlaMandsaurMorenaNarsimhapurNeemuchPannaRaisenRajgarhRatlamRewaSagarSatnaSehoreSeoniShahdolShajapurSheopurShivpuriSidhiTikamgarhUjjainUmariaVidishaWest Nimar (Khargone)Madhya Pradesh
Gender Gender GenderRatio in Ratio in Change from Ratio in Change from 1991 to 2001
1981 1991 1981 to 1991 2001 Change % age Change Rank
District
Source: Census of India 2001, Madhya Pradesh, Series-24

418
Table GE 3 gives the indicators of literacy rates, infant mortality
rates and life expectancy at birth segregated by sex and the
gender ratio in order to present the male-female differential
in human development.
GE 3: MALE FEMALE DIFFERENTIALS IN HUMAN DEVELOPMENT IN DISTRICTS
OF MADHYA PRADESH
GENDER RATIO
Gender ratio is the number of females in a population forevery 1000 males. It is calculated by multiplying the femalepopulation in an area by 1000, and dividing this number bythe male population in that area.
LITERACY RATE
Literacy rate is calculated as a percentage of the of literate population over population above the age of 7 years.
INFANT MORTALITY RATE
The annual number of deaths of infants less than one year ofage per 1000 live births. More specifically, the probability ofdying between birth and exactly one year of age times 1000.
LIFE EXPECTANCY (IN YEARS AT BIRTH)Life expectancy is the number of years a newborn would liveif the current mortality conditions (i.e. age-specific mortalityrate) prevailed throughout its life.
Source: Census of India 2001 for Gender Ratio and Literacy Rate, SRS Bulletin,
Volume 35 No. 1, RGI for Infant Mortality Rate and Compendium of India’s
Fertility and Mortality Indicators 1971-1997 for Life Expectancy at Birth.
Year Madhya Pradesh India
Gender Ratio 2001 920 933
Literacy Rate 2001
Male 76.80% 75.96%
Female 50.3% 54.28%
Infant Mortality Rate 1999
Male 89.6 69.8
Female 89.5 70.8
Life Expectancy at Birth 1992-96
Male 55.1 60.1
Female 54.7 61.4

419
GE 3: MALE FEMALE DIFFERENTIALS IN HUMAN DEVELOPMENT IN DISTRICTS OFMADHYA PRADESH
1022 67.63 38.95 81.09 57.02965 57.42 33.90 77.31 56.05829 66.20 28.20 84.06 55.73896 73.14 54.17 82.56 66.67869 46.87 21.32 65.50 39.38953 56.65 32.52 76.70 54.82902 60.49 30.46 75.05 47.51858 62.50 24.45 82.94 62.48932 61.15 25.57 76.07 44.90954 47.62 20.71 66.18 38.62936 58.53 31.53 74.09 48.46885 48.86 17.99 74.70 43.06847 70.87 43.08 80.83 56.76898 67.19 39.29 81.36 58.02919 62.54 33.76 78.45 54.14911 77.99 53.35 84.32 63.96910 75.64 52.29 91.40 59.47941 63.97 30.53 79.88 48.48990 26.29 11.52 48.75 25.50
1002 50.45 23.48 76.71 45.39994 55.05 20.21 70.41 38.48956 66.98 27.24 85.77 54.87950 69.34 30.04 83.04 49.12822 63.53 23.79 80.97 46.81893 40.73 12.27 62.19 28.99909 68.44 41.59 86.79 69.02907 46.29 19.41 74.02 47.84880 54.02 25.47 82.18 61.89931 46.73 15.62 69.53 37.37959 58.36 19.13 80.10 54.66939 60.67 26.88 75.97 47.83884 67.02 37.78 79.96 54.50926 60.03 27.80 77.82 51.40908 56.90 21.99 78.14 47.95982 57.50 31.14 77.50 54.06958 48.93 20.93 69.55 45.40947 46.85 17.43 74.11 45.57927 56.99 19.77 83.68 57.58858 47.50 15.64 74.78 41.54932 43.23 13.61 68.03 36.43886 47.52 19.96 68.83 40.98940 64.25 32.64 83.70 57.87876 58.04 27.81 74.71 47.45948 55.43 26.09 75.23 50.89973 36.77 19.01 51.09 31.35920 58.54 29.35 76.80 50.28
BalaghatBetulBhindBhopalChhatarpurChhindwaraDamohDatiaDewasDharEast Nimar (Khandwa)GunaGwaliorHoshangabadHardaIndoreJabalpurKatniJhabuaMandlaDindoriMandsaurNeemuchMorenaSheopurNarsimhapurPannaRaisenRajgarhRatlamRewaSagarSatnaSehoreSeoniShahdolUmariaShajapurShivpuriSidhiTikamgarhUjjainVidishaWest Nimar (Khargone)BarwaniMadhya Pradesh
Literacy RatesGender Ratio
1991 20012001Male Female Male Female
District
Source: Census of India 1991, F-Series, Madhya Pradesh
Census of India 2001, Madhya Pradesh

420
GE 3: MALE FEMALE DIFFERENTIALS IN HUMAN DEVELOPMENT IN DISTRICTS OFMADHYA PRADESH
108 111 56.2 55.6126 129 52.2 51.7
83 122 62 53.372 69 64.6 65.3
135 165 50.3 44.497 109 58.8 56
124 120 52.8 53.6106 125 56.8 52.5105 97 61.6 58.8
91 88 62.2 60.8102 98 57.6 58.6117 143 54.2 48.768 75 65.5 63.9
103 116 57.3 54.5Included in Hoshangabad
86 83 66 61.9106 95 56.8 59.2
Included in Jablapur115 145 54.7 48.492 85 60.5 61.5
Included in Mandla103 106 57.3 56.8
Included in Mandsaur89 112 60.5 55.54
Included in Morena101 119 57.9 53.9123 143 53 48.8127 120 52 53.7
84 130 61.8 51.4105 95 56.8 59.2119 137 53.8 49.9118 115 54.1 54.7136 150 50.1 47.4129 114 51.8 54.9
98 99 58.5 58.3114 106 55 56.8
Included in Shahdol108 102 56.2 57.7149 180 47.5 41.4104 107 57.1 56.5112 154 55.4 46.592 107 60 56.6
119 131 53.9 51.3100 108 58.1 56.2
Included in West Nimar101 106 57.9 56.6
BalaghatBetulBhindBhopalChhatarpurChhindwaraDamoh DatiaDewasDharEast Nimar (Khandwa)GunaGwaliorHoshangabadHardaIndoreJabalpurKatniJhabuaMandlaDindoriMandsaurNeemuchMorenaSheopurNarsimhapurPannaRaisenRajgarhRatlamRewaSagarSatnaSehoreSeoniShahdolUmariaShajapurShivpuriSidhiTikamgarhUjjainVidishaWest Nimar (Khargone)BarwaniMadhya Pradesh
Infant Mortality Rate (per 1000 Life Expectancy (in years at live births) birth
1991 1991
Male Female Male Female
District
Source: Census of India 1991, F-Series, Madhya Pradesh
Census of India 2001, Madhya Pradesh

421
Table GE 4 shows the Participation of Women in Economic
Activities as per the 1991 and 2001 census. The Table shows
percentage of Women Main Workers in all Main Workers and the
share of Women Workers in each of the major categories of
Cultivators, Agricultural Labourers, Workers in Household Industry
and Other Workers.
GE 4: PARTICIPATION OF WOMEN IN ECONOMIC ACTIVITIES, 1991
WOMEN MAIN WORKERS SHARE OF ALL MAIN WORKERS
Census records a person as a Main worker if he/ she hasworked for a major part of the year preceding the enumera-tion. Women main workers as share of all Main Workers givesthe percentage of women main workers over all main workers.
WOMEN CULTIVATORS AS SHARE OF ALL CULTIVATORS
For purpose of census a person is working as cultivator if heor she is engaged as employer, single worker or family workerin cultivation of land owned or held from government or heldfrom private person or institutions for payment in money,kind or share. Cultivation includes agriculture operations forall produce except fruit growing, vegetable growing, or keep-ing of orchards or groves or working of plantations. Womencultivators as share of all cultivators gives the percentage ofwomen cultivators over all cultivators.
WOMEN AGRICULTURE LABOURERS AS SHARE OF ALL AGRICULTURE
LABOURERS
Person working on another persons land for wages in money,kind or share are enumerated as agricultural labourers. Anagricultural labourer has no risk in the cultivation and he hasno right of lease or contract on land on which he works.
Women agricultural labourers as share of all agriculturelabourers gives the percentage of women agricultural labourers over all agricultural labourers.
WOMEN WORKERS IN HOUSEHOLD INDUSTRY AS SHARE OF ALL
WORKERS IN HOUSEHOLD INDUSTRY
(Manufacturing, Processing, Servicing and Repairs inHousehold Industry): Persons working in an industry locatedat home or within the village in rural areas and only within theprecincts of the house where the household lives in urbanareas. Women workers in household industry as share of allworkers in household industry gives the percentage of womenworkers in household industry over all workers in houseboldindustry.
WOMEN OTHER WORKERS AS SHARE OF ALL OTHER WORKERS
Other categories include Mining and Quarrying, Non house-hold Industry, Construction, Trade and Commerce,Transport, Storage and Communications, Other Services.Women workers in other categories as share of all workers inother categories gives the percentage of women worker inother categories over all workers in other categories.

422
GE 4: PARTICIPATION OF WOMEN IN ECONOMIC ACTIVITIES-1991
37.97% 34.94% 38.66% 46.17% 47.70%31.93% 34.86% 30.26% 45.92% 47.97%36.51% 28.82% 36.26% 37.34% 57.21%
3.77% 15.67% 2.01% 20.97% 12.66%16.28% 16.66% 16.47% 32.32% 36.15%20.34% 20.92% 16.71% 32.71% 39.93%29.47% 26.25% 27.19% 36.03% 51.18%24.16% 24.54% 9.89% 23.26% 34.17%14.62% 26.77% 12.16% 40.83% 35.37%28.55% 28.21% 26.61% 40.99% 46.12%35.29% 31.60% 35.71% 43.79% 50.17%40.46% 43.69% 38.39% 46.85% 55.54%31.94% 31.83% 30.56% 37.75% 49.59%14.08% 19.32% 8.30% 28.93% 34.64%
9.59% 12.99% 5.91% 22.59% 27.27%25.71% 24.37% 18.49% 38.32% 42.40%19.11% 16.12% 11.54% 19.63% 37.29%19.84% 19.72% 28.29% 39.15% 45.86%22.52% 21.65% 22.77% 27.46% 43.22%31.02% 36.47% 31.52% 48.03% 51.34%26.24% 23.18% 21.74% 30.90% 45.36%41.22% 38.15% 40.66% 43.34% 56.12%32.85% 32.76% 34.12% 42.36% 50.55%
7.36% 16.42% 7.88% 22.79% 14.34%24.83% 23.25% 15.52% 23.85% 40.80%35.89% 34.30% 41.78% 46.17% 52.39%21.89% 24.29% 15.31% 33.66% 39.88%20.52% 17.11% 10.46% 18.72% 34.71%24.48% 30.88% 21.76% 44.12% 46.00%30.64% 27.60% 33.36% 39.54% 51.51%30.31% 29.96% 27.15% 44.32% 44.77%23.61% 23.44% 12.68% 21.28% 29.56%28.88% 26.72% 24.98% 34.23% 44.99%27.57% 24.12% 24.08% 37.21% 43.99%34.64% 30.95% 31.85% 41.02% 48.06%26.94% 25.39% 23.62% 35.22% 51.24%28.00% 25.61% 24.73% 42.34% 44.81%18.94% 16.29% 17.81% 32.63% 36.40%20.06% 28.25% 18.89% 39.05% 43.02%27.14% 26.92% 26.17% 40.21% 41.72%23.21% 24.55% 22.65% 40.51% 41.67%26.07% 28.28% 26.49% 41.94% 46.88%29.32% 25.44% 25.25% 33.46% 49.72%17.41% 15.39% 9.63% 18.34% 31.12%34.99% 36.02% 33.98% 43.94% 49.56%26.33% 26.19% 24.74% 37.29% 44.42%
BalaghatBarwaniBetulBhindBhopalChhatarpurChhindwaraDamoh DatiaDewasDharDindoriEast Nimar (Khandwa)GunaGwaliorHardaHoshangabadIndoreJabalpurJhabuaKatniMandlaMandsaurMorenaNarsimhapurNeemuchPannaRaisenRajgarhRatlamRewaSagarSatnaSehoreSeoniShahdolShajapurSheopurShivpuriSidhiTikamgarhUjjainUmariaVidishaWest Nimar (Khargone)Madhya Pradesh
Women AgriculturalWomen main Workers: Women main Workers: Women Cultivators: Women Cultivators: Labourers: share of all
share of all share of all share of all share of all AgriculturalMain Workers Main Workers Cultivators Cultivators Labourers
1991 2001 1991 2001 1991
District
Source: Census of India 1991

423
GE 4: PARTICIPATION OF WOMEN IN ECONOMIC ACTIVITIES-1991
57.85% 42.99% 53.81% 18.27% 19.79%54.91% 26.86% 37.68% 11.70% 18.92%58.53% 25.61% 33.79% 10.00% 15.49%40.76% 6.80% 49.38% 3.82% 31.82%47.61% 35.85% 39.77% 13.54% 15.68%54.15% 29.05% 49.28% 7.93% 15.28%56.24% 21.75% 30.13% 10.03% 15.60%42.83% 49.81% 64.29% 18.55% 18.90%54.78% 22.41% 49.04% 7.34% 22.79%54.42% 22.85% 33.88% 8.27% 12.60%56.02% 26.41% 33.71% 11.27% 14.68%57.27% 22.75% 42.19% 15.96% 24.26%52.15% 24.03% 33.92% 10.35% 13.37%52.21% 26.56% 47.57% 10.20% 14.37%47.84% 33.36% 46.17% 7.94% 11.47%51.39% 19.62% 32.49% 7.16% 11.74%44.37% 25.05% 34.91% 10.42% 14.54%51.54% 32.10% 30.60% 11.31% 14.64%47.39% 36.04% 52.32% 11.79% 15.23%63.10% 23.73% 41.75% 13.92% 29.76%53.10% 33.93% 54.29% 13.25% 16.88%57.94% 27.87% 39.64% 12.62% 21.71%56.53% 27.39% 31.63% 9.26% 13.56%40.56% 13.28% 51.54% 3.19% 34.07%46.46% 23.97% 37.57% 10.90% 17.19%56.78% 28.97% 36.97% 7.92% 12.20%52.73% 27.43% 44.32% 13.24% 23.14%40.75% 31.86% 53.05% 12.58% 15.54%59.39% 23.71% 37.33% 7.69% 14.25%60.21% 26.60% 30.39% 9.97% 14.03%51.45% 32.62% 43.60% 8.50% 14.98%39.16% 52.76% 62.26% 9.16% 14.16%50.57% 45.40% 56.66% 10.63% 15.89%53.06% 22.21% 31.68% 9.43% 13.57%57.13% 21.54% 34.42% 12.08% 17.98%57.31% 21.53% 37.38% 6.83% 15.26%55.79% 25.38% 36.51% 7.59% 12.49%54.03% 25.46% 43.72% 5.84% 19.34%54.95% 16.89% 38.50% 8.04% 14.40%53.22% 24.11% 34.05% 6.87% 12.55%60.37% 26.48% 51.34% 8.71% 20.36%55.27% 30.01% 40.47% 10.59% 14.60%54.80% 28.44% 39.76% 9.28% 16.96%40.83% 26.05% 45.57% 11.22% 14.28%52.62% 24.59% 32.65% 10.35% 13.92%52.77% 37.04% 50.36% 10.44% 16.29%
BalaghatBarwaniBetulBhindBhopalChhatarpurChhindwaraDamoh DatiaDewasDharDindoriEast Nimar (Khandwa)GunaGwaliorHardaHoshangabadIndoreJabalpurJhabuaKatniMandlaMandsaurMorenaNarsimhapurNeemuchPannaRaisenRajgarhRatlamRewaSagarSatnaSehoreSeoniShahdolShajapurSheopurShivpuriSidhiTikamgarhUjjainUmariaVidishaWest Nimar (Khargone)Madhya Pradesh
Women in Household Women inHouseholdWomen Agricultural Industries : share of all Industries: share of all Women Other Workers: Women Other Workers:Labourers: share of all Workers in Household Workers in Household Share of all Other Share of all OtherAgricultural Labourers Industies Industries Workers Workers
2001 1991 2001 1991 2001
District
Source: Census of India 1991

424
Table GL 1 presents the demographic information on total
population, sex ratio, decadal growth rate and population density
for Indian States and Union Territories. The share of each states
population in India is also presented in the table
GENERAL
Madhya Pradesh- Share of India's
Land Area and Population
1991 2001
12.00
10.00
8.00
6.00
4.00
2.00
0.00
Share of India’s Land Area Share of India’s Population
Per
cen
tage
SHARE OF NATIONAL POPULATION
This is taken as the percentage population of state or Union
Territory over that of India.
SEX RATIO
This gives the number of females in population for thousand
males. It is calculated by dividing the female population by
male population and multiplying the quotient by 1000.
DECADAL GROWTH RATE
This is the growth of population in a decade and is calculated
as a percentage of change in population to total population.
POPULATION DENSITY
Population density is obtained by dividing the population of
the district by total geographical area in sq. kms.
SECTORAL FACTSHEET

425
101387 3.2% 10069917 0.98% 5300574
55673 1.8% 6077248 0.59% 3085256
50362 1.6% 24289296 2.37% 12963362
114 0.0% 900914 0.09% 508224
53483 1.7% 8479562 0.83% 4316401
44212 1.4% 21082989 2.05% 11327658
1483 0.0% 13782976 1.34% 7570890
342239 10.8% 56473122 5.50% 29381657
240928 7.6% 166052859 16.17% 87466301
94163 3.0% 82878796 8.07% 43153964
7096 0.2% 540493 0.05% 288217
83743 2.6% 1091117 0.11% 573951
16579 0.5% 1988636 0.19% 1041686
22327 0.7% 2388634 0.23% 1207338
21081 0.7% 891058 0.09% 459783
10486 0.3% 3191168 0.31% 1636138
22429 0.7% 2306069 0.22% 1167840
78438 2.5% 26638407 2.59% 13787799
88752 2.8% 80221171 7.81% 41487694
79714 2.5% 26909428 2.62% 13861277
155707 4.9% 36706920 3.57% 18612340
135191 4.3% 20795956 2.02% 10452426
308245 9.7% 60385118 5.88% 31456873
196024 6.2% 50596992 4.93% 26344053
112 0.0% 158059 0.02% 92478
491 0.0% 220451 0.02% 121731
307713 9.7% 96752247 9.42% 50334270
275045 8.7% 75727541 7.37% 38286811
191791 6.1% 52733958 5.13% 26856343
3702 0.1% 1343998 0.13% 685617
32 0.0% 60595 0.01% 31118
38863 1.2% 31838619 3.10% 15468664
130058 4.1% 62110839 6.05% 31268654
492 0.0% 973829 0.09% 486705
8249 0.3% 356265 0.03% 192985
3166404 1027015247 531277078
Jammu & Kashmir2,3
Himachal Pradesh4
Punjab
Chandigarh*
Uttaranchal
Haryana
Delhi*
Rajasthan
Uttar Pradesh
Bihar
Sikkim
Arunachal Pradesh
Nagaland
Manipur
Mizoram
Tripura
Meghalaya
Assam
West Bengal
Jharkhand
Orissa
Chhatisgarh
Madhya Pradesh
Gujarat5
Daman & Diu*
Dadra & Nagar Haveli*
Maharashtra
Andhra Pradesh
Karnataka
Goa
Lakshadweep*
Kerala
Tamil Nadu
Pondicherry*
Andaman & Nicobar Islands*
INDIA1,2
Geographical Area Total Population
Area (in sq. kms.) Share of India Persons Share of MaleNational
Population
State/ Union Territory *
GL 1: POPULATION, SEX RATIO, POPULATION DENSITY AND DECADAL GROWTH RATE OFPOPULATION IN INDIAN STATES AND UNION TERRITORIES, 2001
1. The population of India includes the estimated population of entire Kachchh district, Morvi, Maliya-Miyana and Wankaner talukas of Rajkot district, Jodiya taluka of Jamnagar district of GujaratState and entire Kinnaur district of Himachal Pradesh where population enumeration of Census of India 2001 could not be conducted due to natural calamities.
2. For working out the density of India and Jammu & Kashmir the entire area and population of those areas of Jammu & Kashmir which are under illegal occupation of Pakistan and Chinahave not been taken into account.
3. While working out the decadal growth of population of Jammu and Kashmir the population figures for 1991 have been worked out by interpolation as 1991 Census could not be held inthis State owing to disturbed conditions.

426
4769343 900 99 29.04
2991992 970 109 17.53
11325934 874 482 19.76
392690 773 7902 40.33
4163161 964 159 19.20
9755331 861 477 28.06
6212086 821 9294 46.31
27091465 922 165 28.33
78586558 898 689 25.80
39724832 921 880 28.43
252276 875 76 32.98
517166 901 13 26.21
946950 909 120 64.41
1181296 978 107 30.02
431275 938 42 29.18
1555030 950 304 15.74
1138229 975 103 29.94
12850608 932 340 18.85
38733477 934 904 17.84
13048151 941 338 23.19
18094580 972 236 15.94
10343530 990 154 18.06
28928245 920 196 24.34
24252939 921 258 22.48
65581 709 1411 55.59
98720 811 449 59.20
46417977 922 314 22.57
37440730 978 275 13.86
25877615 964 275 17.25
658381 960 363 14.89
29477 947 1894 17.19
16369955 1058 819 9.42
30842185 986 478 11.19
487124 1001 2029 20.56
163280 846 43 26.94
495738169 933 324 21.34
Total PopulationSex Ratio Density Decadal Growth Rate
Female (Females per 1,000 Males) (per sq.km)
Jammu & Kashmir2,3
Himachal Pradesh4
Punjab
Chandigarh*
Uttaranchal
Haryana
Delhi*
Rajasthan
Uttar Pradesh
Bihar
Sikkim
Arunachal Pradesh
Nagaland
Manipur
Mizoram
Tripura
Meghalaya
Assam
West Bengal
Jharkhand
Orissa
Chhatisgarh
Madhya Pradesh
Gujarat5
Daman & Diu*
Dadra & Nagar Haveli*
Maharashtra
Andhra Pradesh
Karnataka
Goa
Lakshadweep*
Kerala
Tamil Nadu
Pondicherry*
Andaman & Nicobar Islands*
INDIA1,2
GL 1: POPULATION, SEX RATIO, POPULATION DENSITY AND DECADAL GROWTH RATE OFPOPULATION IN INDIAN STATES AND UNION TERRITORIES, 2001
4. Figures shown against Himachal Pradesh have been arrived at after including the estimated figures of entire Kinnaur district of Himachal Pradesh where the population enumeration of Census of India 2001 could not be conducted due to natural calamity.
5. Figures shown against Gujarat have been arrived at after including the estimated figures of entire Kachchh district, Morvi, Maliya-Miyana and Wankaner talukas of Rajkot district, Jodiya taluka of Jamnagar district of Gujarat State where the population enumeration of Census of India 2001 could not be conducted due to natural calamity
6. Figures shown against geographical area of Jammu and Kashmir excludes 78114 sq. kms. under the illegal occuaption of Pakistan and 5180 sq. kms. Illegally handed overby Pakistan to China and 37555 sq. Kms. under the illegal occupation of China in Ladakh district.
State/ Union Territory *

427
GL 2: POPULATION, LITERATE POPULATION AND LITERACY RATE IN INDIAN STATES ANDUNION TERRITORIES, 2001
Table GL 2 presents the total population and population in the age
group of 0-6 years in the year 2001 in the Indian States and Union
Territories. It also gives information on the literate population and
literacy rates for the year 2001. All the data have been segregated
into male/ female categories
LITERATE
A person who can both read and write with understanding in
any language is treated as literate. A person who can merely
read but cannot write is not literate. It is not necessary that a
person who is literate should have received any formal educa-
tion or should have passed any minimum educational stan-
dard. All children of the age of 6 years or less are treated as
illiterate even if they might be going to school and may have
picked up reading and writing a few words.
LITERACY RATE
Literacy rate is calculated as a percentage of literate population
over population above the age of 7 years.

428
1. The population of India includes the estimated population of entire Kachchh district, Morvi, Maliya-Miyana and Wankaner talukas of Rajkot district, Jodiya taluka of Jamnagardistrict of Gujarat State and entire Kinnaur district of Himachal Pradesh where population ennumeration of Census of India, 2001 could not be conducted because of natural calamities.
2. Figures shown against Himachal Pradesh have been arrived after including estimated figures for entire Kinnaur district of Himachal Pradesh where the population ennumer-ation of Census of India, 2001could not be conducted due to natural calamity.
3. The total population shown against Gujarat include the estimated population of entire Kachchh district, Morvi, Maliya-Miyana and Wankaner talukas of Rajkot district, Jodiyataluka of Jamnagar district of Gujarat State while the child population in age group 0-6 and illiterates do not include the figures of these areas as these details are not available because the population enumeration of Census of India 2001 could not be conducted in these areas due to natural calamity.
GL 2: POPULATION, LITERATE POPULATION AND LITERACY RATE IN INDIAN STATES ANDUNION TERRITORIES, 2001
10069917 5300574 4769343 1431182 738839 692343
6077248 3085256 2991992 769424 405618 363806
24289296 12963362 11325934 3055492 1704142 1351350
900914 508224 392690 109293 59238 50055
8479562 4316401 4163161 1319393 692272 627121
21082989 11327658 9755331 3259080 1790758 1468322
13782976 7570890 6212086 1923995 1031584 892411
56473122 29381657 27091465 10451103 5474965 4976138
166052859 87466301 78586558 30472042 15903900 14568142
82878796 43153964 39724832 16234539 8375532 7859007
540493 288217 252276 77170 38856 38314
1091117 573951 517166 200055 102010 98045
1988636 1041686 946950 280172 141852 138320
2388634 1207338 1181296 312691 159448 153243
891058 459783 431275 141537 71817 69720
3191168 1636138 1555030 427012 216244 210768
2306069 1167840 1138229 457442 231571 225871
26638407 13787799 12850608 4350248 2215104 2135144
80221171 41487694 38733477 11132824 5671152 5461672
26909428 13861277 13048151 4796188 2440025 2356163
36706920 18612340 18094580 5180551 2656046 2524505
20795956 10452426 10343530 3469774 1756441 1713333
60385118 31456873 28928245 10618323 5504422 5113901
50596992 26344053 24252939 6867958 3656956 3211002
158059 92478 65581 20012 10394 9618
220451 121731 98720 39173 19856 19317
96752247 50334270 46417977 13187087 6878579 6308508
75727541 38286811 37440730 9673274 4926200 4747074
52733958 26856343 25877615 6826168 3501499 3324669
1343998 685617 658381 142152 73547 68605
60595 31118 29477 8860 4488 4372
31838619 15468664 16369955 3653578 1861669 1791909
62110839 31268654 30842185 6817669 3515562 3302107
973829 486705 487124 113010 57722 55288
356265 192985 163280 44674 22733 21941
1027015247 531277078 495738169 157863145 81911041 75952104
Jammu & Kashmir
Himachal Pradesh2
Punjab
Chandigarh*
Uttaranchal
Haryana
Delhi*
Rajasthan
Uttar Pradesh
Bihar
Sikkim
Arunachal Pradesh
Nagaland
Manipur
Mizoram
Tripura
Meghalaya
Assam
West Bengal
Jharkhand
Orissa
Chhatisgarh
Madhya Pradesh
Gujarat3
Daman & Diu*
Dadra & Nagar Haveli*
Maharashtra
Andhra Pradesh
Karnataka
Goa
Lakshadweep*
Kerala
Tamil Nadu
Pondicherry*
Andaman & Nicobar Is.*
INDIA1
Total Population Child Population in the Age Group 0-6
Persons Males Females Persons Males Females
State/ Union territory*

429
1. The population of India includes the estimated population of entire Kachchh district, Morvi, Maliya-Miyana and Wankaner talukas of Rajkot district, Jodiya taluka of Jamnagardistrict of Gujarat State and entire Kinnaur district of Himachal Pradesh where population ennumeration of Census of India, 2001 could not be conducted because of natural calamities.
2. Figures shown against Himachal Pradesh have been arrived after including estimated figures for entire Kinnaur district of Himachal Pradesh where the population ennumeration of Census of India, 2001could not be conducted due to natural calamity.
3. The total population shown against Gujarat include the estimated population of entire Kachchh district, Morvi, Maliya-Miyana and Wankaner talukas of Rajkot district, Jodiyataluka of Jamnagar district of Gujarat State while the child population in age group 0-6 and illiterates do not include the figures of these areas as these details are not available because the population enumeration of Census of India 2001 could not be conducted in these areas due to natural calamity.
GL 2: POPULATION, LITERATE POPULATION AND LITERACY RATE IN INDIAN STATES ANDUNION TERRITORIES, 2001
4704252 2999353 1704899 54.46 65.75 41.82
4029097 2266103 1762994 77.13 86.02 68.08
14853810 8515310 6338500 69.95 75.63 63.55
647208 384563 262645 81.76 85.65 76.65
5175176 3044487 2130689 72.28 84.01 60.26
12225036 7558443 4666593 68.59 79.25 56.31
9703049 5713157 3989892 81.82 87.37 75.00
28086101 18279511 9806590 61.03 76.46 44.34
77770275 50256119 27514156 57.36 70.23 42.98
31675607 20978955 10696652 47.53 60.32 33.57
322828 191326 131502 69.68 76.73 61.46
487796 302371 185425 54.74 64.07 44.24
1146523 645807 500716 67.11 71.77 61.92
1429656 815944 613712 68.87 77.87 59.70
663262 351851 311411 88.49 90.69 86.13
2036159 1156824 879335 73.66 81.47 65.41
1170443 619274 551169 63.31 66.14 60.41
14327540 8324077 6003463 64.28 71.93 56.03
47821757 27784750 20037007 69.22 77.58 60.22
11970177 7759966 4210211 54.13 67.94 39.38
20053785 12118256 7935529 63.61 75.95 50.97
11292896 6770898 4521998 65.18 77.86 52.40
31906109 19932013 11974096 64.11 76.80 50.28
29050019 17349179 11700840 69.97 80.50 58.60
111939 72559 39380 81.09 88.40 70.37
108830 74691 34139 60.03 73.32 42.99
64566781 37487129 27079652 77.27 86.27 67.51
40364765 23636077 16728688 61.11 70.85 51.17
30774988 17817682 12957306 67.04 76.29 57.45
989362 544006 445356 82.32 88.88 75.51
45281 24806 20475 87.52 93.15 81.56
25625698 12817963 12807735 90.92 94.20 87.86
40624398 22847735 17776663 73.47 82.33 64.55
701447 381327 320120 81.49 88.89 74.13
252945 146536 106409 81.18 86.07 75.29
566714995 339969048 226745947 65.38 75.85 54.16
Jammu & Kashmir
Himachal Pradesh2
Punjab
Chandigarh*
Uttaranchal
Haryana
Delhi*
Rajasthan
Uttar Pradesh
Bihar
Sikkim
Arunachal Pradesh
Nagaland
Manipur
Mizoram
Tripura
Meghalaya
Assam
West Bengal
Jharkhand
Orissa
Chhatisgarh
Madhya Pradesh
Gujarat3
Daman & Diu*
Dadra & Nagar Haveli*
Maharashtra
Andhra Pradesh
Karnataka
Goa
Lakshadweep*
Kerala
Tamil Nadu
Pondicherry*
Andaman & Nicobar Is.*
INDIA1
Literates Literacy Rate (%)
Persons Males Females Persons Males Females
State/ Union territory*

430
GL 3: POVERTY RATES, 1993-94
Table GL 3 provides with estimates of rural and urban poverty in
the districts of Madhya Pradesh, drawn from regional estimates of
poverty estimated by NSSO 1993-94. These derived estimates (*)
are used in the construction of the Human Development Indices
* Data for state and regional level poverty from the National Sample Surveys undertaken in 1993/94 are available for sub-state regions, according to agro-climatic zones (forfive zones for Madhya Pradesh). The rural and urban poverty rates are available for the entire region as a whole, divided into rural and urban. To get estimates of rural andurban poverty in each of the districts within an agro-climatic zone, estimated rural and urban population in 1993/94 was calculated. The value of agriculture and forest output for the districts in each zone was divided by the total agriculture and forest output for the zone as a whole for that period. The quotient was divided by share of theestimated rural population of the district to the estimated rural population for the zone as a whole. The poverty rate (head count ratio) for rural poverty for the entire zone wasdivided by the resultant quotient and the resultant figure was assumed to represent the rural poverty rate for each district within a zone.
For urban poverty, no single income measure was found significant enough, and we found that zonal urban poverty rates are sensitive to data on households without accessto safe drinking water, electricity and toilet. Similar to the calculation for rural poverty, we took the population in each district without access to all three facilities in the Censusin 1991, and, the share of this population to the total such people in an entire zone. Similarly, the share of the estimated urban population in each district was divided by thetotal estimated urban population for each zone. The quotient from the first was divided by the quotient from the second, and the result was multiplied with the NSS urbanpoverty rate (head count ratio). The total poverty ratio was calculated from the weights of rural and urban poverty in each district.
Poverty Ratios 1999-2000:
Madhya Pradesh and India
Madhya Pradesh India
Rural 37.06% 27.09%
Urban 38.44% 23.62%
Combined 37.43% 26.10%
Population below Poverty Line: 1999-2000
Rural Urban Combined
Madhya Pradesh India
37.06
27.09
38.44
23.62
37.43
26.10
POOR PERSON
A poor person is one whose consumption expenditure
(PCTE) is below the acceptable minimum, called the poverty
line.
HEAD COUNT RATIO
Head Count Ratio (HCR) is the proportion of poor people in
the total population.

431
GL 3: POVERTY RATES, 1993-94
South Central 33.2% 49.2% 43.3% 63.5% 45.3%
South Western 55.1% 55.9% 66.9% 60.2% 65.6%
North 10.1% 43.3% 12.8% 51.5% 21.5%
Central 34.0% 51.5% 25.2% 39.0% 36.5%
Vindhya 22.8% 48.9% 17.3% 52.5% 24.9%
South Central 33.2% 49.2% 23.1% 56.9% 31.2%
Central 34.0% 51.5% 49.3% 78.8% 55.3%
North 10.1% 43.3% 9.5% 42.8% 17.5%
Malwa Plateau 15.2% 44.0% 17.1% 48.3% 26.5%
Malwa Plateau 15.2% 44.0% 18.0% 46.4% 21.8%
South Western 55.1% 55.9% 48.5% 53.7% 50.0%
North 10.1% 43.3% 9.2% 48.4% 18.1%
North 10.1% 43.3% 7.7% 35.0% 24.2%
South Western 55.1% 55.9% 34.5% 52.8% 39.7%
South Western Included in Hoshangabad
Malwa Plateau 15.2% 44.0% 11.3% 41.5% 32.8%
South Central 33.2% 49.2% 39.3% 45.6% 42.2%
South Central Included in Jabalpur
Malwa Plateau 15.2% 44.0% 30.2% 41.6% 31.2%
South Central 33.2% 49.2% 53.9% 50.9% 53.7%
South Central Included in Mandla
Malwa Plateau 15.2% 44.0% 11.5% 61.9% 23.9%
Malwa Plateau Included in Mandsaur
North 10.1% 43.3% 11.0% 49.3% 20.5%
North Included in Morena
South Central 33.2% 49.2% 18.9% 43.6% 22.8%
Vindhya 22.8% 48.9% 18.3% 51.1% 23.8%
Central 34.0% 51.5% 28.0% 59.1% 34.1%
Malwa Plateau 15.2% 44.0% 21.5% 59.6% 28.7%
Malwa Plateau 15.2% 44.0% 12.4% 33.1% 19.1%
Vindhya 22.8% 48.9% 25.9% 47.5% 29.4%
Central 34.0% 51.5% 44.7% 68.1% 51.7%
Vindhya 22.8% 48.9% 23.4% 48.5% 28.8%
Central 34.0% 51.5% 28.7% 54.3% 34.0%
South Central 33.2% 49.2% 35.3% 49.0% 36.8%
Vindhya 22.8% 48.9% 28.6% 49.7% 33.4%
Vindhya Included in Shahdol
Malwa Plateau 15.2% 44.0% 14.0% 52.0% 21.3%
North 10.1% 43.3% 10.0% 46.9% 16.1%
Vindhya 22.8% 48.9% 36.1% 38.7% 36.4%
Vindhya 22.8% 48.9% 13.6% 52.3% 21.3%
Malwa Plateau 15.2% 44.0% 11.2% 33.1% 20.1%
Central 34.0% 51.5% 29.2% 52.6% 34.3%
South Western 55.1% 55.9% 78.6% 58.9% 75.6%
South Western Included in West Nimar
Balaghat
Betul
Bhind
Bhopal
Chhatarpur
Chhindwara
Damoh
Datia
Dewas
Dhar
East Nimar (Khandwa)
Guna
Gwalior
Hoshangabad
Harda
Indore
Jabalpur
Katni
Jhabua
Mandla
Dindori
Mandsaur
Neemuch
Morena
Sheopur
Narsimhapur
Panna
Raisen
Rajgarh
Ratlam
Rewa
Sagar
Satna
Sehore
Seoni
Shahdol
Umaria
Shajapur
Shivpuri
Sidhi
Tikamgarh
Ujjain
Vidisha
West Nimar (Khargone)
Barwani
Regional Poverty - Estimated Poverty from NSS Estimates
Head Count Ratio Head Count Ratio (HCR)
NSS Region Urban Rural Urban Rural Total
District

432
GL 4: POPULATION DISTRIBUTION, DECADAL GROWTH RATE, SEX RATIO AND DENSITY BY DISTRICT, 2001
SHARE OF STATE POPULATION
This is taken as the percentage population of the district over
that of Madhya Pradesh.
DECADAL GROWTH RATE
This is the urban growth of population in a decade an is
calculated by dividing the change in population by total
population and multiplying the quotient by 100.
POPULATION DENSITY
Population density is obtained by dividing the population of
the district by total geographical in sq. kms.
SEX RATIO
This gives the number of female in population for thousand
males. It is calculated by dividing the female population by
male population and multiplying the quotient by 1000.
URBAN AREA
An urban area is defined as follow:
a) All places with a Municipality Corporations,
Cantonment, Board or Notified Town Area etc.
b) All other places which satisy the following criterion:
i) A minimum population of 5000
ii) Atleast 75% of the male working population engaged in
non-agricultural pursuits
iii) Density of population of atleast 400 per sq. km. (or 1000
per sq. miles)
RATE OF URBANISATION
This is calculated by dividing the urban population by the
total population and multiplying the quotient by 100.
Table GL 4 gives demographic data in the districts of Madhya
Pradesh. Taking data from the 1991 and 2001 census, this table
gives population in the districts. The data on population is segre-
gated into male-female and rural-urban categories. This table also
gives the district wise decadal growth rates in the last two
decades as well the gender ratios and density of population.
Sex Ratios 2001: Madhya Pradesh
and India Year Madhya Pradesh India
Share of India’s Population 2001
Total 5.9%
Rural 6.0%
Urban 5.6%
Rate of Urbanisation 2001 26.7% 27.8%
Decadal Growth Rate 1991-2001 24.34 21.34
Sex Ratio 2001
Total 920 933
Rural 927 946
Urban 899 901
Population Density (per sq.km) 2001 196 324
Population below Poverty Line: 1999-2000
Total Rural Urban
Madhya Pradesh India
920
927
899901
946
933
Source: Census of India 2001

433
GL 4- POPULATION DISTRIBUTION, DECADAL GROWTH RATE, SEX RATIO AND DENSITY BY DISTRICT, 2001
1445760 714938 730822 2.39% 18 1365870 682260 6836101081039 547837 533202 1.79% 34 832422 423809 4086131394421 709525 684896 2.31% 22 1181501 600935 5805661426951 780122 646829 2.36% 20 1219000 671347 5476531836784 968964 867820 3.04% 7 1351479 715283 6361961474633 788845 685788 2.44% 17 1158076 623878 5341981848882 946582 902300 3.06% 6 1568702 803386 7653161081909 568704 513205 1.79% 33 898125 471384 426741
627818 337842 289976 1.04% 41 515360 279041 2363191306617 676414 630203 2.16% 23 1033807 537426 4963811740577 890853 849724 2.88% 9 1367412 700952 666460
579312 290572 288740 0.96% 42 658482 330370 3281121708170 882371 825799 2.83% 11 1431662 738883 6927791665503 883433 782070 2.76% 12 1310317 698747 6115701629881 882258 747623 2.70% 13 1293567 706337 587230
474174 247129 227045 0.79% 45 380762 198908 1818541085011 571796 513215 1.80% 32 886449 468505 4179442585321 1352849 1232472 4.28% 1 1835915 963311 8726042167469 1134870 1032599 3.59% 2 1768037 928898 8391391396677 701742 694935 2.31% 21 1130405 571764 5586411063689 548077 515612 1.76% 36 881925 454756 427169
893908 446487 447421 1.48% 38 632781 319074 3137071183369 604942 578427 1.96% 29 956869 491565 4653041587264 871243 716021 2.63% 14 1279094 707477 571617
957399 501407 455992 1.59% 37 785496 410693 374803725457 371972 353485 1.20% 40 598339 307916 290423854235 447923 406312 1.41% 39 687945 362727 325218
1120159 595730 524429 1.86% 31 876461 466389 4100721253246 648850 604396 2.08% 25 992764 516152 4766121214536 620119 594417 2.01% 27 971888 498798 4730901972333 1017402 954931 3.27% 4 1554987 805000 7499872021783 1073032 948751 3.35% 3 1647736 876079 7716571868648 970114 898534 3.09% 5 1465384 763983 7014011078769 565387 513382 1.79% 35 841358 443332 3980261165893 588135 577758 1.93% 30 1000831 507076 4937551572748 803416 769332 2.60% 15 1323054 681962 6410921290230 669419 620811 2.14% 24 1033248 538694 494554
559715 295630 264085 0.93% 43 431480 229516 2019641440666 775473 665193 2.39% 19 1132977 612821 5201561830553 947276 883277 3.03% 8 1373434 714672 6587621203160 637842 565318 1.99% 28 940829 502822 4380071709885 881509 828376 2.83% 10 1383086 717018 666068
515851 264998 250853 0.85% 44 420815 216708 2041071214759 647632 567127 2.01% 26 970388 517858 4525301529954 785212 744742 2.53% 16 1195723 616161 579562
60385118 31456873 28928245 48566242 25394673 23171569
BalaghatBarwaniBetulBhindBhopalChhatarpurChhindwaraDamoh DatiaDewasDharDindoriEast Nimar (Khandwa)GunaGwaliorHardaHoshangabadIndoreJabalpurJhabuaKatniMandlaMandsaurMorenaNarsimhapurNeemuchPannaRaisenRajgarhRatlamRewaSagarSatnaSehoreSeoniShahdolShajapurSheopurShivpuriSidhiTikamgarhUjjainUmariaVidishaWest Nimar (Khargone)
Madhya Pradesh
Population 2001- All Share of Rank in Population 1991- AllState State
Population
Persons Male Female Persons Male Female
District
Source: Census of India, Madhya Pradesh 1981, 1991 and 2001

434
GL 4- POPULATION DISTRIBUTION, DECADAL GROWTH RATE, SEX RATIO AND DENSITY BY DISTRICT, 2001
1251855 616599 635256 1236083 615256 620827923063 466442 456621 706536 358509 348027
1135542 574477 561065 961551 485361 4761901088798 596586 492212 967857 533892 433965
357665 189504 168161 270677 144516 1261611150354 615753 534601 934552 503845 4307071396648 711762 684886 1206351 613313 593038
877594 461224 416370 735203 385412 349791490273 264301 225972 409995 222722 187273949255 490218 459037 766147 396449 369698
1452342 737160 715182 1187702 605976 581726552450 276754 275696 635376 318297 317079
1247838 644598 603240 1037491 534765 5027261310768 696443 614325 1054741 562488 492253
646550 352668 293882 479520 264501 215019373087 193959 179128 303175 157937 145238749249 394642 354607 617520 325671 291849735010 379428 355582 561397 292506 268891920965 478693 442272 759084 393495 365589
1275648 638984 636664 1032325 520671 511654838731 430221 408510 684417 351044 333373801903 399274 402629 556837 279818 277019962736 491317 471419 764964 392291 372673
1244065 684877 559188 990495 548406 442089804296 421084 383212 668708 349125 319583523204 266897 256307 430975 220837 210138746091 390570 355521 598378 314800 283578913319 484794 428525 738645 392102 346543
1036096 535380 500716 825926 428601 397325847139 431022 416117 662151 338472 323679
1651858 847196 804662 1318172 677541 6406311430421 760970 669451 1166357 619205 5471521483058 765318 717740 1176220 609756 566464
884345 463061 421284 690025 363000 3270251045196 525746 519450 906024 457701 4483231174613 593501 581112 1024794 521776 5030181050890 544850 506040 850362 442939 407423
471135 248464 222671 369137 196354 1727831200994 647596 553398 960907 519937 4409701569163 806043 763120 1284586 664376 620210
990785 526042 464743 781815 418538 3632771047558 537543 510015 836403 431964 404439
432939 221704 211235 350879 179809 171070954480 509708 444772 775303 414142 361161
1292559 661883 630676 1016335 522175 49416044282528 22975256 21307272 36292098 18890291 17401807
BalaghatBarwaniBetulBhindBhopalChhatarpurChhindwaraDamoh DatiaDewasDharDindoriEast Nimar (Khandwa)GunaGwaliorHardaHoshangabadIndoreJabalpurJhabuaKatniMandlaMandsaurMorenaNarsimhapurNeemuchPannaRaisenRajgarhRatlamRewaSagarSatnaSehoreSeoniShahdolShajapurSheopurShivpuriSidhiTikamgarhUjjainUmariaVidishaWest Nimar (Khargone)Madhya Pradesh
Population 2001- Rural Population 1991- Rural
Persons Male Female Persons Male Female
District
Source: Census of India, Madhya Pradesh 1981, 1991 and 2001

435
GL 4- POPULATION DISTRIBUTION, DECADAL GROWTH RATE, SEX RATIO AND DENSITY BY DISTRICT, 2001
193905 98339 95566 13.4% 129787 67004 62783157976 81395 76581 14.6% 125886 65300 60586258879 135048 123831 18.6% 219950 115574 104376338153 183536 154617 23.7% 251143 137455 113688
1479119 779460 699659 80.5% 1080802 570767 510035324279 173092 151187 22.0% 223524 120033 103491452234 234820 217414 24.5% 362351 190073 172278204315 107480 96835 18.9% 162922 85972 76950137545 73541 64004 21.9% 105365 56319 49046357362 186196 171166 27.4% 267660 140977 126683288235 153693 134542 16.6% 179710 94976 84734
26862 13818 13044 4.6% 23106 12073 11033460332 237773 222559 26.9% 394171 204118 190053354735 186990 167745 21.3% 255576 136259 119317983331 529590 453741 60.3% 814047 441836 372211101087 53170 47917 21.3% 77587 40971 36616335762 177154 158608 30.9% 268929 142834 126095
1850311 973421 876890 71.6% 1274518 670805 6037131246504 656177 590327 57.5% 1008953 535403 473550
121029 62758 58271 8.7% 98080 51093 46987224958 117856 107102 21.1% 197508 103712 93796
92005 47213 44792 10.3% 75944 39256 36688220633 113625 107008 18.6% 191905 99274 92631343199 186366 156833 21.6% 288599 159071 129528153103 80323 72780 16.0% 116788 61568 55220202253 105075 97178 27.9% 167364 87079 80285108144 57353 50791 12.7% 89567 47927 41640206840 110936 95904 18.5% 137816 74287 63529217150 113470 103680 17.3% 166838 87551 79287367397 189097 178300 30.2% 309737 160326 149411320475 170206 150269 16.2% 236815 127459 109356591362 312062 279300 29.2% 481379 256874 224505385590 204796 180794 20.6% 289164 154227 134937194424 102326 92098 18.0% 151333 80332 71001120697 62389 58308 10.4% 94807 49375 45432398135 209915 188220 25.3% 298260 160186 138074239340 124569 114771 18.6% 182886 95755 87131
88580 47166 41414 15.8% 62343 33162 29181239672 127877 111795 16.6% 172070 92884 79186261390 141233 120157 14.3% 88848 50296 38552212375 111800 100575 17.7% 159014 84284 74730662327 343966 318361 38.7% 546683 285054 261629
82912 43294 39618 16.1% 69936 36899 33037260279 137924 122355 21.4% 195085 103716 91369237395 123329 113966 15.5% 179388 93986 85402
16102590 8481617 7620873 26.7% 12274144 6504382 5769762
BalaghatBarwaniBetulBhindBhopalChhatarpurChhindwaraDamoh DatiaDewasDharDindoriEast Nimar (Khandwa)GunaGwaliorHardaHoshangabadIndoreJabalpurJhabuaKatniMandlaMandsaurMorenaNarsimhapurNeemuchPannaRaisenRajgarhRatlamRewaSagarSatnaSehoreSeoniShahdolShajapurSheopurShivpuriSidhiTikamgarhUjjainUmariaVidishaWest Nimar (Khargone)Madhya Pradesh
Population 2001- Urban Rate of Population 1991- UrbanUrbanisation
Persons Male Female Persons Male Female
District
Source: Census of India, Madhya Pradesh 1981, 1991 and 2001

436
GL 4- POPULATION DISTRIBUTION, DECADAL GROWTH RATE, SEX RATIO AND DENSITY BY DISTRICT, 2001
19.00 5.85 45 1002 1022 1030 972 148 157 3226.30 29.87 4 964 973 979 941 154 199 1927.68 18.02 39 966 965 977 917 118 139 3925.18 17.06 41 816 829 825 842 273 320 551.05 35.91 2 889 896 887 898 488 663 130.61 27.33 11 856 869 868 873 133 170 2527.21 17.86 40 953 953 962 926 133 156 3324.49 20.46 36 905 902 903 901 123 148 3626.01 21.82 33 847 858 855 870 192 233 1229.99 26.39 16 924 932 936 919 147 186 2329.31 27.29 12 951 954 970 875 168 213 1524.94 13.23 44 985 994 996 944 69 78 4524.11 19.31 37 938 936 936 936 133 159 3030.77 27.11 14 875 885 882 897 118 151 3527.97 26.00 18 831 847 833 857 284 357 429.14 24.53 22 914 919 924 901 114 142 3725.01 22.40 31 892 898 899 895 132 162 2930.26 40.82 1 906 911 937 901 471 663 119.12 22.59 29 903 910 924 900 339 416 342.16 23.56 27 977 990 996 929 167 206 1723.43 20.61 35 939 941 950 909 178 215 1324.17 14.66 43 990 1002 1008 949 134 154 3423.42 23.67 25 947 956 960 942 173 214 1430.58 24.09 24 808 822 816 842 256 318 620.76 21.88 32 913 909 910 906 153 187 2222.58 21.25 34 943 950 960 925 141 170 2527.40 24.17 23 897 907 910 886 96 120 4323.35 27.80 9 879 880 884 864 104 132 4123.88 26.24 17 923 931 935 914 161 204 1824.17 24.97 20 948 959 965 943 200 250 928.77 26.84 15 932 939 950 883 246 312 724.53 22.70 28 881 884 880 895 161 197 2027.05 27.52 10 918 926 938 883 195 249 1027.99 28.22 6 898 908 910 900 128 164 2823.60 16.49 42 974 982 988 935 114 133 4028.96 18.87 38 940 958 979 897 133 158 3122.97 24.87 21 918 927 929 921 167 208 1633.32 29.72 5 880 893 896 878 65 85 4430.84 27.16 13 849 858 855 874 110 140 3838.67 33.28 3 922 932 947 851 130 174 2427.66 27.88 8 871 886 883 900 186 238 1123.82 23.63 26 929 940 949 926 227 281 831.83 22.58 30 942 947 953 915 103 127 4223.92 25.18 19 874 876 873 887 132 165 2723.04 27.95 7 941 948 953 924 149 191 2127.24 24.34 912 920 927 899 158 196
BalaghatBarwaniBetulBhindBhopalChhatarpurChhindwaraDamoh DatiaDewasDharDindoriEast Nimar (Khandwa)GunaGwaliorHardaHoshangabadIndoreJabalpurJhabuaKatniMandlaMandsaurMorenaNarsimhapurNeemuchPannaRaisenRajgarhRatlamRewaSagarSatnaSehoreSeoniShahdolShajapurSheopurShivpuriSidhiTikamgarhUjjainUmariaVidishaWest Nimar (Khargone)Madhya Pradesh
Decadal Rank in Sex-ratio Density Rank in Growth Rate growth: (per sq. km.) Density:
1981-91 1991-2001 1991-2001 1991 2001 2001 Rural 2001 Urban 1991 2001 1991-2001
District
Source: Census of India, Madhya Pradesh 1981, 1991 and 2001
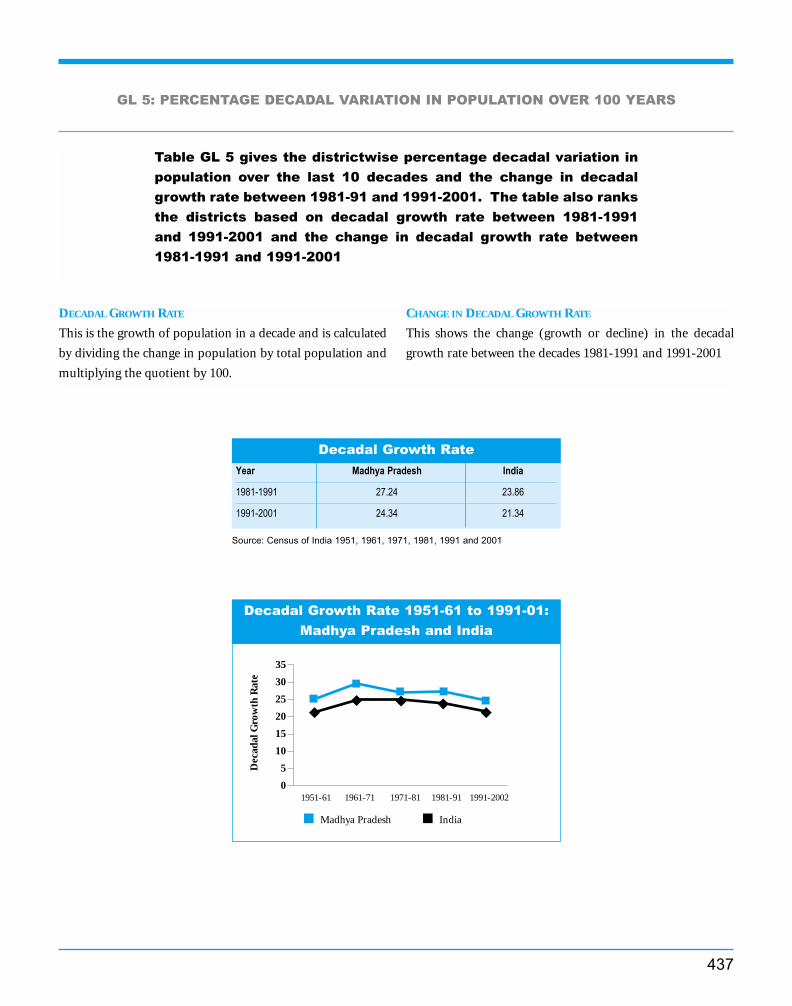
437
GL 5: PERCENTAGE DECADAL VARIATION IN POPULATION OVER 100 YEARS
DECADAL GROWTH RATE
This is the growth of population in a decade and is calculated
by dividing the change in population by total population and
multiplying the quotient by 100.
CHANGE IN DECADAL GROWTH RATE
This shows the change (growth or decline) in the decadal
growth rate between the decades 1981-1991 and 1991-2001
Table GL 5 gives the districtwise percentage decadal variation in
population over the last 10 decades and the change in decadal
growth rate between 1981-91 and 1991-2001. The table also ranks
the districts based on decadal growth rate between 1981-1991
and 1991-2001 and the change in decadal growth rate between
1981-1991 and 1991-2001
Decadal Growth Rate 1951-61 to 1991-01:
Madhya Pradesh and India
Year Madhya Pradesh India
1981-1991 27.24 23.86
1991-2001 24.34 21.34
Decadal Growth Rate
1951-61 1961-71 1971-81 1981-91 1991-2002
Madhya Pradesh India
Source: Census of India 1951, 1961, 1971, 1981, 1991 and 2001
35
30
25
20
15
10
5
0
Dec
adal
Gro
wth
Rat
e

438
GL 5: PERCENTAGE DECADAL VARIATION IN POPULATION OVER 100 YEARS
19.00 7.50 9.77 12.95 9.31 16.34 21.18 17.4036.53 10.07 18.21 14.99 11.44 24.53 26.99 27.7135.64 -6.83 11.69 7.90 3.04 24.08 31.37 25.70-4.54 -4.56 9.27 14.80 6.87 21.44 23.83 22.658.61 -10.27 16.71 15.18 24.95 57.73 53.93 56.388.02 -8.22 -0.76 6.92 3.68 22.08 21.28 24.46
26.74 -4.81 16.56 6.53 5.85 21.52 25.95 24.6316.73 -13.79 6.42 11.96 4.15 22.63 30.78 25.85
-10.34 -4.64 7.95 10.15 0.23 22.06 27.87 21.1620.11 -2.40 14.37 6.27 5.85 29.42 32.99 33.8117.11 14.66 9.88 9.54 6.38 27.74 30.85 25.5326.49 -4.60 15.91 12.47 8.33 37.89 26.62 22.2619.36 1.42 17.83 9.91 5.27 30.88 28.34 31.1918.23 -2.94 11.35 12.07 1.07 23.64 31.54 27.85
-20.04 6.00 11.51 22.74 20.34 24.26 30.51 30.300.18 -3.48 9.62 0.83 -0.12 27.73 28.48 22.633.83 -2.63 9.40 -0.10 1.71 18.99 31.07 25.00
-9.82 24.45 12.36 19.34 32.23 25.38 36.03 37.4910.09 0.09 4.69 21.12 18.83 24.29 36.29 32.5339.56 15.98 16.90 17.40 11.49 34.42 9.83 19.07
8.88 -0.20 2.37 12.65 8.95 17.59 25.22 26.2127.71 -4.66 15.05 13.58 8.64 18.09 28.25 16.2816.84 4.17 13.86 16.08 18.17 25.11 26.88 30.68-0.84 -8.52 11.23 13.70 10.19 22.37 25.74 31.953.22 -3.23 2.01 4.20 1.23 21.61 25.91 25.266.93 2.36 12.87 20.96 15.26 22.18 29.44 32.56
25.13 -2.08 6.12 15.85 4.19 27.57 29.53 25.838.61 -5.95 -1.73 4.73 1.61 30.46 34.42 28.48
26.44 -6.40 12.68 9.73 6.37 20.90 24.66 24.372.47 0.21 18.54 15.39 13.90 26.67 29.58 24.936.71 -3.18 6.71 14.44 8.06 21.90 26.57 23.49
15.24 -2.38 3.13 9.56 6.56 25.21 33.36 24.5517.35 -13.11 8.27 15.41 4.72 25.22 31.56 26.26
8.70 -4.84 8.33 5.98 2.05 34.27 33.99 28.6720.68 11.95 12.86 7.52 2.53 20.66 27.61 21.1514.40 -7.03 20.18 14.97 8.96 25.48 25.91 30.28
9.19 -1.80 10.60 12.56 6.11 21.45 28.93 23.86-3.07 -8.92 5.43 12.54 10.61 27.69 25.94 33.2012.11 -9.38 6.83 10.99 3.73 17.19 21.26 27.9916.50 -13.89 14.71 17.21 9.46 24.95 33.90 27.51
2.60 -13.66 9.75 11.96 3.15 24.44 24.85 29.5515.18 -0.76 17.58 14.48 19.58 21.79 30.34 29.5114.25 -7.38 21.52 11.82 10.51 34.08 18.68 31.7230.25 17.20 -0.64 10.85 0.71 26.71 34.59 18.9336.53 10.07 18.21 15.08 11.36 35.09 31.61 26.4212.38 -2.4 10.21 12.06 8.38 24.73 29.28 27.16
BalaghatBarwaniBetulBhindBhopalChhatarpurChhindwaraDamoh DatiaDewasDharDindoriEast Nimar (Khandwa)GunaGwaliorHardaHoshangabadIndoreJabalpurJhabuaKatniMandlaMandsaurMorenaNarsimhapurNeemuchPannaRaisenRajgarhRatlamRewaSagarSatnaSehoreSeoniShahdolShajapurSheopurShivpuriSidhiTikamgarhUjjainUmariaVidishaWest Nimar (Khargone)Madhya Pradesh
1901-11 1911-21 1921-31 1931-41 1941-51 1951-61 1961-71 1971-81District
Source: Census of India 2001, Madhya Pradesh, Series-24

439
GL 5: PERCENTAGE DECADAL VARIATION IN POPULATION OVER 100 YEARS
19.00 5.85 45 45 -13.15 4226.30 29.87 23 4 3.57 427.68 18.02 18 39 -9.66 3925.18 17.06 25 41 -8.12 3651.05 35.91 1 2 -15.14 4330.61 27.33 8 11 -3.28 2527.21 17.86 21 40 -9.35 3724.49 20.46 29 35 -4.03 2926.01 21.82 24 32 -4.19 3029.99 26.39 11 16 -3.6 2629.38 27.29 12 12 -2.09 2024.94 13.23 27 44 -11.71 4124.11 19.31 32 37 -4.8 3230.77 27.11 7 14 -3.66 2727.97 26.00 17 18 -1.97 1929.14 24.53 13 22 -4.61 3125.01 22.40 26 30 -2.61 2230.26 40.82 10 1 10.56 119.12 22.59 44 29 3.47 542.16 23.56 2 27 -18.6 4423.43 20.61 37 34 -2.82 2324.17 14.66 30 43 -9.51 3823.42 23.67 38 25 0.25 1230.58 24.09 9 24 -6.49 3420.76 21.88 43 31 1.12 922.58 21.25 42 33 -1.33 1627.40 24.17 20 23 -3.23 2423.35 27.80 39 9 4.45 323.88 26.24 34 17 2.36 624.17 24.97 30 20 0.8 1028.77 26.84 15 15 -1.93 1824.53 22.70 28 28 -1.83 1727.05 27.52 22 10 0.47 1127.99 28.22 16 6 0.23 1323.60 16.49 36 42 -7.11 3528.96 18.87 14 38 -10.09 4022.97 24.87 41 21 1.9 732.32 29.72 5 5 -2.6 2130.84 27.16 6 13 -3.68 2838.67 33.28 4 3 -5.39 3327.66 27.88 19 8 0.22 1423.82 23.63 35 26 -0.19 1539.38 19.58 3 36 -19.8 4523.92 25.18 33 19 1.26 823.04 27.95 40 7 4.91 227.24 24.34
BalaghatBarwaniBetulBhindBhopalChhatarpurChhindwaraDamoh DatiaDewasDharDindoriEast Nimar (Khandwa)GunaGwaliorHardaHoshangabadIndoreJabalpurJhabuaKatniMandlaMandsaurMorenaNarsimhapurNeemuchPannaRaisenRajgarhRatlamRewaSagarSatnaSehoreSeoniShahdolShajapurSheopurShivpuriSidhiTikamgarhUjjainUmariaVidishaWest Nimar (Khargone)Madhya Pradesh
1981-91 1991-2001 Rank in Decadal Rank in Decadal Change in DecadalChange between Change between Growth Rate between
1981 and 1991 1991 and 2001 1981-91,1991-01
Change Rank
District
Source: Census of India 2001, Madhya Pradesh, Series-24

440
GL 6: DISTRICTWISE INFORMATION ON GEOGRAPHICAL AREA, TOWNS, VILLAGES ANDADMINISTRATIVE SETUP
TOWNS
A town is defined as all places within a municipality, corpora-
tion, cantonment, board or notified town area committee, etc.
and all other places which satisfy the following criteria
i) a minimum population of 5000
ii) atleast 75% of male working population engaged in non
agricultural pursuits
iii) a density of population of atleast 400 persons per square
km.
VILLAGE:
A village consists of a habitation or a group of habitations or
a hamlet or a group of hamlets comprising a community and
managing its affair in accordance with tradition and customs.
A village must satisfy the following criteria
i) a population of less than 5000
ii) atleast 75% of the male working population engaged in
agricultural pursuits
iii) a density of persons less than 400 persons per sq. km.
GRAM PANCHAYAT:
For the purpose of the Madhya Pradesh Panchayat Raj
Adhiniyam, 1993, a Gram Panchayat is constituted for a village
under sub-section (1) of Section 10.
JANPAD PANCHAYAT
For the purpose of the Madhya Pradesh Panchayat Raj
Adhiniyam, 1993 a Janpad Panchayat is constituted for a Block
under sub-section (2) of section 10.
Table GL 6 gives information on the geographical area of the
districts of Madhya Pradesh. It also presents information on the
number of towns and villages in each of the district as well as
the administrative setup including the number of tehsils, blocks,
Janpad Panchayats and Gram Panchayats.

441
GL 6: DISTRICTWISE INFORMATION ON GEOGRAPHICAL AREA, TOWNS, VILLAGES ANDADMINISTRATIVE SETUP
9229 7 10 6 1388 1269 10 665 11875422 6 7 6 740 714 7 383 714
10043 5 10 6 1406 1328 10 555 13434459 7 6 11 933 877 6 447 9112772 2 2 2 542 511 2 194 5188687 7 8 14 1192 1076 8 558 1086
11815 9 11 22 1984 1903 11 808 19247306 7 7 5 1399 1205 7 456 11592691 3 3 4 602 542 3 250 5367020 6 6 11 1134 1058 6 459 10588153 7 13 9 1571 1487 13 669 15237470 2 7 2 930 899 7 398 929
10779 6 9 7 1068 1060 9 591 124011065 9 9 10 2265 2059 9 728 20634560 3 4 9 776 706 5 298 6183330 3 3 3 571 497 3 181 4956707 7 7 11 983 923 7 391 9513898 4 4 10 645 624 4 304 6525211 4 7 14 1449 1449 7 525 13916782 8 12 8 1357 1313 12 612 13544950 5 6 4 955 882 6 409 8795800 4 9 5 1234 1214 9 423 13005535 5 5 9 943 899 5 423 9224989 6 7 6 799 760 7 475 7715133 5 6 5 1081 1040 6 422 11184256 3 3 8 880 676 3 214 6597135 5 5 6 1048 939 5 378 9908466 7 7 9 1509 1429 7 501 14076154 6 6 12 1736 1664 6 569 16644861 6 6 9 1077 1051 6 406 10606314 7 9 12 2725 2352 9 815 2140
10252 8 11 13 2081 1868 11 753 18927502 8 8 11 2040 1784 8 710 18206578 5 5 7 1072 1011 5 450 10228758 6 8 4 1613 1585 8 598 15909952 8 9 16 1444 1390 9 670 13936196 8 8 12 1124 1068 8 509 10516606 3 3 3 607 533 3 219 562
10278 7 8 7 1459 1326 8 605 134110526 9 8 6 1882 1822 8 716 1838
5048 6 6 12 973 863 6 443 8936091 7 6 7 1135 1092 6 517 11134076 2 3 4 662 646 2 223 5947371 7 7 5 1624 1522 7 549 15228030 8 9 8 1431 1170 9 560 1534
308256 263 313 370 56069 52086 313 22029 52727
BalaghatBarwaniBetulBhindBhopalChhatarpurChhindwaraDamoh DatiaDewasDharDindoriEast Nimar (Khandwa)GunaGwaliorHardaHoshangabadIndoreJabalpurJhabuaKatniMandlaMandsaurMorenaNarsimhapurNeemuchPannaRaisenRajgarhRatlamRewaSagarSatnaSehoreSeoniShahdolShajapurSheopurShivpuriSidhiTikamgarhUjjainUmariaVidishaWest Nimar (Khargone)Madhya Pradesh
Geographical Tehsils Administrative Towns Total Inhabited Janpad Gram Gram area Blocks Villages Villages Panchyat Panchayat Sabhas
(in sq. kms.)District
Source: District Statistical Handbooks and Census of India 2001

442
GL 7: ROAD NETWORK IN DISTRICTS OF MADHYA PRADESH, 1999
NATIONAL HIGHWAYS
These are main highways running through the length and
breadth of the country, connecting to major ports, foreign
highways and capitals of States/ Union territories and large
industrial and tourist centres, and including roads required
for strategic movements for the defence of the country.
STATE HIGHWAYS
These are arterial roads of a State linking district headquarters
and important cities within the State and connecting them
with National Highways or Highways of the neighbouring
States.
DISTRICT MAIN ROADS
These are important roads within a district, serving areas of
production and markets and connecting these with each other
or with the main Highways.
VILLAGE ROADS
These are roads connecting villages/habitation or groups of
habitations with each other and to the nearest road of a
higher category.
Table GL 7 gives information on the road infrastructure in Madhya
Pradesh. The table presents available data on the length of
national highways, state highways, district main roads and rural
roads. It also gives data on the pucca and kutcha roads. Rural
connectivity is shown by rural road length per village and
percentage of villages not connected with pucca roads.

443
GL 7: ROAD NETWORK IN DISTRICTS OF MADHYA PRADESH, 1999
0.0 269.3 413.5 2157.6 656.3 1476.271.4 52.0 205.0 1368.8 0.0 1040.6
126.2 133.6 401.1 1358.8 360.1 713.10.0 274.8 281.2 1221.8 99.6 670.3
39.4 108.4 506.0 860.7 0.0 206.995.0 215.0 489.0 1640.1 613.9 906.344.0 320.2 297.8 1595.9 545.9 933.9
0.0 191.7 424.5 1357.7 196.9 744.640.0 105.0 114.9 519.7 23.4 260.243.9 162.4 194.7 830.5 190.4 429.5
188.2 107.6 550.8 1926.3 132.9 1079.70.0 258.8 146.2 1079.5 87.3 674.50.0 285.9 411.6 1872.2 38.8 1182.9
109.4 284.6 299.4 1266.3 122.5 595.6129.2 28.0 277.4 1140.8 191.0 706.2
0.0 61.8 90.1 354.5 50.8 202.653.2 214.9 39.0 927.7 251.8 620.6
110.8 104.6 181.1 1327.9 169.0 947.4161.0 135.1 166.8 1485.9 131.0 1023.0
48.3 123.5 404.3 1832.1 545.6 1256.0116.6 74.0 244.1 1048.4 135.3 613.7
0.0 332.0 341.8 1417.8 336.6 743.244.0 70.3 236.2 982.8 94.2 632.344.1 182.8 156.5 959.6 68.5 576.2
165.0 102.1 107.6 955.5 189.0 583.238.0 0.0 243.3 666.2 23.1 384.955.0 85.9 418.0 961.6 192.8 413.5
199.4 118.2 317.5 820.5 131.6 207.4214.5 66.1 241.6 884.6 179.1 365.0
87.0 0.0 290.0 815.2 55.5 452.2159.9 122.7 282.8 1889.5 454.3 1330.9153.7 322.7 666.2 1757.4 265.7 647.0176.3 188.8 347.4 2250.3 648.5 1547.0
29.2 219.4 243.3 825.5 76.0 333.6166.7 135.1 196.4 1348.8 471.7 850.6129.6 340.1 221.7 1815.6 650.6 1152.5
30.6 127.6 406.6 1304.0 139.0 750.30.0 201.3 60.5 681.1 0.0 419.3
232.0 158.3 380.0 1311.7 98.4 548.90.0 183.2 355.3 2114.5 1268.4 1663.9
15.0 202.0 221.8 1270.1 156.7 832.317.6 146.6 457.4 1058.3 57.2 436.955.0 95.1 46.0 550.9 245.8 354.8
0.0 327.9 307.6 905.8 148.1 317.414.7 265.7 252.8 2025.1 45.3 1502.9
3403.9 7505.1 12936.8 56745.6 10538.6 33330.0
BalaghatBarwaniBetulBhindBhopalChhatarpurChhindwaraDamoh DatiaDewasDharDindoriEast Nimar (Khandwa)GunaGwaliorHardaHoshangabadIndoreJabalpurJhabuaKatniMandlaMandsaurMorenaNarsimhapurNeemuchPannaRaisenRajgarhRatlamRewaSagarSatnaSehoreSeoniShahdolShajapurSheopurShivpuriSidhiTikamgarhUjjainUmariaVidishaWest Nimar (Khargone)Madhya Pradesh
District National State Main Pucca Kuccha Highway Highway Roads Roads Roads Pucca Rural
(Km.) (Km.) (Km.) (Km.) (Km.) Roads (Km.)
District
Source: Sadak Sankhyiki 1999, Public Works Department, GoMP

444
GL 7: ROAD NETWORK IN DISTRICTS OF MADHYA PRADESH, 1999
654.9 2131.1 2813.9 30.5 1.7 46.20.0 1040.4 1368.8 25.2 1.5 58.3
344.9 1058.0 1718.9 17.1 0.8 72.995.1 765.4 1321.4 29.6 0.9 43.3
0.0 206.9 860.7 31.0 0.4 50.0548.7 1455.0 2254.0 25.9 1.4 61.6545.9 1479.8 2141.8 18.1 0.8 68.8193.8 938.4 1554.6 21.3 0.8 62.9
23.0 283.2 543.1 20.2 0.5 55.4190.4 619.9 1020.9 14.5 0.6 73.0132.9 1212.6 2059.2 25.3 0.8 70.5
87.3 761.8 1166.8 15.6 0.7 71.930.6 1213.5 1911.0 17.7 1.1 51.099.8 695.4 1388.8 12.6 0.3 75.5
191.0 897.2 1331.8 29.2 1.6 37.850.8 253.4 405.3 12.2 0.5 66.5
251.8 872.4 1179.5 17.6 0.9 66.5153.0 1100.4 1496.9 38.4 1.8 49.3131.0 1154.0 1616.9 31.0 0.8 68.2545.6 1801.6 2377.7 35.1 1.4 55.8135.3 749.0 1183.7 23.9 0.8 68.2336.6 1080.6 1754.4 30.2 1.0 71.9
94.2 726.5 1077.0 19.5 0.8 63.768.5 644.7 1028.1 20.6 0.8 43.9
186.6 769.8 1144.5 22.3 0.7 67.123.1 408.0 689.3 16.2 0.6 63.7
182.0 595.5 1154.4 16.2 0.6 65.0109.6 317.0 952.1 11.2 0.2 74.7176.5 541.5 1063.7 17.3 0.3 87.0
41.5 493.7 870.7 17.9 0.5 73.0447.5 1778.4 2343.8 37.1 0.8 55.4233.5 880.5 2023.1 19.7 0.5 73.1639.3 2186.3 2898.8 38.6 1.2 55.0
76.0 409.6 901.5 13.7 0.4 71.4471.7 1322.3 1820.5 20.8 0.8 75.0622.3 1774.8 2466.2 24.8 1.3 65.1127.9 878.2 1443.0 23.3 0.8 74.2
0.0 419.3 681.1 10.3 0.8 43.990.9 639.8 1410.1 13.7 0.5 69.5
1180.5 2844.4 3382.9 32.1 1.6 56.9155.7 988.0 1426.8 28.3 1.1 59.1
57.0 493.9 1115.5 18.3 0.5 76.2245.8 600.6 796.7 19.5 1.0 65.1101.0 418.4 1053.9 14.3 0.3 71.0
34.3 1537.2 2070.4 25.8 1.3 58.310107.8 43437.8 67284.2 21.8 0.8
BalaghatBarwaniBetulBhindBhopalChhatarpurChhindwaraDamoh DatiaDewasDharDindoriEast Nimar (Khandwa)GunaGwaliorHardaHoshangabadIndoreJabalpurJhabuaKatniMandlaMandsaurMorenaNarsimhapurNeemuchPannaRaisenRajgarhRatlamRewaSagarSatnaSehoreSeoniShahdolShajapurSheopurShivpuriSidhiTikamgarhUjjainUmariaVidishaWest Nimar (Khargone)Madhya Pradesh
Rural Percentage of Kuccha Rural Roads Total Road Road Length Rural Roads Villages not Roads (Km.) (Km.) Length per 100 per Village connected with
(Km.) sq.km. (in Km) Pucca RoadDistrict
Source: Sadak Sankhyiki 1999, Public Works Department, GoMP

445
GL 8: ELECTRICITY CONSUMERS AND CONSUMPTION IN DISTRICTS OF MADHYA PRADESH
Table GL 8 presents per capita domestic and non-domestic con-
sumption of electricity and consumption per industrial and per
agricultural unit. Rural electrification is shown by the percentage
of villages electrified.
Year Madhya Pradesh India
1996-97 367 334
Per Capita Consumption of Electricity (kWH)
Source: Compendium of Power Statistics, MPEB, Jabalpur for M.P. and Annual
Reports on the Working of State Electricity Boards and Electricity Department,
Planning Commission, GoI for India

446
GL 8: ELECTRICITY CONSUMERS AND CONSUMPTION IN DISTRICTS OF MADHYA PRADESH
538 453 695 874 566 1017 80430 136801 16340413 277 536 904 590 1045 13152 9494 15697532 393 740 1145 865 1252 227173 179700 280614435 257 629 850 381 923 59800 138929 7462
1083 382 1174 2126 1307 2151 69508 7656 79017460 215 781 1115 361 1260 173602 368663 14252417 212 657 1008 589 1102 69603 65061 72839456 320 616 733 394 831 79602 70828 90409379 240 685 895 584 971 103521 89731 120805499 320 718 988 620 1112 65890 9160 105285508 403 689 1020 649 1294 137942 140488 135728252 210 457 623 427 869 42905 50986 8480548 300 793 1105 750 1194 44465 146318 12177480 254 809 886 530 957 38480 80740 7872646 214 756 1512 463 1574 33306 4245 40454637 538 813 878 410 1043 62834 15032 87929750 615 874 1137 532 1258 94107 50850 129610
1068 449 1098 1794 743 1806 37190 7561 38044864 410 1021 1579 1164 1603 50002 25726 54216392 227 826 858 454 1063 44794 61303 10304548 395 778 1060 660 1151 97092 88866 105437393 252 823 958 725 1064 67051 99324 15626558 399 784 809 421 979 32171 3996 59363453 268 622 922 410 990 36699 52723 29108484 337 715 947 548 1076 8818 10394 7031560 370 768 844 548 929 202329 298972 149907451 291 761 940 510 1111 13690 429 38127455 350 721 1130 777 1236 84890 16594 137588390 202 630 823 385 922 16162 15917 16345627 305 885 942 500 1024 39029 27039 44992489 290 596 1153 547 1287 213847 181262 234736528 327 674 909 489 968 56301 42383 61872578 356 742 1164 764 1213 125531 100344 140151444 322 646 1004 669 1090 42019 3462 84841418 341 674 841 604 974 12917 4582 36346554 307 1019 1339 1114 1394 201739 63265 351046531 412 717 876 578 979 33438 4158 67638352 254 648 733 439 976 4458 3803 5995353 170 663 849 485 996 35327 62339 6858420 273 588 1039 551 1205 257167 59286 463859378 216 533 743 587 775 10744 15699 6369695 345 932 1005 567 1076 38513 4113 48335446 278 1081 1119 965 1218 274633 31941 832356634 479 927 1071 690 1155 48232 3745 82218432 319 786 1050 714 1278 28526 21660 41554583 328 833 1220 610 1341 66445 62368 68791
BalaghatBarwaniBetulBhindBhopalChhatarpurChhindwaraDamoh DatiaDewasDharDindoriEast Nimar (Khandwa)GunaGwaliorHardaHoshangabadIndoreJabalpurJhabuaKatniMandlaMandsaurMorenaNarsimhapurNeemuchPannaRaisenRajgarhRatlamRewaSagarSatnaSehoreSeoniShahdolShajapurSheopurShivpuriSidhiTikamgarhUjjainUmariaVidishaWest Nimar (Khargone)Madhya Pradesh
Per Capita Domestic Consumption (Kwh) Per Capita Non-Domestic Consumption (Kwh) Consumption per Industrial Unit (Kwh)
Total Rural Urban Total Rural Urban Consumption Consumption ConsumptionConsumption Consumption Consumption Consumption Consumption Consumption per Industrial per Rural per Urbanper Consumer per Consumer per Consumer per Consumer per Consumer per Consumer Unit Industrial Unit Industrial Unit
District
Source: Compendium of Power Statistics 1999-2000, Madhya Pradesh Electricity Board, Jabalpur

447
GL 8: ELECTRICITY CONSUMERS AND CONSUMPTION IN DISTRICTS OF MADHYA PRADESH
4866 4760 5224 1269 1170 92.27170 6417 7964 714 637 89.225716 5762 5559 1328 1320 99.47051 7136 6492 877 872 99.436985 7081 6537 511 511 1005293 5160 5916 1076 1062 98.73798 3679 3979 1903 1897 99.687642 7536 8001 1205 1110 92.12
12770 12922 9849 542 539 99.459457 9251 10248 1058 1053 99.53
10033 9910 10397 1487 1479 99.462523 2619 2349 1038 958 92.299374 9577 8892 1060 1055 99.538727 8861 6690 2059 2036 98.888343 8134 9390 566 559 98.769643 9425 10617 497 445 89.547549 7792 7002 923 877 95.02
14253 14625 14168 624 620 99.369400 9862 8207 1373 1339 97.525729 5876 5183 1313 1292 98.41951 2055 1456 884 843 95.361346 1311 1449 1068 1032 96.634619 4633 4573 899 899 100
15576 15397 16734 760 753 99.089662 9464 10412 1040 1038 99.817834 7911 7640 676 674 99.76219 6338 5886 939 921 98.087546 7520 7850 1429 1349 94.46650 6685 6395 1664 1664 1009465 9484 9434 1051 1051 1008773 8294 9240 2352 2154 91.584590 4704 4319 1868 1777 95.138049 8346 7748 1784 1661 93.118567 8363 9800 1011 1008 99.72273 2305 2069 1585 1542 97.293514 3518 3494 1388 1299 93.599681 9868 9103 1068 1065 99.72
19467 21016 11082 533 478 89.686967 6861 7641 1326 1300 98.044020 3834 4332 1822 1804 99.015360 5282 5476 863 862 99.889183 8981 9970 1092 1092 1003063 2971 4104 589 554 94.064610 4682 3440 1522 1478 97.115499 5475 5896 1170 1142 97.617681 7525 8135 51806 50271 97.04
BalaghatBarwaniBetulBhindBhopalChhatarpurChhindwaraDamoh DatiaDewasDharDindoriEast Nimar (Khandwa)GunaGwaliorHardaHoshangabadIndoreJabalpurJhabuaKatniMandlaMandsaurMorenaNarsimhapurNeemuchPannaRaisenRajgarhRatlamRewaSagarSatnaSehoreSeoniShahdolShajapurSheopurShivpuriSidhiTikamgarhUjjainUmariaVidishaWest Nimar (Khargone)Madhya Pradesh
Consumption per Agriculture Unit (Kwh) Villages Electrified
Consumption Consumption Consumption Total Electrified Share ofper per Rural per Urban Villages Electrified
Consumer Consumer Consumer Villages
Source: Compendium of Power Statistics 1999-2000, Madhya Pradesh Electricity Board, Jabalpur
District

448
GL 9: TELECOM CONNECTIONS (DOT) IN DISTRICTS OF MADHYA PRADESH, 2000
Table GL 9 presents data on the total number of exchanges, urban
and rural exchanges and the number of telephone connections in
each district. The physical access to telephones is shown by cal-
culating the number of telephone connections per 100 population.
Year Madhya Pradesh India
2000 2377 25813
Number of Exchanges
Source: Department of Telecom, Madhya Pradesh for M.P. and Department of
Telecommunications, Government of India for India

449
GL 9: TELECOM CONNECTIONS (DOT) IN DISTRICTS OF MADHYA PRADESH, 2000
44 41 3 10233 1.4039 37 2 7890 1.3369 64 5 13234 1.0454 51 3 8530 1.6528 27 1 104086 0.1734 20 14 10554 1.3690 83 7 20270 0.9028 24 4 7065 1.5017 16 1 5831 1.0688 81 7 18928 0.67
120 111 9 21218 0.809 9 0 706 8.10
99 96 3 23582 0.7171 60 11 16338 1.0046 42 4 63703 0.2557 56 1 7015 0.6675 67 8 17285 0.6259 55 4 153656 0.1662 52 10 61410 0.3543 38 5 9171 1.4926 24 2 9972 1.0527 26 1 4038 2.1877 76 1 17171 0.6749 42 7 13215 1.1861 57 4 11330 0.8376 74 2 18644 0.3819 13 6 4459 1.8761 54 7 10248 1.0751 37 14 9780 1.2569 67 2 28713 0.4138 36 2 14799 1.3068 49 19 19684 1.0141 34 7 18052 1.0152 48 4 12351 0.8545 44 1 7754 1.4838 29 9 11421 1.3581 72 9 12088 1.0415 14 1 2917 1.8751 45 6 13262 1.0626 22 4 6850 2.6020 18 2 4708 2.49
103 96 7 37408 0.4510 5 5 2238 2.2649 45 4 12438 0.9592 89 3 15604 0.96
2377 2146 231 899849 0.66
BalaghatBarwaniBetulBhindBhopalChhatarpurChhindwaraDamoh DatiaDewasDharDindoriEast Nimar (Khandwa)GunaGwaliorHardaHoshangabadIndoreJabalpurJhabuaKatniMandlaMandsaurMorenaNarsimhapurNeemuchPannaRaisenRajgarhRatlamRewaSagarSatnaSehoreSeoniShahdolShajapurSheopurShivpuriSidhiTikamgarhUjjainUmariaVidishaWest Nimar (Khargone)Madhya Pradesh
Total Exchanges Number of Exchanges Number of Connections per
Connections 100 populationRural Urban
District
Source: Department of Telecommunications

450
HABITAT
DENSE FOREST
All forests with tree cover of canopy density of 40 percent andabove.
OPEN FOREST
All forests with tree cover of canopy density between 10 to 40percent.
SCRUB FOREST
All lands with poor tree growth mainly of small or stuntedtrees having canopy density less than 10 percent
FOREST COVER TO TOTAL AREA
This gives the percentage of forest cover to the total geographical area.
CHANGE COMPARED TO 1997This gives the change (growth or decline) in forest area in1997 as compared to 1997.
PER CAPITA FOREST AREA
Per capita forest area is obtained by dividing the total forestarea in hectares by the total population.
Table HA 1 gives the districtwise data on the forest cover and
forest types of Madhya Pradesh comparing the situation in 1999
with that in 1993, 1995 and 1997. The data on forest cover to total
area and per capita forest area is also presented in the table.
Year Madhya Pradesh India
Dense Forest as percentage of geographical area 1999 13.6% 11.48%
Dense Forest- Share of India 21.6%
Open Forest as percentage of geographical area 1999 10.7% 7.76%
Open Forest- Share of India 19.7%
Mangrove Forest 1999 0% .15%
Mangrove Forest- Share of India 0%
Total Forest as percentage of geographical area 1999 24.4% 19.39%
Total Forest- Share of India 20.7%
Source: Forest Survey of India, 1999
*: The methodology of the survey: IRS 1C/1D satellites of India, with a resolution of 23.5m, fed data on 11 states crucial to forestry studies; the rest were scanned
by IRS 1B with a resolution 36m. And data on 13 key states were interpreted digitally. But conclusions were not reached merely on the basis of remote sensing data.
FSI carried out extensive field trips for 'ground truthing', to confirm the accuracy of interpretation.
Forest cover 1999:
Madhya Pradesh and India
Madhya Pradesh India
Dense forest as percentage of geographical area
Open forest as percentage of geographical
Mangrove Forest
Total Forest as percentage of geographical area
13.6%10.7%
0.0%
24.4%
7.8%
0.2%
19.4%
11.5%
SECTORAL FACTSHEET

451
HA 1: FOREST COVER* IN DISTRICTS OF MADHYA PRADESH
9229 4590 328 4918 53.29% 9229 4536 383 4919 53.30%10043 2906 654 3560 35.45% 10043 2943 617 3560 35.45%
4459 17 56 73 1.64% 4459 17 55 72 1.61%2772 47 190 237 8.55% 2772 41 192 233 8.41%8687 1414 200 1614 18.58% 8687 1353 258 1611 18.54%
11815 3029 1391 4420 37.41% 11815 3010 1399 4409 37.32%7306 934 2200 3134 42.90% 7306 925 2200 3125 42.77%2038 14 49 63 3.09% 2038 14 53 67 3.29%7020 1232 595 1827 26.03% 7020 1216 590 1806 25.73%8153 78 485 563 6.91% 8153 78 486 564 6.92%
10779 2694 1432 4126 38.28% 10779 2653 1450 4103 38.06%11065 1025 1593 2618 23.66% 11065 997 1603 2600 23.50%5214 403 827 1230 23.59% 5214 393 852 1245 23.88%
10037 2590 760 3350 33.38% 10037 2751 606 3357 33.45%Included in Hoshangabad
3898 345 187 532 13.65% 3898 343 177 520 13.34%10160 1494 638 2132 20.98% 10160 1458 682 2140 21.06%
Included in Jabalpur6782 568 486 1054 15.54% 6782 566 478 1044 15.39%
13269 4750 613 5363 40.42% 13269 4720 642 5362 40.41%Included in Mandla
9791 485 753 1238 12.64% 9791 485 750 1235 12.61%Included in Mandsaur
11594 1937 2658 4595 39.63% 11594 1924 2729 4653 40.13%Included in Morena
5133 664 574 1238 24.12% 5133 661 581 1242 24.20%7135 743 2204 2947 41.30% 7135 739 2201 2940 41.21%8466 1568 979 2547 30.09% 8466 1572 964 2536 29.96%6154 225 147 372 6.04% 6154 225 148 373 6.06%4861 34 221 255 5.25% 4861 34 221 255 5.25%6314 383 171 554 8.77% 6314 381 170 551 8.73%
10252 1552 802 2354 22.96% 10252 1468 876 2344 22.86%7502 359 1337 1696 22.61% 7502 359 1334 1693 22.57%6578 584 753 1337 20.33% 6578 578 752 1330 20.22%8758 2340 652 2992 34.16% 8758 2321 653 2974 33.96%
14028 3052 1334 4386 31.27% 14028 3046 1340 4386 31.27%Included in Shahdol
6196 0 0 0 0.00% 6196 0 0 0 0.00%10278 921 1582 2503 24.35% 10278 894 1589 2483 24.16%10526 3217 698 3915 37.19% 10526 3205 692 3897 37.02%
5048 76 187 263 5.21% 5048 68 182 250 4.95%6091 0 0 0 0.00% 6091 0 0 0 0.00%7371 533 437 970 13.16% 7371 526 443 969 13.15%
13450 1275 1661 2936 21.83% 13450 1257 1649 2906 21.61%Included in West Nimar
308252 48078 29834 77912 25.28% 308252 47757 29997 77754 25.22%
BalaghatBetulBhindBhopalChattarpurChhindwaraDamohDatiaDewasDharEast Nimar (Khandwa)GunaGwaliorHoshangabadHardaIndoreJabalpurKatniJhabuaMandlaDindoriMandsaurNeemuchMorenaSheopurNarsimhapurPannaRaisenRajgarhRatlamRewaSagarSatnaSehoreSeoniShahdolUmariaShajapurShivpuriSidhiTikamgarhUjjainVidishaWest Nimar (Khargone)BarwaniMadhya Pradesh
Forest Cover Assessment Area 1993 (sq km) Forest Area Assessment-1995 (in sq km)Forest Forest
Geographic Dense Open Total Cover to Geographic Dense Open Total Cover toArea Forest Forest Forest Total Area Area Forest Forest Forest Total Area
District
Source : Forest Survey of India, 1993, 1995, 1997, 1999

452
HA 1: FOREST COVER* IN DISTRICTS OF MADHYA PRADESH
9229 3921 849 4770 51.7% 9229 3716 998 471410043 2964 635 3599 35.8% 10043 2922 678 3600
4459 5 42 47 1.1% 4459 7 74 812772 40 257 297 10.7% 2772 94 191 2858687 844 715 1559 17.9% 8687 846 716 1562
11815 2709 1965 4674 39.6% 11815 2690 1948 46387306 721 2257 2978 40.8% 7306 816 2123 29392038 40 53 93 4.6% 2038 58 75 1337020 1103 535 1638 23.3% 7020 1108 536 16448153 120 514 634 7.8% 8153 155 481 636
10779 2327 1081 3408 31.6% 10779 2351 1134 348511065 458 1514 1972 17.8% 11065 778 1335 21135214 559 845 1404 26.9% 5214 456 846 1302
10037 2829 459 3288 32.8% 10037 2765 546 3311Included in Hoshangabad
3898 225 199 424 10.9% 3898 220 233 45310160 1087 916 2003 19.7% 10160 1178 806 1984
Included in Jabalpur6782 364 459 823 12.1% 6782 249 601 850
13269 4628 1092 5720 43.1% 13269 4417 1366 5783Included in Mandla
9791 465 726 1191 12.2% 9791 367 779 1146Included in Mandsaur
11594 2779 1624 4403 38.0% 11594 2250 2292 4542Included in Morena
5133 773 572 1345 26.2% 5133 788 540 13287135 895 1814 2709 38.0% 7135 893 1822 27158466 1659 932 2591 30.6% 8466 1552 1124 26766154 20 104 124 2.0% 6154 37 71 1084861 0 164 164 3.4% 4861 0 185 1856314 206 354 560 8.9% 6314 205 353 558
10252 1276 1388 2664 26.0% 10252 1181 1483 26647502 554 1050 1604 21.4% 7502 618 997 16156578 589 759 1348 20.5% 6578 603 705 13088758 2151 1020 3171 36.2% 8758 2198 958 3156
14028 1991 2186 4177 29.8% 14028 2018 2176 4194Included in Shahdol
6196 0 0 0 0.0% 6196 0 0 010278 931 1400 2331 22.7% 10278 901 1509 241010526 2409 1614 4023 38.2% 10526 2402 1619 4021
5048 46 173 219 4.3% 5048 51 183 2346091 0 1 1 0.0% 6091 0 1 17371 240 547 787 10.7% 7371 331 445 776
13450 957 1061 2018 15.0% 13450 841 1146 1987Included in West Nimar
308252 42885 31876 74761 24.3% 308252 42062 33075 75137
BalaghatBetulBhindBhopalChattarpurChhindwaraDamohDatiaDewasDharEast Nimar (Khandwa)GunaGwaliorHoshangabadHardaIndoreJabalpurKatniJhabuaMandlaDindoriMandsaurNeemuchMorenaSheopurNarsimhapurPannaRaisenRajgarhRatlamRewaSagarSatnaSehoreSeoniShahdolUmariaShajapurShivpuriSidhiTikamgarhUjjainVidishaWest Nimar (Khargone)BarwaniMadhya Pradesh
Forest Area Assessment-1997 (in sq km) Forest Area Assessment-1999 (in sq km)Forest
Geographic Dense Open Total Cover to Geographic Dense Open TotalArea Forest Forest Forest Total Area Area Forest Forest Forest
District
Source : Forest Survey of India, 1993, 1995, 1997, 1999

453
-56 7 51.08% 0.3301 62 35.85% 0.267
34 55 1.82% 0.006-12 48 10.28% 0.016
3 56 17.98% 0.111-36 119 39.26% 0.259-39 5 40.23% 0.28240 37 6.53% 0.022
6 6 23.42% 0.1322 45 7.80% 0.038
77 0 32.33% 0.211141 135 19.10% 0.133
-102 116 24.97% 0.08423 0 32.99% 0.318
Included in Hoshangabad29 8 11.62% 0.019
-19 172 19.53% 0.095Included in Jabalpur
27 37 12.53% 0.06363 83 43.58% 0.665
Included in Mandla-45 92 11.70% 0.101
Included in Mandsaur139 695 39.18% 0.299
Included in Morena-17 84 25.87% 0.144
6 198 38.05% 0.33285 87 31.61% 0.251
-16 34 1.75% 0.00921 76 3.81% 0.016-2 69 8.84% 0.0300 115 25.99% 0.137
11 166 21.53% 0.091-40 22 19.88% 0.127-15 28 36.04% 0.27917 134 29.90% 0.276
Included in Shahdol0 5 0.00% 0.000
79 364 23.45% 0.176-2 87 38.20% 0.23315 127 4.64% 0.020
0 0 0.02% 0.000-11 118 10.53% 0.067-31 147 14.77% 0.136
Included in West Nimar376 3639 24.38% 0.130
BalaghatBetulBhindBhopalChattarpurChhindwaraDamohDatiaDewasDharEast Nimar (Khandwa)GunaGwaliorHoshangabadHardaIndoreJabalpurKatniJhabuaMandlaDindoriMandsaurNeemuchMorenaSheopurNarsimhapurPannaRaisenRajgarhRatlamRewaSagarSatnaSehoreSeoniShahdolUmariaShajapurShivpuriSidhiTikamgarhUjjainVidishaWest Nimar (Khargone)BarwaniMadhya Pradesh
Forest Area Assessment-1999 (in sq kms.) Per CapitaForest Area in
Change Forest 1999 (inCompared Cover to hectare per
to 1997 Scrub Total Area person)
District
HA 1: FOREST COVER* IN DISTRICTS OF MADHYA PRADESH
Source : Forest Survey of India, 1993, 1995, 1997, 1999

454
HA 2: SELECTED INFORMATION ON URBAN SLUMS AND TOWNS IN MADHYA PRADESH
SLUMS
For the purpose of Census of India, 2001, the slum areas
broadly constitute of:
1) All specified areas notified as 'Slum' by State/Local
Government and UT Administration under any Act;
2) All areas recognized as 'Slum' by State/Local Government
and UT Administration which may have not been
formally notified as slum under any Act;
3) A compact area of at least 300 population or about 60-70
households of poorly built congested tenements, in
unhygienic environment usually with inadequate infra-
structure and lacking in proper sanitary and drinking
water facilities.
GENDER RATIO
This gives the number of females in population for thousand
males. It is calculated by dividing the female population by
male population and multiplying the quotient by 1000.
JUVENILE SEX RATIO
This gives the number of females in population for thousand
males in the age group of 0-6 years. It is calculated by dividing
the female population in 0-6 years of age by male population
in the same age group and multiplying the quotient by 1000.
LITERACY RATES
Literacy rate is calculated as the percentage of literate
population over population above the age of 7 years.
Table HA 2 provides information on the extent of slums in the
urban areas in terms of population and as percentage of urban
population. The table also gives information on the other
demographic indicators and social indicators in the slums like
population in the age group of 0-6 years, overall sex ratio, juvenile
sex ratio and the literacy rates both male and female in slum
areas.
Year Madhya Pradesh India
Slum Population as percentage of Urban Population 2001 24.31 14.1
Gender Ratio in Slum Areas 2001 904 875
Juvenile Sex Ratio in Slum Area 2001 903 918
Literacy Rate in Slum Areas 2001
Persons 75.7 73.7
Male 84.7 81.4
Female 65.7 65.0
Source: Forest Survey of India, 1999
Slum Population as a Percentage of Urban
Population and Literacy Rates in Slum 2001:
Madhya Pradesh and India
Slum Literacy Literacy Literacypopulation Rate Rate Rate
as percentage (persons) (Male) (Female)of Urban
Population
Madhya Pradesh India
908070605040302010
0
Per
ceta
ge

455
Balaghat(N.P) 75061 4347 5.79 973
Sarni(N.P) 95015 58421 61.49 900
Betul(N.P) 83287 62049 74.5 922
Bhind (N.P.) 153768 38020 24.73 839
Bhopal(N.N) 1433875 126346 8.81 906
Chhatarpur (N.P.) 99519 26432 26.56 878
Chindwara(N.P) 122309 12049 9.85 885
Chichlikala-Parasiya (N.S) 93071 17382 18.68 943
Damoh (N.P.) 112160 28023 24.98 905
Datia (N.P.) 82742 15122 18.28 891
Dewas (N.N) 230658 95411 41.36 905
Dhar (N.P) 75472 9888 13.1 868
Guna (N.P.) 137132 51501 37.56 882
Gwalior (N.N.) 826919 193635 23.42 867
Itarsi(N.P) 93783 10125 10.8 939
Hoshangabad(N.P) 97357 14532 14.93 876
Indore (N.N) 1597441 259577 16.25 902
Mohw (C.B.) 90220 0 0 0
Jabalpur(N.N) 951469 275454 28.95 907
Jabalpur Cantt. 66482 6680 10.05 928
Mudwara(N.N) 186738 36652 19.63 933
Khandwa(N.N) 171976 111360 64.75 940
Burhanpur(N.N) 194360 194360 100 943
Khargone(N.P) 86443 40145 46.44 934
Mandausar (N.P.) 116483 21025 18.05 937
Morena (N.P) 150890 120617 79.94 830
Neemuch (N.P.) 107496 23434 21.8 930
Jawara (N.P) 63736 52111 81.76 949
Ratlam (N.N) 221267 63932 28.89 947
Rewa (N.N) 183232 13032 7.11 887
Sagar (N.N) 232321 8563 3.69 883
Bina Eitawa (N.S.) 51189 22800 44.54 916
Satna (N.N.) 225468 35539 15.76 867
Sehore(N.P) 90930 32656 35.91 897
Seoni(N.P) 89799 28307 31.52 932
Shahdol (N.P) 78583 4609 5.87 881
Budhar Dhanpuri (N.S.) 91952 10247 11.14 916
Shivpuri (N.P.) 146859 50225 34.2 885
Singroli (N.N) 185580 3134 1.69 833
Tikamgarh (N.P.) 68572 29978 43.72 882
Nagda (N.P) 96525 24026 24.89 906
Ujjain (N.N.) 429933 121028 28.15 923
Vidisha(N.P) 125457 35743 28.49 880
9823309 2388517 24.31 904
Balaghat
Betul
Betul
Bhind
Bhopal
Chhatarpur
Chhindwara
Chhindwara
Damoh
Datia
Dewas
Dhar
Guna
Gwalior
Hoshangabad
Hoshangabad
Indore
Indore
Jabalpur
Jabalpur
Katni
Khandwa
Khandwa
Khargone
Mandausar
Morena
Neemuch
Ratlam
Ratlam
Rewa
Sagar
Sagar
Satna
Sehore
Seoni
Shahdol
Shahdol
Shivpuri
Sidhi
Tikamgarh
Ujjain
Ujjain
Vidisha
Madhya Pradesh
Towns Total Urban Slum AreaPopulation
Population Slum Population as Gender Ratiopercentage of
UrbanPopulation
District
HA 2: SELECTED INFORMATION ON URBAN SLUMS AND TOWNS
Source : Census of India 2001, Madhya Pradesh, Series-24, Paper-2

456
HA 2: SELECTED INFORMATION ON URBAN SLUMS AND TOWNS
Balaghat(N.P) 561 1070 88.9 77.28 87.27 66.88
Sarni(N.P) 7218 923 82.74 79.12 87.38 69.91
Betul(N.P) 8141 892 87.3 89.15 91.47 86.66
Bhind (N.P.) 6793 868 81.18 67.61 80.61 51.99
Bhopal(N.N) 22305 944 80.12 66.23 75.83 55.55
Chhatarpur (N.P.) 4758 966 80.89 69.35 79.48 57.57
Chindwara(N.P) 1552 839 86.31 81.69 89.01 73.48
Chichlikala-Parasiya (N.S) 2285 1038 79.72 75.14 83.3 66.35
Damoh (N.P.) 4397 942 84.01 76.37 86.71 64.87
Datia (N.P.) 2224 850 80.13 81.52 89.15 73.01
Dewas (N.N) 15753 854 81.29 73.05 85.2 59.78
Dhar (N.P) 1713 836 76.05 63.05 74.63 49.82
Guna (N.P.) 9131 898 78.4 66.81 79.9 51.91
Gwalior (N.N.) 28329 837 80.62 72.91 83.04 61.3
Itarsi(N.P) 1593 952 86.28 74.47 84.09 64.19
Hoshangabad(N.P) 2392 873 84.4 70.31 82.58 56.33
Indore (N.N) 36490 903 82.14 79.82 88.04 70.71
Mohw (C.B.) 0 0 82.73 0 0 0
Jabalpur(N.N) 35409 927 84.76 81.15 87.58 74.03
Jabalpur Cantt. 785 1071 92.49 86.01 93.91 77.33
Mudwara(N.N) 6319 952 82.63 65.99 77.27 53.85
Khandwa(N.N) 15143 945 82.47 81.97 88.53 74.98
Burhanpur(N.N) 29056 922 74.69 74.69 81.6 67.39
Khargone(N.P) 7180 923 78.65 67.58 80.23 54.06
Mandausar (N.P.) 3555 943 82.22 67.77 80.06 54.63
Morena (N.P) 19137 806 78.25 77.45 88.48 64.24
Neemuch (N.P.) 3703 917 81.6 71.8 82.19 60.66
Jawara (N.P) 8482 935 73.33 70.16 79.76 60.09
Ratlam (N.N) 8764 957 86.46 78.95 88.09 69.28
Rewa (N.N) 1922 932 82.03 79.12 87.01 70.14
Sagar (N.N) 1200 926 86.2 78.43 86.31 69.44
Bina Eitawa (N.S.) 4167 694 84.89 83.25 96.17 69.99
Satna (N.N.) 5872 981 81.67 75.32 84.07 64.98
Sehore(N.P) 4806 900 79.74 76.85 85 67.75
Seoni(N.P) 3704 876 87.27 85.32 92 75.22
Shahdol (N.P) 592 856 86.6 82.23 91.69 71.53
Budhar Dhanpuri (N.S.) 1565 986 75.47 67.04 76.92 56.1
Shivpuri (N.P.) 8306 864 77.29 68.75 80.54 55.51
Singroli (N.N) 541 912 71.57 65.68 78.63 49.83
Tikamgarh (N.P.) 4775 942 82.67 78.09 87.27 67.55
Nagda (N.P) 3960 914 80.32 69.98 82.37 56.29
Ujjain (N.N.) 18925 926 82.87 70.54 81.84 58.3
Vidisha(N.P) 6516 957 82.66 73.45 84.27 60.92
360019 903 79.68 75.68 84.71 65.68
Balaghat
Betul
Betul
Bhind
Bhopal
Chhatarpur
Chhindwara
Chhindwara
Damoh
Datia
Dewas
Dhar
Guna
Gwalior
Hoshangabad
Hoshangabad
Indore
Indore
Jabalpur
Jabalpur
Katni
Khandwa
Khandwa
Khargone
Mandausar
Morena
Neemuch
Ratlam
Ratlam
Rewa
Sagar
Sagar
Satna
Sehore
Seoni
Shahdol
Shahdol
Shivpuri
Sidhi
Tikamgarh
Ujjain
Ujjain
Vidisha
Madhya Pradesh
Towns Slum Area Literacy Rate in Slum Area
Populaation in Juvenile Sex Urban Literacy Persons Male Femaleage group 0-6 Ratio Rate
District

457
HA 3: STATUS OF DRINKING WATER IN VILLAGES, INSTITUTIONAL PROVISION, 2000
SAFE DRINKING WATER
If the household has access to drinking water supplies from atap, handpump or tubewell situated within or outside thepremises, it is considered as having access to safe drinkingwater.
FULLY COVERED
The habitations where the norms of atleast 40 litres of safedrinking water per capita per day (lpcd) are fulfilled are saidto be fully covered.
SHARE OF HABITATIONS FULLY COVERED
The percentage of habitations fully covered to the total habitations.
PARTIALLY COVERED
The habitations where some safe drinking water is provided
but is less than 40 litres per capita per day are said to be partially covered. Partially covered habitations may fall in twocategories, those getting 10-40 litres per capita per day andthose getting even less than 10 litres per capita day.
SHARE OF HABITATIONS PARTIALLY COVERED
It is the percentage of habitations partially covered to the totalhabitations.
NOT COVERED
The habitations, which do not have access to safe drinkingwater at all, are said to be not covered.
SHARE OF HABITATIONS NOT COVERED
It is the percentage of habitations not covered to the totalhabitations.
Table HA 3 gives information on extent of institutional provision of
safe drinking water to villages. The table presents data from the
Public Health Engineering Department of the government of
Madhya Pradesh for villages covered with handpump for water.

458
3281 3281 100.0% 0 0 03932 3329 84.7% 61 390 4512087 1795 86.0% 8 274 2821878 1179 62.8% 3 665 668
651 622 95.5% 0 29 291594 979 61.4% 0 608 6083646 3235 88.7% 8 397 4051405 985 70.1% 2 375 377
710 676 95.2% 0 34 341240 944 76.1% 1 295 2966438 6278 97.5% 4 81 853005 2325 77.4% 113 541 6542252 2055 91.3% 2 186 1883500 2959 84.5% 0 505 505
942 920 97.7% 0 20 20632 543 85.9% 0 89 89
1258 1165 92.6% 0 86 86898 858 95.5% 1 39 40
1736 1680 96.8% 0 56 569927 9757 98.3% 14 4 181161 1083 93.3% 0 77 773258 2363 72.5% 132 720 8521187 805 67.8% 6 374 3804034 3095 76.7% 0 913 9131550 1425 91.9% 0 120 120
808 704 87.1% 0 104 1041339 1314 98.1% 0 9 91925 1633 84.8% 7 282 2892163 2133 98.6% 0 30 301355 1126 83.1% 16 213 2296985 6199 88.7% 0 776 7762230 1708 76.6% 6 510 5163999 3189 79.7% 0 806 8061175 871 74.1% 0 304 3042564 2520 98.3% 3 40 435511 5321 96.6% 2 124 1261268 1042 82.2% 0 226 226
795 596 75.0% 0 197 1972062 1845 89.5% 0 217 2175933 3303 55.7% 0 2602 26021799 1226 68.1% 1 422 4231166 1036 88.9% 0 130 1301823 1693 92.9% 3 82 851962 1806 92.0% 0 156 1562716 2407 88.6% 36 261 297
111780 96008 85.9% 429 14369 14798
BalaghatBarwaniBetulBhind BhopalChattarpurChhindwaraDamohDatiaDewasDharDindoriEast Nimar (Khandwa)GunaGwaliorHardaHoshangabadIndoreJabalpurJhabuaKatniMandlaMandsaurMorena NarsinghpurNeemuchPannaRaisenRajgarhRatlamRewaSagarSatnaSehoreSeoniShahdolShajapurSheopurShivpuriSidhi TikamgarhUjjainUmariaVidishaWest Nimar (Khargone)Madhya Pradesh
Total Habitations Habitations Share of Partially CoveredFully Habitations
Covered Fully Covered Upto 10 lpcd 10- 40 lpcd TotalDistrict
HA 3: STATUS OF DRINKING WATER IN VILLAGES, INSTITUTIONAL PROVISION, 2000
Source : Public Health Engineering Department, Government of MP and National Commission on Population, Government of India

459
0.0% 0 0.0% 69.6911.5% 152 3.9% 100.0013.5% 10 0.5% 100.0035.6% 31 1.7% 64.48
4.5% 0 0.0% 100.0038.1% 7 0.4% 39.7511.1% 6 0.2% 99.3626.8% 43 3.1% 67.07
4.8% 0 0.0% 99.7923.9% 0 0.0% 100.00
1.3% 75 1.2% 100.0021.8% 26 0.9% 67.18
8.3% 9 0.4% 100.0014.4% 36 1.0% 94.43
2.1% 2 0.2% 100.0014.1% 0 0.0% 100.00
6.8% 7 0.6% 100.004.5% 0 0.0% 100.003.2% 0 0.0% 100.000.2% 152 1.5% 100.006.6% 1 0.1% 100.00
26.2% 43 1.3% 67.1832.0% 2 0.2% 51.3322.6% 26 0.6% 76.17
7.7% 5 0.3% 100.0012.9% 0 0.0% 51.33
0.7% 16 1.2% 48.8715.0% 3 0.2% 100.00
1.4% 0 0.0% 99.5516.9% 0 0.0% 100.0011.1% 10 0.1% 48.1123.1% 6 0.3% 75.2620.2% 4 0.1% 53.3425.9% 0 0.0% 97.63
1.7% 1 0.0% 81.292.3% 64 1.2% 46.91
17.8% 0 0.0% 100.0024.8% 2 0.3% 76.1710.5% 0 0.0% 96.2143.9% 28 0.5% 51.3323.5% 150 8.3% 43.7511.1% 0 0.0% 100.004.7% 45 2.5% 46.918.0% 0 0.0% 80.52
10.9% 12 0.4% 100.0013.2% 974 0.9% 79.44
BalaghatBarwaniBetulBhind BhopalChattarpurChhindwaraDamohDatiaDewasDharDindoriEast Nimar (Khandwa)GunaGwaliorHardaHoshangabadIndoreJabalpurJhabuaKatniMandlaMandsaurMorena NarsinghpurNeemuchPannaRaisenRajgarhRatlamRewaSagarSatnaSehoreSeoniShahdolShajapurSheopurShivpuriSidhi TikamgarhUjjainUmariaVidishaWest Nimar (Khargone)Madhya Pradesh
Share of Habitations Share of Percentage Habitations Not Habitations Coverage of
Partially covered Covered not covered Safe Drinking Water (Habitations)
District
HA 3: STATUS OF DRINKING WATER IN VILLAGES, INSTITUTIONAL PROVISION, 2000
Source : Public Health Engineering Department, Government of MP and National Commission on Population, Government of India

460
HEALTH
SUB HEALTH CENTRE (SHC)Each sub health centre caters to approximately 4-5 villages.They provide basic health care, maternal and child healthservices including family planning. They also undertake simple sanitation and health education tasks.
PRIMARY HEALTH CENTRE (PHC)Each Primary Health Centre supervises six sub-healthCentres. PHCs supervise community health outreach workand offer general medical and simple surgical services.
COMMUNITY HEALTH CENTRE (CHC)The concept of Community Health Centre was introduced in1985. CHCs serve upto 100 000 people and provide specialistmedical, paediatric, obstetric and surgical services.
DISTRICT HOSPITALS
The District Hospital provides specialist medical, paediatric,obstetric and surgical services on a large scale. Other specialities are also included as required from time to time.
POPULATION PER HEALTH INSTITUTION
This indicates the basic provisioning of health institutions andis calculated by dividing the total population by the totalnumber of health institutions. Health institutions hereincludes district hospitals, urban civil hospitals, communityhealth centres, PHCs and SHCs.
RURAL POPULATION SERVED PER PHCThis indicates the basic provisioning of health centres in ruralareas and is calculated by dividing the rural population by thenumber of PHCs.
RURAL POPULATION PER SHCThis indicates the basic provisioning of health centres in ruralareas and is calculated by dividing the rural population by thenumber of SHCs.
AVERAGE AREA SERVICED PER HEALTH INSTITUTION
This indicates the physical accessibility of health institutionsand is obtained by dividing the total geographical area by thenumber of health institutions.
Table HE 1 gives details on Health Infrastructure available in the
district such as Community Health Centres (CHC), Primary Health
Centres (PHC), Sub Health Centre (SHC), District Hospitals, Urban
Civil Hospitals, Post Partum Centres etc. The Table gives popula-
tion per health centre, rural population per SHC and PHC and the
average area in sq. kms. serviced per health institution in order to
indicate the basic provisioning of these.
Year Madhya Pradesh India
Population covered per Primary Health Centres* 1996 30084 27364
Population covered per Sub Health Centres* 1996 4256 4579
Population covered per Community Health Centres (in 000)* 1996 149 214
Source: National Human Development Report, 2001
Population Covered Per Rural Health
Facility 1996: Madhya Pradesh and India
Madhya Pradesh India
Population covered per CHC Population covered per PHC
Population covered per SHC
1490000
425627364
4579
214000
30084
SECTORAL FACTSHEET

461
HE 1: HEALTH INSTITUTIONS IN MADHYA PRADESH, 2001
1 1 6 35 2861 1 5 31 2401 0 6 34 2711 0 7 19 1831 2 2 10 631 0 4 41 1891 2 11 67 3171 0 1 15 1621 2 1 11 871 2 2 25 1921 0 10 50 4000 0 8 24 1831 1 7 46 2711 1 6 24 2160 4 3 15 1010 1 2 7 611 2 5 16 1431 4 3 26 1111 2 5 16 1931 1 10 32 3460 1 5 19 1621 0 7 28 2151 2 0 46 1531 1 4 19 1961 1 5 19 1440 3 1 18 1051 0 4 15 1401 0 5 23 1751 2 4 31 1661 3 3 26 1660 0 9 30 2681 1 9 29 2451 1 6 45 2581 1 5 17 1521 0 8 29 2841 0 10 47 4131 5 5 21 1730 0 3 8 891 0 6 13 1991 0 8 42 3021 0 5 18 1561 5 2 21 1700 1 1 11 871 2 4 20 1440 3 6 53 297
36 59 229 1192 8874
BalaghatBarwaniBetulBhindBhopalChhatarpurChhindwaraDamoh DatiaDewasDharDindoriEast Nimar (Khandwa)GunaGwaliorHardaHoshangabadIndoreJabalpurJhabuaKatniMandlaMandsaurMorenaNarsimhapurNeemuchPannaRaisenRajgarhRatlamRewaSagarSatnaSehoreSeoniShahdolShajapurSheopurShivpuriSidhiTikamgarhUjjainUmariaVidishaWest Nimar (Khargone)Madhya Pradesh
District Urban Civil Community Health Primary Health Sub HealthHospital Hospital Center (CHC) Center Center
Units Units Units Units Units
District
Directorate of Health Services, GoMP

462
HE 1: HEALTH INSTITUTIONS IN MADHYA PRADESH, 2001
1 1 1 0 1 2 3290 1 0 0 1 1 2780 0 1 0 1 3 3120 0 1 0 1 0 2100 0 6 8 2 0 780 0 1 0 1 2 2350 0 2 0 1 1 3980 0 1 0 1 0 1790 0 1 0 1 2 1020 1 1 0 1 2 2220 0 1 0 1 3 4610 0 0 0 0 0 2150 0 2 14 1 2 3261 0 1 0 1 3 2480 0 3 11 1 0 1230 1 0 0 0 1 710 0 2 0 1 2 1670 0 15 13 1 3 1451 1 4 17 1 1 2170 0 1 0 1 2 3900 0 2 5 0 2 1870 0 1 0 1 0 2511 0 1 0 1 2 2020 0 1 0 1 2 2211 0 1 0 1 1 1700 0 1 0 0 4 1270 0 1 0 1 0 1600 0 1 0 1 0 2041 0 1 0 1 1 2041 1 1 3 1 2 1991 0 1 3 1 0 3070 1 3 3 1 1 2851 0 1 0 1 1 3110 0 1 0 1 1 1760 0 1 0 1 1 3221 0 2 0 1 0 4711 0 1 0 1 1 2050 0 0 0 0 0 1000 0 1 0 1 0 2190 0 1 0 1 0 3530 0 1 0 1 0 1803 0 4 3 1 4 1990 0 0 0 0 1 1001 0 1 0 1 1 1711 0 1 0 0 2 359
16 7 74 80 39 57 10390
BalaghatBarwaniBetulBhindBhopalChhatarpurChhindwaraDamoh DatiaDewasDharDindoriEast Nimar (Khandwa)GunaGwaliorHardaHoshangabadIndoreJabalpurJhabuaKatniMandlaMandsaurMorenaNarsimhapurNeemuchPannaRaisenRajgarhRatlamRewaSagarSatnaSehoreSeoniShahdolShajapurSheopurShivpuriSidhiTikamgarhUjjainUmariaVidishaWest Nimar (Khargone)Madhya Pradesh
TotalUrban FW Centre Urban Post Partum Centre Institutions
Type I Type II Type III Health Post District level level Units
District
Directorate of Health Services, GoMP

4394 35767 4377 28.053889 29776 3846 19.504469 33398 4190 32.196795 57305 5950 21.23
23549 35767 5677 35.546275 28057 6087 36.974645 20845 4406 29.696044 58506 5417 40.826155 44570 5635 26.385886 37970 4944 31.623776 29047 3631 17.692694 23019 3019 34.745240 27127 4605 33.066716 54615 6068 44.62
13251 43103 6401 37.076679 53298 6116 46.906497 46828 5240 40.16
17830 28270 6622 26.889988 57560 4772 24.013581 39864 3687 17.395688 44144 5177 26.473561 28639 3730 23.115858 20929 6292 27.407182 65477 6347 22.575632 42331 5585 30.195712 29067 4983 33.515339 49739 5329 44.595491 39710 5219 41.506143 33422 6242 30.176103 32582 5103 24.436425 55062 6164 20.577094 49325 5838 35.976009 32957 5748 24.126129 52020 5818 37.383621 36041 3680 27.203339 24992 2844 21.136294 50042 6075 30.225597 58892 5294 66.066578 92384 6035 46.935186 37361 5196 29.826684 55044 6351 28.048592 49884 6162 30.615159 39358 4976 40.767104 47724 6628 43.114262 24388 4352 22.375812 37150 4990 30
BalaghatBarwaniBetulBhindBhopalChhatarpurChhindwaraDamoh DatiaDewasDharDindoriEast Nimar (Khandwa)GunaGwaliorHardaHoshangabadIndoreJabalpurJhabuaKatniMandlaMandsaurMorenaNarsimhapurNeemuchPannaRaisenRajgarhRatlamRewaSagarSatnaSehoreSeoniShahdolShajapurSheopurShivpuriSidhiTikamgarhUjjainUmariaVidishaWest Nimar (Khargone)Madhya Pradesh
Population Rural Average Area (in sq kms)per Health Population per Rural Population serviced per
Centre PHC Served per SHC Health Institution
District
463
HE 1: HEALTH INSTITUTIONS IN MADHYA PRADESH, 2001
Directorate of Health Services, GoMP

464
HE 2: LIFE EXPECTANCY AND MORTALITY RATES
LIFE EXPECTANCY
Life Expectancy (in years at birth): Life expectancy is the number of years a newborn would live if the current mortality conditions (i.e. age-specific mortality rate) prevailedthroughout its life.
INFANT MORTALITY RATE (IMR)Infant Mortality Rate: Infant Mortality Rate is the number ofdeaths of infants less than one year of age per thousand live
births. It is calculated by dividing the number of infant deathsduring the year by number of live births during the year andmultiplying the quotient by 1000.
CHILD MORTALITY RATE (AGES 1-5)Child Mortality Rate (ages 1-5) is the number of deathsamong children aged 1-5 years per 1000 children in the sameage group.
Table HE 2 presents indirect estimates for Infant Mortality Rate,
Child Mortality, Life Expectancy at age 0 for different sections of
the populations for 1991, and some comparative figures for 1981.
These estimates are based on fertility data on total number of
children born and surviving of every married woman, given by the
census. Based on these data, IMR is calculated using Pearson's
method suggested by Census of India. Mortpak Lite, a United
Nations Programme for demography, was used extensively for
these figures. While the estimate for Infant Mortality match well
with the 1991 Sample Registration Scheme (SRS) estimates, they
are subject to modification due to need to smoothen the popula-
tion table. Thus the estimate may get modified, but for the purpose
of comparative analysis, and a fairly accurate picture of the status
of longevity, the figures are very useful and suffice well. The
estimates are also provided for rural and urban and male and
female. Estimates of male and female life expectancy were also
calculated using the widow techniques. However, the result did
not compare well with SRS estimates and hence were dropped.
Infant Mortality Rate 1991: Madhya Pradesh
All India Male Female All Male Female
120
100
80
60
40
20
0
Rural Urban Total
Per
th
ousa
nd
live
bir
ths

465
Year Madhya Pradesh India
Life Expectancy at birth Total 1992-96
All 55.2 60.7
Male 55.1 60.1
Female 54.7 61.4
Life Expectancy at birth Rural 1992-96
All 53.7 59.4
Male 53.9 58.9
Female 53.4 59.8
Life Expectancy at birth Urban 1992-96
All 63.0 66.3
Male 61.6 64.9
Female 63.4 67.7
IMR All 1999
All 89.5 70.0
Male 89.6 69.8
Female 89.5 70.8
IMR Rural 1999
All 95.8 75.4
Male 94.9 75.6
Female 96.8 75.2
IMR Urban 1999
All 55.3 43.8
Male 59.6 47.4
Female 50.7 39.7
CMR All 1991
All 94 147
Male 91 142
Female 101 151

466
HE 2: LIFE EXPECTANCY AND MORTALITY RATES
42.7 45.3 51.29 55.9 58.5 133 11040.8 43.0 48.63 51.9 54.7 148 12840.5 42.7 50.30 57.7 59.9 139 102
59.14 65.0 64.9 91 7034.4 36.6 43.96 47.3 50.4 175 15041.5 43.8 51.72 57.4 60.4 131 10337.6 39.2 44.35 53.1 54.0 173 12337.7 39.3 43.83 54.7 55.2 176 11542.5 45.0 53.60 60.2 63.3 121 9044.0 46.7 53.16 61.7 63.4 123 8443.2 45.9 47.67 58.1 57.7 154 10039.5 41.4 47.13 51.5 53.5 157 13044.6 47.4 51.43 64.9 65.3 133 7041.6 44.0 45.93 56.0 55.6 164 109
Included in Hoshangabad 55.6 Included in Hoshangabad49.3 43.0 61.29 63.9 69.7 80 7543.3 45.9 48.08 57.8 57.5 151 101
Included in Jabalpur 57.5 Included in Jabalpur43.5 45.8 51.29 51.5 55.8 133 13042.8 45.3 51.72 60.9 62.6 131 88
Included in Mandla 62.6 Included in Mandla42.2 44.7 50.16 57.1 58.5 140 104
Included in Mandsaur 58.5 Included in Mandsaur45.5 45.0 49.60 58.0 57.4 143 100
Included in Morena 57.4 Included in Morena41.0 43.3 48.08 55.9 56.9 151 11035.1 36.7 44.09 50.8 53.0 175 13339.2 41.1 47.95 52.8 55.3 152 12439.2 46.0 45.93 53.3 54.2 164 12244.2 47.0 49.88 57.9 58.1 141 10040.5 42.6 47.54 51.9 53.6 155 12842.3 44.8 46.59 54.4 54.0 160 11637.8 39.5 43.96 48.7 49.6 175 14337.4 39.0 44.87 53.2 54.5 170 12243.1 45.7 51.29 58.5 59.9 133 9839.8 41.9 47.40 55.9 57.1 155 110
Included in Shahdol 57.1 Included in Shahdol38.6 40.4 46.59 56.9 58.3 160 10537.4 38.7 43.57 44.5 47.3 178 16441.2 43.5 48.77 56.8 58.0 147 10534.7 35.8 42.93 51.0 52.8 182 13246.4 49.6 53.46 58.3 59.8 121 9938.1 39.9 46.86 52.7 54.7 158 12443.4 46.0 52.15 57.1 59.6 129 104
Included in West Nimar 59.6 Included in West Nimar
BalaghatBetulBhindBhopal* ChhatarpurChhindwaraDamohDatiaDewasDharE. Nimar (Khandwa)GunaGwaliorHoshangabadHardaIndoreJabalpurKatniJhabuaMandlaDindoriMandsaurNeemuchMorenaSheopurNarsimhapurPannaRaisenRajgarhRatlamRewaSagarSatnaSehoreSeoniShahdolUmariaShajapurShivpuriSidhiTikamgarhUjjainVidishaW. Nimar (Khargone)Barwani
Life Expectancy - All Infant Mortality Rate - All
Census : Census : Census : Census : 20011951-61 1961-71 1971-81 1981-91 (p) (projected) 1981 1991 (p)
District
Source : Census of India, 1981, 1991, F Series, Madhya Pradesh, Sanket-MPHDRO
*These estimates are provisionally calculated by the MPHDRO office based on Fertility Tables of 1991 Census.

467
HE 2: LIFE EXPECTANCY AND MORTALITY RATES
108 66 56.2 111 69 55.6 114 71 55126 86 52.2 129 88 51.7 137 98 50
83 41 62 122 80 53.3 107 65 56.472 32 64.6 69 30 65.3 129 88 51.8
135 96 50.3 165 133 44.4 156 122 46.197 54 58.8 109 67 56 108 66 56.2
124 83 52.8 120 79 53.6 130 90 51.4106 63 56.8 125 84 52.5 125 83 52.6
85 43 61.6 97 54 58.8 103 61 57.382 40 62.2 88 46 60.8 89 47 60.5
102 59 57.6 98 56 58.6 112 70 55.3117 75 54.2 143 106 48.7 133 93 50.868 30 65.5 75 35 63.9 96 54 58.9
103 61 57.3 116 74 54.5 119 78 53.8Included in Hoshangabad
66 28 66 83 42 61.9 93 50 59.8106 63 56.8 95 53 59.2 129 89 51.7
Included in Jabalpur115 73 54.7 145 107 48.4 131 91 51.289 47 60.5 85 43 61.5 88 46 60.8
Included in Mandla103 61 57.3 106 63 56.8 111 68 55.7
Included in Mandsaur89 47 60.5 112 69 55.54 107 64 56.5
Included in Morena101 58 57.9 119 77 53.9 114 71 55123 82 53 143 105 48.8 139 100 49.6127 87 52 120 78 53.7 130 90 51.4
84 42 61.8 130 90 51.4 128 88 51.8105 53 56.8 95 52 59.2 120 79 53.5119 77 53.8 137 98 49.9 133 94 50.7118 76 54.1 115 73 54.7 129 88 51.7136 97 50.1 150 114 47.4 154 120 46.4129 88 51.8 114 72 54.9 128 87 52
98 55 58.5 99 56 58.3 100 58 58114 71 55 106 63 56.8 118 76 54.1
Included in Shahdol108 66 56.2 102 59 57.7 112 70 55.3149 113 47.5 180 154 41.4 173 145 42.8104 61 57.1 107 64 56.5 109 66 56112 70 55.4 154 119 46.5 137 98 5092 49 60 107 64 56.6 111 69 55.6
119 77 53.9 131 91 51.3 136 97 50.2100 57 58.1 108 66 56.2 108 66 56.2
Included in West Nimar
BalaghatBetulBhindBhopal*ChhatarpurChhindwaraDamohDatiaDewasDharE. Nimar (Khandwa)GunaGwaliorHoshangabadHardaIndoreJabalpurKatniJhabuaMandlaDindoriMandsaurNeemuchMorenaSheopurNarsimhapurPannaRaisenRajgarhRatlamRewaSagarSatnaSehoreSeoniShahdolUmariaShajapurShivpuriSidhiTikamgarhUjjainVidishaW. Nimar (Khargone)Barwani
All Male : Years : 1981-91 (**) All Female : 1981-91 (**) (Rural : 1981-91 (**)
Infant Child Infant Child Infant ChildMortality Mortality- Life Mortality Mortality- Life Mortality Mortality- LifeRate (per ages 1-5 Expectancy Rate (per ages 1-5 Expectancy Rate (per ages 1-5 Expectancy1000 live (per 1000 (in years at 1000 live (per 1000 (in years at 1000 live (per 1000 (in years at
birth live births birth) births) live births) birth) births) live births) birth)
District
Source : Census of India, 1981, 1991, F Series, Madhya Pradesh, Sanket-MPHDRO
*These estimates are provisionally calculated by the MPHDRO office based on Fertility Tables of 1991 Census.

468
113 71 55.1 114 72 54.9 66 28 65.9136 96 50.3 138 100 49.7 84 43 61.6
88 46 60.7 130 89 51.5 74 34 64.1138 99 49.9 118 76 54.1 54 20 68.9141 103 49.2 171 142 43.2 119 78 53.7102 59 57.6 116 74 54.6 74 34 64133 93 50.9 128 87 52 72 33 64.5114 71 55 136 97 50.1 79 39 62.899 56 58.3 108 65 56.3 54 20 6985 43 61.5 94 51 59.5 51 18 69.8
113 71 55.1 112 70 55.4 56 21 68.5120 78 53.7 146 109 48.2 115 73 54.7
88 46 60.8 106 63 56.8 48 17 70.4111 69 55.6 127 86 52.1 64 27 66.4
Included in Hoshangabad86 44 61.3 99 57 58.2 64 27 66.5
137 98 50.1 120 79 53.6 51 18 69.8Included in Jabalpur
115 73 54.6 147 111 47.9 114 72 54.991 49 60.1 85 43 61.5 79 38 62.9
Included in Mandla110 67 55.8 111 69 55.5 81 40 62.5
Included in Mandsaur94 51 59.4 121 79 53.5 71 32 64.8
Included in Morena105 63 56.8 122 81 53.2 79 39 62.8130 89 51.5 148 111 47.8 80 39 62.8134 95 50.6 126 85 52.4 87 45 61.1122 80 53.2 137 98 50.1 91 49 60.1123 81 53.1 119 77 53.8 48 16 70.5126 85 52.4 142 104 48.9 91 49 60129 89 51.6 128 88 51.8 75 35 63.8147 110 47.9 162 130 44.9 90 48 60.2133 94 50.8 122 80 53.3 90 48 60.3100 57 58.2 101 59 57.7 67 29 65.8122 80 53.2 114 71 55 73 33 64.2
Included in Shahdol117 75 54.2 107 65 56.4 66 28 66154 119 46.5 190 170 39.4 106 64 56.6107 64 56.5 111 69 55.5 49 17 70.4115 73 54.7 160 128 45.2 106 63 56.7102 59 57.7 121 80 50 79 38 63131 91 51.3 141 104 49.1 69 30 65.2105 62 57 112 69 55.5 77 36 63.4
Included in West Nimar
BalaghatBetulBhindBhopal* ChhatarpurChhindwaraDamohDatiaDewasDharE. Nimar (Khandwa)GunaGwaliorHoshangabadHardaIndoreJabalpurKatniJhabuaMandlaDindoriMandsaurNeemuchMorenaSheopurNarsimhapurPannaRaisenRajgarhRatlamRewaSagarSatnaSehoreSeoniShahdolUmariaShajapurShivpuriSidhiTikamgarhUjjainVidishaW. Nimar (Khargone)Barwani
Rural Male : 1981-91 (**) Rural Female : 1981-91 (**) Urban : 1981-91 (**)
Infant Child Infant Child Infant ChildMortality Mortality- Life Mortality Mortality- Life Mortality Mortality- LifeRate (per ages 1-5 Expectancy Rate (per ages 1-5 Expectancy Rate (per ages 1-5 Expectancy1000 live (per 1000 (in years at 1000 live (per 1000 (in years at 1000 live (per 1000 (in years at
birth live births) birth) births) live births) birth) births) live births) birth)
Source : Census of India, 1981, 1991, F Series, Madhya Pradesh, Sanket-MPHDRO
**These estimates are provisionally calculated by the MPHDRO office based on Fertility Tables of 1991 Census.
HE 2: LIFE EXPECTANCY AND MORTALITY RATES
District

469
HE 2: LIFE EXPECTANCY AND MORTALITY RATES
64 27 66.5 70 31 65.187 45 61.1 83 41 6259 23 67.6 91 48 60.253 20 69.1 54 20 69
108 66 56.2 129 88 51.8na na na 79 38 62.871 32 64.7 73 33 64.374 34 64 88 46 60.843 14 71.9 65 27 66.360 24 67.5 42 13 72.160 24 67.6 52 19 69.5
103 60 75.5 128 87 5250 17 70 47 16 70.963 26 66.7 66 28 66
Included in Hoshangabad55 20 68.8 73 33 64.452 19 69.4 49 17 70.3
Included in Jabalpur109 67 56 119 77 53.9
62 25 66.9 94 52 56.3Included in Mandla
78 37 63.2 84 42 61.8Included in Mandsaur
66 28 65.9 76 35 63.7Included in Morena
63 26 66.8 96 53 5977 37 63.3 83 42 61.986 44 61.2 87 45 61.182 40 62.3 102 59 57.760 24 67.5 36 10 73.880 39 62.7 104 62 57.180 39 62.7 70 31 6583 41 62 98 55 58.699 56 55.4 81 40 62.584 43 61.7 52 18 69.674 34 64 72 32 64.5
Included in Shahdol57 21 68.3 75 35 63.8
108 65 56.3 105 62 5750 17 70.1 47 16 70.794 51 59.5 120 78 53.774 34 64.2 84 42 61.865 27 66.2 75 35 63.860 24 67.4 92 50 59.8
Included in West Nimar
BalaghatBetulBhindBhopal* ChhatarpurChhindwaraDamohDatiaDewasDharE. Nimar (Khandwa)GunaGwaliorHoshangabadHardaIndoreJabalpurKatniJhabuaMandlaDindoriMandsaurNeemuchMorenaSheopurNarsimhapurPannaRaisenRajgarhRatlamRewaSagarSatnaSehoreSeoniShahdolUmariaShajapurShivpuriSidhiTikamgarhUjjainVidishaW. Nimar (Khargone)Barwani
Urban Male : 1981-91 (**) Urban Female : 1981-91 (**)
Infant Child Infant ChildMortality Mortality- Life Mortality Mortality- LifeRate (per ages 1-5 Expectancy Rate (per ages 1-5 Expectancy1000 live (per 1000 (in years at 1000 live (per 1000 (in years at
birth live births) birth) births) live births) birth)
District
Source : Census of India, 1981, 1991, F Series, Madhya Pradesh, Sanket-MPHDRO
**These estimates are provisionally calculated by the MPHDRO office based on Fertility Tables of 1991 Census.

470
HE 3: SELECT HEALTH INDICATORS
PERCENTAGE CHILDREN IMMUNISED
Percentage children immunised is obtained by dividing thenumber of children fully immunised by the total number ofchildren in the age group of 12-23 months and multiplyingthe quotient by 100.
PERCENTAGE SAFE DELIVERIES
Percentage safe deliveries is calculated by dividing the numberof deliveries under proper hygienic conditions under thesupervision of trained health professionals by the total number of deliveries and multiplying the quotient by 100.
PERCENTAGE COUPLE PROTECTION RATE
Percentage couple protection rate is obtained by dividing thenumber of couple adopting family planning techniques by thetotal number of eligible couple and multiplying the quotientby 100.
PERCENTAGE OF GIRLS MARRYING BELOW 18 YEARS OF AGE
It is calculated by dividing the number of girls married below
the age of 18 years, the legal age for marriage of girls by thetotal population of girls upto 18 years of age and multiplyingthe quotient by 100.
PERCENTAGE PREGNANT WOMEN WITH ANTI NATAL CARE (ANC)This is obtained by dividing the percentage of pregnantwomen who received at least some of the ANC services divided by the total number of pregnant women in the sameperiod and multiplying the quotient by 100. The completeANC package consisting of 3 ANC checkups by a visiting doctor or a health professional in a medical facility, or receiv-ing a home visit form a health worker or both, intake ofrequired dose of IFA tablets and 2 tetanus toxide injections.
PERCENTAGE PREGNANT WOMEN WITH COMPLETE ANTI NATAL
CARE (ANC)This is obtained by dividing the percentage of pregnantwomen who received the full package of ANC services dividedby the total number of pregnant women in the same periodand multiplying the quotient by 100. The complete ANCpackage consisting of 3 ANC checkups by a visiting doctor ora health professional in a medical facility, or receiving a homevisit form a health worker or both, intake of required dose ofIFA tablets and 2 tetanus toxide injections.
PERCENTAGE INSTITUTIONAL DELIVERIES
Percentage Institutional Deliveries is calculated by dividingthe total number of births that took place in health facilities to the total number of births in that same period and multiplying the quotient by 100.
Table HE 3 presents the Key Health Indicators like percentage of
girls marrying below 18 years of age, Couple Protection Rate
(CPR), Unmet needs, percentage pregnant women with ANC,
percentage pregnant women with full ANC, percentage institu-
tional deliveries and percentage safe deliveries as found out from
the district level household survey carried out as part of
Reproductive Child and Health Project by the Government of India.
Data for percentage children immunised, percentage safe
deliveries and percentage couple protection rate are also
presented from other sources.
Year Madhya Pradesh India
% Fully Immunised Children aged 12-23 months 1998-99 22.4 42.0
% Couple Protection Rate 1998-99 48.59 48.2
% Births Delivered in Medical institutions 1998-99 33.6 20.4
Source: NFHS I & 2

471
HE 3: SELECT HEALTH INDICATORS
90.4 29.4 33.40 3.50 2.32 2.29 41.5231.8 34.5 36.19 6.14 3.00 4.38 49.7178.9 34.2 32.84 6.80 5.63 7.94 53.2153.8 18.9 22.00 16.01 10.03 13.34 61.3978.5 69.7 24.68 5.41 3.54 5.06 38.6929.5 24.4 21.20 11.62 5.07 7.10 44.9941.4 43.3 37.91 8.43 3.61 4.90 54.8527.2 29.1 31.97 10.55 4.16 4.15 50.8235.1 32.9 24.34 9.98 3.62 5.55 43.5050.0 99.9 34.67 7.52 3.78 5.42 51.3836.5 35.7 34.57 7.99 4.81 5.59 52.9677.1 17.6 44.86 6.09 3.26 2.58 56.7956.7 42.8 32.45 5.37 3.01 4.92 45.7530.7 36.3 24.88 9.22 3.84 5.61 43.5552.6 61.8 32.90 10.10 6.85 12.12 61.9771.0 42.6 30.78 8.73 4.15 6.63 50.3071.0 42.6 30.26 9.36 4.66 8.70 52.9868.9 72.0 36.21 13.41 5.58 6.57 61.7850.9 44.4 39.67 14.65 4.48 6.61 65.4117.4 22.4 21.98 10.19 5.47 6.16 43.8050.9 44.4 37.03 11.60 9.87 7.49 65.9977.1 17.6 31.92 4.68 3.42 2.51 42.5340.4 46.4 28.21 8.84 3.49 7.74 48.2818.6 33.0 22.45 15.38 7.23 8.89 53.9668.7 27.8 39.45 6.49 2.37 5.24 53.5540.4 46.4 28.09 10.20 3.55 9.50 51.3410.5 13.5 20.11 9.58 4.09 9.08 42.8670.6 29.4 24.43 8.74 9.38 6.74 49.2828.0 34.2 22.51 12.22 5.18 6.09 46.0048.8 60.4 29.78 8.08 3.38 4.69 45.9365.0 20.8 18.89 12.16 4.43 3.88 39.3632.4 43.0 24.71 6.60 3.59 2.89 37.7935.9 16.9 23.40 8.14 5.48 4.35 41.3826.8 38.5 29.04 11.54 5.31 11.34 57.2369.0 42.6 39.67 7.94 3.56 4.65 55.8139.7 51.7 25.45 8.86 4.26 5.70 44.2724.8 39.7 26.45 11.70 3.49 6.99 48.6318.6 33.0 21.71 14.25 11.95 7.58 55.4963.2 47.3 22.05 8.29 3.38 5.17 38.8940.8 10.4 16.75 7.32 3.27 6.20 33.5417.3 29.5 28.86 10.02 3.85 5.11 47.8357.6 68.2 32.26 6.15 4.26 5.80 48.4639.7 51.7 24.13 9.65 4.37 5.69 43.8444.0 27.8 20.62 5.83 7.05 10.77 44.2731.8 34.5 36.57 7.62 1.66 3.97 49.82
28.57 9.21 4.63 6.18 48.59
BalaghatBarwaniBetulBhindBhopalChhatarpurChhindwaraDamohDatiaDewasDharDindoriEast Nimar (Khandwa)GunaGwaliorHardaHoshangabadIndoreJabalpurJhabuaKatniMandlaMandsaurMorenaNarsimhapurNeemuchPannaRaisenRajgarhRatlamRewaSagarSatnaSehoreSeoniShahdolShajapurSheopurShivpuriSidhiTikamgarhUjjainUmariaVidishaWest Nimar (Khargone)Madhya Pradesh
SafeDeliveries %
Children (Skilled Couple Protection Rate (CPR)-2000Immunised % Attention)
1998/99 1998/99 Sterilisation IUD Oral Pills Condoms Total
A B C D E F G
District
Source : National Commission on Population 2001 for columns A and B, Directorate of Health, GoMP for columns C to G and Rapid Household Survey
in Different Districts-1998 for columns H to P

472
HE 3: SELECT HEALTH INDICATORS
34.2 45.3 54.5 21 70.3 42.3 12.3 29.4 90.427.6 48.9 61.8 20.9 69.9 53.4 25.2 34.2 78.961.2 50.6 43.7 16.8 48.3 4.8 14.1 18.9 53.834.6 47.3 63.5 23.6 77.6 49.1 52.5 69.7 78.5
73 51.8 32.8 35 53.8 15.2 19.1 24.4 29.531.4 52.6 51.7 15.1 48.1 16.0 18.9 43.3 41.454.7 45.9 41.6 24.5 49 12.2 8.5 29.1 27.249.0 50.8 40.2 21.2 29.9 6.5 23.7 32.9 35.153.5 44 58.2 23.9 55.1 15.7 35.7 99.9 5056.5 63.3 45.8 16.6 56.0 15.5 17.5 35.7 36.542.7 45.6 51.5 13.0 69.9 26.8 21.9 42.8 56.769.6 49.4 39 32.8 57.6 13.1 29 36.3 30.735.8 43.1 51.7 17.9 35.6 2.1 48.2 61.8 52.648.3 41.3 48.6 29.3 64.3 38.5 32.6 42.6 71
Included in Hoshangabad42.6 37.4 67.4 11.1 79.1 35.0 62.3 72.0 68.941.3 40.2 48.8 32.1 56.9 26.4 31.6 44.4 50.9
Included in Jabalpur58.4 63 26.8 22.1 40.2 12.2 18 22.4 17.439.1 46.5 58.2 30.4 55.3 28.8 10.7 17.6 77.1
Included in Mandla59.7 42.4 48.7 17.1 65.3 17.2 25.6 46.4 40.4
Included in Mandsaur73.9 49 48.6 38.6 60 15.6 26.4 33 18.6
Included in Morena49.3 46.9 54.1 12.1 66.6 20 17.8 27.8 68.7
58 49.2 26.8 44 36.8 9.2 10.1 13.5 10.747.6 53.7 52.5 12.4 52.1 27.3 15.9 29.4 70.6
9.4 46.8 34.8 18.8 37.8 12.6 8.3 25.7 63.148.2 43.1 53.1 24.9 65.3 23.9 30 60.4 48.860.4 56.1 38.8 26 28.2 3.6 12.9 20.8 6560.4 44.9 44.1 23.4 68.4 25.2 24.4 43 32.4
60 52.2 35.1 22.3 21.7 4.3 13.3 16.9 35.950.4 49.2 45.4 25.1 51.4 14 23.1 51.7 39.736.6 48.3 50.8 19.2 48.9 9.7 13.9 42.6 69
69 47.6 39.7 29.7 37.6 11.1 11.7 39.7 24.8Included in Shahdol
83.7 47.8 45.4 53 50.7 12.6 29.2 47.3 63.268.3 52.8 34.1 21.1 44.7 9.5 23.1 39.3 38.868.8 59.2 29.5 25.1 17 2.5 7.3 10.4 40.8
70 49.6 45.5 12.7 23 2.5 21.5 29.5 17.342.4 40.5 58.6 25.1 65.3 28 41.1 68.2 57.6
60 51.1 40.9 21.6 61.9 11.8 19.6 27.8 4442.7 51.2 48.9 21.8 61.3 18.8 19.4 34.5 31.8
Included in West Nimar
BalaghatBetulBhindBhopalChhatarpurChhindwaraDamohDatiaDewasDharEast Nimar (Khandwa)GunaGwaliorHoshangabadHardaIndoreJabalpurKatniJhabuaMandlaDindoriMandsaurNeemuchMorenaSheopurNarsinghpurPannaRaisenRajgarhRatlamRewaSagarSatnaSehoreSeoniShahdolUmariaShajapurShivpuriSidhiTikamgarhUjjainVidishaWest Nimar (Khargone)Barwani
Percentage Percentage Percentage PercentageGirls Percentage Pregnant Pregnant Percentage Percentage Children with
Marrying Births order CPR Unmet Women Women with Institutional Safe Completebelow 18 3 and above- (Any)- Need- with ANC- Full ANC- Delivery- Delivery- Immunissation-
Years-1998 1998 1998 1998 1998 1998 1998 1998 1998
H I J K L M N O P
District
Source : National Commission on Population 2001 for columns A and B, Directorate of Health, GoMP for columns C to G and Rapid Household Survey
in Different Districts-1998 for columns H to P

ADB (Asian Development Bank). 1999. Support for theGovernment of Madhya Pradesh Public Finance Reform and Institutional Strengthening. Final Report, TA No 2943-IND.Tata Consultancy Services, India and Ernst & Young,Canada.
Census of India. 1991. Madhya Pradesh District Profile1991.Census of India. Registrar General and CensusCommissioner. New Delhi, India.
______. 1991. State Profile 1991.Census of India. RegistrarGeneral and Census Commissioner. New Delhi, India
______. 1991. Census of India 1991 Final Figure PrimaryCensus Abstract-Madhya Pradesh. Director of CensusOperations, Madhya Pradesh. Bhopal, Madhya Pradesh.
______. 2001. Provisional Population Totals, SupplementPaper-1 of 2001, Series 24, Madhya Pradesh. Census of India,2001, Director of Census Operations. Bhopal, MadhyaPradesh.
______. 2001. Provisional Population Totals, SupplementPaper-2 of 2001, Series 24, Madhya Pradesh. Census of India,2001, Director of Census Operations. Bhopal, MadhyaPradesh.
GoI (Government of India). 1997. Economic Survey 1996-97.Ministry of Economics Division, Government of India. NewDelhi, India.
______. 1998. Health Information of India 1995-96. CentralBureau of Health Intelligence, Directorate General of HealthServices, Ministry of Health and Family Welfare, Governmentof India. New Delhi, India.
______. 2000. Economic Survey 1999-2000. Ministry ofEconomics Division, Government of India. New Delhi,India.
______. 2000. Health Information of India 1997-1998. CentralBureau of Health Intelligence, Directorate General of HealthServices, Ministry of Health and Family Welfare, Governmentof India. New Delhi, India.
______. 2000. Mid Term Appraisal of Ninth Five Year Plan
(1997-2002). Planning Commission, Government of India.New Delhi, India.
______. 2001. Indian Economic Survey 2000-2001. Ministry ofEconomics Division, Government of India. New Delhi, India.
______. 2002. Indian Economic Survey 2001-2002. Ministry ofEconomics Division, Government of India. New Delhi, India.
______. 2002. National Human Development Report 2001.Planning Commission, Government of India. New Delhi,India.
GoMP (Government of Madhya Pradesh). 1989. AgriculturalStatistics 1988-89. Directorate of Agriculture, Government ofMadhya Pradesh. Bhopal, Madhya Pradesh.
______. 1995. Basic Agricultural Statistics Madhya Pradesh1989-90 to 1993-94. Commissioner, Land Records andSettlement, Madhya Pradesh, Gwalior. Madhya Pradesh.
______. 1995. Madhya Pradesh ka Arthik Sarvekshana 1995-96Directorate of Economics and Statistics, Government ofMadhya Pradesh. Bhopal, Madhya Pradesh.
______. 1996. Compendium of Power Statistics 1994-95.Madhya Pradesh Electricity Board. Jabalpur, Madhya Pradesh.
______. 1996. Madhya Pradesh ka Arthik Sarvekshana 1995-96. Directorate of Economics and Statistics, Government ofMadhya Pradesh. Bhopal, Madhya Pradesh.
______. 1996. Road Statistics 1995. Government of MadhyaPradesh, Public Works Department. Bhopal, Madhya Pradesh.
______. 1997. Block wise Main Development Indicators ofMadhya Pradesh 1993-94. Directorate of Economics andStatistics, Government of Madhya Pradesh. Bhopal, MadhyaPradesh.
______. 1997. Compendium of Power Statistics 1994-95.Madhya Pradesh Electricity Board. Jabalpur, Madhya Pradesh.
______. 1998. The Madhya Pradesh Human DevelopmentReport 1998. Directorate of Institutional Finance, Governmentof Madhya Pradesh. Bhopal, Madhya Pradesh.
References
473

______. 1999. Estimates of State Domestic Product of MadhyaPradesh 1980-81 to 1997-98. Directorate of Economics andStatistics, Government of Madhya Pradesh. Bhopal, MadhyaPradesh.
______. 1999. Madhya Pradesh ka Arthik Sarvekshana 1998-99. Directorate of Economics and Statistics, Government ofMadhya Pradesh. Bhopal, Madhya Pradesh.
______. 2000. Agricultural Statistics 2000. Directorate ofAgriculture, Government of Madhya Pradesh. Bhopal,Madhya Pradesh.
______. 2000. Basic Agricultural Statistics Madhya Pradesh1994-95 to 1998-99. Commissioner, Land Records andSettlement, Madhya Pradesh, Gwalior. Madhya Pradesh.
______. 2000. District wise Ten Years Socio-EconomicDevelopment Indicators of Madhya Pradesh 1985-86 to 1994-95. Directorate of Economics and Statistics, Government ofMadhya Pradesh. Bhopal, Madhya Pradesh.
______. 2000. Estimates of State Domestic Product of MadhyaPradesh 1993-94 to 1998-Directorate of Economics andStatistics, Government of Madhya Pradesh. Bhopal, MadhyaPradesh.
______. 2000. Madhya Pradesh ka Arthik Sarvekshana 1999-2000. Directorate of Economics and Statistics, Government ofMadhya Pradesh. Bhopal, Madhya Pradesh.
______. 2001. Estimates of State Domestic Product of MadhyaPradesh 1993-94 to 1999-2000.Directorate of Economics andStatistics, Government of Madhya Pradesh. Bhopal, MadhyaPradesh.
______. 2001. Policy Thrust for Economic Development ofMadhya Pradesh. Government of Madhya Pradesh. Bhopal,Madhya Pradesh.
______. 2002. Madhya Pradesh ka Arthik Sarvekshana 2001-2002. Directorate of Economics and Statistics, Government ofMadhya Pradesh. Bhopal, Madhya Pradesh.
Gopalakrishnan, R. and Agnani, Manohar.1998. SwasthaJeevan Sewa Guarantee Yojna-Moving Towards DecentralisedManagement of Health Care in Madhya Pradesh. OccasionalPaper No-8. Rajiv Gandhi Mission. Bhopal, Madhya Pradesh.
IIPS (International Institute for Population Sciences) andORC Marco. 2001. National Family Health Survey (NFHS-2),India, 1998-99: Madhya Pradesh. Mumbai, India.
NABARD (National Bank for Agriculture and RuralDevelopment). 2001. Madhya Pradesh State Focus Paper.National Bank for Agriculture and Rural Development.Bhopal, Madhya Pradesh
NNMB (National Nutrition Monitoring Bureau). 2000.Nutritional Status of Tribal Report on First Repeat Survey.
NSSO (National Sample Survey Organisation). 1983.Sarvekshana Report on the Third Quinquennial Survey onEmployment and Unemployment: NSS 38th Round (January-December 1983). Department of Statistics, Ministry ofPlanning, Government of India. New Delhi, India.
______. 1998. Sarvekshana Results of the Fourth QuinquennialSurvey on Employment and Unemployment (All India): NSS43rd Round (July 1987- June 1988). Department of Statistics,Ministry of Planning, Government of India.
______. 1998. Morbadity and Treatment of Ailment.52nd Issue July 1995-June 1996 Ministry of Statistics andProgramme Implementation, Government of India. NewDelhi, India.
______. 1999. Sarvekshana: Vol.XXII, No.3, 78th Issue January-March, 1999. Ministry of Statistics and ProgrammeImplementation, Government of India. New Delhi, India.
______. 2000. Sarvekshana: Vol. XXIII, No.3, 82nd Issue(Special) January-March 2000. Ministry of Statistics andProgramme Implementation, Government of India. NewDelhi, India.
______. 2001. Employment and Unemployment Situation inIndia 1999-2000 (Part-I and II): NSS 55th Round (July 1999-June 2000). Ministry of Statistics and ProgrammeImplementation, Government of India.
PRC (Population Research Centre), Directorate of Economicsand Statistics, Bhopal and IIPS (International Institute forPopulation Sciences). 1995. National Family Health Survey(MCH and Family Planning), Madhya Pradesh 1992. Bombay,India.
RGI (Registrar General of India). 1998. Sample RegistrationSystem, Statistical Report 1996. New Delhi, India.
______. 1999. Compendium of Fertility and MortalityIndicators 1971-1997. New Delhi, India.
Sharma, Amita. 2000. Idea of Education. Occasional PaperNo.-7. Rajiv Gandhi Mission. Bhopal, India.
R E F E R E N C E S
474

UNDP (United Nations Development Programme). 1995.Human Development Report 1995. New York: OxfordUniversity Press.
______. 1996. Human Development Report 1996. New York:Oxford University Press.
______. 1997. India: The Road to Human Development, India,Development Firm, Peris, 23-25 June 1997. UNDP. New Delhi,India.
______. 1999. Human Development Report 1999. New York:Oxford University Press.
UNFPA (United Nations Population Fund). 1997. IndiaTowards Population and Development Goals, 1997. United
National System in India, Oxford University Press.
______. 2000. Rapid Assessment: Quality of ReproductiveHealth Services in the UNFPA Supported Integrated andPopulation Development Projects.
VHAI (Voluntary Health Association of India). 1994. A Reporton National Consultation on Tuberculosis.
Vinod, James, and Sunil K. Sinha. 1995. Indirect Estimates ofFertility and Mortality at the District Level, 1981. OccasionalPaper 4 of 1994. New Delhi: Office of the Registrar General,India.
World Bank. 1997. India Achievement and Challenges inReducing Poverty. A World Bank Country Study.
475
R E F E R E N C E S

N O T E S
476

477
N O T E S

N O T E S
478