
The low-frequency radio eclipses of the black widow pulsar ...
15
HAL Id: hal-01714265 https://hal.archives-ouvertes.fr/hal-01714265 Submitted on 20 Sep 2019 HAL is a multi-disciplinary open access archive for the deposit and dissemination of sci- entific research documents, whether they are pub- lished or not. The documents may come from teaching and research institutions in France or abroad, or from public or private research centers. L’archive ouverte pluridisciplinaire HAL, est destinée au dépôt et à la diffusion de documents scientifiques de niveau recherche, publiés ou non, émanant des établissements d’enseignement et de recherche français ou étrangers, des laboratoires publics ou privés. The Low-Frequency Radio Eclipses of the Black Widow Pulsar J1810+1744 E.J. Polzin, R.P. Breton, A.O. Clarke, V.I. Kondratiev, B.W. Stappers, J.W.T. Hessels, C.G. Bassa, J.W. Broderick, J.M. Grießmeier, C. Sobey, et al. To cite this version: E.J. Polzin, R.P. Breton, A.O. Clarke, V.I. Kondratiev, B.W. Stappers, et al.. The Low-Frequency Radio Eclipses of the Black Widow Pulsar J1810+1744. Monthly Notices of the Royal Astronomical Society, Oxford University Press (OUP): Policy P - Oxford Open Option A, 2018, 476 (2), pp.1968- 1981. 10.1093/mnras/sty349. hal-01714265
Transcript of The low-frequency radio eclipses of the black widow pulsar ...
HAL Id: hal-01714265https://hal.archives-ouvertes.fr/hal-01714265
Submitted on 20 Sep 2019
HAL is a multi-disciplinary open accessarchive for the deposit and dissemination of sci-entific research documents, whether they are pub-lished or not. The documents may come fromteaching and research institutions in France orabroad, or from public or private research centers.
L’archive ouverte pluridisciplinaire HAL, estdestinée au dépôt et à la diffusion de documentsscientifiques de niveau recherche, publiés ou non,émanant des établissements d’enseignement et derecherche français ou étrangers, des laboratoirespublics ou privés.
The Low-Frequency Radio Eclipses of the Black WidowPulsar J1810+1744
E.J. Polzin, R.P. Breton, A.O. Clarke, V.I. Kondratiev, B.W. Stappers,J.W.T. Hessels, C.G. Bassa, J.W. Broderick, J.M. Grießmeier, C. Sobey, et al.
To cite this version:E.J. Polzin, R.P. Breton, A.O. Clarke, V.I. Kondratiev, B.W. Stappers, et al.. The Low-FrequencyRadio Eclipses of the Black Widow Pulsar J1810+1744. Monthly Notices of the Royal AstronomicalSociety, Oxford University Press (OUP): Policy P - Oxford Open Option A, 2018, 476 (2), pp.1968-1981. �10.1093/mnras/sty349�. �hal-01714265�

MNRAS 476, 1968–1981 (2018) doi:10.1093/mnras/sty349Advance Access publication 2018 February 9
The low-frequency radio eclipses of the black widow pulsar J1810+1744
E. J. Polzin,1‹ R. P. Breton,1‹ A. O. Clarke,1 V. I. Kondratiev,2,3 B. W. Stappers,1
J. W. T. Hessels,2,4 C. G. Bassa,2 J. W. Broderick,2 J.-M. Grießmeier,5,6 C. Sobey,7,8
S. ter Veen,2 J. van Leeuwen2,4 and P. Weltevrede1
1Jodrell Bank Centre for Astrophysics, School of Physics and Astronomy, The University of Manchester, Manchester M13 9PL, UK2ASTRON, the Netherlands Institute for Radio Astronomy, Postbus 2, NL-7990 AA, Dwingeloo, The Netherlands3Astro Space Centre, Lebedev Physical Institute, Russian Academy of Sciences, Profsoyuznaya Str. 84/32, Moscow 117997, Russia4Anton Pannekoek Institute for Astronomy, University of Amsterdam, Science Park 904, NL-1098 XH Amsterdam, the Netherlands5LPC2E – Universite d’Orleans/CNRS, F-45071 Orleans cedex 2, France6Station de Radioastronomie de Nancay, Observatoire de Paris, PSL Research University, CNRS, Univ. Orleans, F-18330 Nancay, France7International Centre for Radio Astronomy Research – Curtin University, GPO Box U1987, Perth, WA 6845, Australia8CSIRO Astronomy and Space Science, 26 Dick Perry Avenue, Kensington, WA 6151, Australia
Accepted 2018 February 7. Received 2018 February 5; in original form 2017 December 12
ABSTRACTWe have observed and analysed the eclipses of the black widow pulsar J1810+1744 at lowradio frequencies. Using LOw-Frequency ARray (LOFAR) and Westerbork Synthesis RadioTelescope observations between 2011 and 2015, we have measured variations in flux den-sity, dispersion measure, and scattering around eclipses. High-time resolution, simultaneousbeamformed, and interferometric imaging LOFAR observations show concurrent disappear-ance of pulsations and total flux from the source during the eclipses, with a 3σ upper limitof 36 mJy (<10 per cent of the pulsar’s averaged out-of-eclipse flux density). The dispersionmeasure variations are highly asymmetric, suggesting a tail of material swept back due toorbital motion. The egress deviations are variable on time-scales shorter than the 3.6 h orbitalperiod and are indicative of a clumpy medium. Additional pulse broadening detected duringegress is typically <20 per cent of the pulsar’s spin period, showing no evidence of scatteringthe pulses beyond detectability in the beamformed data. The eclipses, lasting ∼13 per cent ofthe orbit at 149 MHz, are shown to be frequency-dependent with total duration scaling as ∝ν−0.41 ± 0.03. The results are discussed in the context of the physical parameters of the system,and an examination of eclipse mechanisms reveals cyclotron–synchrotron absorption as themost likely primary cause, although non-linear scattering mechanisms cannot be quantitativelyruled out. The inferred mass-loss rate is a similar order of magnitude to the mean rate requiredto fully evaporate the companion in a Hubble time.
Key words: plasmas – scattering – binaries: eclipsing – stars: mass-loss – pulsars: individual:PSR J1810+1744.
1 IN T RO D U C T I O N
Black widow pulsars are those which reside in a short orbital period(� 1 d) binary system with a low-mass companion star. Similarlyto redback pulsars, they differ from typical pulsar – white dwarfbinaries due to the irradiation of the companion star by the pulsar’shigh-energy wind. Black widows and redbacks represent two classesof these irradiating binaries that are separated by the companionstar’s mass, with black widow companions typically falling in the
� E-mail: [email protected] (EJP); [email protected] (RPB)
range ∼0.01–0.05 M�, while larger redback companions typicallyhave masses in the range ∼0.1–0.5 M� (Roberts 2013).
The recent surge in the discovery of black widow pulsars fromtargeted searches of γ -ray sources found with the Fermi Gamma-raySpace Telescope (e.g. Ray et al. 2012; Camilo et al. 2015; Cromartieet al. 2016) offers an invaluable opportunity to characterize the gen-eral population of these puzzling systems. The first such system to bediscovered, PSR B1957+20 (Fruchter, Stinebring & Taylor 1988a),was found to exhibit eclipses of the radio pulses for ∼10 per centof the orbit, centred near inferior conjunction of the companionstar. The duration of the eclipses shows that the eclipsing mediummust reside outside of the companion’s Roche lobe, and opticalobservations imply a heavily irradiated degenerate companion star
C© 2018 The Author(s)Published by Oxford University Press on behalf of the Royal Astronomical Society
Dow
nloaded from https://academ
ic.oup.com/m
nras/article-abstract/476/2/1968/4848310 by CN
RS user on 20 Septem
ber 2019

Eclipses of PSR J1810+1744 1969
(Fruchter et al. 1988b), suggesting that ablation of the companionstar from the pulsar wind constantly replenishes a plasma surround-ing the star. Potentially magnetized, it is this plasma that is assumedto cause eclipsing of the pulsar through as-yet undetermined mech-anisms (see Thompson et al. 1994, for a review). This ablation ofthe companion is theorized to eventually fully evaporate the star,and as such we are observing the formation route towards isolatedGalactic millisecond pulsars (Ruderman, Shaham & Tavani 1989).However, modelling of the winds driven from the companion starin PSR B1957+20 casted doubts on the mass loss being sufficientto achieve complete evaporation within Hubble time (Eichler &Levinson 1988).
Until recently, only one other eclipsing black widow pulsar wasknown in the Galactic field, PSR J2051−0827 (Stappers et al.1996). Observed eclipsing phenomena similar to those seen in PSRB1957+20 revealed the necessity of studies at radio frequencies toact as a unique probe into the pulsar wind, eclipse mechanisms, andevolution of black widow systems. However, this limited samplehas thus far allowed in-depth radio frequency studies to be carriedout for only three Galactic field black widows: PSRs B1957+20(Fruchter et al. 1990; Ryba & Taylor 1991), J2051−0827 (Stapperset al. 2001), and J1544+4937 (Bhattacharyya et al. 2013). Thus,many details of these systems remain unclear, and attempts to con-strain their global properties require a much larger sample to succeed(e.g. Wadiasingh et al. 2017).
Many features of black widow systems lend themselves tolow-frequency observing. Many of the known millisecond pul-sars are steep spectrum, i.e. significantly brighter towards lowerradio frequency (Kramer et al. 1999; Kuzmin & Losovsky 2001;Kondratiev et al. 2016). Increased dispersion and scattering of pulsa-tions typically observed near eclipses in black widows (e.g. Stapperset al. 2001) is much more prominent at low observing frequencies.In addition, with telescopes such as the LOw-Frequency ARray(LOFAR; van Haarlem et al. 2013; van Leeuwen & Stappers 2010)offering unprecedented sensitivity at frequencies below 200 MHz –a relatively untouched area for eclipse observations – valuable op-portunities to study these systems are available. A detailed reviewof observing pulsars with LOFAR is provided in Stappers et al.(2011).
Part of the fresh influx of black widow systems (Roberts 2013),PSR J1810+1744 was discovered in a 350 MHz survey of uniden-tified Fermi sources with the Green Bank Telescope (Hesselset al. 2011). The 1.66 ms pulsar hosts a companion in a tight,3.56 h, orbit and at low radio frequencies, it is one of the bright-est known millisecond pulsars (Kondratiev et al. 2016; Kuniyoshiet al. 2015). Evidence for irradiation of the companion is foundin optical observations showing the signature of a heated innerface of the tidally locked star (Breton et al. 2013; Schroeder &Halpern 2014). Both of these papers cite difficulty in fitting real-istic parameters to the observed optical light curves, and suggesta minimum companion mass, MC � 0.045 M�; large for typicalblack widow companions. Gentile et al. (2013) observed the systemin X-rays and found no clear evidence for orbital modulation ofthe X-ray brightness, which is normally ascribed to an intrabinaryshock.
Here, we present multiple low-frequency observations of theeclipses of PSR J1810+1744, utilizing both beamformed and in-terferometric methods, in order to probe the mass-loss and eclipsemechanisms. Details of the observations are provided in Section 2,with analysis techniques following in Section 3. The observedeclipses are characterized in Section 4, and the measured parametersare discussed in the context of eclipse mechanisms in Section 5.
2 O BSERVATI ONS
Aside from a single observation made with the Westerbork Syn-thesis Radio Telescope (WSRT; Baars & Hooghoudt 1974), all ofthe observations presented in this paper were carried out usingLOFAR over a range of different projects between 2012 Decemberand 2015 February. As listed in Table 1, in total we present ∼14 hof LOFAR data covering two full eclipses, three eclipse ingressesand five eclipse egresses, including one full eclipse and one egresscovered in an interferometric observing mode. Both interferometricand beamforming modes were used in order to provide image planeand high-time resolution observations, respectively.
2.1 LOFAR beamformed observations
These observations utilized the wide fractional bandwidth of theLOFAR High Band Antennas (HBA), spanning the frequency range110–188 MHz at a centre frequency of 149 MHz. Dual orthogonallinear polarization signals from 18 to 23 LOFAR Core stations weredirected into the Central Processing Facility correlator where thestation data streams were coherently summed.
The majority of the data were collected using the LOFAR co-herent Stokes mode to form 1–2 tied-array beams (TABs) from theCore stations. Observations with two TABs had one beam centredon the coordinates of the pulsar and a second beam displaced by∼6 arcmin in declination. The second, off-source beam provideda means of discriminating between loss of pulsations and loss oftotal flux from the pulsar, and is described further in Section 4. Pre-processing of these data was performed using the LOFAR PulsarPipeline (PulP). PulP (Alexov et al. 2010; Stappers et al. 2011) is anoffline pipeline that utilizes the software packages PRESTO1 (Ransom2001), DSPSR2 (van Straten & Bailes 2011), and PSRCHIVE3 (Hotan,van Straten & Manchester 2004) to form dedispersed, folded dataproducts for analysis . Specifically here, PulP was used for coherentdedispersion and folding (DSPSR) of the data into archive files with5 s sub-integrations, 256 pulse phase bins, and 400 frequency chan-nels, each of 195.3 kHz width, and RFI excision with PSRCHIVE’spaz.
Further processing of the data consisted of both flux and po-larization calibration. Polarization calibration followed the methodof Noutsos et al. (2015) to apply the inverse of the instrumentalresponse using the Jones matrices generated from the Hamaker–Carozzi beam model (Hamaker 2006, with MSCORPOL4) for eachbeam pointing and frequency channel. Application of the Jones ma-trices to perform the calibration used psrchive’s pac command.psrchive’s pam was then used to convert the calibrated data intothe four Stokes parameters, I, Q, U, V.
Flux calibration was performed using LOFAR_FLUXCAL.PY fromthe LOFAR-BF-PULSAR-SCRIPTS package5, detailed in Kondratiev et al.(2016), to correct for instrumental gain variations as a function oftime and frequency. In brief, the script scales each sub-integration,frequency channel, and polarization based on a theoretical flux den-sity estimation using the signal to noise of the data and assumedvalues for instrumental effects. Specifically, this once again makesuse of the Hamaker–Carozzi beam model, system temperature esti-mations using the Haslam et al. (1982) sky model scaled to LOFAR
1 https://github.com/scottransom/presto2 http://dspsr.sourceforge.net/3 https://psrchive.sourceforge.net/4 https://github.com/2baOrNot2ba/mscorpol5 https://github.com/vkond/LOFAR-BF-pulsar-scripts
MNRAS 476, 1968–1981 (2018)
Dow
nloaded from https://academ
ic.oup.com/m
nras/article-abstract/476/2/1968/4848310 by CN
RS user on 20 Septem
ber 2019

1970 E. J. Polzin et al.
Table 1. List of observations. aL260707, L260713, L260719, L260725, L260731, L260737, L260743, and L260749. bEight consecutive observations of30 min, separated by 7 min intervals. cLOFAR TABs. dCentre frequency of observation.
Date Telescope Project ID Obs ID Duration Orbital phase Comments
2015Feb19 LOFAR LC2_039 a 8 × 30 m 0.20–1.55b Interferometricand beamformed
2014 Sept 19 LOFAR LC2_026 L243355 1 h 0.24–0.52 2 TABsc
2014 Sept 18 LOFAR LC2_026 L243365 1 h 0.21–0.49 2 TABsc
2014 June 17 LOFAR LC2_026 L231759 1 h 0.25–0.53 2 TABsc
2013 Oct 02 LOFAR LC0_011 L181912 5 m 0.18–0.202013 July 26 LOFAR DDT_005 L166106 2 h 6 m 0.70–1.292013 July 25 LOFAR DDT_005 L166110 2 h 42 m 0.81–1.562013 July 24 LOFAR DDT_005 L165450 2 h 12 m 0.20–0.832012 Dec 20 LOFAR LC0_011 L81280 20 m 0.12–0.222011 June 06 WSRT S11A008 11102762 5 h 0.60–2.00 345 MHzd
frequencies as ν−2.55 (Lawson et al. 1987) and model antenna tem-peratures from Wijnholds & van Cappellen (2011) as a function offrequency. Also accounted for are the fraction of operational HBAtiles, fraction of channels, and sub-integrations that were exciseddue to RFI during PulP, and a power-law scaling of coherent sta-tion summation based on the number of HBA stations used. Thenoise level in the data is estimated using the mean and standarddeviation of a pre-defined off-pulse region of the profile in eachsub-integration, channel, and polarization. In order to avoid biasingthis estimation, it was necessary to dedisperse each sub-integrationindividually (at the eclipse edges in particular) so that the pulsarflux did not smear into the pre-defined off-pulse region. The im-portance of flux calibration was clearest in the long-duration obser-vations, where variations in beam shape and shadowing of antennatiles became more pronounced over the range of beam elevations.The calibrated data were re-folded into sub-integrations of duration5–60 s depending on the signal to noise in each observation. Exam-ples of the calibrated beamformed data are shown in Fig. 1, wherethe radio pulses can be seen to be delayed and reduced in fluxdensity near the eclipses.
2.2 WSRT beamformed observation
WSRT data from 2011 June were used to provide a comparativelyhigher radio frequency probe into the eclipse. These data were inthe form of a single 5 h observation using the PuMa-II pulsar back-end (Karuppusamy, Stappers & van Straten 2008) with a bandwidthbetween 310 and 380 MHz, centred on 345 MHz. Using dspsr,the data were coherently dedispersed and folded into 1 min sub-integrations, 128 pulse phase bins, and 512 frequency channels,each of 156 kHz width. Here, a simpler flux calibration method wasused which, although not providing an absolute flux density scale,normalized the profile in each sub-integration and frequency chan-nel based on the off-pulse noise level in order to remove telescopegain variations to first order. Once again the data were dedispersedseparately for each sub-integration around eclipse orbital phases toavoid leakage of pulsar flux into the baseline noise estimation.
2.3 Timing ephemerides
Initial visual inspection of the data showed the pulses to drift sig-nificantly in phase within each observation, highlighting the lackof a satisfactory long-term timing solution for this pulsar. As oftenobserved in black widows (e.g. Arzoumanian, Fruchter & Taylor1994; Shaifullah et al. 2016), due to as-yet undetermined mecha-nisms, the orbital period can vary on relatively short time-scales,
Figure 1. Calibrated, folded beamformed data from observations of PSRJ1810+1744. Top/middle: pulse phase against orbital phase for three obser-vations near eclipse. Observation IDs are indicated in the plots. An orbitalphase of 0.25 corresponds to inferior conjunction of the companion. Delaysin the pulse arrival times are apparent in the two eclipse egresses. Bot-tom: pulse profiles, each integrated over 1 min of data from the observationL231759. The orbital phases of the centre of each 1 min integration areshown as dashed vertical lines in the upper right egress plot, with num-bers corresponding to the labels in the profile plots. Each profile has beennormalized to the maximum flux density of profile no. 1.
leading to difficulties in defining an ephemeris that can be used tocorrectly fold data over a range of observations. To account for this,tempo6 (Hobbs, Edwards & Manchester 2006) was used to find asatisfactory ephemeris for each individual observation by fitting theout-of-eclipse pulse times of arrival through adjustment of the spinfrequency and its derivative (F0 and F1), binary period (PB), andtime of ascending node (T0) timing parameters. See Appendix Afor orbital ephemerides used.
2.4 LOFAR interferometric observations
Simultaneous interferometric and beamformed LOFAR observa-tions were undertaken in 2015 February. Using the ∼4◦ full widthat half-maximum of the LOFAR Core HBA beam (at ∼150 MHz),the interferometric data were collected with spectral and temporal
6 https://sourceforge.net/projects/tempo2/
MNRAS 476, 1968–1981 (2018)
Dow
nloaded from https://academ
ic.oup.com/m
nras/article-abstract/476/2/1968/4848310 by CN
RS user on 20 Septem
ber 2019

Eclipses of PSR J1810+1744 1971
Figure 2. A sequence of LOFAR images showing eclipse ingress. The position of PSR J1810+1744 is at the centre of the red circle in each image. The imageswere formed with an integration time of 1 min, and are cropped to a 1◦ × 1◦ square centred on the pulsar coordinates. The orbital phase at the centre point ofeach integration time is shown in the top right hand corner of each image, with a phase of 0.25 corresponding to inferior conjunction of the companion. Thesynthesized beam shape is shown in the lower left hand corner of each image.
resolutions of ∼3 kHz and 1 s, respectively. The maximum baselineof the LOFAR Core stations is ∼2 km, corresponding to a resolutionof ∼165 arcsec at 150 MHz. These raw visibilities were reduced inan averaging pipeline and the resulting output stored on the LOFARLong Term Archive in measurement sets with time intervals of 10 sduration and frequency channels of ∼49 kHz width. Further detailsof the LOFAR pipeline are available in Heald et al. (2010). The5 h observing time was split into alternate beam pointings of 7 mincentred on flux calibrator 3C295, followed by 30 min centred onthe pulsar, leading to coverage of slightly over one orbit.
The measurement sets were processed using standard LOFARmethods, with AOFLAGGER (Offringa et al. 2010; Offringa, van deGronde & Roerdink 2012b; Offringa, de Bruyn & Zaroubi 2012a)used for RFI flagging and Black Board Self-calibration (Pandeyet al. 2009) used for both flux and phase calibrations. Flux cali-bration of 3C295 was carried out using a pre-defined LOFAR skymodel for the source78 (Scaife & Heald 2012) and the resultinggain solutions were applied to the pulsar measurement sets. We per-formed self-calibration using a sky model of the source region fromthe TGSS LOFAR Sky Model Creator9. Imaging of the calibratedvisibilities was carried out using CASA10, thus no primary beam cor-rection was applied. This lack of correction is justified due to thelocation of the pulsar at the centre of the image, thus the effect ofa changing beam over time is negligible. Due to the brightness ofPSR J1810+1744, we were able to make images of the field using1 min time intervals of data, over the full ∼80 MHz bandwidth, withthe pulsar detectable at ∼40 × the typical rms noise of ∼12 mJy inthe 1 min images. A sequence of the 1 min images, zoomed into a1◦ × 1◦ area centred on the pulsar, is shown in Fig. 2, as the pulsarenters into eclipse.
3 A NA LY SIS
3.1 Analysis of beamformed data
Key to our understanding of eclipsing pulsars is detecting variationsin pulsar flux density, dispersion measure (DM), and scatteringthroughout the orbit in order to constrain the physical parameters ofthe material in the eclipsing medium. Here, we adopted a template
7 https://github.com/lofar-astron/prefactor/tree/master/skymodels8 Scaife & Heald (2012) quote ∼3 per cent uncertainty on flux density at
149 MHz.9 http://tgssadr.strw.leidenuniv.nl/doku.php
10 https://casa.nrao.edu/
fitting method, written in PYTHON11, to measure these parameters inour data as a function of orbital phase.
Initially, two pulsar templates were generated: one for LOFAR,and one for WSRT. The templates were made by spin-phase aligningand summing together in time all of the out-of-eclipse observationsof the pulsar to ensure maximum signal to noise, while avoiding anypulse smearing near eclipse edges. To aid in breaking degeneraciesbetween small changes in DM and scattering, the templates weretwo-dimensional, with frequency and pulse phase binning equal tothat of the data. A third-order Savitzky–Golay filter (Savitzky &Golay 1964) was applied along both axes to smooth out the small-scale noise variations that remained. An array of further templateswas made by dispersing and scattering the stock, out-of-eclipsetemplates with given DM deviations, �DM, and scattering time-scale deviations, �τ , over ranges of �DM and �τ pre-determinedby inspection of the data. For LOFAR, templates were made for0 ≤ �DM ≤ 0.01 in 5 × 10⁻⁵ pc cm−3 steps, and 0 ≤ �τ ≤ P,where P is the pulse period, in steps of 0.02P. For WSRT, templateswere made for 0 ≤ �DM ≤0.03 in 1 × 10⁻⁴ pc cm−3 steps, andsimilarly 0 ≤ �τ ≤ P, in steps of 0.02P. We assumed validity ofthe cold plasma dispersion relation, �tDM ∝ ν−2, and modelledscattering as a convolution of the pulse with a frequency-dependentexponential, 1
τexp−t/τ , where τ ∝ ν−4 (Lang 1971; Lee & Jokipii
1976).For each sub-integration of data, a least-squares fit of the ar-
ray of templates was performed, returning a minimized χ2 valueper template. Both the baseline and scale factor of each templatewere free parameters in the fits, treating the template as a singleentity (as opposed to each frequency channel individually) assum-ing that scintillation will not affect the spectral index over time, asdiscussed in Section 3.3. Thus, for each sub-integration of data, atwo-dimensional χ2 map was obtained over the ranges of �DM and�τ . Finding the maximum likelihood of �τ allowed the distributionof χ2 values for �DM to be plotted as a function of sub-integrationof data, and vice versa for �τ . The resulting contour maps areshown in Fig. 3 with contours plotted for 1σ , 2σ , and 3σ deviationsfrom the minimum χ2, taking into account any degeneracy between�DM and �τ . Fig. 3 also shows the scale factor, and correspond-ing uncertainty, of the best-fitting template for each sub-integration,directly relating to the detected pulsed flux density from the pulsarthroughout the orbit. For display, these light curves are normal-ized so that the out-of-eclipse flux densities are equal to unity.The average out-of-eclipse flux density that we measure for the
11 https://www.python.org/
MNRAS 476, 1968–1981 (2018)
Dow
nloaded from https://academ
ic.oup.com/m
nras/article-abstract/476/2/1968/4848310 by CN
RS user on 20 Septem
ber 2019
1972 E. J. Polzin et al.
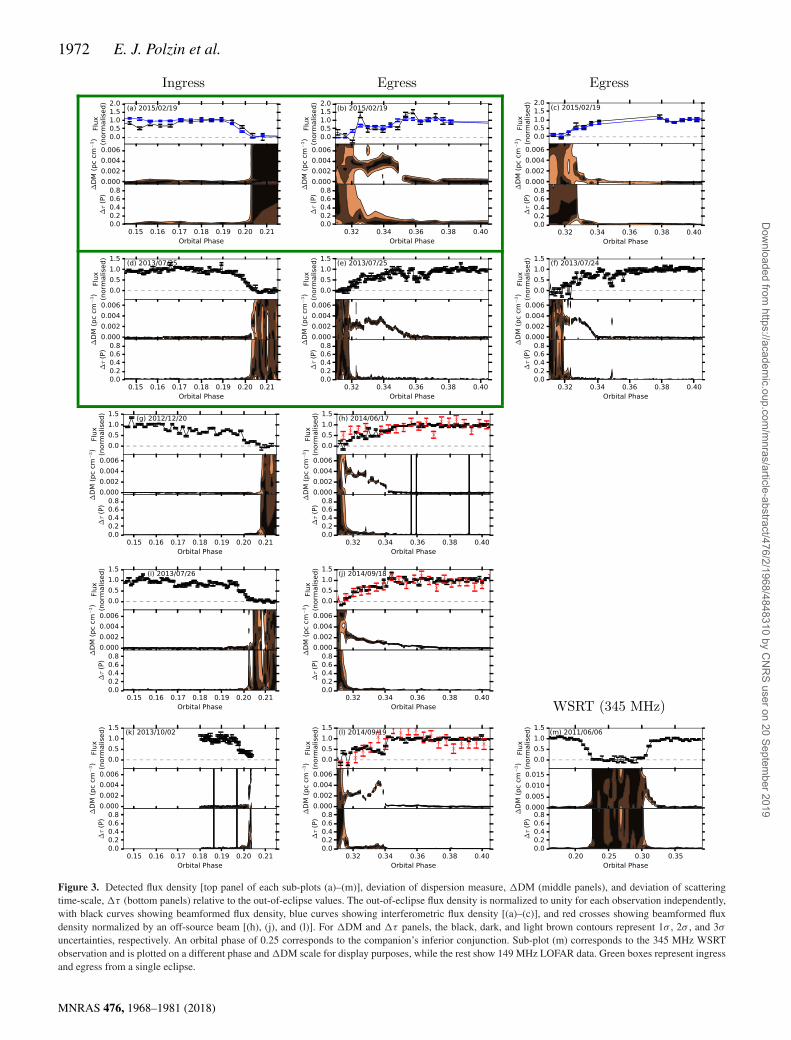
Figure 3. Detected flux density [top panel of each sub-plots (a)–(m)], deviation of dispersion measure, �DM (middle panels), and deviation of scatteringtime-scale, �τ (bottom panels) relative to the out-of-eclipse values. The out-of-eclipse flux density is normalized to unity for each observation independently,with black curves showing beamformed flux density, blue curves showing interferometric flux density [(a)–(c)], and red crosses showing beamformed fluxdensity normalized by an off-source beam [(h), (j), and (l)]. For �DM and �τ panels, the black, dark, and light brown contours represent 1σ , 2σ , and 3σ
uncertainties, respectively. An orbital phase of 0.25 corresponds to the companion’s inferior conjunction. Sub-plot (m) corresponds to the 345 MHz WSRTobservation and is plotted on a different phase and �DM scale for display purposes, while the rest show 149 MHz LOFAR data. Green boxes represent ingressand egress from a single eclipse.
MNRAS 476, 1968–1981 (2018)
Dow
nloaded from https://academ
ic.oup.com/m
nras/article-abstract/476/2/1968/4848310 by CN
RS user on 20 Septem
ber 2019

Eclipses of PSR J1810+1744 1973
calibrated beamformed data is 297 ± 33 mJy, however the nominaluncertainty here is assumed to be an underestimate of the true value,and instead we propose a 50 per cent uncertainty of ∼150 mJy basedon previous studies of LOFAR flux density measurements (Bilouset al. 2016; Kondratiev et al. 2016).
3.1.1 Modification of the model
To investigate the validity of the scattering model used, we recre-ated sets of templates for different frequency power-law exponents,τ ∝ ν−α , with α = 2.0, 2.5, 3.0, and 3.5, based on recent work byGeyer et al. (2017) whereby forward fitting of simulated scatteringprofiles to LOFAR observations yielded values of 1.5 ≤ α ≤ 4.0.In addition, templates were made assuming the scattering model ofWilliamson (1972) for a thick screen positioned close to the pulsar,with scattering function ,( πτ
4t3
)1/2exp−π2τ/16t . (1)
However, due to both the low-level scattering variations present andthe low signal-to-noise ratio of the pulse profile on time-scales shortenough to track variations, no statistically significant deviationsfrom the presented results were found.
Alternatively, to further investigate the dispersion, we referred tothe general form of the plasma dispersion law (Phillips & Wolszczan1992) where, as discussed in Hassall et al. (2012), the quartic term,
�tEM = EM
4ν4, (2)
may become detectable for low observing frequencies traversinga clumpy medium. Here, the emission measure, EM = ∫ D
0 n2edl,
where ne (cm−3) represents number density of electrons and D (pc)is the distance to the source. Incorporating this additional term intoour fits yielded some qualitatively interesting initial results, withoccasional ‘spikes’ during egress reaching EM ∼ 105 pc cm−6. Incontrast, compact H II regions typically have EM � 107 pc cm−6
(table 1 of Kurtz 2002). However, statistical comparison betweenthis, and the original simpler DM model, using both the Akaikeand Bayesian Information Criterion (Akaike 1974; Schwarz 1978,respectively) suggested that the likelihood of the more complex EMmodel is slightly lower than that of the more favourable simple DMmodel. This likelihood takes into account the fact that the increasednumber of degrees of freedom in the EM model is expected tolower the minimum χ2 of the fit, irrespective of the model beinga better or worse representation of the ‘true’ mechanism. In lightof these inconclusive results, we plan to further investigate thegeneral plasma dispersion law for low-frequency observations ofblack widow pulsars.
3.2 Analysis of interferometric data
Interferometric data are sensitive to both pulsed flux and any con-tinuum, unpulsed flux from the black widow system. Each of the1 min images, described in Section 2.4, was analysed with PYBDSF12
to measure the average flux density from the pulsar within that in-terval. PYBDSF automatically identifies ‘islands’ of emission in theimage, and for each island it fits two-dimensional Gaussians to indi-vidual sources. The flux density of each source is calculated directlyfrom the fitted Gaussians, thus with knowledge of the expected co-ordinates of the pulsar, the flux density and associated uncertainty
12 http://www.astron.nl/citt/pybdsm/
were retrieved. For the case of eclipsing pulsars, this process canfalter as the signal to noise decreases, or fully disappears, neareclipse. To counter this, we used a high signal to noise ‘detectionimage’, made by combining several out-of-eclipse observations, toidentify islands of emission and consequently passed these on to the1 min images for flux density extraction. The resulting light curve isshown plotted with the simultaneously observed beamformed fluxdensity as blue points in Figs 3(a)–(c).
Out of eclipse, we detected PSR J1810+1744 at an average fluxdensity of 483 ± 5 mJy in the 78 MHz wide LOFAR band centredon 149 MHz. This is significantly higher than the value quoted inSection 3.1, even with the estimated 50 per cent uncertainty on thatmeasurement. Although this discrepancy can suggest systematicerrors in the flux density calibration methods, we note that the inter-ferometric flux density quoted here is measured from observationscovering just one orbit of the system, whereas the beamformed fluxdensity from Section 3.1 is averaged over observations spanning>2 yr and thus is much more susceptible to the effects of refractivescintillation (see Section 3.3).
Direct comparison with the 150 MHz flux density found in theGiant Metrewave Radio Telescope TGSS survey (Intema et al. 2017)required us to re-image the field with the same ∼17 MHz bandwidthused in that survey, resulting in a measured flux density for PSRJ1810+1744 of 380 ± 10 mJy from our observations. Investigationof the MJDs of the observations used to calculate the flux densityquoted from TGSS led to the finding that the pulsar was in typicallyeclipsed orbital phases for ∼30 per cent of the scans, thus scaling toaccount for this leads to a TGSS flux density from PSR J1810+1744of 390 ± 40 mJy; consistent with the value found here. Finally, asimilar analysis was carried out by re-imaging the field with an8 MHz bandwidth centred on 150 MHz in order to allow directcomparison with the equivalent flux density found in the GLEAMsurvey (Hurley-Walker et al. 2017). This led us to find a flux densityof 335 ± 15 mJy, consistent with the flux density of 321 ± 88 mJyreported from GLEAM.
3.3 Scintillation
Studying flux density variations in eclipsing pulsars can be compli-cated by interstellar scintillation effects that can mask, or mimic,genuine flux density variations in the system depending on thebandwidth and time-scale of the scintles (Fruchter et al. 1990; Stap-pers et al. 2001). At LOFAR frequencies however, the decorrela-tion bandwidth for diffractive scintillation for PSR J1810+1744 is∼2 kHz, thus any effects are averaged out over the 80 MHz band(Archibald et al. 2014). Scaling this to 345 MHz using the measureddependence of decorrelation bandwidth on observing frequency,�νd ∝ ν4.5, for this pulsar (Archibald et al. 2014) gives a decor-relation bandwidth for diffractive scintillation of ∼90 kHz for theWSRT observation, thus also too small to have significant effectsover the full band. Conversely, refractive scintillation can affect theobserved flux densities, however with a decorrelation time-scaleon the order of weeks it has little effect on flux density variationswithin orbital time-scales. As such, the short time-scale flux den-sity variations presented here are assumed to be largely independentof interstellar scintillation. On the other hand, we caution that themeasured out of eclipse, absolute flux densities in this paper areexpected to be influenced by the long-term refractive variability.Measurements of the flux density of the source in each of the beam-formed LOFAR observations used here appear to show a smoothtrend over the ∼2 yr range, with a factor of ∼2 separating the lowestflux density from the highest.
MNRAS 476, 1968–1981 (2018)
Dow
nloaded from https://academ
ic.oup.com/m
nras/article-abstract/476/2/1968/4848310 by CN
RS user on 20 Septem
ber 2019

1974 E. J. Polzin et al.
4 ECLIPSE CHARACTERISTICS
4.1 Individual eclipses
Fig. 3 shows the measured deviations of flux density, DM, andscattering time for all detected eclipses. Here, we highlight thevariability between separate eclipses and the time-scales over whichthese occur.
4.1.1 Scattering
Leading into eclipse, and during eclipse recovery, where the fluxdensity �20 per cent of the out-of-eclipse level, little to no addi-tional scattering is seen. However, very close to eclipse edges, theresults from the fits are unreliable. Here, inspection of the observeddata showed no evidence of increased scattering tails in the pulsa-tions and any apparent sharp increases (e.g. Fig. 3 k) are assumedto be artefacts of the fit to low signal-to-noise data. The eclipseegresses in general show �τ < 20 per cent of the pulse period, withoccasional short time-scale rises up to ∼40 per cent. This low-levelscattering is far from that required to reduce the pulsed flux densitybeyond detection, unless a sharp rise were to occur at eclipse bound-aries. Such a sharp rise would have to occur on a time-scale shorterthan 10 s, equivalent to the shortest integration times presented here,to avoid detection. In addition, in the higher frequency WSRT ob-servation in Fig. 3(m), the pulsar flux remains detectable for orbitalphases closer to inferior conjunction of the companion, thus probingfurther into the eclipsing medium, and shows no evidence of steepscattering variations.
4.1.2 Dispersion measure
Similarly to scattering, the DM (or electron column density) showsno clear evidence of increasing prior to loss of pulsations in eclipseingress. Significant deviations from the out-of-eclipse electron col-umn density can regularly be seen in eclipse egresses. The durationof these deviations varies from ∼5 to 10 min (2–5 per cent of theorbit) between observations. Features in the electron column den-sity profiles show clear distinctions in each eclipse, with notableextremes in Fig. 3(l) – where multiple rises and falls are present,including a sharp boundary to the out-of-eclipse level, and Fig. 3(j)– where the electron column density decreases slowly and smoothlyaway from eclipse. Of particular interest for the time-scale of varia-tions is the fact that these two eclipses were observed on consecutivedays. Placing even tighter constraints on the time variability of theDM features during egress are the consecutive eclipses in Figs 3(b)and (c). The prominent DM feature in Fig. 3(b), extending out toorbital phase 0.36, shows no sign of detection in the egress observedone orbit earlier in Fig. 3(c), demonstrating that the DM featuresare variable within the orbital time-scale of 3.6 h.
Assuming these electron column density deviations are a result ofmaterial within, or in close proximity to, the binary system we arelikely to be sampling the outer edges of the eclipsing medium withsuch low observing frequencies being sensitive to small variationsin DM. The extended egress variations are indicative of a ‘tail’ ofmaterial, swept back due to orbital motion (Fruchter et al. 1990;Stappers et al. 2001; Wadiasingh et al. 2017). In this case, ourresults suggest that the material in the tail is dynamic within orbitaltime-scales, and sharp electron column density variations implythe material to be clumpy in nature. There is some evidence of acommonly appearing peak, or flattening, of the electron column
density around orbital phases 0.33–0.34, which could be suggestiveof a quasi-static dense region, or represent the geometry of the tail.
At 149 MHz, the maximum detected �DM149 < 0.006 pc cm−3,while at 345 MHz, �DM345 < 0.015 pc cm−3. For dispersion smear-ing across the width of a channel to reach the pulse period, andthus remove the pulses, would require �DM149 > 1.3 pc cm−3 and�DM345 > 38.3 pc cm−3; many orders of magnitude above thosedetected. However, in case of short time-scale DM variations, anadditional case of DM smearing can be encountered. Should the DMchange significantly over the duration of a single sub-integration,the resulting pulse, averaged over the integration time, would besmeared by an amount dependent on the observed frequency. Dueto the measurement of DM utilizing templates with the full fre-quency resolution of the data, this smearing would be problematicif the change in DM within a sub-integration, �(�DM), becamelarge enough as to cause the integrated pulse within a channel tosmear over the full pulse phase. This would have the most sig-nificant effect on the channels with the lowest frequencies, andwould occur at the bottom of the respective frequency bands for�(�DM149) > 0.005 pc cm−3 and �(�DM345) > 0.04 pc cm−3 for149 and 345 MHz, respectively. Although not an issue at 345 MHz,at 149 MHz, the maximum gradient detected across a single sub-integration is ∼0.002 pc cm−3, which would smear the pulse by0.7 ms, or ∼40 per cent of the pulse period at the lowest side of thefrequency band, causing an apparent decrease in detected flux den-sity within the sub-integration. In general however, this gradient ismuch lower than that required to smear the pulses beyond detection.
4.1.3 Flux density
At 149 MHz, the pulsed flux density typically decreases much fasterat eclipse ingress in comparison to the egress, in agreement withthat expected for a swept-back tail of material. However, in thesingle 345 MHz eclipse, this relationship is much more symmetric,although with a hint of the relationship being reversed where pulsedflux density recovers marginally quicker post-eclipse, being largelyindependent of the material in the extended tail.
In all observed eclipse ingresses, and most notably that inFig. 3(g), the pulsed flux density begins to attenuate without anydetected increase in the electron column density. Should the attenu-ation be a result of additional material along the line of sight (LoS),then a �DM149 < 0.0003 pc cm−3 would be required to avoid detec-tion amongst the typical out-of-eclipse 3σ uncertainties. This wouldcorrespond to an electron column density of eclipsing material,Ne � 1015 cm−2.
Similarly to the DM, at 149 MHz, the pulsed flux density takes∼5–10 min to recover in eclipse egress. The egress in Fig. 3(l) showsa clear anti-correlation between the flux density recovery and DM,with the pulsed flux density rising and falling with correspondingtroughs and peaks in DM, respectively. The flux density varia-tion associated with the sharp DM boundary to the out-of-eclipselevel should be interpreted with care however, as a bias could beintroduced by DM smearing with this steep gradient. In contrastto this, the pulsed flux density recovery in other eclipse egressesshow no obvious correlation with the electron column density, asmultiple peaks and troughs in pulsed flux density occur with nodetected change in DM. In addition, the electron column densityoften shows a plateau, or even peak, closely after eclipse, through-out which the pulsed flux density continuously recovers, apparentlyindependently of the electron column density. Although the pulsedflux density varies significantly in the egress region, there are no
MNRAS 476, 1968–1981 (2018)
Dow
nloaded from https://academ
ic.oup.com/m
nras/article-abstract/476/2/1968/4848310 by CN
RS user on 20 Septem
ber 2019

Eclipses of PSR J1810+1744 1975
Figure 4. Measured flux density as a function of orbital phase for all obser-vations. The out-of-eclipse flux density is normalized to unity. The pulsedflux density at 345 and 149 MHz is shown in red and grey, respectively. Thetotal continuum flux density at 149 MHz is shown in blue. The dashed lineat phase 0.25 corresponds to inferior conjunction of the companion star.
detectable mini-eclipses (such as those seen in, e.g. PSRB1744−24A and PSR J1023+0038; Lyne et al. 1990; Archibaldet al. 2009, respectively) in any of the observations outside of theorbital phases 0.15–0.40 shown here. Also note that any apparentre-appearances of flux density during an eclipse (e.g. Fig. 3d) showno sign of being realistic upon inspection of the data, and thus arelikely to be artefacts of the fitting method.
For the three eclipse egress observations that utilized a second,simultaneous off-source beam we were able to investigate the vari-ation in the unpulsed continuum flux density from the pulsar, inde-pendent of smearing or scattering of the pulse. By assuming bothbeams are affected equally by the telescope, sky and RFI, the off-source beam was used to normalize, and essentially flat-field, thepulsar centred beam. Thus, by averaging the normalized data overall pulse phases and subtracting unity, the remaining flux densityin each sub-integration is proportional to that of the total flux den-sity from the pulsar, independent of pulsations. The resulting lightcurves, plotted in red on Figs 3(h), (j), and (l), appear to show thetotal flux density disappearing in eclipse.
Stronger evidence of this is provided by the simultaneous beam-formed and interferometric observations shown in Figs 3(a)–(c).The interferometric flux density, sensitive to the total, pulse phaseaveraged flux density from the pulsar, is shown to track the samedisappearance and re-appearance as the pulsed flux, giving clearevidence that flux is removed from the LoS, rather than smeared orscattered.
4.2 Global properties
Figs 4 and 5 show the flux density and DM variations for allcombined observations, respectively. The mean duration, radius,centre points, and asymmetry of the eclipses are shown in Ta-ble 2. The duration is taken to be the full width at half-maximumof the flux density, and was calculated by fitting the normal-ized ingress and egress flux densities with Fermi–Dirac functions,
f = 1/(eφ+p1
p2 + 1), where f is the normalized flux density, φ is or-bital phase, and p1 and p2 are the fitted free parameters . Calculationof the eclipse radius, RE, assumes the eclipsing medium resides atthe orbit of the companion, with orbital separation a = 1.33 R� and
Figure 5. Deviation of DM relative to mean out-of-eclipse value for allbeamformed observations. The observations at 345 and 149 MHz are shownin red and grey, respectively. The dashed line at phase 0.25 corresponds toinferior conjunction of the companion star.
mass ratio q = 0.045/1.4 (Breton et al. 2013). The asymmetry ofthe eclipses is characterized by the ratio of egress to ingress phasesabout φ = 0.25, i.e. (φeg − 0.25)/(0.25 − φin), where φin and φeg
correspond to the phase at half-maximum flux density found fromthe Fermi–Dirac fits for ingress and egress, respectively.
Similarly to black widow PSRs B1957+20 (Fruchter et al.1990), J2051−0827 (Stappers et al. 1996), and J1544+4937(Bhattacharyya et al. 2013), the low-frequency eclipse lasts for∼10 per cent of the orbit, irrespective of the distinctly different sys-tem parameters. The centre points of the eclipses, φc, occur at asimilar phase after inferior conjunction of the companion at both149 and 345 MHz, in contrast to that seen for PSR B1957+20(Fruchter et al. 1990) where the eclipse is centred near orbital phase0.25, and PSR J1544+4937 (Bhattacharyya et al. 2013) where theeclipse is centred slightly prior to 0.25. Due to the shorter durationof the 345 MHz eclipse, the asymmetry, as defined by the ratio ofegress to ingress durations, is unusually larger than at 149 MHz.Although the electron column density can be highly variable fromone eclipse to the next, the disappearance and re-appearance of fluxcan be seen to occur regularly at the same orbital phases, with verylittle deviation.
Note that these calculations assume the orbit to be edge-on. Fits tooptical light curves for this system in both Breton et al. (2013) andSchroeder & Halpern (2014) find best-fitting orbital inclinationsof ∼50◦, suggesting that we are sampling the outer edges of themedium where the density is likely to be lower and eclipse widthshorter than that in the orbital plane. The expected geometry ofthis system is shown in Fig. 6. Should the eclipsing material bespherically symmetric and centred in the orbital plane at the distanceof the companion, then an edge-on view of this system would resultin eclipse radii of 1.2 and 1.1 R� for 149 and 345 MHz, respectively;similar in magnitude to the orbital separation.
Using the polarization calibrated LOFAR data, we measure thepulsar to have an average rotation measure, RM =90.48 ± 0.02 radm−2, prior to ionospheric correction (see Sobey et al., in preparationfor further information, including the ionosphere–corrected value) .Using the measured RMs to correct for Faraday rotation, we find av-erage linear and circular polarization fractions of ∼0.01 and ∼0.05,respectively. The small polarization fractions did not allow us toplace any constraints on the magnetic fields in the eclipse medium.
MNRAS 476, 1968–1981 (2018)
Dow
nloaded from https://academ
ic.oup.com/m
nras/article-abstract/476/2/1968/4848310 by CN
RS user on 20 Septem
ber 2019

1976 E. J. Polzin et al.
Table 2. Duration, �φeclipse, radius, RE, centre point, φc, and asymmetry, �φeg/�φin, for the 149 and345 MHz eclipses. �φeclipse and φc are in units of orbital phase. The top row shows �φeclipse, φc and�φeg/�φin measured using the half-maximum flux density as eclipse boundaries, with RE calculatedassuming an orbital inclination, i = 90◦. The bottom row shows the extrapolated duration and radius of theeclipse within the orbital plane assuming that the observed eclipse is for an orbital inclination, i = 50◦, theeclipse medium is spherically symmetric and centred in the orbital plane at the distance of the companion.The uncertainties on the extrapolated values are formally calculated through error propagation, howeverassume zero uncertainty on the orbital inclination.
ν (MHz) �φeclipse RE φc �φeg/�φin
i = 90◦ 149 0.130 ± 0.002 (0.51 ± 0.01) R� 0.265 ± 0.002 1.48 ± 0.02345 0.090 ± 0.002 (0.37 ± 0.01) R� 0.264 ± 0.002 1.88 ± 0.02
i = 50◦ 149 0.23 ± 0.001 (1.2 ± 0.01) R�345 0.21 ± 0.001 (1.1 ± 0.01) R�
Figure 6. Expected geometry of the PSR J1810+1744 system, schematic is drawn to scale. The Roche lobe and companion orbit are calculated assuming apulsar mass of 1.4 M�, companion mass of 0.045 M� and an orbital separation, a = 1.33 R� (Breton et al. 2013). Note that no attempt is made to displaythe physical size of the companion star. Left: a ‘side-on’ view from the orbital plane, the LoS is drawn assuming an orbital inclination, i = 50◦ (Breton et al.2013; Schroeder & Halpern 2014). Right: a view from perpendicular to the orbital plane, the LoS corresponding to eclipse edges (half-maximum flux density)and post-eclipse egress DM variations are shown by red (345 MHz) and green (149 MHz) dashed lines. The grey arrows indicate the companion’s direction ofmotion.
4.2.1 Material in the system
The combined �DM measurements in Fig. 5 demonstrate the strongasymmetry of material either side of the low-frequency eclipse,much the same as that observed for black widow PSR B1957+20(Ryba & Taylor 1991). The Roche lobe of the companion, assumingRL = 0.19 R� and orbital inclination of 50◦ (Breton et al. 2013), isnot intersected by our LoS and as such the medium causing theseeclipses cannot be gravitationally bound to the companion. Fig. 6highlights the remarkable extent to which the eclipsing mediummay have to be distributed in order to intercept the LoS. Should theinclination estimate be doubted, in order for the LoS to touch theRoche lobe an orbital inclination � 80◦ would be required, and evenfor an edge-on view, the Roche lobe would span the orbital phases∼0.23–0.27; inside the eclipse at both ingress and egress. Attemptsto constrain the density of material in the eclipsing medium areat best an order-of-magnitude estimates. The asymmetry betweeningress and egress, with barely any detectable rise in electron col-umn density at ingress provides very little insight to the leadingedge of the medium. In addition, being far from the gravitational
grasp of the companion, the eclipse tail material could well extendfar outside the orbit.
With this in mind, to allow comparison between systems wechoose to follow previous considerations where it is assumed thatall of the material is contained within an approximately spheri-cal region, centred on the companion, of diameter equal to theeclipse width (Thompson et al. 1994). Thus, at 149 MHz with aneclipse width, 2RE ∼ 1.0 R� and electron column density, Ne ≈1 × 1016 cm−2, the electron density at egress is
ne,149 ≈ 1.4 × 10⁵
(2RE
1.0 R�
)−1
cm−3. (3)
While at 345 MHz, with eclipse width, 2RE ∼ 0.8 R� and egresscolumn density, Ne ≈ 3 × 1016 cm−2, we find
ne,345 ≈ 5 × 10⁵
(2RE
0.8 R�
)−1
cm−3. (4)
MNRAS 476, 1968–1981 (2018)
Dow
nloaded from https://academ
ic.oup.com/m
nras/article-abstract/476/2/1968/4848310 by CN
RS user on 20 Septem
ber 2019
Eclipses of PSR J1810+1744 1977
At 345 MHz, this is an order of magnitude larger than the equivalentdensity found for PSR B1957+20 in Thompson et al. (1994), butsimilar to that found for PSR J2051−0827 at 436 MHz (Stapperset al. 1996).
As stated in section 6.3 of Thompson et al. (1994), shouldthe ablated material become entrained in the pulsar wind thenthe mass-loss rate from the companion can be estimated as,MC ∼ πR2
EmpneVW, where RE is taken to be the eclipse half-widthand represents the radius of the projected circle through which themass is assumed to be lost, and VW is the outflow velocity of ab-lated material in the pulsar wind. Taking into account the expectedgeometry of the PSR J1810+1744 system, we take as RE the in-ferred radius of eclipse material should it be a sphere centred on thecompanion, i.e. 1.2 and 1.1 R� for 149 and 345 MHz, respectively.If the momentum flux of the ablated material is taken to be equalto the momentum flux of the pulsar wind at the distance of thecompanion, then VW = (UE/nemp)1/2. Assuming the pulsar windto be isotropic then we find the energy density of the wind at thecompanion distance,
UE = E
4πca2= 12.3
(a
1.33 R�
)−2
erg cm−3, (5)
where E is the spin-down power of the pulsar. Thus, for the149 MHz observations using RE = 1.2 R� and ne = 1.4 × 105 cm−3,we find an estimated mass-loss rate of MC ∼ 6 × 10⁻¹³ M� yr−1.Instead using the inferred values from the 345 MHz observa-tion of RE = 1.1 R� and ne = 5 × 105 cm−3, we find MC ∼1 × 10⁻¹² M� yr−1. In comparison, to fully evaporate the compan-ion over a time-scale of ∼5 Gyr would require an average mass-lossrate of MC ∼ 9 × 10⁻¹² M� yr−1, only factor of ∼10 larger thanthat estimated at 345 MHz. Considering that these estimates de-pend rather heavily on the assumptions made about the geometryand mechanics of the mass loss, it may not be unreasonable forthe companion to be fully evaporated within Hubble time. How-ever, we note that the long-term orbital dynamics of the system willalso likely influence an evolution of the mass loss over time; in thepresence of negligible magnetic braking and gravitational radiation,mass loss from the system will act to widen the orbital separationbetween the two bodies. When combined with spin-down of thepulsar, it would be naively expected that this predicted decrease inirradiation of the companion star over time will reduce the proba-bility of complete evaporation.
In this model, with the ablated material entrained in the pulsarwind, we note that the observed low column densities suggest thatthe material would be emitted approximately radially from the orbit.This assumes that the material initially flows from the companionat the escape velocity, thus the momentum flux of the thin materialwould be far lower than that of the pulsar wind and it would becarried away at ∼VW. With such a high-velocity radial flow, wewould not expect to see large asymmetries in the measured columndensities about inferior conjunction of the companion, in contrastto that observed. To reconcile this, it can be proposed that the com-panion hosts a magnetosphere filled with material of much higherdensity, and that is compact enough so as to not be intersected by ourLoS. This scenario allows for the denser magnetosphere to be sweptback due to the orbital motion causing measurable asymmetry ofthe eclipses. Magnetic reconnection between the pulsar wind mag-netic field and the companion’s magnetosphere allows for materialto leak into the pulsar wind, detectable as additional egress columndensities as the companion continues through its orbit (Thompson,private communication).
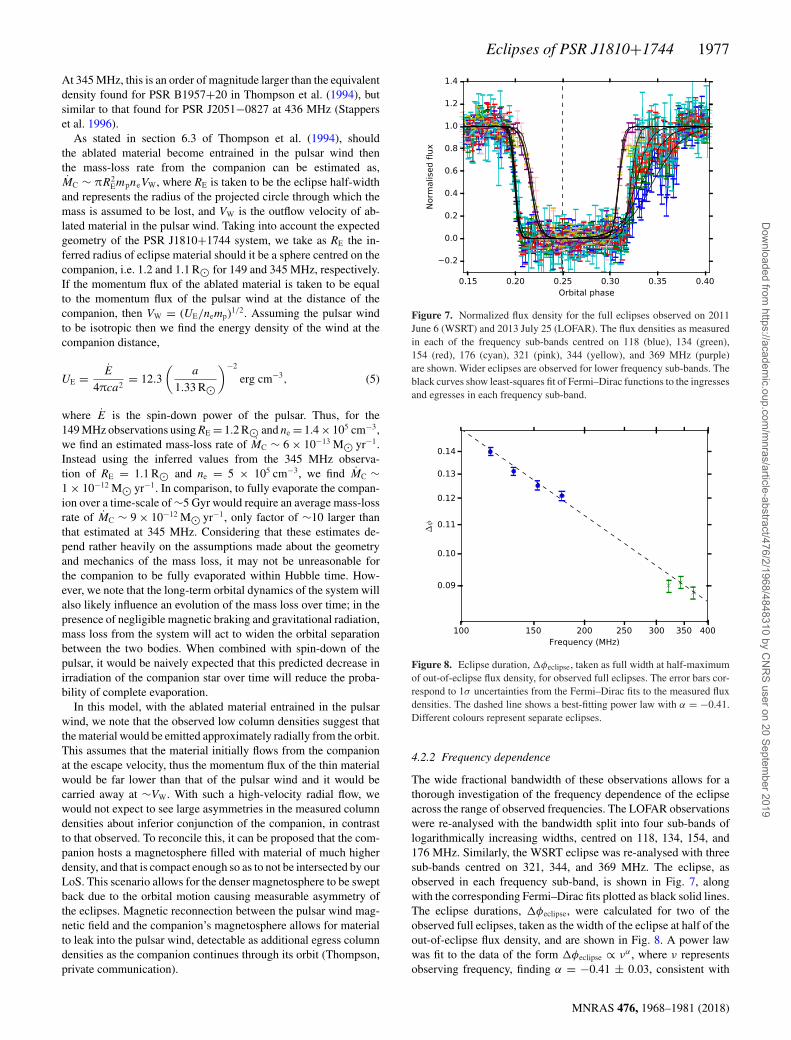
Figure 7. Normalized flux density for the full eclipses observed on 2011June 6 (WSRT) and 2013 July 25 (LOFAR). The flux densities as measuredin each of the frequency sub-bands centred on 118 (blue), 134 (green),154 (red), 176 (cyan), 321 (pink), 344 (yellow), and 369 MHz (purple)are shown. Wider eclipses are observed for lower frequency sub-bands. Theblack curves show least-squares fit of Fermi–Dirac functions to the ingressesand egresses in each frequency sub-band.
Figure 8. Eclipse duration, �φeclipse, taken as full width at half-maximumof out-of-eclipse flux density, for observed full eclipses. The error bars cor-respond to 1σ uncertainties from the Fermi–Dirac fits to the measured fluxdensities. The dashed line shows a best-fitting power law with α = −0.41.Different colours represent separate eclipses.
4.2.2 Frequency dependence
The wide fractional bandwidth of these observations allows for athorough investigation of the frequency dependence of the eclipseacross the range of observed frequencies. The LOFAR observationswere re-analysed with the bandwidth split into four sub-bands oflogarithmically increasing widths, centred on 118, 134, 154, and176 MHz. Similarly, the WSRT eclipse was re-analysed with threesub-bands centred on 321, 344, and 369 MHz. The eclipse, asobserved in each frequency sub-band, is shown in Fig. 7, alongwith the corresponding Fermi–Dirac fits plotted as black solid lines.The eclipse durations, �φeclipse, were calculated for two of theobserved full eclipses, taken as the width of the eclipse at half of theout-of-eclipse flux density, and are shown in Fig. 8. A power lawwas fit to the data of the form �φeclipse ∝ να , where ν representsobserving frequency, finding α = −0.41 ± 0.03, consistent with
MNRAS 476, 1968–1981 (2018)
Dow
nloaded from https://academ
ic.oup.com/m
nras/article-abstract/476/2/1968/4848310 by CN
RS user on 20 Septem
ber 2019
1978 E. J. Polzin et al.
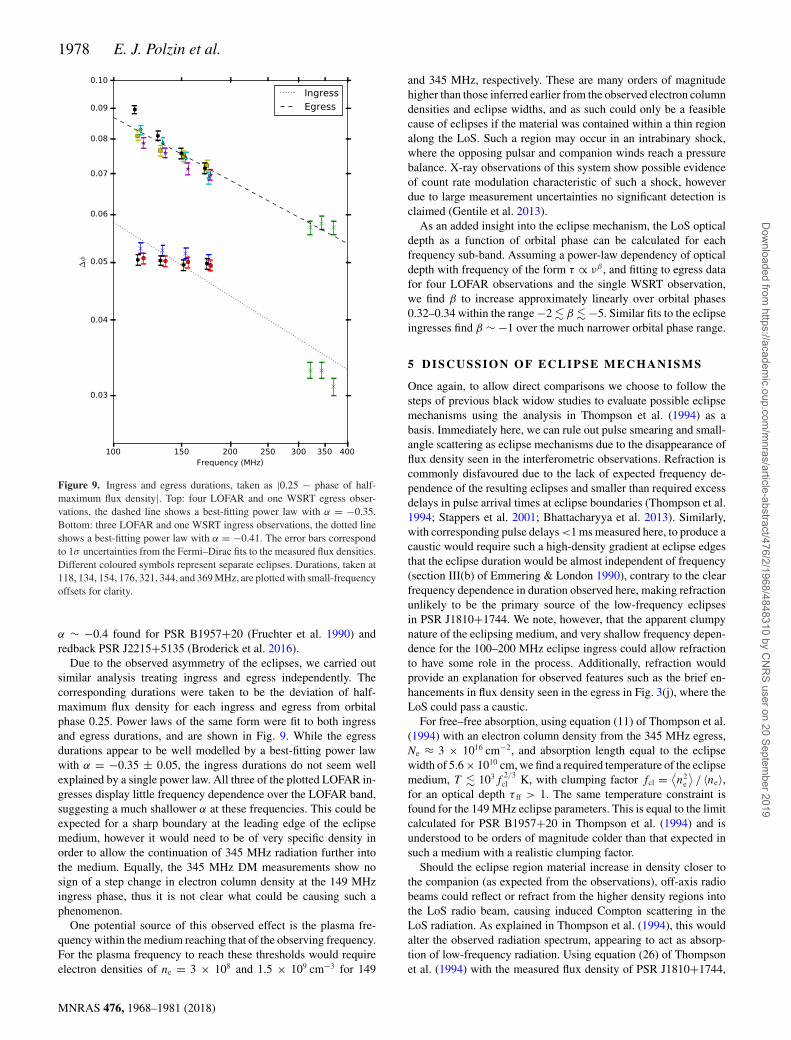
Figure 9. Ingress and egress durations, taken as |0.25 − phase of half-maximum flux density|. Top: four LOFAR and one WSRT egress obser-vations, the dashed line shows a best-fitting power law with α = −0.35.Bottom: three LOFAR and one WSRT ingress observations, the dotted lineshows a best-fitting power law with α = −0.41. The error bars correspondto 1σ uncertainties from the Fermi–Dirac fits to the measured flux densities.Different coloured symbols represent separate eclipses. Durations, taken at118, 134, 154, 176, 321, 344, and 369 MHz, are plotted with small-frequencyoffsets for clarity.
α ∼ −0.4 found for PSR B1957+20 (Fruchter et al. 1990) andredback PSR J2215+5135 (Broderick et al. 2016).
Due to the observed asymmetry of the eclipses, we carried outsimilar analysis treating ingress and egress independently. Thecorresponding durations were taken to be the deviation of half-maximum flux density for each ingress and egress from orbitalphase 0.25. Power laws of the same form were fit to both ingressand egress durations, and are shown in Fig. 9. While the egressdurations appear to be well modelled by a best-fitting power lawwith α = −0.35 ± 0.05, the ingress durations do not seem wellexplained by a single power law. All three of the plotted LOFAR in-gresses display little frequency dependence over the LOFAR band,suggesting a much shallower α at these frequencies. This could beexpected for a sharp boundary at the leading edge of the eclipsemedium, however it would need to be of very specific density inorder to allow the continuation of 345 MHz radiation further intothe medium. Equally, the 345 MHz DM measurements show nosign of a step change in electron column density at the 149 MHzingress phase, thus it is not clear what could be causing such aphenomenon.
One potential source of this observed effect is the plasma fre-quency within the medium reaching that of the observing frequency.For the plasma frequency to reach these thresholds would requireelectron densities of ne = 3 × 10⁸ and 1.5 × 109 cm−3 for 149
and 345 MHz, respectively. These are many orders of magnitudehigher than those inferred earlier from the observed electron columndensities and eclipse widths, and as such could only be a feasiblecause of eclipses if the material was contained within a thin regionalong the LoS. Such a region may occur in an intrabinary shock,where the opposing pulsar and companion winds reach a pressurebalance. X-ray observations of this system show possible evidenceof count rate modulation characteristic of such a shock, howeverdue to large measurement uncertainties no significant detection isclaimed (Gentile et al. 2013).
As an added insight into the eclipse mechanism, the LoS opticaldepth as a function of orbital phase can be calculated for eachfrequency sub-band. Assuming a power-law dependency of opticaldepth with frequency of the form τ ∝ νβ , and fitting to egress datafor four LOFAR observations and the single WSRT observation,we find β to increase approximately linearly over orbital phases0.32–0.34 within the range −2 � β � −5. Similar fits to the eclipseingresses find β ∼ −1 over the much narrower orbital phase range.
5 D I SCUSSI ON OF ECLI PSE MECHANI SMS
Once again, to allow direct comparisons we choose to follow thesteps of previous black widow studies to evaluate possible eclipsemechanisms using the analysis in Thompson et al. (1994) as abasis. Immediately here, we can rule out pulse smearing and small-angle scattering as eclipse mechanisms due to the disappearance offlux density seen in the interferometric observations. Refraction iscommonly disfavoured due to the lack of expected frequency de-pendence of the resulting eclipses and smaller than required excessdelays in pulse arrival times at eclipse boundaries (Thompson et al.1994; Stappers et al. 2001; Bhattacharyya et al. 2013). Similarly,with corresponding pulse delays <1 ms measured here, to produce acaustic would require such a high-density gradient at eclipse edgesthat the eclipse duration would be almost independent of frequency(section III(b) of Emmering & London 1990), contrary to the clearfrequency dependence in duration observed here, making refractionunlikely to be the primary source of the low-frequency eclipsesin PSR J1810+1744. We note, however, that the apparent clumpynature of the eclipsing medium, and very shallow frequency depen-dence for the 100–200 MHz eclipse ingress could allow refractionto have some role in the process. Additionally, refraction wouldprovide an explanation for observed features such as the brief en-hancements in flux density seen in the egress in Fig. 3(j), where theLoS could pass a caustic.
For free–free absorption, using equation (11) of Thompson et al.(1994) with an electron column density from the 345 MHz egress,Ne ≈ 3 × 1016 cm−2, and absorption length equal to the eclipsewidth of 5.6 × 1010 cm, we find a required temperature of the eclipsemedium, T � 103f
2/3cl K, with clumping factor fcl = ⟨
n2e
⟩/ 〈ne〉,
for an optical depth τ ff > 1. The same temperature constraint isfound for the 149 MHz eclipse parameters. This is equal to the limitcalculated for PSR B1957+20 in Thompson et al. (1994) and isunderstood to be orders of magnitude colder than that expected insuch a medium with a realistic clumping factor.
Should the eclipse region material increase in density closer tothe companion (as expected from the observations), off-axis radiobeams could reflect or refract from the higher density regions intothe LoS radio beam, causing induced Compton scattering in theLoS radiation. As explained in Thompson et al. (1994), this wouldalter the observed radiation spectrum, appearing to act as absorp-tion of low-frequency radiation. Using equation (26) of Thompsonet al. (1994) with the measured flux density of PSR J1810+1744,
MNRAS 476, 1968–1981 (2018)
Dow
nloaded from https://academ
ic.oup.com/m
nras/article-abstract/476/2/1968/4848310 by CN
RS user on 20 Septem
ber 2019

Eclipses of PSR J1810+1744 1979
S0ν = 480 mJy, a spectral index α = −2.3 (Murphy et al. 2017),
electron column density Ne ≈ 1016 cm−2, a source distance ofd = 2.0 kpc, and orbital separation a = 9.3 × 1010 cm from Bretonet al. (2013), we find an optical depth at 149 MHz of τ ind � 0.5M,where M ∼ (RC/2r)2 is the magnification factor of the reflected ra-dio beam, RC is the radius of curvature of the reflecting region, andr is the distance from the centre of curvature to the scattering region(section 2.4.1. of Thompson et al. 1994). For PSR J1810+1744,we estimate the radius of curvature of the higher density regionto be equal to the Roche lobe radius, RC ∼ 0.19 R�, and take thescattering region to be at the distance of the 149 MHz ingress fromthe centre of the companion, assuming the material surrounds thecompanion and that the system has an orbital inclination of 50◦,thus r ∼ 0.95 R�. As such, we calculate M ∼ 0.01 and a corre-sponding optical depth at 149 MHz, τ ind � 5 × 10⁻³. This suggeststhat induced Compton scattering is unlikely to be sufficient to causethe low-frequency eclipses.
With the relatively high radio flux density of PSR J1810+1744,the non-linear mechanism of a stimulated Raman scattering para-metric instability may be significant. Here, the radio flux incidenton the eclipsing medium is theorized to generate turbulence in theplasma that can consequently scatter further radio waves out of theLoS. Using distance to the pulsar, d = 2.0 kpc and a = 9.3 × 1010 cm,we estimate the radio flux from the pulsar at the companion’s orbitto be 0.02 erg cm−2 s−1 Hz−1 at 149 MHz. Following the analysisusing equation (32) of Thompson et al. (1994) with an electrondensity at the 149 MHz eclipse, ne ≈ 1.4 × 105 cm−3, we findthat the critical flux incident on the eclipsing medium required forstrong scattering is exceeded here if the temperature of the medium,T � 104 K, which is expected to be satisfied in the eclipse medium.Using the same parameters, the growth time of instabilities is foundto be <1 s which will be less than the characteristic flow time for anyrealistic flow velocity of the medium, hence allowing instabilitiesin the medium to form before the medium disperses. Thus, as forPSR B1957+20 in Thompson et al. (1994), two of the requirementsof Raman scattering are satisfied. However, although considered apossible mechanism, doubt is cast over the apparently satisfied con-ditions if the material is clumped, as higher densities in the mediumincrease the required critical flux incident on the medium. Addi-tionally, should the medium be hot enough, the plasmon (plasmaoscillations required to create turbulence) escape rate can becomesignificant, causing a reduction in plasma turbulence present to scat-ter the incident radio flux. Equally, the lack of scattering observed ateclipse ingress and egress means that the transition into the eclipsingregime would have to be very abrupt. As a result, although we do notdismiss this as a possible mechanism, it appears unlikely given theobservations.
Considered as one of the most likely eclipse mechanisms in PSRsB1957+20 (Thompson et al. 1994), J2051−0827 (Stappers et al.2001), and J1544+4937 (Bhattacharyya et al. 2013) is cyclotron–synchrotron absorption. This can either occur in material entrainedin the magnetized pulsar wind (Thompson et al. 1994), or in a mag-netosphere of the companion filled with relativistic particles fromthe pulsar wind (Khechinashvili, Melikidze & Gil 2000). Followingthe analysis in Thompson et al. (1994), to balance the pulsar windenergy density at the orbit of the companion requires a magneticfield strength, BE ∼ 18 G in the eclipse region. With such a magneticfield, the fundamental cyclotron frequency would be ∼50 MHz, thusabsorption of 149 and 345 MHz radiation would occur at cyclotronharmonics 3 and 7, respectively. Similar conditions calculated forPSR B1957+20 in Thompson et al. (1994) find a cyclotron opticaldepth power-law index at least as steep as τ ∝ ν−4 over the range
318–1400 MHz, for expected temperatures in the eclipse medium.Alternatively, for synchrotron absorption by relativistic electrons,the authors find a shallower frequency dependence of optical depth,τ ∝ ν−13/4, from their equation (67) assuming a power-law non-thermal electron distribution and magnetic field lines at an angle45◦ to the LoS. The model in Khechinashvili et al. (2000) assumesthe companion to be a magnetic white dwarf, with surface magneticfield BS � 104 G. The authors predict the duration of the eclipsesto scale as ∝ ν−0.33 for given temperature and electron distribu-tions. The consistency of these models with our results suggeststhat cyclotron–synchrotron absorption is a comparatively likely pri-mary eclipse mechanism for PSR J1810+1744. However a betterknowledge of the eclipse medium would be required to decipher thebest model.
6 C O N C L U S I O N S
In this paper, we present a detailed account of the low-frequencyeclipses in the black widow pulsar system of PSR J1810+1744. Wemeasure the dispersion, scattering and both pulsed, and continuumflux densities as a function of orbital phase as a sensitive probeinto the eclipsing medium. At these low frequencies, we expect tobe sampling the outer edges of the eclipsing medium, which weshow to have a highly variable structure over time-scales shorterthan the 3.6 h orbital period. The disappearance of both pulsedand continuum flux density regularly occurs between orbital phases∼0.18–0.35, with little deviation in phase from one eclipse to thenext. A clear frequency dependence is seen in eclipse duration,however asymmetry between ingress and egress reveal the dangerof relying on duration to constrain the eclipse mechanism. Eclipseegress durations are shown to be well modelled by a single powerlaw between 110 and 380 MHz, whereas the ingress shows evidencefor a more complex dependence on observing frequency over thisrange.
DM variations suggest a tail of material flows behind the compan-ion as a result of orbital motion, similar to that seen in a number ofother black widow systems. The tail material appears clumpy, andmeasurements show a possible hint of higher order pulse disper-sion. Further high signal-to-noise observations of this bright systemcould attempt to track the variability of tail material and constrain apotential deviation from the typical ∝ ν−2 dispersion relation. In ad-dition, the inferred mass-loss rate suggests that it may be possible tofully evaporate the companion in a Hubble time. Higher frequencyradio observations would probe the density of material further intothe eclipse, and thus add further constraints to the inferred mass-lossrate.
The analyses of Thompson et al. (1994) and Khechinashvili et al.(2000) are followed with the measured system parameters to addconstraints on the eclipse mechanism. The eclipse duration and LoSoptical depth are consistent with cyclotron–synchrotron absorptionas a primary eclipsing mechanism, although the apparently lesslikely non-linear scattering mechanisms cannot be completely ruledout. In addition, the clumpy nature of the medium could allowrefraction to play a minor role. These results provide a much neededinsight into the variabilities, and similarities, between eclipsingmedia in black widow pulsars, allowing further studies on the elusiveblack widow population as a whole (e.g. Wadiasingh et al. 2017).
AC K N OW L E D G E M E N T S
This work was based primarily on observations made with LOFAR– designed and constructed by ASTRON. LOFAR has facilities inseveral countries, each owned and funded by various parties, that
MNRAS 476, 1968–1981 (2018)
Dow
nloaded from https://academ
ic.oup.com/m
nras/article-abstract/476/2/1968/4848310 by CN
RS user on 20 Septem
ber 2019
1980 E. J. Polzin et al.
are collectively operated by the International LOFAR Telescopefoundation under a joint scientific policy. In addition, the WSRTis operated by the ASTRON (Netherlands Institute for Radio As-tronomy) with support from the Netherlands Foundation for Scien-tific Research (NWO). EJP would like to thank the LOFAR PulsarWorking Group, Chris Thompson, Marten van Kerkwijk, and DavidMulcahy for insightful comments and discussions throughout thisstudy. This work made extensive use of ASTROPY (Astropy Collabo-ration et al. 2013) and MATPLOTLIB (Hunter 2007). Part of this workis based on observations from the LOFAR long-term pulsar tim-ing project (PI: J.P.W. Verbiest). EJP acknowledges support froma UK Science and Technology Facilities Council studentship. RPBacknowledges support from the ERC under the European Union’sHorizon 2020 research and innovation programme (grant agree-ment no. 715051; Spiders). AOC gratefully acknowledges supportfrom the European Research Council under grant ERC-2012-StG-307215 LODESTON. JWTH acknowledges funding from an NWOVidi fellowship and from the European Research Council underthe European Union’s Seventh Framework Programme (FP/2007-2013)/ERC Starting grant agreement no. 337062 (‘DRAGNET’).JvL received funding from the European Research Council underthe European Union’s Seventh Framework Programme (FP/2007-2013)/ERC grant agreement no. 617199.
R E F E R E N C E S
Akaike H., 1974, IEEE Trans. Autom. Control, 19, 716Alexov A., Hessels J., Mol J. D., Stappers B., van Leeuwen J., 2010, in
Mizumoto Y., Morita K.-I., Ohishi M., eds, ASP Conf. Ser. Vol. 434,Astronomical Data Analysis Software and Systems XIX. Astron. Soc.Pac., San Francisco, p. 193
Archibald A. M. et al., 2009, Science, 324, 1411Archibald A. M., Kondratiev V. I., Hessels J. W. T., Stinebring D. R., 2014,
ApJ, 790, L22Arzoumanian Z., Fruchter A. S., Taylor J. H., 1994, ApJ, 426, L85Astropy Collaboration et al., 2013, A&A, 558, A33Baars J. W. M., Hooghoudt B. G., 1974, A&A, 31, 323Bhattacharyya B. et al., 2013, ApJ, 773, L12Bilous A. V. et al., 2016, A&A, 591, A134Breton R. P. et al., 2013, ApJ, 769, 108Broderick J. W. et al., 2016, MNRAS, 459, 2681Camilo F. et al., 2015, ApJ, 810, 85Cromartie H. T. et al., 2016, ApJ, 819, 34Eichler D., Levinson A., 1988, ApJ, 335, L67Emmering R. T., London R. A., 1990, ApJ, 363, 589Fruchter A. S., Stinebring D. R., Taylor J. H., 1988a, Nature, 333, 237Fruchter A. S., Gunn J. E., Lauer T. R., Dressler A., 1988b, Nature, 334,
686Fruchter A. S. et al., 1990, ApJ, 351, 642Gentile P. et al., 2013, in van Leeuwen J., ed., Proc. IAU Symp. Vol. 291.
Kluwer, Dordrecht, p. 389Geyer M. et al., 2017, MNRAS, 470, 2659Hamaker J. P., 2006, A&A, 456, 395Haslam C. G. T., Salter C. J., Stoffel H., Wilson W. E., 1982, A&AS, 47, 1Hassall T. E. et al., 2012, A&A, 543, A66Heald G. et al., 2010, preprint (arXiv:1008.4693)Hessels J. W. T. et al., 2011, in Burgay M., D’Amico N., Esposito P.,
Pellizzoni A., Possenti A., eds, AIP Conf. Proc. Vol. 1357, Radio Pulsars:An Astrophysical Key to Unlock the Secrets of the Universe. Am. Inst.Phys., New York, p. 40
Hobbs G., Edwards R., Manchester R., 2006, Chin. J. Astron. Astrophys.Suppl., 6, 189
Hotan A. W., van Straten W., Manchester R. N., 2004, PASA, 21, 302Hunter J. D., 2007, Comput. Sci. Eng., 9, 90
Hurley-Walker N. et al., 2017, MNRAS, 464, 1146Intema H. T., Jagannathan P., Mooley K. P., Frail D. A., 2017, A&A, 598,
A78Karuppusamy R., Stappers B., van Straten W., 2008, PASP, 120, 191Khechinashvili D. G., Melikidze G. I., Gil J. A., 2000, ApJ, 541, 335Kondratiev V. I. et al., 2016, A&A, 585, A128Kramer M., Lange C., Lorimer D. R., Backer D. C., Xilouris K. M., Jessner
A., Wielebinski R., 1999, ApJ, 526, 957Kuniyoshi M., Verbiest J. P. W., Lee K. J., Adebahr B., Kramer M., Noutsos
A., 2015, MNRAS, 453, 828Kurtz S., 2002, in Crowther P., ed., ASP Conf. Ser. Vol. 267, Hot Star
Workshop III: The Earliest Phases of Massive Star Birth. Astron. Soc.Pac., San Francisco, p. 81
Kuzmin A. D., Losovsky B. Y., 2001, A&A, 368, 230Lang K. R., 1971, ApJ, 164, 249Lawson K. D., Mayer C. J., Osborne J. L., Parkinson M. L., 1987, MNRAS,
225, 307Lee L. C., Jokipii J. R., 1976, ApJ, 206, 735Lyne A. G., Johnston S., Manchester R. N., Staveley-Smith L., D’Amico
N., 1990, Nature, 347, 650Murphy T. et al., 2017, PASA, 34, e020Noutsos A. et al., 2015, A&A, 576, A62Offringa A. R., de Bruyn A. G., Biehl M., Zaroubi S., Bernardi G., Pandey
V. N., 2010, MNRAS, 405, 155Offringa A. R., de Bruyn A. G., Zaroubi S., 2012a, MNRAS, 422, 563Offringa A. R., van de Gronde J. J., Roerdink J. B. T. M., 2012b, A&A, 539,
A95Pandey V. N., van Zwieten J. E., de Bruyn A. G., Nijboer R., 2009, in Saikia
D. J., Green D. A., Gupta Y., Venturi T., eds, ASP Conf. Ser. Vol. 407,The Low-Frequency Radio Universe. Astron. Soc. Pac., San Francisco,p. 384
Phillips J. A., Wolszczan A., 1992, ApJ, 385, 273Ransom S. M., 2001, American Astronomical Society Meeting Abst., 119Ray P. S. et al., 2012, preprint (arXiv:1205.3089)Roberts M. S. E., 2013, in van Leeuwen J., ed., Proc. IAU Symp. Vol. 291,
Neutron Stars and Pulsars: Challenges and Opportunities after 80 years.Kluwer, Dordrecht, p. 127
Ruderman M., Shaham J., Tavani M., 1989, ApJ, 336, 507Ryba M. F., Taylor J. H., 1991, ApJ, 380, 557Savitzky A., Golay M. J. E., 1964, Anal. Chem., 36, 1627Scaife A. M. M., Heald G. H., 2012, MNRAS, 423, L30Schroeder J., Halpern J., 2014, ApJ, 793, 78Schwarz G., 1978, Ann. Stat., 6, 461Shaifullah G. et al., 2016, MNRAS, 462, 1029Stappers B. W. et al., 1996, ApJ, 465, L119Stappers B. W., Bailes M., Lyne A. G., Camilo F., Manchester R. N., Sandhu
J. S., Toscano M., Bell J. F., 2001, MNRAS, 321, 576Stappers B. W. et al., 2011, A&A, 530, A80Thompson C., Blandford R. D., Evans C. R., Phinney E. S., 1994, ApJ, 422,
304van Haarlem M. P. et al., 2013, A&A, 556, A2van Leeuwen J., Stappers B. W., 2010, A&A, 509, A7van Straten W., Bailes M., 2011, PASA, 28, 1Wadiasingh Z., Harding A. K., Venter C., Bottcher M., Baring M. G., 2017,
ApJ, 839, 80Wijnholds S. J., van Cappellen W. A., 2011, IEEE Trans. Antennas Propag.,
59, 1981Williamson I. P., 1972, MNRAS, 157, 55
APPENDI X A : EPHEMERI DES
Table A1 shows the parameters used to fold the beamformed ob-servations of PSR J1810+1744 in this work. Due to unsatisfactorylong-term solutions, adjusted ephemerides were used for most ob-servations. The adjusted parameters, and their modified values areshown in Table A2.
MNRAS 476, 1968–1981 (2018)
Dow
nloaded from https://academ
ic.oup.com/m
nras/article-abstract/476/2/1968/4848310 by CN
RS user on 20 Septem
ber 2019

Eclipses of PSR J1810+1744 1981
Table A1. Parameters for PSR J1810+1744.
Parameter Value
RAJ 18:10:37.2817102DECJ +17:44:37.36758F0 601.41150960535386139F1 −1.6320154486270032265e-15PEPOCH 56043.457048008625684POSEPOCH 55530.000192047375631DMEPOCH 56043.456848000000001DM 39.657544844694188023PMRA 18.478282659525929557PMDEC 2.5348579936231234319BINARY BTPB 0.14817027505277922673T0 55130.048390573342001A1 0.095385516379427031886OM 0ECC 0START 57071.294732713806226FINISH 57073.494745636093214
Table A2. List of observations and the corresponding adjusted ephemeris parameters. aL260707, L260713, L260719, L260725, L260731, L260737, L260743,and L260749.
Date Telescope Project ID ObsID Duration Adjusted parameters
2015 Feb 19 LOFAR LC2_039 a 8 × 30 m As above2014 Sept 19 LOFAR LC2_026 L243355 1 h F0 = 601.4114975594
START = 56824.005317681616837FINISH = 56826.046924821248943
2014 Sept 18 LOFAR LC2_026 L243365 1 h F0 = 601.41149755942529537START = 56824.005317681616837FINISH = 56826.046924821248943
2014 Jun 17 LOFAR LC2_026 L231759 1 h F0 = 601.4114975594START = 56824.005317681616837FINISH = 56826.046924821248943
2013 Oct 02 LOFAR LC0_011 L181912 5 m F0 = 601.4114975594START = 56824.005317681616837FINISH = 56826.046924821248943
2013 July 26 LOFAR DDT_005 L166106 2 h 6 m F0 = 601.4115075853279595F1 = −7.0431312170082538772 × 10⁻¹⁴
T0 = 55130.048424058501556START = 56496.838153045821123FINISH = 56498.931146729934149
2013 July 25 LOFAR DDT_005 L166110 2 h 42 m F0 = 601.4115075853279595F1 = 1.422881594092733325 × 10⁻¹⁴
T0 = 55130.048422567561047START = 56497.817284424338311FINISH = 56499.92833244848606
2013 July 24 LOFAR DDT_005 L165450 2 h 12 m F0 = 601.4115075853279595F1 = 1.422881594092733325 × 10⁻¹⁴
T0 = 55130.048422567561047START = 56497.817284424338311FINISH = 56499.92833244848606
2012 Dec 20 LOFAR LC0_011 L81280 20 m F0 = 601.41147769170566595START = 56281.496642146127428FINISH = 56281.51149934484264
2011 June 06 WSRT S11A008 11102762 5 h F0 = 601.4115075853279595F1 = 3.043269057704096029 × 10⁻¹⁴
T0 = 55130.04835922778463A1 = 0.095377871058077957022START = 55717.076542729752688FINISH = 55719.284128548818259
This paper has been typeset from a TEX/LATEX file prepared by the author.
MNRAS 476, 1968–1981 (2018)
Dow
nloaded from https://academ
ic.oup.com/m
nras/article-abstract/476/2/1968/4848310 by CN
RS user on 20 Septem
ber 2019