The Lifecycle of Sustainable Analytics
22
The Lifecycle of Sustainable Analytics FROM DATA COLLECTION TO CHANGE MANAGEMENT Mitchell Colver, PhD Center for Student Analytics
Transcript of The Lifecycle of Sustainable Analytics
The Lifecycle of Sustainable Analytics FROM DATA COLLECTION TO CHANGE MANAGEMENT
Mitchell Colver, PhDCenter for Student Analytics
II | The Lifecycle of Sustainable Analytics
About the Center for Student Analytics
The Center for Student Analytics functions as a service entity at Utah State University, providing professional empowerment and opportunities for enhanced data literacy to other administrative units on campus.
ais.usu.edu/analytics
The core tenets of our mission focus on the following three premises which relate to why analytics are an essential feature of the modern higher education landscape:
a. Analytics enhance professional capacities and highlight professional competency by making an institution’s data more accessible and actionable through robust modeling and dynamic visualizations.
b. When used appropriately and with proper training, analytics are an invaluable resource for informed professional decision making and enhanced deployment of curriculum and student services.
c. Analytics are most effective when used in a manner that leads to increased hu-man collaboration and a greater sense of
efficacy as professionals empower student thriving through increased learning, discov-ery, and engagement.
To these ends, the Center for Student Analytics is committed to the following activities:
1. Data Collection & Access
2. Data Science & Modeling
3. Data Visualization & Workflows
4. Socialization of Analytics Tools
5. Empowerment of Human Action
6. Advocacy & Innovation
The overarching goal of our work is to pur-sue and facilitate institutional effectiveness.
The Lifecycle of Sustainable Analytics | III
Table of Contents
1...........................THE LIFECYCLE OF SUSTAINABLE ANALYTICS: FROM DATA COLLECTION TO CHANGE MANAGEMENT
ABSTRACT
INTRODUCTION
2 .........................FIRST THINGS FIRST: DATA COLLECTION, DATA SCIENCE, & DATA VISUALIZATION
FORMAL ANALYTICS
4 .........................SHINY TOOLS, GLOSSY HEADLINES
OUR EXPERIENCE RESISTING THE ALLURE OF FOCUSING ON TOOLS
6 .........................BASIC PSYCHOLOGICAL NEEDS IN THE WORKPLACE: THE LINK TO INNOVATION
8 .........................FULFILLING THE BASIC PSYCHOLOGICAL NEEDS AT WORK
A ROADMAP FOR IMPROVED LEADERSHIP
9 .........................INTRODUCING THE LIFECYCLE OF SUSTAINABLE ANALYTICS
OVERCOMING BARRIERS TO ANALYTICS ADOPTION: THE NEED FOR SOCIALIZATION
MOVING TOWARD SUSTAINABILITY: EMPOWERING HUMAN ACTION
11 ........................THREE PRACTICAL EXAMPLES OF DATA THERAPY IN ACTION
EXAMPLE 1: SOCIALIZING ANALYTICS FOR ACADEMIC ADVISORS
EXAMPLE 2: EVALUATION ANALYTICS FOR PROGRAM ADMINISTRATORS
EXAMPLE 3: FACULTY ANALYTICS FOR IMPROVED TEACHING
14 .......................ADVOCACY AND INNOVATION
15 .......................CONCLUSION & IMPLICATIONS
15 .......................A TOOLKIT OF TAKEAWAYS
MOVING ANALYTICS-TO-ACTION
16 .......................REFERENCES

IV | The Lifecycle of Sustainable Analytics
The Lifecycle of Sustainable Analytics | 1
The Lifecycle of Sustainable Analytics: From Data Collection to Change ManagementThis report highlights some of the core issues of deploying analytics in higher education in a way that sustains data literacy and cultural change. With a focus on change management, data therapy, and innovation, the report provides a toolkit of strategies that empower 21st-century professionalism.
ABSTRACT In this age of an ever-increasing list of analytics vendors and endlessly forwarded news articles that trumpet the promises of big data in higher education, it can be easy to become distracted by data science and miss out on another opportuni-ty—supporting increased professionalism amongst university staff, faculty, and administrators. Indeed, like many technologies before it, analytics provides us with an opportunity to catalyze institutional effectiveness, but only when we resist the tenden-cy to believe that technology can replace the need for human ingenuity and judgment.
This report will argue that such threats to pro-fessional flourishing can be insulated against if administrators in higher education are willing to imbue analytics initiatives with a focus on increased data literacy, professional autonomy, and human collaboration. Our initial successes with focusing on the human element in analytics will be explored, accompanied by evidence supporting this approach.
Dr. Mitchell Colver is the Founding Manager of the Center for Student Analytics within the Division of Academic & Instructional Services at Utah State University. He also is an instructor in the School of Teacher Education and Leadership.
Acknowledgements: Special thanks to John Louviere, Amanda Hagman, Erik Dickamore, and Meagan Roach for their support and feedback on this project.
Recommended Citation: Colver, M. (2018). The lifecycle of sustainable analytics: From data collec-tion to change management. Center for Student Analytics: Utah State University.
INTRODUCTIONAs has been noted in the large body of high-qual-ity research regarding analytics solutions, institutions of higher education are increasingly finding themselves lost in the weeds of big data. Wayfinding through this data using analytics tools is seen as the emerging imperative of the 21st cen-tury, with institutions racing to keep up with trends set in consumer markets and in the healthcare industry. As noted by MacFadyen, Dawson, Pardo, and Gasevic (2014), “Globally, education lags behind all other sectors in harnessing the power of analytics. A preliminary analysis indicates that educational institutions simply lack the practical, technical and financial capacity to effectively gather, manage and mine big data” (p. 22). Indeed, as we have circulated around the country and world engaging colleagues at peer institutions, we have consistently heard a resounding and recur-rent distress signal revealing the reality that many institutions are simply not prepared to grapple with the demands of enterprise-wide analytics solutions.
For example, at some institutions, teams of data engineers, some a dozen strong, are so engrossed in the flash of creating analytics tools that little effort is diverted to the ever-important work of actively socializing those tools amongst end users. Analytics are powerful, no question, but the results and predictions they produce can be easily misunderstood by the data-adverse when not properly socialized or, worse, can be weaponized against students and colleagues rather than used constructively. At other institutions, mid-level professionals are battered by an analytics mandate handed down from executive administrators desperate for increased metrics. Such administra-tive edicts, to “deploy software or else,” are rarely associated with commensurate resources invested

2 | The Lifecycle of Sustainable Analytics
in building these professionals up with expanded skillsets. Moreover, many institutions enter the analytics race chasing for headline-worthy results, only to turn up years later empty handed and a little befuddled as to why analytics did not serve as a heralded silver-bullet for their flatlined reten-tion numbers.
Early in our analytics journey at Utah State University, we reflected on these scenarios and concluded that a thread common to all is a lack of administrative investment in professional well-being and a narrow focus on analytics tools themselves. Many administrators sitting at the helm of institutions’ analytics initiatives seem to be unhinged from the reality that increased professional practice is what ultimately produces the amazing results we have all read about time and again in the Chronicle of Higher Education. Although analytics are a core element of these success stories, we believe that emerging data science, though necessary, is not sufficient for producing truly stellar outcomes.
Instead, we agree with Siemens, Dawson, and Lynch (2013), who note: “To move a university and the higher education sector as a whole from da-ta-accessible to analytics-informed requires strong leadership and awareness to instill a coherent vi-sion and strategy and to navigate the complexities and resistances to change that are often pervasive in education” (p. 29). In other words, we have learned that analytics can only sustain institutional effectiveness when deployed with an eye towards change management and human ingenuity.
Working to empower data literacy and profession-alism means using data to catalyze different forms of practice, new frameworks of understanding, and an invigorated commitment to student success. In other words, professionals need to be committed to innovation, personal growth, and professional efficacy in order for analytics to work. While such ideals seem vague and amorphous—easier to say than to accomplish—the discipline of organiza-tional psychology lends us some tangible insights: concrete strategies that consistently empower the kind of professionalism that makes analytics work. Indeed. We do not have to look far to find the central ingredients of how to uphold and sustain an innovation-oriented culture and healthy use of analytics.
A rich heritage of research about what motivates human beings and keeps us happy, especially in the workplace, reveals that there are three basic human needs that must be frequently and consistently tended to in order to sustain psy-chological growth and well-being in almost any context: autonomy, competence, and relatedness (Deci & Ryan, 2014; Gagné, 2014). Our approach introduces the oft overlooked link between these basic psychological needs in the workplace and analytics as a tool for driving institutional effec-tiveness. The following pages will also introduce a lifecycle of sustainable analytics that highlights the important role that data can play (when balanced against the need for change management) in facili-tating increased institutional performance through increased professionalism.
First Things First: Data Collection, Data Science, & Data Visualization FORMAL ANALYTICSWhatever else analytics is and does, at the heart of sophisticated analytics systems are mature data collection, data science, and visualization practic-es. While it is easy to discuss the need for change management, we should not be quick to brush aside the importance of well-crafted analytics systems.
In the realm of data science, we usually settle for just two of the three most desirable characteristics of well-crafted software: (i) sophistication, (ii)affordability, and (iii) usability. Whether or not software is homegrown or purchased from a vendor seems to have little effect on this equa-tion. Since such well-crafted analytics systems cannot be replaced by even the greatest change management regimes, institutions that enter the
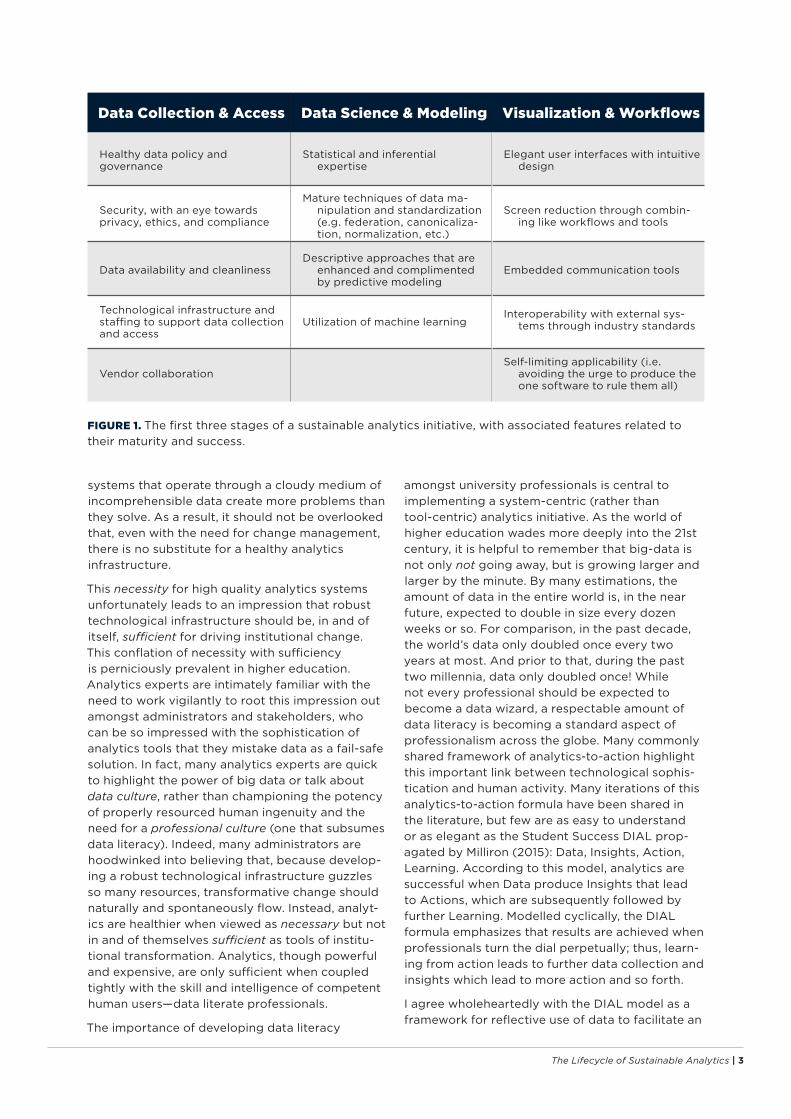
analytics game need to see a healthy technological infrastructure as essential to their overall success. Accordingly, I suggest the following three ele-ments, when mature and high quality, as key to any sustainable analytics initiative: data collection & access, data science & modeling, and visualization & workflows (Figure 1).
When these first three categories of a sustainable analytics initiative are executed well, the resulting insights are likely to be dynamic and potent for driving institutional effectiveness. Indeed when data are clean, clear, and crisp they serve as a lens that dramatically resources each professional’s ability to view institutional outcomes. When data are poorly collected, inaccessible, ineffectively modeled, or otherwise “bad,” analytics systems instead fog, distort, and constrain. Rather than providing greater insight and focus, analytics
The Lifecycle of Sustainable Analytics | 3
FIGURE 1. The first three stages of a sustainable analytics initiative, with associated features related to their maturity and success.
Data Collection & Access Data Science & Modeling Visualization & Workflows
Healthy data policy and governance
Statistical and inferential expertise
Elegant user interfaces with intuitive design
Security, with an eye towards privacy, ethics, and compliance
Mature techniques of data ma-nipulation and standardization (e.g. federation, canonicaliza-tion, normalization, etc.)
Screen reduction through combin-ing like workflows and tools
Data availability and cleanliness Descriptive approaches that are
enhanced and complimented by predictive modeling
Embedded communication tools
Technological infrastructure and staffing to support data collection and access
Utilization of machine learning Interoperability with external sys-
tems through industry standards
Vendor collaborationSelf-limiting applicability (i.e.
avoiding the urge to produce the one software to rule them all)
systems that operate through a cloudy medium of incomprehensible data create more problems than they solve. As a result, it should not be overlooked that, even with the need for change management, there is no substitute for a healthy analytics infrastructure.
This necessity for high quality analytics systems unfortunately leads to an impression that robust technological infrastructure should be, in and of itself, sufficient for driving institutional change. This conflation of necessity with sufficiency is perniciously prevalent in higher education. Analytics experts are intimately familiar with the need to work vigilantly to root this impression out amongst administrators and stakeholders, who can be so impressed with the sophistication of analytics tools that they mistake data as a fail-safe solution. In fact, many analytics experts are quick to highlight the power of big data or talk about data culture, rather than championing the potency of properly resourced human ingenuity and the need for a professional culture (one that subsumes data literacy). Indeed, many administrators are hoodwinked into believing that, because develop-ing a robust technological infrastructure guzzles so many resources, transformative change should naturally and spontaneously flow. Instead, analyt-ics are healthier when viewed as necessary but not in and of themselves sufficient as tools of institu-tional transformation. Analytics, though powerful and expensive, are only sufficient when coupled tightly with the skill and intelligence of competent human users—data literate professionals.
The importance of developing data literacy
amongst university professionals is central to implementing a system-centric (rather than tool-centric) analytics initiative. As the world of higher education wades more deeply into the 21st century, it is helpful to remember that big-data is not only not going away, but is growing larger and larger by the minute. By many estimations, the amount of data in the entire world is, in the near future, expected to double in size every dozen weeks or so. For comparison, in the past decade, the world’s data only doubled once every two years at most. And prior to that, during the past two millennia, data only doubled once! While not every professional should be expected to become a data wizard, a respectable amount of data literacy is becoming a standard aspect of professionalism across the globe. Many commonly shared framework of analytics-to-action highlight this important link between technological sophis-tication and human activity. Many iterations of this analytics-to-action formula have been shared in the literature, but few are as easy to understand or as elegant as the Student Success DIAL prop-agated by Milliron (2015): Data, Insights, Action, Learning. According to this model, analytics are successful when Data produce Insights that lead to Actions, which are subsequently followed by further Learning. Modelled cyclically, the DIAL formula emphasizes that results are achieved when professionals turn the dial perpetually; thus, learn-ing from action leads to further data collection and insights which lead to more action and so forth.
I agree wholeheartedly with the DIAL model as a framework for reflective use of data to facilitate an
4 | The Lifecycle of Sustainable Analytics
Shiny Tools, Glossy Headlines OUR EXPERIENCE RESISTING THE ALLURE OF FOCUSING ON TOOLSIn the summer of 2016, Utah State University signed a contract with Civitas Learning, an Austin-based analytics vendor known for its robust data science and mature process for standardizing institutional data. Years of expe-rience in educational technology had taught our leadership team that enterprise-wide software solutions need to be shepherded closely by professional staff that can focus ex-clusively on the initiative. I was hired to do just that. Our steering committee astutely relied on change management consulting to shape an initial strategy for early adoption amongst key professional groups (such as academic advi-sors and associate deans). While we knew that change management would be necessary, we were not yet sure how analytics differed, if at all, from other software initiatives our division had deployed, such as rolling out Instructure’s learning management system Canvas.
Early in the process of analytics deployment we were fortunate to discover a 2014 paper entitled “Building institutional capacities and competencies for systemic learning analytics initiatives” by lead author Dr. Kimberly Arnold of the University of Wisconsin system and Dr. Grace Lynch of the Society for Learning Analytics Research (SoLAR), writing with several colleagues. The article outlines, fairly comprehensively, crucial issues to the success of any higher education analytics initiative, and identifies common hurdles to overcome in order to achieve success. The paper became our analytics bible, so to speak. Emphasizing the importance of focusing on culture, not tools, the authors share the following insights:
“The promise of educational technology to underpin and drive a transformative learning experience will not be delivered through a simple adoption process… Overnight success
and silver bullet solutions in the realm of learn-ing analytics is highly unlikely. Generally, it is vital to deliver a message of persistence and dedication that, in time, will hopefully yield meaningful results” (pp. 259-260). By heeding their counsel, USU’s analytics leadership team recommitted ourselves to playing the long game of deploying a data literate culture, rather than focusing merely on adoption of the tools.
As part of our commitment to strategic lead-ership, we availed ourselves of the opportunity to create a logic model for the initiative. A logic model is a program planning framework originally designed by the Kellogg Foundation to help program administers think through central elements of the work they oversee. While the logic model we created went through several drafts and still exists as a liv-ing document (we are now on version five), the central elements of the model emphasize the enaction of expertise across multiple domains of higher education leadership. For example, we recognized that it would not be sufficient to rely on our data science, analytics, or even leadership expertise without collaborating with partners who could contribute expertise in the domains of student development theory, curriculum & instruction, communications, and academic advising, just to name a few.
Adding to our commitment to this process was our discovery of Rogers’ (2010) diffu-sion of innovation curve, which highlights that new technologies are rarely adopted rapidly, but instead move through stages of acceptance, which are shaped by cultural, social, and organizational factors. Early in the process, the beliefs and actions of the earliest adopters shape the tone of adoption that the entire organization follows. These champion adopters are critical, as they have a vision for the success of the innovations and are willing to contribute to the cause. This
upward spiral of student success. However, my work with many other institutions mired in the process of jump-starting analytics has taught me that many administrators believe transformative actions flow immediately and spontaneously from analytic insights (rather than from data-literate professionals). Instead, the reality is a great deal more nuanced than that. Successfully empowering professionals to change their practice requires more than throwing a few visualizations at them. Deploying formal ana-lytics is only half of the analytics story; equally important is the work of socialization—empowering both increased professionalism and data literacy amongst stakeholders. The following pages will introduce this new view of analytics and change management, connecting analytics to basic psychological needs and the core elements of life that lead to happiness, especially when applied to the workplace.
The Lifecycle of Sustainable Analytics | 5
group of champions has been called many things—Innovators by Rogers—but perhaps no title is as descriptive as one coined by Melissa Vito, formerly of the University of Arizona: the
“coalition of the willing” (2017). The work of this coalition, early in the process, is critical to wide adoption of any innovation.
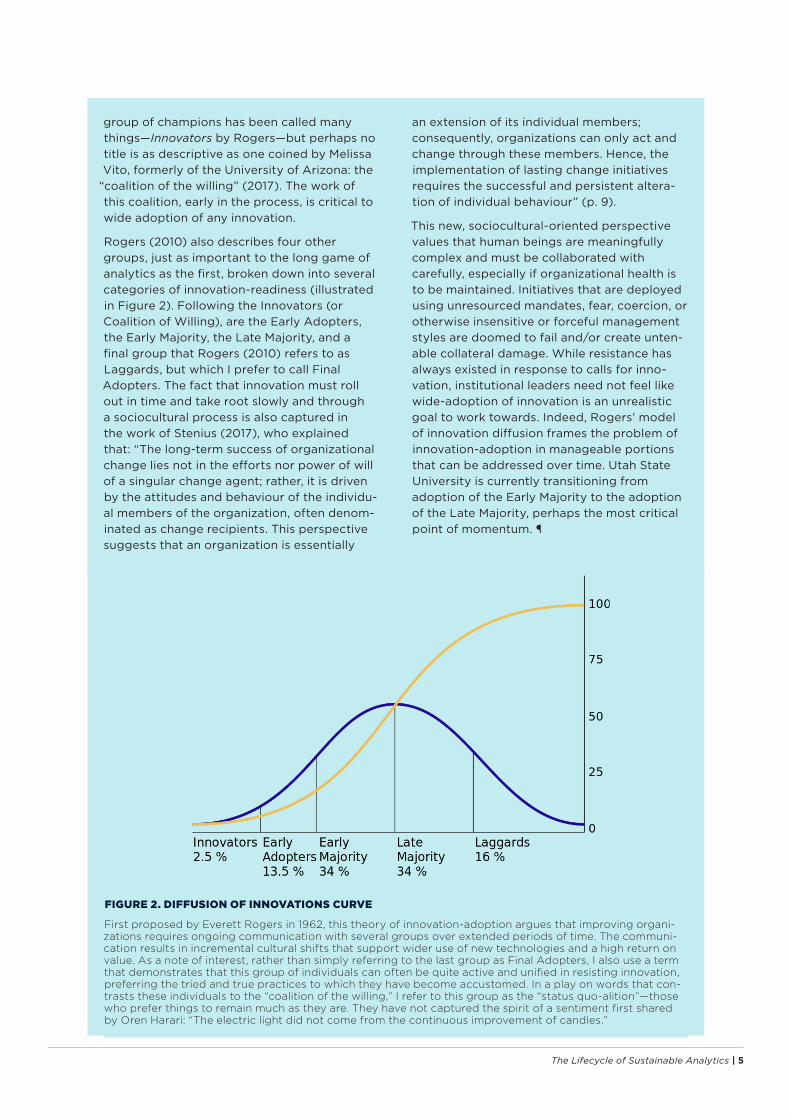
Rogers (2010) also describes four other groups, just as important to the long game of analytics as the first, broken down into several categories of innovation-readiness (illustrated in Figure 2). Following the Innovators (or Coalition of Willing), are the Early Adopters, the Early Majority, the Late Majority, and a final group that Rogers (2010) refers to as Laggards, but which I prefer to call Final Adopters. The fact that innovation must roll out in time and take root slowly and through a sociocultural process is also captured in the work of Stenius (2017), who explained that: “The long-term success of organizational change lies not in the efforts nor power of will of a singular change agent; rather, it is driven by the attitudes and behaviour of the individu-al members of the organization, often denom-inated as change recipients. This perspective suggests that an organization is essentially
an extension of its individual members; consequently, organizations can only act and change through these members. Hence, the implementation of lasting change initiatives requires the successful and persistent altera-tion of individual behaviour” (p. 9).
This new, sociocultural-oriented perspective values that human beings are meaningfully complex and must be collaborated with carefully, especially if organizational health is to be maintained. Initiatives that are deployed using unresourced mandates, fear, coercion, or otherwise insensitive or forceful management styles are doomed to fail and/or create unten-able collateral damage. While resistance has always existed in response to calls for inno-vation, institutional leaders need not feel like wide-adoption of innovation is an unrealistic goal to work towards. Indeed, Rogers’ model of innovation diffusion frames the problem of innovation-adoption in manageable portions that can be addressed over time. Utah State University is currently transitioning from adoption of the Early Majority to the adoption of the Late Majority, perhaps the most critical point of momentum. 
FIGURE 2. DIFFUSION OF INNOVATIONS CURVE
First proposed by Everett Rogers in 1962, this theory of innovation-adoption argues that improving organi-zations requires ongoing communication with several groups over extended periods of time. The communi-cation results in incremental cultural shifts that support wider use of new technologies and a high return on value. As a note of interest, rather than simply referring to the last group as Final Adopters, I also use a term that demonstrates that this group of individuals can often be quite active and unified in resisting innovation, preferring the tried and true practices to which they have become accustomed. In a play on words that con-trasts these individuals to the “coalition of the willing,” I refer to this group as the “status quo-alition”—those who prefer things to remain much as they are. They have not captured the spirit of a sentiment first shared by Oren Harari: “The electric light did not come from the continuous improvement of candles.”
6 | The Lifecycle of Sustainable Analytics
Basic Psychological Needs in the Workplace: The Link to InnovationMore than forty years of research about human motivation and happiness has produced evi-dence that the three basic psychological needs of autonomy, competence, and relatedness are central to human well-being (Deci & Ryan, 1985; Deci, 1971). This framework of human needs has become central to the way that we socialize analytics at Utah State University, informing our analytics deployment strategies at the broadest levels of administrative planning. Known as Self-Determination Theory (SDT), this framework emphasizes that human beings are surprisingly committed to exploring and mastering their surroundings, learning to reap benefits and avoid losses. Interestingly, the human need to explore and understand our environment is so strong that we will even do it at risk of our own peril (Gagné, 2014). The theory posits that the combination of this exploration and the rich ecology of choices we live in gives rise to a basic psychological need for autonomy, or the need to feel personal causa-tion—the realization that our existence produces meaningful differences in the world around us.
As we make choices, we also pay close attention to how our choices produce positive and nega-tive outcomes. We have an insatiable desire for answering the questions, “What has gone well? And what could have been better?” By carefully tracking the results of our endeavors, we begin to
develop a sense of competence, becoming ever more able to navigate the world around us. For example, upon finding some new berries in the forest, we might try one or two and wait a couple of hours to see what happens before trying some more, if at all. We use our autonomy to explore the world and or competence as a way to track the outcomes of our decisions so we can function even more successfully in the future. Taken together, these two basic psychological needs (autonomy and competence) work together to help us to survive and thrive in a dynamically rewarding and adverse world.
While these two psychological needs may not seem immediately relevant to analytics, a close relationship emerges upon further inspection. The formal definition of analytics, according to Cooper (2012), is: “The process of developing actionable insights through problem definition and the application of statistical models and analysis against existing and/or simulated future data” (p. 3). However, with these two basic psychological needs in mind, it might be more useful to define analytics more informally as, “A way to follow up on the choices you have made at work and to pro-vide real-time answers the questions: What is going well? And what could be better?” Since many of the choices we make do not produce immediate results and may affect large systems, we must
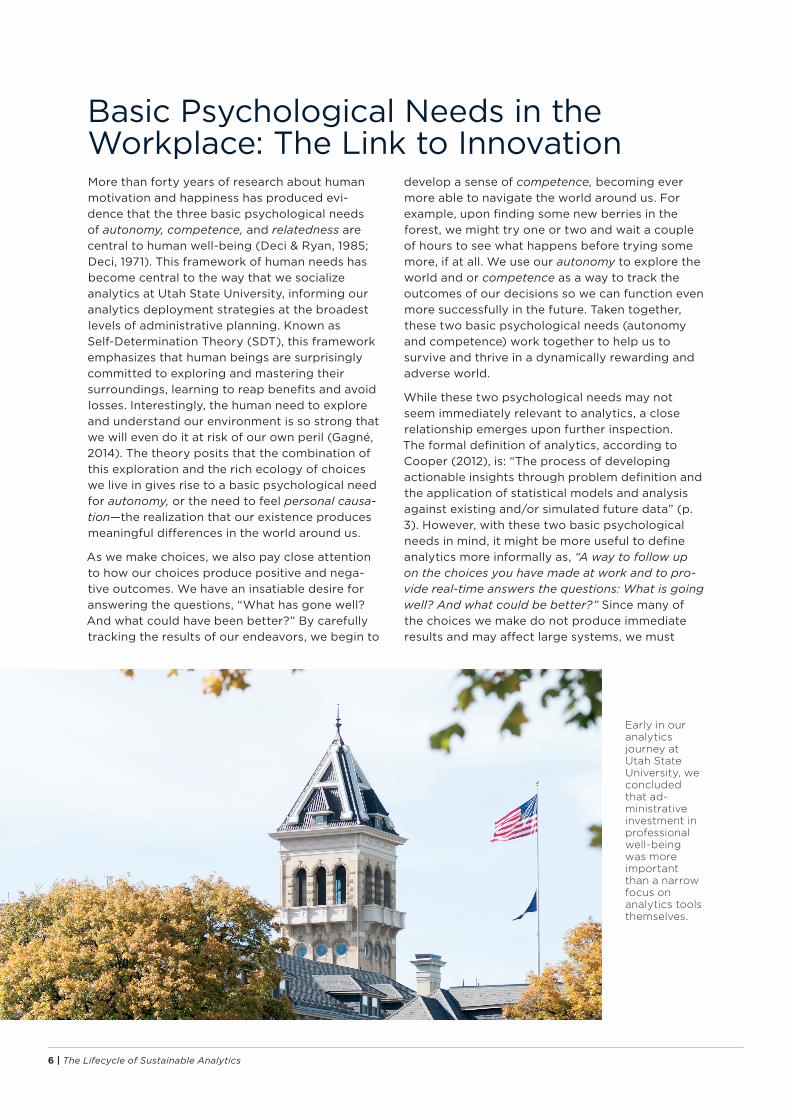
Early in our analytics journey at Utah State University, we concluded that ad-ministrative investment in professional well-being was more important than a narrow focus on analytics tools themselves.
The Lifecycle of Sustainable Analytics | 7
resort to sophisticated methods of measuring the results, using more than just our eyes, ears, and intuition. Thus, this need to measure programs and curriculum does not arise from an evaluation-hap-py group of math-loving administrators. Instead, evaluation and assessment, including the use of analytics, emerges from our basic human need to follow-up on the choices we have made to deter-mine if they have paid off.
As a highly social organism, our basic psycholog-ical need for both autonomy and competence is bolstered by a third need, interpersonal related-ness—our natural desire to interact with others and share the stories of the day regarding our suc-cesses and failures. Interestingly, we learn, benefit, and even suffer from other people’s successes and failures just as well as our own. Using this sociocultural interaction with others, we acquire strategies of surviving and thriving that already have a reputation amongst our fellow humans for achieving success and for avoiding failure. In other words, we rely heavily on our participation in social groups to help us identify and adopt strategies that have already been well tested by others as sustaining human flourishing.
In this same way, analytics directly relate to all three basic human needs by helping us collect evidence of the outcomes of our choices and share that evidence with others who might benefit from our experience. Since most of us are often just one node of a larger organization, analytics may even help individual members of larger systems follow up on choices made by other individuals within the organization. In this way, analytics help close the feedback loop that we require as human beings at both the individual and group level, as we follow up on the many professional choices
we have made. Analytics in the workplace enable us to develop both individual and organizational competence through these critical insights.
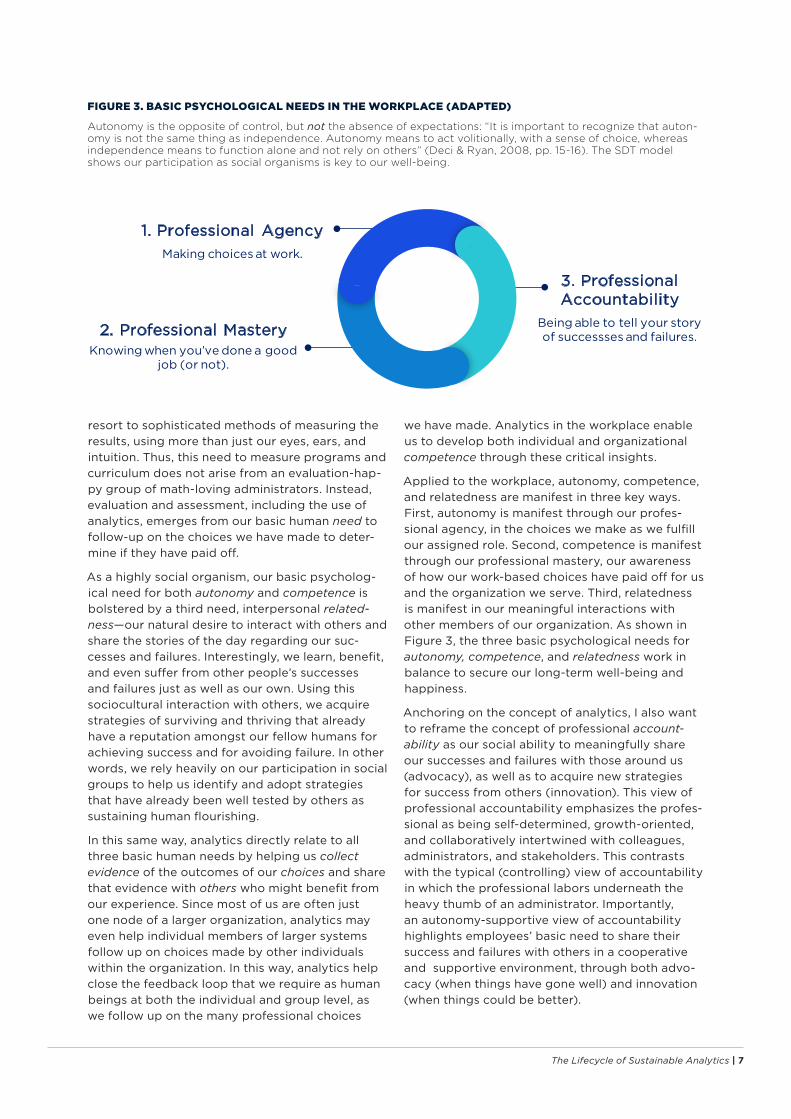
Applied to the workplace, autonomy, competence, and relatedness are manifest in three key ways. First, autonomy is manifest through our profes-sional agency, in the choices we make as we fulfill our assigned role. Second, competence is manifest through our professional mastery, our awareness of how our work-based choices have paid off for us and the organization we serve. Third, relatedness is manifest in our meaningful interactions with other members of our organization. As shown in Figure 3, the three basic psychological needs for autonomy, competence, and relatedness work in balance to secure our long-term well-being and happiness.
Anchoring on the concept of analytics, I also want to reframe the concept of professional account-ability as our social ability to meaningfully share our successes and failures with those around us (advocacy), as well as to acquire new strategies for success from others (innovation). This view of professional accountability emphasizes the profes-sional as being self-determined, growth-oriented, and collaboratively intertwined with colleagues, administrators, and stakeholders. This contrasts with the typical (controlling) view of accountability in which the professional labors underneath the heavy thumb of an administrator. Importantly, an autonomy-supportive view of accountability highlights employees’ basic need to share their success and failures with others in a cooperative and supportive environment, through both advo-cacy (when things have gone well) and innovation (when things could be better).
FIGURE 3. BASIC PSYCHOLOGICAL NEEDS IN THE WORKPLACE (ADAPTED)
Autonomy is the opposite of control, but not the absence of expectations: “It is important to recognize that auton-omy is not the same thing as independence. Autonomy means to act volitionally, with a sense of choice, whereas independence means to function alone and not rely on others” (Deci & Ryan, 2008, pp. 15-16). The SDT model shows our participation as social organisms is key to our well-being.
1. Professional AgencyMaking choices at work.
2. Professional MasteryKnowing when you’ve done a good
job (or not).
3. Professional Accountability
Being able to tell your story of successses and failures.
8 | The Lifecycle of Sustainable Analytics
Fulfilling the Basic Psychological Needs at WorkA ROADMAP FOR IMPROVED LEADERSHIPDecades of research in the field of organizational psychology has shown that fulfilling the three basic psychological needs in the workplace, including supporting individuals in their failures, is crucial to driving organization success. Research by Van den Broeck, Vansteenkiste, De Witte, and Lens (2008) has demonstrated that when all three of our needs for autonomy, competence, and relatedness are fulfilled, numerous positive benefits emerge:
• Enhanced performance and persistence
• More in-depth processing of tasks
• Increased job-satisfaction and trust in management & the organization
• Decreased reports of negative work emotions and control-oriented customer service
• Increased sense of professional efficacy
• Lower work/home interference
While supporting the basic psychological needs in the workplace may seem easier said than done, research also provides us with a roadmap for successfully understanding how each of these three needs manifest in a professional setting.
Authors Gilbert and Kelloway (2014) offer the following suggestions on how to support employee autonomy, competence, and relatedness in the workplace:
AUTONOMY-SUPPORT FOR EMPOWERING PROFESSIONAL AGENCY“Managerial behaviors that are supportive of autonomy [include] sharing control and influence with employees about how the work gets done, allowing employees to choose their tasks, allowing for the possibility of failure, providing feedback in a noncontrolling way, communicating assertively rather than aggressively, using incentives to reward good work, trying to understand the subordi-nates’ perspective, and eliminating excessive rules” (p. 183).
COMPETENCE-SUPPORT FOR EMPOWERING PROFESSIONAL MASTERY
“Leaders can satisfy the need for competence by delegating tasks that fit well with an individual employee’s skills and abilities… properly training and supporting subordinates, discussing and agreeing on achievable goals with subordinates, delegating interesting tasks that develop new skills, providing regular feedback, and removing barriers to efficient performance” (p. 183).
RELATEDNESS-SUPPORT FOR EMPOWERING PROFESSIONAL ACCOUNTABILITY “Leader behaviors that support relatedness are those that foster teamwork, mutual respect, reliance on other team-members, and shaped group goals… holding regular meetings, encouraging cooper-ation and discouraging competition, speaking only favorably about others in the workplace that are not present, communicating effectively and sharing information” (p. 183).
Put succinctly and in relationship to analytics initiatives, the basic psychological needs are fulfilled in the workplace when leaders empower professionals to make good choices, to seek evidence of how those choices have paid off, and to collaboratively share their successes and failures with colleagues, administrators, and stakeholders.
The Lifecycle of Sustainable Analytics | 9
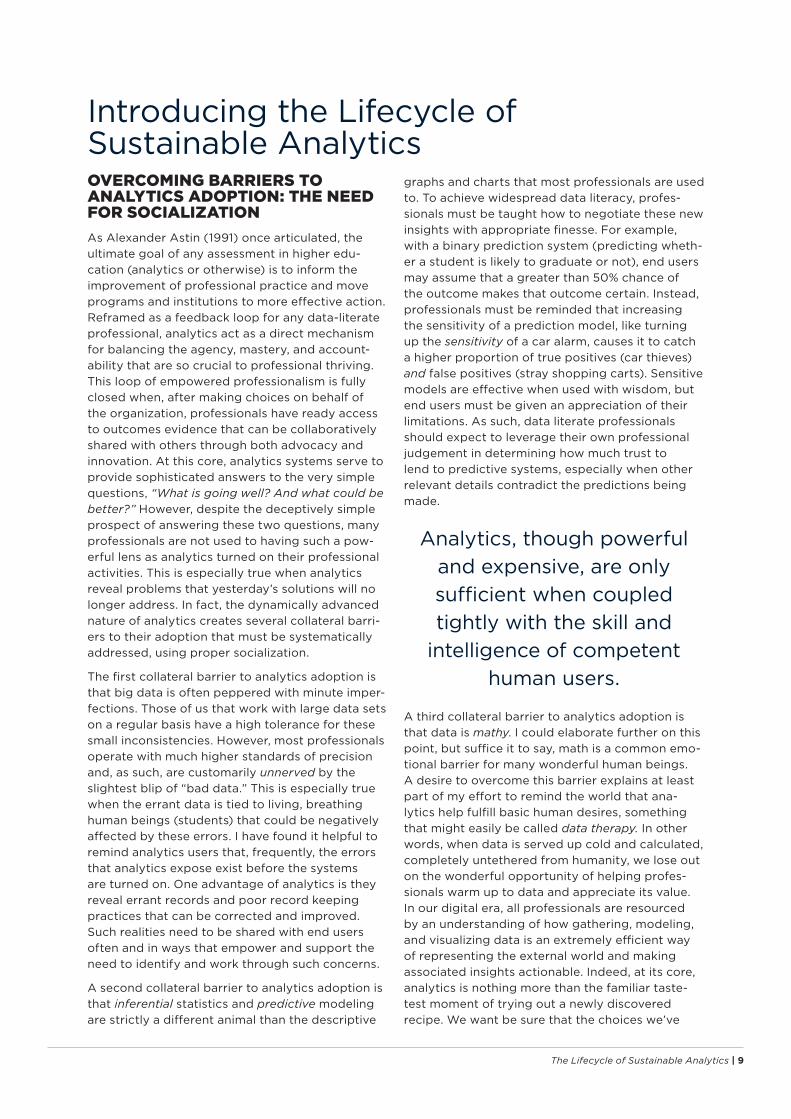
Introducing the Lifecycle of Sustainable AnalyticsOVERCOMING BARRIERS TO ANALYTICS ADOPTION: THE NEED FOR SOCIALIZATIONAs Alexander Astin (1991) once articulated, the ultimate goal of any assessment in higher edu-cation (analytics or otherwise) is to inform the improvement of professional practice and move programs and institutions to more effective action. Reframed as a feedback loop for any data-literate professional, analytics act as a direct mechanism for balancing the agency, mastery, and account-ability that are so crucial to professional thriving. This loop of empowered professionalism is fully closed when, after making choices on behalf of the organization, professionals have ready access to outcomes evidence that can be collaboratively shared with others through both advocacy and innovation. At this core, analytics systems serve to provide sophisticated answers to the very simple questions, “What is going well? And what could be better?” However, despite the deceptively simple prospect of answering these two questions, many professionals are not used to having such a pow-erful lens as analytics turned on their professional activities. This is especially true when analytics reveal problems that yesterday’s solutions will no longer address. In fact, the dynamically advanced nature of analytics creates several collateral barri-ers to their adoption that must be systematically addressed, using proper socialization.
The first collateral barrier to analytics adoption is that big data is often peppered with minute imper-fections. Those of us that work with large data sets on a regular basis have a high tolerance for these small inconsistencies. However, most professionals operate with much higher standards of precision and, as such, are customarily unnerved by the slightest blip of “bad data.” This is especially true when the errant data is tied to living, breathing human beings (students) that could be negatively affected by these errors. I have found it helpful to remind analytics users that, frequently, the errors that analytics expose exist before the systems are turned on. One advantage of analytics is they reveal errant records and poor record keeping practices that can be corrected and improved. Such realities need to be shared with end users often and in ways that empower and support the need to identify and work through such concerns.
A second collateral barrier to analytics adoption is that inferential statistics and predictive modeling are strictly a different animal than the descriptive
graphs and charts that most professionals are used to. To achieve widespread data literacy, profes-sionals must be taught how to negotiate these new insights with appropriate finesse. For example, with a binary prediction system (predicting wheth-er a student is likely to graduate or not), end users may assume that a greater than 50% chance of the outcome makes that outcome certain. Instead, professionals must be reminded that increasing the sensitivity of a prediction model, like turning up the sensitivity of a car alarm, causes it to catch a higher proportion of true positives (car thieves) and false positives (stray shopping carts). Sensitive models are effective when used with wisdom, but end users must be given an appreciation of their limitations. As such, data literate professionals should expect to leverage their own professional judgement in determining how much trust to lend to predictive systems, especially when other relevant details contradict the predictions being made.
A third collateral barrier to analytics adoption is that data is mathy. I could elaborate further on this point, but suffice it to say, math is a common emo-tional barrier for many wonderful human beings. A desire to overcome this barrier explains at least part of my effort to remind the world that ana-lytics help fulfill basic human desires, something that might easily be called data therapy. In other words, when data is served up cold and calculated, completely untethered from humanity, we lose out on the wonderful opportunity of helping profes-sionals warm up to data and appreciate its value. In our digital era, all professionals are resourced by an understanding of how gathering, modeling, and visualizing data is an extremely efficient way of representing the external world and making associated insights actionable. Indeed, at its core, analytics is nothing more than the familiar taste-test moment of trying out a newly discovered recipe. We want be sure that the choices we’ve
Analytics, though powerful and expensive, are only sufficient when coupled tightly with the skill and
intelligence of competent human users.
10 | The Lifecycle of Sustainable Analytics
made in blending together many possible ingre-dients have produced a result that matches our intentions. This simple vetting process helps us avoid serving a result that is less than palatable. Just the same, when we serve up any aspect of higher education without a proper taste-test using analytics (or any form of evaluation), we do so at the expense of everyone we have invited to the table, including students, their families, and even the public.
In light of this reality, measuring the outcomes of our professional choices to determine our relative successes and failures is not only a basic human need, it is a moral imperative for any well-intentioned organization. Realizing this value of big data, institutions of higher education need to invest not only in analytics systems, but also in providing ongoing professional development opportunities that enhance practical strategies of understanding and utilizing data. Proper and ongoing evaluation processes help institutions to close the feedback loop on their professional choices and ensure delivery of a high quality prod-uct. Stewards of analytics systems must therefore socialize the tools through professional develop-ment that helps sustain this awareness through enhanced data literacy. As shown in Figure 4, socialization is the fourth step of The Lifecycle of Sustainable Analytics.
MOVING TOWARD SUSTAINABILITY: EMPOWERING HUMAN ACTIONEven after proper socialization of tools, when widespread adoption of analytics has taken root,
there may yet exist barriers to true analytics sustainability. Chief amongst these are those behaviors that demonstrate high interaction with analytics, but little activity that actually produces enhanced institutional effectiveness. For example, there are twin threats of a data voyeurism (when data are explored to satisfy curiosity rather than to facilitate action) and analysis paralysis (when analytic insights are heavily consumed to the point of confusion). To address these threats, and others, we intentionally focused a great deal of our energy on using techniques of autonomy-supportive lead-ership to ensure that professionals moved toward meaningful actions. Thus, the fifth element of the lifecycle of sustainable analytics is the empower-ment of human action (see Figure 4).
In this work of empowering human action, a healthy arsenal of expertise in relevant domains can help analysts contribute to the heavy lifting of designing university activity. For example, when working with academic advisors, understanding the central tenets and philosophies of academic advising goes a long way toward facilitating a culture of analytics-to-action. When working with faculty on curriculum and instruction, having a deep well of expertise in the realm of pedagogy and learning sciences is similarly a tremendous help. When working with administrators about matters of retention, having a healthy grasp of stu-dent development theory is crucial to partnering towards success. When analysts lack these skills, they should be quick to identify domain experts to partner with to foster innovation that is appropri-ately contextualized. Professionals are much more likely to adopt data literate practices, when their own domain dominates the conversation.
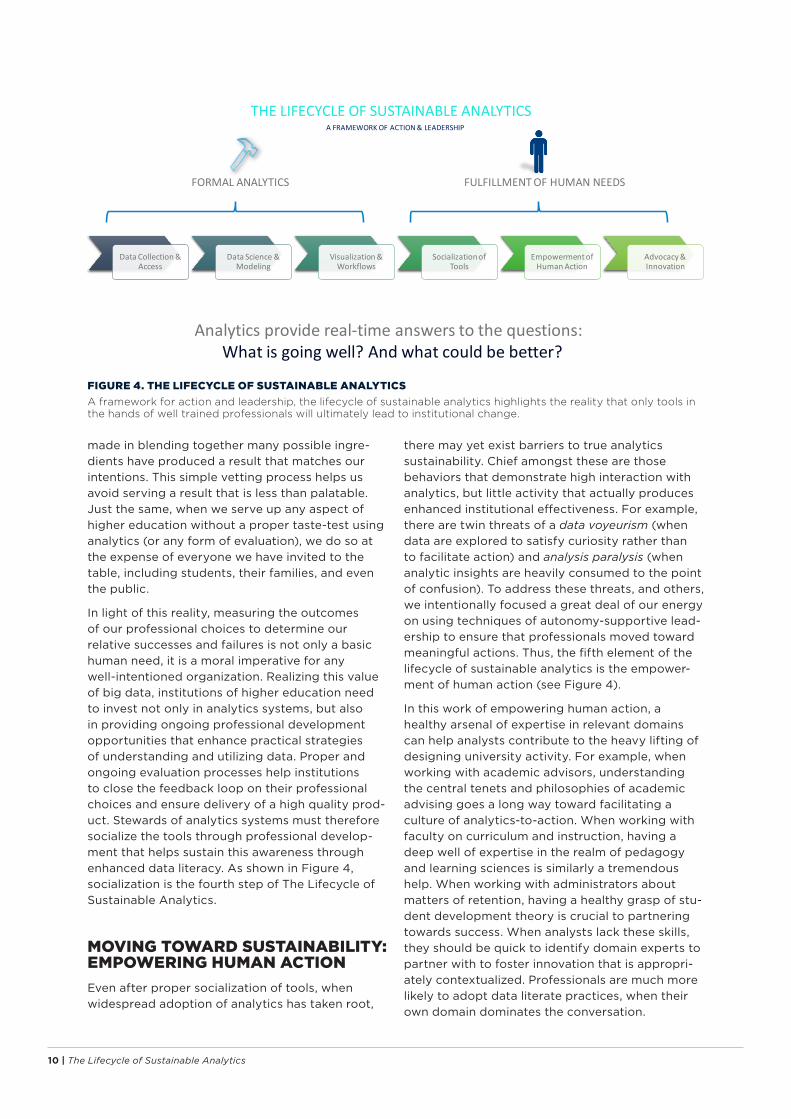
FIGURE 4. THE LIFECYCLE OF SUSTAINABLE ANALYTICS A framework for action and leadership, the lifecycle of sustainable analytics highlights the reality that only tools in the hands of well trained professionals will ultimately lead to institutional change.
Data Collection & Access
Data Science & Modeling
Visualization & Workflows
Socialization of Tools
Empowerment of Human Action
Advocacy & Innovation
THE LIFECYCLE OF SUSTAINABLE ANALYTICS
FORMAL ANALYTICS FULFILLMENT OF HUMAN NEEDS
Analytics provide real-time answers to the questions: What is going well? And what could be better?
A FRAMEWORK OF ACTION & LEADERSHIP

The Lifecycle of Sustainable Analytics | 11
Three Practical Examples of Data Therapy in ActionEXAMPLE 1: SOCIALIZING ANALYTICS FOR ACADEMIC ADVISORSOur initial approach to fostering analytics adoption amongst academic advisors was lacking. We chose to provide a 1.5 hour software training that primari-ly focused on a “click here, now click here” ap-proach to developing analytics competence. While we provided a one-page handout that included some helpful hints on interpreting the analytics, the training left it up to advisors to craft an ana-lytics workflow that would work for them. For the most part, this approach was successful for only a handful of advisors, all of whom have a knack for trying out new software. As a result, overall adoption was relatively poor that first semester. However, with the diffusion of innovations curve in mind and some helpful ideas from self-determina-tion theory, I set to work to collaborate with some champion advisors to build out a new training.
The first strength to this approach was partnering with innovation-oriented academic advisors who could help me interpret the analytics workflow in a way that might make sense to other academic advisors. Rather than focusing on all of the fea-tures that the software provided (tool-centric), we worked to identify tasks that advisors already liked to do, but ones that analytics could help with. We created a 10-page guide (called the “Best Practices Timeline”) that structured these 7 or 8 analytics activities on a timeline for the semester, according to when the tasks would make the most sense. We also provided practical examples of how each task might look when it was complete (for example, sample text of an email that advisors might send to students). We made sure that the training we provided with this new guide made it clear that advisors were in the driver’s seat of each activity; advisors would need to decide what analytics activities made sense for them and their existing workflow. We emphasized that some of the activities might not work for them, but that they could exercise their professional judgment to try out what looked promising. The advisor response was overwhelming. While the first semester was marked by plateaued use of analytics, our release of the “Best Practices Timeline” caused logins to skyrocket. What’s more, the following semester, we associated advisor use of analytics with a dramatic increase in Spring-to-Fall persistence concentrated in academic units that had adopted analytics more intentionally. This increase was roughly ten times
higher than increases we had seen in previous years before analytics were deployed.
This vignette highlights how, relying on principles of fulfilling the basic human needs, we were able to achieve a greater analytics adoption amongst end users. For example, we supported advisor auton-omy by empowering them to determine how the analytics work gets done and also which analytics tasks they wanted to focus on. Rather than issuing a mandate with excessive rules advisors needed to follow, we encouraged advisors to explore what aspects of the product worked for them. To support advisor competence, we identified and encouraged tasks that many advisors were already skilled at. With an expanded training and examples to follow from their peers, we helped advisors to know that the work we were asking of them was possible and had worked well for others. We supported advisor relatedness and accountability by encouraging them to rely on peers for support in learning the new analytics tools. We also hosted several learning circles in which advisors could share their successes and failures with others. As results from their work emerged, we were cog-nizant to provide them updates about how their choice to use analytics had paid off. While there is still much work to do within the academic advising community, we believe these initial results will catapult us toward continued success and profes-sional well-being.
EXAMPLE 2: EVALUATION ANALYTICS FOR PROGRAM ADMINISTRATORS Robust methods of program evaluation are ideal in higher education, but are also underutilized by program administrators due to lack of time, assessment expertise, and proper data collection. As a result, assessment that does occur is often descriptive in nature; for example, programs report counts of student participants and dollars spent, rather than an investigation of the program’s measured impact on student well-being. As we de-ployed a sophisticated program evaluation analyt-ics tool, we made special effort to make sure that we were providing program administrators with a professional development experience designed to increase data literacy. Rather than providing ad-ministrators with program evaluation reports from the software (like some kind of auditing service), we opted to structure a multi-part consultation
12 | The Lifecycle of Sustainable Analytics
that walked program administrators through a plan for ongoing assessment, improved data collection techniques, and a discussion centered on appropri-ate interpretation of the results.
During each part of the multi-session consultation, the program administrators operated at the center of the conversation, using their own profession-alism combined with the evaluation insights as a catalyst for innovation. To create a useful record of this interaction, we documented their responses and developed a plan to continue supporting their professionalism throughout the evaluation cycle. We arranged to return after several months to revisit the results and prepare to start the process again the following semester or academic year.
By democratizing the assessment cycle in this way, using software to make program evaluation sustainable, we aim to empower administrators to be the agents of the assessment process (rather than the subject of an auditors’ evaluation), with the eventual intention of having them lead future assessments of their own programs. As we have monitored our progress in this piece of our larger analytics initiative, we have seen a dramatic increase in the speed, effectiveness, and frequency of the program evaluation that is occurring at our institution, especially within the division of student affairs. We have also seen an increase in data literacy amongst program administrators, fidelity of data collection, and use of these reports for program advocacy.
By adopting a more autonomy-supportive ap-proach to the implementation of this evaluation process, we demonstrated our commitment to providing professionals with a meaningful growth experience, rather than just an evaluator’s explana-tion. Because of the high demand for this service, we recently learned that our university has raced ahead of the vendor’s other institutional partners in use of this analytics tool. Within the first few months of launch, our institution’s activity in the software represented 65% of all activity in the software across dozens of other partner schools.
Currently, we represent roughly 33% of the activity in the software across 45 institutions that contract for this software.
As we have discussed this software with other schools that use PPSM for program evaluation, we have become keenly aware that their assessment offices are often using the software as a novelty, rather than as the central part of a core service. What’s more, they send canned reports without unpacking them through a sociocultural expe-rience. This leaves little window of opportunity to carry out additional analyses that arise from stakeholders’ questions and context. In contrast, we try to build partnerships with our stakeholders, allowing assessment opportunities to emerge out of the rich dossier we provide and the lead-ership-oriented interaction we facilitate. Indeed, the multi-part consultations that we provide are conversations that allow in-depth questions and opportunities for greater data literacy and subse-quent innovation. Our service allows us to work closely with stakeholders to interpret the results and co-create further possibilities.
Because of our autonomy supportive approach, for the first time in our careers, we have seen our colleagues excited about assessment and enthusiastic about increasing their professionalism, largely because we treat them as the experts. We empower them to use data to tell their own story and to advocate for their programs according to their own expertise. What’s more, we have already seen the first cycle of how this program evaluation experience has helped to innovate programs. Each consultation ends with the stakeholder articu-lating a plan of action and a setting a date for us to follow-up with them. The intent of this initial follow-up is to document their improvement activ-ities, which will eventually be included in our insti-tution’s accreditation documentation. Additionally, because the software helps us to focus on student persistence, program administrators can innovate and fine tune their offerings to support student success to an even greater degree.
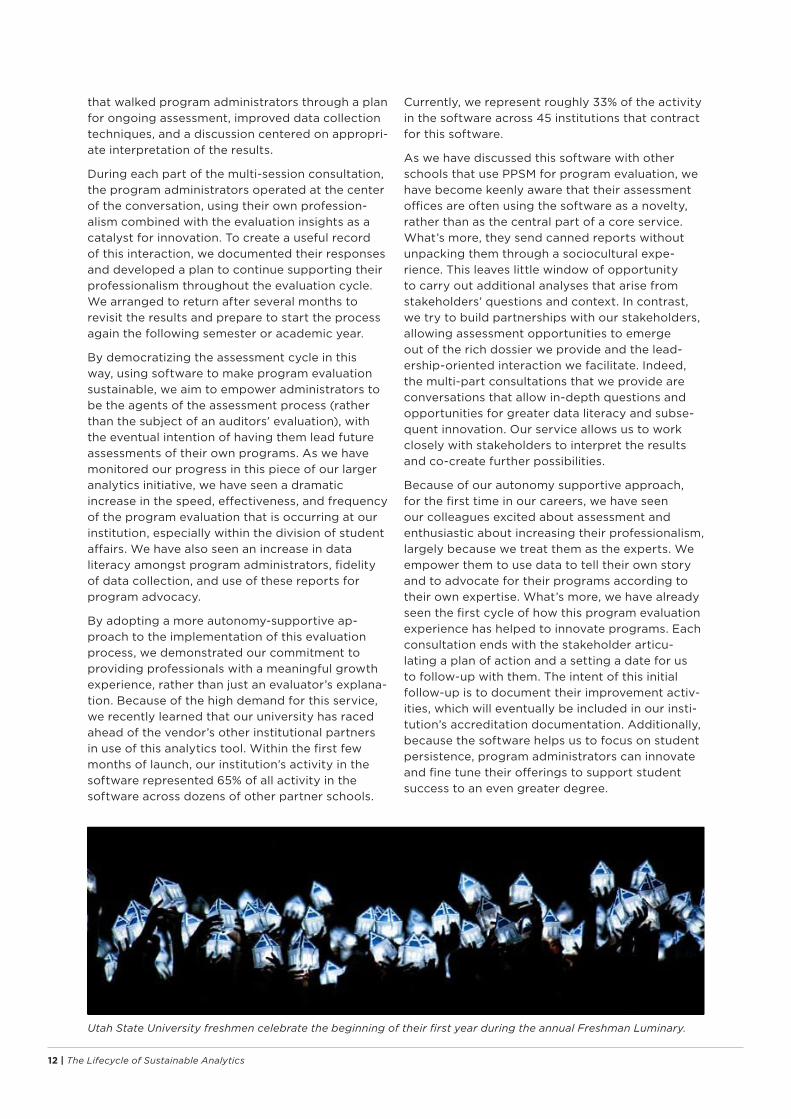
Utah State University freshmen celebrate the beginning of their first year during the annual Freshman Luminary.
The Lifecycle of Sustainable Analytics | 13
Another obstacle we faced is that many program administrators are apprehensive about assessment (a four-letter word in higher education). Rather than launching the software to all units at once, we focused on building partnerships with a coalition of the willing (colleagues with whom we had already built relationships of trust). We presented the use of this technology as an unintrusive assessment opportunity that would involve a great deal of collaborative insight. As we advertised our successes with early adopters, sociocultural momentum built and new implementation op-portunities emerged. Some of the best “Ah hah!” moments occurred when, during our consultations, program administrators would shift into taking ownership of the assessment cycle, demonstrating a clear paradigm shift. Many administrators would express a sentiment of excitement as opportunities for enhanced advocacy for their programs dawned on them. We have been thrilled that the roll-out of this new assessment technology has been met with such positive response.
EXAMPLE 3: FACULTY ANALYTICS FOR IMPROVED TEACHINGIn the early stages of a launching a faculty-facing analytics tool, we were perplexed by how to prompt faculty-engagement in a completely elective analytics training opportunity. To begin our preparation, we looped in domain experts (in pedagogy and curriculum design) from our Center for Innovative Design and Instruction. Working through the many features of the analytics tool, we discovered that many of the data insights that were surfaced, while interesting, were not obviously actionable. Rather than overwhelming faculty with all of this tool’s bells and whistles, we decided to select just a single insight from the software around which to structure an entire two hour workshop. Moreover, as we continued to plan for this professional development opportunity, we focused on using the data to catalyze faculty improvement in a single domain of expertise that would be immediately practical—a syllabus diag-nostic grounded in self-determination theory. This diagnostic would help faculty think through ways to use principles of autonomy, competence, and relatedness to enhance their instructional practice.
Our initial delivery of the faculty analytics work-shop was made possible through administrative partners within a smaller college at our university who were focusing on an initiative to help faculty improve their teaching. Knowing that we would have this support from these core administrators made us confident that we could push the faculty perhaps a little further towards analytics-based
innovation than we otherwise would have felt com-fortable doing. Surprisingly, just 20-25 minutes in the data allowed us to leverage the remaining hour and a half of the workshop toward an in-depth fo-cus on enhanced pedagogy and a research-based discussion of course planning techniques. The result paid dividends. Feedback from one faculty member in that initial training session was that it was the best professional development opportu-nity she had attended in her 20 years as a faculty member. As we have offered this session to more than a dozen different academic departments, we have received similar feedback and have continued to shape and craft the experience. As I’ve followed up with various faculty participants, I have been delighted to see the concepts take root in the form of updated syllabi, autonomy-supportive instruc-tion, and enhanced curriculum.
As with the other examples of professional-fo-cused deployment of analytics, this approach to delivering faculty analytics benefited from the principles of self-determination theory. We supported faculty autonomy by providing them with a few core insights and numerous associ-ated strategies to choose from as they worked to improve their practice. We used analytics to create a feedback loop to help them understand how their courses related to overall student success. We also incentivized their participation by offering to help them document their teaching improvement activity for the promotion and tenure process. We supported faculty competence by focusing on developing the skills and abilities they would be most interested in working on. We not only provided a high quality training, but we also used research-based content to help them develop new frameworks of understanding about high quality curriculum and instructional practices. We supported faculty relatedness by creating a highly engaging workshop that required them to contribute their own experiences and brainstorm with their peers to achieve innovation. We also emphasized that their meaningful interactions with students, using the suggested techniques, were potent for empowering greater academic perfor-mance from students not only in specific courses, but throughout students’ academic career. Overall, this vignette lends support to the idea that focus-ing on enhanced professional practice and the empowerment of human action is key to making analytics initiatives successful.
14 | The Lifecycle of Sustainable Analytics
Advocacy and InnovationTHE FINAL STAGE OF THE LIFECYCLE OF SUSTAIN-ABLE ANALYTICS IS PERHAPS THE MOST REWARD-ING—AN OPPORTUNITY TO ENGAGE IN ADVOCACY AND INNOVATION.
As shown in Figure 4, the entire lifecycle of analyt-ics lays the foundation for professionals to satisfy their basic human need to make choices and an-swer the questions, “What is going well? And what could be better?” Our need for autonomy drives us to want to make a difference in the world, includ-ing through our professional pursuits. Our need for competence makes us want to improve, ever increasing our ability to contribute and to thrive. Our need for relatedness instills a deep desire in us to share the stories of our successes and failures with others, even when things haven’t gone as well (since we know we can improve). Analytics, when used properly and with this framework in mind, help us to navigate and fulfill all three of these basic human needs.
Data collection, modeling, and visualization are an important part of the analytics story. However, their purpose is subservient in the context of fulfilling basic human needs. Focusing so intently on the sleek design and hyper-performance of the technological infrastructure can lead to losing focus on the utility of these systems in facilitat-ing human thriving. Administrators are likely to achieve better results when they honor the impor-tant link between professional thriving and the use of analytics as tools of empowerment. In contrast, launching analytics as a way to pursue key per-formance indicators, as we have so often seen, misses this mark entirely. Such performance-fo-cused mandates make the tools more important than professionalism and the organization more important than the individual. What’s more, this approach belies the reality that institutional trans-formation only occurs when the individuals that make up the institution change in meaningful ways. If you want to get tomorrow’s results, you need to train tomorrow’s professionals today.
The lifecycle of sustainable analytics is a frame-work for both action and leadership. It conceptual-ly combats the notion that institutional evaluation and improvement are a one-and-done process. The lifecycle emphasizes cyclical advocacy and innovation, bankrolled on our confidence that professionals can and want to get better at the work they do. There is great satisfaction in know-ing that the choices you have made are making a difference, and in being able to say “Look! I did it!”—knowing that you served students effectively, knowing that you can report a good day’s work.
However, you shouldn’t be the only person who can know, with certainty, that you’ve done a good job. Analytics not only help us share our stories of success, but provide the necessary evidence to uphold our feeling of satisfaction, especially as we share with administrators and other key stakehold-ers. Interestingly, there can also be just as much satisfaction in learning that your choices didn’t pay off, as long as you work in an environment where failure is seen as an opportunity, rather than a liability. While the notion of failing forward was not emphasized heavily in this report, the value of creating failure-safe working environments cannot be overstated. This does not mean empowering wanton recklessness or negligence, but it does mean insulating professionals with honest feed-back and compassionate support for both growth and innovation.
An important aspect of professional growth and innovation is looking beyond our immediate surroundings for models of successful practice. Abundant volumes of research- and practition-er-oriented publications are available, but I fear that too often professionals look to their own instincts for innovative solutions, or to strategies they’ve gleaned from years of informal interactions in their professional neighborhood. Unfortunately, many of the traditionally-modeled programs that institutions deploy are simply not producing mean-ingful results. Rather than jumping to the urge to root out and cut such programs, administrators should be intimately concerned with identifying, in appropriate literature, approaches to such ser-vices that demonstrate effectiveness. Innovating towards working models, rather than clear cutting programs that underperform is typically healthier in the long run. In any case, even programs that are performing well should not rest on their laurels, as an ever-changing world and shifts in generational demographics mean that there are always oppor-tunities to innovate.
Analytics provide us with an opportunity to catalyze institutional effectiveness,
but only when we resist the tendency to believe that
technology can replace the need for human ingenuity.
The Lifecycle of Sustainable Analytics | 15
Conclusion & ImplicationsThere is a growing misunderstanding in the world of higher education about why analytics are fundamentally desirable. This report is a direct challenge to those who would weaponize a tool more suited to sustaining professional flourishing. Analytics, when given the opportunity to shine through a sustainable lifecycle, fulfill the human need to share evidence with others that the choices we have made have paid off—basic human needs that are not going away. As was identified by the Chronicle of Higher Education (2016) in its executive summary entitled “Big Data Has Arrived,” the world of post-secondary education is entering a period of rapid expansion in the realm of data literacy and usage. This swiftly increasing
“capacity to investigate the rising tide of learner data” (MacFadyen et al., 2014) offers institutions of higher education the opportunity to expand and optimize their curriculum and services. Through our analytics experiences, we have learned that a culture of professionalism and of data literacy is what ultimately leads to institutional effectiveness. While software is a critical driver of this success, the software in and of itself is not sufficient. As we come in greater contact with what is possible in the 21st century using systems of intelligence, we are encouraged to have discovered that high-func-tioning professionals with the right resources and supports will continue to be a dynamic and central aspect of what makes institutions work.
A Toolkit of TakeawaysMOVING ANALYTICS-TO-ACTIONHere are a few first-steps that analytics administrators can take to steer analytics initiatives towards the right path of sustaining professionalism:
1. INVEST IN MATURE TECHNOLOGICAL INFRASTRUCTURESocializing analytics in an autonomy-supportive way is useless if the tools are not crafted and honed to actually be effective. Just because tools should not be the center of any analytics initia-tive, doesn’t mean that the quality of the tools is unimportant. Consider identifying tools that are sophisticated and user-friendly, even if they come at significant expense.
2. EARLY ON, IDENTIFY AND WORK WITH A COALITION OF THE WILLING
Play the long game of analytics by resisting the urge to launch new initiatives with an enter-prise-wide parade. Start every analytics initiative with a coalition of willing partners that you trust and who will protect the investment by providing constructive feedback. Develop and maintain strong partnerships with individuals in every institutional corner.
3. TRUST THAT PEOPLE WANT TO DO GREAT WORK AND USE THE BEST TOOLS
When professionals resist innovation, it is often because they believe it is not yet tried and true. Support professional mastery by enhancing professionals’ ability to do work they already enjoy do-ing. Provide compelling examples of successful adoption and associated results. Involve fore-think-ing professionals in the training-creation process and spotlight their successes when possible.
4. USE DATA THERAPY TO ADDRESS COMMON RESISTANCES TO ADOPTION
Spend time with the most resistant adopters. Listen to their concerns and work to create mutual understanding. Provide consistent, stable communication and frequent, emotionally pleasant engagement opportunities. Ask for feedback and respond to suggestions with positivity and haste.
5. PROVIDE ABUNDANT OPPORTUNITIES TO SHOWCASE SUCCESSES
Sociocultural change occurs when a large group of individuals demonstrate consistent, reliable results in adopting a new tool. Without opportunities to share success stories, it is difficult for other professionals to catch the vision of how analytics can help them be successful. Identify and reward those individuals who are leading the pack in adoption of new and effective strategies of practice. 
16 | The Lifecycle of Sustainable Analytics
ReferencesARNOLD, K. E., Lynch, G., Huston, D., Wong, L., Jorn, L.,
& Olsen, C. W. (2014, March). Building institutional capacities and competencies for systemic learning analytics initiatives. In Proceedings of the Fourth International Conference on Learning Analytics And Knowledge (pp. 257-260). ACM.
ASTIN, A.W. (1991). Assessment for Excellence: The Philosophy and Practice of Assessment and Evaluation in Higher Education. Washington, DC: American Council on Education/Oryx Press Series on Higher Education.
CHRONICLE OF HIGHER EDUCATION (2016, May). Big data has arrived: Using technology to measure student performance. Washington, D.C.: Chronicle of Higher Education.
COOPER, A. (2012). What is analytics? Definition and essential characteristics. CETIS Analytics Series, 1(5), 1–10.
DECI, E. L. (1971). Effects of externally mediated re-wards on intrinsic motivation. Journal of personality and Social Psychology, 18(1), 105.
DECI, E. L., & Ryan, R. M. (1985). Intrinsic motivation and self-determination in human behavior. Springer Science & Business Media.
DECI, E. L., & Ryan, R. M. (2008). Facilitating optimal motivation and psychological well-being across life’s domains. Canadian Psychology, 49(1), 14.
DECI, E. L., & Ryan, R. M. (2014). The importance of universal psychological needs for understanding motivation in the workplace. In M. Gagné (Ed.), The Oxford handbook of work engagement, motivation, and self-determination theory (pp. 13-32). Oxford Library of Psychology.
GAGNÉ, M. (Ed.). (2014). The Oxford handbook of work engagement, motivation, and self-determination theory. Oxford Library of Psychology.
GILBERT, S. L. & Kelloway, E. K. (2014). Leadership. In M. Gagné (Ed.), The Oxford handbook of work engage-ment, motivation, and self-determination theory (pp. 181-198). Oxford Library of Psychology.
KELLOGG FOUNDATION (2004). Logic model develop-ment guide. Michigan: WK Kellogg Foundation.
MACFADYEN, L. P., Dawson, S., Pardo, A., & Gasevic, D. (2014). Embracing big data in complex educa-tional systems: The learning analytics imperative and the policy challenge. Research & Practice in Assessment, 9.
MILLIRON, M. (2015, December 1). Turning the DIAL on student success: A look at the Six Core Principles for Transforming Remediation within a comprehensive student success strategy. Civitas Learning Space: Catalytic Conversations. Retrieved from https://www.civitaslearningspace.com/CatalyticConversations/turning-the-dial/
ROGERS, E. M. (2010). Diffusion of innovations. Simon and Schuster.
SIEMENS, G., Dawson, S., & Lynch, G. (2013). Improving the quality and productivity of the higher education sector. Policy and Strategy for Systems-Level Deployment of Learning Analytics. Canberra, Australia: Society for Learning Analytics Research for the Australian Office for Learning and Teaching.
STENIUS, H. (2017). Change Analytics: Exploring the Data-Driven Management of Organizational Change. Master’s Thesis: Aalto University, Helsinki.
VAN den Broeck, A., Vansteenkiste, M., De Witte, H., & Lens, W. (2008). Explaining the relationships between job characteristics, burnout, and engage-ment: The role of basic psychological need satisfac-tion. Work & Stress, 22(3), 277-294.
VITO, M., Baldasare, A., Chaney, M., & Colver, M. (2017, April). How to pull off institution-wide change man-agement with analytics. Presented at the annual Civitas Learning Summit.

The Lifecycle of Sustainable Analytics | 17


![[1]Oracle Product Lifecycle Analytics Installation and ... · [1]Oracle Product Lifecycle Analytics Installation and Setup Guide Release 3.6 E83715-01 May 2017](https://static.fdocuments.us/doc/165x107/5b07192c7f8b9ad1768db4fd/1oracle-product-lifecycle-analytics-installation-and-1oracle-product-lifecycle.jpg)