The Issue: Measuring Actual Labor Market Experience Work experience is an important source of human...
30
The Feasibility and Im portance ofA dding M easuresof A ctualExperience to C ross-SectionalD ata C ollection* Francine D . Blau CornellU niversity, N BER , IZA and CESifo and Law rence M . K ahn CornellU niversity, IZA and CESifo Septem ber2008
-
date post
20-Dec-2015 -
Category
Documents
-
view
215 -
download
1
Transcript of The Issue: Measuring Actual Labor Market Experience Work experience is an important source of human...

The Feasibility and Importance of Adding Measures of
Actual Experience to Cross-Sectional Data Collection*
Francine D. Blau Cornell University, NBER, IZA and CESifo
and
Lawrence M. Kahn Cornell University, IZA and CESifo
September 2008

The Issue: Measuring Actual Labor Market Experience
• Work experience is an important source of human capital
• Controlling for experience is vital in studying women’s wages and the gender pay gap
• Also potentially important for subgroups of men or women—e.g., less educated, minorities
• Most data sets (eg CPS or Census) don’t collect information on actual experience

Design of the Project
• Goal: Examine the feasibility and importance of adding retrospective measures of actual experience to cross sectional data sets
• Use the PSID to:
1. Study importance of controlling for actual experience in analyzing wages of various groups
2. Compare long-term retrospective measures of experience (which can be included in cross-sectional data) to measures using annual updating

Design of Project (ctd)
• Use 2008 Westat Survey to study feasibility of adding experience questions to CPS-like survey:
1. Study consistency of responses
2. Estimate impact of experience on wages and the gender pay gap
3. Study accuracy of proxy responses

Results on Actual Experience and Women’s Earnings
• We use 1980, 1990 and 1999 PSID to compare results of wage analyses using potential experience, actual labor market experience, and actual experience disaggregated into full-time and part-time components
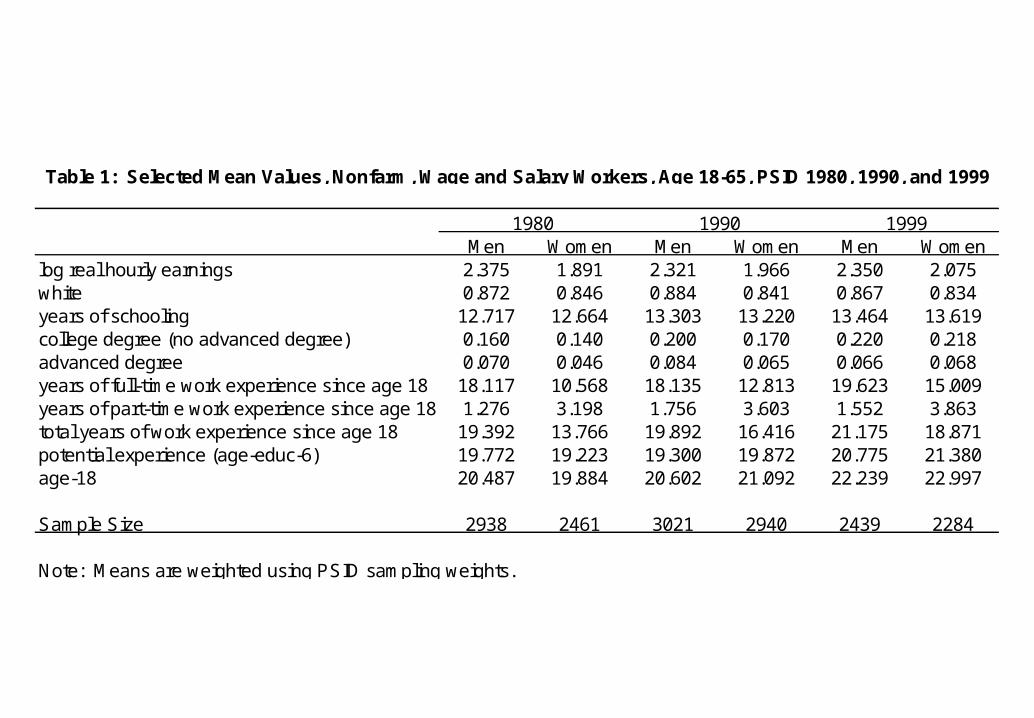
Table 1: Selected Mean Values, Nonfarm, Wage and Salary Workers, Age 18-65, PSID 1980, 1990, and 1999
Men Women Men Women Men Womenlog real hourly earnings 2.375 1.891 2.321 1.966 2.350 2.075white 0.872 0.846 0.884 0.841 0.867 0.834years of schooling 12.717 12.664 13.303 13.220 13.464 13.619college degree (no advanced degree) 0.160 0.140 0.200 0.170 0.220 0.218advanced degree 0.070 0.046 0.084 0.065 0.066 0.068years of full-time work experience since age 18 18.117 10.568 18.135 12.813 19.623 15.009years of part-time work experience since age 18 1.276 3.198 1.756 3.603 1.552 3.863total years of work experience since age 18 19.392 13.766 19.892 16.416 21.175 18.871potential experience (age-educ-6) 19.772 19.223 19.300 19.872 20.775 21.380age-18 20.487 19.884 20.602 21.092 22.239 22.997
Sample Size 2938 2461 3021 2940 2439 2284
Note: Means are weighted using PSID sampling weights.
1980 1990 1999

Table 2: Actual vs. Potential Experience in Wage Regressions
Coef SE Coef SE Coef SE
A. Actual Experience Specification: Womenwhite 0.093 0.026 0.118 0.025 -0.031 0.029years of schooling 0.075 0.006 0.096 0.007 0.086 0.009college degree without advanced degree 0.028 0.037 0.098 0.035 0.118 0.040advanced degree 0.280 0.055 0.252 0.050 0.237 0.058years of actual experience 0.032 0.003 0.047 0.003 0.042 0.004actual experience squared -0.0006 0.0001 -0.0008 0.0001 -0.0006 0.0001constant 0.564 0.081 0.064 0.093 0.376 0.115
B. Potential Experience Specification: Womenwhite 0.082 0.026 0.099 0.025 -0.025 0.030years of schooling 0.080 0.007 0.111 0.008 0.100 0.009college degree without advanced degree 0.055 0.038 0.102 0.037 0.105 0.041advanced degree 0.303 0.056 0.272 0.052 0.225 0.059years of potential experience 0.018 0.003 0.021 0.003 0.031 0.004potential experience squared -0.0003 0.0001 -0.0003 0.0001 -0.0005 0.0001constant 0.589 0.088 0.105 0.102 0.311 0.122
C. Actual Experience Specification: Menwhite 0.109 0.026 0.155 0.028 0.181 0.032years of schooling 0.053 0.005 0.076 0.006 0.067 0.008college degree without advanced degree 0.038 0.030 0.092 0.032 0.152 0.038advanced degree 0.059 0.042 0.141 0.044 0.303 0.056years of actual experience 0.049 0.003 0.053 0.003 0.051 0.004actual experience squared -0.0008 0.0001 -0.0008 0.0001 -0.0008 0.0001constant 1.045 0.064 0.477 0.083 0.628 0.102
D. Potential Experience Specification: Menwhite 0.112 0.026 0.159 0.028 0.190 0.032years of schooling 0.058 0.005 0.086 0.007 0.078 0.008college degree without advanced degree 0.087 0.031 0.133 0.033 0.163 0.038advanced degree 0.090 0.042 0.141 0.045 0.279 0.057years of potential experience 0.044 0.003 0.049 0.003 0.045 0.004potential experience squared -0.0007 0.0001 -0.0007 0.0001 -0.0007 0.0001constant 1.014 0.065 0.392 0.087 0.541 0.104
1980 1990 1999


Table 4: Average Female Residual from Male Wage Regression (from PSID)
Specification 1980 1990 1999
Potential Experience -0.466 -0.344 -0.288Actual Experience -0.389 -0.274 -0.260Actual Full-time and Part-time Experience -0.341 -0.223 -0.232

Work History Data: Annual Updating vs. Long Term Recall
• In 1976 and 1985, the PSID asked all respondents the experience questions
• We use women who were in the Panel each year from 1976 to 1985
• We compare experience based on the 1985 questions vs. the 1976 questions with annual updating through 1985

Table 5: Alternative Measures of Work Experience, 1976 and 1985 PSID, Women Employed as Wage and Salary Workers in 1985 Who Were in the Panel from 1976-1985 (PSID)
Mean SourceActual Labor Market Experience as 1976 9.90 Direct Question in 1976 SurveyActual Full-time Labor Market Experience as of 1976 7.83 Direct Question in 1976 SurveyActual Labor Market Experience as of 1985 18.41 Direct Question in 1985 SurveyActual Full-time Labor Market Experience as of 1985 14.78
Direct Question in 1985 Survey
Constructed Labor Market Experience as of 1985 17.97 Actual 1976 Experience plus annual increments 1976-85Constructed Full-time Labor Market Experience as of 1985 12.95 Actual 1976 Fulltime Experience plus annual increments 1976-85
Absolute Value of Difference: Actual vs. Constructed 1985 Experience 2.81Absolute Value of Difference: Actual vs. Constructed 1985 Full-time Experience 3.63
Note: Sample size is 1643.
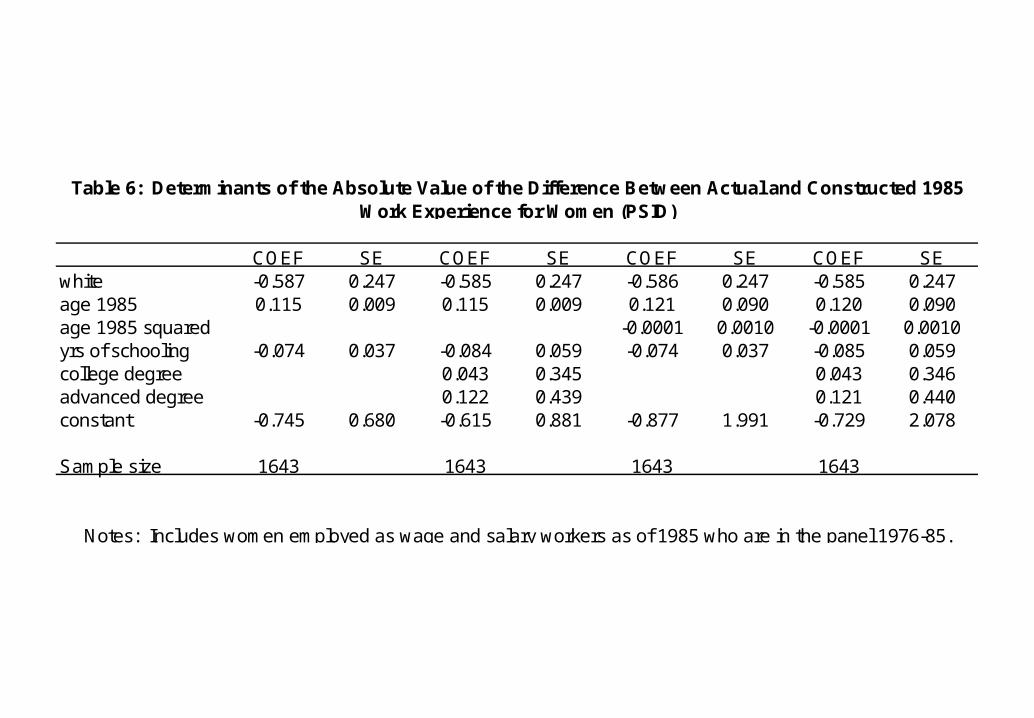
Table 6: Determinants of the Absolute Value of the Difference Between Actual and Constructed 1985 Work Experience for Women (PSID)
COEF SE COEF SE COEF SE COEF SEwhite -0.587 0.247 -0.585 0.247 -0.586 0.247 -0.585 0.247age 1985 0.115 0.009 0.115 0.009 0.121 0.090 0.120 0.090age 1985 squared -0.0001 0.0010 -0.0001 0.0010yrs of schooling -0.074 0.037 -0.084 0.059 -0.074 0.037 -0.085 0.059college degree 0.043 0.345 0.043 0.346advanced degree 0.122 0.439 0.121 0.440constant -0.745 0.680 -0.615 0.881 -0.877 1.991 -0.729 2.078
Sample size 1643 1643 1643 1643
Notes: Includes women employed as wage and salary workers as of 1985 who are in the panel 1976-85.

Table 7: Wage Effects of Alternative Experience Measures for Women (PSID)
A. Ordinary Least SquaresB. Instrumental
VariablesCOEF SE COEF SE COEF SE COEF ASE
white 0.076 0.036 0.098 0.035 0.094 0.035 0.107 0.035yrs of schooling 0.081 0.009 0.075 0.008 0.078 0.008 0.077 0.008college degree 0.067 0.051 0.070 0.049 0.052 0.048 0.061 0.049advanced degree 0.370 0.064 0.342 0.062 0.322 0.061 0.320 0.062potential experience 0.002 0.007potential experience squared 0.00002 0.00011985 survey experience 0.044 0.005 0.054 0.0071985 survey experience squared -0.0008 0.0001 -0.0009 0.00021985 constructed experience 0.049 0.0061985 constructed experience squared -0.0008 0.0001constant 0.715 0.136 0.355 0.111 0.245 0.113 0.188 0.117Sample size 1643 1643 1643 1643
Notes: Constructed Experience is computed by adding annual 1976-85 increments to the 1976 value. Inthe instrumental variables model, 1985 constructed experience and its square are used as instruments forthe 1985 survey experience and 1985 survey experience squared variables. Includes women employed aswage and salary workers as of 1985 who are in the panel 1976-85.

Table 8: Further Results--Wage Effects of Alternative Experience Measures for Women (PSID)
A. Ordinary Least SquaresB. Instrumental
VariablesCOEF SE COEF SE COEF ASE
white 0.118 0.035 0.113 0.034 0.147 0.038yrs of schooling 0.074 0.008 0.073 0.008 0.084 0.010college degree 0.105 0.049 0.125 0.048 0.123 0.054advanced degree 0.353 0.062 0.389 0.061 0.354 0.0671985 survey full-time experience 0.033 0.004 0.038 0.0071985 survey full-time experience squared -0.0006 0.0001 -0.0007 0.00021985 survey part-time experience -0.005 0.005 -0.072 0.0221985 survey part-time experience squared 0.0004 0.0002 0.0034 0.00101985 constructed full-time experience 0.037 0.0041985 constructed full-time experience squared -0.0007 0.00011985 constructed part-time experience -0.018 0.0061985 constructed part-time experience squared 0.0010 0.0003constant 0.503 0.108 0.563 0.109 0.416 0.121Sample size 1643 1643 1643
Notes: Constructed Experience is computed by adding annual 1976-85 increments to the 1976 value. In theinstrumental variables model, 1985 full-time and part-time constructed experience and their squares are usedas instruments for the corresponding 1985 survey experience variables. Includes women employed as wageand salary workers as of 1985 who are in the panel 1976-85.

Conclusions from the Analysis of PSID Data on Women
• 1. Measuring actual fulltime and part-time experience vs. potential experience is very important for analyzing women’s pay and the gender pay gap
• 2. Annual recall is better than long term retrospective questions, although the gain is small
• 3. Results so far suggest the CPS should collect retrospective data on actual and fulltime work experience in its March Annual Supplement

Westat Survey: General Features
• Random digit telephone survey conducted June 5-July 20, 2008
• Some key questions modeled after CPS
• Some questions were pre-tested and refined
• Proxy responses were collected from a subset of respondents

Table 9: Descriptive Statistics, Full Westat Sample, August 2008
A. Men (n=1015) B. Women (n=1213)Mean Std. Dev Min Max Mean Std. Dev Min Max
age 41.178 11.751 18 65 41.739 11.674 20 65educ (years) 13.840 3.044 0 20 14.081 2.623 0 20potential experience 21.343 11.808 0 56 21.658 11.854 0 56black 0.074 0.262 0 1 0.104 0.305 0 1hispanic 0.170 0.376 0 1 0.125 0.331 0 1asian 0.028 0.165 0 1 0.038 0.192 0 1otherrace 0.042 0.201 0 1 0.037 0.190 0 1actual experience, after resurvey 22.171 11.802 1 50 20.813 11.197 1 50actual experience, before resurvey 22.320 11.883 1 50 20.900 11.251 1 50actual experience, after resurvey, constrained to start at age 18 21.919 11.747 0 47 20.477 11.042 1 47actual fulltime experience, after resurvey 20.087 11.972 0 48 17.206 11.236 0 50actual parttime experience, after resurvey 2.083 3.457 0 36 3.606 4.838 0 48actual fulltime experience, before resurvey 20.157 12.014 0 48 17.254 11.267 0 50actual parttime experience, before resurvey 2.164 3.648 0 36 3.646 4.905 0 48actual fulltime experience, after resurvey, constrained to start at age 18 19.919 11.945 0 47 17.005 11.122 0 47actual parttime experience, after resurvey, constrained to start at age 18 2.001 3.371 0 36 3.472 4.751 0 43

Table 10: Descriptive Statistics, Married Westat Sample, August 2008
A. Men (n=687) B. Women (n=679)Mean Std. Dev Min Max Mean Std. Dev Min Max
age 44.011 10.090 23 65 43.557 10.198 20 65educ (years) 14.161 3.318 0 20 14.452 2.601 0 20potential experience 23.856 10.621 0 56 23.105 10.702 0 51black 0.054 0.226 0 1 0.070 0.256 0 1hispanic 0.156 0.363 0 1 0.094 0.292 0 1asian 0.031 0.173 0 1 0.045 0.207 0 1otherrace 0.036 0.186 0 1 0.019 0.136 0 1actual experience, after resurvey 25.083 10.300 1 50 22.181 10.091 2 50actual experience, before resurvey 25.220 10.381 1 50 22.204 10.089 2 50actual experience, after resurvey, constrained to start at age 18 24.874 10.175 1 47 21.912 9.966 2 47actual fulltime experience, after resurvey 22.945 10.547 0 48 17.982 10.461 0 47actual parttime experience, after resurvey 2.139 3.438 0 36 4.198 5.241 0 48actual fulltime experience, before resurvey 22.991 10.635 0 48 17.994 10.457 0 47actual parttime experience, before resurvey 2.229 3.634 0 36 4.210 5.248 0 48actual fulltime experience, after resurvey, constrained to start at age 18 22.826 10.478 0 47 17.845 10.403 0 46actual parttime experience, after resurvey, constrained to start at age 18 2.048 3.330 0 36 4.067 5.134 0 43

Table 11: Descriptive Statistics, Westat Wage Earners Sample, August 2008
A. Men (n=704) B. Women (n=807)Mean Std. Dev Min Max Mean Std. Dev Min Max
log hourly wage 3.132 0.630 1.099 7.447 2.843 0.625 0.405 6.548age 40.898 11.710 20 65 41.297 11.694 20 65educ (years) 13.785 2.885 0 20 14.083 2.655 0 20potential experience 21.113 11.623 0 56 21.214 11.863 0 56black 0.074 0.261 0 1 0.107 0.310 0 1hispanic 0.174 0.379 0 1 0.136 0.343 0 1asian 0.031 0.174 0 1 0.028 0.164 0 1otherrace 0.045 0.208 0 1 0.046 0.209 0 1actual experience, after resurvey 21.922 11.724 1 50 20.485 11.242 1 49actual experience, before resurvey 22.084 11.789 1 50 20.600 11.312 1 49actual experience, after resurvey, constrained to start at age 18 21.715 11.670 1 47 20.278 11.112 1 47actual fulltime experience, after resurvey 19.902 11.947 0 48 17.072 11.301 0 47actual parttime experience, after resurvey 2.020 3.422 0 33 3.413 4.659 0 31actual fulltime experience, before resurvey (n=703) 19.985 11.963 0 48 17.128 11.334 0 47actual parttime experience, before resurvey (n=703) 2.104 3.658 0 33 3.472 4.754 0 44actual fulltime experience, after resurvey, constrained to start at age 18 19.759 11.925 0 47 16.958 11.214 0 47actual parttime experience, after resurvey, constrained to start at age 18 1.956 3.327 0 33 3.320 4.600 0 31

Table 12: Descriptive Statistics, Married Westat Wage Earners Sample, August 2008
A. Men (n=487) B. Women (n=454)Mean Std. Dev Min Max Mean Std. Dev Min Max
log hourly wage 3.302 0.576 1.609 7.447 2.928 0.624 0.916 6.548age 43.766 9.995 23 65 43.244 10.125 22 65educ (years) 14.116 3.051 0 20 14.486 2.692 0 20potential experience 23.650 10.324 1 56 22.758 10.669 3 51black 0.063 0.244 0 1 0.070 0.255 0 1hispanic 0.150 0.357 0 1 0.090 0.287 0 1asian 0.032 0.177 0 1 0.039 0.194 0 1otherrace 0.046 0.209 0 1 0.021 0.142 0 1actual experience, after resurvey 24.809 10.129 4 50 21.976 10.032 2 49actual experience, before resurvey 24.964 10.208 4 50 22.006 10.028 2 49actual experience, after resurvey, constrained to start at age 18 24.656 10.002 4 47 21.813 9.902 2 45actual fulltime experience, after resurvey 22.809 10.400 1 48 18.022 10.504 0 47actual parttime experience, after resurvey 1.999 3.267 0 24 3.954 4.976 0 31actual fulltime experience, before resurvey 22.847 10.491 1 48 18.024 10.486 0 47actual parttime experience, before resurvey 2.117 3.544 0 24 3.982 4.984 0 31actual fulltime experience, after resurvey, constrained to start at age 18 22.732 10.326 1 47 17.953 10.446 0 45actual parttime experience, after resurvey, constrained to start at age 18 1.925 3.137 0 24 3.860 4.900 0 31

Table 13: Average Female Residual from Male Wage Equation, Various Specifications (Westat Survey)
Average Female ResidualSpecification All Workers Married Workers OnlyRaw Gender Pay Gap -0.289 -0.373Potential Experience -0.319 -0.410Aggregate Actual Experience, After Resurvey -0.303 -0.396Aggregate Actual Experience, Before Resurvey -0.304 -0.397
Aggregate Actual Experience, After Resurvey, constrained to start at age 18 -0.304 -0.396Full- and Part-Time Actual Experience, After Resurvey -0.289 -0.390Full- and Part-Time Actual Experience, Before Resurvey -0.287 -0.385
Full- and Part-Time Actual Experience, After Resurvey, constrained to start at age 18 -0.289 -0.387
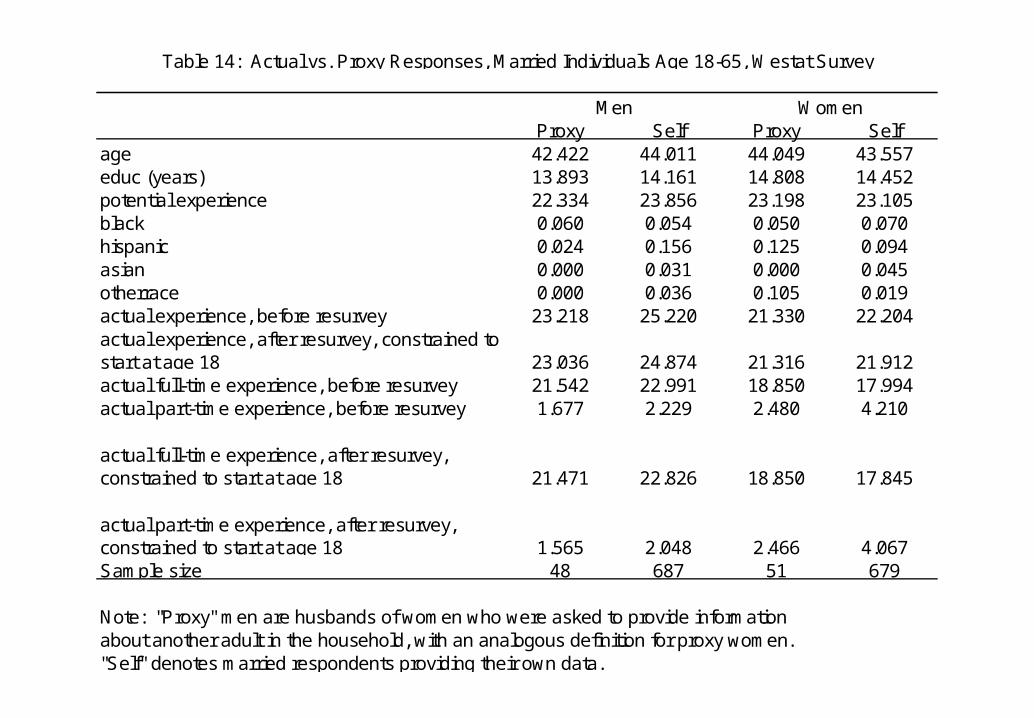
Men WomenProxy Self Proxy Self
age 42.422 44.011 44.049 43.557educ (years) 13.893 14.161 14.808 14.452potential experience 22.334 23.856 23.198 23.105black 0.060 0.054 0.050 0.070hispanic 0.024 0.156 0.125 0.094asian 0.000 0.031 0.000 0.045otherrace 0.000 0.036 0.105 0.019actual experience, before resurvey 23.218 25.220 21.330 22.204actual experience, after resurvey, constrained to start at age 18 23.036 24.874 21.316 21.912actual full-time experience, before resurvey 21.542 22.991 18.850 17.994actual part-time experience, before resurvey 1.677 2.229 2.480 4.210
actual full-time experience, after resurvey, constrained to start at age 18 21.471 22.826 18.850 17.845
actual part-time experience, after resurvey, constrained to start at age 18 1.565 2.048 2.466 4.067Sample size 48 687 51 679
Note: "Proxy" men are husbands of women who were asked to provide informationabout another adult in the household, with an analogous definition for proxy women."Self" denotes married respondents providing their own data.
Table 14: Actual vs. Proxy Responses, Married Individuals Age 18-65, Westat Survey
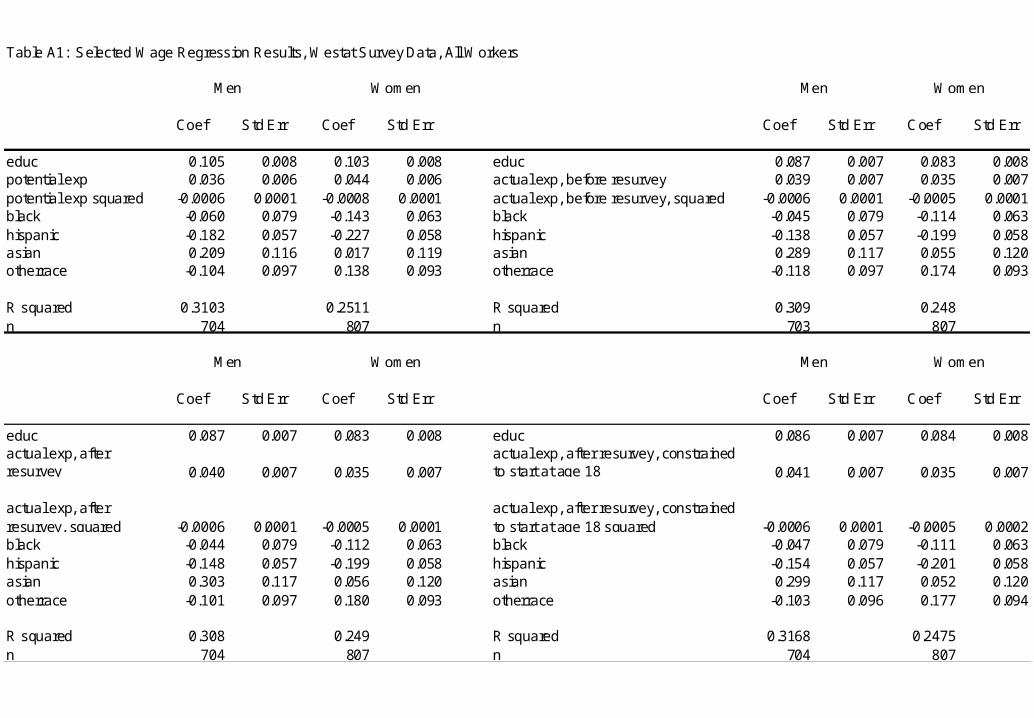
Table A1: Selected Wage Regression Results, Westat Survey Data, All Workers
Men Women Men Women
Coef Std Err Coef Std Err Coef Std Err Coef Std Err
educ 0.105 0.008 0.103 0.008 educ 0.087 0.007 0.083 0.008potential exp 0.036 0.006 0.044 0.006 actual exp, before resurvey 0.039 0.007 0.035 0.007potential exp squared -0.0006 0.0001 -0.0008 0.0001 actual exp, before resurvey, squared -0.0006 0.0001 -0.0005 0.0001black -0.060 0.079 -0.143 0.063 black -0.045 0.079 -0.114 0.063hispanic -0.182 0.057 -0.227 0.058 hispanic -0.138 0.057 -0.199 0.058asian 0.209 0.116 0.017 0.119 asian 0.289 0.117 0.055 0.120otherrace -0.104 0.097 0.138 0.093 otherrace -0.118 0.097 0.174 0.093
R squared 0.3103 0.2511 R squared 0.309 0.248n 704 807 n 703 807
Men Women Men Women
Coef Std Err Coef Std Err Coef Std Err Coef Std Err
educ 0.087 0.007 0.083 0.008 educ 0.086 0.007 0.084 0.008actual exp, after resurvey 0.040 0.007 0.035 0.007
actual exp, after resurvey, constrained to start at age 18 0.041 0.007 0.035 0.007
actual exp, after resurvey, squared -0.0006 0.0001 -0.0005 0.0001
actual exp, after resurvey, constrained to start at age 18 squared -0.0006 0.0001 -0.0005 0.0002
black -0.044 0.079 -0.112 0.063 black -0.047 0.079 -0.111 0.063hispanic -0.148 0.057 -0.199 0.058 hispanic -0.154 0.057 -0.201 0.058asian 0.303 0.117 0.056 0.120 asian 0.299 0.117 0.052 0.120otherrace -0.101 0.097 0.180 0.093 otherrace -0.103 0.096 0.177 0.094
R squared 0.308 0.249 R squared 0.3168 0.2475n 704 807 n 704 807

Selected Instrumental Variables Wage Regression Results, Westat Survey Data, All Workers
Men Women
Coef Std Err Coef Std Err
educ 0.087 0.007 0.080 0.008actual exp, after resurvey, constrained to start at age 18 0.043 0.008 0.066 0.010actual exp, after resurvey, constrained to start at age 18 squared -0.0007 0.0002 -0.0013 0.0002black -0.047 0.079 -0.126 0.064hispanic -0.154 0.057 -0.194 0.059asian 0.299 0.117 0.056 0.122otherrace -0.104 0.097 0.200 0.096
n 704 807
Potential experience and its square are instruments for actual experience and its square.


Table A1 : Selected Wage Regression Results, Westat Survey Data, All Workers (ctd)
A. Actual Experience, Before Resurvey Men Women
B. Actual Experience, After Resurvey Men Women
Coef Std Err Coef Std Err Coef Std Err Coef Std Err
educ 0.087 0.008 0.087 0.008 educ 0.088 0.008 0.086 0.008actual parttime exp 0.006 0.012 -0.004 0.009 actual parttime exp 0.001 0.012 -0.001 0.010actual parttime exp squared -0.0001 0.0006 0.0000 0.0004 actual parttime exp squared 0.0003 0.0007 -0.0001 0.0005actual fulltime exp 0.042 0.006 0.029 0.006 actual fulltime exp 0.041 0.006 0.030 0.006actual fulltime exp squared -0.0007 0.0001 -0.0004 0.0001 actual fulltime exp squared -0.0007 0.0001 -0.0004 0.0001black -0.050 0.078 -0.138 0.063 black -0.053 0.078 -0.135 0.063hispanic -0.129 0.057 -0.225 0.058 hispanic -0.141 0.057 -0.225 0.058asian 0.310 0.118 0.061 0.119 asian 0.287 0.117 0.062 0.119otherrace -0.085 0.096 0.138 0.093 otherrace -0.057 0.096 0.145 0.093
R squared 0.321 0.260 R squared 0.324 0.260n 703 807 n 704 807
C. Actual Experience, After Resurvey, Constrained to Start at Age 18 Men Women
Coef Std Err Coef Std Err
educ 0.087 0.008 0.086 0.008actual parttime exp 0.0021 0.0117 -0.0001 0.0098actual parttime exp squared 0.0002 0.0007 -0.0002 0.0005actual fulltime exp 0.041 0.006 0.030 0.006actual fulltime exp squared -0.0007 0.0001 -0.0004 0.0001black -0.056 0.078 -0.132 0.063hispanic -0.145 0.057 -0.225 0.058asian 0.285 0.117 0.061 0.120otherrace -0.058 0.096 0.146 0.093
R squared 0.325 0.248n 704 807

Westat Survey: Conclusions
• Experience measures seem reasonably consistent with PSID
• Proxy responses are similar to actual responses
• Actual experience, especially disaggregated into full-time and part-time components, explains about 10% of the gender pay gap in 2008