The Influence of Software Process Maturity and Customer ...
25
MANAGEMENT SCIENCE Vol. 59, No. 12, December 2013, pp. 2702–2726 ISSN 0025-1909 (print) ISSN 1526-5501 (online) http://dx.doi.org/10.1287/mnsc.2013.1728 © 2013 INFORMS The Influence of Software Process Maturity and Customer Error Reporting on Software Release and Pricing Terrence August Rady School of Management, University of California, San Diego, La Jolla, California 92093, [email protected] Marius Florin Niculescu Scheller College of Business, Georgia Institute of Technology, Atlanta, Georgia 30308, [email protected] S oftware producers are making greater use of customer error reporting to discover defects and improve the quality of their products. We study how software development differences among producers (e.g., vary- ing levels of process maturity) and software class and functionality differences (e.g., operating system versus productivity software) affect how these producers coordinate software release timing and pricing to optimally harness error reporting contributions from users. In settings where prices are fixed, we characterize the optimal release time and demonstrate why in some cases it can actually be preferable to delay release when customer error reporting rates increase. The manner in which a firm’s optimal release time responds to increases in soft- ware functionality critically hinges on whether the added functionality enhances or dilutes user error reporting; in both cases, the effect of added functionality on release timing can go in either direction, depending on both firm and product market characteristics. For example, when processing costs are relatively large compared with goodwill costs, firms with lower process maturity will release earlier when per-module error reporting contri- butions become diluted and release later when these contributions become enhanced. We also examine how a firm adapts price with changes in error reporting levels and software functionality, and finally, we provide implications of how beta testing influences release timing. Key words : software quality; software reliability; software security; software economics; software process maturity; network effects; software error reporting; diffusion of innovation History : Received August 15, 2010; accepted January 26, 2013, by Lorin Hitt, information systems. Published online in Articles in Advance June 14, 2013. 1. Introduction Over the last decade, the world has achieved phe- nomenal growth in broadband Internet penetration. The United States rose from 4.4% penetration in 2001 to 27.7% in 2011—a sixfold increase (Organi- sation for Economic Co-operation and Development (OECD) 2012). The OECD also reports that, averaging across the G7 countries, the penetration was approxi- mately 18 times higher by the end of the decade. 1 This extensive growth in high-speed access internationally has presented both newfound opportunities and chal- lenges. With currently over 900 million interconnected Internet hosts, over 2.2 billion Internet users, and 1 Globally, countries are continuing to make substantial investments to further promote this growth and foster economic development. As part of the American Reinvestment and Recovery Act in 2009, the U.S. appropriated $7.2 billion toward expanding broadband access in underserved areas, and the United Kingdom has also made a commitment to delivering broadband into every household by 2012 (Tryhorn 2009, Ransom 2010). Countries leading the way, such as South Korea, already have much higher penetration and can also offer significantly faster broadband speeds (Sutter 2010). a projected 15 billion devices connected to Internet protocol networks by 2015, the ease with which businesses, individuals, and society at large can com- municate and exchange information is unprecedented (Cisco 2011, Internet Systems Consortium 2012, Inter- net World Stats 2012). Notwithstanding these ben- efits, the interconnectedness of computers and the speed at which information disseminates across the Internet are actively exploited by malicious individ- uals and software designed to cause substantial eco- nomic damages. According to RTI (2002), the annual cost of faulty software to the U.S. economy alone was $59.5 billion roughly a decade ago and has since grown to an estimated $75 billion (Michaels 2008). Hence, an ongoing challenge faced by both private entities and the public sector is how to continue to obtain increased value from this global interconnected network while mitigating effects associated with soft- ware quality. Recently, software firms have begun to leverage con- sumers’ connectedness to the Internet to enable their users to contribute toward increasing the reliability 2702 INFORMS holds copyright to this article and distributed this copy as a courtesy to the author(s). Additional information, including rights and permission policies, is available at http://journals.informs.org/.
Transcript of The Influence of Software Process Maturity and Customer ...
MANAGEMENT SCIENCEVol. 59, No. 12, December 2013, pp. 2702–2726ISSN 0025-1909 (print) � ISSN 1526-5501 (online) http://dx.doi.org/10.1287/mnsc.2013.1728
© 2013 INFORMS
The Influence of Software Process Maturity andCustomer Error Reporting on Software
Release and PricingTerrence August
Rady School of Management, University of California, San Diego, La Jolla, California 92093, [email protected]
Marius Florin NiculescuScheller College of Business, Georgia Institute of Technology, Atlanta, Georgia 30308,
Software producers are making greater use of customer error reporting to discover defects and improve thequality of their products. We study how software development differences among producers (e.g., vary-
ing levels of process maturity) and software class and functionality differences (e.g., operating system versusproductivity software) affect how these producers coordinate software release timing and pricing to optimallyharness error reporting contributions from users. In settings where prices are fixed, we characterize the optimalrelease time and demonstrate why in some cases it can actually be preferable to delay release when customererror reporting rates increase. The manner in which a firm’s optimal release time responds to increases in soft-ware functionality critically hinges on whether the added functionality enhances or dilutes user error reporting;in both cases, the effect of added functionality on release timing can go in either direction, depending on bothfirm and product market characteristics. For example, when processing costs are relatively large compared withgoodwill costs, firms with lower process maturity will release earlier when per-module error reporting contri-butions become diluted and release later when these contributions become enhanced. We also examine howa firm adapts price with changes in error reporting levels and software functionality, and finally, we provideimplications of how beta testing influences release timing.
Key words : software quality; software reliability; software security; software economics; software processmaturity; network effects; software error reporting; diffusion of innovation
History : Received August 15, 2010; accepted January 26, 2013, by Lorin Hitt, information systems. Publishedonline in Articles in Advance June 14, 2013.
1. IntroductionOver the last decade, the world has achieved phe-nomenal growth in broadband Internet penetration.The United States rose from 4.4% penetration in2001 to 27.7% in 2011—a sixfold increase (Organi-sation for Economic Co-operation and Development(OECD) 2012). The OECD also reports that, averagingacross the G7 countries, the penetration was approxi-mately 18 times higher by the end of the decade.1 Thisextensive growth in high-speed access internationallyhas presented both newfound opportunities and chal-lenges. With currently over 900 million interconnectedInternet hosts, over 2.2 billion Internet users, and
1 Globally, countries are continuing to make substantial investmentsto further promote this growth and foster economic development.As part of the American Reinvestment and Recovery Act in 2009,the U.S. appropriated $7.2 billion toward expanding broadbandaccess in underserved areas, and the United Kingdom has alsomade a commitment to delivering broadband into every householdby 2012 (Tryhorn 2009, Ransom 2010). Countries leading the way,such as South Korea, already have much higher penetration andcan also offer significantly faster broadband speeds (Sutter 2010).
a projected 15 billion devices connected to Internetprotocol networks by 2015, the ease with whichbusinesses, individuals, and society at large can com-municate and exchange information is unprecedented(Cisco 2011, Internet Systems Consortium 2012, Inter-net World Stats 2012). Notwithstanding these ben-efits, the interconnectedness of computers and thespeed at which information disseminates across theInternet are actively exploited by malicious individ-uals and software designed to cause substantial eco-nomic damages. According to RTI (2002), the annualcost of faulty software to the U.S. economy alonewas $59.5 billion roughly a decade ago and has sincegrown to an estimated $75 billion (Michaels 2008).Hence, an ongoing challenge faced by both privateentities and the public sector is how to continue toobtain increased value from this global interconnectednetwork while mitigating effects associated with soft-ware quality.
Recently, software firms have begun to leverage con-sumers’ connectedness to the Internet to enable theirusers to contribute toward increasing the reliability
2702
INFORMS
holds
copyrightto
this
article
and
distrib
uted
this
copy
asa
courtesy
tothe
author(s).
Add
ition
alinform
ation,
includ
ingrig
htsan
dpe
rmission
policies,
isav
ailableat
http://journa
ls.in
form
s.org/.

August and Niculescu: The Influence of Software Process Maturity and Customer Error ReportingManagement Science 59(12), pp. 2702–2726, © 2013 INFORMS 2703
and security of their software products. Applicationsnow routinely have built-in support for automaticerror reporting through which application failureinformation is transmitted from users’ systems tosoftware firms. Microsoft’s Windows Error Report-ing, AutoCAD’s Customer Error Reporting, Mozilla’sCrash Reporter, and other similar implementationsall aim to harness the diverse user population’sidiosyncratic environments and behavior to helpwith software assurance (Markoff 2006). Throughthese tools, software firms collect substantial inputfrom the user community regarding product fail-ures in the field of operation. For example, Mozillagets 2.5 million crash reports per day (Thompson2010). In many instances, software testers cannotreproduce customer-discovered errors using identicalinput because factors involving “invisible users” orthe interactions between the software and the cus-tomer’s environment (operating system, file system,and libraries) are the actual root cause (Whittaker2001). Hence, error reports generated by users’ sys-tems, which often include a snapshot of importantenvironment information, have a significant poten-tial to reduce the costs of correcting bugs; these costscan account for up to 50%–75% of software devel-opment costs (Muthitacharoen and Saeed 2009). In amemo to customers in October 2002, Steve Ballmer,CEO of Microsoft, notes that “in Windows XP ServicePack 1, error reporting enabled [Microsoft] to address29 percent of errors involving the operating systemand applications running on it, including a large num-ber of third-party applications. Error reporting helped[Microsoft] to eliminate more than half of all Office XPerrors with Office XP Service Pack 2” (Ballmer 2002).
With modern software assurance strategies thatleverage users’ systems and their interconnectedness,a software firm must carefully select product releasedates that account for several important trade-offs.On one hand, by releasing earlier, the firm’s prod-uct is available for a longer time in the market beforeit becomes outmoded, the firm reduces its cost ofdetecting and fixing software bugs as a result oferror reporting, and the firm may even enjoy com-petitive benefits associated with being first to market(Cohen et al. 1996). On the other hand, earlier-releasedsoftware bears a lower initial quality, which hasseveral effects: users incur costs associated with secu-rity attacks and poor application performance in theinterim; users, in turn, impose goodwill costs onthe firm; and the speed at which consumers adoptthe software, i.e., the rate of diffusion, is reduced(Keizer 2007).
These aforementioned trade-offs will be stronglyinfluenced by the distinct characteristics of the firm,its product, and the corresponding market. One par-ticularly relevant characteristic of a software firm is
Table 1 The Relationship Between the Average Number of Defectsper Thousand Lines of Code (KLOC) and an Organization’sLevel Achievement in the Capability Maturity Model
CMM CMM CMM CMM CMMLevel 1 Level 2 Level 3 Level 4 Level 5
Defects/KLOC 7.5 6.24 4.73 2.28 1.05
Source. Davis and Mullaney (2003).
its software process maturity, which is “the extent towhich a specific process is explicitly defined, man-aged, measured, controlled, and effective” (Paulket al. 1993, p. 4). The federally funded SoftwareEngineering Institute (SEI) established a set of Capa-bility Maturity Models (CMMs) to help organiza-tions improve processes with an emphasis on thoserelated to software development. Some of these basicmodels were superceded by SEI’s Capability Matu-rity Model Integration (CMMI), but the essence ismuch the same. CMMI defines five levels of matu-rity in software-producing organizations that rangefrom Level 1, which is characterized by ad hoc pro-cesses that can complete goals, to Level 5, where pro-cesses are already rigorously defined and managed ina quantitative way and the focus now lies on opti-mizing them (Software Engineering Institute 2006).One useful aspect of the CMMI is that firms at thesame level tend to be similar on other dimensions aswell. For example, Table 1 illustrates the relationshipbetween a firm’s software process maturity and thequality of its software, measured in terms of defectsper thousand lines of code. This positive relation-ship between process maturity and quality as well asother software development characteristics has alsobeen established in the academic literature (see, e.g.,Harter et al. 2000, Harter and Slaughter 2003). Hence,by understanding how bug density interacts withthe above-mentioned trade-offs that affect softwarerelease, we can provide broad implications on howfirms at a given level of process maturity should man-age software adoption and even identify the valuethat underlies achieving a higher level of maturity.
A second important factor that affects how asoftware firm manages adoption through its releasetiming and price is the amount of software function-ality built into a product. One observation is that,over time, an increasing amount of functionality isbeing included with each new version of a givensoftware product. For example, Microsoft Windowsversions NT 4.0, 2000 Professional, XP Professional,and Vista have 16, 29, 40, and 50 million lines ofcode, respectively (Henry 2007, Manes 2007). Addi-tionally, different classes of software can be correlatedwith different amounts of functionality. For example,another mainstream operating system software, RedHat Linux 7.1, which was released around the same
INFORMS
holds
copyrightto
this
article
and
distrib
uted
this
copy
asa
courtesy
tothe
author(s).
Add
ition
alinform
ation,
includ
ingrig
htsan
dpe
rmission
policies,
isav
ailableat
http://journa
ls.in
form
s.org/.

August and Niculescu: The Influence of Software Process Maturity and Customer Error Reporting2704 Management Science 59(12), pp. 2702–2726, © 2013 INFORMS
time as Windows XP, had a comparable 30+ millionlines of code (Wheeler 2001). Popular open sourcedatabase software products PostgreSQL and MySQLare estimated to have approximately 900,000 lines ofcode each (Babcock 2008, MST 2010).2
In this paper, using an analytical model, we for-mally examine how a software firm adjusts its releasetiming and pricing in a setting where it can harnesscustomer error reporting. In this context, we specifi-cally study the influence of the firm’s pricing power,its software process maturity, and the characteristicsof its product class, as well as its relative qualitywithin that class on its timing and pricing decisions.
2. Literature ReviewThis study is directly related to the literature on opti-mal software release timing. A vast portion of the lit-erature studies the firm’s strategy from a maintenancecost minimization perspective, independent of soft-ware demand. Examples include Okumoto and Goel(1980), Koch and Kubat (1983), Yamada and Osaki(1987), Kimura et al. (1999), Pham and Zhang (1999),and Zheng (2002). Several studies (see, e.g., McDaidand Wilson 2001, Ji et al. 2005, Jiang et al. 2012) extendthis framework and incorporate opportunity costs oflost sales due to late release through a price-invariantcost component that increases in the time to mar-ket. More recently, Arora et al. (2006) implement atotal sales function that depends on release time andpatching levels. One common characteristic of extantmodels in the literature is that the expected evolu-tion of software adoption over time does not impactthe firm’s software release decision, and we relax thisassumption in our work. Whereas some more gen-eral studies on innovation release (e.g., Kalish andLilien 1986) do account for the shape of the adop-tion curve, we further advance our understandingof this topic by focusing on the software industryand its idiosyncrasies, including quality improvementdissemination via patching, negligible reproductioncosts, and, importantly, customer error reporting.
Aiming to clarify and study the trade-off betweeninternal testing and debugging costs on one hand,and revenues, goodwill penalties, and consumer errorreporting benefits on the other, we complement theexisting literature on optimal software release model-ing by employing a continuous-time parameterizationof software demand and incorporating quality andnetwork effects on adoption. The shape of the adop-tion curve impacts a firm’s profit in multiple ways.First, it directly affects revenues. Second, it impactsconsumers’ aggregate contribution to bug detection.
2 The two studies use different metrics; for MySQL, a measure ofthe effective lines of source code was utilized.
Many past studies on software release examine asetting where the firm ceases to test the softwarefor flaws after bringing it to market and implicitlyincorporate consumers’ participation to error report-ing by assuming a bug fixing cost associated withflaws discovered in the field of operation, which, inthe absence of postrelease in-house detection efforts,are reported only by users. Recently, Ji et al. (2005)and Jiang et al. (2012) explicitly incorporate consumererror reporting, and we extend their work by fur-ther incorporating the effect of software demand onthis dimension. Specifically, we allow the consumers’contribution to the bug detection rate to grow withthe installed base and parameterize the actual errorreporting rate to account for users opting out of crashreporting because of privacy and other concerns.
Third, there is an explicit link between the costto firms of addressing postrelease software bugs andhow the network size evolves over time, which isanother important contribution of our work. Priormodels typically consider these costs as being linearin the number of bugs that are detected after mar-ket introduction. Some studies account for it moreabstractly as a function of time (Shantikumar andTufekci 1983), reliability (Pham and Zhang 1999), orthe number of remaining flaws (Ji et al. 2005). Ehrlichet al. (1993) also introduce a cost to the softwarefirm resulting from consumer use that depends on thesoftware failure intensity at release, the usage period,and an exogenous demand that is independent of themodel parameters. Beyond postrelease bug process-ing and fixing costs, we further account for the factthat the firm also incurs goodwill costs at a rate that isproportional to both the current bug count and net-work size. In this manner, we are able to capture thefact that an error that is detected early after release,when there are few adopters, is likely to be less costlyto the firm compared with an error that resides in thecode longer and generates greater damage to a largerconsumer base. Over time, the network size increasesand the number of resident errors decreases, generat-ing an important dynamic with the goodwill cost rateand how the firm controls adoption.
3. The General ModelA firm offers a software product licensed for per-petual use and supports it until discontinuationtime T > 0.3 Beyond T , consumers who have already
3 In the rapidly evolving software industry, this discontinuationtime is often exogenously determined by the rate of technologicaladvance. In other cases, because of future major releases of a prod-uct that are developed in parallel, the discontinuation time can bethe result of planned functional obsolescence. For simplicity, in ourmodel, we take T as fixed and focus attention on how communitycontributions (error reporting) toward quality improvement affecta software producer’s release timing and pricing.
INFORMS
holds
copyrightto
this
article
and
distrib
uted
this
copy
asa
courtesy
tothe
author(s).
Add
ition
alinform
ation,
includ
ingrig
htsan
dpe
rmission
policies,
isav
ailableat
http://journa
ls.in
form
s.org/.

August and Niculescu: The Influence of Software Process Maturity and Customer Error ReportingManagement Science 59(12), pp. 2702–2726, © 2013 INFORMS 2705
purchased may continue to use the software, whichstill has value, but the firm ceases all qualityimprovement efforts.4 The software product’s extentof features and overall complexity is related to its soft-ware class, ranging from enterprise software to simpleend-user applications. We denote the software prod-uct’s complexity as Y > 0, which can be interpretedas the size of the product’s codebase or its num-ber of basic units of code (e.g., modules, functions).Stemming from the CMMI and its implementation inindustry, a standard measure of software quality isthe inverse of defect density, i.e., defects per thousandlines of code (Weszka 2003, Siemens Information Sys-tems Ltd. 2003). We assume that the software producthas B bugs or defects at the earliest moment it canfeasibly be released, denoted as t = 0, which is oftenconsidered to be the beginning of the release candi-date stage, where features are no longer being addedand the focus turns to final testing and debugging(Petreley 1998). Therefore, using this standard mea-sure, initial software quality is given by Y/B.5
We denote the software process maturity of thefirm as � ∈ 60117. Recent empirical studies (Harteret al. 2000, Krishnan et al. 2000, Harter and Slaughter2003, Harter et al. 2012) document a positive rela-tionship between process maturity and software qual-ity and further identify in which circumstances theeffect of maturity is relatively even greater. Followingboth industry evidence and convention in the liter-ature, we also assume this relationship, B/Y = �4�5,exists, where we use defect density for convenienceand �4�5 has the following properties: ¡�/¡� < 0,�405= � <�, and �415 = 0. Taken together, firmswith more mature software development processes(higher �) arrive at the release candidate stage withlower bug density (i.e., B/Y is decreasing in �). Boththe product’s life cycle, 0 < T < �, and the marketpotential, 0 <m4Y 5≤m <�, are finite, the latter beingweakly increasing in the complexity or level of func-tionality provided by the software.
Let D4t5 denote the number of unique bugs de-tected and reported by time t ≥ 0, with the initialcondition D405 = D < B. Analogous to the relation-ship between B and Y , we assume that previouslydetected bugs satisfy D = ��4�5Y , where 0 ≤ � < 1.We assume that the bug detection process satisfies
4 In particular, consumers no longer impose goodwill costs on thefirm after T . In reality, consumers could still impose some goodwillpenalties on the firm after this point in time, but these costs wouldbe limited in comparison to those imposed as a result of poor qual-ity due to software defects during the active life of the product.Beyond T , most consumers have moved on to either newer versionsof the product or possibly different technologies, which further lim-its any goodwill costs.5 Initial bug density, the inverse of initial software quality, isthus B/Y .
properties of the mean of the classic nonhomogeneousPoisson process model for software reliability in Goeland Okumoto (1979), whereby at any given time t,the rate at which previously undiscovered bugs aredetected is proportional to the number remainingin the code.6 In particular, the detection process isgiven by
¡D4t5
¡t= �4t5× 4B−D4t551 (1)
where �4t5 can be interpreted as the overall rate ofdetection per undiscovered bug.7 Both the firm andexisting users can contribute to the bug detection pro-cess. The firm contributes �f > 0 to the overall rate byincurring testing effort, and any adopter who choosesto provide quality feedback contributes �u4Y 5 ∈ 401 �u7.We assume consumers use the software uniformlyover time and across functions and that their usagevaries with the software’s level of functionality Y ,which, in turn, affects the detection rate. Becauseconsumer error reporting is usually optional andsome users elect not to participate because of con-cerns over privacy and possible work disruption(Muthitacharoen and Saeed 2009), we denote the por-tion of users who do participate as � ∈ 40117.
Denoting the time at which the software is releasedas t0, we make a simplifying assumption that thefirm ceases detection at t0 and that all contributionsto detection come from the user base going forward.Thus, if N4t5 denotes the number of existing users attime t, then the overall detection rate per undiscov-ered bug is given by
�4t5=
{
�f if t < t01
�N4t5�u4Y 5 if t ≥ t00(2)
As a result, �4t5 is time inhomogeneous and canincrease substantially after t0 due to adoption. That is,user-supplied detection rates, �N4t5�u4Y 5, can exceed�f as adoption increases. Analogous to the benefit ofincreasing eyeballs with open source software devel-opment to find bugs, early release strategies benefitthe firm by leveraging an increased number of testers(Raymond 1999).
6 This assumption is widely supported and built on in other mod-els (see, e.g., Okumoto and Goel 1980, Ehrlich et al. 1993, Phamand Zhang 1999, Jiang et al. 2012). Although other models of bugdetection do exist, we follow the above tradition while utilizing adeterministic variant that maintains tractability and focus; such anapproach is typical when the stochastic nature of the bug detectionprocess is not critical to the research questions being studied (see,e.g., Ji et al. 2005, 2011; Arora et al. 2006).7 This model implicitly captures bug heterogeneity with regard todetection. Starting with B bugs initially, some bugs will surfacequickly whereas others will take longer to be detected; some willeven go undetected for the entire planning horizon. Furthermore,software complexity (Y ) affects both B = �4�5Y and �4t5 throughits effect on user contributions �u4Y 5, as seen in (2).
INFORMS
holds
copyrightto
this
article
and
distrib
uted
this
copy
asa
courtesy
tothe
author(s).
Add
ition
alinform
ation,
includ
ingrig
htsan
dpe
rmission
policies,
isav
ailableat
http://journa
ls.in
form
s.org/.

August and Niculescu: The Influence of Software Process Maturity and Customer Error Reporting2706 Management Science 59(12), pp. 2702–2726, © 2013 INFORMS
We denote the number of bugs still resident (eitherundetected or detected but unfixed) in the code asB4t5 with the initial condition B405 = B. Once a bugis reported, it is assigned to a pool of bugs thathave been detected but not yet fixed. At time t, thispool contains D4t5 − 4B − B4t55 reported defects, andthe firm works toward addressing them by issuingpatches at a rate � per unfixed defect. Hence, the rateof change for remaining bugs in the code is given by
¡B4t5
¡t= −� × 4D4t5− B+B4t550 (3)
We implicitly capture the property that bugs are likelyto be heterogeneous in the amount of effort requiredfor each to be resolved (Giger et al. 2010). In par-ticular, by the dynamics in (3), once detected, somebugs will be patched fast, others will take longer tobe fixed, and some known flaws will not be removedfrom the code prior to product discontinuation.
Drawing on the vast literature on innovation diffu-sion sparked by Bass’s (1969) model, we parameterizethe evolution of the cumulative installed base of usersN4t5 through a continuous-time hazard rate model asfollows:
¡N4t5
¡t= 4m4Y 5−N4t55
(
a+bN4t5
m4Y 5−c
B4t5
Y
)
w4p51 (4)
over t ∈ 6t01T 7, where a > 0. Adoption is influenced byboth positive network effects associated with the soft-ware and quality effects determined by its reliability.8
The relative strength of the network effects is givenby b > 0. Similarly, we denote the extent to whichpoor software reliability affects adoption as c > 0. Forexample, in recent years, Microsoft’s release of ServicePack 2 (SP2) for Windows XP was plagued by com-patibility issues that led to a significantly slower rateof adoption (Rooney 2004, Oswald 2005). Similarly,when Microsoft released Vista a few years later, itsproduct suffered from instability and, in some cases,slower performance than XP, which again led to slug-gish adoption (O’Neill 2008).
Consumer price sensitivity is reflected by a mul-tiplicative price response function w4p5 satisfying(i) w4p5 > 0, (ii) w′4p5 < 0, (iii) limp→� pw4p5 = 0, and(iv) w′′4p5 ≥ 0. Our choice of a multiplicatively sepa-rable price effect is consistent with the literature onthe diffusion of innovation (see, e.g., Robinson andLakhani 1975, Kalish 1983, Bass et al. 1994, Krishnanet al. 1999, Sethi and Bass 2003). The third conditionimplies that for any level of functionality above a cer-tain price point, both revenues and adoption are neg-ligible. As an example, price response functions of the
8 Network effects are captured in various models applied toIT products and services (see, e.g., Zhang and Seidmann 2010,Niculescu et al. 2012, Dou et al. 2013).
form �e−p� with �1 � > 0 satisfy all assumed proper-ties on w4 · 5.9
The firm incurs four types of costs: testing, errorreport processing, bug fixing, and goodwill, whichwe discuss in order. First, we assume that the firmbroadly tests the entire codebase, which is to say itdoes not know a priori where the defects are located.The firm will incur a total cost rate of CT × �f × Y ,where CT ≥ 0, to induce a bug detection rate (result-ing from the firm’s effort) of �f×4B − D4t55 throughthe testing of all Y units of the codebase. Thus, thetotal testing cost is given by
TC =CT × �f ×Y × t00 (5)
Second, we assume that the firm incurs error pro-cessing costs associated with analyzing error reports,assessing the extent of any given defect, and assign-ing its reparation to an appropriate developmentteam. Bug triaging is far less automated and relies ondevelopers and project managers to actually examinereports and classify them. For example, in a recenteffort to reduce memory leaks in Firefox, Mozillalaunched an initiative called MemShrink, part ofwhich involves weekly bug triage meetings (Keizer2011). User-generated reports usually vary in thequality of information provided and may requireadditional effort in terms of interpreting a reportand reproducing an error (Hooimeijer and Weimer2007, Zimmermann et al. 2010). For these reasons,we denote the per-report processing costs as CP1f ≥ 0and CP1u ≥ 0, depending on whether the report orig-inates from the firm’s testing or users’ reporting,respectively, with CP1f <CP1u. Contemporary auto-mated error reporting systems can help reduce thegap between these two cost rates but do not com-pletely eliminate it (Glerum et al. 2009). In lightof consumer protection laws and potential liability,we assume that the firm processes all error reports(Kennealy 2000, Cusumano 2004, Otto 2009). The totalprocessing cost is given by
PC =CP1f 4D4t05− D5+CP1u4D4T 5−D4t0550 (6)
Third, the firm incurs quality improvement costsby allocating effort to resolve bugs that have beenreported but are still unfixed at a cost rate CF ≥ 0.For simplicity, we assume that the firm works con-currently on fixing all D4t5− B + B4t5 defects. By (3),some fixes are issued quickly, whereas others becomedelayed. As a result, the firm can receive duplicateerror reports that must be cross-checked with the bugtracking system at a cost CD ≥ 0 before being dis-carded. For example, in one study’s data, researchers
9 This functional form is used by Robinson and Lakhani (1975).
INFORMS
holds
copyrightto
this
article
and
distrib
uted
this
copy
asa
courtesy
tothe
author(s).
Add
ition
alinform
ation,
includ
ingrig
htsan
dpe
rmission
policies,
isav
ailableat
http://journa
ls.in
form
s.org/.

August and Niculescu: The Influence of Software Process Maturity and Customer Error ReportingManagement Science 59(12), pp. 2702–2726, © 2013 INFORMS 2707
found that it can take over 20 minutes to recognizethat a bug report is a duplicate (Cavalcanti et al.2010). While pending resolution, any detected butunresolved bug can still be redetected (sometimeswith substantially different symptoms) at a rate �4t5,resulting in a duplicate report cost rate of CD × �4t5×4D4t5− B+B4t55. Therefore, the total bug fixing cost isgiven by
FC =
∫ T
04CF + �4t5CD5× 4D4t5− B+B4t55 dt0 (7)
Finally, the firm incurs goodwill costs from expos-ing its users to buggy software. Software crashes typi-cally generate damage to users only when they occur.However, not all flaws lead to crashes or systemalerts. For example, security breaches can go unde-tected without any system interruption, and malicioushackers can exploit security vulnerabilities repeatedlybefore they are detected and patched. More broadly,what we call “goodwill costs” can be thought ofas the cost of quality, which may even include thecost of helping users recover from software failure.We denote the average cost incurred per each userand unit of time as CG × B4t5/Y , where CG ≥ 0, andthe total expected goodwill costs are given by
GC =
∫ T
t0
CG ×N4t5×B4t5
Ydt0 (8)
Because software is a digital good, we make thetraditional assumption that there are no capacity con-straints and the marginal cost of reproduction is 0.Given that our time frame starts where all func-tionality has already been coded, development costsare considered sunk. Revenues are generated at eachpoint in time when a user adopts the product; hence,the firm’s profit can be written as
ç4t01 p5= pN4T 5− 4TC + PC + FC +GC50 (9)
Using the framework laid out in this section, we canbegin to explore how firms of varying process matu-rity and that offer different classes of software prod-ucts should manage adoption through release timingand pricing.
Throughout the paper and proofs, for clarity inexposition, we will simplify notation for B4�1Y 5,D4�1Y 5, m4Y 5, �u4Y 5, and w4p5 by omitting the argu-ments (i.e., using B, D, m, �u, and w, respectively)whenever the arguments are not relevant to the dis-cussion or analysis at hand. To avoid trivialities, wefocus on parameter regions where the firm yieldsprofits above a minimum, positive value. Further-more, for simplicity, we assume no discounting, butall of the insights presented in this paper extend to acase with discounting.10
10 See Arora et al. (2006) and Jiang et al. (2012) for a similar assump-tion in cases where discounting does not play a central role.
4. Managing Adoption andError Reporting
Prior to software release at t0, the dynamics of thedetected and resident bugs, D4t5 and B4t5, respec-tively, can be characterized as follows. By (1) and (2),the number of unique bugs that have been detectedby the firm by time t ∈ 601 t07, whether fixed or not, isgiven by
D4t5= B+ 4D− B5× e−�f t0 (10)
Using (3) and (10), the number of bugs still remainingin the software, either undetected or detected but notyet fixed, exhibits the following trajectory over time:
B4t5=1
� − �f× 4�4B−D5e−�f t + 4D�− B�f 5e
−�t5 (11)
for 0 ≤ t ≤ t0.11
After software release at t0, adoption can begin, andby (4), a necessary condition is that the hazard ratemust be positive; i.e., a ≥ cB4t05/Y . Using (11) andthe relationship between software maturity and ini-tial bug density, this condition is equivalent to a ≥
c�4�5â4t05, where
â4t54
=1
B4� − �f 5× 4�4B− D5e−�f t + 4D� − B�f 5e
−�t50
Because â4t5 is decreasing and â405= 1, adoption cancommence at t = 0 if a ≥ c�4�5. Otherwise, becauselimt→� â4t5 = 0, there exists a unique bound t satis-fying a = c�4�5â4t5 such that adoption can start pro-vided t0 ≥ t. In summary, the release time must satisfy
t0 ≥ L4�54
=
{
0 if a≥ c�4�51
t otherwise1(12)
where L4�5 is a constraint on release time similar toother constraints on software reliability/quality seenin papers such as Yamada and Osaki (1987), Kimuraet al. (1999), and Zheng (2002). L4�5 is decreasing;software firms with higher maturity can release theirproducts earlier.
The characterization of D4t5 and B4t5 over t ∈ 601 t07in (10) and (11) provides initial conditions to thedynamical system over t ∈ 6t01T 7:
¡D4t5
¡t= �N4t5�u4Y 54B−D4t551
¡B4t5
¡t= −�4D4t5−B+B4t551 (13)
¡N4t5
¡t= 4m4Y 5−N4t55
(
a+bN4t5
m4Y 5−c
B4t5
Y
)
w4p51
11 In the remainder of this paper, without loss of generality, werestrict attention to �f 6= �. For the special case where �f = �,B4t5= 4B+ �4B− D5t5e−�t , and the subsequent analysis is similar.
INFORMS
holds
copyrightto
this
article
and
distrib
uted
this
copy
asa
courtesy
tothe
author(s).
Add
ition
alinform
ation,
includ
ingrig
htsan
dpe
rmission
policies,
isav
ailableat
http://journa
ls.in
form
s.org/.

August and Niculescu: The Influence of Software Process Maturity and Customer Error Reporting2708 Management Science 59(12), pp. 2702–2726, © 2013 INFORMS
where D4t05 = B + 4D − B5e−�f t0 , B4t05 = 4�4B − D5 ·
e−�f t0 + 4D� − B�f 5e−�t05/4� − �f 5, and N4t05= 0.
Because of how the bug detection, fixing, and adop-tion processes interact, the ability to fully analyticallycharacterize the dynamical system described in (13)is limited, though it can be studied numerically overthe complete parameter space. We proceed analyti-cally by focusing on a parameter regime where thequality effect on adoption and the bug fixing rate sat-isfy certain bounds. First, our focal regime will satisfyc < c such that the negative effect of bugs on adop-tion is not too severe. Consistent with most softwareproducts, users often utilize software while cognizantof the quality issues. Adoption is typically not overlyhampered and commences, although users certainlyimpose goodwill costs. Second, � > � will also be sat-isfied in this regime such that we study cases wherebugs are worked on at a reasonable rate.12 Our modelassumes that it is mandatory for firms to processall consumer-reported bugs and resolve them at thisrate. Overall, the parameter regime we study is oftenfound in practice, and maintaining focus on it willincrease clarity and analytical tractability throughoutthe paper.13
4.1. Exogenous PricingFirst, we study the case where price is fixed over thesoftware product’s selling horizon and is determinedby the market. Let p be the price of the software for allt ≥ t0. Examining the dynamical system in our focalregime, the adoption path exhibits certain monotonic-ity properties.
Lemma 1. For all t ≥ t0,(i) N4t5 is decreasing in t0 and p.(ii) For a given software firm’s process maturity level �,
N4t5 is increasing in Y . That is, a firm derives a strongercumulative adoption from releasing a higher functionalityproduct despite it containing a larger number of bugs.
Part (i) of Lemma 1 establishes that a delayed releaseadoption path always lies below an early release adop-tion path. As a consequence, if the firm ever choosesto delay its release in order to increase initial qual-ity and gain stronger initial adoption momentum, thisdelayed strategy will never induce the same cumu-lative sales volume. Part (ii) of Lemma 1 highlightsthat, all else being equal, the net effect of increased
12 Our regime is consistent with Ji et al. (2011) and Jiang et al. (2012),where identified flaws are assumed to be removed instantaneously.13 Because of the nature of (13), c and � are implicit bounds whoseexistence is rigorously demonstrated in the proofs. Because anyclosed-form representations of these bounds would be pages longand lack informativeness (and not be attainable in most cases), wenumerically establish how wide the parameter region typically canbe as we discuss results in the paper. This parameter regime willapply for all propositions.
software functionality is greater adoption, despite theexistence of more bugs in the software. Examining (4),which governs adoption, we see that an increase infunctionality Y increases both the potential marketfor the software m4Y 5 and the initial number of bugsB4�1Y 5 = �4�5Y . When the negative effect of soft-ware quality on adoption is limited, the net effect of alarger market potential is to increase the rate of adop-tion. Hence, a software firm with a given maturity �can increase functionality without hurting adoption,provided it maintains this level of capability in itsdevelopment processes. That is, more bugs certainlyget introduced, but additional functionality serves tocounterbalance them. For example, holding all elseconstant, including software maturity, the above resultsuggests that having both triple the functionality andtriple the bugs would still lead to greater adoption;one could compare the adoption of Windows NT 4.0to Windows 7, which has an estimated three times theformer product’s lines of code.
4.1.1. Release Time Bounds. Next, we study theprofit maximization problem for the firm as it selectsthe optimal release time. Given a fixed price p, theoptimal release time t∗0 satisfies
t∗0 = arg maxt0∈6L4�51T 7
ç4t050
Although it is not possible to give a complete, explicitclosed-form solution to this problem, we can (i) char-acterize informative bounds on the firm’s optimalrelease time, (ii) identify conditions under which t∗0is either at a bound or interior, and (iii) character-ize the conditions t∗0 must satisfy when it is interior.14
Choosing a release time at a bound can often stillgenerate profits comparable to those obtained underthe optimal interior choice for release time, whichwe will both analytically and numerically demon-strate. For convenience, we define G14�5
4
= 4a + b5/4b+ ae4a+b54T−�5w5, G24�5
4
= 4a+ b54T −�5w/2, and
g4�54
= −aG21e
4a+b54T−�5w+��fmpwY��u −CT e��f Y 2��f �u
+(
CG + 4CP1u −CP1f 5Y��u)
× 4B− D5�f
+ 4CG +CP1uY��u5
×G
m��u/4bw51 4B− D5e4a+b54T+�5w/2+am4T−�5��u/b
ae4a+b5Tw + be4a+b5�w
×(
−4a+ b5�f cosh4G25
+ 4�f 4b− a5+ 2am��u5 sinh4G25)
0
14 For both the release time and pricing optimization problems stud-ied in this paper, the profit functions generally have a unique opti-mizer, although their shapes may not be concave. Our results applyfor wide parameter regions as can also be numerically illustrated.
INFORMS
holds
copyrightto
this
article
and
distrib
uted
this
copy
asa
courtesy
tothe
author(s).
Add
ition
alinform
ation,
includ
ingrig
htsan
dpe
rmission
policies,
isav
ailableat
http://journa
ls.in
form
s.org/.

August and Niculescu: The Influence of Software Process Maturity and Customer Error ReportingManagement Science 59(12), pp. 2702–2726, © 2013 INFORMS 2709
Proposition 1. The optimal release time for a firm’ssoftware product satisfies t∗0 ≤H4Y 1�1p5 such that
(i) if �f ≥m��u, then
H4Y 1�1p5
= min{
T 1max{
L4�51
1�f
log(
4B− D54CG + 4CP1u −CP1f 5Y��u5
CTY2��u
)}}
3
(ii) if �f <m��u, then
H4Y 1�1p5
= min{
T 1max{
L4�51
1�f
log(
4B− D54CG + 4CP1u −CP1f 5Y��u5
CTY2��u
)
1
T − log(
1 +4a+ b5�f
a4m��u − �f 5
)
/
44a+ b5w5
}}
1
and profits are decreasing in t0 over the interval4H4Y 1�1p51T 7. Further, there exists Kë > 0 such that�t∗0 −ë � < Kë� whenever g4L4�55 > 0, where ë satisfiesg4ë5= 0.15
Proposition 1 establishes that a firm should neverdelay release beyond H4Y 1�1p5. Despite potentiallyinducing higher sales on some time intervals, adelayed release corresponds to a weaker aggregateinstalled base pointwise. Within the interval 4H4Y 1�1p51T 7, further delaying release will shrink profitsbecause lost revenues and additional internal testingcosts are not offset by the benefits over the remain-ing horizon associated with lower goodwill costs andbug processing costs. Hence, Proposition 1 asserts thata firm should release immediately if any constrain-ing factors prevented release prior to H4Y 1�1p5. Soft-ware firms sometimes face such constraints when theadoption of their product is tied to the availability ofspecific hardware. For example, in the spring of 2006,Sony officially announced a delay in the release of itsPlayStation 3 console until November due to unre-solved issues with the production of Blu-ray compo-nents (Nagai 2006). In such a case, some firms whowould have originally delayed the release of theirtitles to improve initial quality may have reducedincentives to delay under the new console launch date.
As a firm increases the maturity of its developmentprocesses, both bounds on the optimal release timehave a tendency to shrink, which suggests that an
15 The formal conditions of the focal regime are described inLemma A1, which provides greater details on how � should betaken. In particular, c = �c� and � = ��/�, where �c , �� , �> 0.
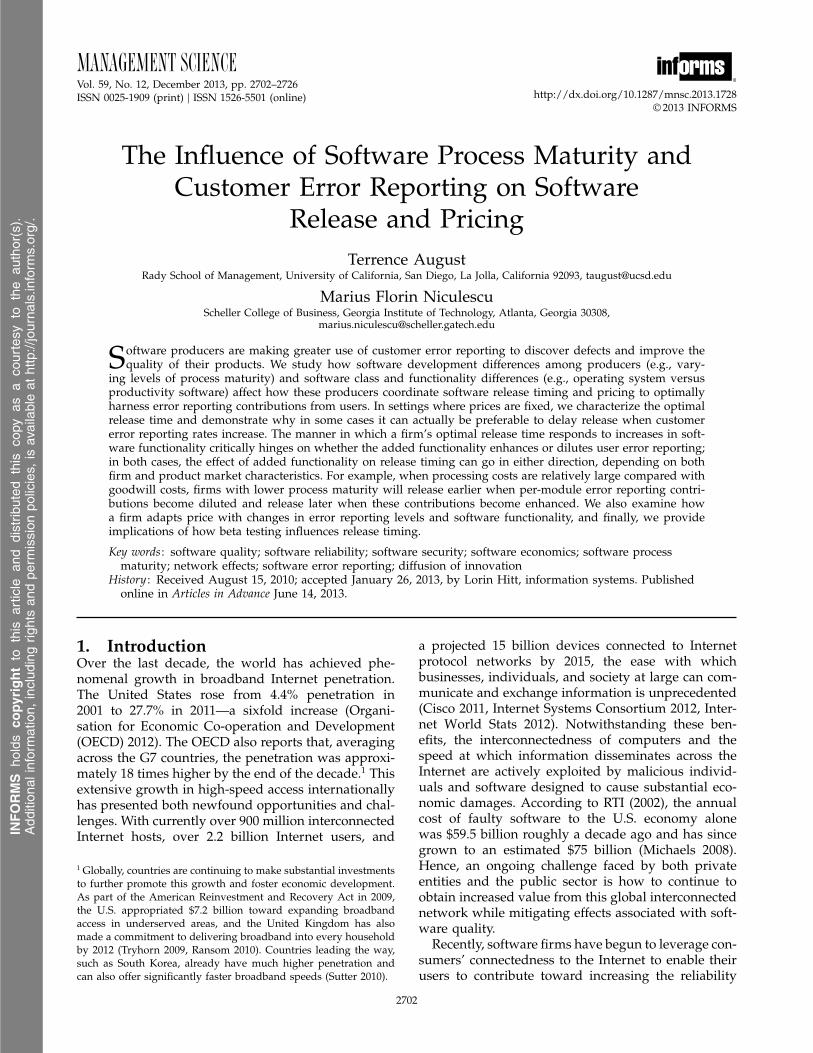
earlier release may be preferable. Proposition 1 alsodescribes the optimal release time as it moves intothe interior and away from the bounds. All together,L, H , and ë characterize how the optimal releasetime is affected by the parameters of the model. InFigure 1, we illustrate how the optimal release timecompares to the derived bounds while slightly devi-ating the parameter set for each panel. Panels (a), (c),and (e) all demonstrate that for sufficiently large �,the bounds collapse, suggesting that the firm shouldrelease its product as soon as it can generate adop-tion. Said differently, firms that utilize mature devel-opment processes (e.g., those that have obtained ahigher CMM level) should release their products tothe market when they have a release candidate avail-able. Although there are always some negative effectson adoption stemming from reduced quality due tobugs early in the product life cycle, at a high level ofmaturity, releasing at L4�5 to boost adoption throughnetwork effects is more beneficial to the firm.
Panel (a) of Figure 1 shows that when the strengthof the bug quality effect on adoption is relatively low(c = 004), L drops to zero, as is implied by (12) for alllevels of software maturity. Even a firm whose soft-ware maturity is low can feasibly release immediatelyand still engender adoption, but it optimally choosesto delay release. In this case, the negative effect oflow quality on adoption is quite limited, but good-will costs are substantial because N4t5 will ramp upquickly when c is small (see (4) and (8)). In this panel,the optimal release time is decreasing as softwarematurity (�) increases, and for sufficiently high matu-rity, the release time bounds collapse and the firmoptimally releases immediately at time zero. Panel (b)demonstrates that the upper bound H performs wellin comparison to the optimal interior release time, andprofits under the lower bound L approach optimalprofits as � gets large.
Panels (c) and (d) of Figure 1 illustrate a case wherethe negative quality effect on adoption is still weakbut a bit larger (c = 3). Additionally, the selling hori-zon is shortened from T = 8 to T = 205. In this case,there are two noteworthy differences. First, becausethe negative quality effect on adoption is slightlystronger, at the low range of software maturity, thelower bound L has now increased, moving away fromzero. Second, the optimal release time occurs sooner,and the software is released at zero for a significantrange of process maturities at the high end. Panel (d)illustrates the corresponding optimal profits, demon-strating that releasing as soon as a release candidateis available at L is nearly optimal. In the followingproposition, we analytically examine what happens as
INFORMS
holds
copyrightto
this
article
and
distrib
uted
this
copy
asa
courtesy
tothe
author(s).
Add
ition
alinform
ation,
includ
ingrig
htsan
dpe
rmission
policies,
isav
ailableat
http://journa
ls.in
form
s.org/.
August and Niculescu: The Influence of Software Process Maturity and Customer Error Reporting2710 Management Science 59(12), pp. 2702–2726, © 2013 INFORMS
Figure 1 Optimal Release Time, Release Time Bounds, and Profits as Affected by Software Maturity, the Impact Strength of Bug Quality onAdoption, and the Length of the Selling Horizon
0 0.5 1.00
1
2
3
4
(a) (b)t 0
,L,H
Weak bug quality effect on adoption,moderate selling horizon
Weak bug quality effect on adoption,short selling horizon
Strong bug quality effect on adoption,moderate selling horizon
L
t0*
H
0 0.5 1.0
50
100
ΠΠ
Π
Π(L)
Π(L)
Π(L)
Π(t0)*
Π(t0)*
Π(t0)*
Π(H)
Π(H)
Π(H)
0 0.5 1.00
1
2
3
(c)
L
H
–50
0
50
100
(d)
0
1
2
3
4
(e)
L
t0*
t0*
H
60
80
100
(f)
*t 0
,L,H
*t 0
,L,H
*
�
0 0.5 1.0
�
�
�
0 0.5 1.0 0 0.5 1.0
��
Notes. For panels (a) and (b), c = 004 and T = 8. For panels (c) and (d), c = 3 and T = 205. For panels (e) and (f), c = 6 and T = 8. The other parametervalues are a = 4, b = 005, Y = 15, m = 30, � = 0025, �f = 008, �u = 00015, CT = 007, CF = 007, CP 1 u = 006, CP 1 f = 005, CG = 003, CD = 005, � = 203, � = 001,� 4�5= 241 − �5, p = 4, and w = 0046.
T becomes shorter, which can provide greater insightinto the characteristics seen in panel (c).
Proposition 2. There exist bounds �u, T > 0 with Tsatisfying
0 = −a4a+b52e4a+b5TwmpwY
4b+ae4a+b5Tw52−CTY
2�f −4B−D5
×
(
CP1fY�f −CGm
×
(
1−aT �f
b+�f 4log4b+ae4a+b5Tw5−log4a+b55
bw
−a+b
b+ae4a+b5Tw
))
1 (14)
INFORMS
holds
copyrightto
this
article
and
distrib
uted
this
copy
asa
courtesy
tothe
author(s).
Add
ition
alinform
ation,
includ
ingrig
htsan
dpe
rmission
policies,
isav
ailableat
http://journa
ls.in
form
s.org/.

August and Niculescu: The Influence of Software Process Maturity and Customer Error ReportingManagement Science 59(12), pp. 2702–2726, © 2013 INFORMS 2711
such that if a > b and �u < �u, then(i) if T < T , then t∗0 = L;(ii) if T > T , then t∗0 >L.
Furthermore, as either software functionality or maturityincreases, a firm can release at L over a wider range ofselling horizons. Technically, T is increasing in � (i.e.,decreasing in B − D) and also increasing in Y wheneverm′4Y 5/m4Y 5 < 1/Y .
Proposition 2 formally establishes that there existsa bound on the length of the selling horizon T belowwhich a software firm should release at L. Above thatbound, the optimal release time moves to the interior.A bound exists for a firm at any level of softwarematurity. The critical difference is how the bound isaffected by software maturity. In Proposition 2, weanalytically establish that T is increasing in softwarematurity, which is to say that a highly mature firmshould release its software at L for a wider range ofselling horizons. Said differently, T can be quite largefor a firm with mature software development pro-cesses. Returning to panel (c) of Figure 1, we illus-trate that firms with software maturities satisfying� ∈ 6006117 already release their software at L whenT = 205. As T decreases further, t∗0 will coincide withL for a greater range.
To contrast this result with what happens as cgrows higher, in panel (e) of Figure 1, we use c = 6and T = 8. Once the negative quality effects on adop-tion become more severe, even less mature softwarefirms will find it optimal to release earlier, but thereasoning is different in this case. It is not the casethat a lower maturity firm should release softwareproducts early in the absolute sense. Rather, it shouldrelease its product as soon as it feasibly can, becauseby the time it has a release candidate with suffi-ciently high quality to induce adoption, the amountof time remaining before product discontinuation hasbecome limited. Panel (e) of Figure 1 illustrates howL4�5 can decrease more sharply in software matu-rity. As � becomes small, the remaining sales horizonis effectively limited and the firm should optimallyrelease at L. As � increases, T −L4�5 increases and thefirm’s sales horizon becomes less constrained. In thiscase, an early release would involve goodwill andprocessing costs accumulating over a longer periodof time for early adopters. Thus, the producer mayprefer to delay release in order to improve qualityfirst, which is depicted by t∗0 moving into the interiorregion between the bounds L and H . However, as �continues to increase, such a firm’s software producthas inherently better quality, and the effects describedin Proposition 2 dominate, indicating that the firmshould release immediately at L.
Finally, Proposition 2 also establishes that T in-creases in Y under market conditions where the mar-ket potential is large and not too sensitive to changes
in software functionality. Under these conditions andwhen the per-user contribution rate is low, an increasein functionality provides greater incentive to releaseearlier and harness customer error reporting. In par-ticular, more bugs are introduced with greater func-tionality, and shorter sales horizons demand fasterbug clearance.
4.1.2. Impact of User Contributions on ReleaseTiming. In this section, we study the sensitivity ofthe optimal release time with respect to user contri-butions. First, we examine how an increase in theproportion of users who agree to participate in errorreporting affects the optimal release time.
Proposition 3. The optimal release time t∗0 is decreas-ing in � if Q�4�5 < 0 for all � ∈ 601 �7 and increasing in� if Q�4�5 > 0 for all � ∈ 601 �7, where
Q�4�5
4
=−bCG
(
a+b
G1
)m��u/4bw5
4ae4a+b5Tw+be4a+b5�w5w�f
+eG2+4a+b5w�+am4T−�5��u/b×4a+b5m��u/4bw5
×(
4a+b5�f cosh4G256wbCG−m��u
×G34wa4T −�5+logG157+sinh4G25
×[
w(
−b2CG�f +a2m��u4T −�5G342m��u−�f 5
+ab4CG�f 41+m��u4T −�55
+CP1umY�2�2u42+�f 4T −�55
)
+m��uG3 log4G154�f 4b−a5+2am��u5])
1 (15)
G34
= CG + CP1uY��u, and � is given in the appendix.Further,
(i) there exists a bound � > 0 such that if
m��u�f
<4a+ b5 cosh44a+ b5Tw/25− 4b− a5 sinh44a+ b5Tw/25
2a sinh44a+ b5Tw/25
and CG/CP1u < �, then Q� > 0;(ii) there exists a bound � > 0 such that if CG/CP1u > �
is satisfied, then Q� < 0.
Proposition 3 demonstrates that the net effect ofthe interaction between the optimal release time (t∗0 )and the level of error reporting (�) is critically deter-mined by goodwill costs, the cost of processing user-generated error reports, error reporting rates of thefirm and user base, bug fixing rates, functionality,and the various parameters describing the adoptioncurve. In our focal regime, how the release time isimpacted by an increase in the error reporting frac-tion ultimately hinges on the sign of Q� as definedin (15). For part (i), when the ratio between goodwillcosts and the processing costs associated with user-generated error reports (CG/CP1u) is relatively low and
INFORMS
holds
copyrightto
this
article
and
distrib
uted
this
copy
asa
courtesy
tothe
author(s).
Add
ition
alinform
ation,
includ
ingrig
htsan
dpe
rmission
policies,
isav
ailableat
http://journa
ls.in
form
s.org/.

August and Niculescu: The Influence of Software Process Maturity and Customer Error Reporting2712 Management Science 59(12), pp. 2702–2726, © 2013 INFORMS
the strength of the error reporting rate from userscompared with the firm is also low, then t∗0 increasesin response to an increase in �. When goodwill costsare low, the firm has incentives to release its productearly on. With an increase in the fraction of users con-tributing to error reporting, the firm can release evenearlier to further harness these contributions, particu-larly in light of the small goodwill costs. On the otherhand, if the cost of processing user reports is large incomparison to goodwill costs and the relative strengthof total user error reporting rate relative to the firm’sis small, then the firm also has incentives to incurfurther detection costs itself and release a more pol-ished product later in the market. Part (i) of Proposi-tion 3 establishes that the latter effect of this trade-offis stronger, and the firm may optimally prefer to shiftits release time outward in such cases. In panel (a) ofFigure 2, we provide a numerical illustration of thisbehavior with curve A.
In contrast, when the condition in part (i) of theproposition is violated and the relative potential oferror reporting (m��u/�f ) is high, the former effecttends to dominate, as is illustrated with curve A′. Inthis case, the inherent market potential is doubledin comparison to that for curve A, which increasesthe potential of user error reporting considerably.Similarly, part (ii) of Proposition 3 establishes thatdespite obvious drawbacks of releasing its softwareearly when goodwill costs are high, a software firmwill overall prefer to release earlier as the fraction ofusers participating in error reporting increases, pro-vided that the cost of processing these user reportsis not too substantial. In panel (a) of Figure 2,
Figure 2 How the Optimal Release Time Changes in the Proportion of Users Who Contribute Error Reports
0 0.2 0.4 0.6 0.8 1.00.94
0.95
0.96
0.97
0.98
0.99(a)
�
t 0* B: High CG/CP, u
A: Low CG /CP, u Low m
A�: Low CG /CP, u High m
0 5 10 150
1
2
3
4
5
6(b)
c
FR
I
II
�
Notes. The common parameter values are a = 4, b = 005, c = 10, T = 105, CT = 0025, CF = 002, CD = 002, CP 1 f = 0001, �f = 007, Y = 305, m4Y 5 =
m041 − e−0042Y 5, �u4Y 5 = 001Y −007, � 4�5 = 241 − �5, � = 0075, p = 004, w4p5 = 005e−0002p , � = 001, and � = 2. For curves A and A′, the specific parametervalues are CG = 108 and CP 1 u = 102, with m0 = 30 in the former and m0 = 60 in the latter. For curve B, the specific parameter values are CG = 2, CP 1 u = 0005,and m0 = 30. Panel (b) illustrates the extent of the bounds on the focal regime, denoted as FR, for curve B.
curve B demonstrates how t0 decreases under theseconditions. In this case, it is critical that the firm beable to remedy defects quickly in order to effectivelyoffset the high goodwill costs while benefitting fromthe increased user error report contributions.
In panel (b) of Figure 2, we depict the extent of thebounds on the quality effect on adoption (c) and thebug fixing rate (�), which we discussed previously in§4.1 and in Footnote 13. As mentioned, the size of ourfocal regime (labeled FR in the figure) is extensive,and our results apply for a wide region of the param-eter space. In particular, using the same parametersused to generate curve B, we illustrate the extent towhich c and � can be adjusted while maintaining thesame qualitative behavior (i.e., monotonicity) as seenin curve B. When this focal regime is violated, theoptimal release time can exhibit varying behavior. Forexample, in region I, when the bug fixing rate is tooslow, the firm has incentives to delay release ratherthan inducing greater detections that are not expedi-tiously resolved. For region II, as c becomes large, thesoftware begins losing profitability.
Another dimension of user contribution to thedebugging process is captured through the user errordetection rate �u4Y 5, which in turn depends on thelevel of software functionality Y . Highlighting thisinteraction, we next explore how the level of softwarefunctionality affects the firm’s release time decision.To simplify the problem and focus on the most rel-evant trade-offs, in the following we will hold themarket potential constant at the level m; implicitly, westudy a region where the market potential is not tooelastic in functionality.
INFORMS
holds
copyrightto
this
article
and
distrib
uted
this
copy
asa
courtesy
tothe
author(s).
Add
ition
alinform
ation,
includ
ingrig
htsan
dpe
rmission
policies,
isav
ailableat
http://journa
ls.in
form
s.org/.

August and Niculescu: The Influence of Software Process Maturity and Customer Error ReportingManagement Science 59(12), pp. 2702–2726, © 2013 INFORMS 2713
Proposition 4. For fixed market potential, the optimalrelease time t∗0 is decreasing in Y if QY 4�5 < 0 for all� ∈ 601 �7, and increasing in Y if QY 4�5 > 0 for all � ∈
601 �7, where
QY 4�5 = �4�541 −�5e−��f
×(
KYGCG +KY
P1uCP1u − �fCP1f
)
− �fCT 1 (16)
and KYG , KY
P1u, and � are given in the appendix.(i) When the additional cost of processing user-reported
bugs is low, then(a) given any level of firm development maturity,
there exists �f > 0 such that if �f < �f and �′u4Y 5 < 0, then
QY > 0 and t∗0 is increasing in Y ;(b) if a firm’s internal rate of bug detection (�f ) is not
too small and it has highly mature development processes,then QY < 0 and t∗0 is decreasing in Y .
(ii) When a firm uses less mature development pro-cesses, the additional cost of processing user-reported bugsis high, and the goodwill costs are low, then
(a) if the impact of increased functionality on the usercommunity’s contribution to detection rate is negative (i.e.,Y�′
u4Y 5+�u4Y 5 < � < 0) and the firm has a relatively highinternal detection rate, then QY < 0 and t∗0 is decreasingin Y ;
(b) if the impact is positive and the contributions arelarge (i.e., �′
u4Y 5 > 0 and �u4Y 5 is high), then QY > 0 andt∗0 is increasing in Y .
An important measure that helps determine theaggregate effect of a change in functionality onrelease time is the degree to which this changeaffects the total detection rate contributed per useracross all modules; i.e., ¡Y�u4Y 5/¡Y = Y 4¡�u4Y 5/¡Y 5+�u4Y 5. When the impact on user contribution is weak(i.e., Y 4¡�u4Y 5/¡Y 5 + �u4Y 5 is small or negative), anincrease in functionality leads to either a limited pos-itive increase or a loss in the total user detectionrate. There are multiple effects in play. On one hand,the firm has reduced incentives to release its prod-uct early to the market because of the lower benefitassociated with user contributions. Instead, the firmcan shift its release to a later time to avoid good-will costs associated with early release. On the otherhand, because there is a cost associated with process-ing user-reported defects, having fewer contributionsfrom the user community may permit the firm torelease earlier to engender faster adoption benefittingfrom network effects while incurring less additionalprocessing costs.
Part i(a) of Proposition 4 establishes that whenthe cost of processing user-reported defects is small,then the optimal release time can be delayed withan increase in functionality. Referring to the trade-offs identified above, because the user contributionsare weak, the firm can benefit from pushing back
the release time such that goodwill costs are notincurred while the firm continues testing on its ownto improve the quality of its software by reducingdefects. Moreover, even in cases when testing costsare large, having a lower internal rate of detection willlimit the firm’s exposure to these costs and permita later release. Part ii(a) of Proposition 4 examinesthe impact of a loss in strength of user contributionsas a result of increased functionality when the firmhas lower software maturity and user error reportprocessing costs are higher. Beyond a certain point,increased complexity may impact the usability of asystem and reduce the chances of users spotting indi-vidual defects. Because of greater flaws due to lowermaturity, a decrease in user reporting can permit ear-lier release without incurring as much total additionalprocessing costs because of these reduced user contri-bution rates. In this case, releasing earlier can expediteadoption and be preferable as long as goodwill costsare limited in comparison to processing costs.
When the impact on user contribution is positiveand contributions are large, an increase in function-ality boosts the total detection rate stemming fromusers. In this case, there is again a distinct trade-off. First, there are incentives to release the softwareearlier in order to benefit from stronger user contri-butions. On the other hand, the firm also wants tolimit both goodwill costs stemming from early releaseand potential additional costs associated with theprocessing of user-reported defects. Part i(b) of Propo-sition 4 establishes that when firms have higher devel-opment maturity, and correspondingly fewer bugs intheir products, they can release earlier to benefit frommore user contributions as long as processing costsare not too high. High maturity and lower process-ing costs together limit the downside costs, making itoptimal to decrease release time as a consequence toincreased functionality. Notably, KY
G in (16) is negativewhen �′
u4Y 5 > 0, suggesting that stronger user contri-butions stemming from increases in functionality canextend this effect to a greater range of software matu-rity levels. On the other hand, part ii(b) of Proposi-tion 4 formalizes the opposite effect: when a firm haslower software maturity, it may find it preferable todelay release to limit exposure to the additional pro-cessing and goodwill costs stemming from the higherbug density found in its product.
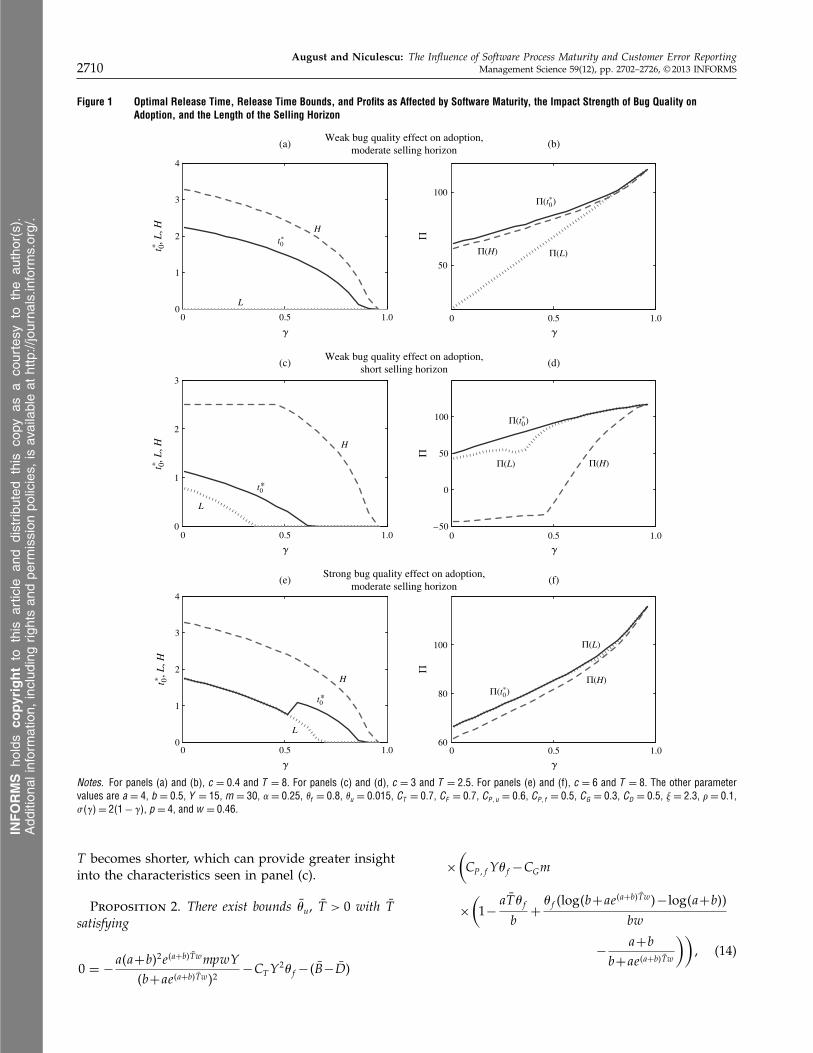
In Figure 3, we illustrate how the optimal releasetime responds to an increase in software functionalityfrom YL = 205 to YH = 4. In this case, CP1u is relativelylow and �f is at a higher level relative to per-usererror reporting contributions; by part i(b) of Propo-sition 4, the optimal release time should decreasein response. In panel (a), we plot the overall detec-tion rate �4t5 over time, which shows t∗0 droppingfrom 0060 under YL down to 0040 under YH . Panel (b)
INFORMS
holds
copyrightto
this
article
and
distrib
uted
this
copy
asa
courtesy
tothe
author(s).
Add
ition
alinform
ation,
includ
ingrig
htsan
dpe
rmission
policies,
isav
ailableat
http://journa
ls.in
form
s.org/.
August and Niculescu: The Influence of Software Process Maturity and Customer Error Reporting2714 Management Science 59(12), pp. 2702–2726, © 2013 INFORMS
Figure 3 Optimal Release Time as Influenced by Changes in Software Functionality
0 0.5 1.0 1.50
2
4
6
8
10
12
14(a) Aggregate detection rate
t0 0.5 1.0 1.5
t0 0.5 1.0 1.5
t
YH
YL
0
5
10
15
20
25
30(b) Number of software adopters
N(t
)
t0*t0
*YH
YL
0
0.5
1.0
1.5
2.0
2.5(c) Number of resident bugs
B(t
) YH
YL
�(t
)
Notes. The common parameter values are a= 10, b = 005, c = 5, T = 105, �= 0025, CF = 007, CD = 005, CP 1 f = 0001, CP 1 u = 0002, CT = 105, CG = 2, �f = 3,m = 30, �u4Y 5 = 2Y −002, � 4�5 = 241 − �5, � = 007, w4p5 = 005e−0002p , p = 107, � = 001, and � = 2. For the two curves depicting lower and higher levels offunctionality, the parameter values are YL = 205 and YH = 4, respectively.
reflects the impact of this change on the adoptioncurve N4t5. Consistent with Lemma 1, the adoptioncurve under a lower t0 and higher Y is greater every-where, as can be seen in the figure. Panel (c) illus-trates how bugs are resolved over time. Because ofthe product’s higher level of functionality, under YH
there are more defects that need to be detected andresolved. Releasing earlier allows the firm to betterharness customer error reporting in order to improvesoftware quality over the selling horizon.
Connecting our findings with what we observe inindustry, we discuss a recent example. The AppleiOS 5 mobile operating system was released relativelyquickly after its previous iteration and initially con-tained flaws and preconfigured settings that severelydiminished handset battery performance (Albanesius2011). Although Apple does not sell its mobile oper-ating system separately to customers, the goodwillimpact of poor quality can be high given its com-plementary handset and application (app) marketbusinesses. Apple uses mature software developmentprocesses and takes a structured approach to qual-ity assurance, using many channels to receive userfeedback. Moreover, a great number of Apple iOS 5’sincremental new features were aimed at enhanc-ing user experience and facilitating the developmentof apps on its platform. Both of these classes ofenhancements are likely to have generated a sig-nificant amount of attention and usage from theirtargeted communities, leading to potentially substan-tial feedback in case of software flaws. This settingfits well with part (ii) of Proposition 3 and part i(b)of Proposition 4, both suggesting that Apple had
incentives to release earlier, which was confirmedex post.
4.1.3. Beta Testing. In this section, we examinehow beta testing interacts with the firm’s release timedecision. Because the focus of our paper centers onrelease timing and pricing in the context of user errorreporting contributions, we abstract from initial soft-ware development decisions taking a software prod-uct as given (i.e., a release candidate is available attime zero). In the typical software release cycle, betatesting is a precursor to the release candidate stage,and therefore issues such as when to cease develop-ment (quality choice) and begin alpha/beta testingbecome more relevant. In that light, in this section,we do not intend to provide a comprehensive under-standing of how to manage beta testing. Instead, wehope to provide some basic insights into how the exis-tence and degree of beta testing might impact a firm’ssoftware release timing, which is a fundamental con-cern in our study.
We take a simple view of beta testing wherethe firm has the capability to harness a portion of thepotential market NB ∈ 401m5 to serve as testers of theproduct during the interval 601 t07 before release. Ineffect, beta testing uses potential customers to boostthe detection rate while not incurring a significantcost of quality (i.e., goodwill cost) because the productstill has yet to be released. At the same time, beta test-ing may push up the cost of processing user-reportedbugs by increasing the rate at which these detectionreports arrive to the development team. In the follow-ing proposition, we explore how the extent of beta
INFORMS
holds
copyrightto
this
article
and
distrib
uted
this
copy
asa
courtesy
tothe
author(s).
Add
ition
alinform
ation,
includ
ingrig
htsan
dpe
rmission
policies,
isav
ailableat
http://journa
ls.in
form
s.org/.
August and Niculescu: The Influence of Software Process Maturity and Customer Error ReportingManagement Science 59(12), pp. 2702–2726, © 2013 INFORMS 2715
testing affects the firm’s incentives to either expediteor delay the release of its software.
Proposition 5. Suppose both the internal and exter-nal bug detection rates and the strength of network effectsare not too large. Then, (i) if a software firm has highlymature development processes and the cost of processinguser-reported bugs is small, it will tend to optimally delayits product release as the size of the beta testing groupincreases; (ii) if the cost of processing user-reported bugs islarge, a firm will instead tend to release earlier.
Part (i) of Proposition 5 formalizes that when a firmwith high process maturity produces a high-qualityproduct and there are not many defects in the code,it should delay software release as the beta test sizeincreases. When there are few defects in the code, thefirm will not incur significant additional processingcosts as a result of user-reported bugs. However, itincurs testing costs at each moment while searchingfor these defects. As the size of the beta test increases,the firm faces a trade-off: it can release earlier toreduce its own testing cost while harnessing a largerbeta testing population for a shorter period of time orrelease later to utilize the larger beta testing popula-tion for a longer period of time, which improves qual-ity and reduces goodwill costs but also leads to highertesting costs. For a high-maturity firm, the trade-offdescribed above tilts toward the latter, and it prefers adelayed release strategy. For example, Blizzard Enter-tainment, a producer of very popular PC games, haslong been known for the high quality of their prod-ucts. Recently, they were in the beta testing phase ofthe third edition of one of their most successful role-playing games. During that phase, they announcedthat the beta test would be extended and the sizeof the beta testing group would also be increased,two moves that should be performed in lockstep fora high-maturity producer as suggested by part (i) ofProposition 5 (Hachman 2011).
On the other hand, when the processing of usererror reports is more costly, part (ii) of Proposition 5formally establishes that the firm can end beta test-ing and release its software earlier because (1) thegreater-sized beta testing population improves thequality of the software faster, enabling earlier release;and (2) releasing the software temporarily relieves theincurrence of processing costs, and adoption rampsup, giving the firm an opportunity to fix previouslydiscovered defects and reduce goodwill costs. Thishighlights the trade-off the firm faces between lowertesting costs and processing costs associated withincreased feedback from adopters; higher processingcosts incentivize the firm to focus more on lower-ing testing costs and increasing revenues throughan earlier release. Although firms of varying matu-rity are similarly affected when user error report-ing processing costs are higher, a firm with lower
maturity is more sensitive because its product is char-acterized by a much higher defect density. In partic-ular, such a firm both needs more help from the usertesters and has adoption that exhibits slower growth.Thus, the applicability of part (ii) of Proposition 5occurs for a wider range of processing costs; i.e., CP1u
can be much smaller for lower-maturity firms and stillinduce this net effect.
4.2. Optimal PricingIn the previous section, we examined a softwarefirm’s optimal release timing and profitability whenit utilizes release time as its primary lever to man-age adoption and error reporting. Next, we explorea setting where a software firm also has some pric-ing power, optimally selecting a single price to chargethroughout the selling horizon of the product. Thereare many instances where software firms prefer to setprice at an optimal level and keep it to a large extentat that level for the entire selling horizon. For exam-ple, over the past several years, the AutoCAD suiteand DivX video software bundle have been priced at$3,995 and $19.99, respectively, for a perpetual license,whereas WinEdt’s noncommercial single-user licensehas been priced at a steady $40 over the last decade.In this section, our aim is to better understand whatrole each lever plays to manage adoption and harnessthe benefits of error reporting. We denote the optimalprice chosen by the firm as p∗, which together withthe optimal release time satisfy
4t∗01 p∗5= arg max
t0∈6L4�51T 71 p>0ç4t01 p50
If error contributions from users are large andgoodwill costs are low, then implications from Propo-sition 1 expand to firms of all maturity; i.e., theytend to release immediately. When a firm releasesits software at the earliest time possible, i.e., t∗0 =
L4�5, it uses a two-pronged strategy. First, immediaterelease jump-starts adoption and permits error report-ing feedback earlier in the software’s life cycle. Sec-ond, the firm finds it profitable to price the software(and, implicitly, shape adoption) in a manner that canhelp prevent overexposure to lower initial quality. Inthis section we explore properties of the optimal pricein such scenarios. First, we examine the link betweenprice and the proportion of users � who report bugs.
Proposition 6. Suppose that the cost of processinguser error reports is not too high. Then,
(i) p∗ decreases in � for software produced by a high-maturity firm when CG/CP1u is high, and
(ii) p∗ increases in � for software produced by a lower-maturity firm with low goodwill costs and intermediateuser error detection rates (i.e., CG/6Y 4CT /441 −�5�5 −
4CP1u −CP1f 557 < ��u4Y 5 < b/44a+ b5mT 55.
INFORMS
holds
copyrightto
this
article
and
distrib
uted
this
copy
asa
courtesy
tothe
author(s).
Add
ition
alinform
ation,
includ
ingrig
htsan
dpe
rmission
policies,
isav
ailableat
http://journa
ls.in
form
s.org/.

August and Niculescu: The Influence of Software Process Maturity and Customer Error Reporting2716 Management Science 59(12), pp. 2702–2726, © 2013 INFORMS
For part (i) of Proposition 6, when software is pro-duced by a highly mature firm, it has fewer bugsat the release candidate stage. Given that the firm isperforming extensive testing across the entire code-base, if it can efficiently harness user contributions tohelp detect the bugs that remain, it has incentives toreduce its own internal testing. This strategy can beachieved by releasing early and pricing in a balancedway such that the installed base leads to a significantreduction in testing costs without severely impactingrevenue. The higher the user error reporting rate, thelower the optimal price is, because a larger resultinginstalled base is an effective substitute to internal test-ing; detection costs are outsourced to the user basewithout compromising quality. This effect is strongestwhen goodwill costs are high because, in this case,the potential benefits of faster quality improvementby harnessing users are the largest. Second, the costassociated with processing user error reports shouldnot be too high such that leveraging users remainseconomical.
Although our paper is normative in nature, webriefly present some suggestive evidence that ourfinding here can be supported. Over time, Microsoftdeveloped and improved Windows Error Reportingto harness consumer bug detections toward improv-ing quality (Glerum et al. 2009). Microsoft alsoreleased successive generations of products such asOffice Professional (i.e., 2000, XP, 2003, 2007, and2010). The suggested retail prices of these versions ofOffice Professional, as announced by Microsoft, were$599, $579, $499, $499, and $499, respectively, and forthe 2010 version, an alternative option to purchasethe product key card instead was made available for$349 (Microsoft 2001, 2007; Arar 2003; Meredith 2010).Given that Microsoft has high software maturity, partof its decreasing price trend over versions can beexplained by the substantial increase in error report-ing and its strategic outsourcing of its testing costs.
In contrast, for part (ii) of Proposition 6, whenquality is lower (i.e., higher bug density), if the firmreleases early, it has the potential to incur significantgoodwill costs and processing costs associated withuser reports. Clearly, a firm with low process maturitycharges less than a firm with high process matu-rity because of its reduced-quality product. How-ever, when the user error reporting rate increases,a lower-maturity firm prefers to restrict early adop-tion by raising its price slightly when goodwill costsare relatively limited in comparison to the processingcosts. Here, the level of user error reporting shouldbe within an intermediate range such that a changein the level has a stronger impact on the processingcosts that are incurred. In particular, when the usererror reporting rate is lower, an increase to the rateand its corresponding effect on processing costs can
be mitigated with a small increase in price while notsignificantly impacting goodwill costs and revenues.Consistent with traditional monopolistic settings, anincrease in the firm’s costs per user is compensatedthrough a higher price that allows the firm to retainhigh margins by serving in the beginning a reducedmass of adopters for whom its software is presumablymost critical while inducing a delay for other adoptersuntil quality further improves through bug detectionand resolution.
Proposition 7. For fixed market potential, supposethat the processing costs associated with user error reportsare not too high.
(i) When the firm has highly mature development pro-cesses and goodwill costs are relatively high,
(a) if increased functionality decreases the user com-munity’s contribution to the detection rate (i.e., �′
u4Y 5 < 0),then p∗ is increasing in Y ;
(b) if it increases the rate (i.e., �′u4Y 5 > 0), then p∗ is
decreasing in Y .(ii) When the firm has less mature development pro-
cesses and goodwill costs are small relative to the costsassociated with processing user error reports (i.e., CG/CP1u
is relatively low),(a) if the user detection rate is low and the impact of
increased functionality on the total contribution is negative(i.e., Y�′
u4Y 5+ �u4Y 5 < � < 0), then p∗ is decreasing in Y ;(b) if the user detection rate is relatively strong com-
pared with the marginal effect of increased functionality onthe rate (i.e., �u4Y 5/4Y�′
u4Y 55 > �> 0), then p∗ is increas-ing in Y .
Proposition 7 explores how pricing varies withfunctionality. When the firm has high maturity, as inpart (i), an increase in functionality is associated withrelatively fewer additional bugs. Above we foundthat when quality is high, reducing testing costs andleveraging a larger installed base tends to dominateincreased processing costs. Nevertheless, when theimpact of increased functionality on user detectionrates is negative and tends to limit the firm’s ability toleverage adopters, the increase in goodwill costs stem-ming from these additional flaws is the predominantfactor. Thus, the firm instead prefers to price higher,serve a smaller installed base, and limit goodwillcosts. Alternatively, if consumer usage rates increaseconsiderably with greater functionality and lead to anincrease in detection rates per bug, then the firm willfind it profitable to leverage the testing efforts of usersdespite higher processing and goodwill costs. In thiscase, the firm marks down its price to boost adoption,as we establish in part i(b) of Proposition 7.
When process maturity is lower, the effect of howuser contributions respond to a change in functional-ity has a much different impact on the firm’s pricing.Because of the magnitude of bugs, any benefits from
INFORMS
holds
copyrightto
this
article
and
distrib
uted
this
copy
asa
courtesy
tothe
author(s).
Add
ition
alinform
ation,
includ
ingrig
htsan
dpe
rmission
policies,
isav
ailableat
http://journa
ls.in
form
s.org/.

August and Niculescu: The Influence of Software Process Maturity and Customer Error ReportingManagement Science 59(12), pp. 2702–2726, © 2013 INFORMS 2717
Figure 4 Shape of Optimal Price Path in Software Functionality for a Firm with Lower Process Maturity
5 10 15 20–15
–5
5
15
25
35(a)A
:Y�
u� (Y
) +
�u
(Y)
B:�
u(Y
)/(Y�
u� (Y
))
Y
A
B
0 5 10 15 2018
20
22
24
26(b)
Y
p*
I
II
0–1.0
–0.6
–0.2
0.2
0.6
1.0
Notes. The parameter values are a = 6, b = 005, c = 10, � 4�5 = 241 − �5, � = 0073, w4p5 = e−001p , T = 4, �f = 0025, � = 3, � = 0009, m = 10, CT = 001,CG = 001, CD = 0005, CF = 0005, CP 1 f = 005, CP 1 u = 100, �u4Y 5= Y − 8 + 16Y −1, and Y ∈ 600051207.
leveraging users toward detecting bugs tend to bedominated by losses associated with processing userreports and goodwill costs. An increase in function-ality will exacerbate these costs. However, if such anincrease inhibits user error detection (i.e., its net effectis negative, as seen in the left-hand portion of curve Ain panel (a) of Figure 4), then the coupled reductionin processing costs can shift the balance so that thefirm can benefit by marginally increasing the installedbase. This scenario is illustrated in the left-hand por-tion (labeled I) of the p∗ curve in panel (b) of Figure 4.Here, the firm slightly reduces its optimal price tostimulate adoption and generate more savings fromoutsourced detection, as is established in part ii(a) ofProposition 7. In contrast, when an increase in func-tionality strengthens user contributions to detection,processing costs then increase, and the firm has incen-tives to increase price, thus limiting exposure to bothprocessing and goodwill costs. In panel (a), curve Bbecomes larger as Y increases and satisfies part ii(b)of Proposition 7 for sufficiently large Y . As a con-sequence, the optimal price increases in Y , which isillustrated in the right-hand portion of the price curve(labeled II) in panel (b).
5. Concluding RemarksWith the recent, rapid penetration of broadband Inter-net access, software firms and their customers nowinteract at a higher frequency and in more com-plex ways than before, especially after a product isreleased to the market. This modern structure enablesfirms to address software quality issues by leverag-ing both in-house developers and user/communityresources. In this paper, we present a model ofsoftware adoption to develop an understanding of
how firms, which vary in development characteris-tics such as software process maturity as well as inproduct characteristics including class and function-ality, should optimally adapt their release timing andpricing in order to harness the potential of customererror reporting. We study this issue in-depth in botha setting where the firm has limited ability to controlprice and a setting where it can optimally set its price.
In the former setting, we characterize relevantbounds on a firm’s software release time and relatethese bounds to the firm’s process maturity and itsproduct’s level of functionality. We then explore howconsumer feedback affects adoption dynamics and, inturn, the firm’s associated revenues and costs.
From our model and results, we generate severaltestable implications for future research. First, we findthat both a shorter product life cycle and a highersoftware process maturity can induce a firm to releaseearlier in time. However, a firm possessing lower pro-cess maturity and offering a product with a longer lifecycle has incentives to delay its release. Second, whenthe additional processing cost stemming from userbug reports is not too high in comparison to goodwillcosts, a firm should release its product earlier whenthe proportion of users agreeing to participate inerror reporting increases. Firms with higher process-ing costs relative to goodwill costs and limited usercontributions should delay release instead. Third, wefind that whether a firm delays release in response toadded functionality critically depends on the extent towhich detection contributions coming from the com-munity adjust in response to this functionality. Impor-tantly, the nature of the effect seems to be oppositedepending on whether a firm has high or low processmaturity. For example, if increased functionality tends
INFORMS
holds
copyrightto
this
article
and
distrib
uted
this
copy
asa
courtesy
tothe
author(s).
Add
ition
alinform
ation,
includ
ingrig
htsan
dpe
rmission
policies,
isav
ailableat
http://journa
ls.in
form
s.org/.
August and Niculescu: The Influence of Software Process Maturity and Customer Error Reporting2718 Management Science 59(12), pp. 2702–2726, © 2013 INFORMS
to dilute per-module detection contributions, then ahighly mature firm should further delay release asit increases functionality, whereas a less mature firmhas greater incentives to expedite release and har-ness these contributions earlier. Fourth, we find sim-ilar results related to beta testing. As the size of thebeta test increases, firms with higher process maturitytend to delay. Finally, when a firm can set a single,optimal price, we find that comparative statics of theproportion of user participation in error reporting andsoftware functionality on the firm’s price align wellwith our comparative statics on release time (i.e., p∗
moves in the same direction as t∗0 , for similar reasons).In this paper, we construct a model while making
some simplifying assumptions for tractability. First,for simplicity, we assume that debugging is perfect,which is to say that new bugs are not introduced intothe code as part of the debugging process. Althoughthe introduction of new bugs can certainly happen,it is generally true that software quality improvesover time because of patching, even with this smallrisk. Our results in this paper would be quite robustto imperfect debugging, provided that debugging ismostly effective. Second, we take a simpler view thatpatches are released as soon as the vendor has a patchavailable; in reality, when patches are released (eitherwillingly or by threat of disclosure) and when they areapplied (if ever) by users is a complex topic in its ownright and extensively studied in the vulnerability dis-closure literature (see August and Tunca 2006, 2008,2011; Cavusoglu et al. 2007, 2008; Arora et al. 2008).One possible future extension could be to explore thislink between vulnerability disclosure and a vendor’sproduct release time and pricing.
There are a number of directions to build on ourmodel and results. One interesting extension is toexamine bugs of varying degrees of severity. In thiscase, the firm would remediate the varying classesof bugs at different rates. In a preliminary numer-ical study, we found that the firm indeed spendsmore energy on fixing more severe bug classes, but italso concurrently delays release as the proportion ofbugs in the severe class increases. Another directionto explore is studying software producers who chooseto offer small functionality updates in addition tosecurity patches over time. Although extensive func-tionality updates would generally be reserved for thenext major release, one can explicitly study a firm’sdecision on how much functionality to build into aproduct by release, how much additional function-ality to add to it later while already released, andwhen to release the next version; all of these deci-sion problems can be grouped together as part of anintegrated study on upgrade cycles. One limitationof our study is that we focus strictly on release time
and price. More broadly, a firm may undertake strate-gies to adjust the level of user error reporting, such astemporarily throttling contributions from users whendetected but unresolved bugs become backlogged andresources are limited. Developing an understandingof this broader decision problem is an interestingdirection for future research.
Since we employ a diffusion model, demand isaggregated at the market level, and we do not layout the decision-making process of individual con-sumers. That being said, a subsequent extension toour work can be to take a utility-based approachand incorporate customer error reporting, release tim-ing, pricing, and adoption. Although making analyt-ical progress with a continuous-time model in thistype of approach would be difficult, such an exten-sion can yield valuable additional insight into theway a software market is strategically grown. Finally,future studies might also examine competition andsubscription-based revenue schemes.
AcknowledgmentsThe authors thank Lorin Hitt (the department editor),the associate editor, and the anonymous reviewers fortheir helpful suggestions throughout the review process.The authors also thank Özge Islegen, Sunil Kumar, DavidLowsky, Noam Shamir, Hyoduk Shin, Seungjin Whang,Gad Allon, and Sandra Slaughter; the participants at theINFORMS 2011 Annual Meeting and the Workshop on In-formation Systems and Economics 2011; as well as the par-ticipants in research seminars at Stanford University, theUniversity of North Carolina at Chapel Hill, the Univer-sity of Michigan at Ann Arbor, London Business School,INSEAD, Singapore Management University, Hong KongUniversity of Science and Technology, Georgia Institute ofTechnology, the University of Texas at Dallas, the Univer-sity of Southern California, the University of Minnesota,and Northwestern University for their discussions and com-ments on various drafts of this paper. This material is basedon work supported by the National Science Foundation[Grant CNS-0954234].
Appendix. Proofs of PropositionsBefore proceeding with the proofs of the proposition state-ments, we start by proving a few useful lemmas. First, wedefine the following quantities:
gD4t54= B− 4B− D54b+ ae4a+b54t−t05w5−m��u/4bw5
× e−t0�f +4m��u/4bw554a4t−t05w+log4a+b551 (17)
gB4t54= B− gD4t51 (18)
gN 4t54=m
(
1 −a+ b
b+ ae4a+b54t−t05w
)
0 (19)
Lemma A1. Suppose c = �c� and � = ��/�, where �c , �� ,� > 0. Then, there exists � > 0 and functions MD4t51MB4t51MN 4t5 > 0 such that if �< �, then gD4t5−D4t5 < �MD4t5, B4t5−gB4t5 < �MB4t5, and gN 4t5−N4t5 < �MN 4t5 for t0 < t ≤ T .
INFORMS
holds
copyrightto
this
article
and
distrib
uted
this
copy
asa
courtesy
tothe
author(s).
Add
ition
alinform
ation,
includ
ingrig
htsan
dpe
rmission
policies,
isav
ailableat
http://journa
ls.in
form
s.org/.

August and Niculescu: The Influence of Software Process Maturity and Customer Error ReportingManagement Science 59(12), pp. 2702–2726, © 2013 INFORMS 2719
Proof of Lemma A1. To begin, we examine an adapteddynamical system with state trajectories denoted by Da4t5,Ba4t5, and Na4t5. For this adapted system, bugs are resolvedimmediately upon detection, i.e., Ba4t5= B−Da4t5, and thereare no negative quality effects on adoption such that Da4t5and Na4t5 solve
¡Da4t5
¡t= �Na4t5�u4Y 54B−Da4t551
¡Na4t5
¡t= 4m4Y 5−Na4t55
(
a+ bNa4t5
m4Y 5
)
w4p50
It is straightforward to show that Da4t5 = gD4t5, Ba4t5 =
gB4t5, and Na4t5 = gN 4t5, as defined in Equations (17)–(19),solve this adapted dynamical system. Next, we show thatthe difference between this solution and the solution to thedynamical system in (13) is O4�5 as � becomes small. First,we examine how the adoption process would behave ifnone of the bugs had been resolved yet to obtain a lowerbound on the real adoption process N4t5. We denote thisprocess as N 4t5, which satisfies (4) with B4 · 5 = B in thatequation. Given t0, we denote the fraction of the total mar-ket potential that adopted before t with F 4t5
4= N 4t5/m4Y 5.
Then, if we define f 4t � t054= 4¡F /¡t54t � t05, by (4), it follows
that f 4t5/41 − F 4t55 = 4a − cB/Y + bF 4t55w, with F 4t05 = 0.This is a Riccati partial differential equation with solutionF 4t5= 1 + 1/�4t5, where �4t5= ew4a−cB/Y+b5t4−e−w4a−cB/Y+b5t0 +
wb∫ t
t0e−w4a−cB/Y+b5k dk50 Hence, we obtain N 4t5 = 0 if t < t0
and N 4t5 = mF 4t5 if t ≥ t0. In particular, for t ≥ t0, aftersimplifications,
N 4t5=m
(
1 −a− cB/Y + b
b+ 4a− cB/Y 5e4a−cB/Y+b54t−t05w
)
0 (20)
By (20), as � becomes small, N 4t5 satisfies
N 4t5 = gN 4t5+�c�Bm4b− 4b+ a4a+ b54t − t05w5e4a+b54t−t05w5
4b+ ae4a+b54t−t05w52Y
+O4�25 (21)
for t ≥ t0. Following a similar logic, we define N 4t5 as satis-fying (4) with B4 · 5 = 0 to obtain an upper bound for N4t5.By (19) and (20), it follows that
N 4t5= gN 4t50 (22)
Suppose B4t5 ≥ B4t5 for all t ∈ 6t01T 7. We will estab-lish that N 4t � B4 · 55 and N 4t � B4 · 55 solving (4) satisfyN 4t � B4 · 55 ≤ N 4t � B4 · 55. Defining ã4t5
4= N 4t � B4 · 55 −
N 4t � B4 · 55, this inequality is equivalent to ã4t5 ≥ 0. Sup-pose toward contradiction that ã4t5 < 0 for some t ∈
4t01T 7. Because ã4t05= 0, ã′4t05 ≥ 0, and ã4 · 5 is contin-uous, t
4= sup8t ∈ 4t01 t5 �ã4t5= 09 exists. However, because
ã′4t5 ≥ 0, t cannot be the supremum. Hence, there is acontradiction, and we conclude that ã4t5 ≥ 0, and thusN 4t � B4 · 55 ≤ N 4t � B4 · 55 for all t ∈ 6t01T 7. It immediatelyfollows that N4t5 solving (13) satisfies N 4t5 ≤ N4t5 ≤ N 4t5,and by (21) and (22), there also exists MN 4t5 > 0 such that4gN 4t5−N4t55/MN 4t5 < � as � becomes small.
By (1) and (2), D4t5 satisfies ¡D4t5/¡t = �N4t5�u ×
4B−D4t55 for t ∈ 6t01T 7. Solving for D4t5, we obtain
D4t5= B− 4B−D4t055e−∫ tt0
��uN4s5ds1 (23)
from which we can explore how an arbitrary adoption pro-cess N 4t5 affects detection D4t5 conditional on that adoptionprocess. From this relationship, we can provide bounds onthe actual detection process D4t5. By (23), it becomes clearthat if N14t5 ≥ N24t5 for all t ∈ 6t01T 7, then D4t � N14t55 ≥
D4t � N24t55. Because N 4t5 ≤ N4t5 ≤ N 4t5, it follows thatD4t � N 4t55≤D4t5≤ D4t � N 4t55. By (20) and (23), we obtain
D4t � N 4t55 = B− 4B− D54Bc− 4a+ b5Y 5m��u/4bw5
×(
−bY + 4Bc− aY 5e4t−t05w44a+b5Y−Bc5/Y)
× e−t0�f +m��u4t−t054aY−Bc5/4bY 50 (24)
By (24), as � becomes small, D4t � N 4t55 satisfies
D4t � N 4t55= gD4t5− �KD4t5+O4�251 (25)
where
KD4t54=
B�cm4B− D5e−t0�f +am��u4t−t05/b
4ae4a+b5tw + be4a+b5t0w4p55w
× 4Y 4a+ b55−1+m��u/4bw5��u
× 4Y 4b+ ae4a+b54t−t05w55−m��u/4bw5
×(
−e4a+b5tw+ e4a+b5t0w41 + 4a+ b54t − t05w5
)
0
Similarly, for D4t � N 4t55, we obtain
D4t � N 55= gD4t50 (26)
Thus, by (25) and (26), and because D4t � N 4t55 ≤ D4t5 ≤
D4t � N 4t55, we conclude that there exists MD4t5 > 0 suchthat 4gD4t5−D4t55/MD4t5 < � as � becomes small.
Finally, solving (3), B4t5 satisfies
B4t5= e−�4t−t05B4t05+ e−�t∫ t
t0
�e�s4B−D4s55 ds3 (27)
hence, if D14t5 ≥ D24t5 for all t ∈ 6t01T 7, then B4t � D14t55 ≤
B4t � D24t55. Because D4t � N 4t55 ≤ D4t5 ≤ D4t � N 4t55, it fol-lows that B4t � D4t � N 4t555 ≤ B4t5 ≤ B4t � D4t � N 4t555. By (26)and (27), we obtain
e−�4t−t05B4t05+ e−�t∫ t
t0
�e�s4B− gD4s55 ds
≤ B4t5≤ e−�4t−t05B4t05+ e−�t∫ t
t0
�e�s4B− D4s � N 4s555 ds1
which upon subtraction can be rewritten as
0 ≤ B4t5− e−�4t−t05B4t05− e−�t∫ t
t0
�e�s4B− gD4s55 ds
≤ e−�t∫ t
t0
�e�s4gD4s5− D4s � N 4s555 ds0 (28)
By (25) and the right-hand side of (28), there exists KD >supt∈6t01T 7
KD4t5 such that as � becomes small,
e−�t∫ t
t0
�e�s4gD4s5− D4s � N 4s555 ds
≤ e−�t∫ t
t0
�e�s�KD ds = KD�41 − e−4��/�54t−t055≤ KD�0 (29)
INFORMS
holds
copyrightto
this
article
and
distrib
uted
this
copy
asa
courtesy
tothe
author(s).
Add
ition
alinform
ation,
includ
ingrig
htsan
dpe
rmission
policies,
isav
ailableat
http://journa
ls.in
form
s.org/.

August and Niculescu: The Influence of Software Process Maturity and Customer Error Reporting2720 Management Science 59(12), pp. 2702–2726, © 2013 INFORMS
Examining the middle expression in (28), and integratingby parts, we obtain
B4t5− e−�4t−t05B4t05− e−�t∫ t
t0
�e�s4B− gD4s55 ds
= B4t5− B+ gD4t5+ 4B−B4t05− gD4t055e−4��/�54t−t05
−
∫ t
t0
e−4��/�54t−s5g′
D4s5 ds0 (30)
By (28), (29), and (30), it follows that as � becomes small,there exists MB4t5 such that B4t5 − gB4t5 < �MB4t5, whichcompletes the proof. �
Lemma A2. aw4T − t05+ log44a+ b5/4b+ ae4a+b54T−t05w55 <0 < 4a + b5w4T − t05 + log44a+ b5/4b+ ae4a+b54T−t05w55 for allt0 ∈ 601T 5.
Proof of Lemma A2. Left-hand inequality: Let h4b5 =
aw4T − t05+ log4a+ b5− log4b + ae4a+b54T−t05w5. By differenti-ation, we obtain
h′4b5=1
a+ b−w4T − t05−
1 − bw4T − t05
b+ ae4a+b54T−t05w0
Note that h′4b5 < 0 if and only if −1 + e4a+b54T−t05w41 −
4a + b54T − t05w5 < 0. Defining x = 4a + b54T − t05 ·
w > 0, h′4b5 < 0 ⇔ −1 + ex41 − x5 < 0. Defining j4x5 = −1 +
ex41 − x5, we obtain j ′4x5 = −xex < 0 for all x > 0. Becausej405= 0, it follows that j4x5 < 0 for all x > 0; hence, h′4b5 < 0.Similarly, h405 = 0; therefore h4b5 < 0 for all b > 0, whichproves the result.
Right-hand inequality: We have
¡4h4b5+ bw4T − t055
¡w=
b4a+ b54T − t05
b+ ae4a+b54T−t05w> 00
Moreover, 4h4b5 + bw4T − t05�w=0 = 0. Thus, h4b5 + bw ·
4T − t05 > 0. �
Proof of Lemma 1. (i) Monotonicity of N with respect to t0.Let � be chosen such that the conditions of Lemma A1are satisfied. Then, by (19) and Lemma A1, it follows thatN4t5 = m41 − 4a+ b5/4b+ ae4a+b54t−t05w55+ �gN 4t5+O4�25. ByLemma A1, gN 4t5 (and corresponding terms gD4t5 and gB4t5)can be shown to satisfy
¡gN 4t5
¡t= −
�cw4B− gD4t554m− gN 4t55
Y
+wgN 4t54m4b− a5− 2bgN 4t55
m1
¡gD4t5
¡t= −��u4gD4t5gN 4t5+ gN 4t54gD4t5− B551
gB4t5 = −g′B4t5+�� gD4t5
��
1
(31)
by taking a Taylor’s series expansion of (13) and subse-quently equating terms, where gN 4t05 = 0 and gD4t05 = 0.System (31) shows how c and � affect D4t5, B4t5, and N4t5through �c and �� . Differentiating N4t5, we obtain
¡N
¡t04t � t01 · 5 = −
amw4p54a+ b52e4a+b54t−t05w
4b+ ae4a+b54t−t05w52
+ �¡gN
¡t04t � t01 · 5+O4�25 < 0
for small enough �.
Monotonicity of N with respect to p. Let us consider(0<) p1 < p2. Then we have w4p15 > w4p25. At t0, we haveN4t0 � t01p11·5=N4t0 � t01p21·5=0 and ¡N/¡t4t0 � t01 p11·5>¡N/¡t4t0 � t01p21·5. Therefore, in the vicinity of t0, N4t � t0,p11 · 5 > N4t � t01 p21 · 5. Defining ãN1p4t � p11 p25
4= N4t � t01
p11 · 5 − N4t � t01 p21 · 5, we have ã′N1p4t0 � p11 p25 > 0 and
ãN1p4t0 � p11 p25= 0.Suppose that at some point � > t1 > t0, the curves cross
each other. Let t1 = inf8t � t > t0 and ãN1p4t � p11 p25 = 09.Then, ãN1p4t5 > 0 for t ∈ 4t01 t15. Since after release alldetections come from users and one adoption path strictlydominates another at all points, obviously more bugs getdetected under p1 than p2, and thus, more bugs are alsogetting fixed (since bugs are getting fixed at a constantrate out of the pool of known but still resident bugs);i.e., B4t � p15 ≤ B4t � p25. Consequently, it is easy to see thatã′
N1p4t1 � p11 p25 > 0. Thus, if the curves cross at t1, then itmust be the case that there exists � such that ãN1p4t � p11 p25< 0 for t ∈ 4t1 − �1 t15. This is a contradiction. Thus,N4t � t01 p11 · 5 >N4t � t01 p21 · 5 for all t > t0.
(ii) There are two cases. First, suppose t = t0 + Kt�,where Kt > 0. By Lemma A1 and (31), differentiatingN4t5, we obtain ¡N4t5/¡Y = awKtm
′4Y 5� + O4�25. Hence,¡N4t5/¡Y > 0 for sufficiently small �. On the other hand,suppose t > t0, and t does not converge to t0 as �becomes small. In this case, we similarly obtain ¡N4t5/¡Y =
m′4Y 541 − 4a+ b5/4b+ ae4a+b54t−t05w55 + �4¡gN 4t5/Y 5 + O4�25,yielding the same conclusion. Thus, there exists � such thatif �< �, N4t5 is increasing in Y . �
Proof of Proposition 1. Substituting (10) and (11) into(9) yields
ç4t01 p5
= pN4T 5−CP1f 4B− D541 − e−�f t0 5
−4CF +�fCD5444B�f −D�5/�541−e−t0�5−4B−D541−e−t0�f 55
�f −�
−CT �fYt0 −
∫ T
t0
4CF +��uN4t5CD54D4t5− B+B4t55 dt
−
∫ T
t0
N4t5
(
CGB4t5
Y+CP1u��u4B−D4t55
)
dt0 (32)
Differentiating (32), we compute the derivative as
¡ç4t01 · 5
¡t0
= p¡N
¡t04t � t01 · 5
∣
∣
∣
t=T−
CP1f �f 4B− D5
e�f t0
−4CF + �fCD5e
−t04�f +�54−4B− D5et0��f + et0�f 4B�f − D�55
�f − �
−CT �fY +
∫ T
t0
¡N4t � t05
¡t0
(
−CP1u��u4B−D4t55−��uCD4D4t5
− B+B4t55−CGB4t5
Y
)
dt
−
∫ T
t0
¡D4t � t05
¡t04CF +��uN4t54CD −CP1u55 dt
−
∫ T
t0
¡B4t � t05
¡t0
(
CF +��uN4t5CD +CG
YN4t5
)
dt0 (33)
INFORMS
holds
copyrightto
this
article
and
distrib
uted
this
copy
asa
courtesy
tothe
author(s).
Add
ition
alinform
ation,
includ
ingrig
htsan
dpe
rmission
policies,
isav
ailableat
http://journa
ls.in
form
s.org/.

August and Niculescu: The Influence of Software Process Maturity and Customer Error ReportingManagement Science 59(12), pp. 2702–2726, © 2013 INFORMS 2721
Setting c = �c� and � = ��/� as in the conditions ofLemma A1 and substituting the result from Lemma A1into (33), it follows that for sufficiently small �,
¡ç4t01 · 5
¡t0
=1
Y��u×
[
−aA21e
2A2+t0�f m4Y 5pwY��u −CT et0�f Y 2��f �u
+ 4B− D5�f 4CG + 4CP1u −CP1f 5Y��u5
+A
1+4m��u5/4bw51 4B− D54CG +CP1uY��u5e
A2+4am4T−t05��u5/b
a+ b
× 4−4a+ b5�f cosh4A25+ 4−4a− b5�f + 2am��u5
× sinh4A255
]
+O4�51 (34)
where A1 = G14t05, A2 = G24t05. First, note that CT et0�f ·
Y 2��f �u > 4B − D5�f 4CG + 4CP1u − CP1f 5Y��u5 is satis-fied if and only if t0 > 41/�f 5 log444B − D54CG + 4CP1u −
CP1f 5 · Y��u55/4CT Y2��u550 Similarly, −4a + b5�f cosh4A25 +
4−4a−b5�f +2am��u5×sinh4A25 < 0 if and only if �f ≥m��uor both �f <m��u and
T −log41 + 4a+ b5�f /4a4m��u − �f 555
4a+ b5w< t00
Thus, when t0 > 41/�f 5 log444B − D54CG + 4CP1u − CP1f 5 ·
Y��u55/4CT Y2��u55 and either �f ≥m��u or both �f <m��u
and
T −log41 + 4a+ b5�f /4a4m��u − �f 555
4a+ b5w< t0
are satisfied, by (34), it follows that ¡ç4t01 · 5/¡t0 < 0.This, together with constraint t0 ≤ T and the definitionof H4Y 1�1p5 presented in the statement of the proposi-tion, completes the proofs of parts (i) and (ii). Second,evaluating (34) at t0 = T , we obtain 4¡ç4t01 · 5/¡t05�t0=T =
−ampw−CT Y�f −4B−D5CP1f �f e−T �f +O4�5 < 0, from which
it follows that there exists TH < T such that t∗0 < TH . There-fore, by (34) and the definition of g4 · 5 given in the propo-sition statement, t∗0 =ë +O4�5 follows immediately. �
Proof of Proposition 2. In addition to the conditions ofLemma A1, let �u = �u�. Then, for sufficiently small �, byLemma A1 and (33) in the proof of Proposition 1, we obtain
¡ç4t01 · 5
¡t0=
e−t0�f
Y4q04T 5+ q14T 55+O4�51 (35)
where
q04T 54= −et0�f 4ampwYA2
1e2A2 −CT Y
2�f 51
q14T 54= 4B− D5
(
−CP1fY�f
+CGm
(
1 −A1 −a4T − t05�f
b−
�f
bwlog4A15
))
0
Differentiating q04T 5 and q14T 5, we obtain q′04T 5 = aA3
1 ·
e2A2+t0�f mpw2Y 4ae2A2 − b5 and q′14T 5 = 4B − D5aCGmA1 ·
44�f 4e2A2 − 155/4a + b5 + e2A2A1w4a + b55. Define q4T 5
4=
q04T 5 + q14T 5. Because a > b, q′04T 5 > 0 and q′
14T 5 > 0
are satisfied; hence, q4 · 5 is increasing in T . Noting thatq4T 5�T=t0
= −CP1fY�f 4B − D5 − Y 4ampw + CT Y�f 5et0�f < 0
and, by Lemma A2, limT→� q4T 5 > 0, T 4t05 = 8T 2 q4T 5 =
0 � t09 exists and is unique. Therefore, ¡2ç4t01 · 5/¡t0¡T > 0;hence, T 4 · 5 is increasing in t0. Defining T = T 405, whichis characterized in (14), if T < T , then q4T 5 < 0 for all t0 ∈
601T 7. Therefore, by (35), ¡ç4t01 · 5/¡t0 < 0 for all t0 ∈ 601T 7for sufficiently small �, and hence t∗0 = L, which proves part(i). For part (ii), suppose T > T . Then, when t0 = 0, q4T 5 > 0;hence, t∗0 >L for sufficiently small �. By (14),
CP1fY�f −CGm
(
1−aT �f
b+�f 4log4b+ae4a+b5Tw5−log4a+b55
bw
−a+b
b+ae4a+b5Tw
)
<00
Because of this fact and q′4T 5 > 0, it immediately followsthat as 4B − D5 decreases, T increases. Because B − D =
41 − �5�4�5Y and � ′4�5 < 0, the same result holds as �increases. Finally, taking an implicit derivative of (14) andsubstituting from (14) as well, we obtain
dT
dY=(
�f 4CT +CP1f 41−�5�4�554b+aJ 534m4Y 5−Ym′4Y 55)
×(
am4Y 5244a+b53pw2J 4aJ −b5+CG�4�541−�54b+aJ 5
×4�f 4b+aJ 54J −15+wJ 4a+b5255)−1
1 (36)
where J = e4a+b5Tw . Because J > 1 and a > b, by (36), weobtain dT /dY > 0, which completes the proof. �
Proof of Proposition 3. Using TH , whose existence isproven at the end of the proof of Proposition 1, let �
4=
min4TH1H4Y 1�1p55. By Lemma A1 and following the proofof Proposition 1, for sufficiently small �, we can differentiate(33) to obtain
¡2ç4t01 · 5
¡t0¡�=
4b+ ae2A2 5−m��u/4bw54B− D5e−t0�f
bwY�2�u4ae4a+b5Tw + be4a+b5t0w5
×Q�4t05+O4�51 (37)
where Q� is characterized in (15), with � taking the place oft0 for clarity in the proposition statement. Depending on thesign of Q�, we can use the increasing differences propertyto infer the monotonicity of t∗0 with respect to �. Note thatQ� is linear in both CG and CP1u and hence can be written as
Q� =K�GCG +K�
P1uCP1u1 (38)
where
K�G
4= �f
e4a+b5wt0 4a+ b51+m��u/4bw5
A1
(
−bwA−m��u/4bw51
+ eam4T−t05��u/b(
bw−m��u4aw4T − t05+ log4A155))
+ 2am2�2�2u sinh4A25e
A2+4a+b5wt0+4am4T−t05��u5/b
× 4a+ b5m��u/4bw54aw4T − t05+ log4A1551 (39)
K�P1u
4= 4aw4T − t05+ log4A155×
(
−4a+ b5�f cosh4A25
+ 4�f 4b− a5+ 2am��u5 sinh4A25)
+ 2baw sinh4A250
By the definition of A1 and Lemma A2, it follows thataw4T − t05+ log4A15 < 0. Therefore, if −4a+ b5�f cosh4A25+4�f 4b − a5 + 2am��u5 sinh4A25 < 0, then K�
P1u > 0. This
INFORMS
holds
copyrightto
this
article
and
distrib
uted
this
copy
asa
courtesy
tothe
author(s).
Add
ition
alinform
ation,
includ
ingrig
htsan
dpe
rmission
policies,
isav
ailableat
http://journa
ls.in
form
s.org/.

August and Niculescu: The Influence of Software Process Maturity and Customer Error Reporting2722 Management Science 59(12), pp. 2702–2726, © 2013 INFORMS
inequality can be rewritten as
m��u�f
<4a+ b5 cosh4A25− 4b− a5 sinh4A25
2a sinh4A251
whose right-hand side is increasing in t0, from which it fol-lows that a sufficient upper bound on 4m��u5/�f to ensureK�
P1u > 0 is as stated in part (i) of this proposition. In thiscase, by (38) and since K�
P1u > 0, Q� > 0 is satisfied when-ever K�
G ≥ 0. If K�G < 0, then Q� > 0 provided that CG/CP1u <
inf8−K�P1u/K
�G2 t0 ∈ 601H4Y 1�1p579. This completes the proof
of part (i).For part (ii), by (39), K�
G is linear in �f and can be ex-pressed as K�
G =K�G10 +K�
G11�f where K�G10 and K�
G11 are givenin (39). By Lemma A2, K�
G10 < 0. Examining K�G11, we have
K�G11 < 0 if and only if 0 > e4am4T−t05��u5/br4t05, where r4t5
4=
bw − m��u4aw4T − t5 + log4A155 − bw4A1eaw4T−t55−4m��u5/4bw5.
Moreover,
r ′4t05=abwm��uA14−1 + e2A2 5
a+ b4−1 + 4A1e
aw4T−t055−m��u/4bw550
From Lemma A2, it immediately follows that4A1e
aw4T−t055−m��u/4bw5 > 1; hence, r ′4t05 > 0. Since r4T 5 = 0,we have r4t05 < 0 for all t0 ∈ 601T 5; hence, K�
G11 < 0. BecauseK�
G11 < 0 and K�G10 < 0, it follows that K�
G < 0, and hence,by (38), Q� < 0 provided CG/CP1u > sup8−K�
P1u/K�G2 t0 ∈
601H4Y 1�1p579. This completes the proof. �
Proof of Proposition 4. Using TH , whose existence isproven at the end of the proof of Proposition 1, let �
4=
min4TH1H4Y 1�1p55. By Lemma A1 and following the proofof Proposition 1, we can differentiate (33) to obtain
¡2ç4t01 · 5
¡t0¡Y=QY 4t05+O4�5 (40)
for sufficiently small �, where
QY 4t054= �4�541−�5e−t0�f 4KY
GCG+KYP1uCP1u−�fCP1f 5−�fCT 1
and
KYG
4=
�′u4Y 5
�u4Y 52×(
KYG10 +KY
G11 ×(
4ae2A2 + b5�f
− am��u4Y 54e2A2 − 15)
�u4Y 5)
1
KYP1u
4= KY
P1u10 +KYP1u11
×Y�′u4Y 5
(
−�f +am�A14e
2A2 − 15a+ b
× �u4Y 5
)
+KYP1u12 ×
(
�u4Y 5+Y�′u4Y 5
)
1
with KYG10
4= �fZ2/�, KY
G114= −mZ1A1Z3/44a + b5bw5,
KYP1u10
4= −�fZ2, KY
P1u114= Z3m�Z1/4bw5, KY
P1u124= am� ·
A1Z34e2A2 − 15/4a+ b5, Z1
4= a4T − t05w + log4A15, Z2
4= −1 +
Z3, and Z34=A
m��u4Y 5/4bw51 eam4T−t05��u4Y 5/b . It can be shown that
KYG10 < 0, KY
G11 > 0, KYP1u10 > 0, KY
P1u11 < 0, KYP1u12 > 0, Z1 < 0,
Z2 < 0, and Z3 ∈ 40115.In proving the results, we use Topkis’s monotonicity
theorem. When � is sufficiently low, if QY is positive every-where, then t∗0 is increasing in Y . Otherwise, if QY is nega-tive everywhere, then t∗0 is decreasing in Y .
(i(a)) For any level of maturity �, if �f and CP1u aresmall enough, the monotonicity depends on the sign
of KYG , which can be rewritten as KY
G = �′u4Y 544Z2/�+KY
G11 ·
4ae2A2 + b5�u4Y 55�f /�u4Y 52 − am�KYG114e
2A2 − 1550 DefineZ4
4= A
m�/4bw51 e4am4T−t05�5/b ∈ 40115. Note that Z3 = Z
�u4Y 54 . Let
�4�54= −1/� + Z�
4 41/� − �Z1m/4bw55. Then, �4�u4Y 55 =
Z2/� + KYG114ae
2A2 + b5�u4Y 5. Note that �′4�5 =
−Z�4 4mZ15
2��/4bw52 < 0 for any � > 0. Moreover, �405 = 0.Consequently, for any �u4Y 5 > 0, Z2/� + KY
G114ae2A2 + b5 ·
�u4Y 5 < 0. Thus, KYG (and, hence, QY ) has the sign opposite
to that of �′u4Y 5. In particular, when �′
u4Y 5 < 0, then t∗0 isincreasing in Y .
(i(b)) If �f is not too small, and the maturity of the firm ishigh, then �4�5 is small, and −�fCT is the dominating termin QY . Thus, QY < 0, and t∗0 is decreasing in Y .
(ii(a)) When CP1u is high and CG and maturity are low,then the monotonicity depends on the sign of KY
P1u, whichcan be rewritten as
KYP1u =
(
1 −Z3
(
1 +Z1m��′
u4Y 5Y
bw
))
�f +am�A14e
2A2 − 15a+ b
×Z3Y�′
u4Y 5�u4Y 5
(
mZ1
bw+
1�u4Y 5
+1
Y�′u4Y 5
)
0
Suppose that �′u4Y 5 < 0 and �Y�′
u4Y 5� is high enough. Giventhat �u4Y 5 is upper bounded, this condition can be simplyexpressed as Y�′
u4Y 5 + �u4Y 5 < � < 0 with � high enough.Given that Z3 ∈ 40115 depends directly only on �u4Y 5 andnot on Y and �′
u4Y 5, it follows that the coefficient of �fin KY
P1u, i.e., 1 − Z341 + Z1m��′u4Y 5Y /4bw55, can become
negative for high enough ��′u4Y 5Y � given that �u is upper
bounded. In such regions, if �f is large enough, then QY < 0,and thus, t∗0 is decreasing in Y .
(ii(b)) If �u4Y 5 is very high, then since Z4 ∈ 40115, Z3 =
Z�u4Y 54 and Z3�u4Y 5 become very small. In this case, KY
P1u
will be close to �f > 0. In such a scenario, t∗0 is increasingin Y . �
Proof of Proposition 5. Adapting (10) and (11) toinclude the contribution to the detection rate from beta test-ing, we obtain D4t5= B+ 4D− B5× e−4�f +��uNB 5t and
B4t5=�4B− D5e−4�f +��uNB 5t + 4D� − B4�f +��uNB55e
−�t
� − 4�f +��uNB5
over t ∈ 601 t07. Accounting for user participation duringbeta testing prior to release, the processing cost and fixingcost become
PC =
(
�f
�f +��uNB
×CP1f +��uNB
�f +��uNB
×CP1u
)
4B− D5
× 41 − e−4�f +��uNB 5t0 5+CP1u��u
∫ T
t0
N4t54B−D4t55 dt1
FC =4CF + 4�f +��uNB5CD5
4�f +��uNB5− �
(
B�f − D�
�41 − e−t0�5
− 4B− D541 − e−t04�f +��uNB 55
)
+
∫ T
t0
4CF +��uN4t5CD5× 4D4t5− B+B4t55 dt0
INFORMS
holds
copyrightto
this
article
and
distrib
uted
this
copy
asa
courtesy
tothe
author(s).
Add
ition
alinform
ation,
includ
ingrig
htsan
dpe
rmission
policies,
isav
ailableat
http://journa
ls.in
form
s.org/.

August and Niculescu: The Influence of Software Process Maturity and Customer Error ReportingManagement Science 59(12), pp. 2702–2726, © 2013 INFORMS 2723
Substituting the adjusted expressions for B4t5, D4t5, PC, andFC into (9) yields
ç4t01p5 = pN4T � ·5−CT �fYt0 −
(
�fCP1f
�f +��uNB
+��uNBCP1u
�f +��uNB
)
×4B−D541−e−4�f +��uNB 5t0 5−
(
4CF +4�f +��uNB5CD5
×
(
B�f −D�
�41−e−t0�5−4B−D541−e−t04�f +��uNB 55
))
×(
4�f +��uNB5−�)−1
−CP1u��u
∫ T
t0
N4t54B−D4t55dt
−
∫ T
t0
4CF +��uN4t5CD54D4t5−B+B4t55dt
−CG
Y
∫ T
t0
N4t5B4t5dt1 (41)
where D4t5, B4t5, and N4t5 solve the dynamical system in(13) over t ∈ 6t01T 7, with adjusted initial conditions
D4t05= B+D− B
e4�f +��uNB 5t01
B4t05=�4B− D5e−4�f +��uNB 5t0 + 4D� − B4�f +��uNB55e
−�t0
� − 4�f +��uNB51
and N4t05= 0. Differentiating (41), we obtain
¡ç4t01·5
¡t0
=p¡N
¡t04t � t01·5
∣
∣
∣
t=T−CT �fY −4�fCP1f +��uNBCP1u5
×4B−D5e−4�f +��uNB 5t0 −44CF +4�f +��uNB5CD5
×(
−4B−D5et0�4�f +��uNB5+et04�f +��uNB 5
×4B4�f +��uNB5−D�5)
5
×(
4�f +��uNB−�5et04�f +��uNB+�5)−1
+
∫ T
t0
¡N4t � t05
¡t0
(
−CP1u��u4B−D4t55
−��uCD4D4t5−B+B4t55−CGB4t5
Y
)
dt
−
∫ T
t0
¡D4t � t05
¡t04CF +��uN4t54CD−CP1u55dt
−
∫ T
t0
¡B4t � t05
¡t0
(
CF +��uN4t5CD+CG
YN4t5
)
dt0 (42)
For part (i), we demonstrate the result for a parameterregion where �f , �u, CP1u, and CP1f are small but rela-tively large in comparison with c and 1/�; i.e., both thenegative impact of bugs on adoption and delays in fixingthese bugs are negligible relative to the other parametersin question. Thus, defining � = �2, setting �f = �f �, �u =
�u�, CP1u = �P1u�, and CP1f = �P1f � and taking c = �c� and� = ��/� as in the conditions of Lemma A1, we can substi-tute an analog of the result from Lemma A1—the solutionof the adapted dynamical system—into (33), such that for
sufficiently small �,
¡ç4t01 · 5
¡t0
=1
�uY�
(
−aA21e
2A2�umpwY�+CG4B− D54�f +�u�NB5
−CG4B− D5A1e
A2
a+ b44a+ b54�f +�u�NB5 cosh4A25
+ 44a− b54�f +�u�NB5− 2am��u5 sinh4A255
)
+O4�50 (43)
Suppose t∗0 is in the interior. Then, by (42) and the implicitfunction theorem, we obtain
dt∗0dNB
= −CG4B− D5�u�
24ae4a+b5Tw + be4a+b5t0w53�
baw4a+ b52e4a+b54T+t05w×
M1
M2
+O4�251 (44)
where
M14= a4−T + t042 −A1e
2A2 55− log4A15/w1
M24= �
(
−ae4a+b5Tw4CG4B− D5+ 4a+ b5pwY 5
+ be4a+b5t0w44a+ b5pwY −CG4B− D55)
0
Let
ãNB 4=
{
t0 > 02 − aA21e
2A2�umpwY�
+CG4B− D5A14e
2A2 − 15�um�
a+ b= 0
}
0
By (43), when t∗0 moves into the interior, it must satisfy t∗0 =
ãNB + O4�5, from which it follows that there exists � > 0such that if B − D < �, then t∗0 is O4�5. In this case, M1 =
4−aTw − log4a+ b5+ log4b + ae4a+b5Tw55/2 +O4�5; hence, byLemma A2, M1 > 0 for sufficiently small �. Similarly, M2 =
−4a4a + b52e4a+b5Tw�umw5/44b + ae4a+b5Tw535 × 4CG4B − D54b +
ae4a+b5Tw5+ 4a+ b5pwY × 4ae4a+b5Tw − b55+O4�5. Thus, if net-work effects are limited, i.e., b < a, then M2 < 0 for suffi-ciently small �, which by (44), implies dt∗0/dNB > 0. On theother hand, if t∗0 = 0 and does not satisfy the first-ordercondition, then it is unchanged for a small increase in NB .Therefore, dt∗0/dNB ≥ 0, which proves part (i).
For part (ii), differentiating (42) with respect to NB , bysetting c = �c� and � = ��/� as in the conditions of LemmaA1 and making similar substitutions, we obtain
¡2ç4t01·5
¡t0¡NB
=e−t04�f +��uNB 5
Y
×4KNBG CG+K
NBP1uCP1u+CP1f t0Y��f �u5+O4�51 (45)
where KNBG
4= 1 − t0��uNB +�NB , KNB
P1u4= Y��u�
NB , and
�NB 4= −4A1e
aw4T−t055m��u/4bw5− t0�f
+ t0Am��u/4bw51 ×
4e4a+b5w4T+t05/2+am4T−t05��u/b5
ae4a+b5Tw + be4a+b5t0w
× 44a+ b54�f +��uNB5 cosh4A25
+ 44a− b54�f +��uNB5− 2am��u5 sinh4A2550
INFORMS
holds
copyrightto
this
article
and
distrib
uted
this
copy
asa
courtesy
tothe
author(s).
Add
ition
alinform
ation,
includ
ingrig
htsan
dpe
rmission
policies,
isav
ailableat
http://journa
ls.in
form
s.org/.

August and Niculescu: The Influence of Software Process Maturity and Customer Error Reporting2724 Management Science 59(12), pp. 2702–2726, © 2013 INFORMS
As �u gets small, �NB approaches −1 as �u gets small; hence,by (45), for large enough CP1u, ¡2ç4t01 · 5/¡t0¡NB < 0, and theresult follows. �
Lemma A3. The optimal release time satisfies t∗0 = L4�5 wheneither (i) CG < ��uY 4CT /441 −�5�5 − 4CP1u − CP1f 55 or (ii)CG >��uY 4CT /441 −�5�5− 4CP1u −CP1f 5e
−�L4�55 and
�4�5 <��uYCT
41 −�54CG +��uY 4CP1u −CP1f 550
Proof. (i) If CG <��u4Y 5Y 4CT /441 −�5�5− 4CP1u −CP1f 55,since �4�5 ≤ � for all �, then it follows that for allp and all �, we have log444B − D54CG + 4CP1u − CP1f 5 ·
Y��u55/4CT Y2��u55 < 0. Thus, from Proposition 1 we have
t∗0 4p∗5= L4�5.
(ii) Note that for any fixed p, if �4�5 < ��uCT Y/441 − �54CG + 4CP1u − CP1f 5Y��u55, then it immediatelyfollows that log444B − D54CG + 4CP1u − CP1f 5Y��u55/4CT Y
2��u55 < 0 and thus, from Proposition 1, we see thatt∗0 4p5= L4�5. �
Proof of Proposition 6. Conditions in cases (i) and (ii)place the price optimization in the context of conditionsin Lemma A3, in which case t∗0 = L4�5 = 0 (under a low� regime). Differentiating (32) with respect to p and �, weobtain
¡2ç4p1 · 5
¡p¡�=R�4p1 · 5+O4�51
where
R�4p1 · 5 = −w′4p5×41 −�5�4�5Z3m�ub24ae2A2 + b5w34p5
× 44ae2A2 + b5Z1 + abTw4p54e2A2 − 155×V�1
where V� ¬ m4CG + CP1uY��u5Z1 + bCP1uYw4p5. We knowthat w′4p5 < 0 for all p > 0. Also, 441 − �5�4�5Z3m�u5/4b24ae2A2 + b5w34p55 > 0. Moreover, it can be shownthat 4ae2A2 + b5Z1 + abTw4p54e2A2 − 15 > 0 if andonly if 2aA2e
2A2/4ae2A2 + b5 > log44ae2A2 + b5/4a+ b55. Con-sider the function å4x5 = axex/4aex + b5 − log44aex + b5/4a+ b55. Then, we have å′4x5 > 0 for all x > 0, withå405= 0. Thus, å4x5 > 0 for all x > 0. Hence, å42A25 =
2aA2e2A2/4ae2A2 + b5 > log44ae2A2 + b5/4a+ b55 > 0, and thus,
4ae2A2 + b5Z1 + abTw4p54e2A2 − 15 > 0. Thus, the sign ofR�4p1 · 5 is given by the sign of V�.
There exists p (independent of costs and functionality)such that p∗ < p because limp→� �4p5 = 0, and we focus onregimes where �∗ ≥ �0 > 0. Given that w′′4p5 ≥ 0, it followsthat w′4p5 ≤ w′4p5 < 0 and w4p5 > w4p5 > 0 for all p ∈ 601 p5.When CG/CP1u is high or Y is low, then, since Z1 < 0, it fol-lows that R�4p1 · 5 < 0. If CG/CP1u is low, the sign of R�4p1 · 5is given by the coefficient of CP1u in V�, which is X�
P1u =
Y 4��umZ1 + bw4p55. Define �4x5 ¬ ��um4aTx + log4a + b5 −
log4b + ae4a+b5Tx55 + bx. Then X�P1u = Y�4w4p55. We have
¡�/¡x = b − a4a + b5e4a+b5TxmT��u/4b + ae4a+b5Tx5. Note that4a+b5e4a+b5Tx/4b+ae4a+b5Tx5 ∈ 411 4a+ b5/a5 for all x > 0. Thus,¡�/¡x ∈ 4b − 4a + b5mT��u1 b − amT��u5. If b/44a+ b5mT 5> ��u, i.e., user contribution to debugging is low, then �is increasing, and thus X�
P1u > 0 for any p which leads toR�4p1 · 5 > 0. Since p < p, for sufficiently small �, R�4p1 · 5 willdominate the O4�5 term everywhere in the interval 601 p7.
Both parts (i) and (ii) follow immediately via Topkis’s mono-tonicity theorem. �
Proof of Proposition 7. Conditions in cases (i) and (ii)place the price optimization in the context of conditions inLemma A3, in which case t∗0 = L4�5 = 0 (under a low �regime). Thus, we only have a one-variable optimization,i.e., with respect to p. Differentiating (32) with respect to pand Y , we obtain
¡2ç4p1 · 5
¡p¡Y=RY 4p1 · 5+O4�51
where
RY 4p1 · 5 = −w′4p5×m�41 −�5�4�5Z3A1
b24a+ b5w34p5
×(
4ae2A2 + b5Z1 + abw4p5T 4e2A2 − 15)
×VY 1
where VY ¬ bCP1uw4p54�u4Y 5 + Y�′u4Y 55 + mZ1�
′u4Y 54CG +
CP1uY��u4Y 55. Note that w′4p5 < 0 and 4m�41 − �5�4�5 ·
Z3A15/4b24a + b5w34p55 > 0. From the proof of Proposi-
tion 6, we also know that 4ae2A2 + b5Z1 + abw4p5T 4e2A2 − 15> 0. Thus, the sign of RY 4p1 · 5 is the same as the sign ofVY . By similar arguments as in Proposition 6, if � is suffi-ciently small, RY 4p1 · 5 dominates the O4�5 term everywhereon 601 p7.
Cases i(a) and i(b): In these cases, the monotonicity isdetermined by the sign of the coefficient of CG in VY . SinceZ1 < 0, it follows that the coefficient of CG has a sign oppo-site to �′
u4Y 5. The results follow directly.Case ii(a): In this case, the monotonicity is determined
by the sign of the coefficient of CP1u in VY , which isequal to bw4p54�u4Y 5 + Y�′
u4Y 55 + mZ1��′u4Y 5Y�u4Y 5. From
Lemma A2 we have −bw4p5T < Z1 < 0. Then, since �′u4Y 5
< 0 in this case,
bw4p54�u4Y 5+Y�′
u4Y 55+mZ1��′
u4Y 5Y�u4Y 5
< bw4p5[
�u4Y 5+Y�′
u4Y 541 −mT��u4Y 55]
0
If �u < 1/4mT�5 and �Y�′u� is large, then �u4Y 5+ Y�′
u4Y 541 −
mT��u4Y 55 < 0. In this case, VY < 0, and p∗ is decreas-ing in Y .
Case ii(b): If �′u4Y 5 < 0 but �u4Y 5 + Y�′
u4Y 5 > 0, it imme-diately follows that the coefficient of CP1u in VY is positive.On the other hand, if �′
u4Y 5 > 0, given that from Lemma A2we have −bw4p5T < Z1 < 0, then
bw4p54�u4Y 5+Y�′
u4Y 55+mZ1��′
u4Y 5Y�u4Y 5
> bw4p5(
�u4Y 5+Y�′
u4Y 541 −mT��u4Y 55)
0
If �u4Y 5/Y�′u4Y 5 > �1 − mT��u�, then VY > 0, and, conse-
quently, p∗ is increasing in Y . �
ReferencesAlbanesius C (2011) Apple confirms iOS 5 battery bug,
promises fix. PC Magazine (November 2), http://www.pcmag.com/article2/0,2817,2395790,00.asp.
Arar Y (2003) Microsoft reveals Office 2003 prices, release. PCWorld(August 19), http://www.pcworld.com/article/112077/article.html.
Arora A, Caulkins JP, Telang R (2006) Research note—Sell first, fixlater: Impact of patching on software quality. Management Sci.52(3):465–471.
Arora A, Telang R, Xu H (2008) Optimal policy for software vul-nerability disclosure. Management Sci. 54(4):642–656.
INFORMS
holds
copyrightto
this
article
and
distrib
uted
this
copy
asa
courtesy
tothe
author(s).
Add
ition
alinform
ation,
includ
ingrig
htsan
dpe
rmission
policies,
isav
ailableat
http://journa
ls.in
form
s.org/.

August and Niculescu: The Influence of Software Process Maturity and Customer Error ReportingManagement Science 59(12), pp. 2702–2726, © 2013 INFORMS 2725
August T, Tunca TI (2006) Network software security and userincentives. Management Sci. 52(11):1703–1720.
August T, Tunca TI (2008) Let the pirates patch? An economic anal-ysis of software security patch restrictions. Inform. Systems Res.19(1):48–70.
August T, Tunca TI (2011) Who should be responsible for softwaresecurity? A comparative analysis of liability policies in net-work environments. Management Sci. 57(5):934–959.
Babcock C (2008) Open source code contains security holes. Informa-tionWeek (January 8), http://www.informationweek.com/open-source-code-contains-security-holes/205600229.
Ballmer S (2002) Connecting with customers. Microsoft Execu-tive E-mail (October 2), http://www.microsoft.com/mscorp/execmail/2002/10-02customers.mspx.
Bass MF (1969) A new product growth model for consumerdurables. Management Sci. 15(5):215–227.
Bass MF, Krishnan TV, Jain DC (1994) Why the Bass model fitswithout decision variables. Marketing Sci. 13(3):203–223.
Cavalcanti YC, de Almeida ES, da Cunha CEA, Lucrédio D,de Lemos Meira SR (2010) An initial study on the bug reportduplication problem. Proc. 14th Eur. Conf. Software Mainte-nance Reengineering (IEEE Computer Society, Washington, DC),264–267.
Cavusoglu H, Cavusoglu H, Raghunathan S (2007) Efficiency ofvulnerability disclosure mechanisms to disseminate vulnera-bility knowledge. IEEE Trans. Software Engrg. 33(3):171–185.
Cavusoglu H, Cavusoglu H, Zhang J (2008) Security patch man-agement: Share the burden or share the damage? ManagementSci. 54(4):657–670.
Cisco (2011) Global Internet traffic projected to quadruple by2015. Press release, June 1, http://newsroom.cisco.com/press-release-content?type=webcontent&articleId=324003.
Cohen MA, Eliashberg J, Ho T-H (1996) New product development:The performance and time-to-market tradeoff. Management Sci.42(2):173–186.
Cusumano MA (2004) Who is liable for bugs and security flaws insoftware? Comm. ACM 47(3):25–27.
Davis N, Mullaney J (2003) The team software processSM (TSPSM) inpractice: A summary of recent results. Technical Report CMU/SEI-2003-TR-014, Software Engineering Institute, CarnegieMellon University, Pittsburgh. http://www.dtic.mil/cgi-bin/GetTRDoc?Location=U2&doc=GetTRDoc.pdf&AD=ADA418430.
Dou Y, Niculescu MF, Wu DJ (2013) Engineering optimal networkeffects via social media features and seeding in markets fordigital goods and services. Inform. Systems Res. 24(1):164–185.
Ehrlich W, Prasanna B, Stampfel J, Wu J (1993) Determining thecost of a stop-test decision. IEEE Software 10(2):33–42.
Giger E, Pinzger M, Gall H (2010) Predicting the fix time of bugs.Proc. 2nd Internat. Workshop Recommendation Systems SoftwareEngrg. (ACM, New York), 52–56.
Glerum K, Kinshumann K, Greenberg S, Aul G, Orgovan V,Nichols G, Grant D, Loihle G, Hunt G (2009) Debugging in the(very) large: Ten years of implementation and experience. Proc.ACM SIGOPS 22nd Sympos. Operating Systems Principles (SOSP’09) (ACM, New York), 103–116.
Goel AL, Okumoto K (1979) Time-dependent error-detection ratemodel for software reliability and other performance measures.IEEE Trans. Reliability R-28(3):206–211.
Hachman M (2011) Blizzard pushes out Diablo III release date until2012. PCMag.com (September 23), http://www.pcmag.com/article2/0,2817,2393507,00.asp.
Harter DE, Slaughter SA (2003) Quality improvement and infras-tructure activity costs in software development: A longitudinalanalysis. Management Sci. 49(6):784–800.
Harter DE, Kemerer CF, Slaughter SA (2012) Does software processimprovement reduce the severity of defects? A longitudinalfield study. IEEE Trans. Software Engrg. 38(4):810–827.
Harter DE, Krishnan MS, Slaughter SA (2000) Effects of processmaturity on quality, cycle time, and effort in software productdevelopment. Management Sci. 46(4):451–466.
Henry P (2007) Protecting the enterprise in a Vista environ-ment. SC Magazine (Australia) (March 7), http://www.scmagazine.com.au/Feature/74901,protecting-the-enterprise-in-a-vista-environment.aspx.
Hooimeijer P, Weimer W (2007) Modeling bug report quality.Proc. 22nd IEEE/ACM Internat. Conf. Automated Software Engrg.(ACM, New York), 34–43.
Internet Systems Consortium (2012) Internet host count history.Accessed September 2012, https://www.isc.org/solutions/survey/history.
Internet World Stats (2012) World Internet usage and pop-ulation statistics. Accessed September 2012, http://www.internetworldstats.com/stats.htm.
Ji Y, Mookerjee VS, Sethi SP (2005) Optimal software devel-opment: A control theoretic approach. Inform. Systems Res.16(3):292–306.
Ji Y, Kumar S, Mookerjee VS, Sethi SP, Yeh D (2011) Optimalenhancement and lifetime of software systems: A control the-oretic analysis. Production Oper. Management 20(6):889–904.
Jiang Z, Sarkar S, Jacob VS (2012) Postrelease testing and softwarerelease policy for enterprise-level systems. Inform. Systems Res.23(3, Part 1):635–657.
Kalish S (1983) Monopolist pricing with dynamic demand and pro-duction cost. Marketing Sci. 2(2):135–159.
Kalish S, Lilien GL (1986) A market entry timing model for newtechnologies. Management Sci. 32(2):194–205.
Keizer G (2007) Vista’s biggest problem remains Windows XP,survey says. Computerworld (November 14), http://www.computerworld.com/s/article/9046942/Vista_s_biggest_problem_remains_Windows_XP_survey_says.
Keizer G (2011) Mozilla gets tough on Firefox memory leaks.Computerworld (June 13), http://www.computerworld.com/s/article/9217580/Mozilla_gets_tough_on_Firefox_memory_leaks.
Kennealy E (2000) The byte stops here: Duty and liability for neg-ligent Internet security. Comput. Security J. 16(4):1–26.
Kimura M, Toyota T, Yamada S (1999) Economic analysis ofsoftware release problems with warranty cost and reliabilityrequirement. Reliability Engrg. System Safety 66(1):49–55.
Koch HS, Kubat P (1983) Optimal release time of computer soft-ware. IEEE Trans. Software Engrg. 9(3):323–327.
Krishnan MS, Kriebel CH, Kekre S, Mukhopadhyay T (2000) Anempirical analysis of productivity and quality in softwareproducts. Management Sci. 46(6):745–759.
Krishnan TV, Bass FM, Jain DC (1999) Optimal pricing strategy fornew products. Management Sci. 45(12):1650–1663.
Manes S (2007) Dim Vista. Forbes (February 26), http://www.forbes.com/forbes/2007/0226/050.html.
Markoff J (2006) A challenge for exterminators. New YorkTimes (October 9), http://www.nytimes.com/2006/10/09/technology/09vista.html.
McDaid K, Wilson SP (2001) Deciding how long to test software.Statistician 50(2):117–134.
Meredith L (2010) Pricing details for Microsoft Office 2010 revealed.TechNewsDaily (May 17), http://technewsdaily.com/481-pricing-details-for-microsoft-office-2010-revealed.html.
Michaels P (2008) Faulty software can lead to astronomic costs.Computer Weekly (June), http://www.computerweekly.com/Articles/2009/01/13/230950/Faulty-software-can-lead-to-astronomic-costs.htm.
Microsoft (2001) Microsoft rolls out first individual trial programfor Microsoft Office XP. Press release (April 2), Microsoft,Redmond, WA.
Microsoft (2007) Microsoft Office system pricing, fact sheet,January 2007. Microsoft, Redmond, WA.
M Squared Technologies (2010) RSM metrics of popular softwareprograms. Accessed May 2010, http://msquaredtechnologies.com/m2rsm/.
Muthitacharoen A, Saeed KA (2009) Examining user involvementin continuous software development (a case of error reportingsystem). Comm. ACM 52(9):113–117.
INFORMS
holds
copyrightto
this
article
and
distrib
uted
this
copy
asa
courtesy
tothe
author(s).
Add
ition
alinform
ation,
includ
ingrig
htsan
dpe
rmission
policies,
isav
ailableat
http://journa
ls.in
form
s.org/.

August and Niculescu: The Influence of Software Process Maturity and Customer Error Reporting2726 Management Science 59(12), pp. 2702–2726, © 2013 INFORMS
Nagai M (2006) Sony delays PS3 launch to November. CNET News(March 15), http://news.cnet.com/Sony-delays-PS3-launch-to-November/2100-1043_3-6049479.html.
Niculescu MF, Shin H, Whang S (2012) Underlying consumer het-erogeneity in markets for subscription-based IT services withnetwork effects. Inform. Systems Res. 23(4):1322–1341.
Okumoto K, Goel AL (1980) Optimal release time for software sys-tem based on reliability and cost criteria. J. Systems Software1(4):315–318.
O’Neill S (2008) Why I’m skipping Windows Vista: ITspeaks out. PCWorld (November 4), http://pcworld.com/article/153295/skipping_windows_vista.html.
Organisation for Economic Co-operation and Development (2012)OECD broadband portal—Historical penetration rates, G7.http://www.oecd.org/sti/broadband/oecdbroadbandportal.htm.
Oswald E (2005) Businesses slow to adopt XP SP2. BetaNews(April 4), http://betanews.com/2005/04/04/businesses-slow-to-adopt-xp-sp2.
Otto PN (2009) Reasonableness meets requirements: Regulatingsecurity and privacy in software. Duke Law J. 59(2):309–342.
Paulk MC, Curtis B, Chrissis MB, Weber CV (1993) Capa-bility maturity model for software, version 1.1. TechnicalReport CMU/SEI-93-TR-024, Software Engineering Institute,Carnegie Mellon University, Pittsburgh.
Petreley N (1998) The official terminology guide to commercial soft-ware development. InfoWorld 20(10):140.
Pham H, Zhang X (1999) Software release policies with gain in reli-ability justifying the costs. Ann. Software Engrg. 8(1–4):147–166.
Ransom D (2010) Six industries poised to grow. Wall Street Journal(April 27), http://online.wsj.com/article/SB10001424052748704471204575210023871636874.html.
Raymond ES (1999) The Cathedral and the Bazaar: Musings on Linuxand Open Source by an Accidental Revolutionary, 1st ed. (O’Reilly& Associates, Sebastopol, CA).
Robinson B, Lakhani C (1975) Dynamic price models for new-product planning. Management Sci. 21(10):1113–1122.
Rooney P (2004) WinXP SP2 adoption slow in enterprise, picksup in SMB. CRN (November 4), http://www.crn.com/news/security/51202859/winxp-sp2-adoption-slow-in-enterprise-picks-up-in-smb.htm
RTI (2002) The economic impacts of inadequate infrastructure forsoftware testing. Planning Report 02-3 prepared by ResearchTriangle Institute for the National Institute of Standards andTechnology, Research Triangle Park, NC.
Sethi SP, Bass FM (2003) Optimal pricing in a hazard rate model ofdemand. Optimal Control Appl. Methods 24(4):183–196.
Shantikumar JG, Tufekci S (1983) Application of a software reli-ability model to decide software release time. MicroelectronicsReliability 23(1):41–59.
Siemens Information Systems Ltd. (2003) Reduced defect densityan average of 71 percent in three technical areas. On aver-age of 46 percent of that reduction occurred as the organiza-tion moved from SW-CMM maturity level 5 towards CMMImaturity level 5. Software Engineering Institute, CarnegieMellon University, Pittsburgh. Accessed September 2011,http://seir.sei.cmu.edu/cmmiresearch/results/state_31.html.
Software Engineering Institute (2006) CMMI for development, ver-sion 1.2. Technical Report CMU/SEI-2006-TR-008, SoftwareEngineering Institute, Carnegie Mellon University, Pittsburgh.
Sutter JD (2010) Why Internet connections are fastest in SouthKorea. CNN.com (March 31), http://www.cnn.com/2010/TECH/03/31/broadband.south.korea/index.html.
Thompson L (2010) Socorro: Mozilla’s crash reporting system.Mozilla Webdev Development (blog), May 19, http://blog.mozilla.com/webdev/2010/05/19/socorro-mozilla-crash-reports/.
Tryhorn C (2009) Digital Britain: “Broadband in every houseby 2012.” Guardian (UK) (January 29), http://www.guardian.co.uk/technology/2009/jan/29/digital-britain-broadband-houses-2012.
Weszka J (2003) Transition from SW-CMM to CMMI: The benefitscontinue! Presentation at the CMMI Technology Conference,November 19, Denver.
Wheeler DA (2001) More than a gigabuck: Estimating GNU/Linux’ssize. Accessed August 2010, http://www.dwheeler.com/sloc/redhat71-v1/redhat71sloc.html.
Whittaker JA (2001) Software’s invisible users. IEEE Software18(3):84–88.
Yamada S, Osaki S (1987) Optimal software release policies withsimultaneous cost and reliability requirements. Eur. J. Oper. Res.31(1):46–51.
Zhang J, Seidmann A (2010) Perpetual versus subscription licens-ing under quality uncertainty and network externality effects.J. Management Inform. Systems 27(1):39–68.
Zheng S (2002) Dynamic release policies for software systems witha reliability constraint. IIE Trans. 34(3):253–262.
Zimmermann T, Premraj R, Bettenburg N, Just S, Schröter A,Weiss C (2010) What makes a good bug report? IEEE Trans.Software Engrg. 36(5):618–643.
INFORMS
holds
copyrightto
this
article
and
distrib
uted
this
copy
asa
courtesy
tothe
author(s).
Add
ition
alinform
ation,
includ
ingrig
htsan
dpe
rmission
policies,
isav
ailableat
http://journa
ls.in
form
s.org/.