Business Value and Customer Benefits Derived from High ... · Business Value and Customer Benefits...
17
Business Value and Customer Benefits Derived from High Maturity CMMI sm Technology Conference and User Group November 2002 Alan Pflugrad Northrop Grumman Information Technology Defense Enterprise Solutions (DES) Chair, DES Engineering Process Group Executive Manager, Systems and Process Engineering Email: [email protected] Phone: (703) 883-5128
Transcript of Business Value and Customer Benefits Derived from High ... · Business Value and Customer Benefits...
Business Value and Customer BenefitsDerived from High Maturity
CMMIsm Technology Conference and User GroupNovember 2002
Alan PflugradNorthrop Grumman Information TechnologyDefense Enterprise Solutions (DES)Chair, DES Engineering Process GroupExecutive Manager, Systems and ProcessEngineeringEmail: [email protected]: (703) 883-5128
2
Discussion Purpose and Agenda
• Purpose:– Communicate business value and customer benefits derived from an
application of “high maturity” system/software engineeringprocesses, and
– How an integrated process framework helps• Discussion Agenda
– Business Value/Customer Benefits & Process Highlights– Quality and Process Goals– Quality and Process Performance– Process Highlights
– Integrated Process Improvement (CMMI)• Limit – 40 minutes including questions
3
22
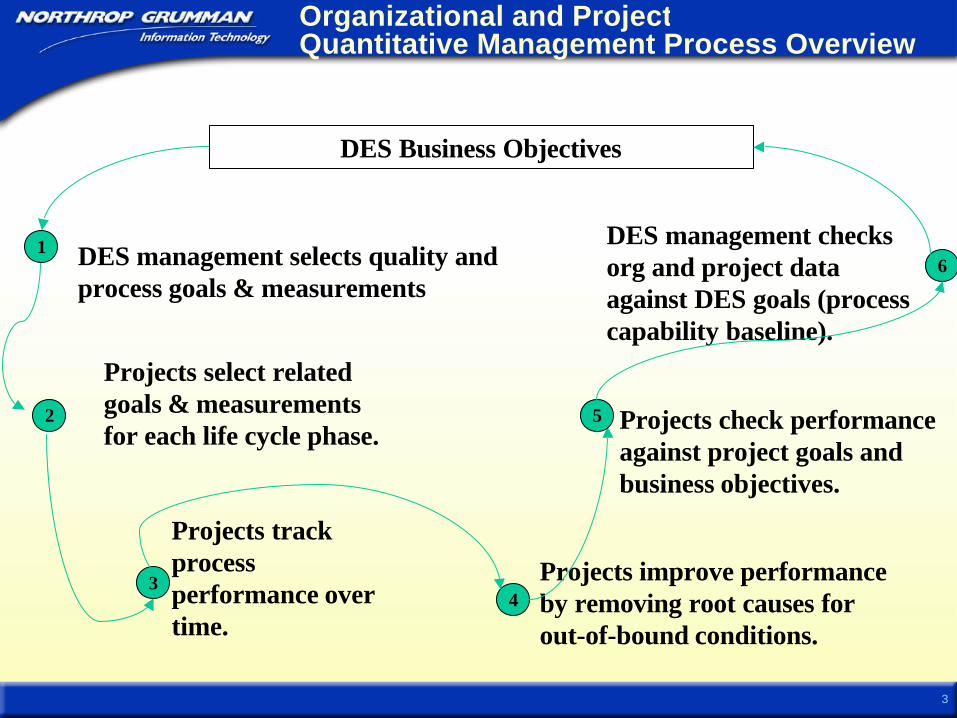
Organizational and ProjectQuantitative Management Process Overview
DES Business Objectives
Projects improve performanceby removing root causes forout-of-bound conditions.
44
Projects trackprocessperformance overtime.
33
Projects select relatedgoals & measurementsfor each life cycle phase. Projects check performance
against project goals andbusiness objectives.
55
66DES management checksorg and project dataagainst DES goals (processcapability baseline).
11 DES management selects quality andprocess goals & measurements
4
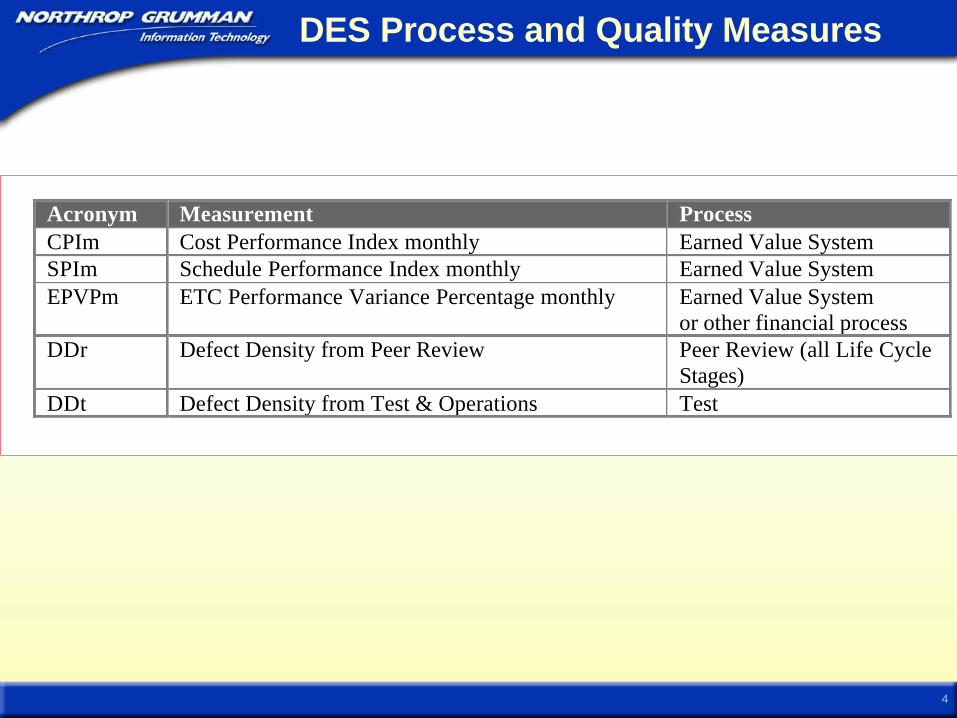
DES Process and Quality Measures
Acronym Measurement ProcessCPIm Cost Performance Index monthly Earned Value SystemSPIm Schedule Performance Index monthly Earned Value SystemEPVPm ETC Performance Variance Percentage monthly Earned Value System
or other financial processDDr Defect Density from Peer Review Peer Review (all Life Cycle
Stages)DDt Defect Density from Test & Operations Test
5
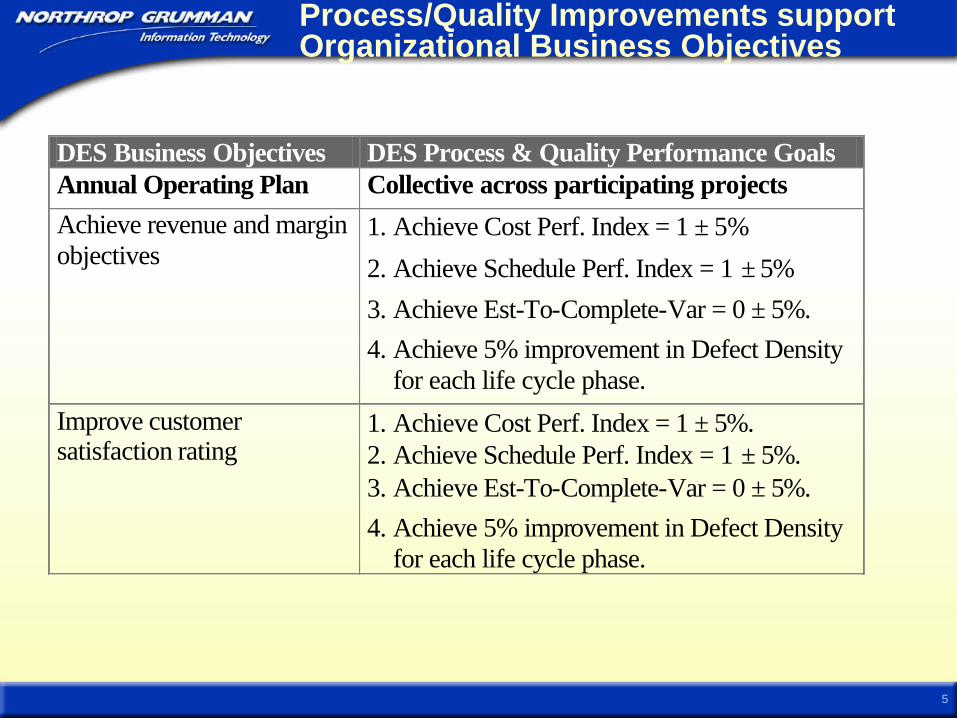
DES Business Objectives DES Process & Quality Performance Goals Annual Operating Plan Collective across participating projects Achieve revenue and margin objectives
1. Achieve Cost Perf. Index = 1 ± 5%
2. Achieve Schedule Perf. Index = 1 ± 5%
3. Achieve Est-To-Complete-Var = 0 ± 5%. 4. Achieve 5% improvement in Defect Density
for each life cycle phase.
Improve customer satisfaction rating
1. Achieve Cost Perf. Index = 1 ± 5%. 2. Achieve Schedule Perf. Index = 1 ± 5%. 3. Achieve Est-To-Complete-Var = 0 ± 5%. 4. Achieve 5% improvement in Defect Density
for each life cycle phase.
Process/Quality Improvements supportOrganizational Business Objectives
6
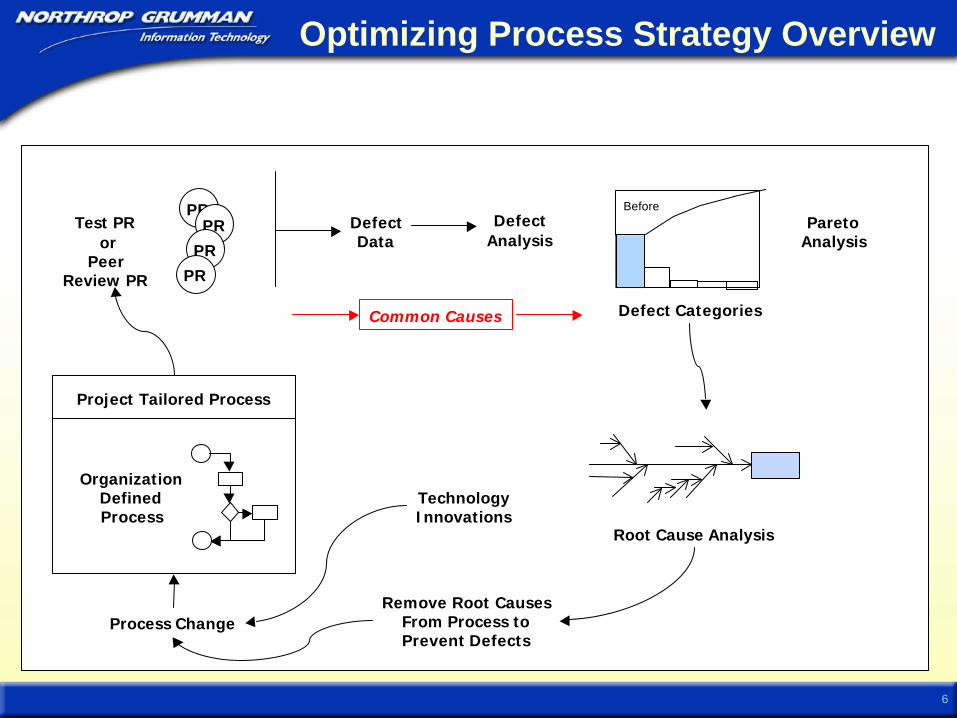
Optimizing Process Strategy Overview
Before
Defect Categories
Root Cause Analysis
ParetoAnalysis
OrganizationDefinedProcess
Project Tailored Process
Process ChangeRemove Root Causes
From Process toPrevent Defects
Test PR or
PeerReview PR
PRPR
PR
PR
DefectAnalysis
DefectData
Common Causes
TechnologyInnovations
7
Cost Performance Index (Monthly)
0.60
0.80
1.00
1.20
1.40M
ar-0
0
May
-00
Jul-0
0
Sep
-00
Dec
-00
Feb
-01
Apr
-01
Jun-
01
Aug
-01
Oct
-01
Nov
-01
Jan-
02
Mar
-02
May
-02
Defect Density at Review (all defects)
0
20
40
60
80
1 4 7 10 13 16 19 22 25 28 31 34 37 40 43 46 49 52 55
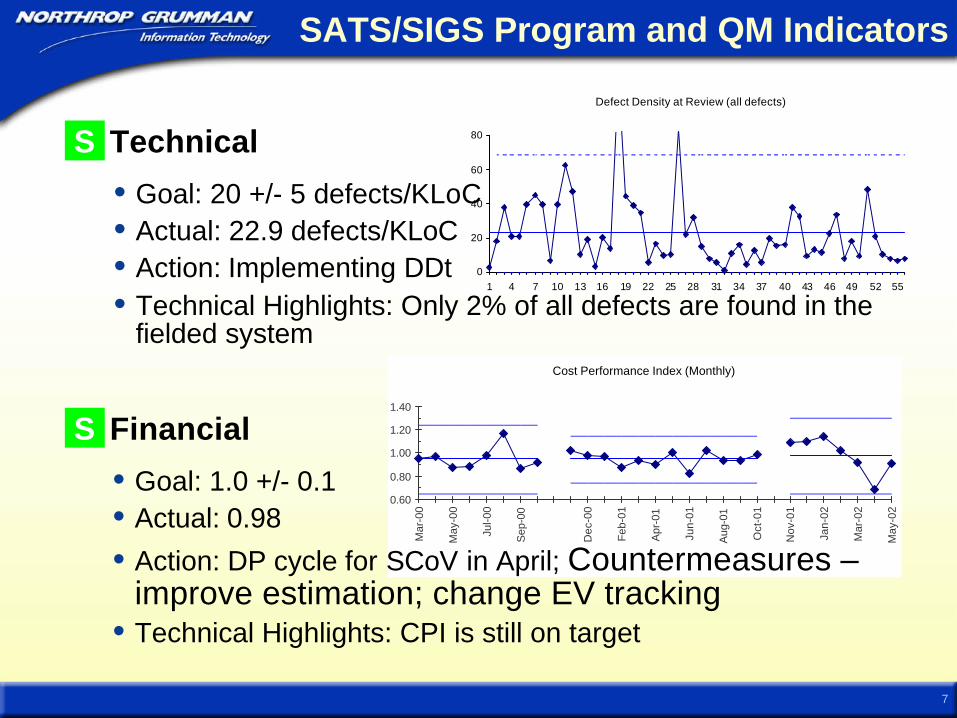
SATS/SIGS Program and QM Indicators
• Goal: 20 +/- 5 defects/KLoC• Actual: 22.9 defects/KLoC• Action: Implementing DDt• Technical Highlights: Only 2% of all defects are found in the
fielded system
S Financial
• Goal: 1.0 +/- 0.1• Actual: 0.98
• Action: DP cycle for SCoV in April; Countermeasures –improve estimation; change EV tracking
• Technical Highlights: CPI is still on target
S Technical
8
Schedule Performance Index (Monthly)
0.500.700.901.101.30
Mar
-00
May
-00
Jul-0
0
Sep
-00
Dec
-00
Feb
-01
Apr
-01
Jun-
01
Aug
-01
Oct
-01
Nov
-01
Jan-
02
Mar
-02
May
-02
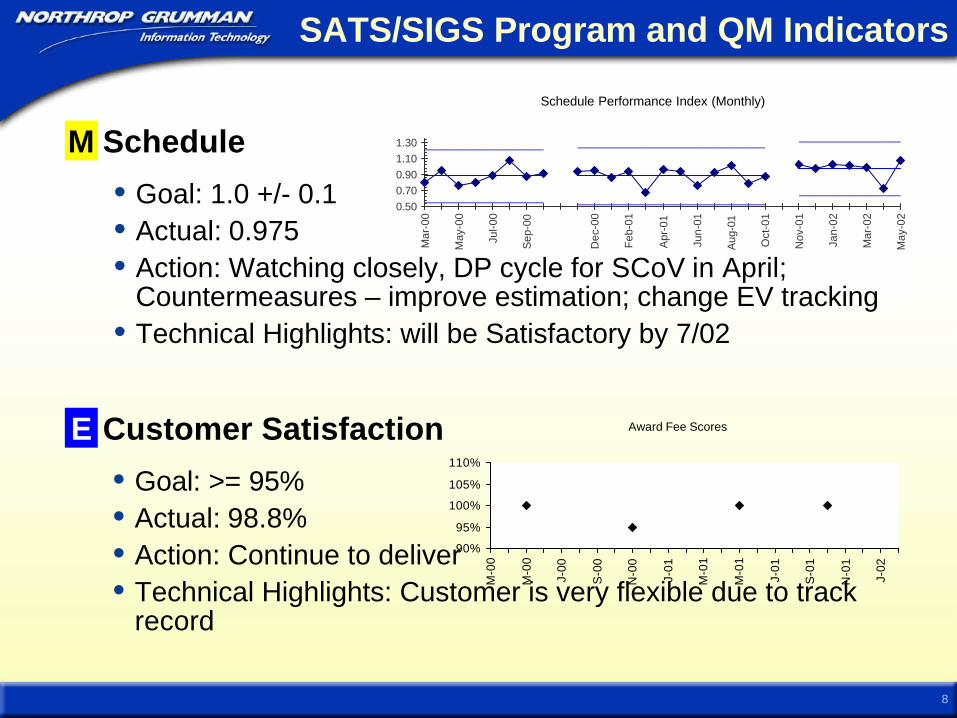
SATS/SIGS Program and QM Indicators
• Goal: 1.0 +/- 0.1• Actual: 0.975• Action: Watching closely, DP cycle for SCoV in April;
Countermeasures – improve estimation; change EV tracking• Technical Highlights: will be Satisfactory by 7/02
• Goal: >= 95%• Actual: 98.8%• Action: Continue to deliver• Technical Highlights: Customer is very flexible due to track
record
E Customer Satisfaction Award Fee Scores
90%
95%
100%
105%
110%
M-0
0
M-0
0
J-00
S-0
0
N-0
0
J-01
M-0
1
M-0
1
J-01
S-0
1
N-0
1
J-02
M Schedule
9
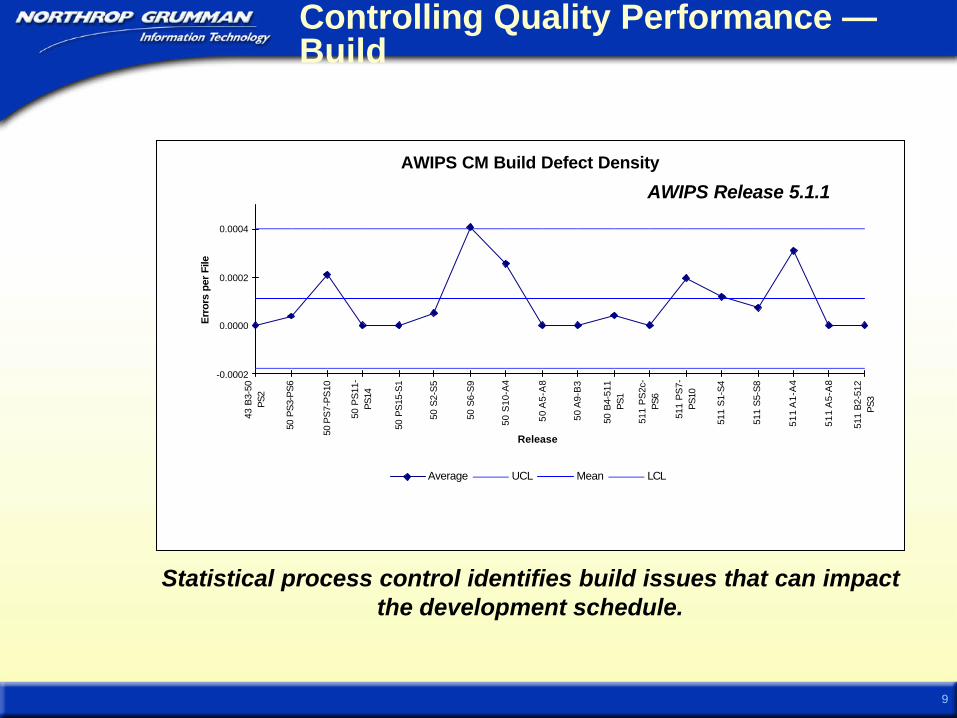
Controlling Quality Performance —Build
AWIPS CM Build Defect Density
-0.0002
0.0000
0.0002
0.0004
43 B
3-50
PS2
50 P
S3-
PS
6
50 P
S7-
PS
10
50 P
S11
-P
S14
50 P
S15
-S1
50 S
2-S
5
50 S
6-S
9
50 S
10-A
4
50 A
5-A
8
50 A
9-B
3
50 B
4-51
1PS
1
511
PS
2c-
PS6
511
PS
7-P
S10
511
S1-
S4
511
S5-
S8
511
A1-
A4
511
A5-
A8
511
B2-
512
PS3
Release
Err
ors
per
File
Average UCL Mean LCL
Statistical process control identifies build issues that can impactthe development schedule.
AWIPS Release 5.1.1
10
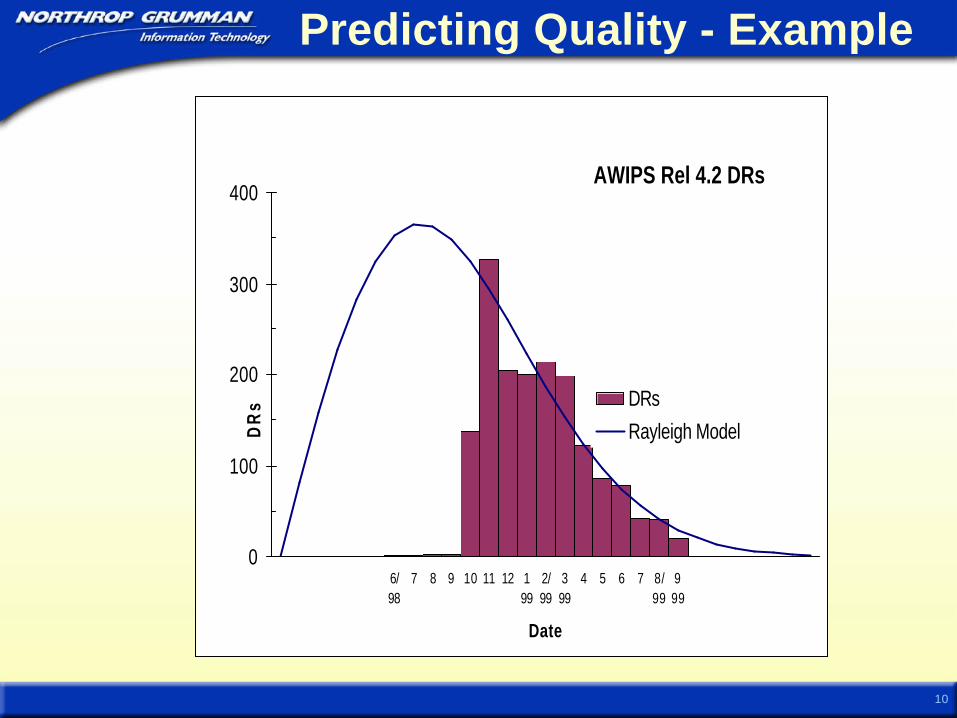
Predicting Quality - Example
AWIPS Rel 4.2 DRs
0
100
200
300
400
6/98
7 8 9 10 11 12 199
2/99
399
4 5 6 7 8/99
999
Date
DR
s DRsRayleigh Model
11
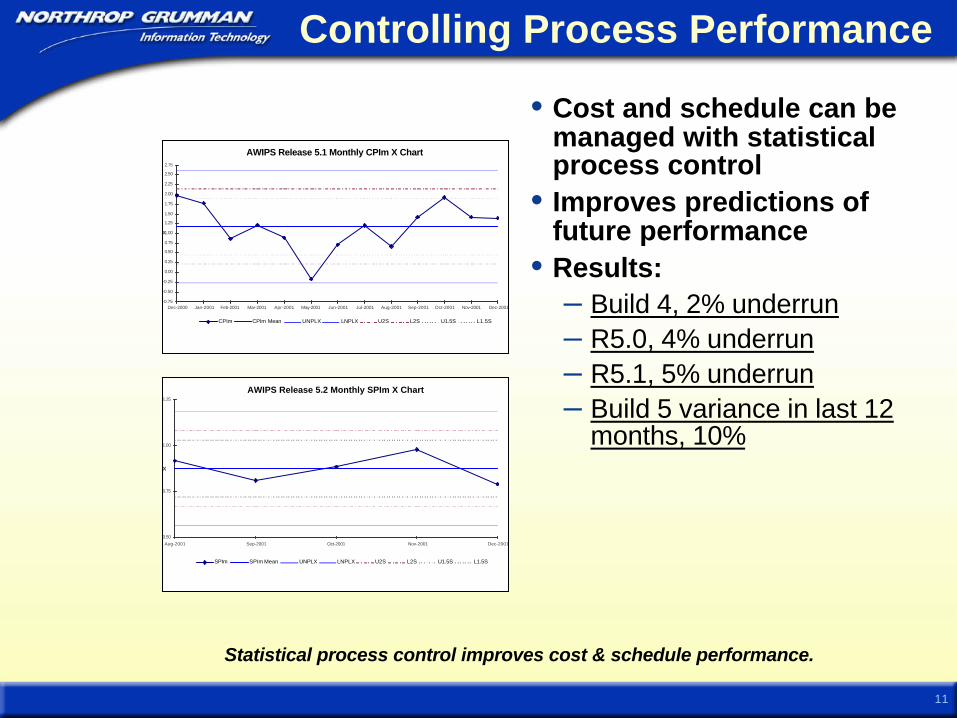
Controlling Process Performance
AWIPS Release 5.1 Monthly CPIm X Chart
-0.75
-0.50
-0.25
0.00
0.25
0.50
0.75
1.00
1.25
1.50
1.75
2.00
2.25
2.50
2.75
Dec-2000 Jan-2001 Feb-2001 Mar-2001 Apr-2001 May-2001 Jun-2001 Jul-2001 Aug-2001 Sep-2001 Oct-2001 Nov-2001 Dec-2001
X
CPIm CPIm Mean UNPLX LNPLX U2S L2S U1.5S L1.5S
Statistical process control improves cost & schedule performance.
AWIPS Release 5.2 Monthly SPIm X Chart
0.50
0.75
1.00
1.25
Aug-2001 Sep-2001 Oct-2001 Nov-2001 Dec-2001
X
SPIm SPIm Mean UNPLX LNPLX U2S L2S U1.5S L1.5S
• Cost and schedule can bemanaged with statisticalprocess control
• Improves predictions offuture performance
• Results:– Build 4, 2% underrun– R5.0, 4% underrun– R5.1, 5% underrun– Build 5 variance in last 12
months, 10%
12
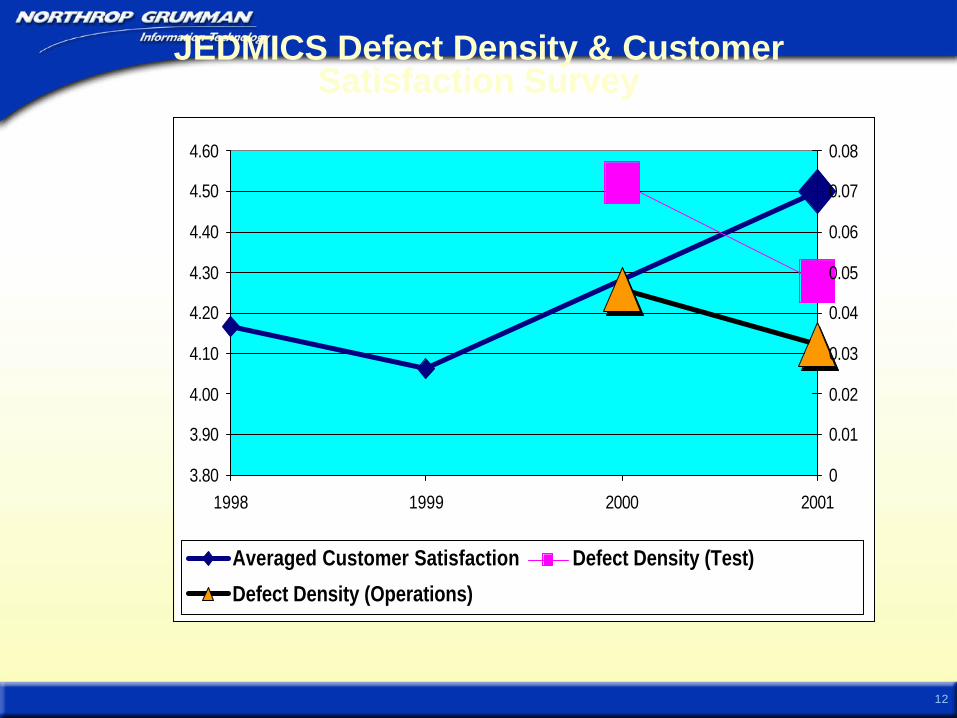
JEDMICS Defect Density & CustomerSatisfaction Survey
3.80
3.90
4.00
4.10
4.20
4.30
4.40
4.50
4.60
1998 1999 2000 20010
0.01
0.02
0.03
0.04
0.05
0.06
0.07
0.08
Averaged Customer Satisfaction Defect Density (Test)
Defect Density (Operations)
13
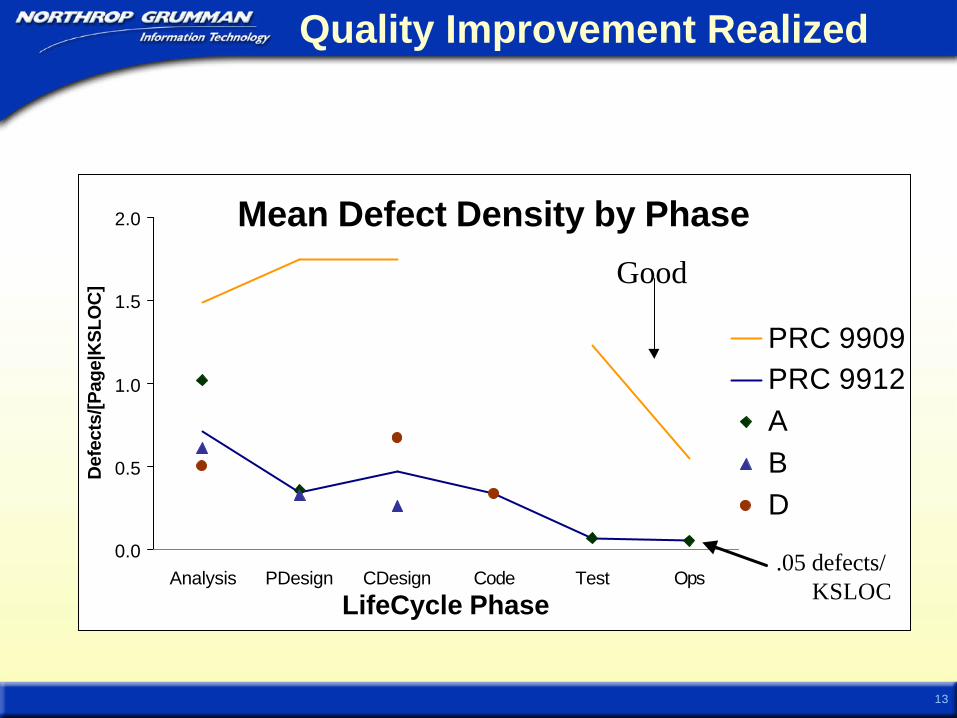
Mean Defect Density by Phase
0.0
0.5
1.0
1.5
2.0
Analysis PDesign CDesign Code Test Ops
LifeCycle Phase
Def
ects
/[Pag
e|K
SLO
C]
PRC 9909PRC 9912ABD
Quality Improvement Realized
Good
.05 defects/ KSLOC
14
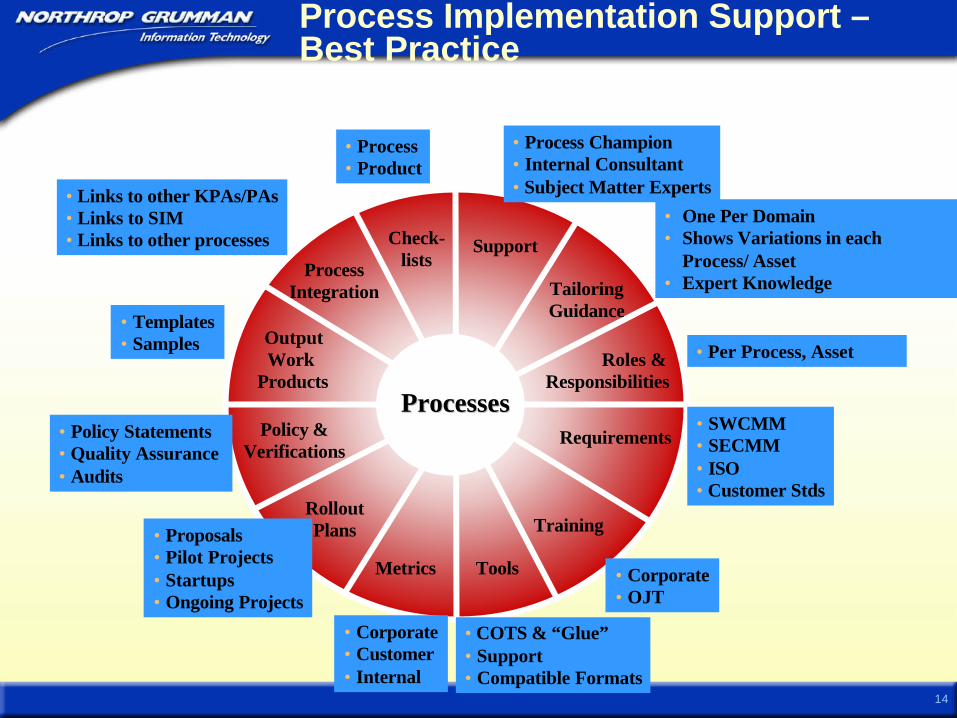
Process Implementation Support –Best Practice
OutputWork
Products Roles &
Responsibilities
ProcessIntegration
Check-lists
Metrics
RolloutPlans
Tools
Training
Support
Requirements
TailoringGuidance
Policy &Verifications
ProcessesProcesses
• Templates• Samples
• Policy Statements• Quality Assurance • Audits
• Proposals• Pilot Projects• Startups• Ongoing Projects
• Corporate• Customer• Internal
• COTS & “Glue”• Support• Compatible Formats
• Corporate• OJT
• SWCMM• SECMM• ISO• Customer Stds
• Per Process, Asset
• One Per Domain• Shows Variations in each
Process/ Asset• Expert Knowledge
• Process• Product
• Process Champion• Internal Consultant• Subject Matter Experts• Links to other KPAs/PAs
• Links to SIM• Links to other processes
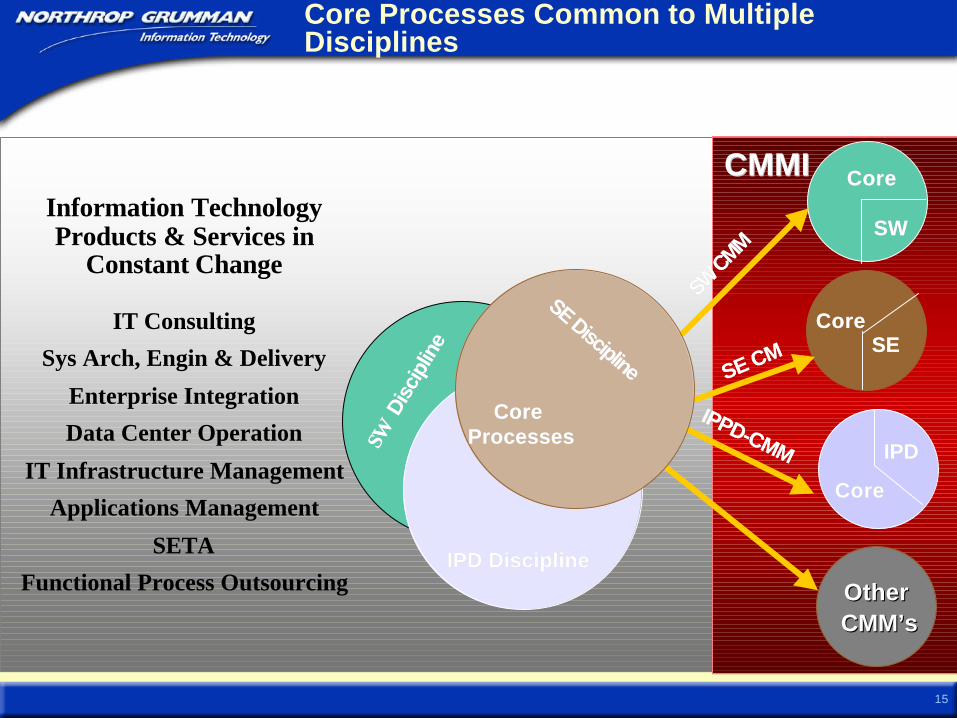
15SW
CMM
SW CMM
SE CMSE CM
IPPD-CMM
IPPD-CMM
CoreCore
CoreCore
CoreCore
IPDIPD
SESE
SWSW
OtherOther CMM’sCMM’s
Information TechnologyProducts & Services in
Constant Change
IT Consulting
Sys Arch, Engin & Delivery
Enterprise Integration
Data Center Operation
IT Infrastructure Management
Applications Management
SETA
Functional Process Outsourcing
CMMICMMI
Core Core ProcessesProcesses
IPD DisciplineIPD Discipline
SE Discipline
SE DisciplineSW
SW
Dis
cipl
ine
Disc
iplin
e
Core Processes Common to MultipleDisciplines
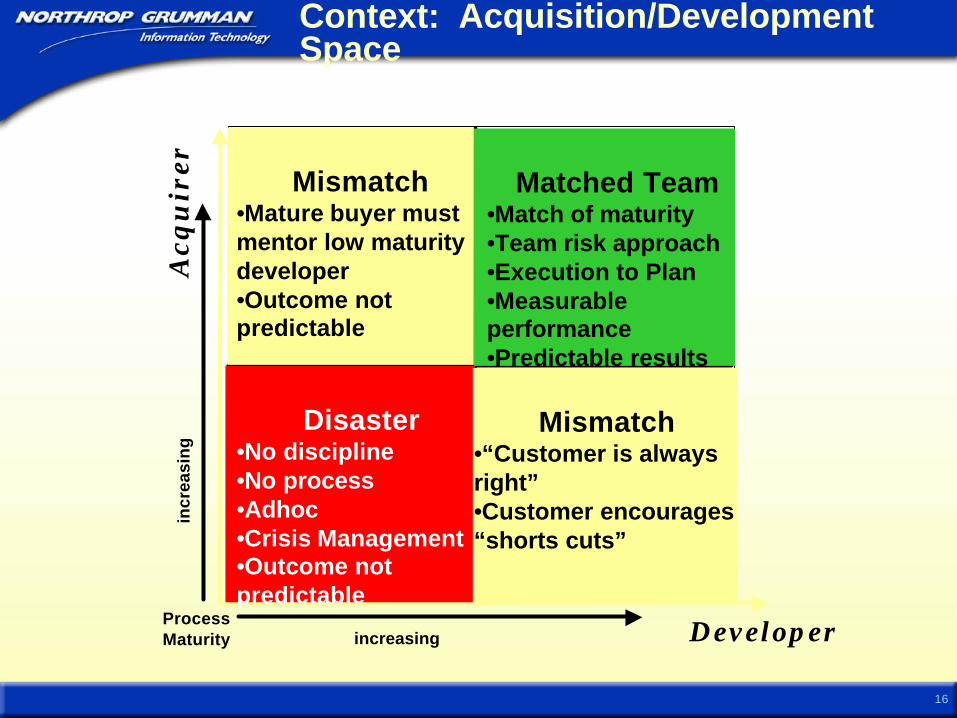
16
Context: Acquisition/DevelopmentSpace
Developer
Acq
uir
er Mismatch•Mature buyer mustmentor low maturitydeveloper•Outcome notpredictable
Matched Team•Match of maturity•Team risk approach•Execution to Plan•Measurableperformance•Predictable results
Disaster•No discipline•No process•Adhoc•Crisis Management•Outcome notpredictable
Mismatch•“Customer is alwaysright”•Customer encourages“shorts cuts”
ProcessMaturity increasing
incr
easi
ng
17
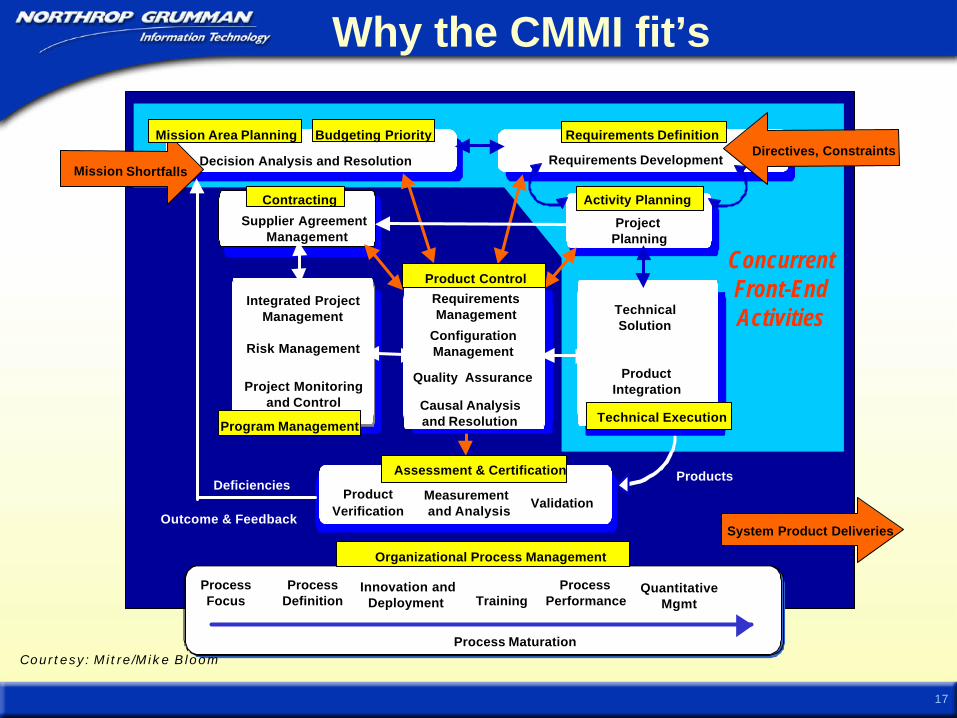
Why the CMMI fit’s
Decision Analysis and Resolution Requirements Development
System Product Deliveries
Project Planning
Supplier Agreement Management
Products
Outcome & Feedback
ProductVerification
ValidationMeasurementand Analysis
Deficiencies
Directives, Constraints
Contracting Activity Planning
Requirements DefinitionBudgeting Priority
Assessment & Certification
Integrated ProjectManagement
Project Monitoringand Control
Risk Management
TechnicalSolution
ProductIntegration
RequirementsManagement
ConfigurationManagement
Quality Assurance
Program Management Technical Execution
ProcessFocus
ProcessDefinition Training
QuantitativeMgmt
ProcessPerformance
Innovation andDeployment
Process Maturation
Mission Shortfalls
Organizational Process Management
Mission Area Planning
ConcurrentFront-EndActivities
Causal Analysisand Resolution
Product Control
Courtesy: Mitre/Mike Bloom