The International Journal of Systematic Innovation2)-09-Full Paper.pdf · The International Journal...
58
-
Upload
hoangkhuong -
Category
Documents
-
view
217 -
download
0
Transcript of The International Journal of Systematic Innovation2)-09-Full Paper.pdf · The International Journal...


The International Journal of Systematic Innovation
Publisher:
The Society of Systematic Innovation
Editorial Team:
Editor-in-Chief:
Sheu, Dongliang Daniel (National
Tsing Hua University, Taiwan)
Executive Editor:
Rau, Hsin (Chung Yun Christian
Univ., Taiwan)
Editors (in alphabetical order):
Chen. Grant (Southwest Jiaotong
University, China)
De Guio, Roland (INSA Strasbourg
University, France)
Domb, Ellen (The PQR Group, USA)
Filmore, Paul (University of
Plymouth, UK)
Feygenson, Oleg (Algorithm, Russia)
Ikovenko, Sergei (Gen 3 Corporation;
MIT, USA)
Lee, Jay (University of Cincinnati,
USA)
Lu, Stephen (University of Southern
California, USA)
Mann, Darrell (Ideal Final Result, Inc.,
UK)
Tan, R.H. (Hebei University of
Technology, China)
Editorial Assistant:
Jane, Chiou
Editorial Board Members: Including
Editor-in-chief, Executive Editor,
Editors, and Associate Editors.
Editorial Office:
The International Journal of Systematic
Innovation
6 F, # 352, Sec. 2, Guanfu Rd,
Hsinchu, Taiwan, R.O.C.
e-mail:
web site: http://www.IJoSI.org
ISSN (Print): 2077-7973 ISSN (Online): 2077-8767

INTERNATIONAL JOURNAL OF SYSTEMATIC INNOVATION
CONTENTS SEPTEM BER 2012 VO LU M E 2 ISSU E 2
FULL PAPERS An Innovative Product Design Approach Based on TRIZ
........................................................... Chun-Ming Yang, Ching-Han Kao and Thu-Hua Liu 01-08 A Phenomenological Model of Parameter Growth in Engineering Systems
......................................................................... Alexander I. Priven and Alexander T. Kynin 09-23 TRIZ Supporting the Project Management Effectiveness
................................................................................................................ José Jorge Monteiro 24-42
A New Perspective on EFL Teaching Applying Fuzzy QFD in TRIZ for Teaching Quality Improvement............................................................................................... Wan-Jeng Chang 43-53

C.M. Yang, C.H. Kao and T.H. Liu/ Int. J. Systematic Innovation, 2(2), 1-8 (2012)
1
An Innovative Product Design Approach Based on TRIZ’s Inventive
Principles
Chun-Ming Yang*, Ching-Han Kao and Thu-Hua Liu
Department of Industrial Design, Ming Chi University of Technology, Taishan, Taipei, Taiwan, R. O. C.
* Corresponding author, E-mail: [email protected]
Abstract
A systematic design approach with effective and efficient guiding principles is pivotal for developing versatile
and innovative products, which then lead to product success. This research aimed to propose an innovative
product design approach that incorporates TRIZ principles. This newly proposed approach started with iden-
tifying design issues or problems by conducting a comprehensive literature review with respect to the targeted
product. The revised three-step inventive problem solving procedure of Shulyak’s then formulated potential
design problems to generate the problem statement in a structured way. The three steps for solving an in-
ventive problem were: determining product’s characteristics that should be improved or eliminated, stating
characteristics needed to be improved to locate the potential contradictions of the problems, and eliminating
the contradictions by employing contradiction matrix to identify the proper inventive resolutions. The solution
concepts, as suggested from TRIZ’s principles, were generated after working through the procedures. They
can serve as design directions to improve and re-design the original product. Case studies were conducted to
demonstrate how this approach works. Study results show that the proposed approach can help product de-
signer or relevant profession develop innovative products effectively and efficiently, resulting in gaining bet-
ter competition in the marketplace.
Keywords: Innovative Product Design, Inventive Problem Solving, Systematic Innovation, TRIZ.
1. Introduction
The Product design generally determines more
than 70% of the total cost in the whole product devel-
opment (Boothrody, et al., 2002; Dowlatshahi, 1992;
Miller, 1995; Shetty, 2002). This suggests that mistakes
or successes in the conceptualization of a product often
have the greatest impact throughout the product devel-
opment. Furthermore, they tend to be amplified over
the course of the product development. Due to the na-
ture of the product development in the early phases,
chaotic, unpredictable and unstructured activities are
often expected and inevitable (Koen, et al., 2002).
These typical scenarios normally post great challenges
for a product to be designed and developed effectively
and successfully in the end. A sound product design
can then be highly rewarding, which will eventually
lead to a successful product that can be producible,
marketable, and profitable.
Product design can be considered as a process for
problem solving (Cross, 2000). A common strategy
used in this problem-solving process is random search
that is generally no apparent plan. This solution search
strategy is generally constraint to past experiences and
own specialties and disciplines that will influence and
dominate the search directions for solutions. These
never-ending random trials take huge effect to locate
the potential solutions, which are likely not existed in
the search region. And they couldn’t be very helpful to
deal with uncertainties in the earlier phases of the
product development and provide the needed infor-
mation and responses in a timely manner. To address
this issue, a systematic innovation approach is necessi-
tated to help point out the most promising solution di-
rections by enlarging solution search space and direct-
ing appropriate solution search across inter-disciplines.
TRIZ, a Russian acronym meaning theory of in-
ventive problem solving, can serve as one of the prom-
ising candidates to meet this requirement. Based on
analyzing numerous patents, TRIZ theory suggests that
design problems can be solved in predictable ways and
95% of the inventive problems in any particular field

C.M. Yang, C.H. Kao and T.H. Liu/ Int. J. Systematic Innovation, 2(2), 1-8 (2012)
2
have already been solved in some other fields
(Terninko, et al., 1998). Therefore, solving design
problems can be effective and efficient when the ap-
propriate solutions are found and implemented by fol-
lowing TRIZ principles. However, design problems are
mostly not well defined and relevant information is
normally limited. The classic TRIZ theory does not
provide tools to define problem situation and formulate
the problem. These post the difficulties for classic
TRIZ theory to deal with problem statement and situa-
tion analysis effectively (Dwyer, 2005; Terninko, et al.,
1998). Teaming up with problem formulation tools,
TRIZ then can serve better to offer innovative solution
concepts.
The remainder of this paper is structured as fol-
lows. Firstly, TRIZ theory, as the core of the proposed
approach, is introduced. This is followed by description
of the TRIZ-based systematic innovation product de-
sign process in details. Thirdly, case studies are pro-
vided. Finally, conclusions are presented.
2. Introduction to TRIZ
After reviewing and analyzing more than several
millions of patents, Genrich Altshuller, a former Soviet
Union inventor and scientist, introduced TRIZ. In the
era of cold war between east and west, TRIZ theory
was regarded as the state secret of the Soviet Union all
the time, the western countries knew little about it. Af-
ter the fall of Soviet Union, many TRIZ researchers
and practitioners have migrated to western countries
such as U.S. and Europe. In addition, Kishinev School,
known for its great reputation in teaching and re-
searching TRIZ in the Soviet Union, has established
branch schools in the western countries to continuously
promote and develop TRIZ (Terninko, et al., 1998).
TRIZ then begun to popularize and further develop in
the western countries rapidly. Many international com-
panies, such as, Ford, GM, Chrysler, and Xerox, have
been sponsored the development of TRIZ and inte-
grated TRIZ to their product design and development,
resulting in gaining great benefits (Domb, 2013; Dwyer,
2005). Companies, such as Samsung from South Korea,
were recovering from the verge of bankruptcies after
employing TRIZ.
The main theories of TRIZ include contradiction
analysis, substance-field method, ideal final result,
ARIZ (algorithm of inventive problem solving), etc.
(Ideation International Inc., 1999; Mann, 2007;
Terninko, et al., 1998). Among them, contradiction
analysis is one of the most popular ones in application.
Altshuller indicated that every innovative patent was
the result to solve an inventive problem, which nor-
mally contains some contradictions (Altshuller, 1998;
Altshuller, 1999). Contradiction is classified into phys-
ical and technical contradictions (Altshuller, 1998;
Altshuller, 1999). Physical contradiction is the conflict
within the same parameter that has the opposite states
co-existing at the same time. To eliminate physical
contradiction, separation principles are employed
(Mann, 2007; Terninko, et al., 1998). When improving
one parameter is causing the deterioration of another,
the conflict is named technical contradiction. To elimi-
nate technical contradiction, contradiction matrix,
made up by a 39 by 39 matrix, is utilized (Mann, 2007;
Terninko, et al., 1998). An innovative problem solving
method should be the one that can eliminate conflict or
contradiction in a problem effectively and efficiently
and help generate innovative solution. And TRIZ is the
one to serve this purpose well.
3. A TRIZ-based Method
Based on the creative design approach proposed
by Yang et al. (2010), this research proposed a struc-
tured and systematic innovation design process that
incorporates both TRIZ principles and a revised
three-step inventive problem solving procedure. Alt-
hough the original three-step inventive problem solving
process proposed by Shulyak (1997) is a sound prob-
lem formulation method to help solve inventive prob-
lems in conjunction with both contradiction matrix and
inventive principles of TRIZ, the forms (Form F-1 &
Form F-2) from the completion of the 3-step process
are designed with engineering terminologies, which
make them not friendly to some professions in product
design and development field, such as industrial de-
signers. To address this issue, a revised 3-step process,
designed from the perspective of the product design
and development, was proposed.
This research started with a comprehensive liter-
ature review on a targeted product to identify the po-
tential problems. The revised 3-step process was then
employed to translate the initial problem description
into the conflict or contradiction such that the contra-
diction matrix of TRIZ can be introduced to resolve the
problem and provide solution concepts. The revised
3-step process for solving an inventive problem is de-
scribed in the following:

C.M. Yang, C.H. Kao and T.H. Liu/ Int. J. Systematic Innovation, 2(2), 1-8 (2012)
3
(1) The first step, completed by filling out the Form
F-1, was to formulate the initial problem descrip-
tion and analyze the product to determine charac-
teristics that should be improved or eliminated. In
this step, there are five items to work with step by
step. Item one is to list the product name. Item two
is to define the goal of the product and how the
product is designed for. Item three is to list the
main elements and their corresponding functions.
Item four is to describe how to use the product.
Based on the information provided above, the last
item is to determine characteristics that should be
improved or eliminated.
(2) By following the analysis results of the first step,
the second step, completed by filling out the Form
F-2, was to analyze positive or negative character-
istics needed to be improved or eliminated in order
to identify the potential contradictions in the prob-
lem for resolution. In this step, there are two items
to work with step by step. Item one is to determine
the characteristics to be improved from TRIZ’s 39
generic characteristics for product improvement,
based on the product’s goal from Form F-1. Item
two is to determine the deteriorated characteristics
with respect to the characteristics to be improved.
(3) The third step, completed by filling out the Form
F-3, was to eliminate the contradictions, identified
from second step, by applying TRIZ’s problem
solving tool – contradiction matrix to locate ap-
propriate inventive principles for resolving the
problem. In this step, there are two items to work
with step by step. Item one is to identify the sug-
gested principles from TRIZ’s 40 Principles, after
applying contradiction matrix analysis. Item two is
to determine the proper inventive principles, which
are from the suggested principles of Item one, with
respect to each element of the product for design
improvement.
The suggested principles or solution concepts can
serve as design directions to improve and re-design the
original product with innovative ideas. If any of the
contradictions cannot be clearly identified after the
problem formulation, Liu’s method (Chen & Liu, 2001;
Liu & Chen, 2013) can be employed to help locate the
proper solution concepts. Another approach to deal
with no contradiction situation is to go through every
inventive principle and choose the most desired solu-
tion concepts (Shulyak, 1997).
4. Case Studies
The daily writing instrument, such as pen and
pencil, was selected as to demonstrate how this ap-
proach works. From the intensive literature review,
three major issues concerning daily writing instrument
design are needed to be improved. They are: assisting
people to write easily and smoothly, avoiding muscle
injury during the writing process, and assisting in
guiding people to use the correct writing posture
(Chang, et al., 2010). To deal with these issues, the
revised 3-step process was applied to formulate the
initial problem description and to help construct and
verify the conflict or contradiction. By completing each
item of Forms F-1 (shown in Table 1), the initial prob-
lem description was formulated to identify product’s
characteristics needed to be improved. They were core,
grip, and shaft of a pen. A typical writing instrument
can be improved by introducing a better core, grip, or
shaft design. To promote easily and comfortably writ-
ing experience, our aim was to design a better housing
or grip of the writing instrument. By completing Form
F-2 (shown in Table 2), all of TRIZ’s 39 characteristics
were investigated one by one with respect to the design
goals (item 2 from Table 1) and the product elements to
be improved (item 5 from Table 1). The characteristic
#12, i.e., shape, was then identified as the sole one
needed to be improved, while the deteriorated charac-
teristics were #7 (volume of a mobile), #13 (stability),
#32 (manufacturability), and #35 (adaptability). Four
technical contradictions were formulated as follows:
(TC-1) If the shape (characteristic #12) design of
the housing or the grip can be improved by introducing
a better one, then the volume of the writing instrument
(characteristic #7) will get worse.
(TC-2) If the shape (characteristic #12) design of
the housing or the grip can be improved by introducing
a better one, then the stability of the writing instrument
(characteristic #13) will get worse.
(TC-3) If the shape (characteristic #12) design of
the housing or the grip can be improved by introducing
a better one, then the manufacturability of the writing
instrument (characteristic #32) will get worse.
(TC-4) If the shape (characteristic #12) design of
the housing or the grip can be improved by introducing
a better one, then the adaptability of the writing in-
strument (characteristic #35) will get worse.
Finally, the contradiction matrix of TRIZ was ap-
plied to eliminate the contradictions specified above

C.M. Yang, C.H. Kao and T.H. Liu/ Int. J. Systematic Innovation, 2(2), 1-8 (2012)
4
and provides totally 15 inventive principles for resolv-
ing the problem (shown in Table 3).
After carefully reviewing the suggested princi-
ples with the consideration of three major design issues
(item 2 from Table 1) and main product elements (item
5 from Table 1) of writing instrument design improve-
ment, the researchers, with the aim of designing a bet-
ter housing or grip, made the judgment call to consider
four of the suggested principles as the most promising
ones and choose them as the re-design directions for
design improvement. The chosen principles (#1, #4,
#14, and #15) were employed to assess the potential
improvement of daily writing instrument (shown in
Table 3). Based on the product analysis from Form F-1
and previous study (Chang, et al., 2010), it was found
that the shaft (or housing) of the writing instrument
holds the main influence on design improvement, fol-
lowing by grip (or grip area) and core, which are all
utilized to support writing in an easy and comfortable
manner. The applicable chosen principles were as-
sessed with respect to the components of a writing in-
strument mentioned above. Selected examples on ap-
plying the inventive principles to generate feasible de-
sign directions are in the following.
Table 1. Formulation of Product’s Characteristic to Be Im-
proved.
F-1: Formulation of Product’s Characteristic to Be Improved
1. State the name of the product:
A typical writing instrument
2. Define the goal of the product. The product is designed to:
* Assisting people to write easily and smoothly
* Avoiding muscle injury and writing strain during the writing
process * Assisting in guiding people to use correct writing posture
3. List main elements of the product and their functions:
Element Function
Core To be applied to a surface of writing
Grip To support comfortable writing
Housing To be hold in writing
4. Describe the operation of the product:
A typical way to hold a writing instrument is three-finger grasp.
The writing instrument lies on the middle finger and is controlled using the thumb and index finger.
5. Determine the element of the product should be improved or
eliminated:
Core, Grip, or Housing (To improve the typical writing instrument by introducing a better core, grip, or housing design. )
Table 2. Formulation of Technical Contradiction.
F-2: Formulation of Technical Contradiction
1. State the characteristic that should be improved, based on the
goal from F1:
#12.Shape
2. State a characteristic that is getting worse under previous condi-tions: (State the technical contradictions)
Name of Technical
Contra-
dictions
Improved
Characteristic
Worsen Characteristic
TC-1 #12 Shape #7 Volume of moving object
TC-2 #12 Shape #13 Stability of object
TC-3 #12 Shape #32 Manufacturability
TC-4 #12 Shape #35 Adaptability
Table 3. Formulation of Solution Concept.
F-3: Formulation of Solution Concept
1. List suggested principles by eliminating the contradictions:
Name of
Technical Contra-
dictions
Coordinates
in the Con-tradiction
Matrix
Suggested
Inventive Principle
Name of the Principle
TC-1 #12 x #7 #14 Spheroidality
#4 Asymmetry
#15 Dynamicity
#22 Convert Harm into
Benefit
TC-2 #12 x #13 #33 Homogeneity
#1 Segmentation
#18 Mechanical Vibration
#4 Asymmetry
TC-3 #12 x #32 #1 Segmentation
#32 Changing the Color
#17 Transition Into a New Dimension
#28 Replacement of Me-
chanical System
TC-4 #12 x #35 #1 Segmentation
#15 Dynamicity
#29 Pneumatic or Hydrau-
lic Construction
2. Determine the proper principles for design directions:
#1. Segmentation , #4.Asymmetry, #14.Spheroidality, and #15.Dynamicity
(1) Principle 1 - Segmentation
For better writing results, the core of a writing
instrument can be divided into parts. The refillable pen
or pencil in the marketplace, such as the one shown in
Fig. 1, is a good example by applying this idea.

C.M. Yang, C.H. Kao and T.H. Liu/ Int. J. Systematic Innovation, 2(2), 1-8 (2012)
5
Fig. 1. Refillable Pencil (Pacific Writing Instrument, Inc., 2010).
(2) Principle 4 - Asymmetry
Without the proper guidance, the existing sym-
metrical barrel design is difficult to promote the correct
writing position. We normally have to accommodate
the existing design while writing, resulting in writing
strain. An asymmetrical shaft design could serve as
holding guidance to promote the correct writing posi-
tion. Handy Birdy Minny (as shown in Fig. 2), de-
signed by Tripod Design in Japan, is a good example
by applying asymmetry principle.
Fig. 2. Handy Birdy Minny (Tripod Design, 2013).
(3) Principle 14 - Spheroidality
The typical barrel design can be replaced with
spherical shapes to provide support while holding the
writing instrument in the writing process. This design
should help reduce writing strain and provide better
and more comfort control throughout the writing. A
good example to demonstrate this idea is U-Wing Pen
(as shown in Fig. 3), design by Tripod Design in Japan.
Fig. 3. U-Wing Pen (Tripod Design, 2013).
(4) Principle 15 - Dynamicity
To accommodate all users, the grip or support
area can be designed to adjust for various writing posi-
tions dynamically. Yoropen (as shown in Fig. 4), de-
signed by Yoropen Corp. in Taiwan, is a good example
to demonstrate this idea.
Fig. 4. Yoropen (Yoropen, 2013).
In addition, to further demonstrate how this
method could work on generating new design concepts
for writing instrument, several student designers were
recruited to participate in pen re-design based on the
proposed approach. The design goals and the typical
pen design analysis were provided and explained. The
four chosen principles (#1, #4, #14, and #15) with de-
tailed descriptions and examples were provided as the
re-design directions. Student designers employed the
suggested inventive principles as the stimuli to develop
the design concepts. The proposed design concepts are
shown in the following:
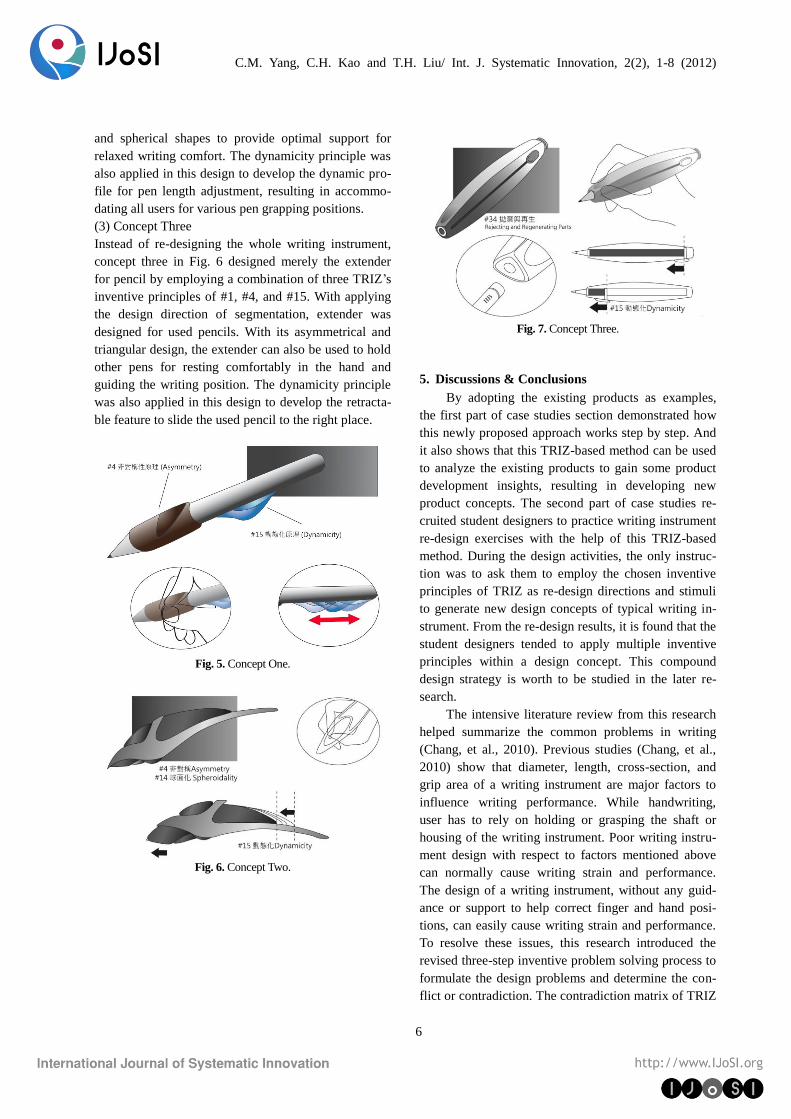
(1) Concept One
Concept one in Fig. 5 employed a combination of
two principles from the chosen ones, which were #4
and #15, to re-design the typical pen. By applying
asymmetry, the grip or support area was designed
asymmetrically and ergonomically to direct user fitting
in the more appropriated writing position and help re-
laxed writing comfort. The dynamicity principle was
applied to develop the flexible profile on the pen shaft
in order to let the pen rest well and comfortably in the
hand, which can serve as both writing position guid-
ance and relaxed writing.
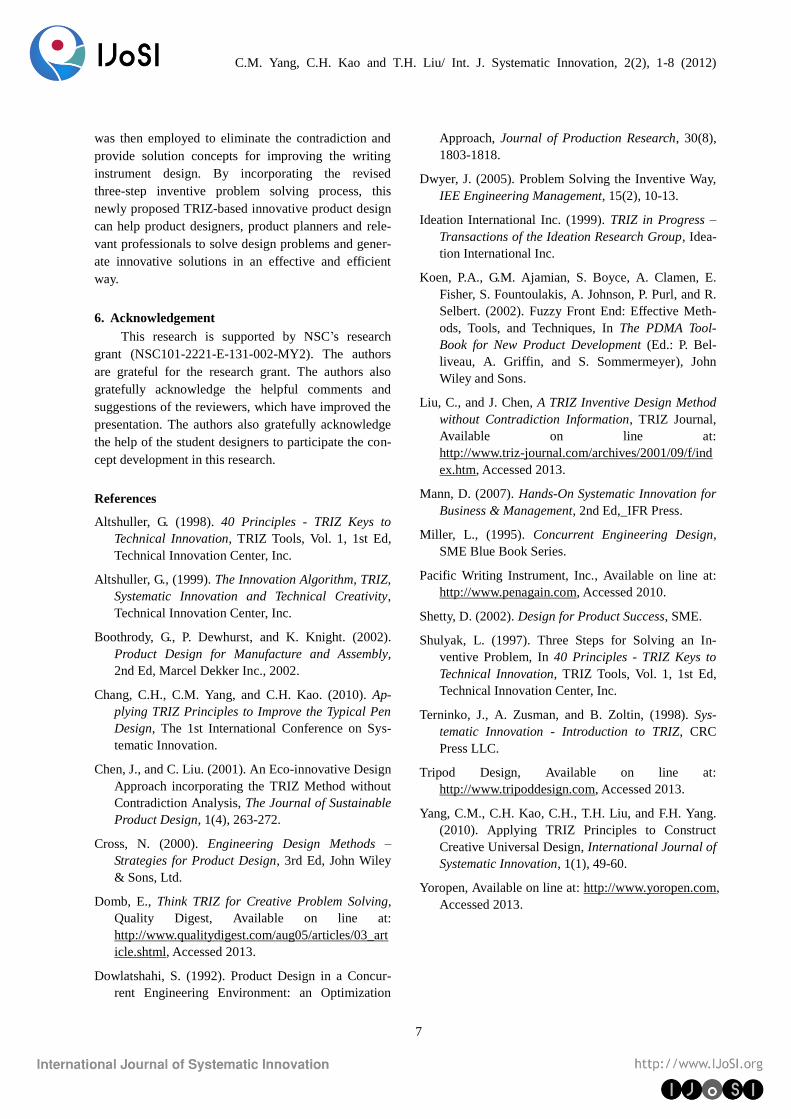
(2) Concept Two
Three principles from the chosen ones, which were #4,
#14, and #15, were incorporated in generating concept
two (as shown in Fig. 6) to re-design the typical pen.
By applying asymmetry and spheroidality, the typical
grip and barrel design was replaced by asymmetrical
C.M. Yang, C.H. Kao and T.H. Liu/ Int. J. Systematic Innovation, 2(2), 1-8 (2012)
6
and spherical shapes to provide optimal support for
relaxed writing comfort. The dynamicity principle was
also applied in this design to develop the dynamic pro-
file for pen length adjustment, resulting in accommo-
dating all users for various pen grapping positions.
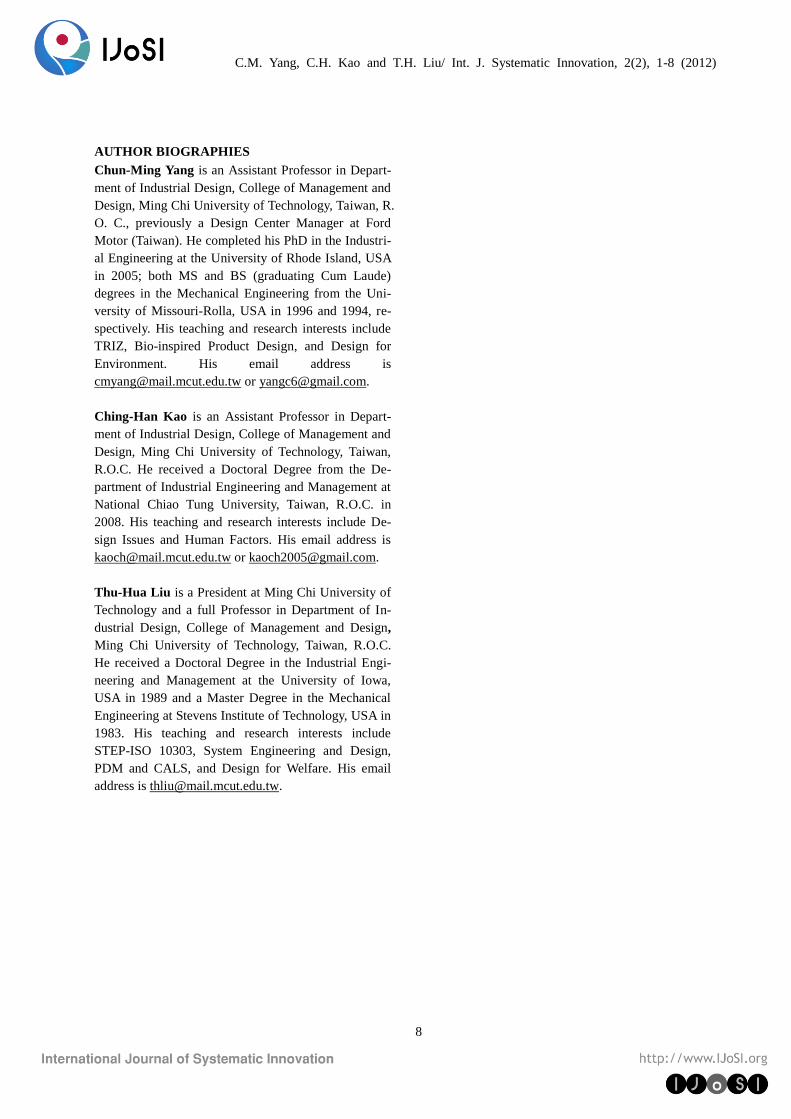
(3) Concept Three
Instead of re-designing the whole writing instrument,
concept three in Fig. 6 designed merely the extender
for pencil by employing a combination of three TRIZ’s
inventive principles of #1, #4, and #15. With applying
the design direction of segmentation, extender was
designed for used pencils. With its asymmetrical and
triangular design, the extender can also be used to hold
other pens for resting comfortably in the hand and
guiding the writing position. The dynamicity principle
was also applied in this design to develop the retracta-
ble feature to slide the used pencil to the right place.
Fig. 5. Concept One.
Fig. 6. Concept Two.
Fig. 7. Concept Three.
5. Discussions & Conclusions
By adopting the existing products as examples,
the first part of case studies section demonstrated how
this newly proposed approach works step by step. And
it also shows that this TRIZ-based method can be used
to analyze the existing products to gain some product
development insights, resulting in developing new
product concepts. The second part of case studies re-
cruited student designers to practice writing instrument
re-design exercises with the help of this TRIZ-based
method. During the design activities, the only instruc-
tion was to ask them to employ the chosen inventive
principles of TRIZ as re-design directions and stimuli
to generate new design concepts of typical writing in-
strument. From the re-design results, it is found that the
student designers tended to apply multiple inventive
principles within a design concept. This compound
design strategy is worth to be studied in the later re-
search.
The intensive literature review from this research
helped summarize the common problems in writing
(Chang, et al., 2010). Previous studies (Chang, et al.,
2010) show that diameter, length, cross-section, and
grip area of a writing instrument are major factors to
influence writing performance. While handwriting,
user has to rely on holding or grasping the shaft or
housing of the writing instrument. Poor writing instru-
ment design with respect to factors mentioned above
can normally cause writing strain and performance.
The design of a writing instrument, without any guid-
ance or support to help correct finger and hand posi-
tions, can easily cause writing strain and performance.
To resolve these issues, this research introduced the
revised three-step inventive problem solving process to
formulate the design problems and determine the con-
flict or contradiction. The contradiction matrix of TRIZ
C.M. Yang, C.H. Kao and T.H. Liu/ Int. J. Systematic Innovation, 2(2), 1-8 (2012)
7
was then employed to eliminate the contradiction and
provide solution concepts for improving the writing
instrument design. By incorporating the revised
three-step inventive problem solving process, this
newly proposed TRIZ-based innovative product design
can help product designers, product planners and rele-
vant professionals to solve design problems and gener-
ate innovative solutions in an effective and efficient
way.
6. Acknowledgement
This research is supported by NSC’s research
grant (NSC101-2221-E-131-002-MY2). The authors
are grateful for the research grant. The authors also
gratefully acknowledge the helpful comments and
suggestions of the reviewers, which have improved the
presentation. The authors also gratefully acknowledge
the help of the student designers to participate the con-
cept development in this research.
References
Altshuller, G. (1998). 40 Principles - TRIZ Keys to
Technical Innovation, TRIZ Tools, Vol. 1, 1st Ed,
Technical Innovation Center, Inc.
Altshuller, G., (1999). The Innovation Algorithm, TRIZ,
Systematic Innovation and Technical Creativity,
Technical Innovation Center, Inc.
Boothrody, G., P. Dewhurst, and K. Knight. (2002).
Product Design for Manufacture and Assembly,
2nd Ed, Marcel Dekker Inc., 2002.
Chang, C.H., C.M. Yang, and C.H. Kao. (2010). Ap-
plying TRIZ Principles to Improve the Typical Pen
Design, The 1st International Conference on Sys-
tematic Innovation.
Chen, J., and C. Liu. (2001). An Eco-innovative Design
Approach incorporating the TRIZ Method without
Contradiction Analysis, The Journal of Sustainable
Product Design, 1(4), 263-272.
Cross, N. (2000). Engineering Design Methods –
Strategies for Product Design, 3rd Ed, John Wiley
& Sons, Ltd.
Domb, E., Think TRIZ for Creative Problem Solving,
Quality Digest, Available on line at:
http://www.qualitydigest.com/aug05/articles/03_art
icle.shtml, Accessed 2013.
Dowlatshahi, S. (1992). Product Design in a Concur-
rent Engineering Environment: an Optimization
Approach, Journal of Production Research, 30(8),
1803-1818.
Dwyer, J. (2005). Problem Solving the Inventive Way,
IEE Engineering Management, 15(2), 10-13.
Ideation International Inc. (1999). TRIZ in Progress –
Transactions of the Ideation Research Group, Idea-
tion International Inc.
Koen, P.A., G.M. Ajamian, S. Boyce, A. Clamen, E.
Fisher, S. Fountoulakis, A. Johnson, P. Purl, and R.
Selbert. (2002). Fuzzy Front End: Effective Meth-
ods, Tools, and Techniques, In The PDMA Tool-
Book for New Product Development (Ed.: P. Bel-
liveau, A. Griffin, and S. Sommermeyer), John
Wiley and Sons.
Liu, C., and J. Chen, A TRIZ Inventive Design Method
without Contradiction Information, TRIZ Journal,
Available on line at:
http://www.triz-journal.com/archives/2001/09/f/ind
ex.htm, Accessed 2013.
Mann, D. (2007). Hands-On Systematic Innovation for
Business & Management, 2nd Ed,_IFR Press.
Miller, L., (1995). Concurrent Engineering Design,
SME Blue Book Series.
Pacific Writing Instrument, Inc., Available on line at:
http://www.penagain.com, Accessed 2010.
Shetty, D. (2002). Design for Product Success, SME.
Shulyak, L. (1997). Three Steps for Solving an In-
ventive Problem, In 40 Principles - TRIZ Keys to
Technical Innovation, TRIZ Tools, Vol. 1, 1st Ed,
Technical Innovation Center, Inc.
Terninko, J., A. Zusman, and B. Zoltin, (1998). Sys-
tematic Innovation - Introduction to TRIZ, CRC
Press LLC.
Tripod Design, Available on line at:
http://www.tripoddesign.com, Accessed 2013.
Yang, C.M., C.H. Kao, C.H., T.H. Liu, and F.H. Yang.
(2010). Applying TRIZ Principles to Construct
Creative Universal Design, International Journal of
Systematic Innovation, 1(1), 49-60.
Yoropen, Available on line at: http://www.yoropen.com,
Accessed 2013.
C.M. Yang, C.H. Kao and T.H. Liu/ Int. J. Systematic Innovation, 2(2), 1-8 (2012)
8
AUTHOR BIOGRAPHIES
Chun-Ming Yang is an Assistant Professor in Depart-
ment of Industrial Design, College of Management and
Design, Ming Chi University of Technology, Taiwan, R.
O. C., previously a Design Center Manager at Ford
Motor (Taiwan). He completed his PhD in the Industri-
al Engineering at the University of Rhode Island, USA
in 2005; both MS and BS (graduating Cum Laude)
degrees in the Mechanical Engineering from the Uni-
versity of Missouri-Rolla, USA in 1996 and 1994, re-
spectively. His teaching and research interests include
TRIZ, Bio-inspired Product Design, and Design for
Environment. His email address is
[email protected] or [email protected].
Ching-Han Kao is an Assistant Professor in Depart-
ment of Industrial Design, College of Management and
Design, Ming Chi University of Technology, Taiwan,
R.O.C. He received a Doctoral Degree from the De-
partment of Industrial Engineering and Management at
National Chiao Tung University, Taiwan, R.O.C. in
2008. His teaching and research interests include De-
sign Issues and Human Factors. His email address is
[email protected] or [email protected].
Thu-Hua Liu is a President at Ming Chi University of
Technology and a full Professor in Department of In-
dustrial Design, College of Management and Design,
Ming Chi University of Technology, Taiwan, R.O.C.
He received a Doctoral Degree in the Industrial Engi-
neering and Management at the University of Iowa,
USA in 1989 and a Master Degree in the Mechanical
Engineering at Stevens Institute of Technology, USA in
1983. His teaching and research interests include
STEP-ISO 10303, System Engineering and Design,
PDM and CALS, and Design for Welfare. His email
address is [email protected].
A.I. Priven, A.T. Kynin/ Int. J. Systematic Innovation, 2(2), 9-23 (2012)
9
A Phenomenological Model of Parameter Growth in Engineering
Systems
Alexander I. Priven1* and Alexander T. Kynin
2
1 GGA Software LLC, Newton, MA, USA
2 Department of Innovations, Saint Petersburg State Polytechnic University, Saint Petersburg, Russia
* Corresponding author, E-mail: [email protected]
Abstract
A new model for approximation and prediction of growth of the parameters of engineering systems is sug-
gested. The model derives the rate of growth not only from the considered system itself but also from the cus-
tomers’ expectations that play a role similar to the “driving force” in thermodynamics. The suggested model is
written in the form of the system of few differential equations that can be solved by numeric calculations,
similarly to the simulation of the structural and stress relaxation phenomena in super-cooled liquids. Some
examples of applications of the simplified model are presented.
Keywords: engineering system, technical system, growth, parameter, S-curve, model, relaxation
1. Background
The Theory of Inventive Problem Solving (TRIZ)
believes that development of the Engineering Systems
(ES) can be considered as an evolutionary process that
undertakes some general laws. The term “engineering
system”, in our consideration, means a “population” of
particular systems that satisfy a particular human need
in similar way like “car” (for transfer by road), “air-
craft” (for transfer by air), “photo camera” (for making
a picture by using optical lens), etc.
Although exact formulations of the laws of evolu-
tion of engineering systems are not known yet, many
rather common trends describing the development of
multiple particular systems seem to confirm the exist-
ence of such laws. For example, various engineering
systems (transport, weapons, information systems, etc.)
being developed become more powerful, more “dy-
namic”, better-controlled, less human-involved, etc.
(Leon, 2006).
Multiple investigations describe the progress of
particular kinds of systems in terms of the “evolution”
of the “key parameters”, e.g. speed and range for
transport, resolution and sensitivity for photo cameras,
power and weight for batteries, etc. (Martino, 1972 &
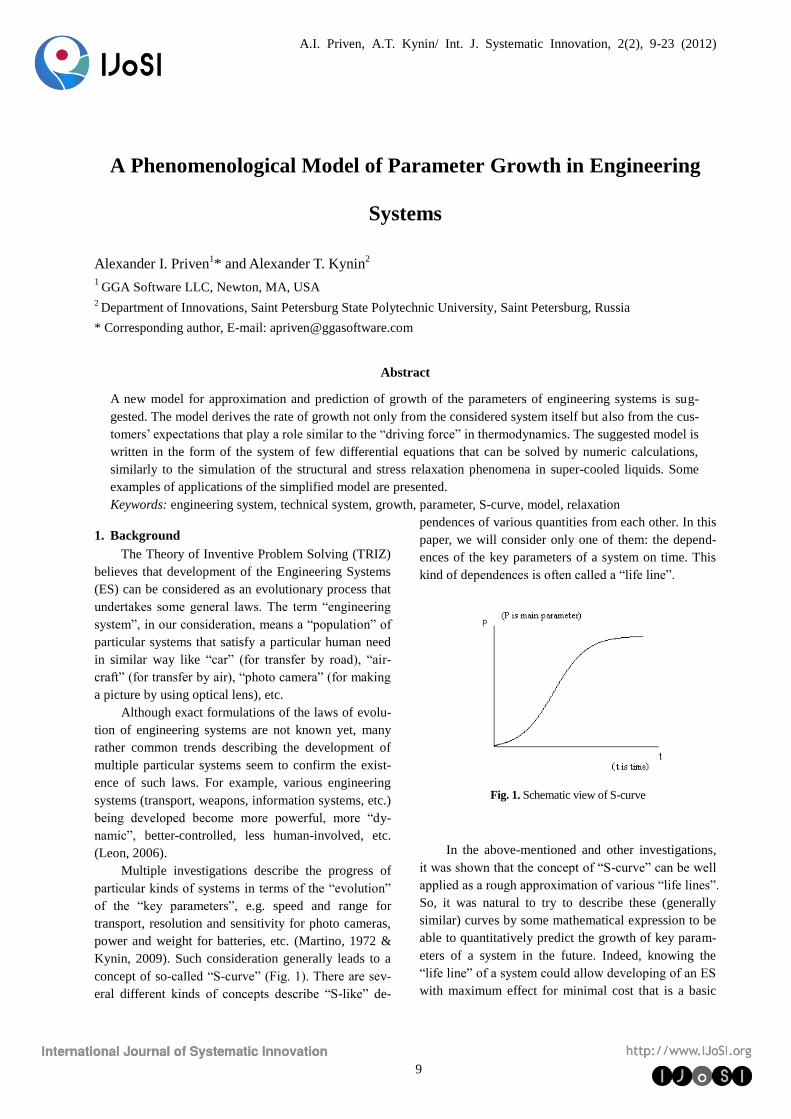
Kynin, 2009). Such consideration generally leads to a
concept of so-called “S-curve” (Fig. 1). There are sev-
eral different kinds of concepts describe “S-like” de-
pendences of various quantities from each other. In this
paper, we will consider only one of them: the depend-
ences of the key parameters of a system on time. This
kind of dependences is often called a “life line”.
Fig. 1. Schematic view of S-curve
In the above-mentioned and other investigations,
it was shown that the concept of “S-curve” can be well
applied as a rough approximation of various “life lines”.
So, it was natural to try to describe these (generally
similar) curves by some mathematical expression to be
able to quantitatively predict the growth of key param-
eters of a system in the future. Indeed, knowing the
“life line” of a system could allow developing of an ES
with maximum effect for minimal cost that is a basic

A.I. Priven, A.T. Kynin/ Int. J. Systematic Innovation, 2(2), 9-23 (2012)
10
idea for the “Directed Evolution” concept (Zlotin,
2001).
For that, multiple approaches were proposed.
Bass (1969), Kohlrausch (1863), Modis (1992) etc.
described multiple more or less simple equations that
can more or less correctly describe the growth of vari-
ous characteristics of ES. In this way, however, serious
problems appeared.
First, not all of the systems (and surely not all of
their key parameters) demonstrate the S-like behavior.
Kynin (2010) mentions that we considered the exam-
ples of abrupt halts and rather long delays in the “life
lines” of key parameters of multiple systems. These
events are usually very difficult to forecast. As a
demonstrative example, we can mention serious prob-
lems of the Microsoft Corporation with the OS Win-
dows Vista. This operating system has been developed
under the assumption that the growth of the clock rate
of PC processors described by nearly exact exponential
curve (twice growth each ~18 months) during several
decades could be extrapolated for the next few years.
However, after reaching about 3 GHz, this characteris-
tic suddenly stopped its growth, and now we mostly
use the processors with virtually the same clock rate as
it was 3-5 years ago. The “physical barrier” has been
achieved instantly and manifested as a break point in-
stead of expected “smooth” slowing the growth rate. As
a result, the operating system optimized for 10-20 GHz
did not satisfy most of customers having “slow” 2-3
GHz computers.
Second, sometimes the market seems not “to like”
the improvements of the systems and does not accept
the products with seemingly quite better characteristics.
This situation can be considered as opposite to previ-
ous one. For example, it is easily possible to develop a
locomotive with the speed of ~250 km/h able to be
used in conventional railroads. These locomotives re-
ally exist and even are commercially used somewhere,
e.g. on the route Moscow – St. Petersburg in Russia.
However, the typical maximum speed of conventional
locomotives is now nearly the same as it was half a
century ago: somewhat about 120 km/h. Improvement
of this characteristic is accepted by market only for the
next generation of the railroad transport that uses other
types of ways (Kynin, 2011). In this case, investments
to a system did bring the expected technical result – but
this result was not required by the infrastructure. This
situation is known in the scientific world as “good
enough”.
Sometimes, however, the key parameters of a sys-
tem which typical values did not change for long
enough time (see above), suddenly start to grow again.
Kynin (2011) considered several examples of this kind
and concluded that such behavior can often be ex-
plained as a result of competition with a new system
with potentially better characteristics.
The above-described kinds of behavior of the “life
lines” seem not to be predictable by using the men-
tioned approaches that consider only a system itself,
without its competitors and surroundings. Below we
suggest a new approach that allows, at least theoreti-
cally, description of above-mentioned behavior of the
“life lines”. However, in the simplified model de-
scribed below we consider only the “regular” case i.e.
growing the main parameter of a system to some limit.
The idea of simulation is borrowed from chemical
thermodynamics where any process is described in
terms of current state, external conditions, target state,
driving force and internal parameters (“order parame-
ters”). Certainly, for an engineering system it is, in
general, very difficult to apply this approach in its
“pure” form because even if we define all required pa-
rameters of a considered system and all of its competi-
tors it might be very difficult (if possible at all) to ex-
actly determine their numeric values. However, there is
a simulation that can quantitatively describe the be-
havior of complicated systems with big (or even infi-
nite) number of “order parameters” under arbitrary
external conditions. This is the simulation of structural
and stress relaxation in in amorphous materials like
glasses and polymers (Scherer, 1986).
Within the frames of this approach, the process in
a system is described in terms of equilibrium and
non-equilibrium states according to Le Chatelier's
principle. The equilibrium state of a system is deter-
mined as a state having no tendency to change in time
under given (constant) external conditions. Each par-
ticular combination of external conditions corresponds
to one and only one equilibrium state of the system. In
each particular equilibrium state, the system has con-
stant characteristics (physical properties) that do not
depend on the way of achieving it. Any change of the
external conditions causes so-called relaxation process
in the system that tends to come to new equilibrium
state corresponding to new conditions. Multiple
changes of the external conditions cause multiple re-
sponses, each of them being independent of all others
(superposition of responses). Changes of multiple ex-
ternal conditions cause multiple responses independent
of each other (superposition of excitations). Each re-
laxation process in the system is a linear combination
of multiple “particular” relaxation processes, each of
A.I. Priven, A.T. Kynin/ Int. J. Systematic Innovation, 2(2), 9-23 (2012)
11
them being characterized by a single internal parameter
of the system that determines the time scale of the pro-
cess (“relaxation time”). Relaxation times of particular
relaxation processes depend on a single integral char-
acteristic that can be represented as a function of all
internal parameters of the system (cooperative change
of relaxation times). Each particular relaxation process
is governed by its “driving force” determining the de-
viation from equilibrium state and relaxation time de-
termining the rate (“speed”) of coming to equilibrium.
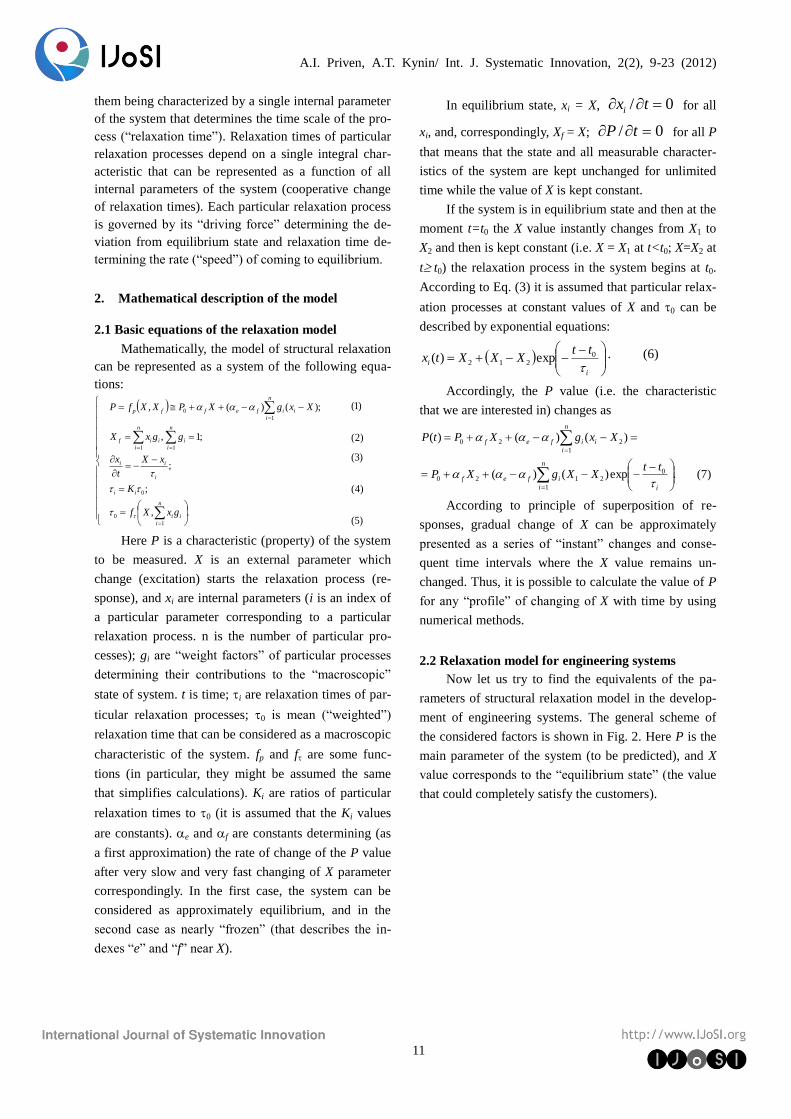
2. Mathematical description of the model
2.1 Basic equations of the relaxation model
Mathematically, the model of structural relaxation
can be represented as a system of the following equa-
tions:
.,
;
;
;1,
;)()(,
1
0
0
11
1
0
n
i
ii
ii
i
ii
n
i
i
n
i
iif
n
i
iifeffp
gxXf
K
xX
t
x
ggxX
XxgXPXXfP
)5(
)4(
)3(
)2(
)1(
Here P is a characteristic (property) of the system
to be measured. X is an external parameter which
change (excitation) starts the relaxation process (re-
sponse), and xi are internal parameters (i is an index of
a particular parameter corresponding to a particular
relaxation process. n is the number of particular pro-
cesses); gi are “weight factors” of particular processes
determining their contributions to the “macroscopic”
state of system. t is time; i are relaxation times of par-
ticular relaxation processes; 0 is mean (“weighted”)
relaxation time that can be considered as a macroscopic
characteristic of the system. fp and f are some func-
tions (in particular, they might be assumed the same
that simplifies calculations). Ki are ratios of particular
relaxation times to 0 (it is assumed that the Ki values
are constants). e and f are constants determining (as
a first approximation) the rate of change of the P value
after very slow and very fast changing of X parameter
correspondingly. In the first case, the system can be
considered as approximately equilibrium, and in the
second case as nearly “frozen” (that describes the in-
dexes “e” and “f” near X).
In equilibrium state, xi = X, 0/ txi for all
xi, and, correspondingly, Xf = X; 0/ tP for all P
that means that the state and all measurable character-
istics of the system are kept unchanged for unlimited
time while the value of X is kept constant.
If the system is in equilibrium state and then at the
moment t=t0 the X value instantly changes from X1 to
X2 and then is kept constant (i.e. X = X1 at t<t0; X=X2 at
t t0) the relaxation process in the system begins at t0.
According to Eq. (3) it is assumed that particular relax-
ation processes at constant values of X and 0 can be
described by exponential equations:
i
i
ttXXXtx
0
212 exp)( . (6)
Accordingly, the P value (i.e. the characteristic
that we are interested in) changes as
n
i i
ifef
n
i
iifef
ttXXgXP
XxgXPtP
1
02120
1
220
)7(.exp)()(
)()()(
According to principle of superposition of re-
sponses, gradual change of X can be approximately
presented as a series of “instant” changes and conse-
quent time intervals where the X value remains un-
changed. Thus, it is possible to calculate the value of P
for any “profile” of changing of X with time by using
numerical methods.
2.2 Relaxation model for engineering systems
Now let us try to find the equivalents of the pa-
rameters of structural relaxation model in the develop-
ment of engineering systems. The general scheme of
the considered factors is shown in Fig. 2. Here P is the
main parameter of the system (to be predicted), and X
value corresponds to the “equilibrium state” (the value
that could completely satisfy the customers).

A.I. Priven, A.T. Kynin/ Int. J. Systematic Innovation, 2(2), 9-23 (2012)
12
Fig. 2. Schematic view of factors considered by the model
We do not know exactly which characteristic can
be considered as the main parameter for a given system.
In terms of TRIZ, this characteristic can be presented
as an analog of “ideality” that is determined as a ratio
of “sum of profits” to “total cost” where the latter one
includes cost and harmful side effects caused by the
development, production, use and utilization of the
system. It is also possible to consider the reciprocal
characteristic: acceptable cost of a unit of the main
parameter of the system. Thus, the X value can be rep-
resented as AC/MP or MP/AC where AC is Acceptable
Cost and MP means the value of the Main Parameter of
the system. For example, if the main parameter of a
digital camera is its resolution (that was actual few
years ago) then X value would be determined as ac-
ceptable cost of the resolution of 1 pixel of a picture, or
as the number of pixels acceptable for 1 dollar of the
cost of camera. It is also possible to use the logarithmic
scale, namely:
)log()log()/log( ACMPACMPP . (8)
To judge if this assumption is correct or not we
need additional investigations. However, even without
clarification of this or other choice, we can assume that
some external characteristic plays the role of X-value.
Thus, we can try to fit this value and its growth empir-
ically without loss of generality of the model.
The sense of the “internal” parameters of the sys-
tem (xi) is most difficult to realize in the structural re-
laxation model. No exact meaning of these parameters
exists. The structure relaxation model does not require
ascribing exact sense to these parameters: it is quite
satisfactory to determine them empirically as “some-
thing in the system”.
Now let us focus at the relaxation times i. These
parameters determine the time required for decreasing
the F value for e times (e 2.718 is the base of natural
logarithms) under the constant X value, i.e., in our case,
increasing the main parameter of the system for e times.
It is known that in some practical cases this value is
approximately constant for rather long time. For exam-
ple, for various characteristics of computers (clock rate
of main processor, RAM memory size, typical capacity
of the hard drive, etc.) this situation was observed dur-
ing about half a century, from 1950th
to the beginning
of 2000th (the so called Moore’s law); the typical
values were about 2-4 years all this time. However, for
particular engineering systems this characteristic is
usually not constant and tends to increase with time.
According to Leon (2006), exponential growth is only
an extreme scenario of evolution that is normally ob-
served only in the beginning of the system evolution.
As far as the system comes nearer to its physical limit
of growth, the “normal” relaxation time increases, with
a tendency to infinity when this limit is achieved. So,
let us suggest the simplest equation that describes this
behavior:
ii
i
ii
ii
XX
K
XX
K
loglog)/log( max,max, (9)
where Ks is normally a constant for a given system,
and Xmax is the limit (or barrier) for the X value.
It is known however that big enough investments
can greatly accelerate the progress of the system, i.e. to
reduce the relaxation time 0. Let us implement a new
term to Eq. (9) to consider the effect of investments:
ii
ii
XX
K
loglog max, . (10)
The quantity should demonstrate the following
behavior:
.investment possible maximumat0
;investmentspecial noat 1
This means that at normal investment we have
“natural” growth curve (with decreasing the rate with
time), and at maximal investment the growth rate is
kept nearly constant, only slightly depending on the
difference between X and Xmax. The simplest expression
having these properties is
dtdI
kt
/exp)( , (11)

A.I. Priven, A.T. Kynin/ Int. J. Systematic Innovation, 2(2), 9-23 (2012)
13
where dI/dt is the invest to the considered system per a
unit of time, and k is a constant. However, for short
enough periods of time, we can neglect the time de-
pendence of considering it as a constant for a given
system.
Then we have to specify the expression for Ki.
From very general consideration, we know that nor-
mally the rate of technical progress exponentially in-
creases with time (Wikipedia, 2014). In terms of our
model, it means that the values of Ki can be considered
as functions of the total time starting from the first
(working) appearance of the system:
s
ii
K
tK exp , (12)
where ti is the time difference between the moments
when the system itself and a given kind of this system
appeared, and Ks is a constant for the system. For ex-
ample, in a system with Ks = 1 year the relaxation time
of each new “generations” will be diminished for e
times every year.
3. Simplified model and its practical application
3.1. Simplification of the model
The above-described model is able (at least, in
principle) to describe various complex scenarios of the
development of Engineering Systems. For that, one
needs to determine the parameters that describe the
considered system itself, its competitors and the sur-
roundings.
However, we consider it reasonable to start the
verification of the model with the simplest (but im-
portant for practice) case of behavior: monotonic
growth without halts as depicted in Fig. 2. We believe
that if a model of some phenomena is correct then the
simplest behavior should be properly described by the
simplest case of the model. So, let us try to simplify the
model in maximum possible extent and then try to ap-
ply it to the description and prediction of monotonic
growth of the engineering systems.
The main simplification is to drop multiple relax-
ation processes off and to consider only one of them.
This simplification turns the system of equations (1-5)
to the following form (as far as we have only one re-
laxation process, the indexes i are also dropped):
.loglog
;
;)(
max
0
xx
K
xX
t
x
xXPP
s
fef
)15(
)14(
)13(
Then let us consider the P value being the main
parameter of the system, without its attribution to cost.
This simplification is equivalent to the assumption that
the cost of the unit of the main parameter changes
much slower than this parameter itself.
Next, let us assume that αf <<αe, i.e. that the
changes of x-value in the “frozen” state are negligible.
This assumption allows dropping the X-value from
Eq. (13):
P = P0 + αf x. (16)
Correspondingly, the X-value becomes some ex-
ternal function that can be considered independently of
other characteristics describing the system itself. We
can assume that for the systems demonstrating similar
behavior, the time dependences of X-values would also
be similar. As far as we postulate this similarity, it be-
comes natural to reduce them to some universal “mas-
ter curve”. For that, we consider it reasonable to intro-
duce some “reduced parameters” tr and Pr instead of
time t and growing parameter P:
tr = (t – t0) / Ks; (17)
Pr = (P – P0) / (Pmax – P0); (18)
r = / Ks, (19)
where t0 is the moment of time when the system was
appeared, P0 is the value of P-parameter at this moment,
and Pmax is the maximum value of P (i.e. the limit of
the development).
Last, as far as we consider the P value propor-
tional to x there is no more need to use the last value.
We can rewrite all equations directly substituting Pr for
x. After all mentioned substitutions we finally have:
.log
1
;
r
r
r
rr
P
PX
t
P
)21(
)20(

A.I. Priven, A.T. Kynin/ Int. J. Systematic Innovation, 2(2), 9-23 (2012)
14
After reduction, the model can be presented as
shown in Fig. 3.
Fig. 3. Schematic view of the reduced model
The difference (X – Pr) corresponds to the “driv-
ing force” of the relaxation process, and the difference
(1 – Pr) describes the remained resource of the main
parameter’s growth.
The S-shaped form of the curve calculated by the
model is caused by the specific change of the deriva-
tive Pr/t according to Eqs (20) and (21): both the
numerator and denominator of Eq. (20) continuously
grow with time but the growth curves are different as
shown in Fig. 4.
Fig. 4. Schematic explanation of S-shaped growth
Thus, we only need to determine the function
X = f(tr) to be able to perform practical calculations.
After some trials, we came to conclusion that for
most practical S-curves, one of the following two
equations for X-function is applicable:
X (tr) = tr (22)
or
X (tr) = exp(2tr – 3.67). (23)
The functions (22) and (23) describe the S-curves
with fast and slow starting parts correspondingly.
The equations (17-23) allow calculation of the
growth curve for an arbitrary growing variable P for
which the following values are known:
P0 and Pmax: minimum and maximum values
(in practice, the P0 value can often be consid-
ered as zero);
t0: moment of time when the considered sys-
tem appeared;
Ks and : parameters of the model;
Kind of X-function: either (22) or (23).
Detailed description of the calculation algorithm is
presented in the Appendix 1.
3.3. Data processing
When applying the model, three questions arise:
(1) how to find the main parameter of the system,
which is usually a complex parameter, i.e. some rela-
tionship of particular parameters of the system (Kynin,
2009). (2) how to determine the limit of growth Pmax in
advance, and (3) how to determine the model parame-
ters Ks and .
Our approach determines the main (complex) pa-
rameter of the system (Priven, 2011 & 2012). Shortly,
as far as we consider the main parameter as something
that customers are ready to pay for, it is natural to ex-
pect significant positive correlation of this parameter
with the total cost of the system. In a particular case
when the major constituent of the total cost is the cost
of the product, we can expect significant positive cor-
relation between the values of the main parameter and
the market prices of best-selling items. An example of
such correlation for laser printers is presented in Fig.5.
(We consider only mid-price range: for the cheapest
printers the market price cannot be considered as a
main constituent of the total cost whereas the most ex-
pensive printers are not in competition with considered
ones.) Some other requirements to complex parameter
are considered in Priven’s work (2011).

A.I. Priven, A.T. Kynin/ Int. J. Systematic Innovation, 2(2), 9-23 (2012)
15
0 10 20 30 40 50 60 70
500
1000
1500
List
pric
e, U
S$
Speed * resolution, (ppm * dpi * 0.001)
Fig. 5. Correlation between the main parameter of laser
printers and market price (for the range from 400 to 1500$)
of the best items according to five independent consumers’
and experts’ ratings (see refs in Priven, 2011 & 2012).
The limit of growth Pmax can be determined in two
ways: as one of the fitting parameters of the model or
from some external reasoning, such as physical limits
for a given operation principle. Detailed consideration
of the problem requires a special publication. Shortly,
as far as the model contains only two fitting parameters
it is possible to add Pmax as the third fitting parameter
and find its value together with Ks and , e.g. by least
square method.
After the complex parameter of the system is
found and the parameters of the model are determined,
it is possible to perform the calculations as described
above.
3.4. Examples of practical application
In Fig. 6, the results of numerical simulation with
five combinations of parameters and X = f(t) are
presented. Below we consider some practical situations
where the “life lines” have shapes of these curves.
From this picture, we can see that the model, even
after drastic simplification, is able to describe various
forms of the growth curves including such effects as
diverse asymmetry, fast and low start, abrupt stopping
the growth, etc.
0 1 2 3 40.0
0.2
0.4
0.6
0.8
1.0
5
3
4
2
1
Pa
ram
ete
r P
Time
Fig. 6. Results of simulation by the suggested simplified model
with different values of parameters:
1: X = t; = 1; 2: X = t; = 0.7; 3: X = t; = 0.1; 4: X =
exp(-3.7 + 2 t); = 1; 5: X = t; = 0.7. In all cases, we set Ks = 1,
f = 0; e = 1; x1,max = 1; P0 = 0.
Below we demonstrate some examples of com-
parison of the model with factual data (Sood,
2005&2009, Tsao, 2004, Intel, 2011, Brodrick, 2013),
the data shows the development several systems. The
source data are presented in the Appendix 2.
In Fig. 7, growth curves of the key parameters of
CRT monitors (product of diagonal size and resolution)
and dot matrix printers (product of printing speed and
resolution) are presented. These variables were selected
as complex parameters describing the most important
characteristics of corresponding systems, which are the
Main Parameters of Value in terms of TRIZ (Efimov,
2011).
The considered systems were selected as far as
their evolution is now virtually completed (they exist
only in the narrow market niches), so that it is possible
to overview the whole curves. However, for determina-
tion of the model parameters, we used only the starting
(left) parts of both curves; the right parts were used for
model validation. The value of Pmax was considered in
this case as a fitting parameter; in Fig. 7b, we demon-
strate several variants of such fitting for several differ-
ent starting segments of the curve. As we can see from
the figure, the results of calculation (presented the Ta-
ble 1 of the Appendix 2) are in good accordance with
actual data.

A.I. Priven, A.T. Kynin/ Int. J. Systematic Innovation, 2(2), 9-23 (2012)
16
1985 1990 1995 2000 2005
10
20
30
40
50
60
70
80
90
100
prediction area
fitting area
actual data
approximation
Dia
gonal *
resulu
tion,
[Inch (
pix
el /
inch
2)
* 0.0
01]
Year
a
b
Fig. 7. Growth of the key parameters of CRT monitors
(a) and dot matrix printers (b) (Sood, 2009).
In Fig. 8, we made some prognosis for the growth
of the effectiveness of the electric lamps.
Like previous picture, markers mean actual data
and curves show the results of simulation. Judging
from our modeling, we expect maximum effectiveness
of lamps come to approximately 240 Lm/Wt in 2020.
3.4. Specific case: simulation of the “Moore’s law”
In Fig. 9 we consider growing the clock rate of
processors of personal computers (PC) starting from
the appearance of Pentium processor. In this case, we
used logarithmic scale that is only available for predic-
tion in the case when a well-developed system contin-
ues huge growth. In this case, the model predicts abrupt
stopping the growth. The exact value at which the
growth is to be stopped is not predictable by the model;
however, the model properly predicts that no “precur-
sors” of such behavior occur (see above). The actual
data are in good accordance with this prediction.
Fig. 8. Growth of the effectiveness of the electric lamps
(Tsao, 2004)
Fig. 9. Growth of the clock rate of personal computers
(in semi-logarithmic scale) (Intel, 2011)
Let us describe this example in more detail. As it
was stated above, this engineering system demonstrat-
ed exponential growth of their characteristics that is
often called “the Moore’s law” (Hutcheson, 2005):
)exp(~; 0ttPPkdt
dP . (24)
Considering the fact that the average cost of per-
sonal computers very slightly changes with time (a
contemporary notebook with middle characteristics
costs nearly the same as PC XT twenty years ago), we
can conclude that the “life line” shown in Fig. 5 can be
applied to the acceptable cost as well. Let us remind
that the P value in this case means the logarithm of the
clock rate.
Such behavior can be simulated by the suggested
model (again, with a single relaxation process) in the
case when the relaxation time 0 and the term (X – Pr)
in Eq. (20) remains constant, regardless of the distance
from the current Pr value to the limit (Pr,max 1). The
latter feature corresponds to 0 in Eq. (21). This spe-
cific situation means that whatever the value of the

A.I. Priven, A.T. Kynin/ Int. J. Systematic Innovation, 2(2), 9-23 (2012)
17
main parameter of the system would be, the surround-
ings (customers, infrastructure, etc.) requires its further
growth, regardless of the cost of its improvement. In
fact, this situation is close to the struggle against a
global threat when to survive is much more important
than to save cost. Indeed, we can observe such situation
in the history of wars.
However, the above-described situation can also
be made artificially, without any external threat. For
that, we only should assume that the system, for some
reason, has unlimited resources. Now let us ask our-
selves a question that is commonly used in so-called
“failure analysis approach” (Kaplan, 1999) widely
known in TRIZ: how to force the environment (i.e.
human society including manufacturers, buyers, gov-
ernments etc.) not to spare the resources for a system?
As far as we formulate this question, the answer be-
comes obvious: somebody in the surroundings should
get benefits that grow with growing the key parameter
of a system. In essence, it means the positive feedback
between the activity of the system and the environ-
mental benefits; in other words, there must be a couple
of synergists that amplify each other as a result of their
activity.
If we consider development of personal computers
from this viewpoint, we can easily find that the growth
of the key parameters of computers really gets addi-
tional benefits to the computer industry, and the soft-
ware developers play the role of synergists for hard-
ware producers. Indeed, the more resources the hard-
ware gives the more complicated – and more conven-
ient – new software can be developed for this hardware.
This stimulates the further growth of the characteristics
of the hardware in turn. Realizing this situation, the
software developers did the next step: they artificially
stimulated hardware producers to increase the re-
sources more and more to accelerate the “aging” of the
software. This meant that the computer programs that
essentially satisfy most of customers do not work in
new computers because of the lack of resources. Thus,
the customers who want to use the contemporary (the
most convenient) software are forced to update the
hardware, after which they need new version of the
software in turn. Actually, the cost of the R&D in the
computer industry ceased to play a role of the “bottle-
neck”, i.e. the hardware developers had virtually “infi-
nite” resources for improving the hardware.
If we now return to Eq. (21) above then we come
to a conclusion that as far as the main parameter of a
system approaches to its limit the base of the denomi-
nator of the right part of this equation tends to zero:
0)1log1(logloglog max, rr PP , and even small
power index cannot prevent fast growth of the relax-
ation time . In other words, the growing process
should be rapidly stopped near to the mentioned limit.
The Fig. 5 shows that this is exactly what we ob-
serve: the growth of the clock rate rapidly stopped near
3 GHz after exponential growing during more than 20
years.
4. Relaxation model and Synergetics
Now it is common knowledge that the evolution
of self-developing systems can be described within the
frames of synergetics. This branch of knowledge has
been first developed by Ilia Prigogine and its cowork-
ers. (Prigogine, 1969) The “synergetic” ideas are now
widely used for descriptions of evolution in various
kinds of natural and artificial systems. We believe that
the basic concepts of the synergetic theory can be ap-
plied to the evolution of the engineering systems as
well.
In this connection, we have to note that the struc-
tural relaxation model that we used as a base for the
suggested model uses the concepts that are essentially
similar to synergetics. Volkenstein (1956) & Mazurin
(1986) mention the structural relaxation was consid-
ered within the frames of thermodynamics. From these
works, one can conclude that the phenomenon of
structural relaxation simulated by this model concerns
essentially the same kind of behavior as synergetics
does: thermodynamically non-equilibrium state.
In our previous paper (Priven, 1987), it was
shown that under some external conditions the struc-
tural relaxation demonstrates the behavior which is
similar to the synergetic systems: in particular, it be-
comes difficult to exactly predict because of appear-
ance of positive feedback between excitation and re-
sponse. In the present model, such positive feedback
also can appear that we showed in the last example.
Above we showed that multiple features that can
be observed in the “life lines” of real engineering sys-
tems can be easily simulated by using an essentially
very simple model that is based on very common as-
sumptions (such as superposition, equilibrium, relaxa-

A.I. Priven, A.T. Kynin/ Int. J. Systematic Innovation, 2(2), 9-23 (2012)
18
tion, etc.). We believe that the further development of
the model would help to describe and predict multiple
features of behavior of engineering systems that are
now very difficult to simulate and properly predict.
5. Conclusion
A new model of evolution of engineering systems
is suggested on the base of a known model that de-
scribes the phenomenon of structural relaxation in
amorphous physicochemical systems. This model uses
the concepts of equilibrium and non-equilibrium states
of a system, Le Chatelier's principle of tending of a
system to equilibrium, multiple particular (elementary)
processes impacting the “visible” results, superposition
and cooperation of these processes.
The model is (at least, in principle) able to explain
some specific behavior of engineering systems that has
been observed in practice and (in our opinion) unlikely
can be properly described within any of existing mod-
els and approaches taken one by one. To compare the model predictions with actual data
we considerably simplified the model. Although the
simplified model cannot predict all possible cases of
behavior of the growing system, it is considerably more
flexible than the known simple models. At that, the
simplified model contains only three fitting parameters.
One of them is the maximum value of the growing
variable that can be either used from external data or
fitted as a model parameter. In the first case, the num-
ber of fitting parameters reduces to two that is the same
as in the mentioned models. However, containing only
two fitting parameters our models is able to properly
describe and predict various cases of growth curves,
including different asymmetry and different shapes of
starting and ending parts. In particular, the model
properly predicted the fact of abrupt stopping the
growth of the clock rate of the processors of personal
computers after long years of exponential growth,
without any “precursors” of such behavior.
We believe that the suggested approach could be
helpful for forecasting the evolution of engineering
systems including specific cases which are difficult to
explain and simulate by using the known approaches.
References
Bass, F. M. (1969). A New Product growth model for
consumer durables, Management Science, 15,
215-227.
Brodrick, J. R. (2007). SSL technology evolution // US
Department of Energy, Feb 8,
http://www.energystar.gov/ia/partners/prod_develo
pment/new_specs/downloads/Brodrick_SSLProgra
m_Overview.pdf (Accessed Oct 30, 2013)
Efimov, A.V. (2011). Description of principle of opera-
tion for a system: at what level of detail one should
stop, Summit of TRIZ developers, 2011, Available
on line at:
http://www.triz-summit.ru/file.php/id/f5086/name/1
.efimov.pdf (Accessed September 30, 2011).
Hutcheson, D. G. (2005). Moore's Law: The history and
economics of an observation that changed the
world, The Electrochemical Society INTERFACE,
14, 17-21.
Intel product information, http://ark.intel.com (Ac-
cessed September 30, 2011).
Kaplan, S., Visnepolschi, S., Zlotin, B.& Zusman, A.
(1999). New tools for failure & risk analysis. An
Introduction to Anticipatory Failure Determination
(AFD) and The Theory of Scenario Structuring,
Ideation International Inc.
Kohlrausch F. (1863). Ü ber die elastische Nachwirkung
bei der Torsion, Pogg. Ann., 119, 337-368.
Kynin, A. T. , Leniashin, V. A. , & Feygenson, N. B.
(2009). Selection of parameters to describe the de-
velopment of technical systems along the «life line»,
Proceedings of TRIZ-Fest, 27-30 July, Saint Pe-
tersburg, Russia.
Kynin, A. T. , Leniashin, V.A., & Feygenson, N. B.
(2010). Growth and development of transport sys-
tems. 3:Ground transport, Available on line at:
http://www.metodolog.ru/node/452 (Accessed
March 9, 2014), in Russian.
Kynin, A. T. & Priven, A. I. (2011). About Some Typi-
cal Reasons of Delays and Stops in the Develop-
ment of Technical Systems, Proceedings of 2nd Int.
Conf. on Systematic Innovation (ICSI) & AITRI
Innovation Week, Shanghai.
Leon, N. (2006). Trends and patterns of evolution for
product innovation, Journal of TRIZ, Available on
line at:
http://www.metodolog.ru/triz-journal/archives/2006
/10/01.html (Accessed 2011).
Martino, J. P. (1972). Technological Forecasting for
Decision making, New York.
Mazurin, O. V. (1986). Steklovanie (Glass Transition),
Leningrad, in Russian.
Modis, T. & Debecker, A. (1992). Chaoslike states can
be expected before and after logistic growth, Tech-
nological Forecasting and Social Change, 41,
111-120.
Prigogine, I., and Defay, R. (1969). Chemical thermo-
dynamics (Treatise on thermodynamics), Hardcov-
er.
Priven, A. I. (1987). Stability of calculation of structur-
al relaxation in glass-forming substances, Fizika i

A.I. Priven, A.T. Kynin/ Int. J. Systematic Innovation, 2(2), 9-23 (2012)
19
Khimiya Stekla (Rus. Glass Physic and Chemistry),
13, 173-177, in Russian.
Priven, A.I. (2011). On the quantitative criteria of ide-
ality of engineering systems. 3: Determination of
the complex parameter of system from factual data,
Available on line at:
http://www.metodolog.ru/node/1512 (Accessed
November 14, 2011), in Russian.
Priven, A.I. (2012). Evaluation of key technical contra-
dictions in engineering systems, Proc. Int. Conf.
TRIZfest-2012, Lappeenranta, Finland, August
01-04, p. 121-130
Scherer, G. W. (1986), Relaxation in glass and compo-
sites, New York, Wiley.
Sood A.& Tellis G. J. (2005). Technological evolution
and radical innovation. J. Marketing, 2005, vol. 69,
p. 152-168.
Sood, A. & Tellis, G. J. (2009). Understanding the
seeds of growth: Technological evolution and
product innovation, Available on line at:
http://www.marshall.usc.edu/emplibrary/wp04-04.p
df (Accessed September 10, 2009).
Tsao, J. Y. (2004). Solid-state lighting: lamps, chips
and materials for tomorrow. IEEE Circuits & De-
vices Magazine. No. 3, p. 28-37.
Volkenstein, M.V. & Ptitsyn, O.B. (1956). Relaxation
theory of glass transition. I. Solution of main equa-
tion and its investigation, Zh. Theor. Phys., 26,
2204-2222, in Russian.
Wikipedia (2014) Accelerating change, Wikipedia,
Available on line at: http://en.wikipedia.org/wiki/Accelerating_change
(Accessed March 9, 2014).
Zlotin, B.& Zusman, A. (2001) Directed evolution phi-
losophy, theory and practice, Available on line at:
http://www.ideationtriz.com/new/materials/directed
evolutionbook.pdf (Accessed March 9, 2014).

A.I. Priven, A.T. Kynin/ Int. J. Systematic Innovation, 2(2), 9-23 (2012)
20
APPENDIX 1: Algorithm of calculation
Step-by-step calculation
As mentioned above, the calculations are per-
formed step by step. Each step consists of instant
growth of X value followed by the relaxation process at
which the internal parameter x (that was reduced to the
Pr value) gradually comes to the equilibrium.
Our practice showed that the optimal value of the
time step is
∆t = 0.01 Ks,
which corresponds to the step of the tr value equal to
∆tr = 0.01.
The calculation procedure consists of the follow-
ing parts:
(1) We postulate some initial conditions;
(2) We make the first step by a simplified algo-
rithm;
(3) We make the next steps by using normal al-
gorithm;
(4) We exit calculations when the P value be-
comes close to saturation.
Below these parts are considered in more details.
Initial conditions
On start (t = t0), we accept the following values of
variables:
tr = 0; Pr = 0.0001; P = P0 + 0.0001 (Pmax – P0).
The value Pr = 0.0001 instead of 0 is accepted for
simplicity of further calculations. This does not affect
the final result as far as the error of calculation is any-
way much greater than 0.01%.
First step of calculation
Below, the subscript “1” means that the corre-
sponding values concern the end of the first step, i.e.
the moment of time corresponding to tr = 0.01;
t = t0 + 0.01 Ks. At this moment, we have:
tr,1 = 0.01;
Pr,1 = 0.0001;
t1 = t0 + ∆t = t0 + 0.01 Ks;
P1 = P0 + 0.0001(Pmax – P0).
Next steps of calculation
Below, the formulas for the next steps are pre-
sented. All values concern the end of the corresponding
step of calculation; the number of step is specified as
“i”:
Xi = X(tr, i-1);
i = (–1/ln Pr, i-1);
(dPr/dtr)i = – (Xi – Pr, i-1) / i;
Pr,i = Pr, i-1 + (dPr/dtr)i ∆tr;
ti = ti-1 + ∆t = ti-1 + 0.01 Ks;
Pi = P0 + Pr,i (Pmax – P0).
Exit of calculation procedure
The calculations stop when the Pr value becomes
greater than 0.99. This means that the growing variable
came to 99% of saturation. Further calculations are
surely senseless because of the model error.

A.I. Priven, A.T. Kynin/ Int. J. Systematic Innovation, 2(2), 9-23 (2012)
21
APPENDIX 2: Source data tables
1. Complex parameter of dot matrix printers:
speed (page/min) * resolution (dpi) * 10-3
Year CP (actual) Model
1977 - 0
1978 0.036 0.012
1979 0.037 0.017
1980 0.073 0.023
1982 0.092 0.045
1983 0.092 0.062
1984 0.092 0.085
1985 0.09 0.11
1986 0.14 0.15
1987 0.20 0.20
1988 0.21 0.26
1989 0.34 0.33
1990 0.46 0.41
1991 0.46 0.50
1992 0.46 0.60
1993 0.71 0.70
1994 0.71 0.81
1995 0.90 0.91
1996 0.83 1.01
1997 1.26 1.10
1998 1.26 1.17
1999 1.30 1.24
2000 1.30 1.30
2001 1.34 1.34
Data source: [15]
2. Complex parameter of CRT monitors:
diagonal (inch) * resolution (pixel/inch2) * 10
-3
Ye
ar CP Year CP
1988 14 1994 67
1989 17 1995 70
1990 22 1996 76
1991 32 1997 78
1992 38 1998 82
1993 50
Data source: [15]
3. Maximum clock rate of Intel CPU for PC
Year F, MHz Year F, MHz
1971 0.108 1996 2000
1972 0.2 1997 300
1974 2 1998 450
1978 10 1999 1200
1979 8 2000 2000
1982 12 2001 3060
1985 32 2002 2530
1988 32 2003 3200
1989 50 2004 3600
1990 25 2005 2200
1991 33 2006 2930
1992 50 2007 3000
1993 200 2008 3200
1994 100 2009 3330
1995 200 2010 3330
Data source: [17]

A.I. Priven, A.T. Kynin/ Int. J. Systematic Innovation, 2(2), 9-23 (2012)
22
4. Efficacy of electric lamps
Filament Fluorescent Arc
Year E, Lm/W Ref. Year E, Lm/W Ref. Year E, Lm/W Ref.
1880 1.5 [2] 1901 10 [2] 1909 15 [25]
1880 2.3 [25] 1906 12 [2] 1913 15 [25]
1881 3.9 [25] 1933 39 [2] 1915 20 [25]
1883 2.5 [16] 1955 72 [2] 1924 20 [25]
1895 2.5 [2] 1960 60 [16] 1926 26 [25]
1896 3.1 [25] 1963 74 [2] 1934 25 [25]
1897 4.0 [2] 1970 70 [16] 1937 31 [25]
1897 4.7 [25] 1975 75 [24] 1938 39 [25]
1900 3.5 [16] 1980 80 [24] 1941 41 [25]
1903 4.7 [25] 1983 83 [24] 1945 41 [25]
1903 7.0 [2] 1987 87 [24] 1949 41 [25]
1903 5.5 [25] 1990 90 [24] 1950 50 [25]
1905 6.0 [2] 1994 92 [24] 1954 50 [25]
1905 10.0 [2] 1998 95 [24] 1960 53 [19]
1907 5.5 [25] 2000 98 [24] 1961 50 [25]
1908 7.8 [25] 2000 100 [16] 1967 100 [25]
1910 6.0 [16] 2005 100 [24] 1972 100 [25]
1911 7.8 [25] OLED 1973 109 [25]
1911 10.0 [2] 1990 0.5 [24] 1973 116 [25]
1911 10.9 [25] 1995 5 [24] 1980 123 [19]
1913 19.5 [2] 2000 30 [24] 1982 116 [25]
1920 11.0 [16] 2002 70 [24] 1984 126 [25]
1927 32.5 [2] 2005 125 [24] 1996 126 [25]
1931 36.0 [2] 1997 145 [25]
1942 36.0 [2] 2001 145 [25]
LED
Year E, Lm/W Ref. Year E, Lm/W Ref. Year E, Lm/W Ref.
1960 0.1 [16] 1990 10 [24] 2000 100 [16]
1961 0.4 [16] 1992 11 [16] 2001 87 [24]
1975 1 [16] 1994 23 [16] 2002 28 [24]
1982 1.8 [16] 1995 25 [24] 2004 34 [24]
1983 2 [24] 1995 15 [16] 2005 100 [24]
1983 2 [16] 1998 70 [24] 2005 47 [24]
1987 7.5 [24] 1998 30 [16] 2006 65 [24]

A.I. Priven, A.T. Kynin/ Int. J. Systematic Innovation, 2(2), 9-23 (2012)
23
AUTHORS BIOGRAPHIES
Alexander Priven is a Consultant of
GGA Software Services, LLC in MA,
the USA since 1995. He has about 20
years of experience in the applied sci-
ence in the field of glass in the USA,
Korea and the USSR. Alexander re-
ceived his Ph.D. degree in glass tech-
nology at the Institute of Silicate Chemistry and Doctor
of Science degree in chemistry at the St. Petersburg
State Technical University. His areas of interests in-
clude Systematic Innovation in Chemistry and Material
Science including TRIZ.
Alexander Kynin is a Professor of
Saint Petersburg State Polytechnic
University (Department of innova-
tions) since 2011. He has about 15
years of experience in the application
of TRIZ methods in industry in Rus-
sia, Korea and China. He is a certificated specialist in
TRIZ level 5 (Master). Alexander received his degree
of Doctor of Science (Engineering) in Physical Chem-
istry and Material Science at the St. Petersburg State
University of Technology and Design. His areas of
interests include Systematic Innovation in Chemistry
and Material Science including TRIZ.
J.J. Monteiro/ Int. J. Systematic Innovation, 2(2), 24-42 (2012)
24
TRIZ Supporting the Project Management Effectiveness
José Jorge Monteiro
* Corresponding author, E-mail: [email protected]
Abstract
The project management (PM) techniques were created during the 1950s in the United States to increase the
probability of success in large military projects and have been developed and applied in other areas since then.
The Russian scientist Heinrich Altshuller and colleagues have been developing TRIZ (Theory of Inventive
Problem Solving) since the 1940s to create a method to find innovative solutions for technical problems. In an
organization already using a standard project management procedure to deliver quality projects but having still
been missing the planned schedules in a higher rate than desirable, the TRIZ tools were used to improve those
results. This paper shows how to apply a structured version of TRIZ to a typical PM procedure bringing
innovative alternatives to solve the hidden contradiction that is how to accelerate projects without compromising
the delivered systems quality. TRIZ supports the practitioner to go beyond the standard project risk analysis,
offering innovative solutions focused not only on threats and opportunities but mainly on the contradiction
elimination, increasing the probabilities of delivering projects in time and with quality.
Keywords: contradiction, effectiveness, inventive, problem solving, project management, TRIZ
1. Introduction
The Guide to the Project Management Body of
Knowledge (PMBOK), organized by the Project
Management Institute (PMI, 2013) is among the most
effective standard procedures to plan and execute any
kind of project. It covers several processes to manage a
project, like scope, time, cost, human resource, quality,
risk, communication, integration and so on. The guide
is focused on delivering the planned scope with the
specified quality in the time and costs proposed that is
delivering projects with high efficacy. The reference
scenario in this article considered there is a standard
PM procedure based on the PMBOK and a team able to
deliver the systems with the quality needed in an
industrial environment. However, some projects have
been running late in a higher rate than the desirable one.
That is, despite a good PM maturity level has been
achieved, there is an opportunity related to time and
quality managements to explore, reason why an
additional method was used. According to the Pulse of
Profession Report (PMI, 2013), the best performing
organizations (with high PM maturity level and
training along the projects execution) have only
reached limited percentage of successful projects
among the completed ones: met the goals=66%, within
budget= 62% and on schedule= 58%. For each project
not reaching the goals in time there are opportunities
not converted in value or problems not solved, draining
value from any system. The reported limited
achievement average percentages in time (58%) and
quality (66%) are already enough to demonstrate the
real importance of looking for additional support to
improve the results.
Based on extensive analysis of a patents collection,
the scientist Heinrich Altshuller and colleagues tried to
identify a method for sustainable and innovative
solutions related to technical problems, called TRIZ
(Altshuller, 1999). With the political events in the
former Soviet Union, part of the research group moved
to Europe and USA spreading the TRIZ knowledge
since 1990. TRIZ is based on the pursuit of ideality
(higher availability of functions with the lowest
resource use) and is supported on five conceptual
pillars: contradictions, ideality, functionality, resources
and time / space (Mann, 2010). As illustrated in Fig. 1,
the method translates the “specific problem” in a more
general manner (“a problem like mine”), enabling the
use of solution patterns (“generic solutions”) identified
by Altshuller in similar problems. Among these generic
solutions, the ones capable of solving the specific
problem (“specific solution”) will be selected, avoiding
the usual trial and error and non-focused brainstorming
approaches. TRIZ operates by identifying the
contradiction associated with the problem under
evaluation offering a shortcut to find alternative

J.J. Monteiro/ Int. J. Systematic Innovation, 2(2), 24-42 (2012)
25
solutions in different knowledge areas than those
immediately related to the problem (Silverstein,
Decarlo and Slocum, 2008). For that purpose, one may
use several available tools. Some of them are
Identification of available resources, Thinking in Time
and Space, Ideal Final Result, Contradiction Matrix &
40 Inventive Principles, Size-Time-Cost, Function
Analysis, 76 Standard Solutions and the 8 Trends of
Evolution.
Fig. 1. TRIZ Basic Method (Mann, 2010)
Among the mentioned tools, the Matrix
Contradictions is considered the first stage tool by the
ease of use treating the technical contradictions (when
one tries to improve a feature, there is a second
independent feature/parameter that gets worse).
Therefore, at least two features (the one we need to
improve and the one getting worse with our attempt to
improve the first) express each identified technical
contradiction. According to Altshuller s research
(1999), for each combination, a number of suggested
inventive principles that have already solved the same
contradiction in other fields of knowledge are available.
The traditional list contains 39 parameters and 40
inventive principles combined in a matrix. Originally
focused on technical issues, the use of TRIZ also
expanded to the management area. Through additional
research, Darrell Mann has developed a similar matrix
focused on managerial issues, the Business
Contradiction Matrix (Mann, 2009), which we will use
in this paper. To enrich the proposed alternatives,
additional TRIZ tools will be used. The whole group
has been integrated to facilitate the use by beginners
(Fig. 3). Although there are other different integrated
views, the applied approach was based on the proposals
by Mann (2010) and Gadd (2011).
The link between the PMBOK and TRIZ has
already been considered through the risk management
process. Such a process includes the analysis to
identify potential threats and opportunities, generating
preventive actions to improve the probability of
success for the projects (Wideman, 1992; Smith and
Merit; PMI, 2013). Some of the TRIZ tools have been
proposed to be applied directly to the project risk
management trying to modify and boost this specific
process (Barsano, 2008). In this article, the TRIZ tools
were used in a different way, focusing on an existing
PM procedure facing a specific problem related to
projects delays. The several tools were taken as an
additional support to the PM procedure, searching for
new solutions, always based on the schedule’s
perspective. In that sense, the TRIZ tools were used in
a reactive mode not intending to modify the risk
management process but trying to eliminate the speed x
quality contradiction. They add a specific solutions
package to the PM procedure to treat an existing
schedule problem. If incorporated to the PM procedure,
such a package may be used in a preventive way on
future individual projects, reinforcing the standard risk
management to search for improvement in the success
rates in time and quality. Considering the limited
success rates reported in the Pulse of Profession Report
(PMI, 2013), the TRIZ tools might be used in other
projects environments like a support to the PM
procedure to eliminate the hidden contradictions that
keep organizations with lower achievements.
It is relevant to mention that one of the key
attractiveness for using TRIZ on such a delicate
situation is the basic concept associated to this method
in which no compromise will be accepted to solve the
problem. That is, the hidden conflict is identified and it
guides the search for inventive solutions.
2. Context
The project management current practice applies
most of the processes in the Guide to the Project
Management Body of Knowledge (PMI, 2013) and has
progressive decision stages (Fig. 2). In the first stages
until the Filter 3, alternatives are evaluated with the
selection of one of them to move forward to the
detailing in order to support the final decision. At Filter
3, with no doubts left and all data available, the
decision to implement the project until the delivery and
results review it is confirmed.

J.J. Monteiro/ Int. J. Systematic Innovation, 2(2), 24-42 (2012)
26
Fig. 2 Simplified Summary of Current Practice
Theoretically, the higher the effort applied to the
stages before Filter 3, the higher likelihood of a good
quality result. However, getting deeper in these first
stages consumes financial resources and mainly takes
time, exposing the basic contradiction through the
TRIZ lenses: how to speed up the whole project while
maintaining the desired final quality?
In that context, the TRIZ tools are not applied to
the projects individually but only once to the PM
current procedure and to the environment in which the
projects are managed. They allow identifying harms
and opportunities related to the mentioned conflict. The
most effective proposed reactions/solutions should be
incorporated to the PM procedure as support for all
future projects in that environment.
3. Development
Regarding the TRIZ application to the PM
procedure and its managing environment, it will be
used the integrated sequence in Fig. 3 (adapted from
Gadd, 2011 & Mann, 2010) that illustrates the problem
definition and the progressive use of several TRIZ tools.
The workflow in Fig. 3 is divided in convergent
and divergent stages, according to their nature,
broadening the evaluation and generating alternatives
or focusing and selecting the best ones. The whole flow
starts with listing all preliminary ideas (first to come,
with no critics) to solve the identified problem. It
consists of four steps:
a. Define the problem (the real situation)
The real situation is checked using the six critical
questions (What is the problem? Why is there such a
situation? Why is it a problem? Why is it necessary to
solve it? What do we really want-What is our ideal?
What is holding us to solve the problem?). The context
is expressed in the time and space diagram (9 boxes). A
map of the available resources is prepared (9 boxes).
The ideal outcome is clearly defined (What do we
really want?). The gap between the real and the ideal
situations is explored. A first evaluation of the
preliminary ideas can be performed to identify harmful
aspects. The function analysis can be performed in this
stage or after the contradiction identification, as
considered in this article.
Fig. 3 TRIZ Integrated Workflow

J.J. Monteiro/ Int. J. Systematic Innovation, 2(2), 24-42 (2012)
27
b. Select tools to use (the right situation) This stage is divided in other two parts. The first
is the basic one in which the basic tools can be applied
(contradictions). The second one must follow the
function analysis and will enable additional tools, if the
practitioner thinks they are necessary. The tools
application starts by the technical contradiction
identification and treatment with the inventive
principles. The physical contradiction identification
and treatment is done in the sequence, completing the
first part. The function analysis and the subject-action-
object list can be prepared now. With the analysis
completed, the trimming and 76 standard solutions can
be applied. Additionally, the innovative triggers (X-
Factor; Life and Death analogies; Smart Little People;
Time-Size-Cost; Subversion), the effect database and
the trends of evolution may be tested. Inventing new
systems is only used in specific cases.
c. Generate solutions (candidate ones)
Using the selected tools, all possible candidate
solutions are generated.
d. Evaluate solutions (the best ones)
Those solutions that fit the better to the ideality
criteria are selected (multi-criteria selection to support
the decision-making). The criteria and their weights
can be adjusted to the user’s need.
This cycle can be repeated, if necessary, and
establishes a way for anyone (or any organization) to
contribute systematically to solve complex problems
and to develop new products and systems (develop
anything through identifying and breaking its hidden
contradictions). How deep one should go to find
alternative solutions will certainly depend on the type
of problem being treated and on the practitioner needs.
More than that, Fig. 3 shows a big picture of the
available tools and a suggested workflow that helps
TRIZ beginners to find their own way and gain
confidence in the method.
4. Applying the TRIZ workflow to the problem
The TRIZ tools were applied treating the problem
as any other but using the business & management
adaptation (Mann, 2009). The workflow itself is a
structure adapted from two authors’ contribution in
their published books and papers (Gadd, 2011 and
Mann, 2009). For the case under focus, there are two
main groups of processes: the development of
information and details until the authorization to
execute and the execution itself. The solution proposals
were generated covering both groups.
4.1 Preliminary Ideas (spontaneous)
10 solution proposals were listed.
Fig. 4 Preliminary Ideas List
4.2 Definition
-Description of the problem
Projects are delivered late against the planned
finish date, causing potential additional costs and
delays in the expected results. When trying to
accelerate the execution there is a risk to lose quality.
(As the problem and its consequences were
completely clear, the 6W s were not detailed)
-Main desired result
Systems are delivered early or on schedule and
with the desired quality and specifications demanded
by customers.
-Ideal Final Result (what they really want)
# Critical (must have)
-Finish projects in the planned month
-Get the procurement activities done as scheduled
-Have effective field supervision during execution
-Have effective frame contracts
-List of pre-approved suppliers
-Work permits released until 9 AM daily
-Effective continuous work permits
-Costs fully managed and controlled.
# Desirable (nice to have)
-Have a schedule risk simulation done before the
project approval
-Have certified project managers
-Dedicated procurement team
-Scaffolding contract dedicated to the projects
-Do not depend on a single engineering support
contractor

J.J. Monteiro/ Int. J. Systematic Innovation, 2(2), 24-42 (2012)
28
-Have at least one engineering support contractor
near the plant
-Do not depend on a single assembly contractor
-Do not depend on a single civil construction
contractor.
-Problem Context Map
The Fig. 5 shows a typical 9 boxes diagram with
the problem context.
Fig. 5 Context Map - The problem discussed in time and space (9 boxes diagram)

J.J. Monteiro/ Int. J. Systematic Innovation, 2(2), 24-42 (2012)
29
-Problem Resources Map Fig. 6 shows the typical 9 boxes diagram with the
identified available resources in time and space.
Fig. 6 Resources Map - Available resources examined considering time and space. (9 boxes diagram)

J.J. Monteiro/ Int. J. Systematic Innovation, 2(2), 24-42 (2012)
30
As the present situation and the ideal one were
already clear, the ideality audit (real x ideal) was not
detailed.
4.3 TRIZ Tools Selection
As it comes to managerial situations with easily
identifiable contradiction, it was used the Business
Matrix Contradictions (Mann, 2009) and the adapted
inventive principles to treat them. For more alternative
proposals, one should identify the associated physical
contradiction (to get the desired result we need a
variable that has simultaneous contrary behaviors, for
example, the temperature should be high and low, the
system must be fast and slow at the same time).
-Identifying the "Technical Contradiction”
Improving feature: speed of projects execution
Adapted TRIZ parameter: Production Time.
Worsening feature: quality, cost and risk of the
final system
Adapted TRIZ parameters: specification of
production, costs of production, production risk.
In Fig. 7, we can see a section of the business
contradiction matrix indicating the suggested inventive
principles (arrows intersection = green painted cells).
Fig. 7 Business Contradiction Matrix –suggested inventive principles (Mann, 2009)
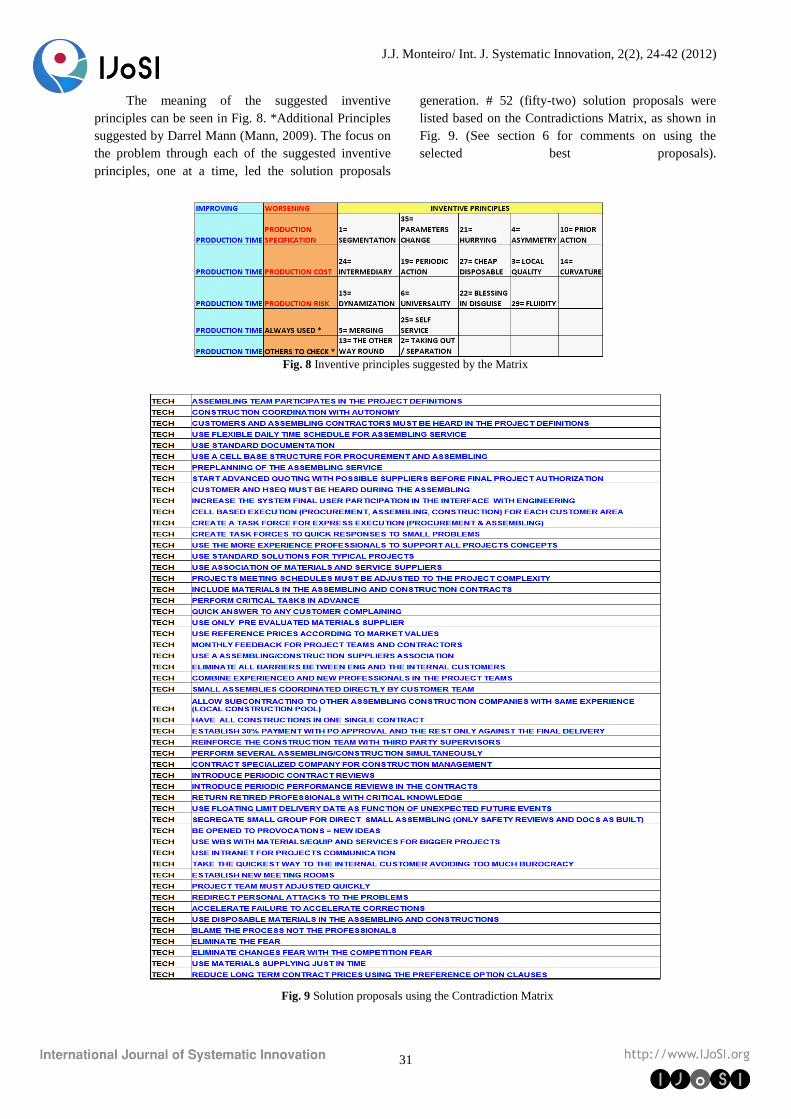
J.J. Monteiro/ Int. J. Systematic Innovation, 2(2), 24-42 (2012)
31
The meaning of the suggested inventive
principles can be seen in Fig. 8. *Additional Principles
suggested by Darrel Mann (Mann, 2009). The focus on
the problem through each of the suggested inventive
principles, one at a time, led the solution proposals
generation. # 52 (fifty-two) solution proposals were
listed based on the Contradictions Matrix, as shown in
Fig. 9. (See section 6 for comments on using the
selected best proposals).
Fig. 8 Inventive principles suggested by the Matrix
Fig. 9 Solution proposals using the Contradiction Matrix
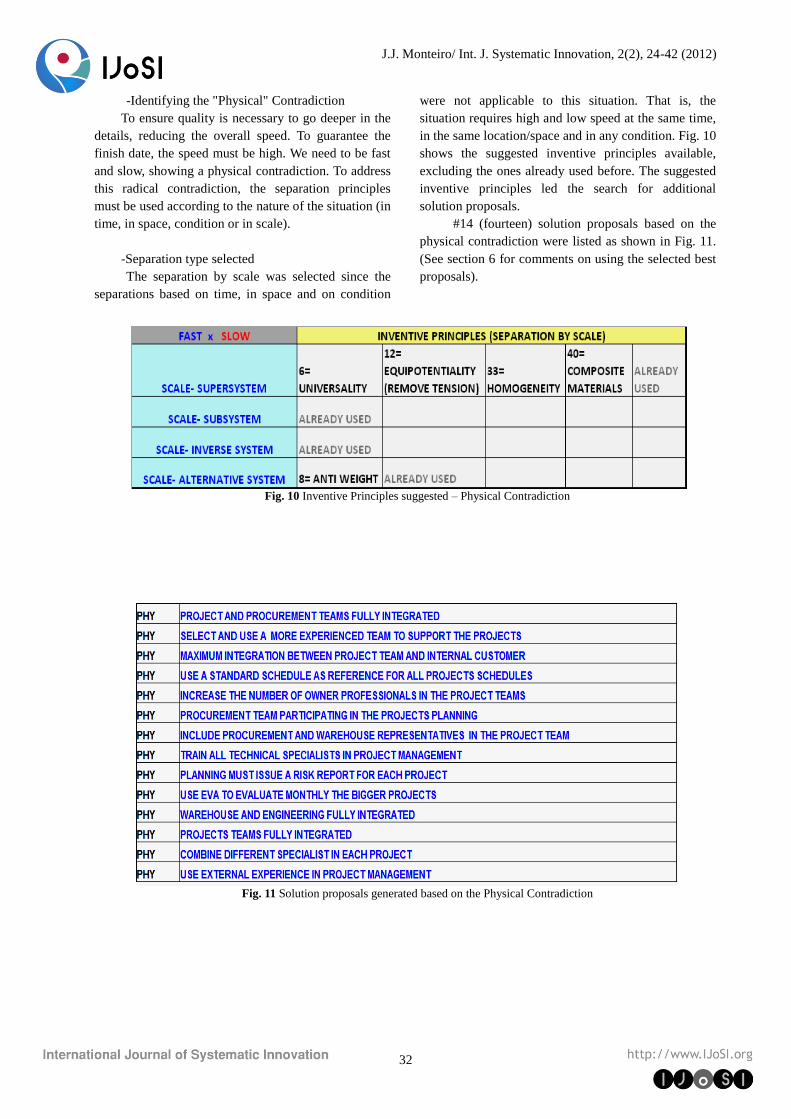
J.J. Monteiro/ Int. J. Systematic Innovation, 2(2), 24-42 (2012)
32
-Identifying the "Physical" Contradiction
To ensure quality is necessary to go deeper in the
details, reducing the overall speed. To guarantee the
finish date, the speed must be high. We need to be fast
and slow, showing a physical contradiction. To address
this radical contradiction, the separation principles
must be used according to the nature of the situation (in
time, in space, condition or in scale).
-Separation type selected The separation by scale was selected since the
separations based on time, in space and on condition
were not applicable to this situation. That is, the
situation requires high and low speed at the same time,
in the same location/space and in any condition. Fig. 10
shows the suggested inventive principles available,
excluding the ones already used before. The suggested
inventive principles led the search for additional
solution proposals.
#14 (fourteen) solution proposals based on the
physical contradiction were listed as shown in Fig. 11.
(See section 6 for comments on using the selected best
proposals).
Fig. 10 Inventive Principles suggested – Physical Contradiction
Fig. 11 Solution proposals generated based on the Physical Contradiction

J.J. Monteiro/ Int. J. Systematic Innovation, 2(2), 24-42 (2012)
33
At this point, the basic cycle of TRIZ was
concluded generating 66 (sixty-six) proposals. One
could go directly to the evaluation against the ideality
or expand the search for new solution proposals using
additional tools. The second option was chosen.
-Trimming and 76 Standard Solutions By choosing to broaden the search for
alternatives using these two additional tools, one must
return to the definition phase and perform the function
analysis that gives a better view of the characteristics
of the specific problem and its relationships.
-Function Analysis
The most problematic relationships were
identified in the analysis (Shown in Fig. 12). They will
allow the TRIZ tools to be focused on the real issues.
The analysis summary, focusing only on the
problematic relationships, can be seen in Fig. 13 (SAO:
Subject – Action – Object) and they will be the basis
for the additional tools application.
Fig. 12 Function Analysis (threats or insufficiencies in red dotted or thick lines)
Note: Red dotted lines = insufficiencies; Red thick lines = harms/threats; Blue thin lines = satisfactory

J.J. Monteiro/ Int. J. Systematic Innovation, 2(2), 24-42 (2012)
34
Fig. 13 SAO: Identified Problematic Relationships
-Trimming
This tool operates questioning each of the
problematic relationship as follows.
-Can we eliminate the function?
-Could the object perform the function itself?
-Is it possible to remove the subject / the agent or
the object?
-Is it possible to get rid of the agent / the subject
after the function performed?
-Is it possible to remove any system parts?
-Can any other agent or other object perform that
function?
-Any available resource could perform the
function?
The answers to the questionnaire generated 6 (six)
solution proposals as shown in Fig. 14. (See section 6
for comments on using the selected best proposals)
Fig. 14 Solution proposals generated based on the Trimming tool and SAO
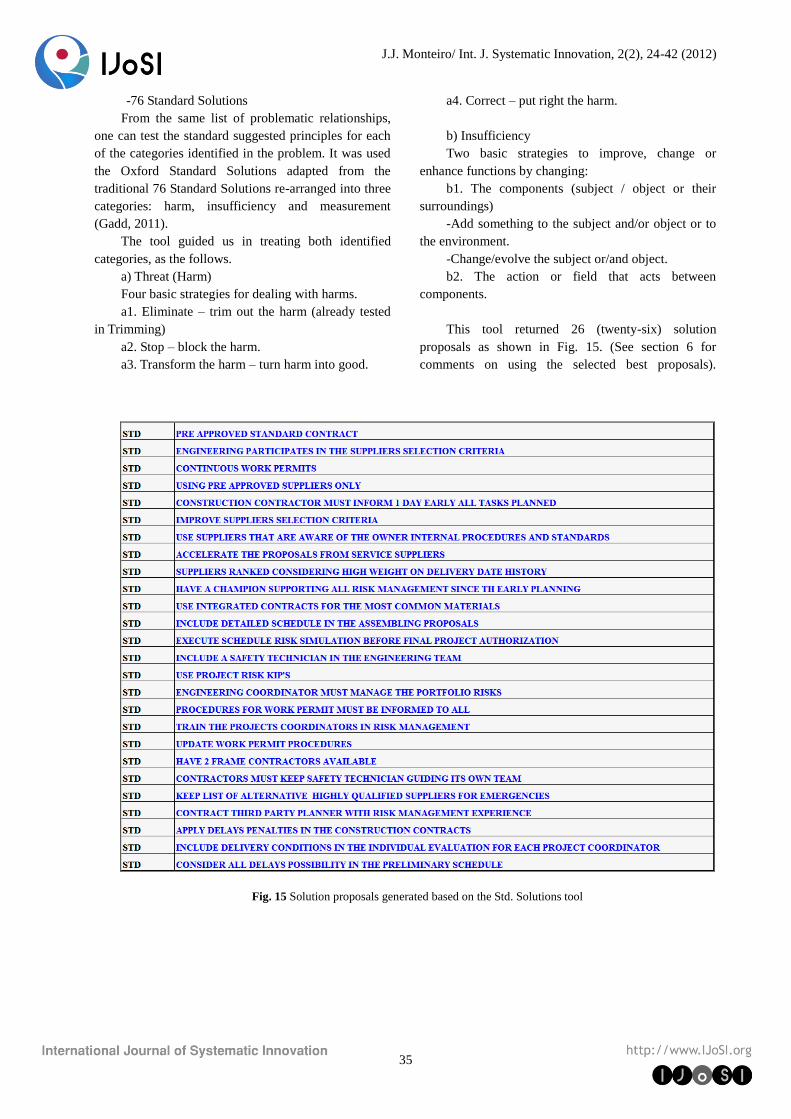
J.J. Monteiro/ Int. J. Systematic Innovation, 2(2), 24-42 (2012)
35
-76 Standard Solutions
From the same list of problematic relationships,
one can test the standard suggested principles for each
of the categories identified in the problem. It was used
the Oxford Standard Solutions adapted from the
traditional 76 Standard Solutions re-arranged into three
categories: harm, insufficiency and measurement
(Gadd, 2011).
The tool guided us in treating both identified
categories, as the follows.
a) Threat (Harm)
Four basic strategies for dealing with harms.
a1. Eliminate – trim out the harm (already tested
in Trimming)
a2. Stop – block the harm.
a3. Transform the harm – turn harm into good.
a4. Correct – put right the harm.
b) Insufficiency
Two basic strategies to improve, change or
enhance functions by changing:
b1. The components (subject / object or their
surroundings)
-Add something to the subject and/or object or to
the environment.
-Change/evolve the subject or/and object.
b2. The action or field that acts between
components.
This tool returned 26 (twenty-six) solution
proposals as shown in Fig. 15. (See section 6 for
comments on using the selected best proposals).
Fig. 15 Solution proposals generated based on the Std. Solutions tool
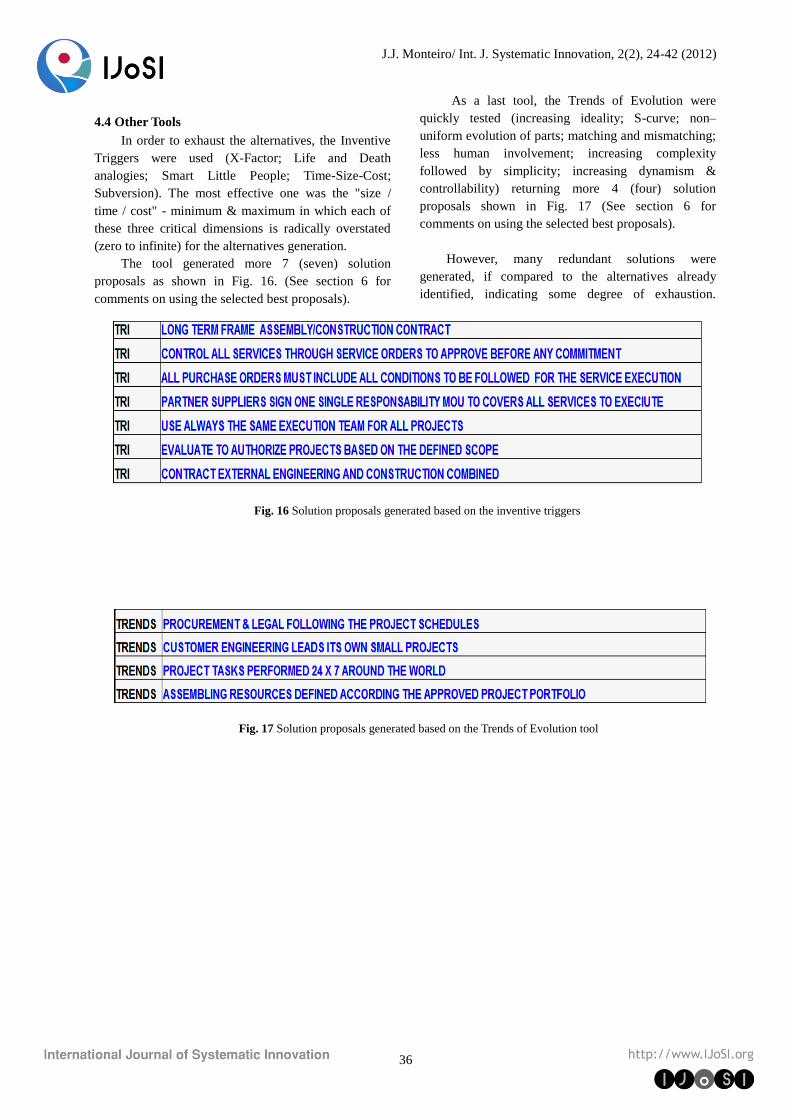
J.J. Monteiro/ Int. J. Systematic Innovation, 2(2), 24-42 (2012)
36
4.4 Other Tools
In order to exhaust the alternatives, the Inventive
Triggers were used (X-Factor; Life and Death
analogies; Smart Little People; Time-Size-Cost;
Subversion). The most effective one was the "size /
time / cost" - minimum & maximum in which each of
these three critical dimensions is radically overstated
(zero to infinite) for the alternatives generation.
The tool generated more 7 (seven) solution
proposals as shown in Fig. 16. (See section 6 for
comments on using the selected best proposals).
As a last tool, the Trends of Evolution were
quickly tested (increasing ideality; S-curve; non–
uniform evolution of parts; matching and mismatching;
less human involvement; increasing complexity
followed by simplicity; increasing dynamism &
controllability) returning more 4 (four) solution
proposals shown in Fig. 17 (See section 6 for
comments on using the selected best proposals).
However, many redundant solutions were
generated, if compared to the alternatives already
identified, indicating some degree of exhaustion.
Fig. 16 Solution proposals generated based on the inventive triggers
Fig. 17 Solution proposals generated based on the Trends of Evolution tool

J.J. Monteiro/ Int. J. Systematic Innovation, 2(2), 24-42 (2012)
37
5. Assessment against the ideality
Until now, the proposals were generated without
any formal evaluation. At this step, it is necessary to
rank the proposals in order to identify the best ones and
those easier to implement. As a reference for decision-
making, the assessment was done using multiple
criteria selection based on the concepts of ideality
(Rantanen& Domb, 2008):
-Were threats eliminated?
-Are useful features retained and new benefits
added?
-Have new threats arisen? -Did the system become more complex?
-Was the main physical contradiction eliminated?
-Were free or ignored resources used?
By adding a criterion related to the ease of
implementation, one can prioritize proposals according
to the ideality ranking starting by the easiest one to put
in practice (Fig. 18). Depending on the environment in
which the projects are executed, other criteria and
individual weights may be used.
As an exhaustive process, many repeated
proposals came through different tools. Eliminating
redundancies/repetitions, there were 109 additional
proposals over the 10 preliminary ones. Of the total
119 proposals, 61 ones reached ideality rating
Fig. 18 Evaluated Solution Proposals Summary (>/=60% ideality ranking)

J.J. Monteiro/ Int. J. Systematic Innovation, 2(2), 24-42 (2012)
38
above 50% as a first filter. The proposals show
corrective and preventive approaches that could be
used as a specific filter, if needed. The rest of the
proposals should also be examined because it contains
ideas whose immediate execution may be difficult but
with significant positive impact if implemented in the
future. A summary containing the higher-ranking 31
solution proposals (complying >/=60% to ideality and
ease to implement) is shown in the Fig. 18. (See
section 6 for comments on using the selected best
proposals).
Note: The identified sources are TRI (triggers),
STD (standard solutions), TECH (technical
contradictions), PHY (physical contradictions),
TRENDS (trends of evolution), TRIM (trimming),
PRE (preliminary solutions). Confirming the TRIZ
contribution to reveal new possibilities one can see
only one proposal coming from the preliminary
proposal list (PRE) in this higher-ranking group.
As a preliminary guidance on similar situations
and based on the number of solutions generated (Fig.
19), the most effective tools to treat such problems
were the elimination of the technical contradictions
(48%) and the 76 standards solutions (24%) followed
by the elimination of the physical contradictions (13%).
It shows that the basic cycle of the workflow was
capable of generating half of the potential solutions
(51%). Being quicker and effective, the basic cycle
becomes the best option for similar cases in which the
speed is critical and the time may be short to develop
the whole workflow.
Fig. 19 Number of Ideas x TRIZ tools
6. The best proposals and their expected effect
Consolidating the figures 4, 9, 12, 14, 15, 16 and
17, the figure 18 summarizes the best proposals already
ranked using the proposed multi-criteria. This section
presents additional comments and explanation about
the context, how to implement and the expected effects
derived from each of the best proposals highlighted in
Fig. 18. Note that those solutions have derived from the
typical contradiction (speed x quality in project
management) and specific threats, insufficiencies and
opportunities identified in the function analysis (Fig.
12). The projects used as reference are the ones found
in a typical industrial environment. That is, most of the
proposals could have direct use in other project
management environments but some of them will only
be useful in the mentioned context. The ranking criteria
themselves, as reference for decision-making, may
change according to each situation and type of project.
As a quick option to use the best proposals list (>50%
ideality compliance), consider taking it as a checklist.
Such checklist must be evaluated against your real
project and environment during the project planning
phase aiming the project acceleration. The multi-
criteria and weights may be adjusted to your own
situation, generating a different ranking, your own one.
Another option would be to expose your PM procedure
and environment to the TRIZ workflow. It would
generate your own set of best proposals to apply to
future projects, reinforcing the risk management
process.
See the below comments about each of the best
proposal in Fig. 18.
Long term assembly/construction contract: when
dealing with several small and medium size projects at
the same time, this type of frame contract will speed up
the contracting phase of execution, usually keeping the
same construction partner for most of the jobs. Pre-approved standard contracts: where is not
possible to use the frame contract, the availability of a
standard contract form already evaluated and approved
by legal department and all other internal stakeholders
will speed the contracting process and the project
execution.
Engineering participating in the suppliers’
selection criteria: the engineering team directly in
charge of the projects management must participate in
defining which criteria should be used to select
suppliers for the vendor list updating by the
procurement team. It would avoid contracting a
supplier without the skills and means necessary to
execute the job in that specific environment.
Problematic contractors may stop or delay the job
execution delaying the project delivery.
Assembling team participates in the projects
definitions: where there is a team directly responsible
by the assembling and construction execution, this
team must be involved since the definition phases to
identify opportunities to speed up the construction and
to avoid future problems and restrictions. It would

J.J. Monteiro/ Int. J. Systematic Innovation, 2(2), 24-42 (2012)
39
avoid having to deal with problems during the
construction when is much more difficult to solve them
without spending additional time.
Continuous work permit: when executing projects
in an industrial environment with the presence of
flammable products, dangerous substances or any other
aggressive fluids, the standard safety procedure
requests a formal work permit for every job to be done
day by day. Usually this permit must be issued by
operational team overloaded with the production
routines and the maintenance daily demands. In this
scenario, it is easy having a delay in the assembling or
construction work permit. If the problem keeps
repeating day after day, the whole project schedule will
certainly delay. One of the solutions would be having a
continuous work permit valid for a week if the safety
conditions were under control. This would avoid the
daily work permit eliminating the time needed to start
the tasks daily.
Project and procurement team fully integrated:
considering the importance of preliminary cost
estimates and all other procurement tasks executed
according to the project schedule it becomes clear that
the two teams must work together since the planning
phases to avoid unreal budgets and schedule. Since the
planning phase, the procurement team must be aware
of the impact of every package to be bought or
contracted in the whole project. The procurement team
must also be allowed to contribute with its experience
in the project planning. The integration is critical for
generating the best budget and schedule and for having
the commitment of both teams with the final schedule.
Procurement & legal following the project
schedules: when dealing with contracts there will be an
interface with the legal team. The integration of the
procurement team in the planning can bring together
the legal team to the commitment with the projects
schedule.
Using preapproved suppliers only: using suppliers
and contractors not fully prepared to work in the
specific environment can delay all the project
execution. In that sense, using only a pre-approved
suppliers list is critical for the schedule.
Customer’s engineering leads its own small
projects: when dealing with small and low complexity
projects, if the customer’ s engineering structure has
enough skill in PM, these small projects can be
managed by that structure with some support from the
engineering team. This option would allow solving
specific customer’s problems in a faster way with an
accelerated project delivery.
Construction coordination with autonomy: it is
usual to have an engineering structure in which the
construction/assembling team has its own coordination.
The autonomy to participate and interfere in the
project-planning phase is critical to have a construction
phase running as quick as possible with minimum
unexpected problems and the project delivered in time.
Construction contractor must inform 1 day early
all tasks planned: this item is related to the daily work
permit. If the construction contractor has a schedule to
followed and it updates the future tasks one day before
it turns the work permit issue and control much easier
for all stakeholders, avoiding delays.
Customers and assembling contractors must be
heard in the project definitions: if the customers’ and
assembling contractors’ representative are both heard
during definitions phase, they not only can contribute
avoiding unreal assumptions but also bringing options
to accelerate the schedule.
Improve suppliers’ selection criteria: the selection
criteria must always be improved including factors that
can identify the suppliers with the better conditions and
historical in delivering the tasks safely and in the time
contracted to avoid projects delays.
Select and use a more experienced team to support
the projects: if the team has a number of more
experienced professionals, the idea is having part of the
time of this group available to the less experienced
group in order to identify and correct potential
problems early in the planning phase as a type of
internal coaching and support.
Use flexible daily time schedule for assembling
service: sometimes it is impossible to have the
assembling tasks starting in the beginning of the
workday with the rest of daily routines, meaning
projects delays. In those situations, a special daily
schedule would be used for the assembling, starting 2
hours later and adding 2 hours at the end of the day, for
example.
Use standard documentation: all projects need a
huge amount of formal documentation. The use of the
same standard forms in all projects accelerates the team
skill and helps avoiding mistakes and
misunderstandings. Fewer mistakes mean lower
probabilities of delays.
Use suppliers that are aware of the owner internal
procedures and standards: In complex industrial
environments, it is usual that companies have their own
procedures about every critical aspect for their
operational routines. The potential suppliers must be
aware of these procedures and critical requests before
issuing their work proposals once the compliance may

J.J. Monteiro/ Int. J. Systematic Innovation, 2(2), 24-42 (2012)
40
affect the costs. A financial unbalance during the
execution may generate potential delays in the job.
Preference for the frame contracts suppliers: it is
usual to develop partners for specific kinds of jobs
negotiating and signing frame contracts with them.
These contracts establish the commercial and general
conditions. At each job to be done, a specific proposal
is issued covering the specific scope and schedule but
referring the general conditions already negotiated. The
frame contracts accelerate the contracting phase and so
the execution in each project.
Control all services through service orders to
approve before any commitment: considering an
environment with valid frame contracts, it is critical
that each job has its own service order based on a
proposal covering scope, cost and schedule. It avoids
misunderstandings during execution and so delays for
the whole project.
Use a cell base structure for procurement and
assembling: this option considers having a small
procurement group (“cell”) dedicated to small projects.
The same concept applies to the assembling cell. The
idea is that these cells would have autonomy to develop
the tasks related to small projects contributing to higher
delivery speed.
Accelerate the proposals from service suppliers:
the time to obtain the formal proposals for services and
goods is critical for the schedules. The time requested
to return the proposal must be planned in the schedule
and must be considered by the procurement teams.
Suppliers ranked considering high weight on
delivery date history: the delivery time history must be
a critical factor when selecting the potential suppliers
to avoid the ones not capable of following the schedule.
Use pre evaluated suppliers only: having a
suppliers list with updated evaluation related to the
schedule commitment is critical to avoid general delays.
Maximum integration between project team and
internal customer: this integration is critical for the
definition and planning phases. Without this integration,
the probability of having an incomplete or wrong
solution defined is higher, increasing the possibility to
spend more time during the execution trying to fix the
problems.
Pre planning the assembling service: the
assembling must be planned to avoid potential
problems during the execution, leading to delays.
Procurement team dedicated to projects: the ideal
situation is having a procurement group dedicated to
the projects not executing tasks for other areas to avoid
waste of time in this interface.
All purchase orders must include all conditions to
be followed for service execution: the suppliers must
be informed before the proposal of all the requests and
risks in the environment in which the job will be
executed. It avoids surprises that are time consuming to
solve during the execution.
Use a standard schedule as reference for all
projects schedules: as all other standard forms, using a
standard schedule structure for all projects turns easier
to prepare it and to understand it avoiding time-
consuming misunderstandings.
Start advanced quoting with possible suppliers
before final project authorization: the advance quoting
is critical to generate better budgets for the projects. An
understated budget will make a project short of funds
leading to interruptions in execution and delays.
Increase the number of owner professional in the
project teams: the higher number of owner project
professionals in the team compared to third part ones
may increase the commitment with projects problem
solutions. In that sense, keeping an owner project
professional’s core group is critical for the commitment
with cost and schedule.
Have a champion supporting all risk management
since the early planning: having an experienced risk
professional available to support all the project team
when dealing with potential threats and opportunities in
the schedule management is critical for good results.
This professional could also support the TRIZ tools
application.
7. Conclusions
If the solutions derived from the current project
management procedure are satisfactory, just apply them,
you don’t need TRIZ. In more complex cases, when
results are not reaching the desirable level and the
current PM procedure is limited to compromising
options, the TRIZ tools support the search for inventive
solutions, identifying the hidden contradiction and
developing the specific situation analysis.
In the evaluated case, one can see clearly that the
preliminary ideas had not the same coverage as those
ones generated through TRIZ. That is, the contribution
of TRIZ to accelerate projects while maintaining the
quality was significant in quantity and focus. As a
general conclusion and based on 109 solutions generate
using the TRIZ tools, we might say that the project
management practice, like any other group of processes,
can also benefit from the exposure to the TRIZ
concepts, mainly for problems in which the usual
solutions may lead to a compromise.
J.J. Monteiro/ Int. J. Systematic Innovation, 2(2), 24-42 (2012)
41
TRIZ can take the standard PM procedure beyond
the usual limits to deal with real problems in executing
any project. It does it by turning clear the harms and
insufficiencies and focusing on solving the main
contradiction without compromises.
Based on the number of solutions obtained
through each tool, the most effective ones for similar
cases were the elimination of the technical and physical
contradictions. Being part of the proposed workflow’s
basic cycle, they were quicker and generated 51% of
the entire contribution. They can be considered the best
option for similar cases in which the schedule is critical
and the time to develop the whole workflow is short.
The solutions derived from this paper can be
applied in other similar cases as a checklist to evaluate
the situation regarding speed and quality of the projects
under planning. However, some of the solutions are
specific to the situation and environmental under
analysis and may be not relevant to other cases.
Due to the characteristics of the TRIZ workflow, it
can be adjusted (using part of the available tools)
according to the situation’s complexity or the
dissatisfaction with the amount and / or quality of the
solution proposals obtained so far. The workflow
facilitates the use of the tools by beginners.
For better results, a multidisciplinary group,
including members with deep knowledge of the
problem, should perform the exercise of TRIZ.
One thing that becomes clear along the process is
that the structured and progressive TRIZ workflow
used in this paper turns quickly available strong means
to identify the real critical problems. Around these
critical points, all energy and inventiveness are
concentrated to generate a huge amount of possible
solutions in a very short time period.
It is important to make clear that the TRIZ tools
were not meant to replace the project management
procedures. Their application only makes sense over an
established project management methodology when
facing a real problem or limitation in getting the
desired projects results. If there is no project
management procedure in use, the first step would be
to introduce it, otherwise TRIZ would only generate
solutions that certainly would already be part of any
consolidated project management good practice.
As seen, TRIZ can be a powerful support to
improve the PM practices if one considers that PM is
about delivering quality results under restrictions of
time, cost, and scope, a typical scenario with
contradictions and compromises.
References
Altshuller, G. S. (1999). Innovation Algorithm,
Worcester: Technical Innovation Center (1st.
ed.1969).
Bersano, G. (2008). TRIZ as Catalyst for Project
Management Excellence, The TRIZ Journal.
Gadd, K. (2011). TRIZ for Engineers – Enabling
Inventive Problem Solving, Chichester - West
Sussex – United Kingdom - John Wiley and
Sons Ltd.
Mann, D. L. (2009). Hands-On Systematic Innovation
for Business & Management, Bideford – Devon –
UK – Lazarus Press.
Mann, D. L. (2010). Hands-On Systematic Innovation
for Technical Systems, Bideford – Devon – UK –
Lazarus Press.
Mann, D. L. (2010). Matrix 2010, Re-updating the
TRIZ Contradiction Matrix, First Edition –
Bideford – Devon – UK - Lazarus Press.
PMI-Project Management Institute (2013). A Guide to
the Project Management Body of Knowledge,
(PMBOK Guide - 5th. Edition) – Newtown
Square, PA, USA - Project Management Institute,
Inc.
PMI-Project Management Institute (2013).PMI s Pulse
of Profession- The High Cost of Low
Performance, Newtown Square, PA, USA -
Project Management Institute, Inc.
Rantanen, K. and Domb, E. (2008). Simplified TRIZ:
new problem solving applications for engineers
and manufacturing professionals, 2nd edition-
Boca Raton – FL – USA – Auerbach Publications-
Taylor & Francis Group, LLC.
Silverstein, S., Decarlo, N.; and Slocum, M. (2008).
Insourcing Innovation – How to Achieve
Competitive Excellence Using TRIZ, Boca
Raton – FL – USA – Auerbach Publications-
Taylor & Francis Group.
Smith, P. G. and Merrit, G. M. (2002). Proactive Risk
Management: Controlling Uncertainty in Product
Development, New York, NY- USA- Productivity
Press.
Wideman, R. M. (1992). Project and Program Risk
Management: A Guide to Managing Project Risk
and Opportunities, Newtown Square, PA, USA -
Project Management Institute, Inc.

J.J. Monteiro/ Int. J. Systematic Innovation, 2(2), 24-42 (2012)
42
AUTHOR BIOGRAPHY
José Jorge Monteiro is an engineer
at Lanxess Elastômeros do Brasil since
1996. Before then, he has 15 years of
industrial experience at several
chemical and petrochemical local
industries in Brazil, mostly dealing with process
improvements and industrial project management. José
has a chemical engineering degree from Universidade
Federal Rural do Rio de Janeiro-Brazil and received his
MBA and Post-MBA in advanced project management
from FGV-Fundação Getúlio Vargas-Rio de Janeiro-
Brazil. He also holds, a Project Management
Professional certificate from PMI-Project Management
Institute-USA and a TRIZ Champion certificate from
Oxford Creativity-UK. His main areas of interests are
Systematic Innovation, basically TRIZ and
biomimetics, and project management.

W.J. Chang/ Int. J. Systematic Innovation, 2(2), 43-53 (2012)
43
A New Perspective on EFL Teaching: Applying Fuzzy QFD in TRIZ
for Teaching Quality Improvement
Wan-Jeng Chang
Department of Applied English, Overseas Chinese University, Taichung, Taiwan
E-mail: [email protected]
Abstract
Teaching quality has been a frequently studied topic in education literature; however, a creative approach for
improving teaching quality is rarely discussed. In this paper, a systematic framework based on the TRIZ
methodology is suggested to generate creative solutions for improving teaching quality. First, the determinants
of teaching quality were investigated based on a comprehensive review of language teaching. Subsequently, a
parameter-corresponding table was developed to apply the TRIZ contradiction matrix effectively to solve
language-teaching problems. Cochran test was used as a statistical hypothetic test during this phase. The cor-
relation between “the vague opinions from the supplier and receptor of teaching” and “the determinants of
teaching quality” was analyzed by using fuzzy QFD to identify the critical determinants related to teaching
quality improvement. The corresponding parameters can be effectively applied in the TRIZ contradiction ma-
trix to identify the inventive principles. The appropriate re-explanations of the inventive principles developed
for foreign language teaching are discussed. A case study proved the usefulness of the approach in EFL
courses, and practical solutions are presented to demonstrate the valuable contribution of the TRIZ methodol-
ogy to the education field.
Keywords: Teaching quality, Teaching improvement, TRIZ, EFL, Fuzzy QFD
1. Overview
The teaching quality of universities has been in-
creasingly emphasized since Boyer (1990) proposed
expanding scholarship beyond teaching, integration,
and application. Although educators have begun to
realize the importance of improving teaching quality,
the processes remain uncertain. Planning a university
course is a complex activity (Barone & Lo Franco,
2009); therefore, enhancing teaching quality involves
substantial shifts in thought and practice. In this study,
a methodology for innovatively resolving teaching
problems and improving teaching quality was devel-
oped to foster meaningful and long-term learning for
students.
TRIZ (Theoria Resheneyva Isobretatelskehuh
Zadach) is a Russian abbreviation for “theory of in-
ventive problem solving,” which is a well-developed
system of tools used for idea generation, problem
solving, and failure prevention (Akay, Demıray & Kurt,
2008; Belski, 2009). One tool, contradiction analysis,
which consists of 39 parameters and 40 inventive prin-
ciples, is the most frequently used method (Su & Lin,
2008). TRIZ is a popular subject regarding technologi-
cal innovation (Mann, 2000) and has recently been
proven to be an innovative and well-structured method
for solving problems in non-technical fields (Mann,
2000; Saliminamin & Nezafati, 2003). However, there
is a lack of TRIZ-specific research addressing the
teaching quality domain, which is another reason for
undertaking this study.
Quality function deployment (QFD) is a method
for developing and managing products or services to
assist planners in identifying product or service char-
acteristics from the viewpoints of customers (Celik,
Cebi, Kahraman & Er, 2009). The practice of QFD has
primarily relied on market surveys for acquiring cus-
tomer requirements, and planners typically employ
linguistic variables to set various parameters. However,
the outcomes of market surveys and linguistic variables
are often imprecise or unclear and may reflect biased
results. Scholars have combined the fuzzy set theory
with QFD to solve this problem (Liu, 2011). In contrast
to traditional QFD, the input data of fuzzy QFD are

W.J. Chang/ Int. J. Systematic Innovation, 2(2), 43-53 (2012)
44
expressed and represented in fuzzy numbers instead of
crisp numbers (Chen, Fung, & Tang, 2006). In the cur-
rent study, fuzzy QFD was used to identify critical
teaching-quality determinants; this is crucial because
numerous researchers have proposed that teaching is
one of the primary services of a university (Harvey,
2003; Barone & Lo Franco, 2009).
In this study, the “quality” of a university course is
defined as the degree to which the course satisfies the
teaching expectations of the supplier and the receptor.
Tribus (1993) stated that quality is what makes learning
a pleasure and involves the way in which the teaching
process is performed. In this regard, teachers and stu-
dents are the primary parties responsible for achieving
the goal of improved teaching quality. Accordingly, this
paper addresses both teacher and student perspectives.
The study is structured as follows: Section 2 pre-
sents a review of the literature; Section 3 provides a
description of the proposed approach; Section 4 pre-
sents the application of the proposed approach to Eng-
lish as a foreign language (EFL) courses; and Section 5
offers concluding remarks and suggestions for future
developments.
2. Literature review
TRIZ offers a comprehensive toolkit for analyzing
and solving problems according to various perspectives
and is based on the knowledge and experiences of a
wide range of inventors (Moehrle, 2005). The founda-
tion study of TRIZ research was one of the largest
studies on creativity conducted, involving more than
1,500 person-years of study and an analysis of more
than two million patents globally (Mann, 2001; Zhang,
Chai, & Tan, 2005). In this foundation study, an ex-
ceedingly small number of inventive patterns and
strategies were identified and extracted (Mann, 2001).
The strengths of TRIZ are described as follows. First,
TRIZ encourages planners to break out of the conven-
tional “begin with the present situation” style of think-
ing, and to start instead by considering ideality (Mann,
2001). Second, it transforms the undesirable elements
of a system into useful resources and removes contra-
dictions rather than encourages trade-offs or compro-
mise (Mann, 2001; Zhang, et al., 2005; Su & Lin,
2008). Third, it helps to prevent psychological inertia,
which is inherent in human thinking, because it in-
volves devising a comprehensive set of feasible solu-
tions (Zhang et al., 2005). Fourth, by providing a pre-
defined direction, TRIZ complements and adds struc-
ture to, rather than replaces, an inventor’s natural crea-
tivity (Mann, 2001; Moehrle, 2005). TRIZ facilitates
developing numerous high-quality ideas effectively and
systematically (Zhang et al., 2005).
The most commonly applied TRIZ tool is the con-
tradiction matrix, which consists of 39 rows and 39
columns involving the 1,482 most common contradic-
tion types (Mann, 2001). The rows of the matrix con-
tain the desired factors of a system, whereas the col-
umns comprise the harmful elements of a system. In
each cross-field, up to 4 of 40 inventive principles are
advised for eliminating the contradiction. Using dif-
ferent inventive principles occasionally generates sim-
ilar ideas. The inventive principles lead planners in
specific directions, but concrete solutions must be
formed by combining inventive principles with the
knowledge and creativity of the individual problem
solver (Moehrle, 2005).
During years of development and application,
TRIZ has proven its effectiveness and efficiency in
resolving technical problems and in removing all
boundaries across a broad range of areas and problem
types (Mann, 2001). Several papers have presented
discussions on the 40 inventive principles in various
fields, such as business (Mann & Domb, 1999), finance
(Dourson, 2004), society (Terninko, 2001), software
(Rea, 2001), microelectronics (Retseptor, 2002), food
(Mann, & Winkless, 2001), quality management
(Retsptor, 2003), eco-innovation (Chang & Chen,
2003), construction (Teplitskiy & Kourmaev, 2005),
service operations management (Zhang, Chai, & Tan,
2003), education (Marsh, Waters, & Marsh, 2004), and
marketing, sales, and advertising (Retsptor, 2005).
Several studies have also presented discussions on the
parameters in the TRIZ contradiction matrix for
non-technical fields, such as business (Mann, 2002),
education (Marsh, Waters, & Mann, 2002), service
quality (Su, Lin, & Chiang, 2008), and English learn-
ing (Sokol et. al., 2008). The literature on applying
TRIZ in improving teaching quality has been limited,
particularly in the area of foreign language teaching.
To strengthen their strong points (Tan, 2002), in-
tegrating TRIZ with other leading methods, such as
QFD (Domb, 1998; Terninko, 1998; Schlueter, 2001;
Yanashina, Ito, & Kawada, 2002), the theory of con-
straint (Stratton & Warburton, 2003), and Six Sigma
(Verduyn, 2002), is a recent trend (Tan, 2002). Su and
Lin (2008) proposed a systematic method for integrat-
ing fuzzy QFD and TRIZ to improve e-service quality.

W.J. Chang/ Int. J. Systematic Innovation, 2(2), 43-53 (2012)
45
Because of their application success, the model of Su
and Lin was applied in this study to resolve problems
in an EFL teaching context.
3. Proposed approach
Based on the literature review, the systematic
problem-solving process used in previous research (Su,
Lin, & Chiang, 2008; Su & Lin, 2008) was applied,
with slight modifications, to improve teaching quality.
The proposed approach comprises five primary phases.
Phase 1: Clarify the scope of the problem and dis-
tinguish the segment under which it is classified. As-
sisting problem solvers in clarifying the depth of the
original problem requires identifying the specified area
and focusing on resolving issues in the same segment.
For instance, problems arising in EFL courses are clas-
sified under the segment of foreign language teaching.
Consulting teachers and students to collect existing
information on the possible problem is an easy and
common practice for gathering situational information
accurately. Function and attribute analysis (FAA) can
also be used to access the root causes of the problem.
Phase 2: Extract the determinants affecting teach-
ing quality from a review of various perspectives. Ref-
erence materials related to teaching quality are exten-
sively analyzed to identify the critical characteristics
regarding teaching quality improvement.
Phase 3: Develop a parameter-corresponding table
for foreign language teaching. Once the resulting table
of the identified segment is constructed, the assured
TRIZ parameters can be efficiently extracted and ap-
plied in the contradiction matrix. This phase comprises
five steps:
Step 3-1: Link the implications of the determi-
nants assembled in Phase 2 with the TRIZ 39 engi-
neering parameters according to their analogical inter-
pretations. A survey of a focus group or several
semi-structured interviews may be conducted in this
step.
Step 3-2: Design a questionnaire based on the pa-
rameter-matching results in Step 3-1.
Step 3-3: Administer the questionnaire to a group
of professionals to ensure their approval of the match-
ing results. Determine that more than half of the spe-
cialists accept remarks as “accepted” or “rejected.”
Reform the rejected items according to specialists’
suggestions until all of them are accepted.
Step 3-4 Confirm the relative effectiveness of the
expert opinions on the parameter-matching results by
using the Cochran test, a statistical test.
Step 3-5: According to the results of Step 3-4,
construct a verified parameter-corresponding table for
the segment of foreign language teaching. The speci-
fied contradiction matrix is now ready for use.
Phase 4: Originate the practicable solutions by
using the TRIZ contradiction matrix. Following the
indicated TRIZ inventive principles, all probable solu-
tions may be generated through various discussions.
This process is divided into the following steps:
Step 4-1: Describe the existing problems specifi-
cally and identify the elements of the existing problems
based on the interviews conducted in Phase 1.
Step 4-2: Define the ideal situation to be achieved
when the existing problems are solved.
Step 4-3: Apply fuzzy QFD with the entries of de-
terminants from Phase 3 to indicate the critical deter-
minants relevant to the existing problems. This step
consists of five procedures.
(1) The importance of the relationship between
teaching quality determinants from Phase 3 and the
elements of the existing problems is described in lin-
guistic terms with five distinct levels, namely, EI (ex-
tremely important), VI (very important), I (important),
SI (slightly important), and NI (not important). The
data can be collected from the opinions of selected
teachers and students.
(2) The triangular fuzzy number is employed in
this research, and all membership functions for the
linguistic input data are standardized in the interval [0,
1]. The triangular fuzzy numbers {(0.75, 1, 1), (0.5,
0.75, 1), (0.25, 0.5, 0.75), (0, 0.25, 0.5), (0, 0, 0.25)}
correspond to linguistic variables {“EI”, “VI”, “I”, “SI”,
“NI”}, individually.
(3) Assume ),,( ijkijkijkijk cbaT is the triangular
fuzzy number of the thk team member assessing the
correlative importance between the thj element of the
existing problems and the thi entry of teaching quality
determinants. Thus, ijT is the average fuzzy number of
the thi entry of teaching quality determinants for the thj
element of the existing problems. When
),,( ijijijij cbaT and n = the number of team members,
ijT can be calculated using the following equations:
n
k
ijkij Tn
T1
1

W.J. Chang/ Int. J. Systematic Innovation, 2(2), 43-53 (2012)
46
n
k
ijkij an
a1
1
n
k
ijkij bn
b1
1
n
k
ijkij cn
c1
1
Assume there is no weighting difference consid-
ered among the determinants of teaching quality, and,
consequently, the integrated fuzzy number of each
teaching quality determinant for m team mem-
bers ),,( iii CBA can be calculated using the following
equations:
m
j
iji am
A1
1
m
j
iji bm
B1
1
m
j
iji cm
C1
1
(4) Assume X is the defuzzified value of the inte-
grated fuzzy number for each teaching quality deter-
minant ),,( iii CBA , and can be calculated using the fol-
lowing equation (Su & Lin, 2008):
4
iiii CBBAX
(5) Based on the computed data, the prioritized
significance of each relevant determinant can be ranked
successively.
Step 4-4: Discuss the determinants that prevent
the desirable situation from being achieved in the top
region of the ranking list. The improving and worsen-
ing determinants can then be identified from the pa-
rameter-corresponding table developed in Phase 3.
Step 4-5: Based on the TRIZ contradiction matrix,
indicate the intersection of the improving and worsen-
ing parameters and denote the numbers of the TRIZ 40
inventive principles.
Step 4-6: Identify the TRIZ 40 inventive princi-
ples that appear at least twice according to the outcome
of Step 4-5.
Step 4-7: Based on relevant references, re-explain
the inventive principles to suit the identified segment.
Link the suggested principles to the existing problems
and generate all viable solutions to eliminate the con-
flict points by discussion meetings.
Step 4-8: Examine the possible solutions and in-
vite experts to rank them according to a set of deci-
sion-making criteria.
Phase 5: Implement the attainable solutions. If the
existing problems are ineffectively solved, repeat the
fourth stage until the conflicts are resolved.
4. Case study
The studied school is a privately funded university
in central Taiwan. To aid in a later career, all students
are required to master at least one foreign language,
specifically, English. The university language center
proposed and implemented an English enhancement
scheme in 2009. The goal of the scheme is to enhance
the English ability of students in a short time. However,
since the implementation of the new policy, several
students have encountered various problems. In addi-
tion to the proficiency and achievement tests (in-class
quizzes, mid-terms, and final exams), students are
graded according to online learning tests, online learn-
ing practices, weekly vocabulary tests, a certificate of
English proficiency test, and the English learning
passport, which involves participating in English activ-
ities. Students are expected to acquire an abundance of
knowledge in class and after school.
The case study focused on providing an efficient
approach for generating ideas to resolve the problems
regarding general English teaching in the university to
improve EFL teaching quality. The author first inter-
viewed three teachers and three freshmen who partici-
pated in the English enhancement scheme for 1 year.
The results showed various contradictions within the
scheme, and that TRIZ could be used to resolve the
teaching problems.
Phase 1: In the studied case, the university lan-
guage center is in charge of the general English courses
for all students. The problems arising in EFL courses
were classified under the segment of foreign language
teaching. The FAA diagram in Fig. 1 was developed
based on the aforementioned interviews.

W.J. Chang/ Int. J. Systematic Innovation, 2(2), 43-53 (2012)
47
Phase 2: In this phase, the author concentrated on
various perspectives from the literature review to ex-
tract the main determinants of teaching quality in the
specified segment. By categorizing the related aca-
demic studies within the scope of the case problem, the
author concluded that teaching quality improvement is
related to educational quality, teaching effectiveness,
student achievement, student satisfaction, and potential
teaching difficulties. The teaching quality determinants
mentioned in this study may suit both EFL teaching
and other undergraduate subjects.
Primary Useful Function
English ability
measure enhance
Useful function Useful function
English certificates Vocabulary size
obtain increase
Useful function
increase English enhancement scheme increase
Harmful function Harmful function
Course difficulty deliver Workload
increase Harmful function increase
Energy and time
( : Useful action :Harmful action)
Figure 1 The FAA diagram for the case study
Fig. 1. The FAA diagram for the case study
Phase 3: The determinants of teaching quality de-
veloped in Phase 2 were analyzed and explained, and
were subsequently correlated with the TRIZ 39 param-
eters. Semi-structured interviews with five experts in
the fields of TRIZ, education, and EFL teaching were
conducted to ensure a matching result.
The parameter-corresponding table is presented in
Table 1. A TRIZ parameter may match more than one
determinant of teaching quality. Furthermore, the de-
terminants of teaching quality are not limited to those
shown in Table 1. Each row of Table 1 represents the
most similar analogical explanation between a deter-
minant of teaching quality and a specific TRIZ param-
eter.
Subsequently, the author designed a questionnaire
explaining each parameter, and five EFL teachers from
the university were invited to answer the questionnaires
with their professional opinions. Each item gained the
approval of at least three specialists.
The Cochran test was used to confirm the con-
sistency of the specialists’ opinions on the parame-
ter-corresponding results, which led to the development
of the following null hypotheses:
0H : No meaningful difference exists among the
opinions.
1H : A meaningful difference exists among the
opinions.
“1” was used to express agreement with the
matching result, and “0” was used to express rejection.
The results were tabulated using c columns (c special-
ists) and r rows (r determinants). Each entry in the table
was either “1” or “0.” Ri was the row totals (i = 1,
2, . . .., r), Cj was the column totals ( j = 1, 2, . . .., c),
and N was the total number of “1” values in the table.
The test statistic was calculated using the following
equation:
235.834
1445
)(
)(
)1(
1
1
2
r
i
ii
c
j
j
RcR
c
NC
ccT
The computed statistic value of T was smaller
than the critical value 9.488. The null hypothesis
0H was accepted. Therefore, the 29 pairs of matching
parameters were valid.
Table 1. Parameter-corresponding Table

W.J. Chang/ Int. J. Systematic Innovation, 2(2), 43-53 (2012)
48
No. of
TRIZ
parameter
Name of TRIZ
parameter
Determinants of
teaching quality References
1
3
5
7 15
19
A mobile object
E-learning
(web-assisted or
web-based
courses)
Liaw, Huang, &
Chen (2007)
Fichten et al.
(2009) Liaw et al. (2007)
Waschull (2001)
Desai, Hart, &
Richard (2008)
Faul, Frey, and
Barber (2004)
Uzunboylu (2005)
2
4
6
8
16
20
A stationary
object
Traditional
classroom
instruction
Stephenson,
McGuirk, Zeh, &
Reeves (2005)
9 Speed The pace of a
lesson
Greenblatt, Cooper, & Muth (1984)
Feldman (1989)
10 Force Group
interaction
Phillips, Santoro, &
Kuehn (1988)
Marsh & Bailey
(1993)
Chickering &
Gamson (1991)
11 Tension/
Pressure
Pressure or
stress of
students
Hughes (2005)
Byrne & Flood
(2003) Ginnsa,
Prosserb & Barriea
(2007)
12 Shape Overall course
impression Harrison, Douglas, & Burdsal (2004)
13 Stability of
composition
Well-designed
curriculum
Walker (2003)
Holley (2009)
14 Strength Professionalism
of instructors
Glenn (2001)
Jumani & Yousuf
Zai (2009)
Eilam & Poyas
(2006)
17 Temperature Classroom
atmosphere
Glenn (2001)
Feldman (1989)
18 Brightness Learning
environment
Jumani & Yousuf
Zai (2009)
Beattie & Collins
(2000)
Strolin-Goltzman (2010)
21 Power
Enthusiasm and
efforts of
teachers
Minchella (2007)
22 Loss of energy Excessive
workload
Harrison, Douglas,
& Burdsal (2004)
Feldman (1989)
Byrne & Flood
(2003)
23 Loss of a
substance
Maintenance of
facilities and
equipment
Beattie & Collins
(2000)
24 Loss of
information
Selected course
content
Sözbilir (2004)
25 Loss of time
Spending time
on classroom
management
Van de Grift (2007)
26 Amount of
substance
Adequate
facilities and
equipment
Beattie & Collins
(2000)
27 Reliability Teachers'
self-efficacy
Fives & Buehl (2010)
Klassen & Chiu
(2010)
28 Accuracy of
measurement
Accuracy of
grading
Harrison, Douglas,
& Burdsal (2004)
Beattie & Collins
(2000)
Jumani & Yousuf
Zai (2009)
29 Accuracy of
manufacturing
Aligning
teaching and
assessing with
course objectives
Biggs (1996)
30
Harmful factors
acting on an
object from
outside
Unnecessary
interruptions
Greenblatt, Cooper,
& Muth (1984)
Kennedy (2006)
31
Harmful factors
developed by an
object
Disruptive
student
behavior
Kennedy (2006)
32 Manufacturability The degree of
class difficulty
Harrison, Douglas,
& Burdsal (2004)
33 Convenience of
use
Convenience of
finding support
Klem & Connell
(2004)
34 Reparability Reflective
teaching
Farrell (1998)
35 Adaptability
Flexibility in
teaching (to
respond to
external environment or
to meet student
needs)
Feldman (1989)
Zahorik (1990)
Knight (1999)
Glenn (2001)
36 Complexity of a
device
Complexity of a
grading policy
Sadler (2005)
Linn, Baker, &
Dunbar (1991)
37 Complexity of
control
Complexity of
the issues
involved in
grading
Guskey (2000)
Wood (1994)
38 Level of
automation
Self-initiated
learning
Feldman (1989)
Beattie & Collins
(2000) Van de Grift (2007)
39 Capacity/
Productivity
Expectations for
student
performance
Beattie & Collins
(2000)
Chickering &
Gamson (1991)
Phase 4: According to the results of FAA, the
scope of the problem comprised the areas of vocabu-
lary size, English certificates, course difficulty, and
workload. These four were the elements of existing
problems, and the author defined the ideal situation as
the provision of a supportive and motivating environ-
ment for students to enhance their English ability
without undertaking heavy workloads.
The fuzzy QFD process was initiated to identify
the critical teaching quality determinants. The correla-
tive importance between the teaching quality determi-

W.J. Chang/ Int. J. Systematic Innovation, 2(2), 43-53 (2012)
49
nants from Phase 3 and elements of the existing prob-
lems was determined in linguistic terms based on the
opinions of the three teachers and three students who
participated in the English enhancement scheme for 1
year. The integrated triangular fuzzy numbers and the
rankings of their importance are shown in Table 2.
Table 2. Integrated Triangular Fuzzy Numbers and the Rankings
of their Importance
Integrated Triangular Fuzzy Number No. of
Teaching Quality
Determinant iA iB iC
Defuzzied
Fuzzy
Number
Ranking
of
Importance
1 0.250 0.458 0.698 0.466 13
2 0.365 0.615 0.865 0.615 4
3 0.333 0.500 0.698 0.508 8
4 0.094 0.239 0.489 0.265 25
5 0.188 0.365 0.604 0.380 19
6 0.188 0.375 0.625 0.390 18
7 0.313 0.531 0.771 0.536 7
8 0.198 0.396 0.635 0.406 16
9 0.198 0.386 0.604 0.393 17
10 0.032 0.177 0.427 0.203 28
11 0.219 0.417 0.667 0.430 15
12 0.230 0.427 0.646 0.432 14
13 0.073 0.187 0.437 0.221 26
14 0.042 0.115 0.365 0.159 29
15 0.250 0.458 0.698 0.466 12
16 0.084 0.250 0.500 0.271 23
17 0.459 0.698 0.886 0.685 2
18 0.115 0.261 0.511 0.287 22
19 0.313 0.510 0.698 0.508 10
20 0.292 0.500 0.740 0.508 9
21 0.104 0.312 0.562 0.323 21
22 0.375 0.573 0.761 0.570 5
23 0.375 0.625 0.875 0.625 3
24 0.156 0.354 0.594 0.364 20
25 0.323 0.573 0.781 0.562 6
26 0.094 0.240 0.490 0.266 24
27 0.073 0.177 0.427 0.213 27
28 0.615 0.865 0.958 0.826 1
29 0.302 0.500 0.709 0.503 11
The author regarded the first five ranked determi-
nants as the primary characteristics influencing student
learning regarding participation in the English en-
hancement scheme. The selected determinants were
self-initiated learning, teachers' self-efficacy, conven-
ience of finding support, traditional classroom instruc-
tion, and the degree of class difficulty.
To achieve the ideal situation, the five identified
important determinants must be improved. However,
this involves several issues. First, encouraging
self-regulated learning may require increasing peer
interaction and professor interaction. Interaction gives
learners the opportunity to model behaviors and to
measure their progress, which in turn increases the mo-
tivation to learn. Second, improving the self-efficacy of
instructors requires extra in-service training. Teachers
must spend more time participating in related work-
shops or seminars. Third, providing more support and
offering additional courses increase the workload of
teachers. Teachers must increase their efforts to satisfy
student needs. Fourth, lowering the coverage rate and
the level and amount of material may affect the
productivity of students. Teachers may need to lower
their expectations for student performance.
Table 3 shows improving TRIZ parameters, the
corresponding worsening TRIZ parameters, and the
number of TRIZ inventive principles in the intersection
of the improving and worsening TRIZ parameters. The
principles that occurred at least twice were No. 2, 10,
28, and 35.
Table 3. Improving and Worsening TRIZ Parameters and the
Related Inventive Principles
Improving
TRIZ
Parameters
Worsening
TRIZ
Parameters
Number of
Inventive
Principles
38 10 2 35
27 14 11 28
33 21 2 10 34 35
2 21 15 18 19 22
4 21 8 12
6 21 17 32
8 21 6 30
16 21 16
20 21
32 39 1 10 28 35
The author analyzed each of the inventive princi-
ples from the related studies and discussed them with
the three teachers and three students who participated
in the English enhancement scheme for 1 year to gen-
erate ideas for solutions. The study of Marsh et al.
(2004), which provides educational examples of the 40
inventive principles, was the primary reference in the
discussions.
The first idea was based on Principle 2, extraction.
A remedial program can be established, and students
with special needs should be separated from the gen-
eral student population (Marsh et al., 2004). Teachers
can arrange meetings with students who require addi-
tional assistance. The meetings can be conducted to
review course content, emphasize key points, and pro-
vide additional practice.
The second idea was developed based on Principle
10, prior action. The accuracy of the placement test
must improve. The current type of question is multiple

W.J. Chang/ Int. J. Systematic Innovation, 2(2), 43-53 (2012)
50
choices, which is too simple for adequately determin-
ing the ability of students. Students who enter a class
that is not suited to their ability encounter problems.
Increasing the number and variety of placement test
questions may facilitate determining the actual level of
student ability.
The third idea was derived from Principle 2. Stu-
dents in the studied university were classified accord-
ing to their placement test performance: superior, in-
termediate, and average. Students should study materi-
als suited to their English ability. Students should be
classified into more than three levels.
The fourth idea was based on Principle 35, trans-
formation of the physical and chemical states of an
object. Numerous students do not appropriately equip
themselves to study current courses. They must en-
hance their basic skills, such as phonetic symbols,
pronunciation, and grammar. Intensive courses can
improve students’ skills in a short period of time. These
basic courses can be taught during nights, weekends,
and summer and winter vacations for a small tuition
fee.
The fifth idea was based on Principle 35. Teachers
can reduce the volume of vocabulary taught throughout
the semester, but assign homework during summer (2
months) and winter (1 month) vacations. Therefore,
students can reduce their workload, reducing the prob-
ability that they neglect their studies during the semes-
ter.
The sixth idea was based on Principle 35. The
university offers English classes only for freshmen and
sophomores. Instead of teaching a substantial amount
of content in the first 2 years, it may be useful to pro-
vide courses throughout the 4 years of undergraduate
study. Offering English courses to junior and senior
students may enhance their learning.
The source of the seventh idea was Principle 35.
The general English course is 2 hr per week. Because
teachers are unable to teach all the content in 2 hr, it
may help to add 1 more hr to the course. Three hours
per week gives teachers sufficient time cover all the
course content.
The eighth idea was based on Principle 28, re-
placement of a mechanical system. Teachers can divide
students into groups consisting of both high and low
achievers. Those who perform highly are responsible
for tutoring the others. The study group provides op-
portunities for students to model desired behaviors.
The ninth idea was based on Principle 35. The
university offers courses for preparing English certifi-
cates, but only a certain number of students enroll in
these classes because of the cost. The school can pro-
vide additional classes for all students who want to join
the program for a small fee.
These nine ideas were prioritized in the grading
from 1 to 10 and were evaluated by five teachers from
the university. Cost, time, and manpower were the
three criteria considered when making the final deci-
sion. The nine ideas were arranged according to priori-
ty as follows: Idea 9, 6, 2, 8, 7, 5, 3, 4, and 1.
Phase 5: The school was suggested to implement
these nine ideas according to their priority. The results
of the implementation are not demonstrated in this case
study. Researchers may consider evaluating the results
in future studies.
5. Conclusion
The contribution of this study to EFL teaching is
the suggestion of a creative approach to improving
teaching quality, a contribution that provides a consid-
erable boost toward solving teaching problems. This
study also fills gaps in previous research on TRIZ by
constructing teaching quality determinants that corre-
late with the TRIZ 39 parameters. Although the veri-
fied parameter-corresponding table may not reflect all
the distinct patterns of teaching quality, implementing
the proposed approach would produce a considerable
effect on the education field.
References
Akay, D., Demıray, A., and Kurt, M. (2008). Collabo-
rative tool for solving human factors problems in
the manufacturing environment: the Theory of
Inventive Problem Solving Technique (TRIZ)
method. International Journal of Production Re-
search, 46(11), 2913-2925.
Barone, S. and Lo Franco, E. (2009). Design of a uni-
versity course quality by Teaching Experiments
and Student Feedback (TESF). Total Quality
Management & Business Excellence, 20(7),
687-703.
Beattie, V. and Collins, B. (2000). Teaching quality
assessment in accounting: The Scottish experience.
Accounting Education, 9(1), 1-22.

W.J. Chang/ Int. J. Systematic Innovation, 2(2), 43-53 (2012)
51
Belski, I. (2009). Teaching thinking and problem solv-
ing at university: A course on TRIZ. Creativity &
Innovation Management, 18(2), 101-108.
Biggs, J. (1996). Enhancing teaching through construc-
tive alignment. Higher Education, 32, 347-364.
Boyer, E. L. (1990). Scholarship Reconsidered: Priori-
ties of the Professoriate. Princeton, NJ: The Car-
negie Foundation for the Advancement of Teach-
ing
Byrne, M., and Flood, B. (2003). Assessing the teach-
ing quality of Accounting programmes: An evalu-
ation of the course experience questionnaire. As-
sessment and Evaluation in Higher Education,
28(2), 135-145.
Celik, M., Cebi, S., Kahraman, C., and Er, I. D. (2009).
An integrated fuzzy QFD model proposal on
routing of shipping investment decisions in crude
oil tanker market. Expert Systems with Applica-
tions, 36, 6227-6235.
Chang, H. T. and Chen, J. W. (2003). Eco-innovative
examples for 40 TRIZ Inventive principle. The
TRIZ Journal, Aug.
Chickering, A.W. and Gamson, Z.F. (Eds.). (1991).
New directions for teaching and learning: Vol. 47.
Applying the seven principles for good practice in
undergraduate education. San Francisco:
Jossey-Bass.
Chen, Y., Fung, R. Y. K., and Tang, J. (2006). Rating
technical attributes in fuzzy QFD by integrating
fuzzy weighted average method and fuzzy ex-
pected value operator. European Journal of Oper-
ational Research, 174(3), 1553-1566.
Desai, M. S., Hart, J., and Richard, T. C. (2008).
E-learning: Paradigm shift in education. Educa-
tion, 129(2), 327-334.
Domb, E. (1998). QFD and TIPS/TRIZ. The TRIZ
Journal, Jun.
Dourson, S. (2004). The 40 Inventive Principles of
TRIZ Applied to Finance. The TRIZ Journal, Oct.
Eilam, B. and Poyas, Y. (2006). Promoting awareness
of the characteristics of classrooms' complexity: A
course curriculum in teacher education. Teaching
and Teacher Education, 22(3), 337-351.
Ellen, D. (1998). The 39 features of Altshuller’s con-
tradiction matrix. The TRIZ Journal, Nov.
Farrell, T. (1998). Reflective teaching: The principles
and practices. English Teaching Forum, 36(4),
10 – 17.
Faul, A. C., Frey, A. J., and Barber, R. (2004). The ef-
fects of web-assisted instruction in a social work
research methods course. Social Work Education,
23(1), 105-118.
Feldman, K. A. (1989). The association between stu-
dent ratings of specific instructional dimensions
and student achievement: Refining and extending
the synthesis of data from multisection validity
studies. Research in Higher Education, 30(6),
583-645
Fichten, C. S., Asuncion, J.V., Barile, M., Ferraro, V.,
and Wolforth, J. (2009). Accessibility of
e-learning and computer and information tech-
nologies for students with visual impairments in
postsecondary education. Journal of Visual Im-
pairment & Blindness, 103(9), 543-557.
Fives, H. and Buehl, M. M. (2010). Examining the
factor structure of the teachers’ sense of efficacy
scale. The Journal of Experimental Education,
78(1), 118-134.
Ginnsa, P., Prosserb, M., and Barriea, S. (2007). Stu-
dents’ perceptions of teaching quality in higher
education: The perspective of currently enrolled
students. Studies in Higher Education, 32(5),
603-615.
Glenn, R. E. (2001). What teachers need to be. Educa-
tion Digest, 67, 19-21.
Greenblatt, R. B., Cooper, B. C. and Muth, R. (1984).
Managing for effective teaching. Educational
Leadership, 41(5), 57-59.
Guskey, T. R. (2000). Developing grading and report-
ing systems for student learning. Thousand Oaks,
CA: Corwin Press.
Harrison, P.D., Douglas, D.K., and Burdsal, C.A.
(2004). The relative merits of different types of
overall evaluations of teaching effectiveness. Re-
search in Higher Education, 45(3), 311-323.
Harvey, L. (2003). Student feedback. Quality in Higher
Education, 9(1), 3-20.
Holley, K. (2009). The challenge of an interdisciplinary
curriculum: A cultural analysis of a doctor-

W.J. Chang/ Int. J. Systematic Innovation, 2(2), 43-53 (2012)
52
al-degree program in neuroscience. Higher Edu-
cation, 58(2), 241-255.
Hughes, B. M. (2005). Study, examinations, and stress:
Blood pressure assessments in college students.
Educational Review, 57(1), 21-36.
Jumani, N. B. and Yousuf Zai, Z. I. (2009). Distance
teacher education in Pakistan. Quarterly Review of
Distance Education, 10(4), 381-389.
Kennedy, M. M. (2006). From teacher quality to quali-
ty teaching. Educational Leadership, 63(6), 14-19.
Klassen, R. M. and Chiu, M. M. (2010). Effects on
teachers' self-efficacy and job satisfaction: Teach-
er gender, years of experience, and job stress.
Journal of Educational Psychology, 102(3),
741-756.
Klem, A. M. and Connell, J. P. (2004). Relationships
matter: Linking teacher support to student en-
gagement and achievement. Journal of School
Health, 74(7), 262-273.
Knight, B. A. (1999). Towards inclusion of students
with special educational needs in the regular
classroom. Support for Learning, 14(1), 3-7.
Liaw, S. S., Huang, H. M., and Chen, G. D. (2007).
Surveying instructor and learner attitudes toward
e-learning. Computers & Education, 49(4),
1066–1080.
Linn, R. L., Baker, E., and Dunbar, S. B. (1991). Com-
plex, performance-based assessment: expectations
and validation criteria. Educational Researcher,
20(8), 15-21.
Liu, H. T. (2011). Product design and selection using
fuzzy QFD and fuzzy MCDM approaches. Ap-
plied Mathematical Modelling, 35(1), 482-496.
Mann, D. and Domb, E. (1999). 40 inventive (Business)
principles with examples. The TRIZ Journal, Sep.
Mann, D. and Winkless, B. (2001). 40 inventive (food)
principles with examples. The TRIZ Journal, Jul.
Mann, D. (2000). Application of TRIZ tools in a
non-technical problem context. The TRIZ Journal,
Aug.
Mann, D. (2001). An introduction to TRIZ: The theory
of inventive problem solving. Creativity and In-
novation Management, 10(2), 123-125.
Mann, D. (2002). Systematic win-win problem solving
in a business environment. The TRIZ Journal, Apr.
Marsh, D. G., Waters, F. H., and Mann, D. L. (2002).
Using TRIZ to resolve educational delivery con-
flicts inherent to expelled students in Pennsylva-
nia. The TRIZ Journal, Nov.
Marsh, D. G., Waters, F. H., and Marsh, T. D. (2004).
40 inventive principles with applications in educa-
tion. The TRIZ Journal, Apr.
Marsh, H. W. and Bailey, M. (1993). Multidimensional
students' evaluations of teaching effectiveness: A
profile analysis. Journal of Higher Education,
64(1), 1-18.
Minchella, D. J. (2007). R.E.S.P.E.C.T. - A teaching
primer. Journal of College Science Teaching,
36(7), 12-13.
Moehrle, M. G. (2005). What is TRIZ? From conceptu-
al basics to a framework for research. Creativity
and Innovation Management, 14(1), 3–13.
Phillips, G. M., Santoro, G. M., and Kuehn, S. A.
(1988). The use of computer-mediated communi-
cation in training students in training students in
group problem-solving and decision-making tech-
niques, The American Journal of Distance Educa-
tion, 2, 38-51.
Rea, K. C. (2001). TRIZ and software- 40 principle
analogies, part 1. The TRIZ Journal, Sep.
Retseptor, G. (2002). 40 inventive principles in micro-
electronics. The TRIZ Journal, Aug.
Retseptor, G. (2003). 40 inventive principles in quality
management. The TRIZ Journal, Mar.
Retseptor, G. (2005). 40 inventive principles in mar-
keting, sales and advertising. The TRIZ Journal,
Apr.
Sadler, D. R. (2005). Interpretations of criteria-based
assessment and grading in higher education. As-
sessment & Evaluation in Higher Education,
30(2), 175-194.
Saliminamin, M. H. and Nezafati, N. (2003). A new
method for creating non-technological principles
of TRIZ. The TRIZ Journal, Oct.
Schlueter, M. (2001). QFD by TRIZ. The TRIZ Journal,
Jun.
Sokol, A., Oget, D., Sonntag, M., and Khomenko, N.
(2008). The development of inventive thinking
skills in the upper secondary language classroom.
Thinking Skills and Creativity, 3(1), 34-46.
W.J. Chang/ Int. J. Systematic Innovation, 2(2), 43-53 (2012)
53
Sözbilir, M. (2004). What makes physical chemistry
difficult? Perceptions of Turkish chemistry under-
graduates and lecturers. Journal of Chemical Ed-
ucation, 81(4).
Stephenson, K., McGuirk, A., Zeh, T., and Reeves,
D.W. (2005). Comparisons of the educational
value of distance delivered versus traditional
classroom instruction in introductory agricultural
economics. Review of agricultural economics,
27(4), 605-620.
Stratton, R. and Warburton, R. D. H. (2003). The stra-
tegic integration of agile and lean supply. Interna-
tional Journal of Production Economics, 85(2),
183-198.
Strolin-Goltzman, J. (2010). The relationship between
school-based health centers and the learning en-
vironment. Journal of School Health, 80(3),
153-159.
Su, C. T. and Lin, C. S. (2008). A case study on the
application of Fuzzy QFD in TRIZ for service
quality improvement. Quality & Quantity, 42(5),
563-578.
Su, C. T., Lin, C. S., and Chiang, T. L. (2008). System-
atic improvement in service quality through TRIZ
methodology: An exploratory study. Total Quality
Management & Business Excellence, 19(3),
223-243.
Tan, R. (2002). Voice of customers pushed by directed
evolution. The TRIZ Journal, Jun.
Teplitskiy, A. and Kourmaev, R. (2005). Application of
40 inventive principles in construction. The TRIZ
Journal, May.
Terninko, J. (1998). The QFD, TRIZ and Taguchi con-
nection: Customer-driven robust innovation. The
TRIZ Journal, Jan.
Terninko, J. (2001). 40 inventive principles with social
examples. The TRIZ Journal, Jun.
Tribus, M. (1993). Quality management in education.
Journal of Quality and Participation, 16(1).
Uzunboylu, H. (2005). The Tools of the web assisted
foreign language instruction. (ERIC Document
Reproduction Service No. ED490529).
Van de Grift, W. (2007). Quality of teaching in four
European countries: a review of the literature and
application of an assessment instrument. Educa-
tional Research, 49(2), 127-152.
Verduyn, D. (2002). Integrating innovation into design
for six sigma. The TRIZ Journal, Feb.
Walker, D. (2003). Fundamentals of curriculum: Pas-
sion and professionalism. Mahwah, NJ: Lawrence
Erlbaum Associates.
Waschull, S. B. (2001). The online delivery of psy-
chology courses: Attrition, performance, and
evaluation. Teaching of Psychology, 28(2),
143-147.
Wood, L. A. (1994). An unintended impact of one
grading practice. Urban Education, 29(2),
188–201.
Yanashina, H., Ito, T., and Kawada, H. (2002). Innova-
tive product development process by integrating
QFD and TRIZ. International Journal of Produc-
tion Research, 40(5), 1031-1050.
Zahorik, J. A. (1990). Stability and flexibility in teach-
ing. Teaching and Teacher Education, 6(1), 69-80.
Zhang, J., Chai, K. H., and Tan, K. C. (2003). 40 in-
ventive principles with applications in service op-
erations management. The TRIZ Journal, Dec.
Zhang, J., Chai, K. H., and Tan, K. C. (2005). Applying
TRIZ to service conceptual design: An explorato-
ry study. Creativity and Innovation Management,
14(1), 34-42.
AUTHOR BIOGRAPHIES
Dr. Wan-Jeng Chang had been in the
United States for over seven years. In
that period of time, she got her master’s
and doctor’s degree. She had earned
concentrations in both Business
Communication and TESOL as part of
her doctoral studies in education. She is
currently an assistant professor in the Department of
Applied English, Overseas Chinese University, Taiwan.
INSTRUCTIONS TO AUTHORS
Submission of Papers
The International Journal of Systematic Innovation is a refereed journal publishing original papers
four times a year in all areas of SI. Papers for publication should be submitted online to the IJoSI
website (http://www.ijosi.org) In order to preserve the anonymity of authorship, authors shall prepare
two files (in MS Word format or PDF) for each submission. The first file is the electronic copy of the
paper without author's (authors') name(s) and affiliation(s). The second file contains the author's
(authors') name(s), affiliation(s), and email address(es) on a single page. Since the Journal is blind
refereed, authors should not include any reference to themselves, their affiliations or their
sponsorships in the body of the paper or on figures and computer outputs. Credits and
acknowledgement can be given in the final accepted version of the paper.
Editorial Policy
Submission of a paper implies that it has neither been published previously nor submitted for
publication elsewhere. After the paper has been accepted, the corresponding author will be
responsible for page formatting, page proof and signing off for printing on behalf of other co-authors.
The corresponding author will receive one hardcopy issue in which the paper is published free of
charge.
Manuscript Preparation
The following points should be observed when preparing a manuscript besides being consistent in
style, spelling, and the use of abbreviations. Authors are encouraged to download manuscript
template from the IJoSI web site, http://www.ijosi.org.
1. Language. Paper should be written in English except in some special issues where Chinese
maybe acceptable. Each paper should contain an abstract not exceeding 200 words. In addition, three
to five keywords should be provided.
2. Manuscripts. Paper should be typed, single-column, double-spaced, on standard white paper
margins: top = 25mm, bottom = 30mm, side = 20mm. (The format of the final paper prints will have
the similar format except that double-column and single space will be used.)
3. Title and Author. The title should be concise, informative, and it should appear on top of the first
page of the paper in capital letters. Author information should not appear on the title page; it should
be provided on a separate information sheet that contains the title, the author’s (authors') name(s),
affiliation(s), e-mail address(es).
4. Tables and Figures. Once a paper is accepted, the corresponding author should promptly supply
original copies of all drawings and/or tables. They must be clear for printing. All should come with
proper numbering, titles, and descriptive captions. Figure (or table) numbering and its subsequent
caption must be below the figure (or table) itself and as typed as the text.
5. References. Display only those references cited in the text. References should be listed and
numbered alphabetically by the surname of the first author at the end of the paper. References cited
in the text should appear as the corresponding numbers in square bracket with or without the authors’
names in front. For example
Altshuller, G. (1998). 40 Principles: TRIZ Keys to Technical Innovation, Technical Innovation
Center.
Sheu, D. D. and Hou, C. T. (2011a). Self-closing Embedded Slit Valve, R.O.C. Patent pending.
Sheu, D. D. and Hou, C. T. (2011b). Self-closing Embedded Slit Valve, U.S.A. Patent pending.
Sheu, D. D. (2007). Body of Knowledge for Classical TRIZ, the TRIZ Journal, 1(4), 27-34.
Sheu, D. D. and Tsai, M. C. (2012). Cause Effect and Contradiction Chain Analysis for conflict
Identification and Problem Solving, the 2nd International Conference on Systematic Innovation.
CREAX Function Database. (2011). Available on line at: http://function.creax.com, Accessed 2011.

Society of Systematic Innovation (2012)
The International Journal of Systematic Innovation
Journal Order Form Organization
Or Individual Name
Postal address for delivery
Person to contact
Name: e-mail:
Position:
School/Company:
Order
Information
I would like to order ___ copy (ies) of the International J. of Systematic Innovation:
Period Start: 1st/2nd half , Year: (Starting 2010)
Period End : 1st/2nd half , Year:
Price:
Institutions: US $90 (yearly) / NT 2,800 (In Taiwan only)
Individuals: US $30 (yearly) / NT 950 (In Taiwan only)
(Surface mail postage included. Air mail postage extra)
E-mail to: [email protected] or fax: +886-3-572-3210
Air mail desired (If checked, we will quote the additional cost for your consent) Total amount due US$
Payment Methods:
1. Credit Card (Fill up the following information ande-mail/ facsimile this form to The Journal office indicated below)
2. Bank transfer
Account: The Society of Systematic Innovation
Bank Name: Mega International Commercial BANK
Account No: 203-09-03927-5
SWIFT Code: ICBCTWTP203
Bank code:017-2037
Bank Address: 69, Tung Chien Street Hsinchu City, Taiwan (R.O.C.)
VISA / Master/ JCB/ AMERICAN Cardholder Authorization for Journal Order
Card Holder Information
Card Holder Name (as it appears on card)
Full Name (Last,
First Middle)
Expiration Date / (month / year) Card Type □ VISA □ MASTER □ J C B
Card Number □ □ □ □ -□ □ □ □ -□ □ □ □ -□ □ □ □ Security Code □ □ □
Amount Authorized Special
Messages
Full Address
(Incl. Street, City,
State, Country
and Postal code)
Please Sign your name here (same as the signature on your card)
The Society of Systematic Innovation
6 F, # 352, Sec. 2, Guanfu Rd,
Hsinchu, Taiwan, 30071, R.O.C.