The Influences of Visceral Fat Area on the Sites of...
9
Research Article The Influences of Visceral Fat Area on the Sites of Esophageal Mucosal Breaks in Subjects with Gastroesophageal Reflux Diseases Ji Hyung Nam , 1,2 Eirie Cho, 1 Jeung Sook Kim, 3 Eun-Cheol Park , 4 and Jae Hak Kim 1 1 Department of Internal Medicine, Dongguk University College of Medicine, Ilsan Hospital, Goyang, Republic of Korea 2 Department of Medicine, Graduate School, Yonsei University, Seoul, Republic of Korea 3 Department of Radiology, Dongguk University College of Medicine, Ilsan Hospital, Goyang, Republic of Korea 4 Department of Preventive Medicine and Institute of Health Services Research, Yonsei University College of Medicine, Seoul, Republic of Korea Correspondence should be addressed to Jae Hak Kim; [email protected] Received 2 October 2018; Revised 13 December 2018; Accepted 17 January 2019; Published 17 February 2019 Academic Editor: Tatsuya Toyokawa Copyright © 2019 Ji Hyung Nam et al. This is an open access article distributed under the Creative Commons Attribution License, which permits unrestricted use, distribution, and reproduction in any medium, provided the original work is properly cited. Background. Central obesity is suggested as a risk factor for gastroesophageal reflux diseases. The aim of this study was to evaluate the influences of a visceral fat area on the site of mucosal breaks in the esophagogastric junction (EGJ). Methods. Subjects who underwent abdomen-computerized tomography and esophagogastroduodenoscopy for screening on the same day were evaluated between 2007 and 2016. We enrolled 178 subjects who had erosive esophagitis (LA classifications A-D). Abdominal obesity was evaluated by measuring visceral adipose tissue (VAT), subcutaneous adipose tissue (SAT), VAT-to-SAT ratio, total adipose tissue (TAT), body mass index (BMI), and waist circumference (WC). Results. The lesser curvature (LC) of EGJ was the most frequent site of mucosal breaks (104 cases, 58.4%). BMI, WC, VAT, the VAT-to-SAT ratio, and TAT were higher in the LC group. In multivariate analysis, higher VAT (odds ratio (OR) 2.90, 95% confidence interval (CI) 1.18 to 7.13, 3rd vs. 1st quartile, P =0 021; OR 3.63, 95% CI 1.44 to 9.10, 4th vs. 1st quartile, P =0 006) and the VAT/SAT ratio (OR 2.91, 95% CI 1.11 to 7.61, 3rd vs. 1st quartile, P =0 03; OR 3.02, 95% CI 1.17 to 7.83, 4th vs. 1st quartile, P =0 023) were significantly associated with mucosal breaks in the LC group. However, BMI, WC, and TAT were not significant in the multivariate analysis. Conclusion. The VAT and the VAT/SAT ratio were significantly associated with the mucosal breaks in the LC of EGJ. Visceral obesity could influence the location of the mucosal breaks on EGJ. 1. Introduction The symptom-based gastroesophageal reflux disease (GERD) and endoscopic reflux esophagitis have increased in Asian countries [1]. GERD is related to several clinical conditions such as smoking, hiatal hernia, and obesity [2, 3]. Metabolic syndrome also increases the risk of GERD [4, 5]. It has shown an upward trend in obesity and metabolic syndrome, which reflects the recent socioeconomic development and Western- ized lifestyle [6, 7], and the prevalence of GERD has increased rapidly in Korea [8]. In brief, both GERD and obesity have emerged as important health challenges not only in the West but also in the whole world. Meanwhile, general obesity is measured by body mass index (BMI). Abdominal obesity is measured by waist circumference (WC), and currently, vis- ceral obesity is measured by MRI or CT scan. Abdominal vis- ceral obesity is a more important index of GERD rather than BMI or WC [9–11]. In Korea, voluntary health check-up programs are prev- alent, and several packages include upper endoscopy, colo- noscopy, abdominal ultrasound, and abdominal CT scan [4, 9, 12]. Under these cultural circumstances, abdominal visceral adipose tissue (VAT) can be measured by a CT scan as well as BMI and WC. Recent studies suggest that VAT is Hindawi Gastroenterology Research and Practice Volume 2019, Article ID 9672861, 8 pages https://doi.org/10.1155/2019/9672861
Transcript of The Influences of Visceral Fat Area on the Sites of...
Research ArticleThe Influences of Visceral Fat Area on the Sites ofEsophageal Mucosal Breaks in Subjects with GastroesophagealReflux Diseases
Ji Hyung Nam ,1,2 Eirie Cho,1 Jeung Sook Kim,3 Eun-Cheol Park ,4 and Jae Hak Kim 1
1Department of Internal Medicine, Dongguk University College of Medicine, Ilsan Hospital, Goyang, Republic of Korea2Department of Medicine, Graduate School, Yonsei University, Seoul, Republic of Korea3Department of Radiology, Dongguk University College of Medicine, Ilsan Hospital, Goyang, Republic of Korea4Department of Preventive Medicine and Institute of Health Services Research, Yonsei University College of Medicine,Seoul, Republic of Korea
Correspondence should be addressed to Jae Hak Kim; [email protected]
Received 2 October 2018; Revised 13 December 2018; Accepted 17 January 2019; Published 17 February 2019
Academic Editor: Tatsuya Toyokawa
Copyright © 2019 Ji Hyung Nam et al. This is an open access article distributed under the Creative Commons Attribution License,which permits unrestricted use, distribution, and reproduction in any medium, provided the original work is properly cited.
Background. Central obesity is suggested as a risk factor for gastroesophageal reflux diseases. The aim of this study was to evaluatethe influences of a visceral fat area on the site of mucosal breaks in the esophagogastric junction (EGJ). Methods. Subjects whounderwent abdomen-computerized tomography and esophagogastroduodenoscopy for screening on the same day wereevaluated between 2007 and 2016. We enrolled 178 subjects who had erosive esophagitis (LA classifications A-D). Abdominalobesity was evaluated by measuring visceral adipose tissue (VAT), subcutaneous adipose tissue (SAT), VAT-to-SAT ratio, totaladipose tissue (TAT), body mass index (BMI), and waist circumference (WC). Results. The lesser curvature (LC) of EGJ was themost frequent site of mucosal breaks (104 cases, 58.4%). BMI, WC, VAT, the VAT-to-SAT ratio, and TAT were higher in theLC group. In multivariate analysis, higher VAT (odds ratio (OR) 2.90, 95% confidence interval (CI) 1.18 to 7.13, 3rd vs. 1stquartile, P = 0 021; OR 3.63, 95% CI 1.44 to 9.10, 4th vs. 1st quartile, P = 0 006) and the VAT/SAT ratio (OR 2.91, 95% CI 1.11to 7.61, 3rd vs. 1st quartile, P = 0 03; OR 3.02, 95% CI 1.17 to 7.83, 4th vs. 1st quartile, P = 0 023) were significantly associatedwith mucosal breaks in the LC group. However, BMI, WC, and TAT were not significant in the multivariate analysis.Conclusion. The VAT and the VAT/SAT ratio were significantly associated with the mucosal breaks in the LC of EGJ. Visceralobesity could influence the location of the mucosal breaks on EGJ.
1. Introduction
The symptom-based gastroesophageal reflux disease (GERD)and endoscopic reflux esophagitis have increased in Asiancountries [1]. GERD is related to several clinical conditionssuch as smoking, hiatal hernia, and obesity [2, 3]. Metabolicsyndrome also increases the risk of GERD [4, 5]. It has shownan upward trend in obesity and metabolic syndrome, whichreflects the recent socioeconomic development andWestern-ized lifestyle [6, 7], and the prevalence of GERD has increasedrapidly in Korea [8]. In brief, both GERD and obesity haveemerged as important health challenges not only in the West
but also in the whole world. Meanwhile, general obesity ismeasured by body mass index (BMI). Abdominal obesity ismeasured by waist circumference (WC), and currently, vis-ceral obesity is measured by MRI or CT scan. Abdominal vis-ceral obesity is a more important index of GERD rather thanBMI or WC [9–11].
In Korea, voluntary health check-up programs are prev-alent, and several packages include upper endoscopy, colo-noscopy, abdominal ultrasound, and abdominal CT scan[4, 9, 12]. Under these cultural circumstances, abdominalvisceral adipose tissue (VAT) can be measured by a CT scanas well as BMI and WC. Recent studies suggest that VAT is
HindawiGastroenterology Research and PracticeVolume 2019, Article ID 9672861, 8 pageshttps://doi.org/10.1155/2019/9672861

a risk factor for GERD and the area of VAT is correlatedwith the severity of GERD according to the LA classificationof GERD [11, 12].
However, the association between VAT and the sites ofesophageal mucosal breaks in subjects with GERD has notbeen investigated. Esophageal mucosal breaks occur mainlyat a site with direct exposure to gastric juice. Thus, the loca-tion of mucosal break is likely affected by posture as well asbody size or visceral obesity. The aim of this study was toevaluate the influence of a visceral fat area on the site ofmucosal breaks in the esophagogastric junction (EGJ).
2. Methods and Materials
2.1. Study Design and Population. The cross-sectional studywas conducted in consecutive participants in the voluntaryhealth screening program of Dongguk University Ilsan Hos-pital in Goyang, Korea, between January 2007 and October2016. This program comprises overall screening examina-tions including routine laboratory tests, upper endoscopy,and abdominal sonogram and/or CT, which basicallyrequires overnight fasting. A total of 59,962 subjects under-went screening upper endoscopy during the study period,and 2,782 subjects underwent simultaneous abdomen/pelvicCT during the same day. Among them, 447 patients, diag-nosed with reflux esophagitis via upper endoscopy, were eli-gible for inclusion in the study. Information relating topatients’ social history and comorbidity was obtained viaestablished questionnaires based on the screening program.A detailed questionnaire about gastrointestinal symptomswas routinely administered before upper endoscopy. Basedon the exclusion criteria such as a history of gastric surgery,lack of Helicobacter pylori (H. pylori) test results, or insuffi-cient questionnaires or laboratory test results, 38 patientswere excluded from the study. We additionally excluded231 cases with minimal changes such as mild blurring orerythema on the EGJ, and finally, 178 subjects wereincluded (Figure 1). This study was approved by the institu-tional review board of Dongguk University Ilsan Hospital(2016-136).
2.2. Endoscopy. Upper endoscopy was performed using aflexible endoscope (GIF-H260, Olympus Optical Co. Ltd.,Tokyo, Japan). Erosive esophagitis was defined by endoscop-ically confirmed mucosal break on the EGJ. The grading oferosive esophagitis was graded according to the Los Angeles(LA) classification system [13]. The sites of mucosal breakswere described as the posterior wall (PW), lesser curvature(LC), anterior wall (AW), and fundus (FU) sides. In the leftlateral decubitus position, the ventral side of the esophaguswas always positioned at 12 o’clock of an endoscopy image,which indicates the AW side. Thus, 3 o’clock position(between 2 and 4 o’clock) indicates the LC side, which leadsto the LC side of the stomach. The presence of hiatal herniain the EGJ was determined by a direct view and via J-turn.The hiatal hernia (grades 0-IV) was graded according toHill’s classification [14, 15]. Grade 0 suggested the absenceof hiatal hernia whereas grade II or higher, which is consis-tent with a hiatal width of at least 2 cm, was considered
clinically a significant hiatal hernia. The H. pylori test usinga rapid urease test or histological examination was performedduring the endoscopic procedure.
2.3. Measurement of Anthropometric Index and AbdominalObesity. All participants underwent physical measurementsincluding height (cm), weight (kg), and body fat ratio(BFR) (%) using InBody 720 systems (BioSpace, Seoul,Korea). BMI was calculated as weight divided by height inmeter squared (kg/m2). Abdominal obesity was evaluatedby measuring WC, VAT, subcutaneous adipose tissue(SAT), total adipose tissue (TAT), and VAT/SAT ratio basedon the method reported previously by our institute [16]; WC(cm) was measured at the midpoint between the lower bor-ders of the rib cage and upper pole of the iliac crest. We usedsemiautomated image segmentation software implementedin the analysis system 10.0 (Mayo Clinic Foundation, Bio-medical Imaging Resource, Rochester, Minnesota, USA).The software threshold was set between -250 and -50Hounsfield units, which was the specific range for adiposetissue on CT images. VAT was defined as the intra-abdominal fat confined within the rectal sheath. TheSPLINE tool was used to demarcate the VAT by drawinga line around the spine and intra-abdominal muscles(rectus abdominis, transverse abdominis, quadratus lum-boru, and psoas).
2.4. Statistical Analyses. Descriptive statistics for age, anthro-pometric index, and adipose tissue areas were described ascontinuous variables (mean ± standard deviation). Otherbaseline characteristics and endoscopic findings were ana-lyzed as categorical variables. We compared the differencesin baseline and clinical findings based on the presence ofmucosal breaks in the four directions (PW, LC, AW, andFU) of erosive esophagitis. Independent sample t-tests wereused to analyze the association between continuous variablesand each direction of erosive esophagitis, and chi-square testsfor categorical variables. Next, multivariate logistic regres-sion analyses were performed to determine the correlationbetween anthropometric or abdominal obesity indices withthe direction of erosive esophagitis. Each regression modelincluded age, sex, comorbidity, social histories, gastrointesti-nal symptoms, the presence of hiatal hernia, and H. pyloripositivity. In addition, we evaluated the risk of esophagitiswith LC side mucosal break depending on the quartiles ofVAT using logistic regression with adjusted odds ratio(OR) with 95% confidence intervals (CI). All two-sided Pvalues < 0 05 were considered significant. Statistical analyseswere performed using IBM SPSS Statistics 19.0 (IBM,Armonk, NY, USA).
3. Results
3.1. Patient Characteristics and Univariate Analyses. Baselinedemographics and clinical and endoscopic findings of the178 patients with erosive esophagitis are described inTable 1. The mean age was 53 5 ± 10 6 yrs (range:26-88 yrs), and 87.1% were males. The mean levels of theabdominal fat area were 63 2 ± 27 7 cm2 for VAT and 80 9
2 Gastroenterology Research and Practice

± 37 8 cm2 for SAT. The proportion of patients with two ormore gastrointestinal symptoms was 15.2%, and most ofthe patients belonged to LA classification A or B (98.9%).The LC side was the most common location of esophagealmucosal breaks (58.4%), followed by the PW side (39.3%).The proportion of erosive esophagitis on the AW or FU sidewas 20.2% (36/178), which was usually accompanied bymucosal breaks on the other sides, and 39.3% of the subjectshad grade II or higher grade of hiatal hernia.
In univariate analysis, subjects with erosive esophagitison the PW side had significantly lower height, weight, andWC than those without mucosal breaks in this direction(Table 2). On the other hand, subjects with LC side breakshowed significantly higher VAT and TAT as well as higherweight, BMI, and WC than those without LC side break. Interms of gender, a higher proportion of male patients showedthe break on the LC side (P = 0 014). The presence of hiatalhernia was only significantly associated with the break onthe AW side (P = 0 038) and showed a marginal significancein relation to the LC side (P = 0 057). Other variables such asage, drinking and smoking habits, coffee intake, H. pylori,gastrointestinal symptoms, and laboratory findings werenot correlated with any location of mucosal breaks.
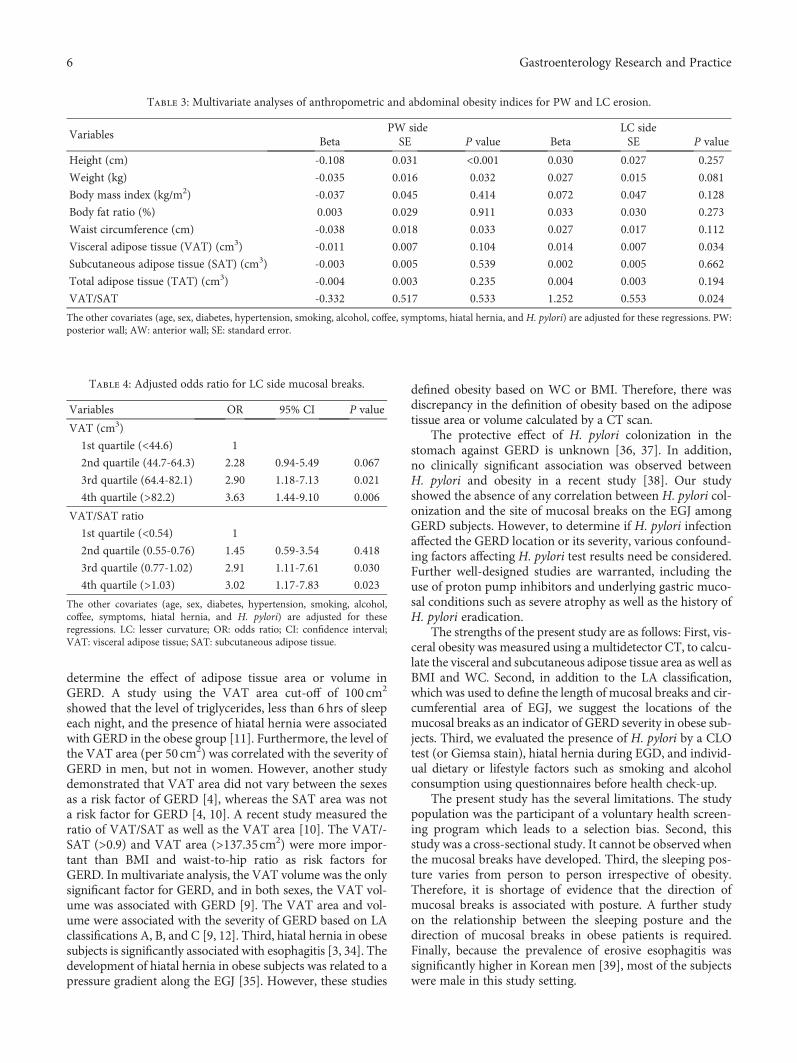
3.2. Abdominal Obesity and the Location of Mucosal Breakson the EGJ. Anthropometric indices including height, weight,and WC were inversely associated with erosive esophagitison the PW side (beta coefficient = −0 108, -0.035, and-0.038, respectively) even after adjusting for other baselineand clinical covariates (Table 3). None of the indices cor-relating with abdominal fat area showed any significantassociation with PW side mucosal breaks. VAT was stillsignificantly increased in patients with erosive esophagitison the LC side (beta = 0 014, P = 0 034) after adjustingfor other covariates (Table 3). The VAT/SAT ratio alsovaried in patients with LC side mucosal break and others
(beta = 1 252, P = 0 024). Anthropometric indices, SAT,and TAT showed no significant correlation with LC sidemucosal break in multivariate analyses. Male sex did notaffect the presence of LC side mucosal break. When theVAT was analyzed as quartiles, the risk of erosive esopha-gitis on the LC side increased significantly in the VAT ofthe third and fourth quartiles when compared with thatof the first quartile (adjusted odds ratio (OR) 2.90, 95%confidence interval (CI) 1.18 to 7.13, 3rd quartile vs. 1stquartile, P = 0 021; OR 3.63, 95% CI 1.44 to 9.10, 4th quar-tile vs. 1st quartile, P = 0 006). Hiatal hernia did not affectthe presence of LC side mucosal breaks (adjusted OR =1 4, P = 0 345). Regarding the quartile values of the VAT/-SAT, the adjusted OR for the risk of LC side mucosalbreaks was 2.91 (95% CI 1.11 to 7.61, 3rd quartile vs. 1stquartile, P = 0 030) and 3.02 (95% CI 1.17 to 7.83, 4thquartile vs. 1st quartile, P = 0 023) (Table 4).
4. Discussion
The present study demonstrated that conventional indices ofobesity such as BMI and WC, and visceral obesity were cor-related with the presence of erosions on the LC side of EGJ.Higher values of VAT significantly increased the risk of LCerosion. To the best of our knowledge, the associationbetween the sites of mucosal breaks in GERD and visceralobesity has never been studied.
The variation in the site of mucosal breaks according tothe VAT area or VAT/SAT ratio may be associated withthe body position such as lateral decubitus. Positionalchanges were probably associated with a considerable redis-tribution of chime and acid [17, 18]. Body position influ-enced fasting and postprandial acid reflux. Heartburn isreported frequently in the supine position, and nocturnalreflux is common in complicated GERD [19]. The effect ofthe lateral position on GERD has been reported but not the
59,962 consecutive persons who performed upper endoscopyfrom health screening program of Dongguk UniversityIlsan Hospital between January 2007 and October 2016
2,782 participants who simultaneously underwentabdomen/pelvic computerized tomography during the same day
447 patients with reflux esophagitis on upper endoscopy
(i)
(ii)
178 eligible patients with erosive esophagitisconfirmed endoscopically (LA class A to D)
38 exclude a history of gastric surgery,no H. pylori test, and insufficient
questionnaires or laboratory results
231 exclude patients with minimal change
Figure 1: The selection of study population.
3Gastroenterology Research and Practice

site of mucosal breaks per se [20–23]. After infusion of themeal, the LES pressure declined and transient relaxation ofthe lower esophageal sphincter (TRLES) frequencyincreased. Acid reflux episodes occurred more than twiceas often in the right lateral position [20]. A previous studyassessed the effect of posture and meal on reflux composi-tion by impedance monitoring [23]. It showed that the refluxwas nearly always liquid-only on the right side whereasreflux associated with the left side and upright position wasgas-only or liquid and gas. In the right lateral position, theLC side of the stomach is the most gravity-dependent side[24]. The normal “left-curved” turn of the esophagus intothe stomach may be straightened by the effects of gravitywhile lying in the right lateral decubitus position, and theEGJ may be in a dependent position relative to the gastricpool in that position. The right lateral decubitus positionwas associated with a greater duration of exposure to pH < 4and longer esophageal acid clearance compared with the left,supine, and prone. However, the body position did not affectacidity at the gastric cardia and corpus in 10 healthy subjects[21]. TRLES was equally common in both lateral positionsin healthy controls [20, 22]. However, another study showedthat TRLES occurred more frequently in the right decubitusposition in healthy volunteers [21]. These findings are basedon different definitions and methods used for the detectionof TRLES. The most recent study using manometry, multi-channel intraluminal impedance, and scintigraphy demon-strated that TRLES, GER, distension of proximal stomach,and gastric emptying were increased in the right lateral posi-tion compared with the left lateral position in subjects withGERD [22].
Interestingly, our study showed that the visible body sizemeasured by height, weight, and WC was rather small inpatients with mucosal breaks associated with the PW sidecompared with others. Therefore, a slightly raised upperbody during the supine position may provide symptom reliefespecially in GERD patients with a normal body size. Bycontrast, obese patients who generally carry mucosal breakson the LC are recommended with the left lateral position.Similarly, because the location of mucosal breaks variesdepending on the body size and visceral obesity, behavioralinstructions related to sleeping posture vary according tothe degree of obesity and the site of mucosal breaks.
Some positive correlations were observed between obe-sity and GERD. First, though the LES pressure in obese sub-jects was not significantly different compared with those innormal subjects [25], others suggested that the larger BMIhas been correlated with the lower LES pressure [26, 27],which is still disputed. However, TRLES is more frequentlyobserved in obese subjects [28]. TRLES is stimulated by gas-tric distension, and the total exposure of distal esophagus toacid and the proportion of TRLES accompanied by acidreflux were more frequent in obese subjects [29]. TRLES dur-ing the 2-hour postprandial period also showed a signifi-cantly greater frequency [30]. Second, abdominal obesityincreases the intra-abdominal pressure via transmission ofthe force of adipose tissue to the abdominal cavity, whichhas been studied using intra-gastric manometry [31–33].CT scan has been used for adipose tissue measurement to
Table 1: Characteristics of the study subjects (n = 178).
(a)
Continuous variables Mean SD Range
Age (years) 53.5 10.6 26-88
Height (cm) 170.2 7.6 142-188
Weight (kg) 73.0 14.2 41.1-143.3
Body mass index (BMI) (kg/m2) 25.1 4.2 15.1-46.4
Body fat ratio (BFR) (%) 24.8 6.3 11.5-51.1
Waist circumference (WC) (cm) 87.5 11.3 50-134
Visceral adipose tissue (VAT) (cm3) 63.2 27.7 6.5-132.8
Subcutaneous adipose tissue (SAT) (cm3) 80.9 37.8 14.2-310.5
Total adipose tissue (TAT) (cm3) 144.1 56.7 21.8-443.3
VAT/SAT 0.82 0.37 0.18-2.03
HbA1c (mg/dl) 5.8 1.0 4.7-13.2
Total cholesterol (mg/dl) 206.0 44.2 96-496
Triglyceride (mg/dl) 151.1 106.2 24-664
HDL cholesterol (mg/dl) 52.2 15.0 23-127
(b)
Categorical variables n %
Male sex 155 87.1
Current smoker 55 30.9
Alcohol 85 47.8
Coffee 53 29.8
Diabetes 13 7.3
Hypertension 28 15.7
H. pylori-positive 52 29.2
2 symptoms or more 27 15.2
Foreign body sense 13 7.3
Nausea/vomiting 11 6.2
Heartburn 24 13.5
Abdominal discomfort 12 6.7
Epigastric soreness 25 14.0
Dyspepsia 20 11.2
Los Angeles (LA) classification
A 135 75.8
B 41 23.0
C 2 1.1
D 0 0
Direction of erosion
Posterior wall side 70 39.3
Lesser curvature side 104 58.4
Anterior wall side 26 14.6
Fundus side 16 9.0
Hiatal hernia grade
0 86 48.3
I 22 12.4
II 45 25.3
III 24 13.5
IV 1 0.6
HDL: high-density lipoprotein; SD: standard deviation.
4 Gastroenterology Research and Practice

Table2:Univariateanalyses
basedon
thedirections
oferosiveesop
hagitis.
Variables
Posterior
wall
Lesser
curvature
Anteriorwall
Fund
usYes
(n=70)
No(n
=108)
Yes
(n=104)
No(n
=74)
Yes
(n=26)
No(n
=152)
Yes
(n=16)
No(n
=162)
Mean
SDMean
SDMean
SDMean
SDMean
SDMean
SDMean
SDMean
SD
Age
(years)
53.8
10.0
53.3
11.1
53.9
11.6
53.0
9.2
52.5
8.2
53.7
11.0
51.2
7.2
53.8
10.9
Height(cm)
168.0
7.3
171.6
7.5‡
171.0
7.3
168.9
7.9∗
171.0
7.3
170.0
7.7
169.3
5.1
170.2
7.8
Weight(kg)
70.1
12.2
74.9
15.1†
75.5
15.4
69.5
11.5‡
73.8
11.5
72.9
14.6
74.3
16.6
72.9
14.0
BMI(kg/m
2 )24.7
3.8
25.4
4.4
25.8
4.7
24.2
3.1†
25.2
3.3
25.1
4.3
25.8
5.8
25.0
4.0
Bod
yfatratio(%
)24.7
6.0
24.9
6.5
25.3
6.9
24.2
5.4
24.4
4.6
24.9
6.6
26.1
9.0
24.7
6.0
WC(cm)
85.3
11.2
89.0
11.2†
89.4
12.3
84.9
9.0‡
88.2
7.3
87.4
11.8
86.9
14.2
87.6
11.0
VAT(cm
3 )58.6
27.0
66.2
27.9∗
69.1
26.5
55.0
27.4‡
60.6
23.8
63.6
28.3
59.5
26.1
63.6
27.9
SAT(cm
3 )78.0
35.0
82.8
39.5
82.9
43.4
78.1
28.1
84.6
24.3
80.3
39.7
90.4
58.4
80.0
35.2
TAT(cm
3 )136.6
51.6
149.0
59.5
151.9
61.3
133.1
47.7†
145.3
41.0
143.9
59.0
149.9
71.8
143.5
55.2
VAT/SAT
0.79
0.39
0.84
0.35
0.9
0.37
0.72
0.34‡
0.74
0.34
0.84
0.37
0.78
0.48
0.83
0.35
N%
N%
N%
N%
N%
N%
N%
N%
Malesex
6187.1
9487.0
9692.3
5979.7†
2180.8
134
88.2
1487.5
141
87.0
Current
smoker
1724.3
3835.2
3331.7
2229.7
1142.3
4428.9
637.5
4930.2
Alcoh
ol34
48.6
5147.2
5048.1
3547.3
1350.0
7247.4
637.5
7948.8
Coff
ee22
31.4
3128.7
2927.9
2432.4
830.8
4529.6
743.8
4628.4
Diabetes
68.6
76.5
98.7
45.4
13.8
127.9
16.3
127.4
Hypertension
811.4
2018.5
2120.2
79.5∗
311.5
2516.4
16.3
2716.7
H.pylori-po
sitive
1825.7
3431.5
3230.8
2027.0
830.8
4428.9
425.0
4829.6
2symptom
sor
more
1115.7
1614.8
1514.4
1216.2
726.9
2013.2∗
318.8
2414.8
Hiatalh
ernia
2332.9
4743.5
4745.2
2331.1∗
1557.7
5536.2†
850.0
6238.3
HbA
1c≥65
1318.6
1413.0
1615.4
1114.9
311.5
2415.8
16.3
2616.0
TC≥200(m
g/dl)
3854.3
5550.9
5653.8
3750.0
1350.0
8052.6
637.5
8753.7
TG≥150(m
g/dl)
2028.6
3936.1
3836.5
2128.4
830.8
5133.6
425.0
5534.0
HDL<40
(M),<5
0(F)(m
g/dl)
1115.7
2422.2
1817.3
1723.0
830.8
2717.8
212.5
3320.4
BMI:body
massindex;HDL:high-densitylip
oprotein
cholesterol;SA
T:sub
cutaneou
sadiposetissue;SD:stand
arddeviation;TAT:totaladiposetissue;T
C:totalcholesterol;TG:triglyceride;VAT:visceraladipo
setissue
WC:w
aistcircum
ference.Pvalue:
∗<0
.1,†<0
.05,
‡ <0.01.
5Gastroenterology Research and Practice
determine the effect of adipose tissue area or volume inGERD. A study using the VAT area cut-off of 100 cm2
showed that the level of triglycerides, less than 6hrs of sleepeach night, and the presence of hiatal hernia were associatedwith GERD in the obese group [11]. Furthermore, the level ofthe VAT area (per 50 cm2) was correlated with the severity ofGERD in men, but not in women. However, another studydemonstrated that VAT area did not vary between the sexesas a risk factor of GERD [4], whereas the SAT area was nota risk factor for GERD [4, 10]. A recent study measured theratio of VAT/SAT as well as the VAT area [10]. The VAT/-SAT (>0.9) and VAT area (>137.35 cm2) were more impor-tant than BMI and waist-to-hip ratio as risk factors forGERD. In multivariate analysis, the VAT volume was the onlysignificant factor for GERD, and in both sexes, the VAT vol-ume was associated with GERD [9]. The VAT area and vol-ume were associated with the severity of GERD based on LAclassifications A, B, and C [9, 12]. Third, hiatal hernia in obesesubjects is significantly associated with esophagitis [3, 34]. Thedevelopment of hiatal hernia in obese subjects was related to apressure gradient along the EGJ [35]. However, these studies
defined obesity based on WC or BMI. Therefore, there wasdiscrepancy in the definition of obesity based on the adiposetissue area or volume calculated by a CT scan.
The protective effect of H. pylori colonization in thestomach against GERD is unknown [36, 37]. In addition,no clinically significant association was observed betweenH. pylori and obesity in a recent study [38]. Our studyshowed the absence of any correlation between H. pylori col-onization and the site of mucosal breaks on the EGJ amongGERD subjects. However, to determine if H. pylori infectionaffected the GERD location or its severity, various confound-ing factors affecting H. pylori test results need be considered.Further well-designed studies are warranted, including theuse of proton pump inhibitors and underlying gastric muco-sal conditions such as severe atrophy as well as the history ofH. pylori eradication.
The strengths of the present study are as follows: First, vis-ceral obesity was measured using a multidetector CT, to calcu-late the visceral and subcutaneous adipose tissue area as well asBMI and WC. Second, in addition to the LA classification,which was used to define the length of mucosal breaks and cir-cumferential area of EGJ, we suggest the locations of themucosal breaks as an indicator of GERD severity in obese sub-jects. Third, we evaluated the presence of H. pylori by a CLOtest (or Giemsa stain), hiatal hernia during EGD, and individ-ual dietary or lifestyle factors such as smoking and alcoholconsumption using questionnaires before health check-up.
The present study has the several limitations. The studypopulation was the participant of a voluntary health screen-ing program which leads to a selection bias. Second, thisstudy was a cross-sectional study. It cannot be observed whenthe mucosal breaks have developed. Third, the sleeping pos-ture varies from person to person irrespective of obesity.Therefore, it is shortage of evidence that the direction ofmucosal breaks is associated with posture. A further studyon the relationship between the sleeping posture and thedirection of mucosal breaks in obese patients is required.Finally, because the prevalence of erosive esophagitis wassignificantly higher in Korean men [39], most of the subjectswere male in this study setting.
Table 3: Multivariate analyses of anthropometric and abdominal obesity indices for PW and LC erosion.
VariablesPW side LC side
Beta SE P value Beta SE P value
Height (cm) -0.108 0.031 <0.001 0.030 0.027 0.257
Weight (kg) -0.035 0.016 0.032 0.027 0.015 0.081
Body mass index (kg/m2) -0.037 0.045 0.414 0.072 0.047 0.128
Body fat ratio (%) 0.003 0.029 0.911 0.033 0.030 0.273
Waist circumference (cm) -0.038 0.018 0.033 0.027 0.017 0.112
Visceral adipose tissue (VAT) (cm3) -0.011 0.007 0.104 0.014 0.007 0.034
Subcutaneous adipose tissue (SAT) (cm3) -0.003 0.005 0.539 0.002 0.005 0.662
Total adipose tissue (TAT) (cm3) -0.004 0.003 0.235 0.004 0.003 0.194
VAT/SAT -0.332 0.517 0.533 1.252 0.553 0.024
The other covariates (age, sex, diabetes, hypertension, smoking, alcohol, coffee, symptoms, hiatal hernia, and H. pylori) are adjusted for these regressions. PW:posterior wall; AW: anterior wall; SE: standard error.
Table 4: Adjusted odds ratio for LC side mucosal breaks.
Variables OR 95% CI P value
VAT (cm3)
1st quartile (<44.6) 1
2nd quartile (44.7-64.3) 2.28 0.94-5.49 0.067
3rd quartile (64.4-82.1) 2.90 1.18-7.13 0.021
4th quartile (>82.2) 3.63 1.44-9.10 0.006
VAT/SAT ratio
1st quartile (<0.54) 1
2nd quartile (0.55-0.76) 1.45 0.59-3.54 0.418
3rd quartile (0.77-1.02) 2.91 1.11-7.61 0.030
4th quartile (>1.03) 3.02 1.17-7.83 0.023
The other covariates (age, sex, diabetes, hypertension, smoking, alcohol,coffee, symptoms, hiatal hernia, and H. pylori) are adjusted for theseregressions. LC: lesser curvature; OR: odds ratio; CI: confidence interval;VAT: visceral adipose tissue; SAT: subcutaneous adipose tissue.
6 Gastroenterology Research and Practice
In conclusion, the VAT and the VAT/SAT ratio weresignificantly correlated with the mucosal breaks in the LCof EGJ. Visceral obesity could influence the location of themucosal breaks on EGJ.
Data Availability
The data used to support the findings of this study areavailable from the corresponding author upon request.
Disclosure
This study was presented as an abstract at the Neuro Gastro2017. The funders had no role in the study design, datacollection, data analysis, decision to publish, or preparationof the manuscript.
Conflicts of Interest
The authors declare no conflicts of interest.
Authors’ Contributions
Kim JH is responsible for the conceptualization. Cho E col-lected the data. Park E-C is responsible for the methodology.Kim JH and Nam JH are responsible for the analysis andinvestigation. Kim JH and Nam JH prepared the originaldraft of the manuscript. Kim JS reviewed and edited the man-uscript. All authors approved the final manuscript.
Acknowledgments
This study was funded by Dongguk University research fund2017.
References
[1] H. K. Jung, “Epidemiology of gastroesophageal reflux diseasein Asia: a systematic review,” Journal of Neurogastroenterologyand Motility, vol. 17, no. 1, pp. 14–27, 2011.
[2] H. B. El-Serag, D. Y. Graham, J. A. Satia, and L. Rabeneck,“Obesity is an independent risk factor for GERD symptomsand erosive esophagitis,” The American Journal of Gastroenter-ology, vol. 100, no. 6, pp. 1243–1250, 2005.
[3] L. J. Wilson, W. Ma, and B. I. Hirschowitz, “Association ofobesity with hiatal hernia and esophagitis,” The AmericanJournal of Gastroenterology, vol. 94, no. 10, pp. 2840–2844,1999.
[4] S. J. Chung, D. Kim, M. J. Park et al., “Metabolic syndrome andvisceral obesity as risk factors for reflux oesophagitis: across-sectional case–control study of 7078 Koreans undergo-ing health check-ups,” Gut, vol. 57, no. 10, pp. 1360–1365,2008.
[5] H. J. Song, K. N. Shim, S. J. Yoon et al., “The prevalence andclinical characteristics of reflux esophagitis in koreans and itspossible relation to metabolic syndrome,” Journal of KoreanMedical Science, vol. 24, no. 2, pp. 197–202, 2009.
[6] H. T. Kang, J. Y. Shim, H. R. Lee, B. J. Park, J. A. Linton, andY. J. Lee, “Trends in prevalence of overweight and obesity inKorean adults, 1998–2009: the Korean National Health and
Nutrition Examination Survey,” Journal of Epidemiology,vol. 24, no. 2, pp. 109–116, 2014.
[7] S. Lim, H. Shin, J. H. Song et al., “Increasing prevalence of met-abolic syndrome in Korea: the Korean National Health andNutrition Examination Survey for 1998-2007,” Diabetes Care,vol. 34, no. 6, pp. 1323–1328, 2011.
[8] K. M. Kim, Y. K. Cho, S. J. Bae et al., “Prevalence of gastro-esophageal reflux disease in Korea and associated health-careutilization: a national population-based study,” Journal ofGastroenterology and Hepatology, vol. 27, no. 4, pp. 741–745,2012.
[9] S. Y. Nam, I. J. Choi, K. H. Ryu, B. J. Park, H. B. Kim, andB.-H. Nam, “Abdominal visceral adipose tissue volume is asso-ciated with increased risk of erosive esophagitis in men andwomen,” Gastroenterology, vol. 139, no. 6, pp. 1902–1911.e2,2010.
[10] H. L. Lee, C. S. Eun, O. Y. Lee et al., “Association betweenerosive esophagitis and visceral fat accumulation quantifiedby abdominal CT scan,” Journal of Clinical Gastroenterology,vol. 43, no. 3, pp. 240–243, 2009.
[11] J. Matsuzaki, H. Suzuki, M. Kobayakawa et al., “Association ofvisceral fat area, smoking, and alcohol consumption withreflux esophagitis and Barrett’s esophagus in Japan,” PLoSOne, vol. 10, no. 7, article e0133865, 2015.
[12] E. Y. Ze, B. J. Kim, H. Kang, and J. G. Kim, “Abdominal vis-ceral to subcutaneous adipose tissue ratio is associated withincreased risk of erosive esophagitis,” Digestive Diseases andSciences, vol. 62, no. 5, pp. 1265–1271, 2017.
[13] D. Armstrong, J. R. Bennett, A. L. Blum et al., “The endoscopicassessment of esophagitis: a progress report on observer agree-ment,” Gastroenterology, vol. 111, no. 1, pp. 85–92, 1996.
[14] L. D. Hill, R. A. Kozarek, S. J. M. Kraemer et al., “The gastro-esophageal flap valve: in vitro and in vivo observations,” Gas-trointestinal Endoscopy, vol. 44, no. 5, pp. 541–547, 1996.
[15] I. Hansdotter, O. Björ, A. Andreasson et al., “Hill classificationis superior to the axial length of a hiatal hernia for assessmentof the mechanical anti-reflux barrier at the gastroesophagealjunction,” Endoscopy International Open, vol. 4, no. 3,pp. E311–E317, 2016.
[16] C. G. Lee, J. K. Lee, Y. S. Kang et al., “Visceral abdominal obe-sity is associated with an increased risk of irritable bowel syn-drome,” The American Journal of Gastroenterology, vol. 110,no. 2, pp. 310–319, 2015.
[17] M.Horowitz, K. Jones,M. A. L. Edelbroek, A. J. P.M. Smout, andN.W. Read, “The effect of posture on gastric emptying and intra-gastric distribution of oil and aqueous meal components andappetite,” Gastroenterology, vol. 105, no. 2, pp. 382–390, 1993.
[18] S. S. Shay, D. L. Conwell, V. Mehindru, and B. Hertz, “Theeffect of posture on gastroesophageal reflux event frequencyand composition during fasting,” The American Journal ofGastroenterology, vol. 91, no. 1, pp. 54–60, 1996.
[19] W. C. Orr, M. L. Allen, and M. Robinson, “The pattern of noc-turnal and diurnal esophageal acid exposure in the pathogen-esis of erosive mucosal damage,” The American Journal ofGastroenterology, vol. 89, no. 4, pp. 509–512, 1994.
[20] K. C. Kapur, N. J. Trudgill, and S. A. Riley, “Mechanisms ofgastro-oesophageal reflux in the lateral decubitus positions,”Neurogastroenterology and Motility, vol. 10, no. 6, pp. 517–522, 1998.
[21] M. A. van Herwaarden, D. A. Katzka, A. J. P. M. Smout,M. Samsom, M. Gideon, and D. O. Castell, “Effect of different
7Gastroenterology Research and Practice
recumbent positions on postprandial gastroesophageal refluxin normal subjects,” The American Journal of Gastroenterol-ogy, vol. 95, no. 10, pp. 2731–2736, 2000.
[22] C. Loots, M. Smits, T. Omari, R. Bennink, M. Benninga, andM. vanWijk, “Effect of lateral positioning on gastroesophagealreflux (GER) and underlying mechanisms in GER disease(GERD) patients and healthy controls,” Neurogastroenterology& Motility, vol. 25, no. 3, 2013.
[23] S. S. Shay and R. Lopez, “Impedance monitoring shows thatposture and a meal influence gastro-oesophageal reflux com-position and frequency,” Neurogastroenterology & Motility,vol. 19, no. 2, pp. 94–102, 2007.
[24] L. C. Katz, R. Just, and D. O. Castell, “Body position affectsrecumbent postprandial reflux,” Journal of Clinical Gastroen-terology, vol. 18, no. 4, pp. 280–283, 1994.
[25] T. F. O’Brien Jr., “Lower esophageal sphincter pressure (LESP)and esophageal function in obese humans,” Journal of ClinicalGastroenterology, vol. 2, no. 2, pp. 145–148, 1980.
[26] G. Kouklakis, J. Moschos, J. Kountouras, A. Mpoumponaris,E. Molyvas, and G. Minopoulos, “Relationship between obesityand gastroesophageal reflux disease as recorded by 3-houresophageal pH monitoring,” Romanian Journal of Gastroen-terology, vol. 14, no. 2, pp. 117–121, 2005.
[27] M. A. Küper, K. M. Kramer, A. Kischniak et al., “Dysfunctionof the lower esophageal sphincter and dysmotility of the tubu-lar esophagus in morbidly obese patients,” Obesity Surgery,vol. 19, no. 8, pp. 1143–1149, 2009.
[28] B. L. Fisher, A. Pennathur, J. L. Mutnick, and A. G. Little,“Obesity correlates with gastroesophageal reflux,” DigestiveDiseases and Sciences, vol. 44, no. 11, pp. 2290–2294, 1999.
[29] P. J. Kahrilas, G. Shi, M. Manka, and R. J. Joehl, “Increased fre-quency of transient lower esophageal sphincter relaxationinduced by gastric distention in reflux patients with hiatal her-nia,” Gastroenterology, vol. 118, no. 4, pp. 688–695, 2000.
[30] J. C.-Y. Wu, L.-M. Mui, C. M.-Y. Cheung, Y. Chan, and J. J.-Y.Sung, “Obesity is associated with increased transient loweresophageal sphincter relaxation,” Gastroenterology, vol. 132,no. 3, pp. 883–889, 2007.
[31] D. M. Lambert, S. Marceau, and R. A. Forse, “Intra-abdominalpressure in the morbidly obese,” Obesity Surgery, vol. 15, no. 9,pp. 1225–1232, 2005.
[32] J. E. Varela, M. Hinojosa, and N. Nguyen, “Correlationsbetween intra-abdominal pressure and obesity-relatedco-morbidities,” Surgery for Obesity and Related Diseases,vol. 5, no. 5, pp. 524–528, 2009.
[33] H. B. El-Serag, T. Tran, P. Richardson, and G. Ergun, “Anthro-pometric correlates of intragastric pressure,” ScandinavianJournal of Gastroenterology, vol. 41, no. 8, pp. 887–891, 2006.
[34] M. Suter, G. Dorta, V. Giusti, and J. M. Calmes, “Gastro-esophageal reflux and esophageal motility disorders in mor-bidly obese patients,” Obesity Surgery, vol. 14, no. 7,pp. 959–966, 2004.
[35] J. E. Pandolfino, H. B. el-Serag, Q. Zhang, N. Shah, S. K.Ghosh, and P. J. Kahrilas, “Obesity: a challenge to esophago-gastric junction integrity,” Gastroenterology, vol. 130, no. 3,pp. 639–649, 2006.
[36] H. Nordenstedt, M. Nilsson, R. Johnsen, J. Lagergren, andK. Hveem, “Helicobacter pylori infection and gastroesopha-geal reflux in a population-based study (the HUNT study),”Helicobacter, vol. 12, no. 1, pp. 16–22, 2007.
[37] D. A. Corley, A. Kubo, T. R. Levin et al., “Helicobacter pyloriand gastroesophageal reflux disease: a case–control study,”Helicobacter, vol. 13, no. 5, pp. 352–360, 2008.
[38] W. J. den Hollander, L. Broer, C. Schurmann et al., “Helicobac-ter pylori colonization and obesity – a Mendelian randomiza-tion study,” Scientific Reports, vol. 7, no. 1, article 14467, 2017.
[39] M. S. Kang, D. I. Park, S. Y. Oh et al., “Abdominal obesity is anindependent risk factor for erosive esophagitis in a Koreanpopulation,” Journal of Gastroenterology and Hepatology,vol. 22, no. 10, pp. 1656–1661, 2007.
8 Gastroenterology Research and Practice

Stem Cells International
Hindawiwww.hindawi.com Volume 2018
Hindawiwww.hindawi.com Volume 2018
MEDIATORSINFLAMMATION
of
EndocrinologyInternational Journal of
Hindawiwww.hindawi.com Volume 2018
Hindawiwww.hindawi.com Volume 2018
Disease Markers
Hindawiwww.hindawi.com Volume 2018
BioMed Research International
OncologyJournal of
Hindawiwww.hindawi.com Volume 2013
Hindawiwww.hindawi.com Volume 2018
Oxidative Medicine and Cellular Longevity
Hindawiwww.hindawi.com Volume 2018
PPAR Research
Hindawi Publishing Corporation http://www.hindawi.com Volume 2013Hindawiwww.hindawi.com
The Scientific World Journal
Volume 2018
Immunology ResearchHindawiwww.hindawi.com Volume 2018
Journal of
ObesityJournal of
Hindawiwww.hindawi.com Volume 2018
Hindawiwww.hindawi.com Volume 2018
Computational and Mathematical Methods in Medicine
Hindawiwww.hindawi.com Volume 2018
Behavioural Neurology
OphthalmologyJournal of
Hindawiwww.hindawi.com Volume 2018
Diabetes ResearchJournal of
Hindawiwww.hindawi.com Volume 2018
Hindawiwww.hindawi.com Volume 2018
Research and TreatmentAIDS
Hindawiwww.hindawi.com Volume 2018
Gastroenterology Research and Practice
Hindawiwww.hindawi.com Volume 2018
Parkinson’s Disease
Evidence-Based Complementary andAlternative Medicine
Volume 2018Hindawiwww.hindawi.com
Submit your manuscripts atwww.hindawi.com