The Influence of Volume Fraction on the Distribution of ...
29
ACCEPTED VERSION Qi, Guo Qiang; Nathan, Graham; Kelso, Richard Malcolm PTV measurement of drag coefficient of fibrous particles with large aspect ratio Powder Technology, 2012; 229:261-269 Crown copyright © 2012 NOTICE: this is the author’s version of a work that was accepted for publication in Powder Technology. Changes resulting from the publishing process, such as peer review, editing, corrections, structural formatting, and other quality control mechanisms may not be reflected in this document. Changes may have been made to this work since it was submitted for publication. A definitive version was subsequently published in Powder Technology, 2012; 229:261-269. DOI: 10.1016/j.powtec.2012.06.049 http://hdl.handle.net/2440/73090 PERMISSIONS http://www.elsevier.com/journal-authors/author-rights-and-responsibilities#author- posting Elsevier's AAM Policy: Authors retain the right to use the accepted author manuscript for personal use, internal institutional use and for permitted scholarly posting provided that these are not for purposes of commercial use or systematic distribution. 21 August 2013
Transcript of The Influence of Volume Fraction on the Distribution of ...

ACCEPTED VERSION
Qi, Guo Qiang; Nathan, Graham; Kelso, Richard Malcolm PTV measurement of drag coefficient of fibrous particles with large aspect ratio Powder Technology, 2012; 229:261-269
Crown copyright © 2012
NOTICE: this is the author’s version of a work that was accepted for publication in Powder Technology. Changes resulting from the publishing process, such as peer review, editing, corrections, structural formatting, and other quality control mechanisms may not be reflected in this document. Changes may have been made to this work since it was submitted for publication. A definitive version was subsequently published in Powder Technology, 2012; 229:261-269. DOI: 10.1016/j.powtec.2012.06.049
http://hdl.handle.net/2440/73090
PERMISSIONS
http://www.elsevier.com/journal-authors/author-rights-and-responsibilities#author-posting
Elsevier's AAM Policy: Authors retain the right to use the accepted author manuscript for personal use, internal institutional use and for permitted scholarly posting provided that these are not for purposes of commercial use or systematic distribution.
21 August 2013

1
PTV measurement of drag coefficient of fibrous particles with large
aspect ratio
Guo Q. QI, Graham J. NATHAN and Richard M. KELSO
School of Mechanical Engineering and Centre for Energy Technology, The
University of Adelaide, Adelaide SA 5005 AUSTRALIA
Email: [email protected]
Abstract
The aerodynamic behaviour of long aspect ratio nylon fibrous particles has been investigated
experimentally whilst settling in air under super dilute conditions without any influence of
secondary flows and at fibre Reynolds numbers of 0.5 - 2 based on fibre diameter. A method
for laser-based measurement of the orientations and velocities of fibrous particles is
presented. The experimental apparatus employs a two-dimensional Particle Tracking
Velocimetry (PTV) to calculate orientation and velocity based on the two end-points. The
controlling length scale in the relationship between Reynolds number and drag coefficient
was investigated and the equivalent diameter of settling fibre in air was reported.
Keywords: Sedimentation; aerodynamics; PTV; fibrous particle; drag coefficient
1 Introduction
A fibrous particle settling in air under the influence of gravity will accelerate until the
gravitational force is exactly balanced by the drag force, because the buoyancy can be
ignored in this case. The constant velocity reached is called terminal settling velocity. The
terminal settling velocity of a fibre is strongly influenced by its orientation[16]. Although
research has been conducted on the problem of drag for cylindrical particle, it seems that no
experimental investigations have been undertaken to determine its equivalent diameter of

2
settling fibre in air with large aspect ratio to assess its aerodynamic behaviour.
Fan et al [1] experimentally studied the relationship between drag coefficient (CD) of slender
particles with large aspect ratio (L/d=4-37) and Red (0.4-100). They proposed following
equation to calculate drag coefficient, which needs to be assessed.
)Re6224.0006983.0(Re
24)()(
sin
1 046.1
8524.0
2
23
537.1
d
d
ffp
f
fp
D
gdC
(1)
Here θ is the orientation of the fibre, which is the angle between the major axis of the fibre
and the direction of the gravity; ρfp and ρf are the fibre and fluid density respectively; d is the
diameter of the fibre and μ is the viscosity of fluid; Red = ρairVfpd/µ.
Clift et al [2] reported that for a single fibrous particle with Reynolds number Red > 0.01, a
cylinder falls with its axis oriented horizontally and exhibits steady motion with this
orientation up to Red of order 100. However, this is yet to be extended to a cloud of
interacting particles in suspension. Also Clift proposed the following model to calculate CD
of a cylindrical particle:
04.078.0 )(Re42.1)(Re689.9 ddDC (0.1 < Red < 5) (2)
Sphericity, ψ, is a measure of how closely a particle conform to a spherical shape. It is
widely used in the study of non-spherical particle and has also been used to evaluate fibrous
particles. Sphericity was defined to be:
p
s
A
A (3)
where As is the surface area of sphere that has the same volume as the non-spherical particle
and Ap is the surface area of the non-spherical particle. Based on this definition, the
3
sphericity of a cylindrical particle becomes:
2/2
2
ddL
devfp
(4)
where dev is the diameter of the sphere that has the same volume as the fibrous particle, e.g.
equivalent volume diameter, and d and L are the diameter and length of the fibrous particle
respectively. For present fibre, ψ =0.38.
Haider and Levenspiel [3] proposed the following four parameters correlation to calculate
CD.
Re1
)Re1(Re
24
D
CAC B
D
(5)
Where the values of A,B,C,D are functions of ψ. The authors pointed out that, while the fit is
quite good for isometric particles, ψ > 0.67, it is poorer outside this range. They also argued
that “for close to isometrically shaped particles, those with no one very much longer or very
much shorter dimension, the sphericity is a useful measure, most likely the best single
parameter for describing the shape for falling particles.” That is, Eq (5) is not expected to be
appropriate for a fibrous particle with a long aspect ratio. Furthermore particles with entirely
different shapes and different aerodynamic behaviour can have the same sphericity. For
example, a disc particle and a fibrous particle can have the same Ψ, but have a totally
different aerodynamic behaviour. Therefore, more work is needed to develop relationships
that characterize drag for long aspect ratio fibres.
Venu Maddhav and Chhabra [4] investigated cylinders settling in a confined environment.
The settling cylinders were observed to retain their initial orientation during settling, which
is opposite to the conclusion of Clift et al [2] for a single fibre. Under the conditions of 0.01

4
< Re < 400, 0.35 < Ψ < 0.7 and 0.05 < L/d < 50, Venu Maddhav and Chhabra [4] developed
the following expression to calculate CD:
)Re604.01(Re
24 529.0DC (6)
However the terminal settling velocity with the above range of Re, the cylinder falls with its
axis oriented horizontally [2]. Therefore it doubtful that the findings of Venu Maddhav and
Chhabra [4] can be extrapolated to an unconfined environment in which the orientation is not
generally horizontal.
In addition to above investigations on cylindrical particles, numerous studies have been
conducted by employing equal volume diameter and sphericity to investigate CD of non-
spherical particles [8]-[15]. Based on the work of Haider and Levenspiel [3], Ganser [5]
introduced two shape factors to a drag correlation. But like Haider’s work, for particles
where ψ<0.5, Ganser’s work is applicable to disk only. Swamee and Ojha [6] also developed
a correlation with the Corey shape factor, β=c/(ab)1/2
, where a>b>c are the lengths of the
three principal axis of the particle. However this parameter is only applicable in the range of
0.3 < β <1, making it unsuitable for long aspect ratio fibres such as those considered here.
For present fibre Corey shape factor is 0.16, so it is not applicable.
In the light of the previous investigations described above, we seek to further the
understanding of the aerodynamics of settling long fibrous particles in the range of Red = 0.5
– 2, with a high density ratio of particle to fluid and no boundary limitation. Furthermore we
would investigate the equivalent diameter of a fibre with large aspect ratio settling in air. As
can be seen from the literature review this equivalent diameter has yet to be reported
previously. Therefore, the first aim of present work is to develop a novel method to measure
the velocity and orientation of a fibrous particle simultaneously. The second aim is to employ

5
this method to obtain the relationship (equations) between a fibre’s number density and its
settling velocity in the super dilute regime. The third aim is to investigate the equivalent
diameter that suit the fibre with large aspect ratio and drag coefficient and assess the two
models proposed by previous investigators.
2 Experimental apparatus/facility
2.1 Measurement technique and set-up of PTV system
Fig. 1 presents a schematic diagram of experimental apparatus. To avoid any influence of
electrostatics, the pipe was earthed. The experimental method employed a typical Particle
Tracking Velocimetry (PTV) technique. The laser was operated in a pulsed mode and the
camera in a two-frame mode. The laser sheet was formed by telescopic and diverging lenses.
The settling fibrous particles were illuminated by the laser sheet at regular intervals of time
and the CCD camera used to record two images of the fibres separated by a delay of about
2.5 ms. The oscilloscope and delay generator were employed in the experiments. The
oscilloscope was used to monitor and validate the time separation chosen for the experiments.
A DG-535 delay generator was employed to trigger both the laser flash-lamps and the
camera. The laser used in the experiments was a Quantel Brilliant Twins double-cavity
pulsed Nd: YAG 10 Hz laser, frequency doubled to provide a wavelength of 532nm. The
output energy of laser head was set to provide either 250 mJ/pulse or 400 mJ/pulse. The
camera was a Kodak MegaPlus ES1.0 with a CCD array of 1008pixels × 1018pixels. The
resolution was around 26 μm/pixel and the viewing area was 26mm× 26 mm. Xcap software
was used as the operating system.
6
O
X
Z
Y
Pulsed Nd: YAG Q_Switched laser
Laser sheet
Mirror
Mirror
CCD Camera
Brilliant Twins
Laser head
Laser beam
Telescope and diverging lens
Pipe
60mm
50
0 m
m
Fig. 1 Experimental arrangement (not to scale). The surrounding settling chamber
(650mm×620mm cross section) is not shown for clarity.
The settling chamber was of nominally square cross section with a 650mm × 620mm, height
of 2,000mm and was made of Perspex. The fibrous particles were introduced into the top of
the chamber and settled over a distance of 2.5-3.0m through a 2,000 mm long pipe of 60mm
diameter. Not only did this ensure sufficient length to reach their terminal settling velocities
before entering the chamber, it also ensured that any background currents induced by the
particles in the chamber were negligible. With a volume fraction of order of 10-5
, and cross
sectional area of the “jet” of falling particles to the chamber of the order 10-2
, any induced
chamber flows will be at most 1% that of the particles, which is within experimental error.
This neglect ensured the dilute phase was not influenced by any chamber currents in contrast
to previous investigation [16]. Also fibres settling velocities were measured for settling
distances of both 2.5m and 3.0m. The mean settling velocities obtained were identical for
both cases, confirming that the fibres have reached their terminal settling velocities and
steady state conditions.
The particle delivering system is axisymmetric, which this greatly facilitates the

7
measurement, because the measurement can be performed at any vertical plane through the
centre line of the pipe. The system can also accommodate spherical particles under identical
conditions. This allows direct comparisons to be performed between spherical particles and
fibrous particles.
The intensity distribution of laser sheet is nearly Gaussian, as shown in Fig. 7. This property
is exploited to determine whether a fibre is fully or partly within the light sheet, as described
below. The thickness of the laser sheet was chosen to be around 5mm to provide good
illumination of entire particles.
2.2. Property of the fibres
The particles used in the experiments are nylon fibres whose properties are shown in Table 1.
A micrograph of a sample of the fibres is shown in Fig. 2, at a resolution of 18 μm/pixel. It
can be seen that they are of constant diameter and, while many are straight, a significant
number have a slight bend.
Table 1 Nylon fibre used in the experiments
Length, L, μm 2,000
Diameter, d, μm 49.6
Density, ρfp, kg/m3 1,150
Aspect ratio, L/d 40
Material Nylon
Denier 20
Fig. 2 A micrograph of the sample of nylon fibres.
8
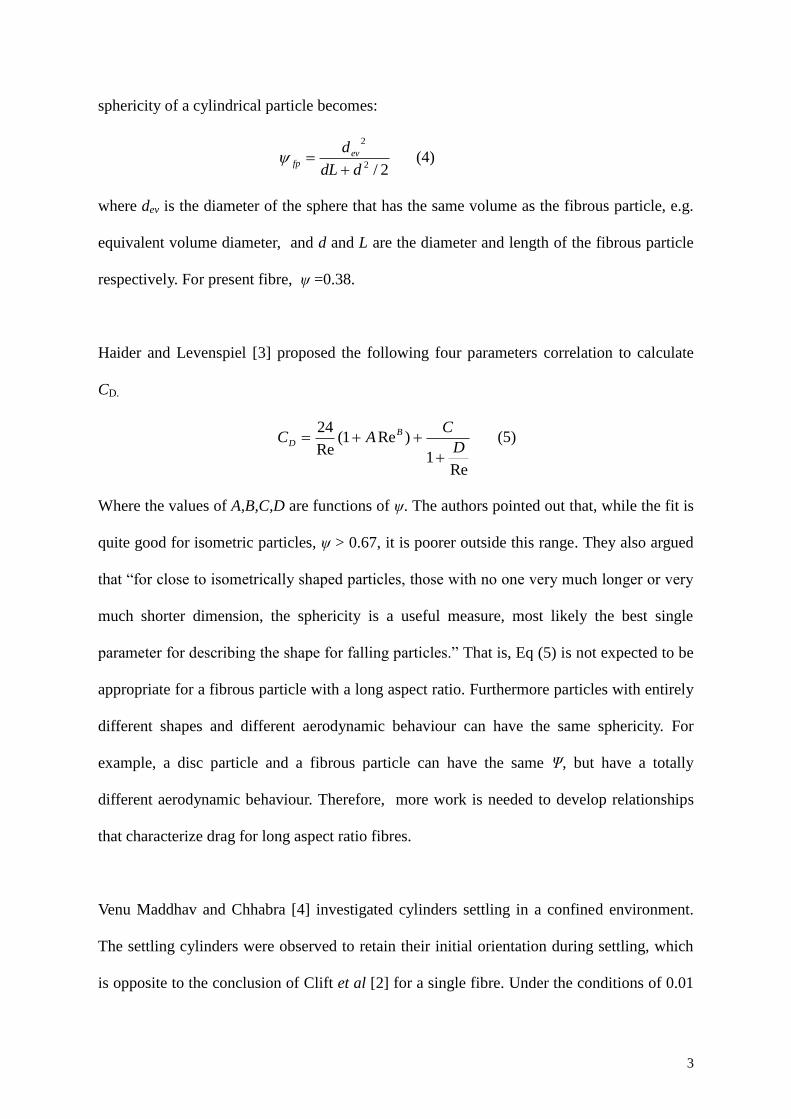
The length of each fibrous particle (i.e. the major axis) is defined as the maximum distance
between any two pixels in the object. This distance is measured from an optical image
converted to binary form (see Fig. 3). The minor axis is defined to be perpendicular to the
major axis and the rectangle defined by the two axes can enclose the perimeter of the region.
This rectangle we call the “basic rectangle” (Gonzalez et al [7]). The concept of a basic
rectangle can also be used to define fibrous particle’s straightness, as shown in Eq. (7).
i
i
L
d
1 (7)
where ε is straightness of a fibrous particle; δ is minor axis of the basic rectangle on a binary
image; di and Li is the diameter and length of the fibre respectively on the binary image and
the subscript “ i ” refers to “image”. If a fibre’s straightness tends toward unity, the fibre
approaches being straight.
δ
d i
L iBasic rectangle
Fig. 3 A binary image of a fibre and its “basic rectangle” used to
define its characteristic dimensions.
Fig. 4 presents the distribution of the straightness of the fibrous particles based on a sample
size of 1,139. It can be seen that 90.1% of these fibres have straightness ε > 0.85 and some
38% are perfectly straight.

9
0
0.05
0.1
0.15
0.2
0.25
0.3
0.35
0.4
0.5 0.55 0.6 0.65 0.7 0.75 0.8 0.85 0.9 0.95 1
Fig. 4 The distribution of straightness, ε (see Eq. 7) for the present fibres.
Fig. 5 presents the distribution of the fibres length, L, which were measured directly from the
two endpoints. It can be seen that 82% of fibres have a length between 1900 and 2100 μm
and over 95% between 1800 and 2200 μm, with a standard deviation of 196μm.
0
0.1
0.2
0.3
0.4
0.5
0 500 1000 1500 2000 2500 3000
length of fibrous particle, micron
pro
bab
ilit
y
Fig. 5 The distribution of the length, L, of the present fibres.
2.3 Number density, orientation and velocity measurement
Fig. 6 presents the orientation definition of a fibre. The plane of x-y is image plane. The
angle of α is defined to be azimuth of a fibre and θ the orientation of a fibre.
L , (μm)
ε
Pro
bab
ilit
y
Pro
bab
ilit
y

10
Fig. 6 The definition fibre orientation, where x-y is image plane
In the present study, we define the volume fraction of fibrous particles as:
HR
Ldnp
2
2
10181008
)2/(
(8)
where np is the number of fibrous particles in viewing volume, R is the magnification of
camera image system, H is the thickness of laser sheet and 1008×1018R2H is the viewing
volume.
In the present experiments of measuring settling velocity and Ф, the volume fraction were
controlled to be in the range of Ф ≤ 0.0001, which is a super dilute condition so that there
were few particles which exhibited clumping. Hence the number density of fibrous particle
in the viewing area (volume) was calculated by counting the number of particles, and the
volume fraction was computed exactly. The volume fractions were also binned by the
number of particles to obtain statistically the influence of particle number density on the
fibres’ aerodynamic behaviour.
The coordinates of two endpoints of each object (fibrous particle) were obtained. Since the
θ
Camera
α
x
x
y
z
Lx
Ly
11
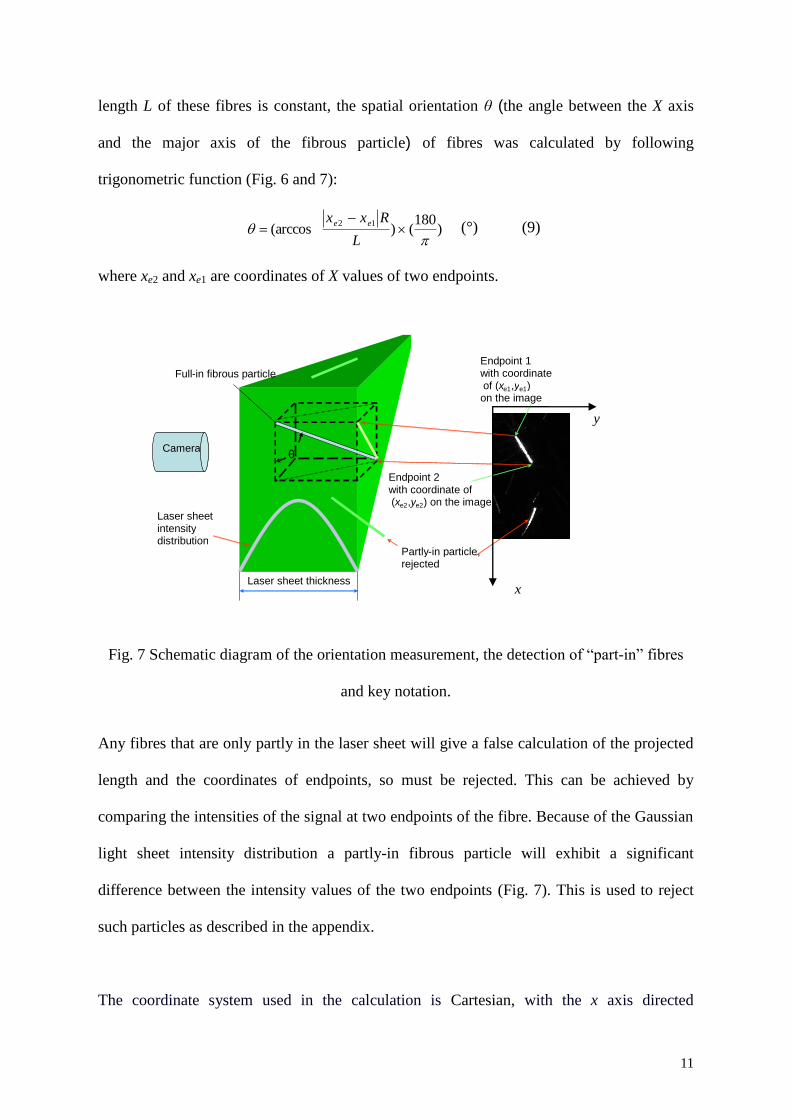
length L of these fibres is constant, the spatial orientation θ (the angle between the X axis
and the major axis of the fibrous particle) of fibres was calculated by following
trigonometric function (Fig. 6 and 7):
)180
()(arccos12
L
Rxx ee (°) (9)
where xe2 and xe1 are coordinates of X values of two endpoints.
Fig. 7 Schematic diagram of the orientation measurement, the detection of “part-in” fibres
and key notation.
Any fibres that are only partly in the laser sheet will give a false calculation of the projected
length and the coordinates of endpoints, so must be rejected. This can be achieved by
comparing the intensities of the signal at two endpoints of the fibre. Because of the Gaussian
light sheet intensity distribution a partly-in fibrous particle will exhibit a significant
difference between the intensity values of the two endpoints (Fig. 7). This is used to reject
such particles as described in the appendix.
The coordinate system used in the calculation is Cartesian, with the x axis directed
y
θ
Endpoint 2 with coordinate of (x e2 ,y e2 ) on the image
Endpoint 1 with coordinate of (x e1 ,y e1 ) on the image
Full - in fibrous particle
Laser sheet thickness
Camera
Partly - in particle, rejected
Laser sheet intensity distribution
x
12
downwards in the direction of gravity. We define the two endpoint velocities of the fibrous
particle as Ve1 and Ve2. Each endpoint velocity has three components Ve1x , Ve1y , Ve1z and
Ve2x ,Ve2y ,Ve2z, as shown in Fig. 8 and Eq. (10).
zeyexee
zeyexee
VVVV
VVVV
2222
1111
(10)
Based on Eq. (10), we define Ve1x and Ve2x as vertical components of the settling velocity of
the endpoints 1 and 2 respectively of the fibrous particle. Similarly Ve1y and Ve2y are the
horizontal components of settling velocity of endpoints 1 and 2 of the fibrous particle
respectively.
Image pairs were recoded by the digital camera with a known time separation (Δt). After
image processing the displacements of two endpoints of fibrous particles along the x and y
axis can be obtained. From this Ve1x , Ve1y and Ve2x , Ve2y can be calculated by Eq. (11), as
follows:
t
RxxV ee
xe
)( 11121
,t
RyyV ee
ye
)( 11121
,t
RxxV ee
xe
)( 21222
,t
RyyV ee
ye
)( 21222
(11)
where Ve1x is the velocity of endpoint 1 in the x direction; Ve1y is the velocity of endpoint 1
in the y direction; Ve2x is the velocity of endpoint 2 in the x direction; Ve2y is the velocity of
endpoint 2 in the y direction; xe12 is x axis coordinate of endpoint 1from the second image,
xe11 is x axis coordinate of the endpoint 1from the first image; ye12 is y axis coordinate of the
endpoint 1 from the second image and so on.
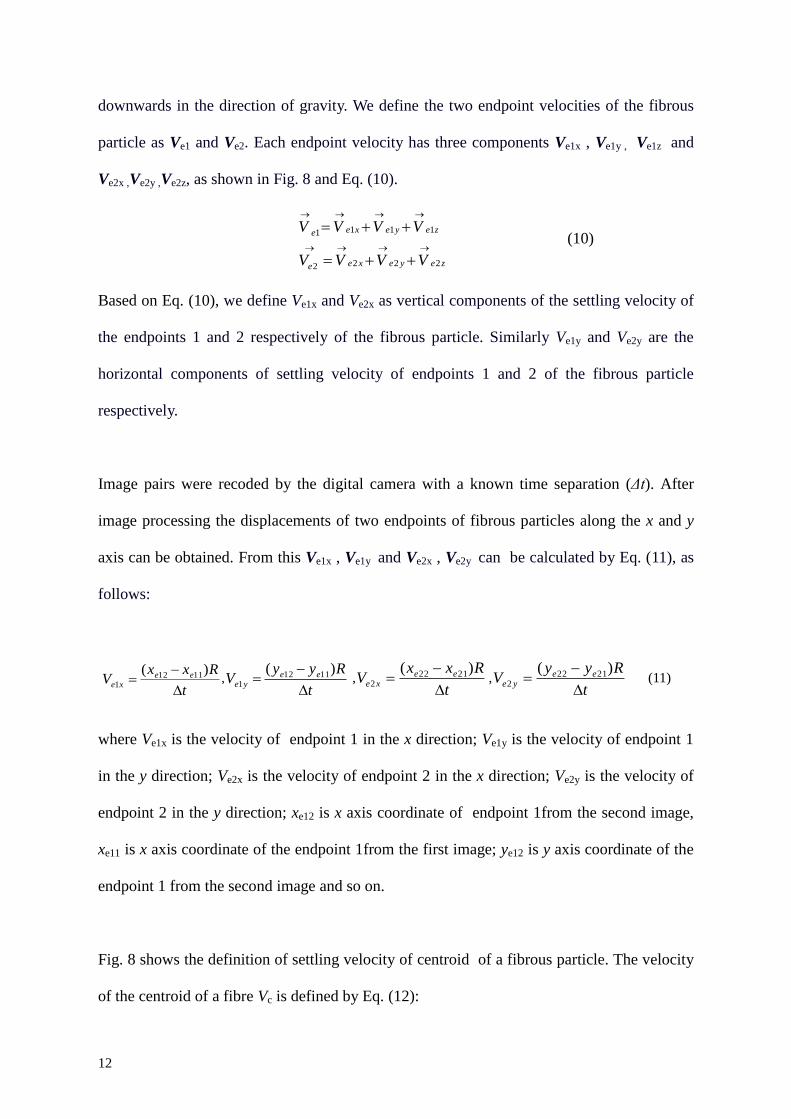
Fig. 8 shows the definition of settling velocity of centroid of a fibrous particle. The velocity
of the centroid of a fibre Vc is defined by Eq. (12):
13
)(2
1
)(2
1
)(2
1
21
21
21
zezecz
yeyecy
xexecx
czcycxc
VVV
VVV
VVV
VVVV
(12)
Fig. 8 Two endpoint and centroid velocities of a fibre.
In present study, Vcx and Vcy represent vertical and horizontal components of settling
velocities of a fibrous particle respectively. Because the particle delivery system is vertical
and axisymmetric, the distributions of Vcy and Vcz is identical and Vcy is representative. So
Vcz is ignored.
Since data are obtained from an image pair, the orientation of a fibrous particle equals the
average orientation of the fibre from the first and second images:
)(2
121 (13)
)180
(arccos1121
1
L
Rxx ee (14)
)180
(arccos1222
2
L
Rxx ee (15)
Vc
Ve1x
Ve1z
Ve1y
y
Endpoint1
z
x
Endpoint 2
Ve1

14
3 Experimental results and discussions
3.1 Distribution of fibre’s settling velocity and orientation
Fig. 9 presents distribution of vertical settling velocity obtained from 29,364 samples for
volume fraction less than 5×10⁻⁴
and Herzhaft and Guazzelli’s work [16]. It can be seen the
distribution is Gaussian. Fig. 9 indicates that the relatively small size of the error bars shows
that the variation in straightness of the fibres does not have a large influence on the settling
velocity of these fibres. Furthermore, the absence of any bimodality in the curve implies that
there is no fundamental difference in the aerodynamics of perfectly straight and slight curve
fibres under the conditions assessed here. That is the presence of a slight curve may increase
the scatter in the velocity distribution but does not result in any fundamental change in
aerodynamic behaviour, since some fibres are perfectly straight. Finally the significantly
lower spread in Vcx/Vts compared with the measurements of Herzhaft and Guazzelli[16], who
did use perfectly straight fibres, suggests that the influence of volume fraction is more
significant than that of straightness.
Fig. 10 shows the orientation distribution of fibrous particles obtained from 29,364 samples
over the range of a volume fraction, Ф < 5×10⁻⁴
. It can be seen the majority of fibres are
broadly, but not exactly, horizontal. This agrees with Fan et al [1] and Clift et al [2].

15
Fig.9 The measured distribution of settling velocity Vcx relatively to the terminal velocity of
an isolated particle, Vts, at volume fraction Φ < 5×10⁻⁴
0
0.03
0.06
0.09
0.12
0.15
0 5 10 15 20 25 30 35 40 45 50 55 60 65 70 75 80 85 90
Fig. 10 The measured distribution of the orientation of present fibres from the vertical, at
volume fraction Φ < 5×10⁻⁴
Dimensionless vertical velocity (Vcx/Vts )
Pro
bab
ilit
y
Herzhaft and
Guazzelli’s work
ReL=10-4
, Φ=0.07
Present work
ReL=20-100
Φ=0.0005
θ, (°)
Pro
bab
ilit
y

16
3.2 Influences of volume fraction on vertical component of settling velocity of fibrous
particles
Fig. 11 presents the relationship between volume fraction (Ф) and the mean vertical
component of settling velocity ( cxV ) under the condition of low number density (0.1× 10⁻⁵
–
10 × 10-5
). The measurements conducted in super dilute condition. Thousands of runs were
performed and per volume fraction were sorted out by image processing. The data point
corresponding to the lowest volume fraction in Fig. 11 represents the case of one isolated
particle per image and highest volume fraction is 98 fibres per image. Each data point of
cxV , and cyV comes from the average of per volume fraction which has hundreds of data in
Fig.11-13. It can be seen that cxV increases monotonically with Ф. Furthermore the scatter
in the data also increases with Ф, the RMS of the data has a similar trend. Eq. (16) is
proposed to describe relationship between the number density and the vertical component of
settling velocity for the dilute regime.
n
ts
cxa
V
V
)( (16)
where tsV is average terminal settling velocity of a single fibre; a and n are constants that
are expected to depend on fibre’s aspect ratio and Reynolds number; The constants in Eq.
(16 ) for the present fibres are: tsV =0.375, a=7.310 and n=0.1519. That is
1519.0743.2)( cxV (17)

17
0
0.1
0.2
0.3
0.4
0.5
0.6
0.7
0.8
0.0 2.0 4.0 6.0 8.0 10.0
phai (E-5)
mean
Vcx (
m/s
)Vcx
RMS
Power (Vcx)
Fig.11 The relationships between Ф and cxV for fibrous particles settling in air
The data point corresponding to the lowest volume fraction in Fig. 11 represents the
minimum of cxV (terminal settling velocity of an isolated fibre), with all other values of cxV
exceeding it in Ф=0.1× 10⁻⁵
– 10 × 10-5
regime.
3.3 Influences of volume fraction on orientation of fibrous particles
Fig. 12 presents the relationship between the Ф and mean orientation ( ). It can be seen
decreases with Ф, i.e. the fibrous particles tend to become more horizontal with decreasing
Ф. These data can also be described by a power relationship:
tsn
b
)( (°) (18)
where b is a constant and ts is average orientation of a single fibre when settling in air. In
the above case, ts =81.38° and n=0.0654, b=0.428. This result can explain why the value
of cxV increases with the increasing of Ф. An increase in Ф causes the fibre’s major axis to
Vcx
(m
/s)
)10( 5
cxV
RMS
Eq. (17)

18
tend to be more vertical, causing cxV to increase, due to increased aerodynamic interaction
between particles.
0
10
20
30
40
50
60
70
80
90
100
0.0 2.0 4.0 6.0 8.0 10.0
phai (E-5)
deg
ree RMS
θ
Power (θ)
Fig. 12 The relationship between and Ф
3.4 Influences of volume fraction on horizontal component of settling velocity of fibrous
particles
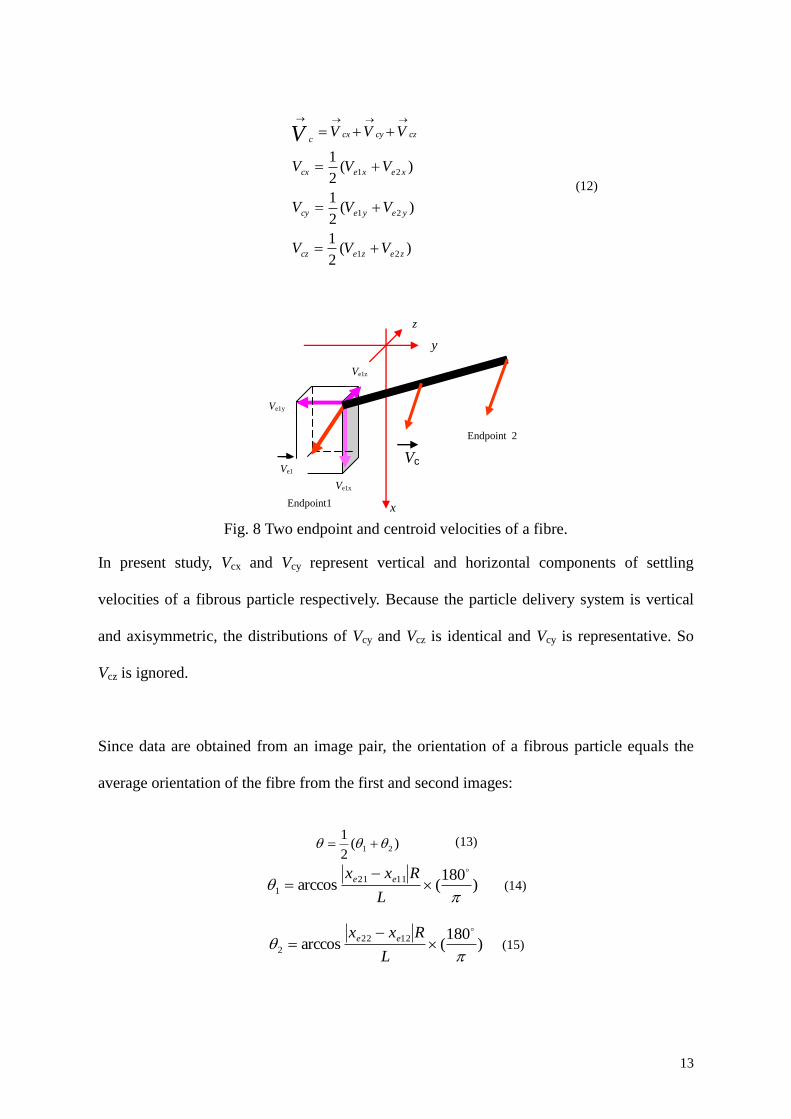
Fig. 13 presents the relationship between mean horizontal component of settling velocity cyV
and Ф. It can be seen that cyV is zero on average and the fluctuation of
cyV increases
monotonically with Ф. The RMS is well characterized by a power law as follows:
RMS of cyV = 0.0167 Ф
0.2495 (19)
The fluctuation of cyV values indicates the trajectories of settling fibres are not straight line.
The aerodynamic interaction increases the absolute value of cyV .
θ,
(°)
)10( 5
RMS
Eq. (18)
19
-0.06
-0.05
-0.04
-0.03
-0.02
-0.01
0
0.01
0.02
0.03
0.04
0.05
0.0 2.0 4.0 6.0 8.0 10.0
phai (E-5)
Vcy,
(m/s
)
RMS
Vcy
Power (RMS)
Fig. 13 The relationship between cyV and Ф
3.5 Assessment of characteristic length of a fibre when settling in air
The definition of the Reynolds number of a settling fibrous particle in air requires a
characteristic length scale. The Re of a fibre can be calculated using diameter d, length L or
equivalent deq . Assuming that an equivalent “diameter” deq can be found, it is possible to
define a Reynolds number Reeq of a single fibre as follows:
eqtsair
eq
dVRe (20)
When settling in air, the fibre’s drag force can then be defined as follows:
222)
2(
2
1
2
1 eq
tsDaireqtsDairD
dVCAVCF (21)
The force due to gravity is Lgd
F fpg
2)2
( , and when the fibre reaches its terminal
settling velocity Dg FF :
Lgd
fp
2)2
( 22)
2(
2
1 eq
tsDair
dVC (22)
combining Eqs. (20) and (22) gives CD (Reeq)2
:
)10( 5
V
cy,
(m
/s) RMS
cyV
Eq. (19)

20
KLgd
Cairfp
eqD 2
2
22
)(Re
(23)
In Eq. (23), K is a constant for a given fibre, so we can obtain relationship of present fibre
between CD and (Reeq)-2
theoretically, as shown in Fig. 14:
22 )(Re81.412)(Re eqeqD KC (24)
0
2
4
6
8
10
12
14
16
18
0 5 10 15 20
Fig. 14 The theoretical relationship between Reeq and CD
If we define deq based on the fibre’s projected area, in the vertical direction it is:
cos)2
(sin)2
( 22 ddL
dA
eq
eq (25)
We can experimentally measured CD from Eq. (26):
)cos)2
(sin(2
1
)2
(
2
1 22
2
2
d
dLV
Lgd
AV
FC
tsair
fp
eqtsair
DD
(26)
Meanwhile
dVtsaird Re , combining Eq (26) and gives:
)cos4
1sin(Re2 22
3
dL
LgdC
d
fpair
D
(27)
Eq. (27) is relationship between CD and Red and orientation θ.
Eq. (24)
Reeq
C
D

21
Fig. 15 presents the experimental relationship between Re and CD based on 94 single settling
fibres and the Re were calculated using the fibre’s diameter d, length L, volume equivalent
diameter dev and surface equivalent diameter des respectively. We plot CD – Re (Eq.26 and 20)
by changing deq until the curve of Fig. 15 coincides Fig. 14, then we obtained deq = 354μm
for present fibre, see Fig. 16. After that Eq. (25) becomes:
396800.00sinθ + 7728.82cos θ = 393691.82 (28)
Solving Eq. (28), we can obtain θeq = 81.62°. Comparing with Eq. (18), ts =81.38° it can be
seen that average orientation of a settling single fibre can be used in Eqs. (25), (26).
Therefore from Eq. (25) the equivalent “diameter” deq of a fibre settling in air is as follows:
ts
ts
eq dLd
d
cos
sin4 2 (29)
Fig. 15 The experimental dependence of drag coefficient on Reynolds number based on
length ReL, on diameter Red, on equivalent surface area diameter Redes and on equivalent
volume diameter Redev
0
2
4
6
8
10
12
14
0 20 40 60 80 100
Re based on dev Re based on L Re based on d Re based on des
Re
CD=11471(ReL)-1.97
CD=306(Redes)-1.97
CD=118(Redev)-1.97
CD=8(Red)-1.97
C
D

22
Fig. 16 Theoretical and experimental relationship between CD and Reeq, where deq is defined
in Eq. (29)
The models proposed by Fan et al [1] and Clift et al [2] are based on diameter, d, of the fibre.
Hence we use this characteristic length to assess their models in Fig. 17. From the figure we
can see that these models do not describe the behaviour of present particles. For Fan’s
model, as can be seen from Eq. (1), the term of 537.1)(
f
fp
plays an important role when ρfp
is far greater than ρf. For present case ρfp / ρf = 958, it predicts CD far less than the present
values. Hence their model is poorly suited to fibre-gas two-phase flow. For Clift’s model
04.078.0 )(Re42.1)(Re689.9 ddDC (0.1 < Red < 5), the power of -0.78 is far greater than -2,
so its slope is much lower than that of present fibres. As mentioned in section 3.1, the
presence of slight curve of fibres increase the scatter in settling velocity distribution, this can
cause a bias on CD. However no comparable data is available against which to provide a
quantitative assessment of the effect.
0
2
4
6
8
10
12
14
16
18
0 5 10 15 20
Experiment Calculation
CD=380.78(Reeq)-1.97,
Experimental
CD=412.81(Reeq)-2,
Theoretical
CD
Reeq

23
Fig. 17 The relationship of Red and CD between present and Fan’s and Clift’s work
4 Conclusions
In this work, we measured the vertical and horizontal components of settling velocities,
orientation and number density for long fibres settling in air with Re ~ O(1) and for volume
fractions Ф = 10-6
- 5×10⁻⁴
. The mean vertical settling velocities were found to increase
monotonically with Ф. The mean orientations decrease with Ф. We show that all the mean
steady state settling velocities of multiple fibres exceed the mean terminal settling velocity
of a single fibre under Ф < 10-4
. This phenomenon is attributed to fibres' orientation
transition from horizontal state to vertical under super dilute regime that stems from
increasing aerodynamic interactions between fibres. The mean horizontal settling velocity
was zero on average. However the fluctuations of the horizontal components of settling
velocities of settling fibres were found to increase with volume fraction. Finally the
controlling length scale in the relationship between Reynolds number and drag coefficient
was assessed. It is found that the diameter based on the projected area with mean orientation
describes the relationship well, while all other length scales fail. The models of Fan et al [1]
and Clift et al [2] were also found to be in poor agreement with present measurements.
0
2
4
6
8
10
12
14
0 0.5 1 1.5 2 2.5
Re based on d
Cd Fan et al (2004)
Clift et al (1978)
Present work
Red
CD
24
Acknowledgement
This study has been supported by the Faculty of Engineering, Computer & Mathematical
Science of The University of Adelaide and by an ARC Discovery Grant, both of which are
gratefully acknowledged.
References
[1] L. Fan, Z. Mao, C. Yang, Experiment on Settling of Slender Particles with Large Aspect
Ratio and Correlation of the Drag Coefficient, Ind. Eng. Chem. Res. 43 (2004), pp7664 -
7670.
[2] R. Clift, J. Grace and M. Weber, Bubbles, drops, and particles, ISBN 0-12-176950-X,
Academic Press, New York, 1978
[3] A. Haider and O. Levenspiel, Drag coefficient and terminal velocity of spherical and
nonspherical particles, Powder Technology, 58 (1989), pp63-70.
[4] G. Venu Madhav, R. P. Chhabra, Drag on non-spherical particles in viscous fluids,
International Journal of Mineral Processing, 43(1995), pp15-29
[5]G. H. Ganser, A rational approach to drag prediction of spherical and nonspherical
particles, Powder Technology, 77(1993), pp143-152
[6] P. K. Swamee, C. P. Ojha, Drag coefficients and fall velocity of non-spherical particles J.
Hydraul. Eng. 117(1991)
[7] R. Gonzalez, R. Woods, S. Eddins, Digital image processing using Matlab, ISBN 0-13-
008519-7, Pearson Education, 2004
[8] R. P. Chhabra, L. Agawal, N. K. Sinha, Drag on non-spherical particles: an evaluation of
available methods, Powder Technology, 101(1999), pp288-295
[9] Z. L. Arsenijevic, Z. B. Grbavcic, R. V. Grulovic, F. K. Zdanski, Determination of non-
spherical particle terminal velocity using particulate expansion data, Powder Technology,
25
103 (1999), pp265-273
[10] H. Y. Xie, D. W. Zhang, Stokes shape factor and its application in the measurement of
sphericity of non-spherical particles, Powder Technology, 114 (2001). pp102-105
[11] P. Rajitha, R. P. Chhabra, N. E. Sabiri and J. Comiti, Drag on non-spherical particles in
power law non-Newtonian media, International Journal of Mineral Processing, 78 (2006),
pp110-121
[12] S. Tran-Cong, M. Gay and E. E. Michaelides, Drag coefficient of irregularly shaped
particles, Powder Technology, 139(2004), pp21-32
[13] A. Unnikrishnan, R. P. Chhabra, An experimental study of motion of cylinders in
Newtonian fluids: wall effects and drag coefficient, the Canadian Journal of Chemical
Engineering, Vol. 69, 1991
[14] J. Gabitto and C. Tsouris, Drag coefficient and settling velocity for particles of
cylindrical shape, Powder Technology 183 (2008), pp314-322
[15] G. McKay, W. R. Murphy and M. Hillis, Settling characteristics of discs and cylinders,
Chem Eng Res Des, Vol. 66, 1988
[16]B. Herzhaft, and E. Guazzelli, Experimental study of sedimentation of dilute and semi-
dilute suspensions of fibres, Journal Fluid Mech, Vol 384 (1999) pp133-158
Appendix
Image processing
The purpose of the image processing is to extract measurements for each particle using Eqs.
9-15 and to thus allow the aerodynamic behaviour of the fibrous particle to be assessed
statistically under various conditions. From the coordinates of two endpoints it is possible to
calculate the orientation and velocities of a fibre.
26
Those fibrous particles located at the edges of an image yield a false measurement of its
length. Therefore first step of image processing is to remove these fibrous particles from the
images. The second step is to convert the image into binary form. The third step is to remove
small objects. Binary images typically contain “noise” which comprises spurious signal in
one or two isolated pixels. They are not real fibrous particles and so need to be removed. The
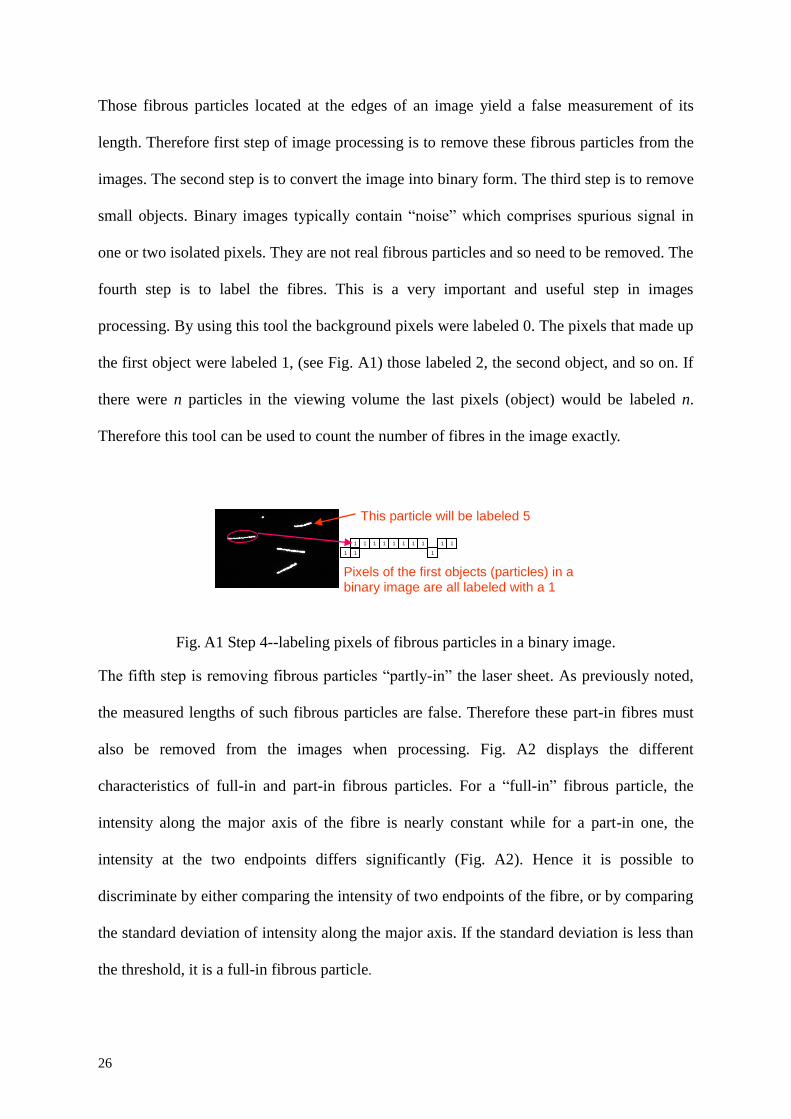
fourth step is to label the fibres. This is a very important and useful step in images
processing. By using this tool the background pixels were labeled 0. The pixels that made up
the first object were labeled 1, (see Fig. A1) those labeled 2, the second object, and so on. If
there were n particles in the viewing volume the last pixels (object) would be labeled n.
Therefore this tool can be used to count the number of fibres in the image exactly.
Fig. A1 Step 4--labeling pixels of fibrous particles in a binary image.
The fifth step is removing fibrous particles “partly-in” the laser sheet. As previously noted,
the measured lengths of such fibrous particles are false. Therefore these part-in fibres must
also be removed from the images when processing. Fig. A2 displays the different
characteristics of full-in and part-in fibrous particles. For a “full-in” fibrous particle, the
intensity along the major axis of the fibre is nearly constant while for a part-in one, the
intensity at the two endpoints differs significantly (Fig. A2). Hence it is possible to
discriminate by either comparing the intensity of two endpoints of the fibre, or by comparing
the standard deviation of intensity along the major axis. If the standard deviation is less than
the threshold, it is a full-in fibrous particle.
Pixels of the first objects (particles) in a binary image are all labeled with a 1
1 1 1 1 1 1 1 1
1 1 1
1 1
This particle will be labeled 5

27
0 10 20 30 40 50 60 700
100
200
300
400
500
600
700
800
900
1000
pixels along major axis, in pixel
pix
els
in
tensit
y a
long
mo
jor
axis
pf
pa
rtic
le,
in b
it
"full-in" particle, No 24 particle
0 5 10 15 20 25 30 35 40100
200
300
400
500
600
700
800
900
1000"part-in" particle, No particle 30 of run7-sett-vel-29-03-20d2-034
pixels along major axis, in pixel
pix
el
inte
nsit
y ,
in b
it Part-in
Full-in
Fig. A2 The distributions of intensity along major axis for part-in
and full-in fibrous particles in the laser sheet.
The last step is tracking particles and calculating velocities and orientations. Fig. A3
presents a pair of images of fibres with a known time separation of 2500 μs. The circles
highlight those fibrous particles that are pairs. It can be seen that if the time separation is
short enough, any changes in fibre’s length is small, orientation and area are small. Based on
these characteristics on the images, tracking particles (matching pairs) becomes easier than
for spherical particles.
28
Fig. A3 A pair of images of fibres with a known time separation of 2,500 μs,
sets of obviously matching pairs are encircled.
The accurate matching of pairs of fibrous particles within a known time separation is a most
important step in image processing. From this, the vertical and horizontal displacements of
each particle can be obtained, and hence the vertical and horizontal components of settling
velocities can be calculated. After collecting of the two endpoint’s coordinates and matching
particle pairs in each pair of images, all components of settling velocities (translational and
rotational) of the centroid and orientation of a fibrous particle can be obtained from Eqs. 9-
15. The end point of a fibre moves by average 50 pixels, and the total uncertainty in the
position of the end point is 4 pixels, then this corresponds to a relative uncertainty in the
spatial position of the end point of 8%.


![VCCTL at SCG - RMC Research & Education Foundation · -Setting time [ASTM C191] • Particle size distribution of cement, limestone & gypsum • Surface area fraction & volume fraction](https://static.fdocuments.us/doc/165x107/5e7908beab5e08264e3dd463/vcctl-at-scg-rmc-research-education-foundation-setting-time-astm-c191.jpg)