The influence of nutrition policy and practice on children ...
17
The influence of nutrition policy and practice on children’s eating habits in school Research Bulletin No 5:
Transcript of The influence of nutrition policy and practice on children ...

The influence of nutrition policy and practice on children’s eating habits in school
Research Bulletin No 5:

2
This article should be cited as Gilmore G, Beattie K. Research Bulletin No.5: The
influence of school nutrition policy and practice on children’s eating habits. Public
Health Agency, Belfast 2016.

3
Background
Health policies within individual schools have a key role to play in the overall
implementation of the school food: top marks programme1. Local policies limiting the
availability of high fat or sugar foods and drinks in school engender a whole school
approach to healthy eating, and can bolster the success of the nutritional standards
for school meals and other food in schools.
To help assess the impact of the school food: top marks programme, research
exploring attitudes towards food in schools and eating behaviours was completed in
2008, and again in 2012. In 2008, 3277 children from primary and post-primary
schools across Northern Ireland (representative of Education and Library Board2
area; school type; and free school meal entitlement (FSME) participated in cross-
sectional quantitative research. The survey was repeated in 2012 with a sample of
3291 children. Further details on the research methodology are presented in
Research Bulletin No. 1.3
A series of seven research bulletins have been produced outlining the key outcomes
of this research and making recommendations for future action with a full list of these
bulletins available within the School food: top marks research background and
approach bulletin.3 This fifth bulletin specifically illustrates the extent to which schools
have adopted nutrition or health related policies and describes how the
implementation of these can impact on the eating habits of children within the school
setting.
School policies
Throughout the duration of the research, the most popular school policy reported by
principals was keeping pupils on-site at break and lunch times (see Table 5.1,
page 4). In 2012, 93% of principals maintained they had implemented this policy,
1 Since the completion of this research, a review of the school food marketing and promotion strategy has taken
place. Following consultation with stakeholders the school food: top marks programme has been renamed and rebranded to school food (try something new today). The aims and objectives of the programme have remained the same. 2 From 1 April 2015, the five Education and Library boards (ELBs) have amalgamated to become the Education
Authority. 3
Gilmore G, Beattie K. Research Bulletin No. 1: School food: top marks, research background and approach. Public Health Agency, Belfast 2016. Available at http://www.publichealth.hscni.net

4
“Once they hit 4th, 5th, 6th year, they are allowed out at lunch time… 400 children hitting that town every day so every single shop is selling hot food - the Chinese…they are all doing school specials”. Interview; school catering manager, Belfast Education and Library Board (ELB).2
while 7% (n=15) of principals indicated that their pupils were allowed off school
premises at break and/or lunch time without having specific permission; twelve
during lunchtime and three at both break and lunch time. However, there was a
significant difference between primary and post-primary schools and the likelihood of
implementing an onsite policy – all of the primary school principals who responded to
this question kept children onsite, compared to 82% of post-primaries (p<.001).
The importance of keeping pupils
onsite was a recurrent theme
throughout the qualitative research
with catering staff in schools and
focus groups with the wider
catering managers and coordinators. Catering staff in school pointed out two issues
in allowing children to leave school at lunch time: firstly, it diverted resources away
from the canteen; and secondly, the food the children bought outside school was
unhealthier than that sold in the school canteen. Indeed, as is discussed later in this
bulletin, when the types of foods and drinks bought from different outlets were
examined, those purchased from shops or catering were more likely to be higher in
fat and/ or sugar than those from other sources.
Table 5.1 School policies in 2008 and 2012 (as reported by principals)4 2008 2012
All5
(N=298) Primary (N=180)
Post-primary (N=112)
All6 (N=209)
Primary (N=121)
Post-primary (N=85)
Break time policy 73% 94%*** 45%*** 79% 97%*** 49%***
Whole school nutritional policy 67% 71% 62% 75% 72% 79%
Fizzy drinks policy 72% 77% 67% 79% 90%*** 64%***
Chocolate, crisps, sweets policy 61% 64% 58% 53% 53% 52%
Healthy tuck shop 35% 32% 40% 71% 69% 72%
On-site policy at lunch time 91% 99%*** 79%*** 93% 100%*** 82%***
Healthy break policies were the next most common healthy eating policy in schools
in both 2008 and 2012 (see Table 5.1, above). It was interesting to note that the
proportion of principals who indicated their school had a break time policy increased
4
*** signifies a p-value of less than 0.001, where the observed difference could only be expected to have occurred by chance in 1 in 1000 times in repeated tests; ** signifies a p-value of less than 0.01, suggesting that the observed outcome would be expected to occur by chance only 1% of the time, and * suggests the difference is statistically significant at a p-value of less than 0.05 (suggesting that the observed outcome would be expected to occur by chance only 5% of the time). 5 ‘All’ category includes 6 special schools- not shown in individual primary / post primary school analysis.
6 ‘All’ category includes 3 special schools- not shown in individual primary / post primary school analysis.

5
from 73% in the initial wave of the research to 79% in the most recent survey (see
Table 5.1). This was due to increases in both primary and post-primary sector
implementing break time policies. However, again primary school principals were
more likely to indicate that they had a break time policy in their school, compared to
post-primary (for example, in 2012, this was 97% and 49% respectively; p<.001).
In 2012, there was an increased number of principals who indicated their school
banned high sugar carbonated drinks, compared to the 2008 baseline research7,
(73% in 2008 increasing to 79% in 2012), however, again these policies were found
to be more prevalent in primary schools (90%) than post-primaries (64%) (p<.001).
Nevertheless, of concern, the proportion of schools with a no chocolate, crisps or
sweets policy decreased between 2008 and 2012, falling from 61% to 53% (see
Table 5.1, page 4).
Food sources
As part of this research, food outlets available to primary and post-primary children
were explored. It was found that vending machines and tuck shops were more
common in post-primaries, despite declines in their numbers since 2008 (see
Table 5.2, page 6).
Data collected from school principals who participated in the research showed that
tuck shops were more than twice as common in post-primary schools compared to
primary schools (16% and 6% respectively). In contrast, only 2% of the primary
school principals who took part in the research indicated that their school had a
vending machine, compared to 43% of those in post-primaries.
Another potential source of food for children were fast food outlets. In 2012, one in
four (25%) post-primary principals indicated there was a fast food outlet near their
school – nearly double that of 2008 (13%), a pertinent issue given that 7% of schools
within this sample allow children off site during school hours.
7 Gilmore G, Gossrau-Breen D, MacDonald L, Taylor L and McGowan L. School food: top marks. A summary
report on food in schools research in Northern Ireland. Public Health Agency, Belfast 2010. Available at: http://www.publichealth.hscni.net/sites/default/files/Top%20marks%20summary%20report.pdf. Accessed 18 July 2013.
6
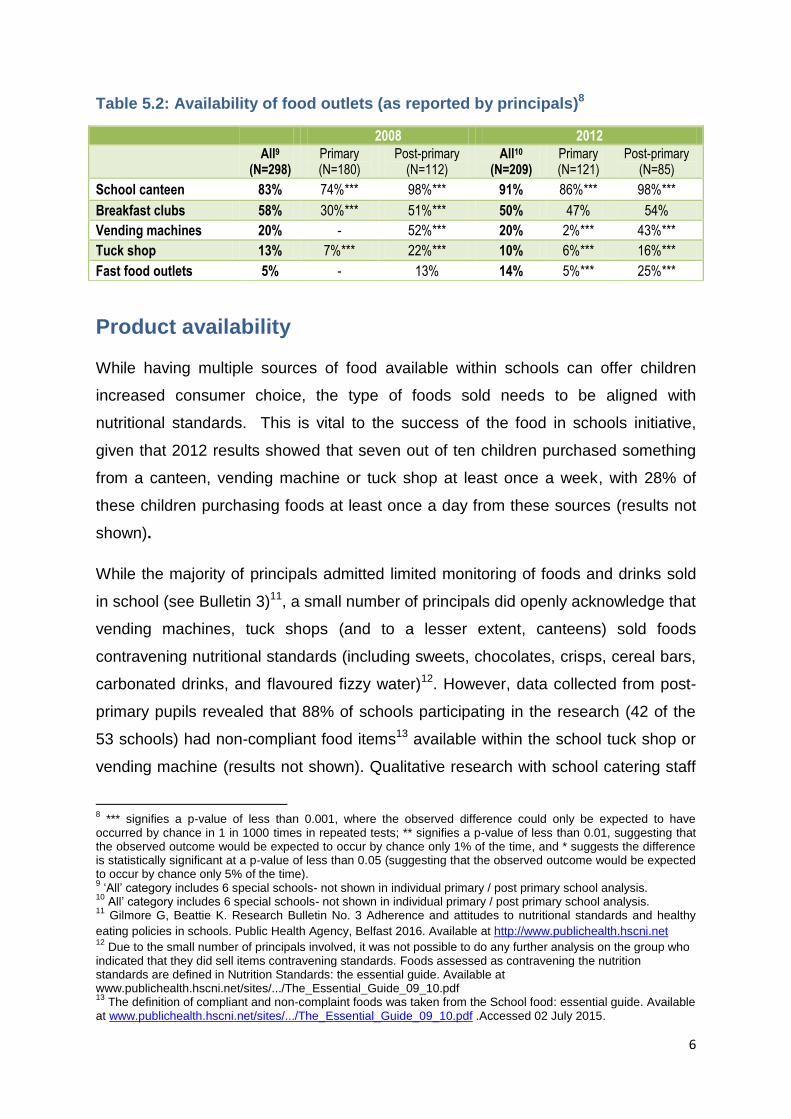
Table 5.2: Availability of food outlets (as reported by principals)8
Product availability
While having multiple sources of food available within schools can offer children
increased consumer choice, the type of foods sold needs to be aligned with
nutritional standards. This is vital to the success of the food in schools initiative,
given that 2012 results showed that seven out of ten children purchased something
from a canteen, vending machine or tuck shop at least once a week, with 28% of
these children purchasing foods at least once a day from these sources (results not
shown).
While the majority of principals admitted limited monitoring of foods and drinks sold
in school (see Bulletin 3)11, a small number of principals did openly acknowledge that
vending machines, tuck shops (and to a lesser extent, canteens) sold foods
contravening nutritional standards (including sweets, chocolates, crisps, cereal bars,
carbonated drinks, and flavoured fizzy water)12. However, data collected from post-
primary pupils revealed that 88% of schools participating in the research (42 of the
53 schools) had non-compliant food items13 available within the school tuck shop or
vending machine (results not shown). Qualitative research with school catering staff
8 *** signifies a p-value of less than 0.001, where the observed difference could only be expected to have
occurred by chance in 1 in 1000 times in repeated tests; ** signifies a p-value of less than 0.01, suggesting that the observed outcome would be expected to occur by chance only 1% of the time, and * suggests the difference is statistically significant at a p-value of less than 0.05 (suggesting that the observed outcome would be expected to occur by chance only 5% of the time). 9 ‘All’ category includes 6 special schools- not shown in individual primary / post primary school analysis.
10 All’ category includes 6 special schools- not shown in individual primary / post primary school analysis.
11 Gilmore G, Beattie K. Research Bulletin No. 3 Adherence and attitudes to nutritional standards and healthy
eating policies in schools. Public Health Agency, Belfast 2016. Available at http://www.publichealth.hscni.net 12
Due to the small number of principals involved, it was not possible to do any further analysis on the group who indicated that they did sell items contravening standards. Foods assessed as contravening the nutrition standards are defined in Nutrition Standards: the essential guide. Available at www.publichealth.hscni.net/sites/.../The_Essential_Guide_09_10.pdf 13
The definition of compliant and non-complaint foods was taken from the School food: essential guide. Available at www.publichealth.hscni.net/sites/.../The_Essential_Guide_09_10.pdf .Accessed 02 July 2015.
2008 2012
All9
(N=298) Primary (N=180)
Post-primary (N=112)
All10 (N=209)
Primary (N=121)
Post-primary (N=85)
School canteen 83% 74%*** 98%*** 91% 86%*** 98%***
Breakfast clubs 58% 30%*** 51%*** 50% 47% 54%
Vending machines 20% - 52%*** 20% 2%*** 43%***
Tuck shop 13% 7%*** 22%*** 10% 6%*** 16%***
Fast food outlets 5% - 13% 14% 5%*** 25%***

7
“Our school has a tuck shop where children can go and buy Mars bars and sweets, anything they like really, so we, we are very much up against it here… Parents are giving their children money for the canteen and it is all being spent in the tuck shop!” Interview; school catering manager, North Eastern ELB.2
and managers also indicated that the sale of non-compliant foods and drinks was
widespread in school tuck shops and vending machines.
Although 13% of post-primary pupils said they had
purchased healthier food from the tuck shop, this
rose to 25% who said they frequently bought
unhealthier food items, such as sweets, chocolate
and crisps (see Figure 5.1). The disparity
between sales of compliant and non-compliant
foodstuffs was more marked in vending
machines.14 Just 7% of post-primary pupils said they bought healthier foods and
snacks from vending machines, whilst almost one in five (19%) frequently purchased
items high in sugar or fat, like crisps or chocolate. More than one in five (21%)
frequently bought non-compliant drinks from vending machines with one in eight
(13%) of post-primary pupils maintaining they frequently purchased non-compliant
drinks from their school tuck shop.
Catering staff explained that the prevalence of non-compliant food and drinks items
in school had a profoundly negative impact on the successful implementation of the
nutritional standards. Caterers believed the availability and prevalence of these
foods in tuck shops and vending machines reduced demand for school meals and
other foods sold in the canteen, where children were restricted to foods compliant
with the nutritional standards - i.e. no sweets, chocolate etc. (See Research Bulletin
No. 6).15
14
The definition of compliant and non-complaint foods was taken from the School food: essential guide. Available at www.publichealth.hscni.net/sites/.../The_Essential_Guide_09_10.pdf Accessed 02 July 2015 15
Beattie K, Gilmore G. Research Bulletin No. 6: Uptake and factors impacting on demand for school meals. Public Health Agency, Belfast 2016. Available at http://www.publichealth.hscni.net

8
Figure 5.1 Compliant and non-compliant items purchased by post-primary children from tuck shops and vending machines in 2012 (N=2164)
Break time consumption
Children were asked to record what they ate and drank at break time, and findings
were grouped into foods and drinks that were compliant or non-compliant with the
nutritional standards. Findings suggest that, compared with 4 years ago, children in
primary and post-primary schools are now eating fewer unhealthier snacks
and having healthier foods more frequently at break time, although the change
is more marked amongst primary children (See Table 5.3, page 9).
In primary schools, children’s consumption of non-compliant food items decreased
from 44% in 2008, to 30% in 2012 (p<.001). Moreover, post-primary pupils also
appeared to be eating fewer unhealthier food items such as crisps, chocolate and
sweets for break, with consumption of non-compliant snacks decreasing from 58% in
2008 to 53% in 2012 (p<.001).
In both years of the research, primary school children consumed more
compliant food and drinks items (such as fruit, bread, toast or pancakes) than
non-compliant, 73% and 30% respectively. In contrast, post-primary children
consumed more non-compliant than compliant foods (53% and 48%
respectively).16
16
It was not possible to conduct tests of statistical significance.
13
7
25
19
14
29
13
21
0
5
10
15
20
25
30
35
Tuck shop Vending machine
%
Compliant foods
Non-compliant foods
Compliant drinks
Non-compliant drinks

9
Table 5.3 Types of food and drinks consumed by pupils at break time17
2008 2012 2008 2012
Primary
(N=1126)
Primary
(N=1138)
Post-primary
(N=2148)
Post-primary
(N=2164)
Compliant food 72% 73% 44%* 48%*
Non-compliant food 44%*** 30%*** 58%** 53%**
Compliant drinks 68% 70% 56% 57%
Non-compliant drinks 18%** 13%** 28% 30%
Of concern, the most recent research data show 15% of primary school children and
19% of post primary school children report having nothing to eat at break, while 23%
and 26% of primary and post primary children have nothing to drink at break. Overall
10% of post-primary and 7% of primary school children have nothing to eat or
drink at morning break (see Table 5.4).
Table 5.4 Proportion of pupils who don't eat or drink at break time in school17
2008 2012 2008 2012
Primary (N=1126)
Primary (N=1138)
Post-primary (N=2148)
Post-primary (N=2164)
Don’t eat anything 12%* 15%* 19% 19%
Don’t drink anything 22% 23% 25% 26%
Don’t eat or drink anything 6% 7% 9% 10%
Moreover, the data revealed a clear gradient according to the relative
deprivation status of the school, as measured by the proportion of pupils at
the school with a free school meal entitlement (FSME), and likelihood of not
having anything to eat or drink at break time. Children attending post-primary
schools in the most deprived group (i.e. those with 40.1% + FSME) were more than
twice as likely not to have anything to eat or drink at break in comparison with
children attending schools with lower FSME ratios: 8% of post-primary children in the
least deprived schools usually didn’t get anything for break time, increasing to 17%
of children attending schools in the most deprived quartile (p<.01) (see Figure 5.2).
17
*** signifies a p-value of less than 0.001, where the observed difference could only be expected to have occurred by chance in 1 in 1000 times in repeated tests; ** signifies a p-value of less than 0.01, suggesting that the observed outcome would be expected to occur by chance only 1% of the time, and * suggests the difference is statistically significant at a p-value of less than 0.05 (suggesting that the observed outcome would be expected to occur by chance only 5% of the time).

10
Figure 5.2 Post-primary children who do not usually eat or drink anything at break time according to school FSME (2012, N=2117)18
Break time sources of compliant and non-compliant items
Most non-compliant snacks and drinks consumed by both primary and non-
primary school children were brought into school from home (see Figure 5.3,
page 12). For example, less than one in ten (9%) primary school children who were
supplied with food items at break time by the school had snacks which did not
comply with nutritional standards. In comparison, those who brought food in from
home were more than four times as likely to have non-compliant items, with more
than two in five primary school children who brought break time items from home
having high fat or sugary snacks (42%; p<.001).
This was exacerbated as children got older, with post-primary children more likely
to bring in unhealthier items and less likely to bring in compliant items from
home than their primary school counterparts. For example, as mentioned above,
while 42% of primary children who brought food from home consumed items such as
crisps and chocolate, this increased to more than three-quarters (77%) of post-
primary pupils who brought break time snacks from home. This suggests there
18
*** signifies a p-value of less than 0.001, where the observed difference could only be expected to have
occurred by chance in 1 in 1000 times in repeated tests; ** signifies a p-value of less than 0.01, suggesting that the observed outcome would be expected to occur by chance only 1% of the time, and * suggests the difference is statistically significant at a p-value of less than 0.05 (suggesting that the observed outcome would be expected to occur by chance only 5% of the time).
8*** 9***
11***
17***
0
2
4
6
8
10
12
14
16
18
10% and less 10.1%-20.0% 20.1%-40.0% 40.1%+
Perc
en
tag
e c
hild
ren
wh
o d
o n
ot
eat
or
dri
nk a
nyth
ing
at
bre
kati
me (
%)
Free school meal entitlement (%)

11
should be greater engagement with parents – particularly parents of post-primary
pupils - in order to raise awareness of the impact of children’s consumption of foods
and drinks high in fat, sugars and salt. Moreover, it is suggested that parents should
be given information on healthier alternative break time snacks and drinks.
Children who purchased food outside school19 – for example, at newsagents,
garages or shops – were more likely to buy non-compliant food and drinks
compared to those who get their drinks and snacks from other sources. Three-
quarters (75%) of post-primary children who purchased food outside school had
items which were high in sugar, fats or salt, compared to 43% of those who
purchased or were given snacks from their school (p<.001). This finding, coupled
with that above relating to the types of snacks and drinks supplied to children by
parents, reiterates the need for robust school break time policy regarding the types
of foods and drinks allowed.
A higher proportion of post-primary children were sold non-compliant snacks
and drinks by their school itself than primary children. For example, although
fewer than one in ten (9%) primary school pupils who bought or were given a break
time snack in school had non-compliant food items, this increased to 43% of post-
primary pupils who subsequently consumed high fat, sugary or salty snacks.
Moreover, post-primary children who usually bought something in school were ten
times more likely than primary school pupils to have a fizzy or sugary drink at break
(33% compared to 3% respectively). This may in part be explained by the higher
prevalence of tuck shops and vending machines in post primaries (as reported by
principals and in qualitative research with school catering staff).
19
Only post-primary children were asked about buying food and drinks outside school.

12
Figure 5.3 Sources of compliant and non-compliant food and drinks items (2012)20
Lunch time food sources
While it is beyond the scope of this study to determine the actual foods children ate
at lunch time, this research did examine lunchtime food sources. Just over two out
of five (41%) parents indicated that their child took school meals most of the
time, whilst 44% said their child sometimes had school meals.21
Half (50%) of all parents said their child usually had a packed lunch, and slightly over
one in five said they sometimes gave their children a packed lunch. Although parents
suggested that packed lunches could ensure that their children were provided with
the types of foods they actually liked, school catering staff maintained the nutritional
content of some lunch boxes could be extremely poor, with some children simply
snacking on sweets, crisps and fizzy drinks rather than having a balanced meal.
Further information relating to packed lunches and school meals is discussed at
length in Research Bulletin No. 6.21
20
*** signifies a p-value of less than 0.001, where the observed difference could only be expected to have
occurred by chance in 1 in 1000 times in repeated tests; ** signifies a p-value of less than 0.01, suggesting that the observed outcome would be expected to occur by chance only 1% of the time, and * suggests the difference is statistically significant at a p-value of less than 0.05 (suggesting that the observed outcome would be expected to occur by chance only 5% of the time). 21
Research Bulletin No. 6 provides a fuller description of those who did and did not take school meals, and looks at some of the reasons behind choice of lunch. Beattie K, Gilmore G. Research Bulletin No. 6: Uptake and factors impacting on demand for school meals. Public Health Agency, Belfast 2016. Available at http://www.publichealth.hscni.net
85** 77**
68***
54***
34***
79* 72*
66** 62**
47**
9***
42*** 43***
77*** 75***
3***
16***
30*** 33***
62***
0
10
20
30
40
50
60
70
80
90
Primary; school(N=257)
Primary; home(N=693)
Post-primary; school(N=567)
Post-primary; home(N=890)
Post-primary; shops/cafes (N=128)
%
Compliant food Compliant drinks Non-compliant food Non-compliant drinks
13
However, given that over a third of parents (36%) reported their child (4% mostly or
32% sometimes) bought a snack for lunch from the tuck shop or vending machine,
schools should ensure these outlets are fully compliant with the standards for other
food in schools. Furthermore, 1 in 12 (8%) parents said their child got lunch either
sometimes (7%) or mostly (1%) from a shop outside school, for example a cafe or
chip shop. Given the high calorie and high fat foods typically sold in fast food outlets,
school implementation of on-site policies at lunchtimes could limit children’s access
to these outlets, and help facilitate full implementation of the nutritional standards.
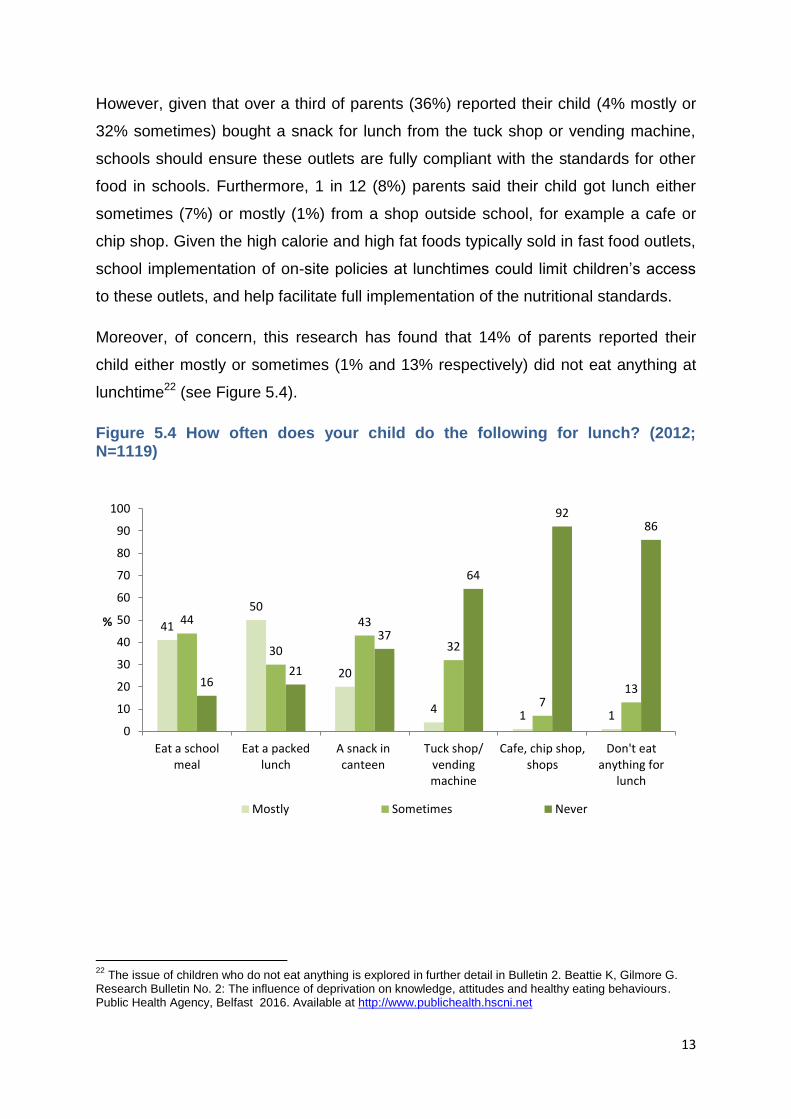
Moreover, of concern, this research has found that 14% of parents reported their
child either mostly or sometimes (1% and 13% respectively) did not eat anything at
lunchtime22 (see Figure 5.4).
Figure 5.4 How often does your child do the following for lunch? (2012; N=1119)
22
The issue of children who do not eat anything is explored in further detail in Bulletin 2. Beattie K, Gilmore G. Research Bulletin No. 2: The influence of deprivation on knowledge, attitudes and healthy eating behaviours. Public Health Agency, Belfast 2016. Available at http://www.publichealth.hscni.net
41
50
20
4 1 1
44
30
43
32
7 13
16 21
37
64
92 86
0
10
20
30
40
50
60
70
80
90
100
Eat a schoolmeal
Eat a packedlunch
A snack incanteen
Tuck shop/vendingmachine
Cafe, chip shop,shops
Don't eatanything for
lunch
%
Mostly Sometimes Never

14
Children’s lunch time food sources
In comparison to parents of primary school children, post-primary pupils’ parents
were:
more likely to say that their child ‘usually or sometimes’ took a packed lunch
(62% and 57% respectively; p<.001).
over seven times more likely to say their child ‘usually or sometimes’ bought their
lunch from school vending machine or tuck shop (52% post-primary and 7%
primary respectively; p<.001).
five times more likely to say their child had lunch from a chip shop or cafe, with
one in ten (10%) post-primary parents saying their child usually or sometimes
took this lunch option compared to only 2% of primary parents (p<.001).
three times more likely to say their child sometimes or usually did not have
anything to eat at lunchtime – 18% of parents recruited through post-primary
schools said their child did not eat anything whereas 6% of primary parents said
the same (p<.001) (see Figure 5.5).
Interestingly, parents of different socio-economic groups did not differ significantly in
whether they said that their child had lunch from the tuck shop/ vending machine, an
outside food venue (e.g. chip shop or cafe), or whether their child usually or
sometimes didn’t eat at lunch time.
Figure 5.5 Lunchtime sources of food according to primary and post-primary
parents23
23
*** signifies a p-value of less than 0.001, where the observed difference could only be expected to have
occurred by chance in 1 in 1000 times in repeated tests; ** signifies a p-value of less than 0.01, suggesting that the observed outcome would be expected to occur by chance only 1% of the time, and * suggests the difference is statistically significant at a p-value of less than 0.05 (suggesting that the observed outcome would be expected to occur by chance only 5% of the time).
57***
7*** 2*** 6***
62*** 52***
10*** 18***
0
20
40
60
80
Packed lunch Tuck shop/ vendingmachine
Cafe, chip shop, shops Don't eat anything forlunch
%
Primary (N=369) Post-primary (N=701)

15
Conclusion
The food children consume at break time has improved within the primary and
post-primary sector since the implementation of the food in schools programme.
Pupils are simultaneously eating more healthy foods, while consuming fewer high
fat, sugary or high salt items at break time. However, children in post-primary
schools are still consuming more non-compliant food and drinks items than their
primary school counterparts. This suggests a need for additional work in post-
primary schools.
Overall healthy eating practices appear to be most successful in primary schools.
However, primary schools were also most likely to have other individual school
policies to support pupils’ healthy eating; such as healthy breaks schemes, and
have more communication with key stakeholders (including parents) regarding
issues to do with school meals and nutrition in school. Children’s consumption of
unhealthier foods and drinks at break and lunch time could be stemmed through
the development and implementation of individual school policies and improved
communication. For example:
o Most of the unhealthier items consumed at break time came from home.
Moreover, this issue is particularly pertinent in post-primary schools.
Implementation of break time policies at a school level (with regional
guidance from the Food in Schools Forum and Public Health Agency (PHA)
on management and implementation) may help address this issue. Research
findings have shown that parents are supportive of school rules on healthy
eating; therefore regional healthy break schemes would have an immediate
impact on children’s food consumption (see Bulletin No. 3).24
o Caterers highlight many packed lunches brought from home are of poor
nutritional value. The Food in Schools Forum and PHA should consider
working with schools in order to provide parents and children – particularly
24
Gilmore G, Beattie K. Research Bulletin No. 3 Adherence and attitudes to nutritional standards and healthy
eating polices in schools. Public Health Agency, Belfast 2016. Available at http://www.publichealth.hscni.net

16
those in post-primary schools – with guidance as to healthy snacks and
recommendations for healthier foods and drinks for inclusion in lunch boxes.
Healthy pack lunch schemes or treat days could be integrated into schools to
limit the frequency or volume of unhealthier types of food in packed lunches.
o Parents and children (particularly in post-primary schools) bringing food into
schools that does not meet the nutritional standards detracts from a whole
school healthy eating ethos. This in turn undermines existing healthy eating
policies within schools and inhibits the development of other schemes, as
schools often need parental support in order for these schemes to work
effectively. This suggests that more emphasis should be put on intensively
engaging with parents, highlighting the importance of good nutrition and
promoting campaigns for healthy eating for children, and on improving
communication between schools and parents on issues and resources linked
to healthy eating.25
o Children in post-primaries were more likely than primary aged children to
source unhealthier drinks and snacks from school. This is possibly linked to
the popularity of tuck shops and vending machines in post-primary schools.
Schools need to be aware of the content of these outlets and ensure
provision of foods and drinks sold comply with the standards for other food
and drinks sold in schools. Currently the availability of non-compliant foods
within these outlets undermines the whole school approach necessary for
the successful implementation of the food in schools programme. In addition,
as discussed previously more robust monitoring of the types of foods and
drinks sold in schools needs to be put in place (Bulletin 3).26
o Another issue of concern is the rise in numbers of fast food outlets in close
proximity to post-primary schools. These outlets can encourage children to
consume high calorie drinks and foods at break or lunch. While the majority
of schools have on-site lunch and break time policies in place it is suggested
that all schools should adopt these, thereby limiting children’s access to fast
food outlets during the school day.
25
Gilmore G, Beattie K. Research Bulletin No. 4 Marketing the School food: top marks programme and healthy eating messages Public Health Agency, Belfast 2016. Available http://www.publichealth.hscni.net 26 Gilmore G, Beattie K. Research Bulletin No. 3 Adherence and attitudes to nutritional standards and healthy
eating polices in schools. Public Health Agency, Belfast 2016. Available at http://www.publichealth.hscni.net.

17
It is important for children to eat on a regular basis to meet their nutritional
requirements for growth. A proportion of children do not have anything to eat or
drink for break – particularly in schools with higher numbers of pupils who are
eligible for free school meals. A collective response is needed to address this
issue, and it is suggested that the Department of Education should work
alongside schools to emphasise the importance of eating a small healthy snack
at break time, and communicate this both to children and parents. Moreover,
the possibility of providing a free healthy break in schools with the highest ratios
of FSME should be explored.