THE INFLUENCE OF DIFFERENT STRESS STATES ON SOIL ...
12
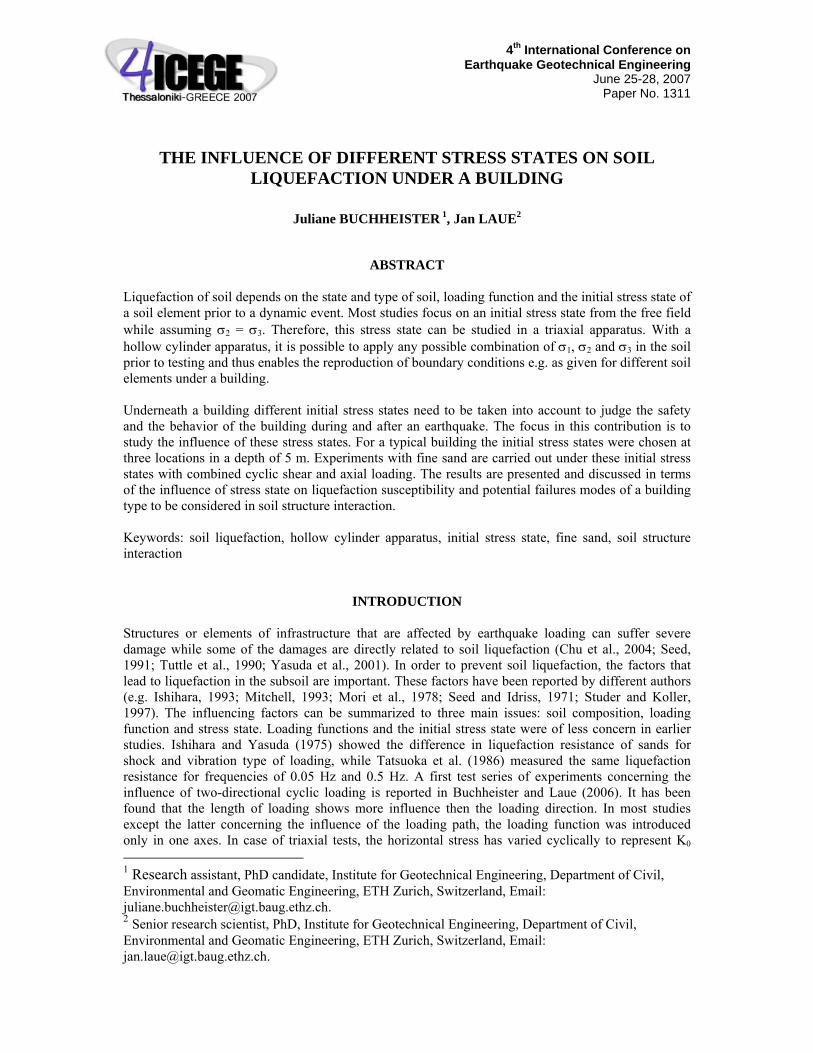
4 th International Conference on Earthquake Geotechnical Engineering June 25-28, 2007 Paper No. 1311 THE INFLUENCE OF DIFFERENT STRESS STATES ON SOIL LIQUEFACTION UNDER A BUILDING Juliane BUCHHEISTER 1 , Jan LAUE 2 ABSTRACT Liquefaction of soil depends on the state and type of soil, loading function and the initial stress state of a soil element prior to a dynamic event. Most studies focus on an initial stress state from the free field while assuming σ 2 = σ 3 . Therefore, this stress state can be studied in a triaxial apparatus. With a hollow cylinder apparatus, it is possible to apply any possible combination of σ 1 , σ 2 and σ 3 in the soil prior to testing and thus enables the reproduction of boundary conditions e.g. as given for different soil elements under a building. Underneath a building different initial stress states need to be taken into account to judge the safety and the behavior of the building during and after an earthquake. The focus in this contribution is to study the influence of these stress states. For a typical building the initial stress states were chosen at three locations in a depth of 5 m. Experiments with fine sand are carried out under these initial stress states with combined cyclic shear and axial loading. The results are presented and discussed in terms of the influence of stress state on liquefaction susceptibility and potential failures modes of a building type to be considered in soil structure interaction. Keywords: soil liquefaction, hollow cylinder apparatus, initial stress state, fine sand, soil structure interaction INTRODUCTION Structures or elements of infrastructure that are affected by earthquake loading can suffer severe damage while some of the damages are directly related to soil liquefaction (Chu et al., 2004; Seed, 1991; Tuttle et al., 1990; Yasuda et al., 2001). In order to prevent soil liquefaction, the factors that lead to liquefaction in the subsoil are important. These factors have been reported by different authors (e.g. Ishihara, 1993; Mitchell, 1993; Mori et al., 1978; Seed and Idriss, 1971; Studer and Koller, 1997). The influencing factors can be summarized to three main issues: soil composition, loading function and stress state. Loading functions and the initial stress state were of less concern in earlier studies. Ishihara and Yasuda (1975) showed the difference in liquefaction resistance of sands for shock and vibration type of loading, while Tatsuoka et al. (1986) measured the same liquefaction resistance for frequencies of 0.05 Hz and 0.5 Hz. A first test series of experiments concerning the influence of two-directional cyclic loading is reported in Buchheister and Laue (2006). It has been found that the length of loading shows more influence then the loading direction. In most studies except the latter concerning the influence of the loading path, the loading function was introduced only in one axes. In case of triaxial tests, the horizontal stress has varied cyclically to represent K 0 1 Research assistant, PhD candidate, Institute for Geotechnical Engineering, Department of Civil, Environmental and Geomatic Engineering, ETH Zurich, Switzerland, Email: [email protected]. 2 Senior research scientist, PhD, Institute for Geotechnical Engineering, Department of Civil, Environmental and Geomatic Engineering, ETH Zurich, Switzerland, Email: [email protected].
Transcript of THE INFLUENCE OF DIFFERENT STRESS STATES ON SOIL ...
4th International Conference on Earthquake Geotechnical Engineering
June 25-28, 2007 Paper No. 1311
THE INFLUENCE OF DIFFERENT STRESS STATES ON SOIL LIQUEFACTION UNDER A BUILDING
Juliane BUCHHEISTER 1, Jan LAUE2
ABSTRACT Liquefaction of soil depends on the state and type of soil, loading function and the initial stress state of a soil element prior to a dynamic event. Most studies focus on an initial stress state from the free field while assuming σ2 = σ3. Therefore, this stress state can be studied in a triaxial apparatus. With a hollow cylinder apparatus, it is possible to apply any possible combination of σ1, σ2 and σ3 in the soil prior to testing and thus enables the reproduction of boundary conditions e.g. as given for different soil elements under a building. Underneath a building different initial stress states need to be taken into account to judge the safety and the behavior of the building during and after an earthquake. The focus in this contribution is to study the influence of these stress states. For a typical building the initial stress states were chosen at three locations in a depth of 5 m. Experiments with fine sand are carried out under these initial stress states with combined cyclic shear and axial loading. The results are presented and discussed in terms of the influence of stress state on liquefaction susceptibility and potential failures modes of a building type to be considered in soil structure interaction. Keywords: soil liquefaction, hollow cylinder apparatus, initial stress state, fine sand, soil structure interaction
INTRODUCTION Structures or elements of infrastructure that are affected by earthquake loading can suffer severe damage while some of the damages are directly related to soil liquefaction (Chu et al., 2004; Seed, 1991; Tuttle et al., 1990; Yasuda et al., 2001). In order to prevent soil liquefaction, the factors that lead to liquefaction in the subsoil are important. These factors have been reported by different authors (e.g. Ishihara, 1993; Mitchell, 1993; Mori et al., 1978; Seed and Idriss, 1971; Studer and Koller, 1997). The influencing factors can be summarized to three main issues: soil composition, loading function and stress state. Loading functions and the initial stress state were of less concern in earlier studies. Ishihara and Yasuda (1975) showed the difference in liquefaction resistance of sands for shock and vibration type of loading, while Tatsuoka et al. (1986) measured the same liquefaction resistance for frequencies of 0.05 Hz and 0.5 Hz. A first test series of experiments concerning the influence of two-directional cyclic loading is reported in Buchheister and Laue (2006). It has been found that the length of loading shows more influence then the loading direction. In most studies except the latter concerning the influence of the loading path, the loading function was introduced only in one axes. In case of triaxial tests, the horizontal stress has varied cyclically to represent K0 1 Research assistant, PhD candidate, Institute for Geotechnical Engineering, Department of Civil, Environmental and Geomatic Engineering, ETH Zurich, Switzerland, Email: [email protected]. 2 Senior research scientist, PhD, Institute for Geotechnical Engineering, Department of Civil, Environmental and Geomatic Engineering, ETH Zurich, Switzerland, Email: [email protected].
conditions under loading and changes between compression and extension cycles are possible. Nevertheless, this allows only a limited variation of the loading function. In this paper the influence of the initial stress state is investigated in terms of two directional hollow cylinder experiments on fine sand. A change in principal stresses results in a reduction of the liquefaction resistance, which was found out by Yamada and Ishihara (1983) in triaxial tests on sand by changing the stress paths from the straight-line to the circle. In triaxial torsional shear tests it was shown that the cyclic strength is reduced if the principal stress axes are rotated (Ishihara and Towhata, 1983). Pradel et al. (1990) and Gutierrez et al. (1991) pointed out that the plastic principal strain depends on the stress increment direction, which has been confirmed by studies from Wichtmann (2005). Yoshimine et al. (1998) investigated the effects of principal stress direction showing a greater pore water development for a large inclination of the main principal stress and a large intermediate principal stress independent of the density. Fewer studies focus on the influence of a shear force prior the earthquake loading overlaying K0 conditions. Vaid and Chern (1983) concluded that the presence of static shear does not necessarily lead to an increased resistance to liquefaction or cyclic strain development whereas Haeri and Khosh (2006) showed a decrease in liquefaction resistance depending on the confining pressure with the presence of shear stress. Depending on the initial stress conditions the liquefaction resistance can be increased or decreased (Higuchi, 2001).
HOLLOW CYLINDER APPARATUS
The test apparatus used in this study is the Hollow Cylinder Apparatus (HCA) of the Institute for Geotechnical Engineering. With this HCA it is possible to apply two directional cyclic loading in axial and torsional direction simultaneous and control all stresses independently (in direction and magnitude). The used specimen is 200 mm high and has an outer diameter of 100 mm and an inner diameter of 50 mm respectively. An introduction into the test device can be found in Buchheister and Laue (2006). A detailed description will be given in Laue et al. (2007).
MATERIAL PROPERTIES
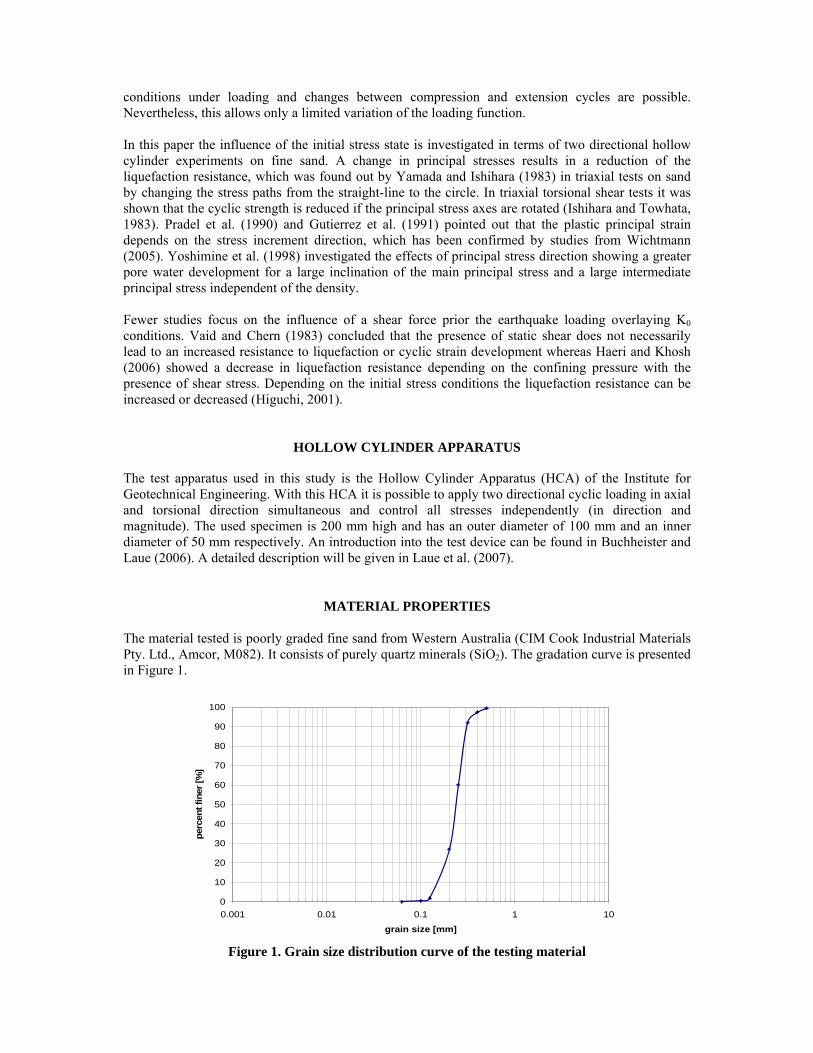
The material tested is poorly graded fine sand from Western Australia (CIM Cook Industrial Materials Pty. Ltd., Amcor, M082). It consists of purely quartz minerals (SiO2). The gradation curve is presented in Figure 1.
0
10
20
30
40
50
60
70
80
90
100
0.001 0.01 0.1 1 10
grain size [mm]
perc
ent f
iner
[%]
Figure 1. Grain size distribution curve of the testing material
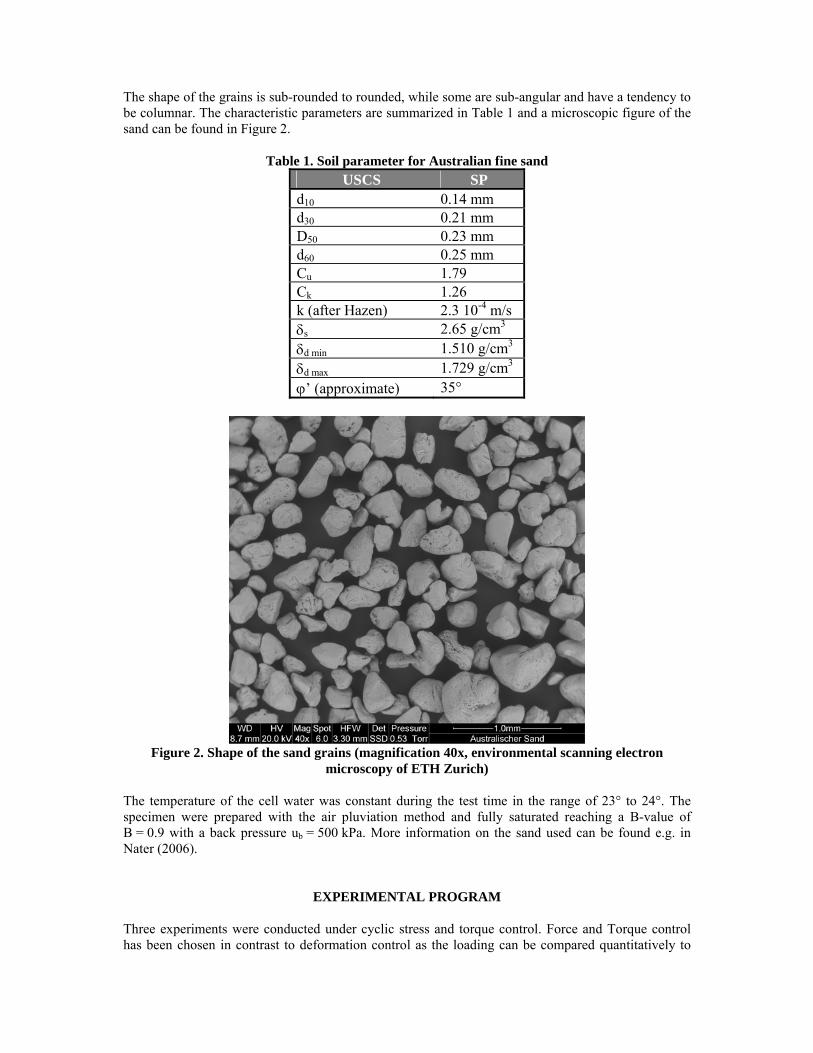
The shape of the grains is sub-rounded to rounded, while some are sub-angular and have a tendency to be columnar. The characteristic parameters are summarized in Table 1 and a microscopic figure of the sand can be found in Figure 2.
Table 1. Soil parameter for Australian fine sand
USCS SP d10 0.14 mm d30 0.21 mm D50 0.23 mm d60 0.25 mm Cu 1.79 Ck 1.26 k (after Hazen) 2.3 10-4 m/s δs 2.65 g/cm3 δd min 1.510 g/cm3 δd max 1.729 g/cm3 ϕ’ (approximate) 35°
Figure 2. Shape of the sand grains (magnification 40x, environmental scanning electron
microscopy of ETH Zurich) The temperature of the cell water was constant during the test time in the range of 23° to 24°. The specimen were prepared with the air pluviation method and fully saturated reaching a B-value of B = 0.9 with a back pressure ub = 500 kPa. More information on the sand used can be found e.g. in Nater (2006).
EXPERIMENTAL PROGRAM Three experiments were conducted under cyclic stress and torque control. Force and Torque control has been chosen in contrast to deformation control as the loading can be compared quantitatively to
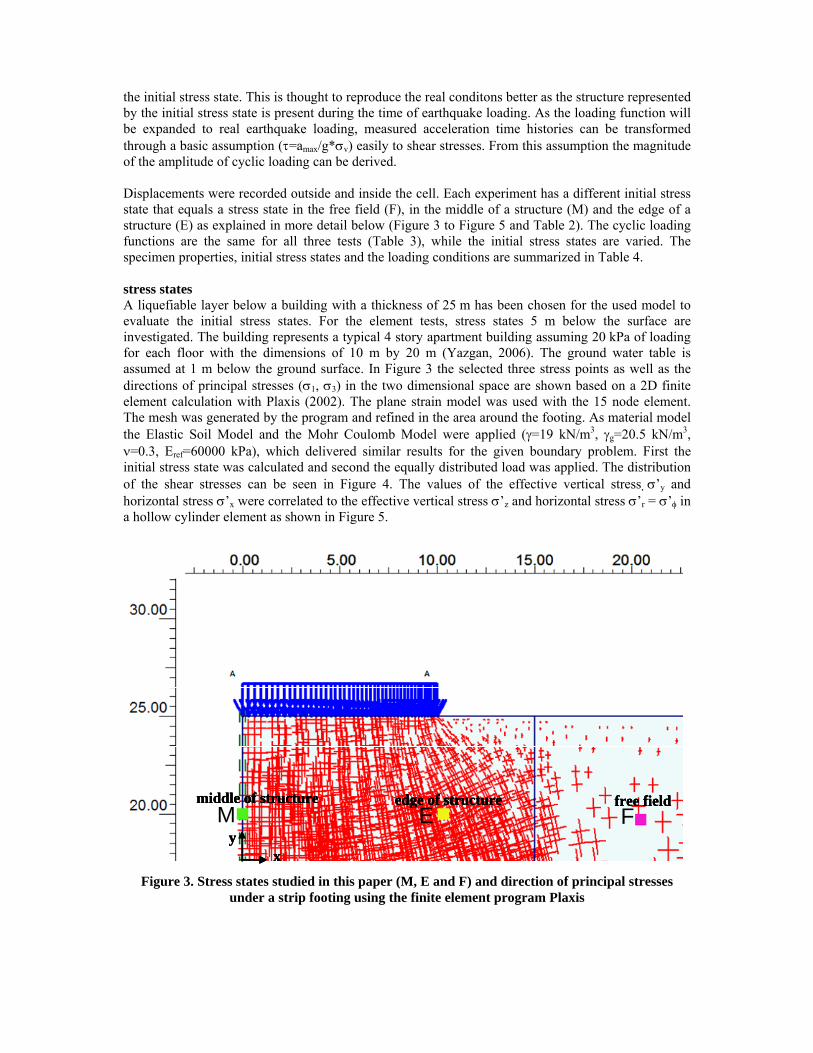
the initial stress state. This is thought to reproduce the real conditons better as the structure represented by the initial stress state is present during the time of earthquake loading. As the loading function will be expanded to real earthquake loading, measured acceleration time histories can be transformed through a basic assumption (τ=amax/g*σv) easily to shear stresses. From this assumption the magnitude of the amplitude of cyclic loading can be derived. Displacements were recorded outside and inside the cell. Each experiment has a different initial stress state that equals a stress state in the free field (F), in the middle of a structure (M) and the edge of a structure (E) as explained in more detail below (Figure 3 to Figure 5 and Table 2). The cyclic loading functions are the same for all three tests (Table 3), while the initial stress states are varied. The specimen properties, initial stress states and the loading conditions are summarized in Table 4. stress states A liquefiable layer below a building with a thickness of 25 m has been chosen for the used model to evaluate the initial stress states. For the element tests, stress states 5 m below the surface are investigated. The building represents a typical 4 story apartment building assuming 20 kPa of loading for each floor with the dimensions of 10 m by 20 m (Yazgan, 2006). The ground water table is assumed at 1 m below the ground surface. In Figure 3 the selected three stress points as well as the directions of principal stresses (σ1, σ3) in the two dimensional space are shown based on a 2D finite element calculation with Plaxis (2002). The plane strain model was used with the 15 node element. The mesh was generated by the program and refined in the area around the footing. As material model the Elastic Soil Model and the Mohr Coulomb Model were applied (γ=19 kN/m3, γg=20.5 kN/m3, ν=0.3, Eref=60000 kPa), which delivered similar results for the given boundary problem. First the initial stress state was calculated and second the equally distributed load was applied. The distribution of the shear stresses can be seen in Figure 4. The values of the effective vertical stress σ’y and horizontal stress σ’x were correlated to the effective vertical stress σ’z and horizontal stress σ’r = σ’φ in a hollow cylinder element as shown in Figure 5.
free fieldmiddle of structure edge of structure
yx
free fieldmiddle of structure edge of structure
yx
free fieldmiddle of structure edge of structure
yx
free fieldmiddle of structure edge of structure
yx
M E Ffree fieldmiddle of structure edge of structure
yx
free fieldmiddle of structure edge of structure
yx
free fieldmiddle of structure edge of structure
yx
free fieldmiddle of structure edge of structure
yx
M E F
Figure 3. Stress states studied in this paper (M, E and F) and direction of principal stresses
under a strip footing using the finite element program Plaxis
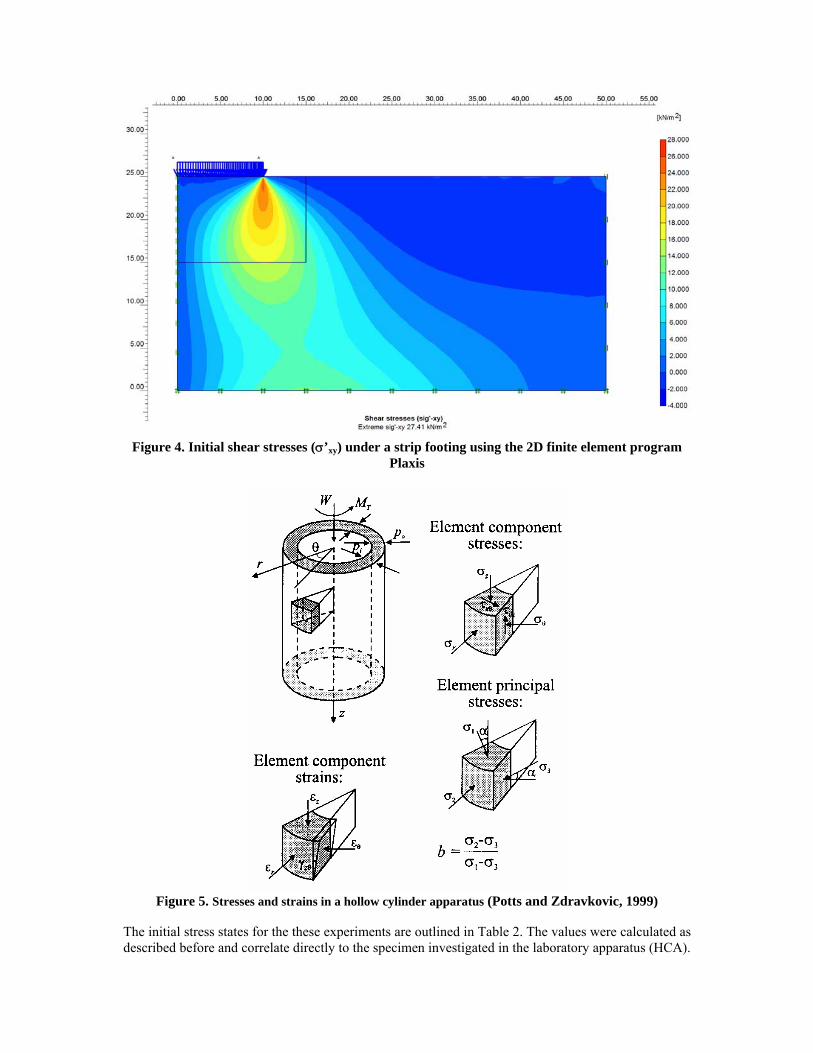
Figure 4. Initial shear stresses (σ’xy) under a strip footing using the 2D finite element program
Plaxis
Figure 5. Stresses and strains in a hollow cylinder apparatus (Potts and Zdravkovic, 1999)
The initial stress states for the these experiments are outlined in Table 2. The values were calculated as described before and correlate directly to the specimen investigated in the laboratory apparatus (HCA).
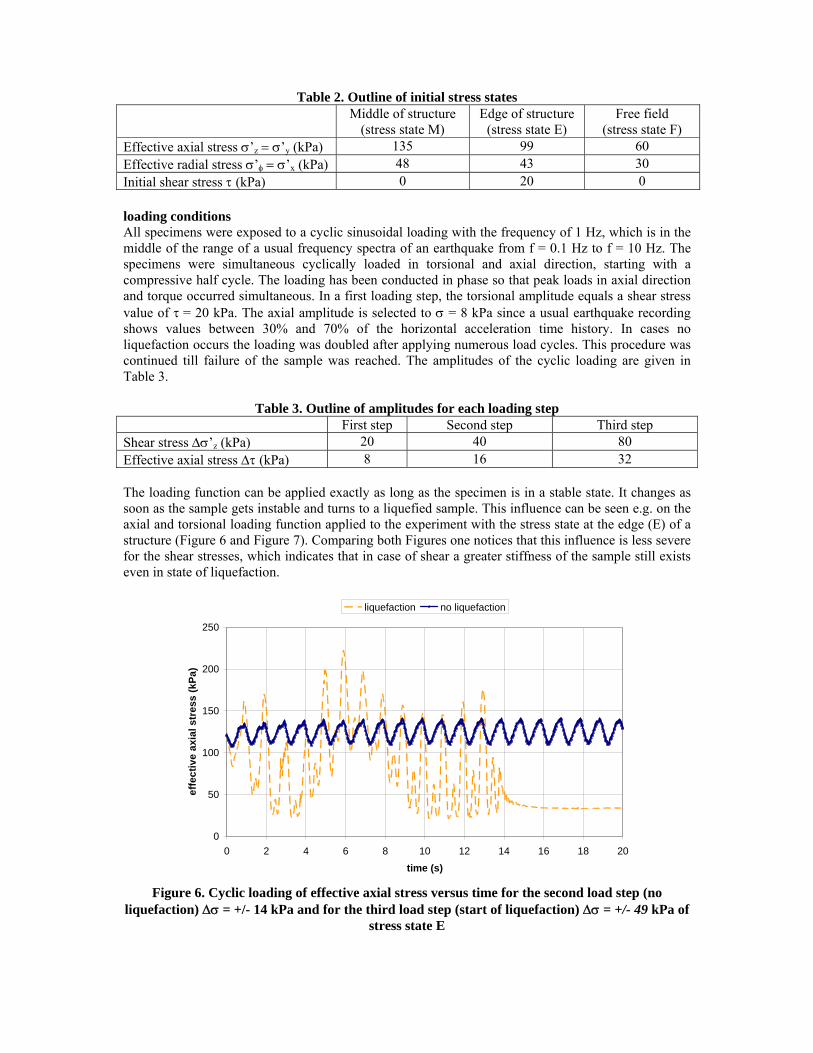
Table 2. Outline of initial stress states Middle of structure
(stress state M) Edge of structure
(stress state E) Free field
(stress state F) Effective axial stress σ’z = σ’y (kPa) 135 99 60 Effective radial stress σ’φ = σ’x (kPa) 48 43 30 Initial shear stress τ (kPa) 0 20 0 loading conditions All specimens were exposed to a cyclic sinusoidal loading with the frequency of 1 Hz, which is in the middle of the range of a usual frequency spectra of an earthquake from f = 0.1 Hz to f = 10 Hz. The specimens were simultaneous cyclically loaded in torsional and axial direction, starting with a compressive half cycle. The loading has been conducted in phase so that peak loads in axial direction and torque occurred simultaneous. In a first loading step, the torsional amplitude equals a shear stress value of τ = 20 kPa. The axial amplitude is selected to σ = 8 kPa since a usual earthquake recording shows values between 30% and 70% of the horizontal acceleration time history. In cases no liquefaction occurs the loading was doubled after applying numerous load cycles. This procedure was continued till failure of the sample was reached. The amplitudes of the cyclic loading are given in Table 3.
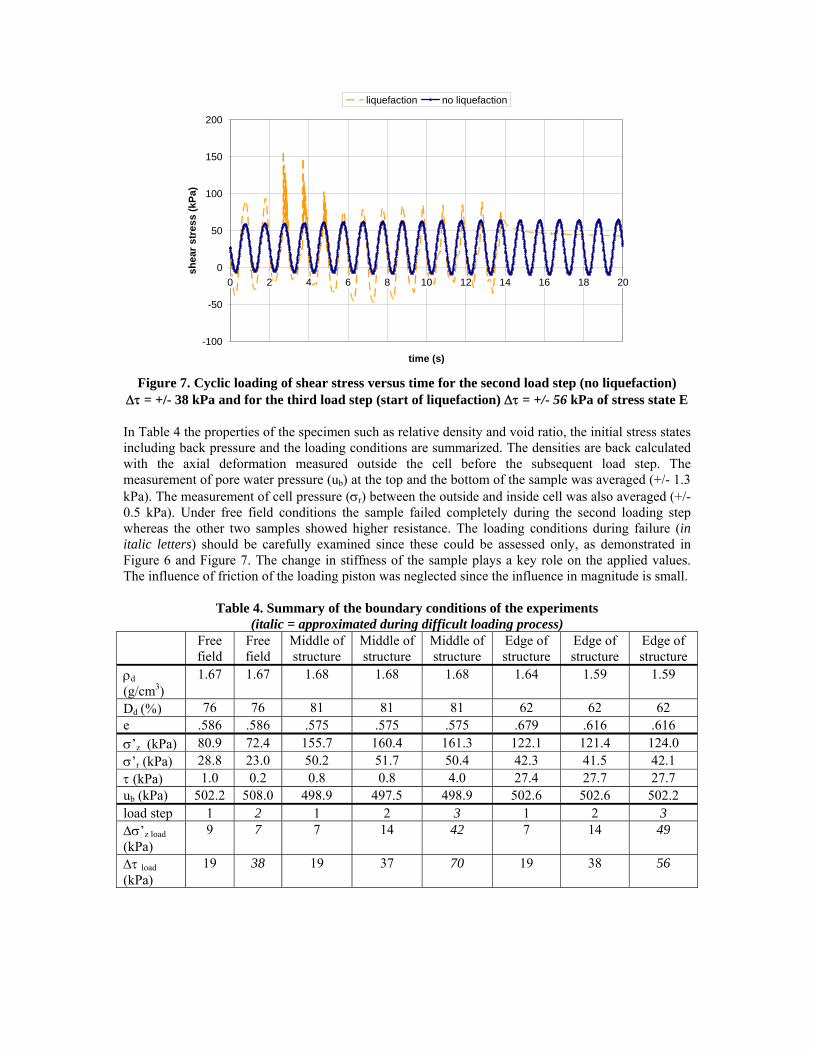
Table 3. Outline of amplitudes for each loading step First step Second step Third step Shear stress Δσ’z (kPa) 20 40 80 Effective axial stress Δτ (kPa) 8 16 32 The loading function can be applied exactly as long as the specimen is in a stable state. It changes as soon as the sample gets instable and turns to a liquefied sample. This influence can be seen e.g. on the axial and torsional loading function applied to the experiment with the stress state at the edge (E) of a structure (Figure 6 and Figure 7). Comparing both Figures one notices that this influence is less severe for the shear stresses, which indicates that in case of shear a greater stiffness of the sample still exists even in state of liquefaction.
0
50
100
150
200
250
0 2 4 6 8 10 12 14 16 18 20
time (s)
effe
ctiv
e ax
ial s
tres
s (k
Pa)
liquefaction no liquefaction
Figure 6. Cyclic loading of effective axial stress versus time for the second load step (no
liquefaction) Δσ = +/- 14 kPa and for the third load step (start of liquefaction) Δσ = +/- 49 kPa of stress state E
-100
-50
0
50
100
150
200
0 2 4 6 8 10 12 14 16 18 20
time (s)
shea
r str
ess
(kPa
)
liquefaction no liquefaction
Figure 7. Cyclic loading of shear stress versus time for the second load step (no liquefaction)
Δτ = +/- 38 kPa and for the third load step (start of liquefaction) Δτ = +/- 56 kPa of stress state E
In Table 4 the properties of the specimen such as relative density and void ratio, the initial stress states including back pressure and the loading conditions are summarized. The densities are back calculated with the axial deformation measured outside the cell before the subsequent load step. The measurement of pore water pressure (ub) at the top and the bottom of the sample was averaged (+/- 1.3 kPa). The measurement of cell pressure (σr) between the outside and inside cell was also averaged (+/- 0.5 kPa). Under free field conditions the sample failed completely during the second loading step whereas the other two samples showed higher resistance. The loading conditions during failure (in italic letters) should be carefully examined since these could be assessed only, as demonstrated in Figure 6 and Figure 7. The change in stiffness of the sample plays a key role on the applied values. The influence of friction of the loading piston was neglected since the influence in magnitude is small.
Table 4. Summary of the boundary conditions of the experiments (italic = approximated during difficult loading process)
Free field
Free field
Middle of structure
Middle of structure
Middle of structure
Edge of structure
Edge of structure
Edge of structure
ρd (g/cm3)
1.67 1.67 1.68 1.68 1.68 1.64 1.59 1.59
Dd (%) 76 76 81 81 81 62 62 62 e .586 .586 .575 .575 .575 .679 .616 .616 σ’z (kPa) 80.9 72.4 155.7 160.4 161.3 122.1 121.4 124.0 σ’r (kPa) 28.8 23.0 50.2 51.7 50.4 42.3 41.5 42.1 τ (kPa) 1.0 0.2 0.8 0.8 4.0 27.4 27.7 27.7 ub (kPa) 502.2 508.0 498.9 497.5 498.9 502.6 502.6 502.2 load step 1 2 1 2 3 1 2 3 Δσ’z load (kPa)
9 7 7 14 42 7 14 49
Δτ load (kPa)
19 38 19 37 70 19 38 56
RESULTS AND DISCUSSION OF HCA EXPERIMENTS
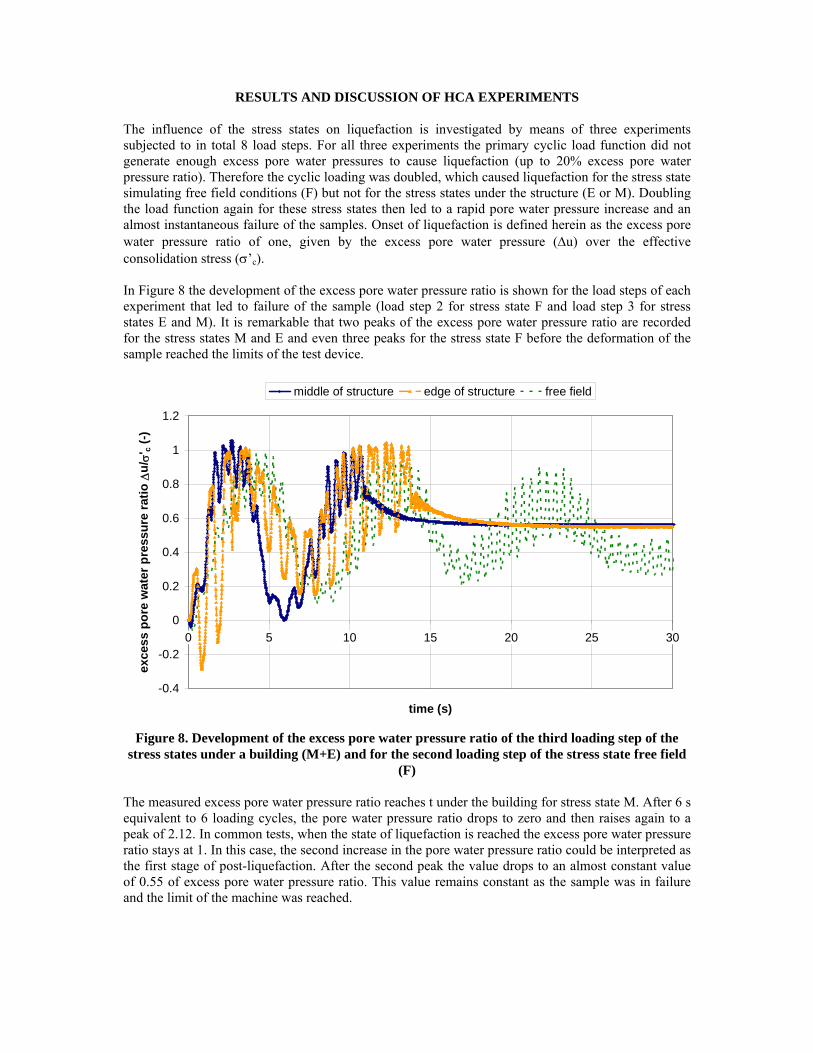
The influence of the stress states on liquefaction is investigated by means of three experiments subjected to in total 8 load steps. For all three experiments the primary cyclic load function did not generate enough excess pore water pressures to cause liquefaction (up to 20% excess pore water pressure ratio). Therefore the cyclic loading was doubled, which caused liquefaction for the stress state simulating free field conditions (F) but not for the stress states under the structure (E or M). Doubling the load function again for these stress states then led to a rapid pore water pressure increase and an almost instantaneous failure of the samples. Onset of liquefaction is defined herein as the excess pore water pressure ratio of one, given by the excess pore water pressure (Δu) over the effective consolidation stress (σ’c). In Figure 8 the development of the excess pore water pressure ratio is shown for the load steps of each experiment that led to failure of the sample (load step 2 for stress state F and load step 3 for stress states E and M). It is remarkable that two peaks of the excess pore water pressure ratio are recorded for the stress states M and E and even three peaks for the stress state F before the deformation of the sample reached the limits of the test device.
-0.4
-0.2
0
0.2
0.4
0.6
0.8
1
1.2
0 5 10 15 20 25 30
time (s)
exce
ss p
ore
wat
er p
ress
ure
ratio
Δu/
σ'c (
-)
middle of structure edge of structure free field
Figure 8. Development of the excess pore water pressure ratio of the third loading step of the
stress states under a building (M+E) and for the second loading step of the stress state free field (F)
The measured excess pore water pressure ratio reaches t under the building for stress state M. After 6 s equivalent to 6 loading cycles, the pore water pressure ratio drops to zero and then raises again to a peak of 2.12. In common tests, when the state of liquefaction is reached the excess pore water pressure ratio stays at 1. In this case, the second increase in the pore water pressure ratio could be interpreted as the first stage of post-liquefaction. After the second peak the value drops to an almost constant value of 0.55 of excess pore water pressure ratio. This value remains constant as the sample was in failure and the limit of the machine was reached.
0
0.5
1
1.5
2
2.5
0 50 100 150 200 250 300
time (s)
axia
l and
she
ar s
trai
n (%
)
eta axial (SA) (%) gamma (SA) (%)eta axial (SA) sample (%) gamma (SA) sample (%)
20% axial strain at sample
24% shear strain at sample
Figure 9. Axial and shear strains measured at the middle of the specimen height compared to the
strains measured outside the cell for the second loading step for the stress state ‘edge of structure’ (E)
0
0.5
1
1.5
2
2.5
3
3.5
Load step 1 Load step 2 Load step 1 Load step 2
stress state M stress state M stress state E stress state E
axia
l str
ain
(%)
sample total
Figure 10. Axial strains measured at the middle of the specimen height compared to the ones
measured outside the cell for the stress state M and E
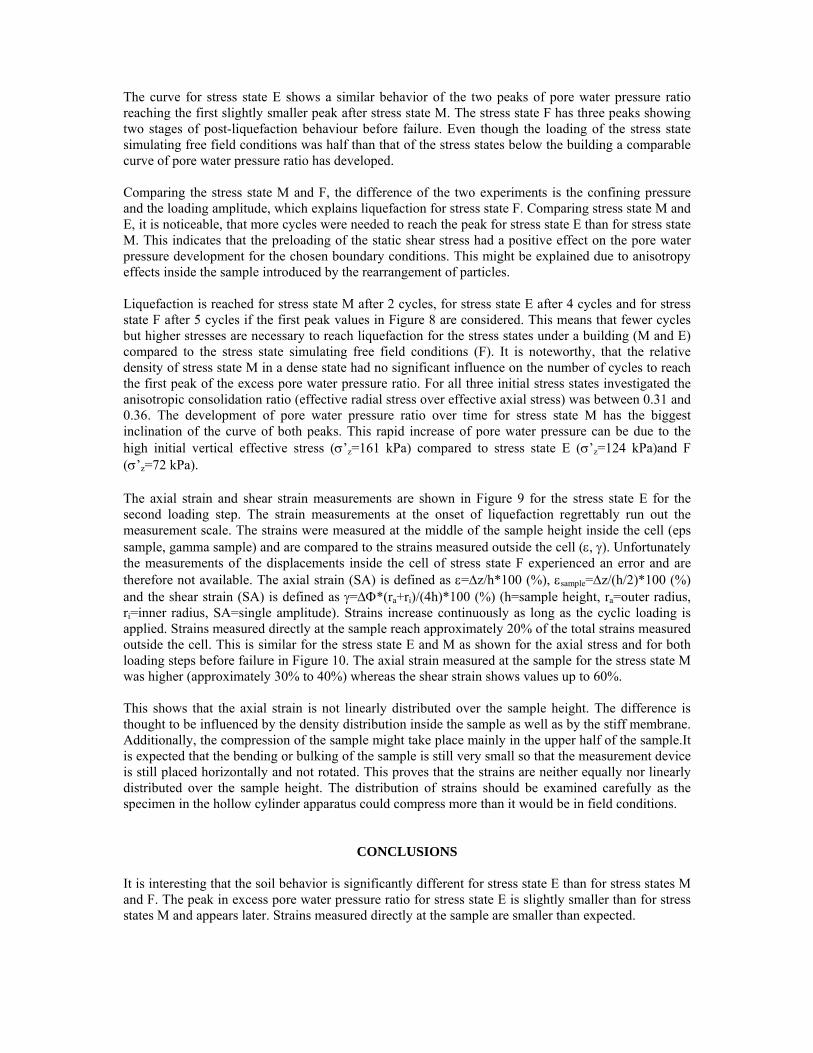
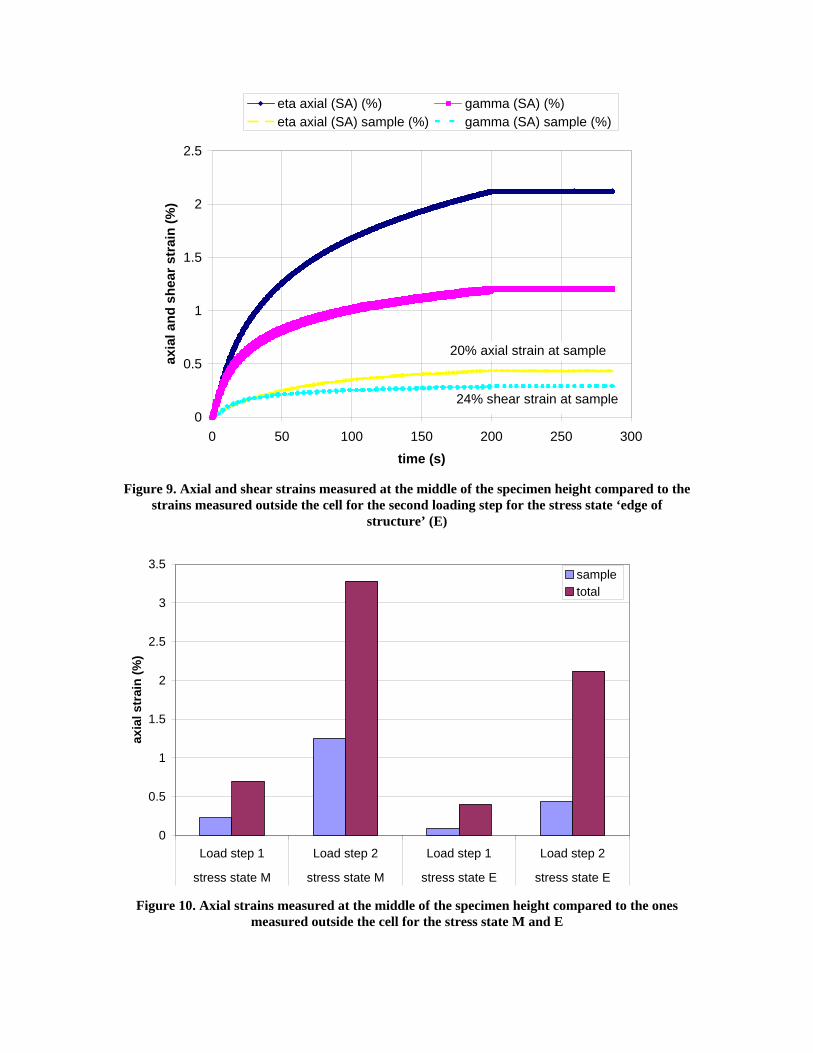
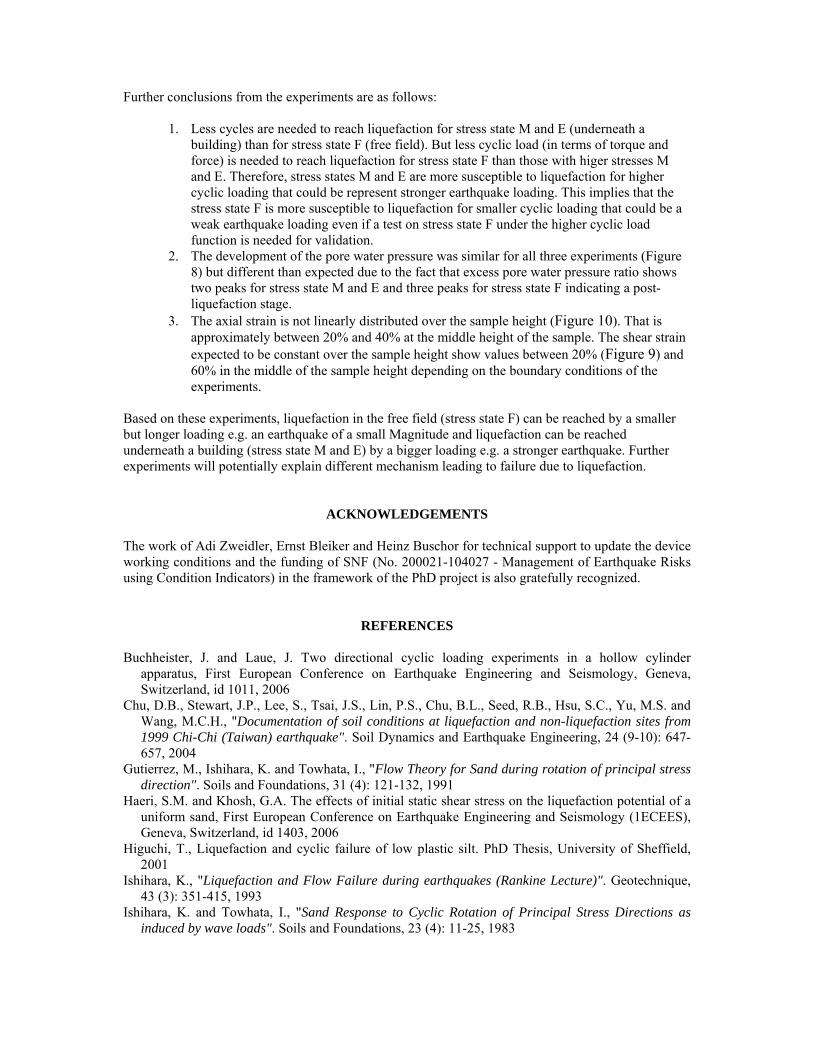
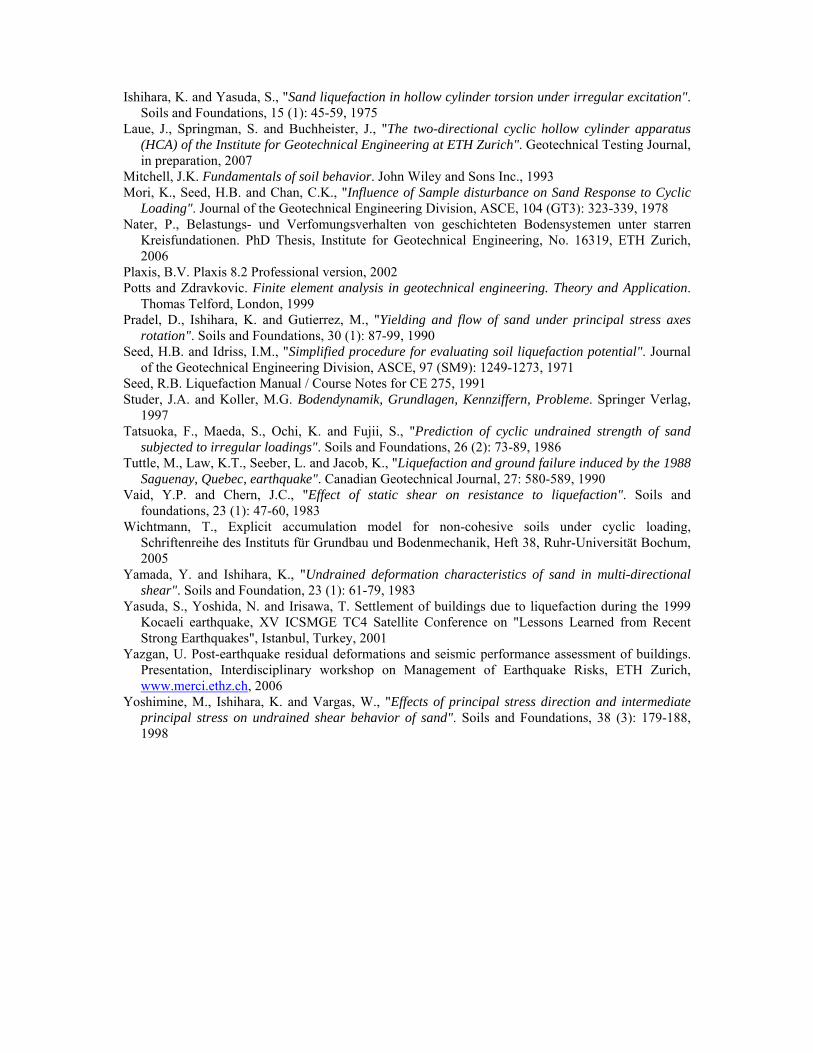
The curve for stress state E shows a similar behavior of the two peaks of pore water pressure ratio reaching the first slightly smaller peak after stress state M. The stress state F has three peaks showing two stages of post-liquefaction behaviour before failure. Even though the loading of the stress state simulating free field conditions was half than that of the stress states below the building a comparable curve of pore water pressure ratio has developed. Comparing the stress state M and F, the difference of the two experiments is the confining pressure and the loading amplitude, which explains liquefaction for stress state F. Comparing stress state M and E, it is noticeable, that more cycles were needed to reach the peak for stress state E than for stress state M. This indicates that the preloading of the static shear stress had a positive effect on the pore water pressure development for the chosen boundary conditions. This might be explained due to anisotropy effects inside the sample introduced by the rearrangement of particles. Liquefaction is reached for stress state M after 2 cycles, for stress state E after 4 cycles and for stress state F after 5 cycles if the first peak values in Figure 8 are considered. This means that fewer cycles but higher stresses are necessary to reach liquefaction for the stress states under a building (M and E) compared to the stress state simulating free field conditions (F). It is noteworthy, that the relative density of stress state M in a dense state had no significant influence on the number of cycles to reach the first peak of the excess pore water pressure ratio. For all three initial stress states investigated the anisotropic consolidation ratio (effective radial stress over effective axial stress) was between 0.31 and 0.36. The development of pore water pressure ratio over time for stress state M has the biggest inclination of the curve of both peaks. This rapid increase of pore water pressure can be due to the high initial vertical effective stress (σ’z=161 kPa) compared to stress state E (σ’z=124 kPa)and F (σ’z=72 kPa). The axial strain and shear strain measurements are shown in Figure 9 for the stress state E for the second loading step. The strain measurements at the onset of liquefaction regrettably run out the measurement scale. The strains were measured at the middle of the sample height inside the cell (eps sample, gamma sample) and are compared to the strains measured outside the cell (ε, γ). Unfortunately the measurements of the displacements inside the cell of stress state F experienced an error and are therefore not available. The axial strain (SA) is defined as ε=Δz/h*100 (%), εsample=Δz/(h/2)*100 (%) and the shear strain (SA) is defined as γ=ΔΦ*(ra+ri)/(4h)*100 (%) (h=sample height, ra=outer radius, ri=inner radius, SA=single amplitude). Strains increase continuously as long as the cyclic loading is applied. Strains measured directly at the sample reach approximately 20% of the total strains measured outside the cell. This is similar for the stress state E and M as shown for the axial stress and for both loading steps before failure in Figure 10. The axial strain measured at the sample for the stress state M was higher (approximately 30% to 40%) whereas the shear strain shows values up to 60%. This shows that the axial strain is not linearly distributed over the sample height. The difference is thought to be influenced by the density distribution inside the sample as well as by the stiff membrane. Additionally, the compression of the sample might take place mainly in the upper half of the sample.It is expected that the bending or bulking of the sample is still very small so that the measurement device is still placed horizontally and not rotated. This proves that the strains are neither equally nor linearly distributed over the sample height. The distribution of strains should be examined carefully as the specimen in the hollow cylinder apparatus could compress more than it would be in field conditions.
CONCLUSIONS It is interesting that the soil behavior is significantly different for stress state E than for stress states M and F. The peak in excess pore water pressure ratio for stress state E is slightly smaller than for stress states M and appears later. Strains measured directly at the sample are smaller than expected.
Further conclusions from the experiments are as follows:
1. Less cycles are needed to reach liquefaction for stress state M and E (underneath a building) than for stress state F (free field). But less cyclic load (in terms of torque and force) is needed to reach liquefaction for stress state F than those with higer stresses M and E. Therefore, stress states M and E are more susceptible to liquefaction for higher cyclic loading that could be represent stronger earthquake loading. This implies that the stress state F is more susceptible to liquefaction for smaller cyclic loading that could be a weak earthquake loading even if a test on stress state F under the higher cyclic load function is needed for validation.
2. The development of the pore water pressure was similar for all three experiments (Figure 8) but different than expected due to the fact that excess pore water pressure ratio shows two peaks for stress state M and E and three peaks for stress state F indicating a post-liquefaction stage.
3. The axial strain is not linearly distributed over the sample height (Figure 10). That is approximately between 20% and 40% at the middle height of the sample. The shear strain expected to be constant over the sample height show values between 20% (Figure 9) and 60% in the middle of the sample height depending on the boundary conditions of the experiments.
Based on these experiments, liquefaction in the free field (stress state F) can be reached by a smaller but longer loading e.g. an earthquake of a small Magnitude and liquefaction can be reached underneath a building (stress state M and E) by a bigger loading e.g. a stronger earthquake. Further experiments will potentially explain different mechanism leading to failure due to liquefaction.
ACKNOWLEDGEMENTS The work of Adi Zweidler, Ernst Bleiker and Heinz Buschor for technical support to update the device working conditions and the funding of SNF (No. 200021-104027 - Management of Earthquake Risks using Condition Indicators) in the framework of the PhD project is also gratefully recognized.
REFERENCES Buchheister, J. and Laue, J. Two directional cyclic loading experiments in a hollow cylinder
apparatus, First European Conference on Earthquake Engineering and Seismology, Geneva, Switzerland, id 1011, 2006
Chu, D.B., Stewart, J.P., Lee, S., Tsai, J.S., Lin, P.S., Chu, B.L., Seed, R.B., Hsu, S.C., Yu, M.S. and Wang, M.C.H., "Documentation of soil conditions at liquefaction and non-liquefaction sites from 1999 Chi-Chi (Taiwan) earthquake". Soil Dynamics and Earthquake Engineering, 24 (9-10): 647-657, 2004
Gutierrez, M., Ishihara, K. and Towhata, I., "Flow Theory for Sand during rotation of principal stress direction". Soils and Foundations, 31 (4): 121-132, 1991
Haeri, S.M. and Khosh, G.A. The effects of initial static shear stress on the liquefaction potential of a uniform sand, First European Conference on Earthquake Engineering and Seismology (1ECEES), Geneva, Switzerland, id 1403, 2006
Higuchi, T., Liquefaction and cyclic failure of low plastic silt. PhD Thesis, University of Sheffield, 2001
Ishihara, K., "Liquefaction and Flow Failure during earthquakes (Rankine Lecture)". Geotechnique, 43 (3): 351-415, 1993
Ishihara, K. and Towhata, I., "Sand Response to Cyclic Rotation of Principal Stress Directions as induced by wave loads". Soils and Foundations, 23 (4): 11-25, 1983
Ishihara, K. and Yasuda, S., "Sand liquefaction in hollow cylinder torsion under irregular excitation". Soils and Foundations, 15 (1): 45-59, 1975
Laue, J., Springman, S. and Buchheister, J., "The two-directional cyclic hollow cylinder apparatus (HCA) of the Institute for Geotechnical Engineering at ETH Zurich". Geotechnical Testing Journal, in preparation, 2007
Mitchell, J.K. Fundamentals of soil behavior. John Wiley and Sons Inc., 1993 Mori, K., Seed, H.B. and Chan, C.K., "Influence of Sample disturbance on Sand Response to Cyclic
Loading". Journal of the Geotechnical Engineering Division, ASCE, 104 (GT3): 323-339, 1978 Nater, P., Belastungs- und Verfomungsverhalten von geschichteten Bodensystemen unter starren
Kreisfundationen. PhD Thesis, Institute for Geotechnical Engineering, No. 16319, ETH Zurich, 2006
Plaxis, B.V. Plaxis 8.2 Professional version, 2002 Potts and Zdravkovic. Finite element analysis in geotechnical engineering. Theory and Application.
Thomas Telford, London, 1999 Pradel, D., Ishihara, K. and Gutierrez, M., "Yielding and flow of sand under principal stress axes
rotation". Soils and Foundations, 30 (1): 87-99, 1990 Seed, H.B. and Idriss, I.M., "Simplified procedure for evaluating soil liquefaction potential". Journal
of the Geotechnical Engineering Division, ASCE, 97 (SM9): 1249-1273, 1971 Seed, R.B. Liquefaction Manual / Course Notes for CE 275, 1991 Studer, J.A. and Koller, M.G. Bodendynamik, Grundlagen, Kennziffern, Probleme. Springer Verlag,
1997 Tatsuoka, F., Maeda, S., Ochi, K. and Fujii, S., "Prediction of cyclic undrained strength of sand
subjected to irregular loadings". Soils and Foundations, 26 (2): 73-89, 1986 Tuttle, M., Law, K.T., Seeber, L. and Jacob, K., "Liquefaction and ground failure induced by the 1988
Saguenay, Quebec, earthquake". Canadian Geotechnical Journal, 27: 580-589, 1990 Vaid, Y.P. and Chern, J.C., "Effect of static shear on resistance to liquefaction". Soils and
foundations, 23 (1): 47-60, 1983 Wichtmann, T., Explicit accumulation model for non-cohesive soils under cyclic loading,
Schriftenreihe des Instituts für Grundbau und Bodenmechanik, Heft 38, Ruhr-Universität Bochum, 2005
Yamada, Y. and Ishihara, K., "Undrained deformation characteristics of sand in multi-directional shear". Soils and Foundation, 23 (1): 61-79, 1983
Yasuda, S., Yoshida, N. and Irisawa, T. Settlement of buildings due to liquefaction during the 1999 Kocaeli earthquake, XV ICSMGE TC4 Satellite Conference on "Lessons Learned from Recent Strong Earthquakes", Istanbul, Turkey, 2001
Yazgan, U. Post-earthquake residual deformations and seismic performance assessment of buildings. Presentation, Interdisciplinary workshop on Management of Earthquake Risks, ETH Zurich, www.merci.ethz.ch, 2006
Yoshimine, M., Ishihara, K. and Vargas, W., "Effects of principal stress direction and intermediate principal stress on undrained shear behavior of sand". Soils and Foundations, 38 (3): 179-188, 1998