The Importance of International Trade to the Canadian ... · for 2,942,400 jobs in Canada in 2011...
13
fraserinstitute.org FRASER RESEARCH BULLETIN 1 FRASER RESEARCH BULLETIN October 2016 In 2015, exports accounted for 31.5% of GDP, up from 25% before Canada signed a se- ries of free trade agreements starting in 1988. Exports were 36% of GDP before the global recession began in 2008. Value-added exports, which subtract the imports embedded in ex- ports, represented 22.2% of GDP. Exports directly and indirectly accounted for 2,942,400 jobs in Canada in 2011 according to Statistics Canada, or 16.7% of all employ- ment. Imports were the equivalent of 33.8% of GDP in 2015. About 26% of imports are used as inputs into production in Canada, notably in export-intensive sectors like autos and high- tech. The effective tariff rate on imports is 1%, down from 3.5% before the push to more free trade began in the late 1980s. Trade overwhelmingly is still oriented to the United States. The stagnation of exports to Europe and Japan in recent years was offset by increases to Asia. Because Canada exports to Asia, notably natural resources, it has a rela- tively small trade deficit with Asia compared with the US. Canada has little direct trade with Mexico. Both exports and imports are beneficial to economic growth, largely by boosting produc- tivity. Firms in Canada that export have sig- nificantly higher productivity than firms that do not export. Imports of intermediate inputs contributed over half of Canada’s recent pro- ductivity growth. However, trade does create winners and losers, which has fuelled protec- tionist sentiment. SUMMARY by Philip Cross The Importance of International Trade to the Canadian Economy: An Overview
-
Upload
hoangtuyen -
Category
Documents
-
view
217 -
download
1
Transcript of The Importance of International Trade to the Canadian ... · for 2,942,400 jobs in Canada in 2011...

fraserinstitute.org FRASER RESEARCH BULLETIN 1
F R A S E R RESEARCHBULLETIN
October 2016
�� In 2015, exports accounted for 31.5% of GDP, up from 25% before Canada signed a se-ries of free trade agreements starting in 1988. Exports were 36% of GDP before the global recession began in 2008. Value-added exports, which subtract the imports embedded in ex-ports, represented 22.2% of GDP.
�� Exports directly and indirectly accounted for 2,942,400 jobs in Canada in 2011 according to Statistics Canada, or 16.7% of all employ-ment.
�� Imports were the equivalent of 33.8% of GDP in 2015. About 26% of imports are used as inputs into production in Canada, notably in export-intensive sectors like autos and high-tech. The effective tariff rate on imports is 1%, down from 3.5% before the push to more free trade began in the late 1980s.
�� Trade overwhelmingly is still oriented to the United States. The stagnation of exports to Europe and Japan in recent years was offset by increases to Asia. Because Canada exports to Asia, notably natural resources, it has a rela-tively small trade deficit with Asia compared with the US. Canada has little direct trade with Mexico.
�� Both exports and imports are beneficial to economic growth, largely by boosting produc-tivity. Firms in Canada that export have sig-nificantly higher productivity than firms that do not export. Imports of intermediate inputs contributed over half of Canada’s recent pro-ductivity growth. However, trade does create winners and losers, which has fuelled protec-tionist sentiment.
Summary
by Philip Cross
The Importance of International Trade to the Canadian Economy: An Overview

The Importance of International Trade to Canada’s Economy
fraserinstitute.org FRASER RESEARCH BULLETIN 2
IntroductionProtectionist forces are clearly in the ascen-dant in many parts of the world. Britain’s vote to exit the European Union (EU) and Republican presidential nominee Donald Trump’s vow to renegotiate trade deals such as the North Amer-ican Free Trade Agreement (NAFTA) are only the most obvious manifestations of this senti-ment. Hillary Clinton, the Democratic nomi-nee for president, has promised to “review” NAFTA and publicly opposes the Trans-Pacific Partnership (TPP) (McKenna, 2016, August 6).1 Canada’s trade deal with Europe, called the Comprehensive Economic and Trade Agree-ment (CETA), may not receive the unanimous approval required the European Parliament, while the prospects for a US–EU trade deal appear miniscule.
Canada’s initiative to pursue trade deals with Europe and Asia itself grew out of the failure of the Doha round of global trade talks under the auspices of the World Trade Organization (WTO). These talks floundered on disagree-ments over agricultural and manufacturing trade issues. More broadly, the era of rapidly proliferating global supply chains seems to have come to an end, at least for manufactur-ing. Global trade flows have been further ham-pered by slow economic growth in many west-ern countries since the global financial crisis started in 2007, notably in Europe and Japan. In turn, slow growth and continuing job losses
1 Some of this can be regarded as posturing during an election campaign; in 2008 Obama also prom-ised a review of NAFTA when running for president, while in 1993 Canada’s soon-to-be prime minister, Jean Chretien, promised to renegotiate free trade with the US, but finally adopted the NAFTA.
in factories have fed protectionist sentiment in many parts of the world.
A concerted move by Canada’s leading trad-ing partners to inhibit trade flows would harm the prospects for sustaining rising incomes, on which Canada built much of its post-war pros-perity. It is no exaggeration to claim that trade policy has been “arguably the most impor-tant tool of Canada’s economic development throughout the country’s history” in the words of one of Canada’s leading trade negotiators (Ritchie, 1997: 76). This paper documents Cana-da’s exposure to trade, both in terms of produc-tion and jobs. It then reviews where the growth in trade has been the most pronounced and our vulnerability to protectionism the greatest, par-ticularly in trade with the United States.
It is easy to exaggerate the threat to world trade from the failure of the Doha round and the troubled outlook for the CETA and the TPP. Trade expert Michael Hart observed that the rules governing international trade under the auspices of the WTO and various regional trade deals may be sufficiently developed that no major improvements are needed to sustain a trade regime that would be very supportive of economic growth. The benefits of the CETA for Canada would be limited anyway since the pact retains supply management, protection of cul-tural industries, and the net benefit test for for-eign investment. The TPP was mostly an update of the NAFTA and an attempt by the US to set the rules for trade with Asia without the com-promises China demanded (Rioux, 2016, August 4). However, there is no minimizing any pos-sible threat to our trade agreements with the US, although experts note that a suspension of NAFTA by the US would still leave in place the 1988 Free Trade Agreement to govern our trade with the United States (McKenna, 2016, August 6).
The Importance of International Trade to Canada’s Economy
fraserinstitute.org FRASER RESEARCH BULLETIN 3
How trade benefits the economy
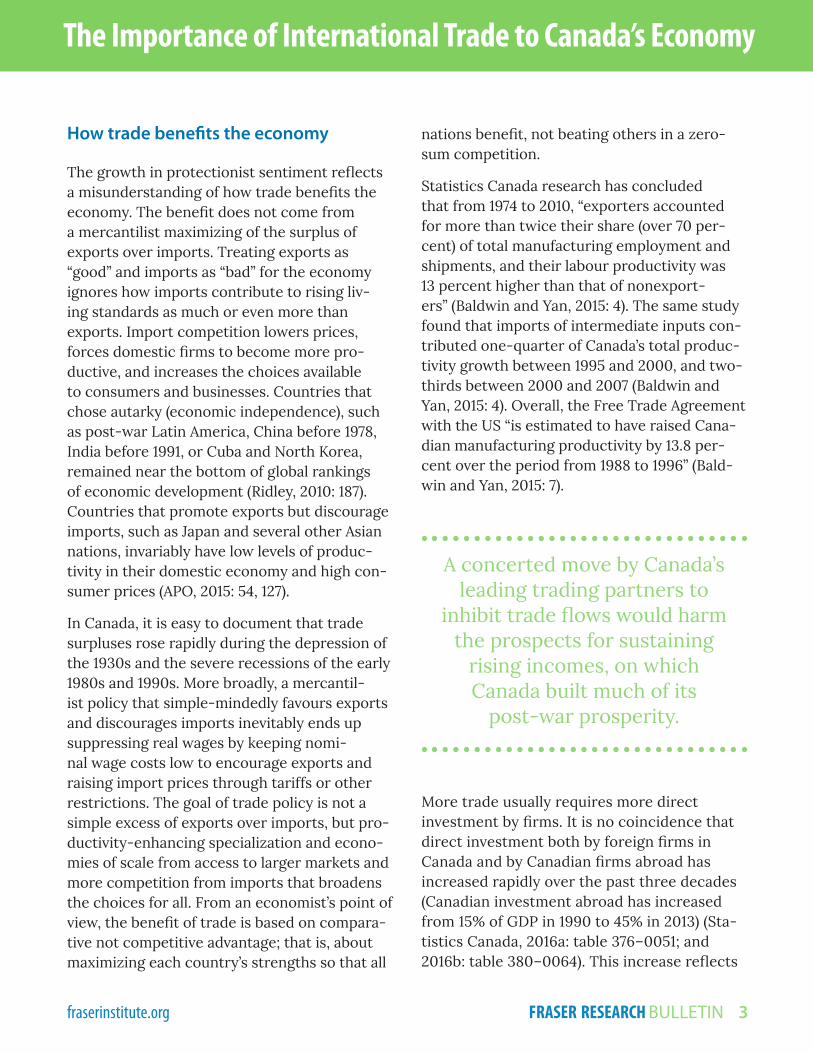
The growth in protectionist sentiment reflects a misunderstanding of how trade benefits the economy. The benefit does not come from a mercantilist maximizing of the surplus of exports over imports. Treating exports as “good” and imports as “bad” for the economy ignores how imports contribute to rising liv-ing standards as much or even more than exports. Import competition lowers prices, forces domestic firms to become more pro-ductive, and increases the choices available to consumers and businesses. Countries that chose autarky (economic independence), such as post-war Latin America, China before 1978, India before 1991, or Cuba and North Korea, remained near the bottom of global rankings of economic development (Ridley, 2010: 187). Countries that promote exports but discourage imports, such as Japan and several other Asian nations, invariably have low levels of produc-tivity in their domestic economy and high con-sumer prices (APO, 2015: 54, 127).
In Canada, it is easy to document that trade surpluses rose rapidly during the depression of the 1930s and the severe recessions of the early 1980s and 1990s. More broadly, a mercantil-ist policy that simple-mindedly favours exports and discourages imports inevitably ends up suppressing real wages by keeping nomi-nal wage costs low to encourage exports and raising import prices through tariffs or other restrictions. The goal of trade policy is not a simple excess of exports over imports, but pro-ductivity-enhancing specialization and econo-mies of scale from access to larger markets and more competition from imports that broadens the choices for all. From an economist’s point of view, the benefit of trade is based on compara-tive not competitive advantage; that is, about maximizing each country’s strengths so that all
nations benefit, not beating others in a zero-sum competition.
Statistics Canada research has concluded that from 1974 to 2010, “exporters accounted for more than twice their share (over 70 per-cent) of total manufacturing employment and shipments, and their labour productivity was 13 percent higher than that of nonexport-ers” (Baldwin and Yan, 2015: 4). The same study found that imports of intermediate inputs con-tributed one-quarter of Canada’s total produc-tivity growth between 1995 and 2000, and two-thirds between 2000 and 2007 (Baldwin and Yan, 2015: 4). Overall, the Free Trade Agreement with the US “is estimated to have raised Cana-dian manufacturing productivity by 13.8 per-cent over the period from 1988 to 1996” (Bald-win and Yan, 2015: 7).
A concerted move by Canada’s leading trading partners to
inhibit trade flows would harm the prospects for sustaining
rising incomes, on which Canada built much of its
post-war prosperity.
More trade usually requires more direct investment by firms. It is no coincidence that direct investment both by foreign firms in Canada and by Canadian firms abroad has increased rapidly over the past three decades (Canadian investment abroad has increased from 15% of GDP in 1990 to 45% in 2013) (Sta-tistics Canada, 2016a: table 376–0051; and 2016b: table 380–0064). This increase reflects

The Importance of International Trade to Canada’s Economy
fraserinstitute.org FRASER RESEARCH BULLETIN 4
firms establishing manufacturing plants, often linked to global supply chains, and distribution networks to manage their trade flows and pro-vide services directly in foreign markets (nota-bly banking and insurance).
Trade agreements replace the state-to-state resolution of trade disputes, such as between Canada and the US over softwood lumber. In trade disputes between nations, the larger country usually fares better in a political set-ting where power triumphs. Trade agreements instead resolve disputes mostly with investor-to-state settlements in an arbitral setting.2 In Hart’s words, it is erroneous to think of trade agreements as between countries, since it is individuals and companies who actually trade within the rules set by governments: “Trade agreements do little more than reduce the scope for arbitrary and discriminatory regu-lations and for unproductive interference in market-based decisions” (Hart, 2002: 8). Trade agreements allow firms to plan long-term deci-sions on where to locate production and distri-bution with more certainty about the “rules of the game.”
Of course, trade inevitably creates winners and losers in terms of both incomes and jobs. As well, it can increase the inequality of incomes, although this has been more of a factor in the US than in Canada because of the boom in our resource sector over much of the past 13 years. In stressing the benefits of trade, economists and politicians have not paid enough attention
2 Famously, when Canada banned a gasoline addi-tive in 1997, the MMT company that manufactured this additive successfully sued for damages (cited in Heaman, 2015: 200). More recently, the TransCanada Pipeline Company is suing the US government for $15 billion for not approving its Keystone pipeline extension.
to creating programs to help those who are dis-advantaged by the loss of jobs or lower wages.
The importance of exports to Canada’s economyIn 2015, total exports of goods and services accounted for 31.5% of Canada’s GDP. Imme-diately after the implementation of the Free Trade Agreement (FTA) with the US in 1989, exports snapped out of a decade-long lethargy, rising from 25.2% of GDP to 36.1% in less than a decade. The implementation of the NAFTA and a booming North American economy lifted exports to a record 44.2% of GDP in 2000. The 2001 recession and bursting of the ICT (also known as the dot-com) bubble lowered this share to 36% in 2002, where it remained until
Figure 1: Import Duties as a Percentage of Imports
0.0
0.5
1.0
1.5
2.0
2.5
3.0
3.5
4.0
1988 1992 1996 2000 2004 2008 2012
%
Source: Statistics Canada, 2016c, Table 380-0080; Statistics Canada, 2016d, Table 228-0059.

The Importance of International Trade to Canada’s Economy
fraserinstitute.org FRASER RESEARCH BULLETIN 5
the 2008 recession and the subsequent slow recovery from it, which drove it down to 31.5%.
At 33.8% of GDP, imports in 2015 are closer to their all-time high of 38.6% set in 2000. Imports rose steadily in the 1990s as trade was liberalized and tariffs reduced. The impact of Canada’s free trade agreements with the US and Mexico are evident in the effective tariff rate on imports. Duties collected on imports fell from 3.5% of the value of Canada’s imports just before the FTA was implemented to 1% after NAFTA. Since then, they have remained at 1% (see figure 1). While this statistic does not capture all the impediments to trade—trade flows will naturally gravitate to sectors where tariffs are low or non-existent and away from sectors such as dairy and poultry where Cana-dian tariffs are punitive—it provides an over-view of how Canada’s effective tariff rate was reduced by free trade agreements in the 1980s and 1990s.
Combined, exports and imports were equiva-lent to 65.4% of Canada’s GDP in 2015, up from less than 50% before the FTA was adopted but less than the record 83% set in 2000 (figure 2). However, this conventional measure of the importance of trade in the economy is mislead-ing. In some industries where supply chains extend to both sides of the Canada/US border, notably autos and the information and commu-nication technology (ICT) sector, the same part may cross the border several times during the manufacturing process. As a result, the value of exports and imports is inflated by the double-counting (or sometimes triple or more) of the same part crossing the border several times (Ghanem and Huang, 2014)). Statistics Canada adjusts for the double-counting of imports embedded in exports by calculating the value-
added of exports, which subtracts the use of imported intermediate inputs.3
The value-added of exports is a still substantial 22.2% of Canada’s GDP in 2011 (figure 3). This is slightly below its pre-recession high of 24.7% in 2007 because of the severe drop in exports during the global recession, which slashed the share of value-added exports in GDP to a low of 20.5% in 2009. The ratio of value-added to gross exports was very stable and ranged between 72.2% and 72.6% from 2007 to 2011, despite large fluctuations in the economy and
3 For more on how the adjustment for the import content of exports is done, see Cross and Cam-eron, 1999.
Figure 2: International Trade as a Share of GDP
Source: Statistics Canada, 2016b, Table 380-0064, goods and services, Balance of Payment basis.
0
10
20
30
40
50
60
70
80
90
1981 1985 1989 1993 1997 2001 2005
Imports
Exports
Exports and imports
%

The Importance of International Trade to Canada’s Economy
fraserinstitute.org FRASER RESEARCH BULLETIN 6
the Canadian dollar, as firms consistently used imports for nearly 26% of their inputs. This sta-bility reflects that firms change their produc-tion processes slowly and methodically over time. However, the use of imports in the pro-duction process varies widely by industry. In some manufacturing industries such as autos and high-tech, imports account for half of all inputs. In construction and natural resources, imports are used sparingly at less than 20% of all inputs (Cross, 2002: 3.4).
Statistics Canada uses its Input/Output Accounts of the Canadian economy to cal-culate how many jobs in Canada are tied to exports. In 2011, 1,540,112 jobs in Canada were directly dependent on exports. Adding in the jobs needed indirectly to produce these exports (such as materials used in auto assemblies or transporting goods to the border) raises
the total employment impact of exports to 2,942,480, or 16.7% of all employment in Canada (Statistics Canada, 2016e: Table 381-0032). The share of jobs created by exports is less than their share of GDP because of the high level of productivity required for these industries to be competitive on the world stage. It has become a cliché to say that the loss of factory jobs in the western world in recent decades has resulted from technological change and not trade, as if the two are separate forces.4 It is the need to raise productivity to meet the challenge of intensified competition itself that is one factor that induces firms to adopt new technologies.
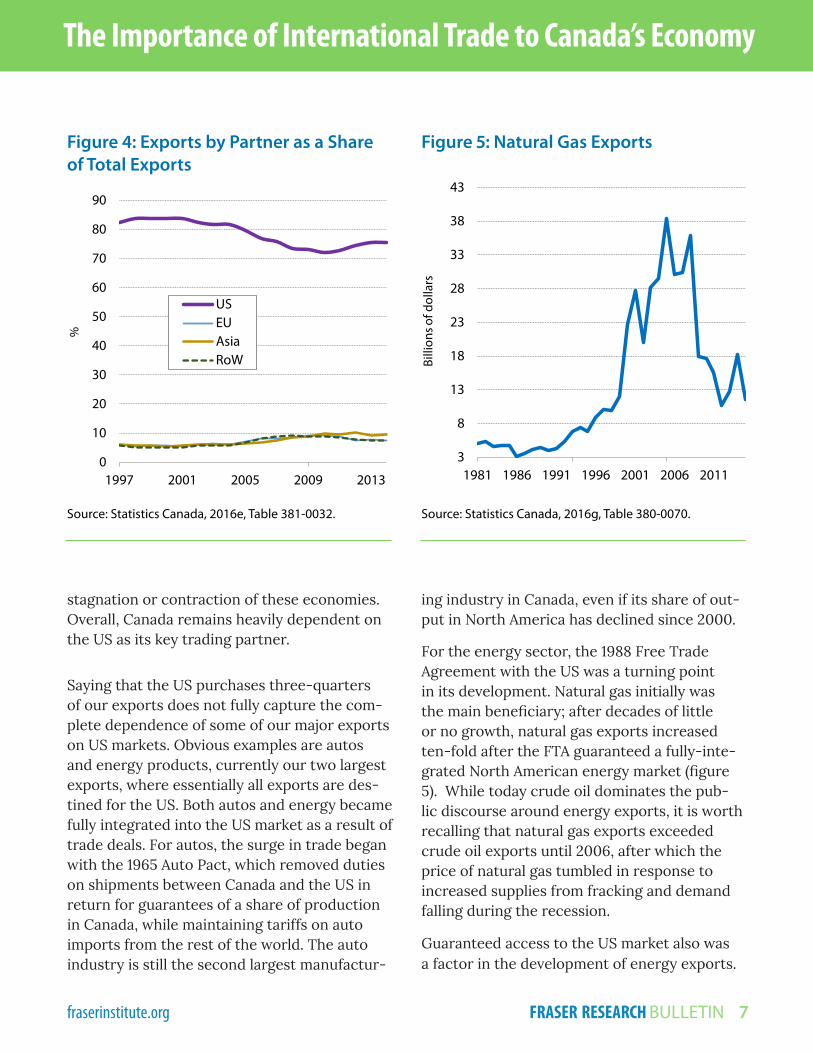
Canada’s major trading partnersThe United States continues to dominate our international trade flows, accounting for three-quarters of Canada’s exports and two-thirds of its imports.5 Canada’s reliance on the US for trade has fallen slightly over the past two decades, especially with the emergence of Asian nations such as China and South Korea both as suppliers of manufactured goods and as export markets for our natural resources. How-ever, the US share has recovered from a low in 2011 of 72.1% of exports and 61.7% of imports, reflecting stronger growth in the US than in many overseas markets, especially the auto industry whose integrated operations inflate trade flows in both directions across the border (figure 4). Meanwhile, the share of trade with the European Union and Japan has fallen over the past decade, a reflection of the continuous
4 The Economist said that “Manufacturing’s share of employment has fallen mostly because of technol-ogy, not trade” (August 13, 2016).
5 All data on Canada’s trade by country come from Statistics Canada (2016f): Table 228-0069, and are on a Balance of Payments basis.
Figure 3: Share of Exports in GDP and Jobs
Source: Statistics Canada, 2016e, Table 381-0032.
0
5
10
15
20
25
30
35
40
2007 2008 2009 2010 2011
Gross exports
Jobs
Value-added exports
%
The Importance of International Trade to Canada’s Economy
fraserinstitute.org FRASER RESEARCH BULLETIN 7
stagnation or contraction of these economies. Overall, Canada remains heavily dependent on the US as its key trading partner.
Saying that the US purchases three-quarters of our exports does not fully capture the com-plete dependence of some of our major exports on US markets. Obvious examples are autos and energy products, currently our two largest exports, where essentially all exports are des-tined for the US. Both autos and energy became fully integrated into the US market as a result of trade deals. For autos, the surge in trade began with the 1965 Auto Pact, which removed duties on shipments between Canada and the US in return for guarantees of a share of production in Canada, while maintaining tariffs on auto imports from the rest of the world. The auto industry is still the second largest manufactur-
ing industry in Canada, even if its share of out-put in North America has declined since 2000.
For the energy sector, the 1988 Free Trade Agreement with the US was a turning point in its development. Natural gas initially was the main beneficiary; after decades of little or no growth, natural gas exports increased ten-fold after the FTA guaranteed a fully-inte-grated North American energy market (figure 5). While today crude oil dominates the pub-lic discourse around energy exports, it is worth recalling that natural gas exports exceeded crude oil exports until 2006, after which the price of natural gas tumbled in response to increased supplies from fracking and demand falling during the recession.
Guaranteed access to the US market also was a factor in the development of energy exports.
Figure 5: Natural Gas Exports
Source: Statistics Canada, 2016g, Table 380-0070.
Figure 4: Exports by Partner as a Share of Total Exports
Source: Statistics Canada, 2016e, Table 381-0032.
3
8
13
18
23
28
33
38
43
1981 1986 1991 1996 2001 2006 2011
Billi
ons o
f dol
lars
0
10
20
30
40
50
60
70
80
90
1997 2001 2005 2009 2013
USEUAsiaRoW
%
The Importance of International Trade to Canada’s Economy
fraserinstitute.org FRASER RESEARCH BULLETIN 8
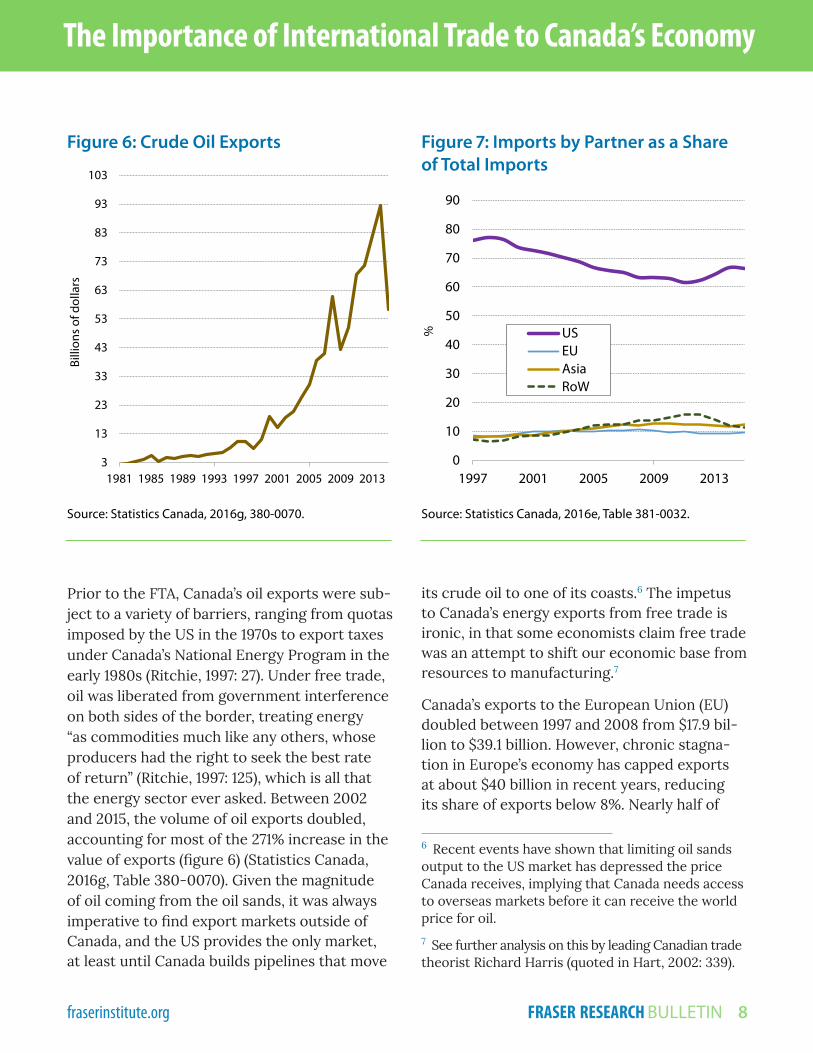
Prior to the FTA, Canada’s oil exports were sub-ject to a variety of barriers, ranging from quotas imposed by the US in the 1970s to export taxes under Canada’s National Energy Program in the early 1980s (Ritchie, 1997: 27). Under free trade, oil was liberated from government interference on both sides of the border, treating energy “as commodities much like any others, whose producers had the right to seek the best rate of return” (Ritchie, 1997: 125), which is all that the energy sector ever asked. Between 2002 and 2015, the volume of oil exports doubled, accounting for most of the 271% increase in the value of exports (figure 6) (Statistics Canada, 2016g, Table 380-0070). Given the magnitude of oil coming from the oil sands, it was always imperative to find export markets outside of Canada, and the US provides the only market, at least until Canada builds pipelines that move
its crude oil to one of its coasts.6 The impetus to Canada’s energy exports from free trade is ironic, in that some economists claim free trade was an attempt to shift our economic base from resources to manufacturing.7
Canada’s exports to the European Union (EU) doubled between 1997 and 2008 from $17.9 bil-lion to $39.1 billion. However, chronic stagna-tion in Europe’s economy has capped exports at about $40 billion in recent years, reducing its share of exports below 8%. Nearly half of
6 Recent events have shown that limiting oil sands output to the US market has depressed the price Canada receives, implying that Canada needs access to overseas markets before it can receive the world price for oil.
7 See further analysis on this by leading Canadian trade theorist Richard Harris (quoted in Hart, 2002: 339).
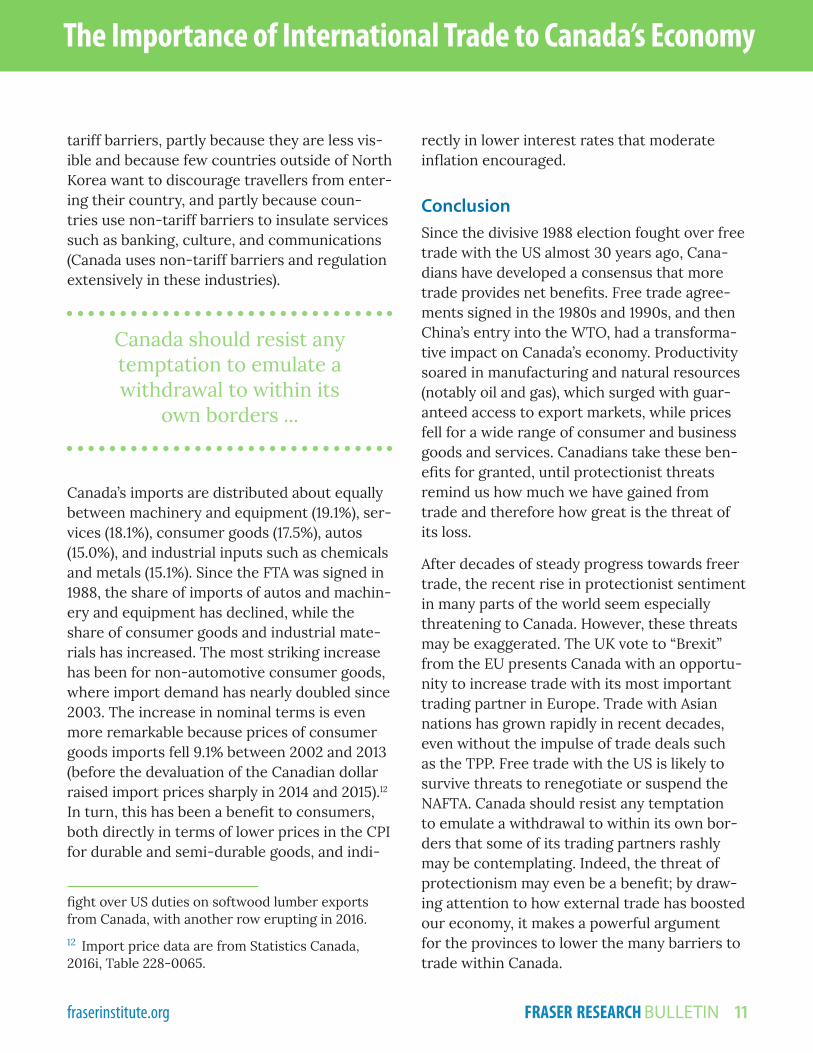
Figure 7: Imports by Partner as a Share of Total Imports
Source: Statistics Canada, 2016e, Table 381-0032.
Figure 6: Crude Oil Exports
Source: Statistics Canada, 2016g, 380-0070.
0
10
20
30
40
50
60
70
80
90
1997 2001 2005 2009 2013
USEUAsiaRoW
%
3
13
23
33
43
53
63
73
83
93
103
1981 1985 1989 1993 1997 2001 2005 2009 2013
Billi
ons
of d
olla
rs

The Importance of International Trade to Canada’s Economy
fraserinstitute.org FRASER RESEARCH BULLETIN 9
Canada’s exports to Europe are destined for the United Kingdom. This is encouraging for Canada, since it appears that the UK vote to leave the EU means that a trade deal can be negotiated separately with Britain even if the CETA fails to pass. After Britain, Germany is the next largest market for Canada’s exports in Europe at $3.8 billion, reflecting the relatively healthy state of its economy. However, Canada’s exports to Germany are less than one-quarter its sales to Britain.
While Canada’s exports to the EU have stag-nated since 2008, imports from the EU have risen steadily from $46.6 billion to $53 billion in 2015. This reflects both continued growth in Canada’s domestic demand and the falling euro. Germany is the largest supplier of imports at $15 billion, followed by the UK at $8.6 billion. Still, the EU supplies less than 10% of Canada’s imports (figure 7).
While the US share of trade with Canada has fallen from its peak at the turn of the century and the EU has stagnated at less than 10% of our trade for the past decade, Asian coun-tries became the most dynamic source of trade with Canada. In particular, imports from Asian nations such as China and South Korea have risen rapidly over the past two decades, from 6.5% of Canada’s imports in 1998 to a peak of 12.8% in 2009, where they have remained. Most Asian imports come from China, Japan, and South Korea, which altogether have doubled their share of Canadian imports from 5.0% in 1998 to 10.0% in 2009, though they have not made any further inroads since.
After falling to a low of 5.1% of Canada’s exports in the aftermath of the Asian crisis in the late 1990s, Asia’s share of exports rose to 9.2% in 2009 during the depths of the recession in the US. A resumption of growth in the US helped lower Asia’s export share below 9%. After 2013
their share dipped under 8% as commodity prices tumbled and China’s industrial growth slowed. However, statistics on Asia’s share of exports only capture the direct impact of exports shipped to Asia. The decade-long com-modity price boom fuelled by Asian demand after 2002 raised the prices Canada received for its resource exports to all its trading part-ners, since most commodities have one price on world markets.
Overall, Canada’s trade deficit with Asia has been contained by rising exports, especially of natural resources. This contrasts sharply with the US experience, where rising imports from Asia have not boosted American exports, which are dominated by manufactured goods that often faced intensified competition from Asian producers. In 2013 and 2014, for example, Can-ada ran outright trade surpluses with Japan, while exports to China were about two-thirds the level of our imports. Conversely, the US runs substantial trade deficits with Japan, while US exports to China are only one-third the level of its imports from China.8 This is one example where Canada’s often-denigrated dependence on natural resources actually proved a bless-ing in an era where Asian producers captured a rising share of global markets for manufac-tured goods. It may also help explain why the protectionist sentiment growing south of our border has no real echo in Canada, where the consensus remains that more trade is benefi-cial to the economy.
Despite Mexico joining the NAFTA free trade zone in 1996, trade between Canada and Mexico remains muted. Exports to Mexico totaled $7.9
8 The US runs a substantial trade surplus with Latin America, which is why little protectionist rhetoric is directed toward that continent. All the US trade data are from the US Census Bureau, 2015.

The Importance of International Trade to Canada’s Economy
fraserinstitute.org FRASER RESEARCH BULLETIN 10
billion in 2015, having never recovered to their pre-recession high of $8 billion in 2008. Mexico’s share of all Canadian exports under NAFTA rose from 0.7% in 1997 to only 1.5% in 2015. Imports grew slightly faster, from 1.5% of Canada’s total imports to 3.4%, but remain relatively small at less than half of China’s share of 7.1%.
Imports from the rest of the world mostly con-sist of oil imports from nations such as Norway and Algeria, and have fallen sharply as prices declined and shipments to refineries in Eastern Canada increased.
The commodity composition of exports and importsCanada’s exports are dominated by manufac-tured, mining (including oil and gas), and agricul-tural products. Together, these three industries accounted for 74.1% of exports in 2015, and over half (58.7%) of all export-related jobs (Statistics Canada, 2016e: Table 381–0032). Their greater share of income than of jobs reflects the high level of productivity in export-oriented industries.
The composition of Canada’s trade has shifted continually over time. In 1981, metals and min-erals were Canada’s leading export. By the 1990s, autos dominated with a 20.6% share of exports, although energy exports had begun to grow rapidly in response to the FTA. At the peak of oil prices in 2008, energy exports were 20.8% of all exports, matching the dominance of autos in 2000.
In 2015, Canada’s exports were more evenly dis-tributed than in the previous three decades. Autos again were the leading export at $87.3 billion, just ahead of machinery and equipment ($84.9 billion) and energy ($83.8 billion). Close behind were metals and minerals ($77.0 billion) and consumer goods ($70.1 billion). Forestry
products ($39.8 billion) and agriculture ($32.1 billion) trail, though they have risen markedly in recent years. The recovery of agriculture and forestry even as prices slumped for energy and metals products is a reminder that natu-ral resource markets do not move in unison.9 Meanwhile, services exports have risen by one-quarter since 2008 to $100.1 billion, one of the fastest growth rates among exports, reflecting rapid growth in commercial services and travel.
Having a diversified mix of manufactured, ser-vices, and resource exports helps insulate Can-ada from possible disruptions to trade agree-ments. Manufactured goods are most often the target of protective tariffs. Resources are rarely threatened, since they are mostly an input into the production process of other countries and it would make little sense for a country to raise the cost of imported inputs it needs10 (Canada’s softwood lumber exports are a notable excep-tion, where the US regularly insists on rais-ing the price of one of the primary inputs into the price of its homes).11 Services rarely attract
9 Forestry in particular slumped badly from 2003 to 2008 even as energy boomed, partly because the US imposed a tariff of nearly 30% on softwood lumber. Lumber exports jumped 20% after the expiry of an agreement governing Canada’s exports in 2015.
10 Low tariffs on Canada’s resource exports have long been the norm. Hart (2002: 173) noted that the combination of “low levels of protection on exports of those resources to the United States” and high tariffs on manufactured goods in both Canada and the US encouraged the growth of resources and discouraged manufacturing for decades.
11 The American National Association of Home Builders recognized this in 1997 when it wrote that “The duty on lumber from Canada is essentially a tax on home ownership that is costing home buyers bil-lions of dollars a year” (quoted in Ritchie, 1997: 214). Ritchie devotes a whole chapter to the interminable
The Importance of International Trade to Canada’s Economy
fraserinstitute.org FRASER RESEARCH BULLETIN 11
tariff barriers, partly because they are less vis-ible and because few countries outside of North Korea want to discourage travellers from enter-ing their country, and partly because coun-tries use non-tariff barriers to insulate services such as banking, culture, and communications (Canada uses non-tariff barriers and regulation extensively in these industries).
Canada should resist any temptation to emulate a withdrawal to within its
own borders ...
Canada’s imports are distributed about equally between machinery and equipment (19.1%), ser-vices (18.1%), consumer goods (17.5%), autos (15.0%), and industrial inputs such as chemicals and metals (15.1%). Since the FTA was signed in 1988, the share of imports of autos and machin-ery and equipment has declined, while the share of consumer goods and industrial mate-rials has increased. The most striking increase has been for non-automotive consumer goods, where import demand has nearly doubled since 2003. The increase in nominal terms is even more remarkable because prices of consumer goods imports fell 9.1% between 2002 and 2013 (before the devaluation of the Canadian dollar raised import prices sharply in 2014 and 2015).12 In turn, this has been a benefit to consumers, both directly in terms of lower prices in the CPI for durable and semi-durable goods, and indi-
fight over US duties on softwood lumber exports from Canada, with another row erupting in 2016.
12 Import price data are from Statistics Canada, 2016i, Table 228-0065.
rectly in lower interest rates that moderate inflation encouraged.
ConclusionSince the divisive 1988 election fought over free trade with the US almost 30 years ago, Cana-dians have developed a consensus that more trade provides net benefits. Free trade agree-ments signed in the 1980s and 1990s, and then China’s entry into the WTO, had a transforma-tive impact on Canada’s economy. Productivity soared in manufacturing and natural resources (notably oil and gas), which surged with guar-anteed access to export markets, while prices fell for a wide range of consumer and business goods and services. Canadians take these ben-efits for granted, until protectionist threats remind us how much we have gained from trade and therefore how great is the threat of its loss.
After decades of steady progress towards freer trade, the recent rise in protectionist sentiment in many parts of the world seem especially threatening to Canada. However, these threats may be exaggerated. The UK vote to “Brexit” from the EU presents Canada with an opportu-nity to increase trade with its most important trading partner in Europe. Trade with Asian nations has grown rapidly in recent decades, even without the impulse of trade deals such as the TPP. Free trade with the US is likely to survive threats to renegotiate or suspend the NAFTA. Canada should resist any temptation to emulate a withdrawal to within its own bor-ders that some of its trading partners rashly may be contemplating. Indeed, the threat of protectionism may even be a benefit; by draw-ing attention to how external trade has boosted our economy, it makes a powerful argument for the provinces to lower the many barriers to trade within Canada.

The Importance of International Trade to Canada’s Economy
fraserinstitute.org FRASER RESEARCH BULLETIN 12
References
Asian Productivity Organization [APO] (2015). APO Productivity Databook 2015. Asian Productivity Organization. <http://www.apo-tokyo.org/publications/wp-content/uploads/sites/5/APO-Productivity-Databook-2015.pdf>, as of September 21, 2016.
Baldwin, John, and Beiling Yan (2015). Trade and Productivity: Insights from Canadian Firm-Level Data. In Stephen Tapp, Ari Van Assche and Robert Wolfe (eds.). Volume VI: Redesigning Canadian Trade Policies for New Global Realities (Institute for Research on Public Policy [IRPP]). <http://irpp.org/wp-content/uploads/2015/05/AOTS-baldwin-yan.pdf>, as of Sept. 19, 2016.
Cross, Philip, and Grant Cameron (1999). The Importance of Exports to GDP and Jobs. Canadian Economic Observer. Statistics Canada Catalogue no 11-010-X, Vol. 12, No. 11 (November).
Cross, Philip (2002). Cyclical Implications of the Rising Import Content in Exports. Canadian Economic Observer. Statistics Canada Catalogue no. 11-010-XPB, Vol. 15 No. 12 (December).
The Economist (2016, August 13). Scrimping on Sense. The Economist. <http://www.economist.com/news/leaders/21704792-republican-nominees-ideas-economy-are-thoughtless-and-dangerous-scrimping-sense>, as of September 19, 2016.
Ghanem, Ziad, and Lyming Huang (2014, July 3). Value-added Exports: Measurement Framework. Statistics Canada, Industry Accounts Division. <http://www23.statcan.gc.ca/imdb-bmdi/document/1401_D14_T9_V1-eng.pdf>, as of September 19, 2016.
Hart, Michael (2002). A Trading Nation: Canadian Trade Policy from Colonialism to Globalization. UBC Press.
Heaman, E.A. (2015). A Short History of the State in Canada. University of Toronto Press.
McKenna, Barrie (2016, August 6). How an Amexit from NAFTA would hurt Canada. Globe and Mail.
Ridley, Matt (2010). The Rational Optimist. Harper Perennial.
Rioux, Jean-Sebastien (2016, August 4). CETA, TPP are in Trouble—what’s Canada’s Plan B? Globe and Mail.
Ritchie, Gordon (1997). Wrestling with the Elephant: The Inside Story of the Canada–U.S. Trade Wars. Macfarlane, Walter, and Ross.
Statistics Canada (2016a). Table 376-0051: International Investment Position, Canadian Direct Investment Abroad and Foreign Direct Investment in Canada, by Country. Government of Canada. <http://www5.statcan.gc.ca/cansim/a26?lang=eng&id=3760051>, as of September 21, 2016.
Statistics Canada (2016b). Table 380-0064: Gross Domestic Product, Expenditure-Based. Government of Canada. <http://www5.statcan.gc.ca/cansim/a26?lang=eng&id=3800064>, as of September 21, 2016.
Statistics Canada (2016c). Table 380-0080: Revenue, Expenditure and Budgetary Balance—General Governments. Government of Canada. <http://www5.statcan.gc.ca/cansim/a26?lang=eng&id=3800080>, as of September 21, 2016.
Statistics Canada (2016d). Table 228-0059: Merchandise Imports and Exports, Customs and Balance of Payments Basis for All
The Importance of International Trade to Canada’s Economy
fraserinstitute.org FRASER RESEARCH BULLETIN 13
Copyright © 2016 by the Fraser Institute. All rights re-served. Without written permission, only brief passag-es may be quoted in critical articles and reviews.
ISSN 2291-8620
Media queries: call 604.714.4582 or e-mail:
Support the Institute: call 1.800.665.3558, ext. 586, or
e-mail: [email protected]
Visit our website: www.fraserinstitute.org
Philip Cross worked for 36 years at Statistics Canada, the last few as its Chief Economic Analyst. He wrote Statistics Canada’s monthly assess-ment of the economy for years, as well as many feature articles for the Canadian Economic Observer. After leaving Statistics Canada, he has worked as a contract researcher for a variety of organizations. He has been widely quoted over the years, and now writes a bi-weekly column for the National Post and other papers.
AcknowledgmentsThe author would like to thank the anony-mous reviewers for their comments, sug-gestions, and insights. Any remaining errors or oversights are the sole responsibility of the author. As the researcher has worked independently, the views and conclusions expressed in this paper do not necessar-ily reflect those of the Board of Directors of the Fraser Institute, the staff, or supporters.
Countries, by Seasonal Adjustment and North American Product Classification (NAPCS). Government of Canada. <http://www5.statcan.gc.ca/cansim/a26?lang=eng&id=2280059>, as of September 21, 2016.
Statistics Canada (2016e). Table 381-0032: Value-Added Exports, by Industry. Government of Canada. <http://www5.statcan.gc.ca/cansim/a26?lang=eng&id=3810032>, as of September 21, 2016.
Statistics Canada (2016f). Table 228-0069: Merchandise Imports, Exports and Trade Balance, Customs and Balance of Payments Basis for All Countries, by Seasonal Adjustment and Principal Trading Partners. Government of Canada. <http://www5.statcan.gc.ca/cansim/a26?lang=eng&id=2280069>, as of September 21, 2016.
Statistics Canada (2016g). Table 380-0070: Exports and imports of goods and services. Government of Canada. <http://www5.statcan.gc.ca/cansim/a26?lang=eng&id=3800070>, as of Sept. 2016.
Statistics Canada (2016i). Table 228-0065: Merchandise Imports and Exports, Customs and Balance of Payments Basis for All Countries, by Seasonal Adjustment, Price and Volume Indexes, Weighting and North American Product Classification (NAPCS). Government of Canada. <http://www5.statcan.gc.ca/cansim/a26?lang=eng&id=2280070>, as of September 21, 2016.
United States Census Bureau (2015). Exhibit 20 U.S. Trade in Goods and Services by Selected Countries and Areas, BOP Basis. In Part C: Seasonally Adjusted (by Geography), U.S. International Trade in Goods and Services. Government of the United States. <http://www.census.gov/foreign-trade/statistics/notices/FT900_20.pdf>, as of August 2016.