The Impacts of State Ownership on Information Asymmetry ... Sami... · THE IMPACTS OF STATE...
38
13 CHINA JOURNAL OF ACCOUNTING RESEARCH, Vol 3 Issue 1 © LexisNexis, 2010 Jongmoo Jay Choi a , Heibatollah Sami b,** and Haiyan Zhou c a Department of Finance, Fox School of Business, Temple University, USA b Department of Accounting, Lehigh University, USA c Department of Accounting and Business Law, University of Texas–Pan American, USA e Impacts of State Ownership on Information Asymmetry: Evidence from an Emerging Market* Abstract is study examines the effect of corporate ownership on information asymmetry as measured by bid-ask spread in the emerging markets of China. Government ownership has significant and positive impacts on bid-ask spread during the period 1995-2000, but disappears afterward during 2001-2003. The finding that state ownership raised bid-ask spread in the early period is consistent with recent studies on emerging markets including China, which indicate that firms with higher state ownership tend to have a greater deviation between cash flow rights and control rights (eg, Wei et al., 2005). is implies that lower state ownership is associated with lower information asymmetry in the market, an economic consequence of significant economic reform and privatization regarding the market microstructure. However, with more active control transfers and * We would like to thank Dr. Xijia Su, the editor, Dr. Yuan Ding, the discussant, and the participants at the 3rd Symposium of China Journal of Accounting Research, and the 2008 Mid-Year Meeting of the International Accounting Section of the American Accounting Association for their insightful comments and suggestions on an earlier version of this paper. We also would like to express our gratefulness to Dr. Junxiong Fang for his help in editing our Chinese version of the abstract. is paper was developed based on a portion of an earlier paper under a different title presented at the 2006 Annual Conference of American Accounting Association (AAA) and the 2006 Symposium of Journal of Contemporary Accounting & Economics. Any remaining error is the responsibility of the authors. ** Corresponding author. Heibatollah Sami: E-mail address: [email protected]. Correspondence address: Department of Accounting, Lehigh University, Bethlehem, PA 18015, USA. Jongmoo Jay Choi: E-mail address: [email protected]. Correspondence address: Department of Finance, Fox School of Business, Temple University, Philadelphia, PA 19122, USA. Haiyan Zhou: E-mail address: [email protected]. Correspondence address: Department of Accounting and Business Law, University of Texas–Pan American, Edinburg, TX 78539, USA.
Transcript of The Impacts of State Ownership on Information Asymmetry ... Sami... · THE IMPACTS OF STATE...

13CHINA JOURNAL OF ACCOUNTING RESEARCH, Vol 3 Issue 1 © LexisNexis, 2010
Jongmoo Jay Choia, Heibatollah Samib,** and Haiyan Zhouc
a Department of Finance, Fox School of Business, Temple University, USAb Department of Accounting, Lehigh University, USA
c Department of Accounting and Business Law, University of Texas–Pan American, USA
The Impacts of State Ownership on Information Asymmetry:
Evidence from an Emerging Market*
Abstract
This study examines the effect of corporate ownership on information asymmetry as measured by bid-ask spread in the emerging markets of China. Government ownership has significant and positive impacts on bid-ask spread during the period 1995-2000, but disappears afterward during 2001-2003. The finding that state ownership raised bid-ask spread in the early period is consistent with recent studies on emerging markets including China, which indicate that firms with higher state ownership tend to have a greater deviation between cash flow rights and control rights (eg, Wei et al., 2005). This implies that lower state ownership is associated with lower information asymmetry in the market, an economic consequence of significant economic reform and privatization regarding the market microstructure. However, with more active control transfers and
* We would like to thank Dr. Xijia Su, the editor, Dr. Yuan Ding, the discussant, and the participants at the 3rd Symposium of China Journal of Accounting Research, and the 2008 Mid-Year Meeting of the International Accounting Section of the American Accounting Association for their insightful comments and suggestions on an earlier version of this paper. We also would like to express our gratefulness to Dr. Junxiong Fang for his help in editing our Chinese version of the abstract. This paper was developed based on a portion of an earlier paper under a different title presented at the 2006 Annual Conference of American Accounting Association (AAA) and the 2006 Symposium of Journal of Contemporary Accounting & Economics. Any remaining error is the responsibility of the authors.
** Corresponding author. Heibatollah Sami: E-mail address: [email protected]. Correspondence address: Department of Accounting, Lehigh University, Bethlehem, PA 18015, USA. Jongmoo Jay Choi: E-mail address: [email protected]. Correspondence address: Department of Finance, Fox School of Business, Temple University, Philadelphia, PA 19122, USA. Haiyan Zhou: E-mail address: [email protected]. Correspondence address: Department of Accounting and Business Law, University of Texas–Pan American, Edinburg, TX 78539, USA.

JONGMOO JAY CHOI, HEIBATOLLAH SAMI AND HAIYAN ZHOU14
emergence of private controlling shareholders, regulatory changes in ownership structure and corporate governance mechanisms, and thus an improved legal and institutional environment, the link between the government ownership and information asymmetry turns to be insignificant in the later period. These results have important implications for transparency and information disclosure policies as well as privatization in emerging markets.
JEL classification: G14; G15; G32; M41
Keywords: Bid-ask spread; Information asymmetry; Transparency; Adverse selection; Government (State) ownership; Foreign ownership; Emerging market (China)
1. Introduction
Information asymmetry underscores several key concepts in finance and accounting. In corporate finance, information asymmetry is commonly assumed to describe the relationship between corporate insiders and outside investors in the market (eg, Shleifer and Vishny, 1997). In financial accounting, information asymmetry is related to transparency. For example, various authors such as Verrecchia (2001) and Bushman et al. (2004) show that voluntary corporate disclosure reduces information asymmetry and improves general transparency, and thereby potentially enhances corporate valuation although it may also entail risk of disclosing useful information to competitors. And in market microstructure, information asymmetry faced by market makers may increase bid-ask spread because of the cost of adverse selection (eg, Stoll, 2003).1
We argue that one source of information asymmetry is corporate ownership structure in line with some studies that have related bid-ask spread to corporate insider and block ownership. Because the market may perceive insiders to have superior access to a firm’s private information, bid-ask spread may rise for all, suggesting a positive relationship between insider ownership and bid-ask spread (Chiang and Venkatesh, 1988). With
1 Information asymmetry models of bid-ask spreads such as Glosten and Milgrom (1985), and Easley and O’Hara (1987) envision a market consisting of informed traders, uninformed liquidity traders, and market makers [For more traditional models of bid-ask spreads, see Demsetz (1968) and Amihud and Mendelson (1986)]. Informed traders trade on private information not currently reflected in price, while uninformed liquidity traders trade based on public information or on their assessment of market fundamentals. Faced with the possibility of potential informed trading, market makers – who are not privy to private information – set a higher bid-ask spread for all market participants because of their inability to distinguish between trades that are information motivated or liquidity motivated. In effect, part of the cost of adverse selection stemming from facing informed trading is passed on to liquidity-based noise traders. A prediction of these models is that the bid-ask spread is an increasing function of information asymmetry. In addition, Brockman and Chung (2000) show that bid-ask spreads increase with information asymmetry regardless of whether trading is settled by market makers or dealers, and whether the market is quote-driven or order-driven.

THE IMPACTS OF STATE OWNERSHIP ON INFORMATION ASYMMETRY: EVIDENCE FROM AN EMERGING MARkET 15
regard to the effect of a controlling shareholder on agency costs of the firm, there are two competing effects (Morck et al., 1988). On the one hand, a controlling shareholder is more likely to monitor management actions, limit the extent of agency costs through incentive alignment between managers and outside investors, and reduce information asymmetry (Hope et al., 2009). On the other hand, a controlling shareholder can take advantage of controlling position, direct private benefits for personal consumption (which is the typical expropriation of minority shareholders and potentially creditors), and exacerbate information problems by increasing information asymmetry (eg, Barclay and Holderness, 1991; Heflin and Shaw, 2000).2
In this paper, we focus on the effects of state ownership on information asymmetry measured by bid-ask spread in China. As Verrecchia (2001) suggests, given their generally low information environments, emerging markets provide a unique setting to investigate the impacts of institutional characteristics on changes related to information. This is because the information content of major corporate strategies, such as ownership structure, are likely to be more pronounced in emerging markets than in rich information settings such as the US, where the marginal effect of information embedded in corporate strategies is not likely to be so strong.
Moreover, in China, the government has significant ownership holdings even for those “privatized” firms traded in the open market.3 Despite the fact that the government exists to improve public welfare, the informational consequences of particular government policies such as privatization or changes in state ownership are not clear. On the one hand, it is plausible that government regulations and reforms work for the benefit of improved general transparency for all. On the other hand, the government exercise of its control and ownership is also often selective, beset with bureaucratic rigidity, and/or favoring personal connections and political affiliations. Because of the political nature of the privatization programs (Wei et al., 2005), IPO (initial public offering) shares of Chinese state enterprises can be allocated to enhance the personal career benefits of CEOs (Chen et al., 2009a). To the extent that net effects of government policies are more selective than general, it is likely that the government ownership increases information asymmetry and hence increases bid-ask spread.
However, the changes in institutional environment could affect the link between the government corporate ownership and information asymmetry. There are a few major features of the recent institutional changes in the emerging markets of China which may result in such effects. First, starting in 2001, control transfers have become more active and private shareholders became controlling shareholders of some listed
2 In their study of US firms for 1985, kini and Mian (1995), however, report results that do not support the predictions of asymmetric information models: bid-ask spread has a statistically insignificant relation with insider ownership or block ownership.
3 Chen et al. (2009a) report that of the 1,213 state firms that had been privatized by IPOs from December 2000 to June 2006, the median state ownership is 33.9%.

JONGMOO JAY CHOI, HEIBATOLLAH SAMI AND HAIYAN ZHOU16
companies (Wang, 2010).4 Second, subsequent to a series of accounting scandals, such as Zheng Bai Wen (2000) and Yin Guang Xia (2001), and enhanced regulations on fraudulent financial statements and market manipulations, litigations against corporate management and auditors have become more significant (Chen et al., 2010). Third, the corporate governance structures of listed companies have been significantly improved after 2001 due to statutory regulations and guidelines (Wang, 2010). These changes in the institutional environment could help improve the disclosure transparency and affect the role of government ownership in the information environment. This suggests that it is important to control for these changes to study the link between government ownership and information asymmetry.
We believe that this study is the first of its kind to examine the effect of corporate ownership structure on the bid-ask spread in emerging markets.5 Our study also adopts a new perspective as it relates to the effects of government on bid-ask spread. Incorporating the recent institutional changes of the emerging markets, we conduct our empirical analyses separately for the two periods, pre-period versus post-period of institutional reform (the period of 1995-2000 versus the period of 2001-2003), using both single-equation and simultaneous estimation methods. We find that bid-ask spreads increased with state ownership before the institutional reforms. These results are consistent with a market perception that state owners, on balance, may have worked to exploit their specific information advantages more than to enhance general market-wide transparency6 in an emerging market when institutional facilities are not in place. However, when we analyze a sample for the post institutional reform period of 2001-2003, the effect of state ownership on information asymmetry disappears. Such results are indications that the reduction in the magnitude of state ownership, regulatory changes regarding ownership and corporate governance, and changes in legal and institutional environment help to reduce information asymmetry compared to previous periods.
The implications of these results go beyond the specifics of this paper. First, this study provides the first direct evidence on the impacts of ownership structure on information asymmetry as measured by bid-ask spread in emerging markets, thus linking corporate governance and market microstructure literatures. Second, unless proper safeguards are in place, we show that, from a market perspective, state investors may have an incentive to exploit their specific information asymmetry for their own interest rather than
4 One important feature is the transfers of state shares from government agents to market-oriented state-owned enterprises. According to Wang (2010), the percentage of shares of listed companies that were held by government agents declined from above 20% in 1994 to below 10% in 2004.
5 Several studies on Chinese capital markets, such as Sun and Tong (2003) and Wei et al. (2005), examine the effect of privatization and ownership changes on firm valuation. Cull and Xu (2005) show that property rights and private ownership influence profit reinvestment by the Chinese firms.

THE IMPACTS OF STATE OWNERSHIP ON INFORMATION ASYMMETRY: EVIDENCE FROM AN EMERGING MARkET 17
enhancing general informational transparency.6 These have significant implications for accounting standard setters and regulators, as well as for an insight into the potential economic consequences of privatization.
The remainder of the paper is organized as follows. Section 2 presents an overview of institutional background and develops hypotheses. Section 3 discusses research methodology, and Section 4 presents data and descriptive statistics. Section 5 discusses basic empirical results, and Section 6 explores further empirical issues. Section 7 concludes the paper.
2. Institutional Background and Hypotheses
2.1. Ownership Structure in China
The establishment of two national exchanges in Shanghai and Shenzhen in the early 1990s helped to privatize state-owned enterprises (SOE) in China. The number of publicly listed companies increased markedly from 14 in 1991 to 1,360 in December 2003. The market value of these two Chinese stock exchanges exceeded that of the Hong kong Stock Exchange in May 2001 (China Daily Press, June 2, 2001), which made China the second largest stock market in Asia after Japan.7 Compared to privatization in other countries where proceeds of share sales go to the government (Boubakri and Cosset, 1998; D’Souza and Megginson, 1999), the Chinese privatization programs tend to leave the funds at the discretion of the SOE, and the decision process appears to be more politically oriented (Wei et al., 2005).
In addition to shares for domestic investors (called A-shares), Chinese companies can issue shares to foreign investors (called B-shares) through the two national stock exchanges. Both types of shares are listed on both exchanges. The Chinese companies can also cross-list on other foreign stock exchanges, such as H-shares on the Hong kong Stock Exchange and other shares traded in the US, Uk, and Singapore. A-shares for domestic investors include five types: state, legal person, employee, individual, and management shares. Employee and management shares are those held by managers, directors and employees of listed companies. According to Chen et al. (2009b) and Wang (2010), management, foreign, and employee shares represent less than 2% of the
6 The sentiment here is similar to that of Claessens et al. (2002) who suggest, in a different context, that the deviation between control and ownership can lead to the entrenchment effect of large shareholders. Attig et al. (2006) find that stocks with greater deviations between ultimate control and ownership have a larger information asymmetry component of their bid-ask spread for a sample of Canadian firms.
7 Over the past several years, there have been significant developments in the stock markets in China. For instance, the number of publicly listed firms increased to 1,775 in February 2010 (www.crsc.gov.cn). In addition, during January 4 to 24, 2008, China surpassed Japan in stock-market capitalization for the first time. Again, on July 16, 2009, China overtook Japan as the world’s second largest stock market by value (for more details see www.bloomburg.com).

JONGMOO JAY CHOI, HEIBATOLLAH SAMI AND HAIYAN ZHOU18
outstanding shares, thus they cannot act as major voting block shareholders.8
The majority of shares are held by the government (“state shares”) and corporations or economic entities (“legal person shares”). State shares are those controlled by the Ministry of Finance through the State Assets Management Bureau (SAMB) and its local agencies, although some are also owned by state owned enterprises (SOEs) controlled by central government (SOECG) and local government (SOELG) (Chen et al., 2009b).9 Legal person shares are shares held by Chinese domestic legal entities, including corporations, financial institutions, and majority state-controlled enterprises. Legal-persons could also be other entities such as collectively owned enterprises, township and village enterprises, or other listed companies (Wang, 2010). To enhance the performance of listed companies, starting in 2001, the government has encouraged more active control transfers from government agents to SOEs (Chen et al., 2009b; Wang, 2010).
Despite privatization, the influence of government is pervasive. Beyond exercising its proportional shareholder rights, the government exercises controls through regulations and political directives, or through the appointment of management and members of the board of directors. The Chinese government generally endorses individuals considered for management and board membership. The regulation concerning IPOs includes a mandate that at least 25% of total outstanding shares should be issued to individual shareholders. Nevertheless, because of the dominance of state and institutional shares, individual investors typically are minority shareholders.
2.2. Changes in Institutional Environment and Hypothesis Development
State Ownership
Recent studies on emerging markets including China have focused on the impact of state ownership on firm performance (eg, Sun and Tong, 2007; Sami et al., 2009). Insiders such as former government officials may gain control of the firm either through
8 The changes in regulations on share transfers over the last several years have dramatically changed the share structures in China. For instance, the foreign acquisition of state-owned and legal shares in listed companies, which had been prohibited since 1995, has been permitted subsequent to the Notice on the Relevant Issues Regarding the Transfer of State-owned Shares and Legal shares of Listed Companies to Foreign Investors (2003). In addition, A-share market was opened to foreign investors pursuant to the Interim Provisions on the Administration of Security and Investment in China by Qualified Foreign Institutional Investors (2002), which was later replaced by the Provisions on the Administration of Security and Investment in China by Qualified Foreign Institutional Investors (2006). Thus the discussions on different share categories, which are relevant to our sample period, might not be applicable for the years after the reform.
9 In reality, government agents and market-oriented SOEs are the two types of entities exercising the control rights of state shares. Government agents became state shareholders when their sole-owned enterprise was restructured into a listed company, or when they invested their controlled state-owned assets in a listed company. These government agents could be: (1) central government ministries and commissions, (2) national industrial companies, (3) local government bureaus, (4) local branches of SAMB, and (5) local state assets operating companies. For detailed explanations, see Wang (2010) and Chen et al. (2009b).

THE IMPACTS OF STATE OWNERSHIP ON INFORMATION ASYMMETRY: EVIDENCE FROM AN EMERGING MARkET 19
direct government appointments or indirect political influence, despite owning few or no cash flow rights. Similarly, the actual government control of a partially privatized firm may be greater than what its ownership proportion may indicate – the government can influence the firm through policy directives and political influences, as well as the appointment of top management and board members (Sami et al., 2009). Companies with high level of state ownership also lack an effective personnel management system that establishes a clear link between performance and promotion. Because state ownership has a negative impact on firm performance, it is likely that high state ownership is associated with a high level of adverse selection by managers (Sun and Tong, 2003; Sami et al., 2009).
The level of state ownership should be positively associated with the level of information asymmetry, given that state ownership is positively associated with adverse selection by managers or that it creates a deviation between control and ownership. The deviation between control and ownership by the government may compromise general transparency and create information asymmetry. That is, firms with higher state ownership might have less incentive to commit to full corporate disclosure, especially when informed shareholders expropriate other shareholders’ interests. This would result in a larger information asymmetry component of the bid-ask spread (Attig et al., 2006).10
Alternatively, it is also possible that, as a promoter for the maximization of public welfare, the government seeks to enhance general transparency of corporate disclosure for all information users. With the status of a controlling shareholder, it could be easier and more efficient for the government to directly monitor management actions and thus actually reduce agency costs (Hope et al., 2009). Furthermore, the controlling state shareholders could enable a long investment horizon, which helps build strong relationships between the firms and external shareholders and creditors (Ellul et al., 2007). In this case, while the overall information environment of the market may improve, the information transparency would increase and thus relative information asymmetry would decline. If this is true, a higher state ownership may arguably be associated with a lower level of information asymmetry.
To summarize, state ownership could derive two forces that work in opposite directions. Political influence, increased agency costs and information problems associated with high state ownership work to increase information asymmetry. However, public-welfare maximization, incentive alignment, investment horizon effects, and greater monitoring associated with high state ownership will work to increase information transparency and decrease information asymmetry. More pertinent to our study on the emerging markets, we are primarily interested in the association between
10 An additional reason, which operates in the same direction, is a possibility that high state ownership implies less liquidity, which may result in higher bid-ask spread. It is not possible to sort this liquidity effect out from that of information asymmetry by estimating a reduced-form equation of bid-ask spread.

JONGMOO JAY CHOI, HEIBATOLLAH SAMI AND HAIYAN ZHOU20
state ownership and information asymmetry. When state ownership is high, political influence and ineffective management monitoring can play a greater role in increasing costs associated with agency and information problems.
However, the recent institutional changes could affect the link between government ownership and information asymmetry. One of the important features of these changes is related to the recent regulations on the ownership issues of public companies in China. First, an announcement was made by China’s State Council on the sale of state-owned shares in June 2001, which would change the nature of state shares and make it different from the practice in earlier years when state-shares were not allowed to be traded in public. Also, in recent years, more private enterprises developed into larger corporations and went public. These privately controlled firms increased dramatically and could have significantly changed the market microstructure. According to Sami et al. (2009), privately controlled firms increased significantly, from 120 (11% of listed firms) in 2001 to 531 (35% of listed firms) in 2007. In addition, commencing from 2001, domestic shareholders with foreign currency accounts have been allowed to purchase B-shares which had been sold only to foreign individual investors. This has not only provided more investment opportunities for individual shareholders and increased the public float but also complicated the foreign ownership issues.
Another important feature of the changing institutional environment is the enhanced regulations on fraudulent financial statements, market manipulations and increased legal litigation risks. Subsequent to a series of accounting scandals, litigation risks against corporate management and auditors and the number of public enforcement actions taken by regulatory agencies become more significant (Chen et al., 2010). For instance, the number of enforcement actions taken by the China Securities Regulatory Commission (CSRC) and the Shanghai and Shenzhen stock exchanges reached a peak of 71 cases in 2001, compared to 16 in 2000 (Pistor and Xu, 2005). In addition, in January 2002, the Supreme Court issued a corrective notice on accepting civil lawsuits against corporate management and their auditors involved in fraudulent statements, and permitted intermediate courts to accept such cases. According to China Economic Times (2002) quoted by Chen et al. (2010), 893 civil cases against listed companies and/or their auditors were accepted by the courts in 2002, as compared to about 400 cases in 1998 (CPA Newsletter 1998, quoted by Gul et al., 2009). The Supreme Court further promulgated the litigation rules in January 2003. It extended the conditions for the acceptance of securities litigation from CSRC sanctions to other administrative actions or criminal court rulings and placed the burden of proof on auditors in private securities litigation.11
11 For detailed discussions on the scandals and relevant lawsuits, see Chen et al. (2010).

THE IMPACTS OF STATE OWNERSHIP ON INFORMATION ASYMMETRY: EVIDENCE FROM AN EMERGING MARkET 21
Third, the corporate governance structure has been significantly improved after 2001. Recognizing the importance of corporate governance, the CSRC has issued a series of guidelines to improve corporate governance mechanisms of public companies. For instance, in conjunction with the State Economic and Trade Commission, the CSRC issued the Code of Corporate Governance for Listed Companies in 2001, which provided the basic rules of conduct for top management of listed companies. It also introduced the concept of independent directors and discouraged the dual positions of chairperson of the board and CEO. Further, the CSRC issued the Guidelines for Introducing Independent Directors to the Board of Directors of Listed Companies (2001), stipulating that at least one-third of the board should be independent by June 2003. These regulations have dramatically reformed the board structures of listed companies. According to Wang (2010), the percentage of firms with dual positions of Board Chair and CEO declined from 28.35% in 1999 to 23.47% in 2000 and dropped further to 20.32% in 2004. In addition, the percentage of firms with at least one independent director increased from 3.77% in 1999 to 8.49% in 2000 and 28.52% in 2001. The number increased to 97.65% in 2002, and 99.05% in 2003 (Wang, 2010).
These significant changes in the institutional environment could affect the relationship between state shareholders and information asymmetry. In particular, the changes in institutional features could deter political influence, and stem rising agency costs and information problems associated with high state ownership that influence increased information asymmetry. Therefore, we separately analyze the relationship between state ownership and information asymmetry for the periods before and after the institutional reforms in the emerging market settings.
Based on the above discussions, our hypothesis on the link between state ownership and the level of information asymmetry is stated in the following alternative format:
Hypothesis 1: There is a positive relation between state ownership and bid-ask spread.
Other Types of Ownership
Other ownership types could also influence information asymmetry. For example, a usual expectation concerning foreign corporate ownership is that foreign investors are at an informational disadvantage about a local firm compared with domestic investors. This is borne out by Choe et al. (2005), who show that domestic investors appear to have an informational edge in korea.12 If so, an increase in foreign ownership may lead to an increased demand and pressure for increased disclosure by local firms. Sami and Zhou (2004) find that the value relevance of accounting information in the B-share market of
12 In the same line of argument, Jiang and kim (2004) use an ex ante point of view and argue that the cost of being less informed is lower when foreign investors invest in a firm with low information asymmetry. Thus ceteris paribus, foreign investors are more likely to be attracted to firms with lower information asymmetry.

JONGMOO JAY CHOI, HEIBATOLLAH SAMI AND HAIYAN ZHOU22
China (where foreigners invest) is generally higher than in the A-share market (where domestic investors trade). The A-shares’ accounting information is prepared and audited for domestic investors under the domestic accounting standards, while the B-share information is prepared and audited for foreign investors under international accounting standards. Firms with foreign investors usually hire Big-Four CPA firms to help audit their financial statements. These features suggest that the presence of foreign ownership may help to improve the general information environment of public companies.13 The increased information transparency, as indicated in better accounting standards and higher quality of auditors, can improve the market liquidity (Lang et al., 2009). One of the economic consequences of information transparency, or increased disclosure as defined in Verrecchia (2001), should include a reduced level of information asymmetry in the market.
However, the literature also indicates that there is an incentive for foreign investors to maintain their superior information (Grinblatt and keloharju, 2000). Foreign (institutional) investors may have a relatively better capability to process public information into private value-relevant information than domestic individual investors. As the value of private information increases with information asymmetry, foreign investors might be associated with firms with high information asymmetry.
In the US, existing work on insider trading (Seyhun, 1992; Bris, 2000) provides evidence on the profitability of insider trading. Since insider holdings are perceived to have a potential for information asymmetry and adverse selection, there should be a positive relation between insider ownership and bid-ask spread (eg, Chiang and Venkatesh, 1988; Chung and Charoenwong, 1998). Using the IPO data for Chinese companies during 1994-1999, Su (2004) finds that given information asymmetry, insiders including managers, board members and private owners may retain a larger portion of shares to signal their confidence about the firm’s prospects. On the other hand, corporate managers are usually selected from the rank of government bureaucrats and the extent of managerial ownership in China is limited. This may moderate the influence of insider ownership. Studies suggest a positive relationship between inside ownership and bid-ask spread.
O’Brien and Bhushan (1990) and others argue that firms with high institutional holdings have a high level of analyst coverage, which leads to information dissemination and lower information asymmetry. However, the effect of institutional ownership also depends on the nature of institutions (Lakonishok et al., 1992). Fehle (2004) shows that while the effect of institutional ownership on bid-ask spread is generally negative in the US (eg, Van Ness et al., 2001), it is positive for certain types of institutions such as banks and investment management companies. Moreover, because the analysts’ industry
13 In addition, foreign investors are shown to contribute to firm performance through shareholder activism and board representation (Choi et al., 2007), by the use of more sophisticated valuation method (Wei et al., 2005), and during the privatization process of state-owned enterprises (Xu et al., 2005).

THE IMPACTS OF STATE OWNERSHIP ON INFORMATION ASYMMETRY: EVIDENCE FROM AN EMERGING MARkET 23
and capability are not well developed in emerging markets, their role in information dissemination in China may be limited. Given the less-developed corporate governance system, institutional investors may then have an incentive to use private information obtained by monitoring in order to extract rent from minority shareholders rather than to contribute to information dissemination. This implies an increase in information asymmetry. Hence, although there may be a significant relationship between institutional ownership and information asymmetry, its net effect is less clear in emerging markets.
As mentioned earlier, block shareholders are believed to have private information because of their role as a monitor of corporate operations (eg, Bethel et al., 1998). Thus firms with higher block ownership, either by managers or external entities, have larger bid-ask spreads for US firms (Heflin and Shaw, 2000). However, a block (controlling) shareholder may actually help reduce agency costs, as the monitoring of management actions increases with ownership concentration. Furthermore, block shareholders could implement a long-term investment perspective which encourages the building of a strong contracting link between the firm and its investors. This could facilitate an improved information environment and increased information transparency (Hope et al., 2009), and hence reduce information asymmetry. The block shareholders most likely are state shareholders, institutional shareholders or foreign shareholders in our research settings.14
Because the different types of ownership coexist at the same time in a firm, it is better to simultaneously investigate their roles in issues related to corporate governance, agency cost and information disclosure in order to develop a more comprehensive understanding of the role of ownership structure in these issues. Therefore, we also control these ownership types to reveal the effects of state ownership together with foreign, insider, institutional and block ownership on the information environment.
3. Research Methodology
The bid-ask spread model is first estimated using the ordinary least squares (OLS) as a function of state ownership plus control variables including volume turnover and return volatility in addition to foreign, insider, institutional and block ownership. Turnover and volatility are then endogenized by estimating a simultaneous system using the three stage least squares (3SLS). We also estimate the model for an adverse selection component rather than the total bid-ask spread and perform various robustness checks.
To examine the effect of state ownership, we adopt the following empirical model for
14 Because the block shareholders most likely are state shareholders, institutional shareholders or foreign shareholders in our research settings, we add the block ownership variable as a possible control for the effects of other types of shareholders who fall into the controlling position of a firm. As an alternative measure, we also use the residual from a regression of block ownership on state, foreign and institutional ownership to control for the same issue and the results remain the same.

JONGMOO JAY CHOI, HEIBATOLLAH SAMI AND HAIYAN ZHOU24
bid-ask spread:
SPREADit = α0 + α1 STATEit + α2 FOREIGNit + α3 TURNOVERit + α4 VOLATILITYit + α5 SIZEit + α6 BLOCkit + α7 INSIDERit + α8 INSTit + α YEAR + eit (1)
The model represents our focus on ownership and other variables such as volume and volatility that may measure market information environments. The left-hand side variable, SPREAD is measured in percentage, by an average weekly bid-ask spread (ask minus bid divided by the average of these two prices) of firm i in year t.
As an explanatory variable of our primary interest, state ownership (STATE) is measured by the percentage of state shares held by government.15 Foreign ownership (FOREIGN) is measured by the percentage of shares held by registered foreign individual investors.16 Insider ownership (INSIDER) is measured by the percentage of shares owned by managers and directors; institutional ownership (INST) is measured by the percentage of shares held by domestic securities companies, insurance companies, depository institutions, investment companies, endowment funds, and mutual funds;17 block ownership (BLOCk) is measured by the percentage of shares held by stockholders with no less than three percent equity ownership.18
As other control variables, we include volume turnover rate, which is likely to affect bid-ask spread negatively (eg, Copeland and Galai, 1983). We also include a measure of volatility because, for an order-driven market, the extent of trading gains by informed traders is a positive function of return volatility (Aitken and Frino, 1996). In addition, large companies tend to have lower spreads (Greenstein and Sami, 1994), and analyst following and media coverage increase with firm size (Chiang and Venkatesh, 1988). Hence, we include firm size to control for a firm’s information environment (Leuz and Verrecchia, 2000). The indicator variable for year and its interaction terms are included
15 As an alternative measure, we use the total share percentage owned by state and state controlling enterprises (state ownership is no less than 50%) to measure the ownership of government and the results are similar to what we reported. In addition, as a sensitivity test, we include both variables (state share percentage and share percentage owned by state controlling enterprises in the regression model). The results on the two variables are similar to each other as discussed under the Sensitivity Test section.
16 As an alternative measure, we use the total share percentage owned by foreign individuals and institutions to measure the ownership of foreign investors and the results are similar to those reported.
17 As an alternative measure, we use the total share percentage owned by domestic and foreign institutions to measure the institutional ownership and the results are similar to those reported. Our definition of institutional ownership is standard in empirical corporate finance. However, Wei et al. (2005) use a broader definition for institutional shareholders, which include domestic state-controlled enterprises as well as financial institutions. As a robustness test, we also use this alternative definition of institutional ownership, and the results again are similar to those reported.
18 We also experimented with an alternative level of block ownership such as the percentage shares held by stockholders with no less than one percent ownership, and the percentage shares held by top ten stockholders, with no appreciable qualitative differences.
5
8+j jj=1∑

THE IMPACTS OF STATE OWNERSHIP ON INFORMATION ASYMMETRY: EVIDENCE FROM AN EMERGING MARkET 25
to control for the intertemporal effects of institutional and regulatory changes over time. Specifically, SIZE is a log of average weekly market value of the firm’s equity during
the year, and YEAR is an indicator variable for calendar year. TURNOVER is the average weekly turnover measured by the value of trading volume divided by market value of the equity, in Renminbi, of a firm for year t, and VOLATILITY is an average of the 52-week standard deviations of daily returns of firm’s stock during year t.
A single-equation specification above assumes an exogeneity of all explanatory variables. However, it is plausible that information asymmetry reflected in the ownership structure can also influence some of these variables, especially volume turnover and volatility. To address this concern, we estimate volume turnover and return volatility endogenously along with bid-ask spread using the following models:
TURNOVERit = α0 + α1 SIZEit + α2 VOLATILITYit + α3 INDEXit + α4 STATEit + α5 FOREIGNit + α6 BLOCkit + α7 INSIDERit +α8 INSTit + YEAR + eit (2)
VOLATILITYit = α0 + α1 SIZEit + α2 BETAit + α3 STATEit + α4 FOREIGNit + α5 BLOCkit + α6 INSIDERit +α7 INSTit + YEAR + eit (3)
Each of these two models includes ownership variables as explanatory variables. In the volume turnover model, we follow Leuz and Verrecchia (2000) and include INDEX, which is one if the company’s stock is included in the composite share index on the Shenzhen Stock Exchange or in the SH180 index on the Shanghai Stock Exchange, and zero otherwise. Included in the volatility model is BETA, which is a measure of the firm’s systematic risk and is estimated with weekly returns for the 52-week period.
4. Data and Descriptive Statistics
Our sample selection starts with the entire population of firms listed on either the Shanghai Stock Exchange or the Shenzhen Stock Exchange at the beginning of 1995. These firms are then subject to the following screening criteria: (1) daily last bid and ask prices as well as daily closing price data are available for the period of 1995-2000 in the Taiwan Economic Journal Database (TEJ); (2) annual corporate reports (with known report dates) are available from a Chinese website, www.stock2000.com.cn; and (3) information on trading volume and publicly held shares are available from TEJ.
As shown in Table 1, this screening procedure resulted in a sample of 271 firms under the fixed-firm approach, which yields 1,549 firm-year observations for the analysis of the pre-period of institutional reform (1995-2000) and 797 firm-year observations for the post period (2001-2003). As indicated earlier, we analyze the periods 1995-2000 and 2001-2003 separately as the institutional environment experienced significant changes around 2001. The fixed-firm approach is used to control for the impact of inter-firm
5
7+jj=1
j
j
5
8+jj=1∑
∑
α
α

JONGMOO JAY CHOI, HEIBATOLLAH SAMI AND HAIYAN ZHOU26
differences in firm characteristics. However, to increase the external validity of our results, we also conducted our tests using pooled data. As shown in Table 1, using the pooled sample approach, the same screening procedure resulted in 3,498 firm-year observations (from 1,002 firms) for the analysis of the pre-period of institutional reform (1995-2000) and 3,442 firm-year observations (from 1,219 firms) for the post period (2001-2003).
Table 1. Sample SelectionSample Selection Procedure Number of Firms Number of Observations
Fixed-Firm Sample
Firms issuing A-shares whose stock price information is available since January 1995 287Less: Firms whose disclosure dates are not available from the Taiwan
Economic Journal Database (TEJ) or from their annual reports 10Less: Firms whose bid or ask prices are not available from the Taiwan
Economic Journal Database (TEJ) 6Total firms available for analysis 271
Firm-year observations for the period of 1995-2000 271 1,549Firm-year observations for the period of 2001-2003 271 797
Pooled-Firm Sample
Firms issuing A-shares whose stock price information is available for the period of 1995-2003 1,261Less: Firms whose disclosure dates are not available from the Taiwan
Economic Journal Database (TEJ) or from their annual reports 3Less: Firms whose bid or ask prices are not available from the Taiwan
Economic Journal Database (TEJ) 39Total firms available for analysis 1,219
Firm-year observations for the period of 1995-2000 1,002 3,498Firm-year observations for the period of 2001-2003 1,219 3,442
Table 2 presents the descriptive statistics for variables used in the empirical work. In the pre-period of institutional reforms, the mean bid-ask spread across fixed sample firms is 0.272 (median is 0.252), while in the post period the mean is -0.004 (median is 0.002).19 The mean value of INDEX is 0.248 in the pre-period and 0.256 in the post-period, indicating that about a quarter of companies in the sample are included in the Shenzhen composite share price index or in the Shanghai SH180 index. Both the mean and median of systematic risk are about one in the two periods, which shows the
19 To simplify the presentation of our results, we only reported the statistical description and correlation coefficients for the fixed-firm sample here.

THE IMPACTS OF STATE OWNERSHIP ON INFORMATION ASYMMETRY: EVIDENCE FROM AN EMERGING MARkET 27
efficacy of our sample in mimicking the market portfolio. The mean insider ownership is only 0.3% in the pre-period and 0.2% in the post-period but the maximum reaches 38.7% and 32.4% in the pre- and post-periods, respectively. Institutional ownership is more sizable, with a mean of 22.9% in the pre-period and 26.1% in the post-period. In our sample of “privatized” firms, the average share of government ownership slightly decreased from 30.1% in the pre-period to 27% in the post-period, which is comparable to those reported elsewhere (eg, Chen et al., 2009a). The average foreign ownership slightly increased from 6.8% in the pre-period to 8.5% in the post-period, but for the sample of firms with foreign ownership, the foreign influence can be substantial, with a maximum foreign ownership reaching 66.4% for both periods. The remaining shareholders other than these four categories should be largely domestic individual investors. However, block ownership with at least 3% ownership has a mean of 52.5% in the pre-period and 49.3% in the post-period, which indicates a degree of concentration in the Chinese stock markets.
Table 2. Descriptive Statistics
Variables Maximum Quartile 3 Median Mean Quartile 1 Minimum
Panel A: Pre-period of Institutional ReformsSPREAD 0.914 0.335 0.252 0.272 0.190 0.075
VOLATILITY 9.909 3.155 2.712 2.743 2.261 1.196
TURNOVER 16.285 2.728 1.895 2.270 1.222 0.173
SIZE 10.351 8.031 7.470 7.506 6.923 5.442
INDEX 1.000 0.000 0.000 0.248 0.000 0.000
BETA 2.213 1.204 1.052 1.014 0.898 0.066
INSIDER 0.387 0.000 0.000 0.003 0.000 0.000
STATE 0.886 0.506 0.322 0.301 0.000 0.000
INST 0.907 0.39 0.162 0.229 0.009 0.000
FOREIGN 0.664 0.000 0.000 0.068 0.000 0.000
BLOCk 0.861 0.640 0.524 0.525 0.416 0.000
Panel B: Post-period of Institutional ReformsSPREAD 0.224 0.043 0.002 -0.004 -0.040 -0.264
VOLATILITY 4.480 2.140 1.890 1.907 1.650 0.700
TURNOVER 7.722 1.216 0.811 0.983 0.583 0.163
SIZE 17.087 15.294 14.825 14.895 14.414 13.317
INDEX 1.000 1.000 0.000 0.256 0.000 0.000
BETA 1.713 1.229 1.075 0.931 0.796 -0.299
INSIDER 0.324 0.000 0.000 0.002 0.000 0.000
STATE 0.886 0.452 0.297 0.270 0.000 0.000
INST 0.864 0.433 0.207 0.261 0.062 0.000

JONGMOO JAY CHOI, HEIBATOLLAH SAMI AND HAIYAN ZHOU28
Variables Maximum Quartile 3 Median Mean Quartile 1 Minimum
FOREIGN 0.664 0.146 0.000 0.085 0.000 0.000
BLOCk 0.886 0.589 0.493 0.493 0.393 0.032
Note: SPREAD = average weekly bid-ask spread in percentage during the year; SIZE = log of average weekly market value of the firm’s equity during the year; TURNOVER = average weekly share turnover during the year where share turnover is defined as the dollar amount of trading volume divided by the market value of the equity of the firm; VOLATILITY = average of 52-week standard deviation of daily returns during the year; INDEX = 1 if the company’s stock is included in the composite share index on Shenzhen Stock Exchange or in the SH180 index on Shanghai Stock Exchange (and 0 otherwise); BETA = systematic market risk of the firm, estimated from weekly return for the 52-week period; INSIDER = the percentage of common equity shares held by managers and directors; STATE = the percentage of state shares; INST = the percentage of common equity shares held by domestic institutions, such as securities companies, insurance companies, depository institutions, investment companies, endowment funds, and mutual funds; FOREIGN = the percentage of common equity shares held by registered foreign individuals; BLOCK = the percentage of common equity shares held by stockholders with no less than 3% ownership according to the annual report. Data is for the fixed-firm sample.
Prior to estimating the regression equation, we computed the Pearson correlation
coefficients among explanatory variables included in equation (1) for the two periods. Somewhat surprisingly, there is little correlation (0.023 in the pre-period and 0.005 in the post-period) between institutional ownership and block ownership (Table 3). Similarly, there is little correlation between insider ownership and any of the other ownership variables except that between insider and block ownership in the post-period (0.14). However, state ownership and institutional ownership have a high negative correlation (-0.747 in the pre-period and -0.767 in the post-period), indicating that the majority of privatization cases may involve a sale of SOE shares to institutional investors. However, we compute variance inflation factors (VIF) for all equations, and the results suggest that multicollinearity is not a serious problem, as none of the VIF values is greater than the suggested benchmark of 10 (Gujarati, 1995, p339). In addition, volume turnover and volatility have a relatively high correlation (0.719 in the pre-period and 0.674 in the post-period). Hence, as sensitivity tests, we also included these variables separately in the estimation, with no appreciable differences from those obtained when both variables are included. Later, the relation between turnover and volatility is further directly estimated using the 3SLS. Again, tests of multicollinearity for all explanatory variables in the bid-ask spread equation using the methods by Belsley et al. (1980) and Gujarati (1995) indicate no serious multicollinearity problem.

THE IMPACTS OF STATE OWNERSHIP ON INFORMATION ASYMMETRY: EVIDENCE FROM AN EMERGING MARkET 29
Tabl
e 3.
Pe
arso
n C
orre
latio
n M
atri
x of
Maj
or V
aria
bles
SPR
EAD
VOLA
TIL
ITY
TU
RN
OV
ERSI
ZEIN
DEX
BET
AIN
SID
ERST
ATE
INST
FOR
EIG
N
Pane
l A: P
re-p
erio
d of
Insti
tutio
nal R
eform
sV
OLA
TIL
ITY
0.21
10
TU
RN
OV
ER0.
014
0.71
90.
573
0SI
ZE
-0.5
65-0
.293
-0.1
640
00
IND
EX-0
.183
-0.1
26-0
.112
0.40
90
00
0BE
TA0.
004
-0.2
540.
005
-0.0
220.
009
0.88
70
0.85
90.
383
0.72
6IN
SID
ER0.
078
0.02
5-0
.015
-0.0
630.
022
0.00
10.
002
0.33
50.
557
0.01
40.
388
0.97
6ST
ATE
0.06
20.
026
0.04
40.
144
-0.0
36-0
.019
-0.0
570.
014
0.31
10.
081
00.
155
0.44
50.
024
INST
0.14
50.
092
0.01
4-0
.170
0.01
10.
008
0.07
0-0
.747
00
0.57
20
0.67
80.
745
0.00
60
FOR
EIG
N0.
037
-0.0
46-0
.007
0.20
0-0
.049
0.00
8-0
.058
0.07
4-0
.179
0.14
30.
069
0.78
40
0.05
40.
765
0.02
20.
004
0BL
OC
k0.
109
0.07
00.
054
0.14
2-0
.091
-0.0
22-0
.050
0.39
70.
023
0.10
20
0.00
60.
034
00
0.38
70.
051
00.
365
0

JONGMOO JAY CHOI, HEIBATOLLAH SAMI AND HAIYAN ZHOU30SP
REA
DVO
LAT
ILIT
YT
UR
NO
VER
SIZE
IND
EXB
ETA
INSI
DER
STAT
EIN
STFO
REI
GN
Pane
l B: P
ost-p
erio
d of
Insti
tutio
nal R
eform
sV
OLA
TIL
ITY
0.03
80.
297
TU
RN
OV
ER0.
014
0.67
40.
692
0SI
ZE
-0.0
71-0
.256
-0.0
760.
050
00
IND
EX-0
.014
-0.1
79-0
.200
0.47
90.
696
00
0BE
TA0.
040
0.33
70.
126
-0.1
090.
054
0.27
50
00.
003
0.14
0IN
SID
ER-0
.009
-0.0
45-0
.013
0.18
60.
096
0.02
70.
008
0.21
00.
710
00.
007
0.45
6ST
ATE
0.01
70.
003
0.06
70.
216
0.01
10.
078
-0.0
670.
631
0.93
30.
066
00.
700
0.03
00.
061
INST
-0.0
190.
048
0.01
0-0
.184
-0.1
18-0
.065
-0.0
64-0
.767
0.60
50.
183
0.78
60
00.
073
0.07
00
FOR
EIG
N0.
032
0.06
20.
224
0.23
4-0
.896
-0.0
18-0
.040
0.00
7-0
.190
0.38
40.
090
00
0.01
20.
616
0.25
50.
848
0BL
OC
k0.
024
0.05
50.
145
0.18
5-0
.130
0.00
90.
140
0.43
20.
005
0.12
80.
505
0.12
30
00
0.81
00
00.
877
0
Not
e: SP
READ
= a
vera
ge w
eekl
y re
lativ
e bi
d-as
k sp
read
(in
perc
enta
ge) i
n ye
ar t;
SIZ
E =
log
of a
vera
ge w
eekl
y m
arke
t val
ue o
f the
firm
’s eq
uity
in y
ear
t; TU
RNO
VER
= av
erag
e w
eekl
y sh
are t
urno
ver i
n ye
ar t
whe
re sh
are t
urno
ver i
s defi
ned
as th
e dol
lar a
mou
nt o
f tra
ding
vol
ume d
ivid
ed b
y th
e mar
ket v
alue
of t
he fi
rm; V
OLA
TILI
TY
= av
erag
e of 5
2-w
eek
stand
ard
devi
atio
n of
dai
ly re
turn
s in
year
t; IN
DEX
= 1
if th
e com
pany
’s sto
ck is
inclu
ded
in th
e com
posit
e sha
re in
dex
on S
henz
hen
stock
exch
ange
or S
H18
0 in
dex
on S
hang
hai s
tock
exch
ange
(a
nd 0
oth
erw
ise);
BETA
= sy
stem
atic
risk
of fi
rm i,
esti
mat
ed w
ith w
eekl
y re
turn
s in
year
t; I
NSI
DER
= th
e to
tal p
erce
ntag
e of
shar
es he
ld b
y m
anag
ers,
dire
ctors
and
othe
r in
sider
s; ST
ATE
= th
e pe
rcen
tage
of s
tate
shar
es; I
NST
= th
e to
tal p
erce
ntag
e of
shar
es he
ld b
y do
mest
ic in
stitu
tions
, suc
h as
secu
rities
com
pani
es, in
sura
nce
com
pani
es, d
epos
itory
insti
tutio
ns,
inve
stmen
t com
pani
es, en
dow
men
t fun
ds, a
nd m
utua
l fun
ds; F
ORE
IGN
= th
e tot
al p
erce
ntag
e of s
hare
s held
by f
oreig
n in
divi
dual
inve
stors;
BLO
CK
= th
e tot
al p
erce
ntag
e of s
hare
s held
by
stoc
khol
ders
with
no
less t
han
3% ow
nersh
ip a
ccor
ding
to th
e ann
ual r
epor
t. Th
e dat
a is
for t
he fi
xed
sam
ple.

THE IMPACTS OF STATE OWNERSHIP ON INFORMATION ASYMMETRY: EVIDENCE FROM AN EMERGING MARkET 31
5. Basic Empirical Results
5.1. Pre-period of Institutional Reforms
Table 4 reports the OLS results of equation (1) using the fixed-firm sample. The result shows a positive and significant relationship between state ownership and bid-ask spread. This confirms Hypothesis 1, indicating that firms with a higher state ownership have a higher information asymmetry as reflected in bid-ask spread. This is consistent with earlier findings that firms with higher state ownership tend to have a greater deviation between cash flow rights and control rights (eg, Wei et al., 2005). When state ownership is high, political influence and ineffective management monitoring can play a greater role in increasing costs associated with agency and information problems. Our findings are consistent with the notion that the government, as a partial owner of the firm, tends to engage in selective and unscrupulous policies pertaining to information conveyance which increases information asymmetry rather than enhancing general information environments for all. Therefore, in the emerging market settings, and without proper regulations and corporate governance structure, firms with higher state ownership will be associated with a higher level of information asymmetry.
Table 4. Pre-period of Institutional Reforms: OLS Analysis of State Ownership and Bid-Ask Spread
Variables Coefficient T-statistics Two-tail p-valueIntercept 0.684 *** 28.51 <.0001
STATE 0.140 *** 8.84 <.0001
FOREIGN 0.126 *** 8.46 <.0001
INSIDER -0.020 -0.21 0.8310
INST 0.132 *** 7.97 <.0001
BLOCk 0.013 0.83 0.4087
VOLATILITY 0.007 1.23 0.2187
TURNOVER -0.016 *** -7.73 <.0001
SIZE -0.055 *** -19.46 <.0001
YEAR1 -0.009 -1.04 0.2973
YEAR2 -0.081 *** -10.79 <.0001
YEAR3 -0.112 *** -15.76 <.0001
YEAR4 -0.074 *** -9.13 <.0001
YEAR5 -0.120 *** -13.93 <.0001
Adjusted R2 56.35%
F-value 154.73
*** significant at 0.01, ** significant at 0.05, * significant at 0.10, respectively (two-tail test).
Note: Estimation is done by the OLS based on pooled time series and cross sectional data for 271 publicly traded Chinese firms (1,549 firm-year observations) for the period of 1995-2000. A specific form of ownership is used in regression.

JONGMOO JAY CHOI, HEIBATOLLAH SAMI AND HAIYAN ZHOU32
SPREAD = average weekly bid-ask spread in percentage during the year; SIZE = log of average weekly market value of the firm’s equity during the year; TURNOVER = average weekly share turnover during the year where share turnover is defined as the dollar amount of trading volume divided by the market value of the equity of the firm; VOLATILITY = average of 52-week standard deviation of daily returns during the year; INDEX = 1 if the company’s stock is included in the composite share index on Shenzhen Stock Exchange or in the SH180 index on Shanghai Stock Exchange (and 0 otherwise); BETA = systematic market risk of the firm, estimated from weekly return for the 52-week period; INSIDER = the percentage of common equity shares held by managers and directors; STATE = the percentage of state shares; INST = the percentage of common equity shares held by domestic institutions, such as securities companies, insurance companies, depository institutions, investment companies, endowment funds, and mutual funds; FOREIGN = the percentage of common equity shares held by registered foreign individuals; BLOCK = the percentage of common equity shares held by stockholders with no less than 3% ownership according to the annual report. Data period is from 1995 to 2000 and the sample is a fixed-firm sample.
Regarding other ownership variables, the coefficient of foreign ownership is significant and positive which is consistent with a part of our previous discussion regarding the effect of foreign ownership on bid-ask spread. We find no significant relationship between insider ownership and bid-ask spread. The weak result on insider ownership is consistent with the result of kini and Mian (1995) for the US firms. Similarly, the coefficient of block ownership is statistically insignificant. Similar results are obtained with alternative measures of block ownership, such as the percentage of shares owned by stockholders with 1% or more equity ownership, and the percentage of shares owned by top ten stockholders. However, the effect of institutional ownership is highly significant and positive. This is suggestive of a breakdown in corporate governance systems in the emerging markets of China. Institutional investors have incentives to use private information obtained by monitoring to extract rent from minority shareholders rather than to contribute to information dissemination.
There is evidence that the bid-ask spread has narrowed over time due to an improvement in the general information environment, as indicated by the negative and significant coefficients of YEAR variables after year one (1995). In addition, the F tests for the joint effects of ownership and interaction terms involving ownership and time (not reported) show that the net intertemporal effect of state ownership is positive and significant. That is, even considering the intertemporal changes over time, state ownership is shown to raise the bid-ask spread due to information asymmetry. To the extent that the information consequence of state ownership is more selective than general, it presents a challenge for Chinese policymakers in terms of their privatization and market liberalization as to how a general information environment can be improved rather than for the selected few.
As expected, volume turnover has a significant and negative effect on bid-ask spread. Return volatility has a positive coefficient as expected, although it is not statistically significant. As expected, firm size is shown to lower the bid-ask spread. Additional analysis including interaction terms with a time-trend variable indicates that the effect of turnover on bid-ask spread has increased over time while that of volatility has decreased.
Table 5 reports the results of 3SLS for the fixed-firm sample where volume turnover and volatility, along with bid-ask spread, are endogenously estimated. The result in Panel A for bid-ask spread confirms the result from the single-equation estimation in Table 4.

THE IMPACTS OF STATE OWNERSHIP ON INFORMATION ASYMMETRY: EVIDENCE FROM AN EMERGING MARkET 33
Again, the effect of state ownership is significant and positive. In addition, the effects of foreign and institutional ownership on bid-ask spread are significant and positive, while insider and block ownership are statistically insignificant. One difference from Table 4 is that the coefficient of volume turnover is statistically insignificant. These results remain the same when we perform additional analysis including interaction terms between ownership variables and a time-trend variable.
Table 5. Pre-period of Institutional Reforms: 3SLS Analysis of State Ownership and Bid-Ask Spread
Variables Coefficient T-statistics Two-tail p-valueSystem Weighted R2 58.59%Panel A: Bid-Ask ModelIntercept 0.422 ** 2.22 0.0263
STATE 0.116 *** 4.61 <.0001
FOREIGN 0.104 *** 4.50 <.0001
INSIDER -0.018 -0.17 0.8646
INST 0.129 *** 6.66 <.0001
BLOCk -0.031 -0.89 0.3711
VOLATILITY 0.007 0.54 0.5871
TURNOVER 0.062 1.18 0.2370
SIZE -0.026 -1.28 0.1998
YEAR1 -0.288 -1.50 0.1327
YEAR2 -0.173 *** -2.66 0.0078
YEAR3 -0.167 *** -4.38 <.0001
YEAR4 -0.177 ** -2.45 0.0144
YEAR5 -0.201 *** -3.65 0.0003

JONGMOO JAY CHOI, HEIBATOLLAH SAMI AND HAIYAN ZHOU34
Variables Coefficient T-statistics Two-tail p-valueSystem Weighted R2 58.59%Panel B: Volume Turnover ModelIntercept 3.619 *** 5.77 <.0001
STATE 0.330 1.31 0.1919
FOREIGN 0.295 1.24 0.2157
INSIDER 0.022 0.02 0.9880
INST 0.050 0.19 0.8501
BLOCk 0.583 ** 2.40 0.0165
VOLATILITY -0.074 -0.45 0.6559
SIZE -0.390 *** -7.28 <.0001
INDEX 0.014 0.23 0.8151
YEAR1 3.652 *** 16.77 <.0001
YEAR2 1.240 *** 7.89 <.0001
YEAR3 0.712 *** 6.32 <.0001
YEAR4 1.378 *** 8.87 <.0001
YEAR5 1.027 *** 7.42 <.0001
System Weighted R2 58.59%
Panel C: Return Volatility ModelIntercept 3.532 *** 34.59 <.0001
STATE 0.149 * 1.73 0.0838
FOREIGN -0.027 -0.34 0.7338
INSIDER 0.471 0.94 0.3456
INST 0.122 1.36 0.1731
BLOCk 0.221 *** 2.69 0.0071
SIZE -0.166 *** -11.13 <.0001
BETA -0.120 *** -17.57 <.0001
YEAR1 1.153 *** 31.70 <.0001
YEAR2 0.703 *** 18.83 <.0001
YEAR3 0.088 ** 2.33 0.0199
YEAR4 0.598 *** 14.53 <.0001
YEAR5 -0.214 *** -4.85 <.0001
System Weighted R2 58.59%
*** significant at 0.01, ** significant at 0.05, * significant at 0.10, respectively (two-tail test).
Note: Estimation is done by 3SLS based on a fixed-firm sample of 271 publicly traded Chinese firms (1,549 firm-year observations) for the period of 1995-2000. See Table 2 for definitions of variables.

THE IMPACTS OF STATE OWNERSHIP ON INFORMATION ASYMMETRY: EVIDENCE FROM AN EMERGING MARkET 35
Panels B and C explore the impacts of ownership structure on turnover and volatility. In Panel B, state ownership has a marginally significant coefficient under one-tail test (p=0.0959). Foreign ownership has no significant effect on volume turnover although the coefficient is positive. In Panel C, state ownership again is shown to increase price volatility. Foreign ownership has no significant effect on price volatility although the coefficient is negative. Thus, we did not find any evidence on the popular sentiment about a potentially destabilizing influence of foreign investors.20 As to other ownership variables, although no effects of block ownership on bid-ask spreads are found, block investors are shown to increase turnover and volatility. Insider and institutional ownership have no significant effect on volume turnover or price volatility.
5.2. Post-period of Institutional Reforms
Table 6 reports the OLS results of equation (1) for the post-period of institutional reforms. The result shows no significant relationship between state ownership and bid-ask spread. This confirms our conjecture, indicating that the changes regarding the recent regulations of state ownership and market microstructure, legal litigation risks, and corporate governance mechanisms improved the information environment. In particular, the changes in these institutional features could deter political influence, and hold constant or reduce agency costs, and reduce information problems associated with high state ownership that work to increase information asymmetry. This is consistent with earlier evidence suggesting that the institutional environment significantly changed around 2001. For instance, Chen et al. (2010) find that the frequency of modified audit opinions is negatively related to client importance from 1995 to 2000 but positively related from 2001 to 2004. Our findings are consistent with their findings in suggesting that the significant changes in institutional environment could significantly affect the relationship between state ownership and bid-ask spread, as changes in ownership regulations regarding state shares and market microstructure, legal litigation risks and corporate governance mechanisms would deter the state shareholder from engaging in selective and unscrupulous policies pertaining to information conveyance. Similarly, the coefficients of other ownership variables are statistically insignificant.
20 This is consistent with the finding by Choe et al. (1999) who report no evidence that foreign investors had a destabilizing effect in the korean stock markets during the Asian financial crisis.

JONGMOO JAY CHOI, HEIBATOLLAH SAMI AND HAIYAN ZHOU36
Table 6. Post-period of Institutional Reforms: OLS Analysis of State Ownership and Bid-Ask Spread
Variables Coefficient T-statistics Two-tail p-valueIntercept 0.049 0.85 0.3929
STATE -0.001 -0.05 0.9605
INST -0.007 -0.34 0.7371
FOREIGN 0.016 0.96 0.3359
BLOCk 0.012 0.59 0.5585
INSIDER -0.002 -0.02 0.9867
VOLATILITY 0.007 0.90 0.3709
TURNOVER -0.003 -0.62 0.5341
SIZE -0.005 -1.45 0.1476
YEAR7 0.006 1.19 0.2333
YEAR8 0.011 2.12 0.0347
Adjusted R2 3.05%
F-value 1.23
*** significant at 0.01, ** significant at 0.05, * significant at 0.10, respectively (two-tail test).
Note: Data period is from 2001-2003 and the sample is a fixed-firm sample. See Table 2 for the definitions of variables.
There is evidence that the bid-ask spread has stopped the narrowing pattern during the period subsequent to the institutional reforms. As expected, volume turnover and firm size have negative effects on bid-ask spread, while return volatility has a positive coefficient as expected, although they are not statistically significant.
Table 7 reports the results of 3SLS where volume turnover and volatility, along with bid-ask spread, are endogenously estimated. The result in Panel A for bid-ask spread confirms the result from the single-equation estimation in Table 6. Again, the effect of state ownership is not significant.
Table 7. Post-period of Institutional Reforms: 3SLS Analysis of State Ownership and Bid-Ask Spread
Variables Coefficient T-statistics Two-tail p-value
Panel A: Bid-Ask ModelIntercept 0.040 0.40 0.6907
STATE 0.022 0.63 0.5309
INST 0.015 0.45 0.6539
FOREIGN 0.053 1.11 0.2684
BLOCk 0.009 0.41 0.6801
INSIDER 0.023 0.21 0.8370
VOLATILITY 0.034 0.81 0.4174
TURNOVER -0.039 -0.86 0.3881
SIZE -0.006 -1.30 0.1945

THE IMPACTS OF STATE OWNERSHIP ON INFORMATION ASYMMETRY: EVIDENCE FROM AN EMERGING MARkET 37
Variables Coefficient T-statistics Two-tail p-value
YEAR7 -0.002 -0.15 0.88
YEAR8 0.011 1.70 0.0898
System Weighted R2 16.36%
Panel B: Volume Turnover ModelIntercept -1.717 ** -2.22 0.0265
STATE 0.498 *** 2.90 0.0039
INST 0.472 *** 2.83 0.0048
FOREIGN 0.857 *** 5.91 <.0001
BLOCk -0.102 -0.61 0.5408
INSIDER 0.595 0.72 0.4712
VOLATILITY 0.914 *** 7.22 <.0001
SIZE 0.052 1.24 0.2141
INDEX -0.138 *** -3.11 0.0019
YEAR7 -0.226 *** -5.49 <.0001
YEAR8 0.038 0.79 0.4287
System Weighted R2 16.36%
Panel C: Return Volatility ModelIntercept 4.411 *** 15.27 <.0001
STATE 0.289 ** 2.41 0.0163
INST 0.316 *** 2.71 0.0070
FOREIGN 0.466 *** 5.05 <.0001
BLOCk 0.011 0.09 0.9275
INSIDER 0.268 0.44 0.6606
SIZE -0.194 *** -10.11 <.0001
BETA 0.323 *** 10.74 <.0001
YEAR7 -0.068 ** -2.08 0.0379
YEAR8 -0.308 *** -9.66 <.0001
System Weighted R2 16.36%
*** significant at 0.01, ** significant at 0.05, * significant at 0.10, respectively (two-tail test).
Note: Estimation is done by 3SLS based on a fixed-firm sample of 271 publicly traded Chinese firms for the period of 2001-2003. See Table 2 for definitions of variables.
5.3. A Pooled Sample in the Pre-period of Institutional Reforms
In the previous tests, we used a fixed-firm sample design to investigate the effect of state ownership on bid-ask spread. To check whether the results are sensitive to using a

JONGMOO JAY CHOI, HEIBATOLLAH SAMI AND HAIYAN ZHOU38
pooled sample for all publicly traded firms during the pre-period of institutional reforms, we re-estimated Tables 4 and 5 and the results are reported in Tables 8 and 9.21 The OLS results, regarding state ownership, in Table 8 are similar to those reported in Table 4. The 3SLS analyses in Table 9 indicate the significant effect of state ownership on bid-ask spread reported in Table 5 is unchanged after using an expanded (pooled) sample.
Table 8. Pre-period of Institutional Reforms: OLS Analysis on State Ownership and Bid-ask Spread with a Pooled Sample
Variables Coefficient T-statistics Two-tail p-valueIntercept 0.548 *** 32.59 <.0001
STATE 0.048 *** 4.27 <.0001
INST 0.067 *** 5.58 <.0001
FOREIGN 0.137 *** 9.97 <.0001
BLOCk 0.029 *** 3.59 0.0003
INSIDER -0.069 *** -2.71 0.0069
VOLATILITY 0.001 ** 2.01 0.0447
TURNOVER -0.006 *** -8.29 <.0001
SIZE -0.050 *** -23.88 <.0001
YEAR1 0.126 *** 19.90 <.0001
YEAR2 0.123 *** 22.06 <.0001
YEAR3 0.034 *** 7.41 <.0001
YEAR4 0.012 *** 2.86 0.0042
YEAR5 0.038 *** 8.05 <.0001
Adjusted R2 46.50%
F-value 234.85
*** significant at 0.01, ** significant at 0.05, * significant at 0.10, respectively (two-tail test).
Note: Estimation is done by the OLS based on pooled time series and cross sectional data for 1,002 publicly traded Chinese firms (3,498 firm-year observations) for the period of 1995-2000. See Table 2 for definitions of variables.
Table 9. Pre-period of Institutional Reforms: 3SLS Analysis of State Ownership and Bid-Ask Spread with a Pooled Sample
Variables Coefficient T-statistics Two-tail p-value
Panel A: Bid-Ask ModelIntercept 0.524 *** 13.46 <.0001
STATE 0.045 ** 2.30 0.0216
INST 0.062 *** 3.34 0.0009
FOREIGN 0.136 *** 7.38 <.0001
21 The results remain the same when IPO observations are excluded.

THE IMPACTS OF STATE OWNERSHIP ON INFORMATION ASYMMETRY: EVIDENCE FROM AN EMERGING MARkET 39
Variables Coefficient T-statistics Two-tail p-value
BLOCk 0.034 *** 2.81 0.0049
INSIDER -0.106 ** -2.30 0.0217
VOLATILITY 0.019 1.55 0.1213
TURNOVER -0.016 -1.13 0.2599
SIZE -0.051 *** -10.97 <.0001
YEAR1 0.123 *** 9.06 <.0001
YEAR2 0.143 *** 4.44 <.0001
YEAR3 0.040 *** 5.28 <.0001
YEAR4 0.019 ** 2.38 0.0172
YEAR5 0.041 *** 4.83 <.0001
System Weighted R2 20.69%
Panel B: Volume Turnover ModelIntercept 1.612 ** 2.45 0.0145
STATE 0.805 ** 2.48 0.0133
INST 0.622 * 1.83 0.0668
FOREIGN -0.588 -1.64 0.1003
BLOCk 0.394 * 1.88 0.0607
INSIDER -2.515 *** -3.71 0.0002
VOLATILITY 0.622 *** 4.38 <.0001
TURNOVER -0.217 *** -3.67 0.0002
SIZE -0.433 *** -3.52 0.0004
YEAR1 -0.653 *** -3.76 0.0002
YEAR2 2.435 *** 16.25 <.0001
YEAR3 0.379 *** 3.05 0.0023
YEAR4 -0.227 -1.46 0.1453
YEAR5 -0.373 *** -2.59 0.0098
System Weighted R2 20.69%
Panel C: Return Volatility ModelIntercept 3.854 *** 5.61 <.0001
STATE 1.099 ** 2.37 0.0179
INST 1.039 ** 2.11 0.0353
FOREIGN -0.344 -0.61 0.5427
BLOCk 0.011 0.03 0.9749
INSIDER 1.427 1.37 0.1713
SIZE -0.156 * -1.81 0.0704
BETA -0.116 *** -4.41 <.0001
YEAR1 -0.372 -1.43 0.1527

JONGMOO JAY CHOI, HEIBATOLLAH SAMI AND HAIYAN ZHOU40
Variables Coefficient T-statistics Two-tail p-value
YEAR2 0.265 1.20 0.23
YEAR3 -0.273 -1.45 0.1472
YEAR4 -0.771 *** -4.35 <.0001
YEAR5 -0.558 *** -2.87 0.0042
System Weighted R2 20.69%
*** significant at 0.01, ** significant at 0.05, * significant at 0.10, respectively (two-tail test).
Note: Estimation is done by 3SLS based on pooled time series and cross sectional data for 1,002 publicly traded Chinese firms (3,498 firm-year observations) for the period of 1995-2000. See Table 2 for definitions of variables.
5.4. A Pooled Sample in the Post-period of Institutional Reforms
Similarly, to check whether the results on the post-period of institutional reforms are sensitive to using a pooled sample for all publicly traded firms, we re-estimated Tables 6 and 7 for the pooled sample and the results of OLS and 3SLS are reported in Tables 10 and 11, respectively. As shown in these tables, we did not find any significant results on the effect of state ownership on bid-ask spread. This, in turn, indicates that due to changes in ownership regulations regarding state shares and market microstructure, legal litigation risks and corporate governance mechanisms, the undesirable effect of state ownership on information asymmetry disappeared. It also indicates that due care should be exercised when we generalize the results from emerging markets to other periods or to other markets because of the transitional nature of such markets.
Table 10. Post-Period of Institutional Reforms: OLS Analysis of State Ownership and Bid-Ask Spread with a Pooled Sample
Variables Coefficient T-statistics Two-tail p-valueIntercept 10.079 *** 3.57 0.0004
STATE 1.361 0.87 0.3835
INST 0.229 0.15 0.8818
FOREIGN 2.945 ** 2.21 0.0272
BLOCk -0.967 -0.73 0.4639
INSIDER 0.284 0.06 0.9507
VOLATILITY -0.297 *** -3.69 0.0020
TURNOVER 0.149 1.42 0.1558
SIZE -0.738 *** -3.85 <.0001
YEAR7 0.842 *** 2.83 0.0005
YEAR8 0.632 ** 2.08 0.0374

THE IMPACTS OF STATE OWNERSHIP ON INFORMATION ASYMMETRY: EVIDENCE FROM AN EMERGING MARkET 41
Variables Coefficient T-statistics Two-tail p-value
Adjusted R2 1.30%
F-value 5.52 ****** significant at 0.01, ** significant at 0.05, * significant at 0.10, respectively (two-tail test).
Note: Estimation is done by OLS based on pooled time series and cross sectional data for 1,219 publicly traded Chinese firms (3,442 firm-year observations) for the period of 2001-2003. See Table 2 for definitions of variables.
Table 11. Post-period of Institutional Reforms: 3SLS Analysis of State Ownership and Bid-Ask Spread with a Pooled Sample
Variables Coefficient T-statistics Two-tail p-value
Panel A: Bid-Ask ModelIntercept -930.844 -0.55 0.5858
STATE -141.046 -0.59 0.5574
INST -110.617 -0.60 0.5479
FOREIGN -204.742 -0.58 0.5651
BLOCk -116.613 -0.57 0.5697
INSIDER -245.304 -0.61 0.5423
VOLATILITY 68.587 0.48 0.6280
TURNOVER 124.578 0.62 0.5341
SIZE 52.406 0.55 0.5820
YEAR7 40.234 0.58 0.5615
YEAR8 48.502 0.53 0.5959
System Weighted R2 1.51%
Panel B: Volume Turnover ModelIntercept 7.316 1.13 0.2581
STATE 1.104 1.48 0.1382
INST 0.853 1.28 0.2012
FOREIGN 1.639 * 1.82 0.0693
BLOCk 0.891 1.08 0.2784
INSIDER 1.937 1.00 0.3176
VOLATILITY -0.537 -0.56 0.5739
SIZE -0.409 -1.23 0.2172
INDEX -0.115 -0.99 0.3230
YEAR7 -0.311 -1.37 0.1709
YEAR8 -0.373 -0.78 0.4337
System Weighted R2 1.51%
Panel C: Return Volatility Model

JONGMOO JAY CHOI, HEIBATOLLAH SAMI AND HAIYAN ZHOU42
Variables Coefficient T-statistics Two-tail p-value
Intercept 6.399 *** 6.73 <.0001
STATE 0.323 0.62 0.5380
INST 0.121 0.23 0.8159
FOREIGN 0.698 1.56 0.1191
BLOCk 0.612 1.38 0.1678
INSIDER -0.109 -0.07 0.9435
SIZE -0.322 *** -5.01 <.0001
BETA 0.133 1.34 0.1791
YEAR7 -0.026 ** -2.36 0.0183
YEAR8 -0.531 *** -4.86 <.0001
System Weighted R2 1.51%
*** significant at 0.01, ** significant at 0.05, * significant at 0.10, respectively (two-tail test).
Note: Estimation is done by 3SLS based on pooled time series and cross sectional data for 1,219 publicly traded Chinese firms (3,442 firm-year observations) for the period of 2001-2003. See Table 2 for definitions of variables.
6. Further Examinations
6.1. The Adverse Selection Component of Bid-Ask Spread
In the empirical work above, we used the total bid-ask spread as a measure of information asymmetry as influenced by specific corporate ownership variables. However, one can argue that total spread includes several components (order processing, inventory holding, and adverse selection), of which only the adverse selection component measures information asymmetry. To check for the sensitivity of our results, we have estimated the adverse selection component of bid-ask spread based on the method used by George, kaul and Nimalendran (1991). The correlation between the total spread and the adverse selection component is 0.86.
Based on the above discussions, equation (1) is re-estimated using the adverse selection component as the dependent variable, by OLS for single equation estimation and also as a simultaneous system along with equations (2) and (3) by 3SLS. The results, presented in Table 12, are not materially different from those from the basic estimation results above using the total spread (only the results for the pre-period are reported to simplify the presentation). In both OLS and 3SLS, results are comparable. Hence, the use of the adverse selection component rather than the total spread does not materially alter any of the conclusions arrived at earlier in the paper.
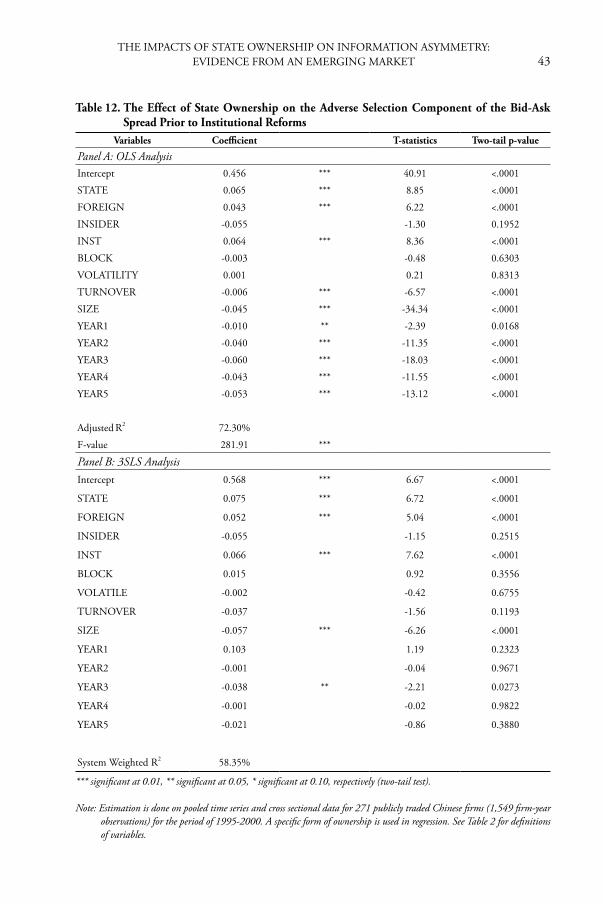
THE IMPACTS OF STATE OWNERSHIP ON INFORMATION ASYMMETRY: EVIDENCE FROM AN EMERGING MARkET 43
Table 12. The Effect of State Ownership on the Adverse Selection Component of the Bid-Ask Spread Prior to Institutional Reforms
Variables Coefficient T-statistics Two-tail p-value
Panel A: OLS AnalysisIntercept 0.456 *** 40.91 <.0001
STATE 0.065 *** 8.85 <.0001
FOREIGN 0.043 *** 6.22 <.0001
INSIDER -0.055 -1.30 0.1952
INST 0.064 *** 8.36 <.0001
BLOCk -0.003 -0.48 0.6303
VOLATILITY 0.001 0.21 0.8313
TURNOVER -0.006 *** -6.57 <.0001
SIZE -0.045 *** -34.34 <.0001
YEAR1 -0.010 ** -2.39 0.0168
YEAR2 -0.040 *** -11.35 <.0001
YEAR3 -0.060 *** -18.03 <.0001
YEAR4 -0.043 *** -11.55 <.0001
YEAR5 -0.053 *** -13.12 <.0001
Adjusted R2 72.30%
F-value 281.91 ***
Panel B: 3SLS AnalysisIntercept 0.568 *** 6.67 <.0001
STATE 0.075 *** 6.72 <.0001
FOREIGN 0.052 *** 5.04 <.0001
INSIDER -0.055 -1.15 0.2515
INST 0.066 *** 7.62 <.0001
BLOCk 0.015 0.92 0.3556
VOLATILE -0.002 -0.42 0.6755
TURNOVER -0.037 -1.56 0.1193
SIZE -0.057 *** -6.26 <.0001
YEAR1 0.103 1.19 0.2323
YEAR2 -0.001 -0.04 0.9671
YEAR3 -0.038 ** -2.21 0.0273
YEAR4 -0.001 -0.02 0.9822
YEAR5 -0.021 -0.86 0.3880
System Weighted R2 58.35%
*** significant at 0.01, ** significant at 0.05, * significant at 0.10, respectively (two-tail test).
Note: Estimation is done on pooled time series and cross sectional data for 271 publicly traded Chinese firms (1,549 firm-year observations) for the period of 1995-2000. A specific form of ownership is used in regression. See Table 2 for definitions of variables.

JONGMOO JAY CHOI, HEIBATOLLAH SAMI AND HAIYAN ZHOU44
6.2. More Control Variables on Ownership
In the primary test, we used state share percentage to measure state ownership. However, state controlling enterprises in which state ownership is no less than 50%, are also allowed to own shares issued by public companies. To investigate whether the two types of ownership have different effects on information asymmetry, we include both STATE (measured by the percentage of state shares in total shares) and SCINSTI (measured by the ownership of state controlled enterprises, in which state ownership is no less than 50%) in the regression model. Also, we include foreign institution ownership (FOREIGNINST) and foreign individual ownership (FOREIGN) to shed light on the potential difference on the effects on information environment between the two different foreign ownerships. The results, presented in Tables 13 and 14, are not materially different from those from the basic estimation results for the pre-period of institutional reforms reported in Tables 4 and 5. Both OLS and 3SLS results show that the magnitude of both state ownership and ownership by state controlled enterprises has an increasing effect on information asymmetry for the pre-period. Again, we only present the results for the pre-period to simplify the presentation. The results for the post-period are quite similar to those reported in Tables 6 and 7.
Table 13. The Effects of Ownership by State and State Controlling Enterprises on Bid-ask Spread Prior to Institutional Reforms
Variables Coefficient T-statistics Two-tail p-valueIntercept 0.684 *** 28.71 <.0001
STATE 0.145 *** 8.46 <.0001
SCINSTI 0.135 *** 7.86 <.0001
FOREIGNINST 0.028 0.73 0.4628
FOREIGN 0.127 *** 8.49 <.0001
INSIDER -0.018 -0.20 0.8428
BLOCk 0.008 0.51 0.6091
VOLATILITY 0.006 1.21 0.2258
TURNOVER -0.016 *** -7.72 <.0001
SIZE -0.055 *** -19.46 <.0001
YEAR1 -0.009 -1.02 0.3081
YEAR2 -0.081 *** -10.73 <.0001
YEAR3 -0.112 *** -15.69 <.0001
YEAR4 -0.073 *** -9.11 <.0001
YEAR5 -0.119 *** -13.90 <.0001
Adjusted R2 56.34%
F-value 143.67 ****** significant at 0.01, ** significant at 0.05, * significant at 0.10, respectively (two-tail test).
Note: Estimation is done by the OLS based on for a fixed-firm sample of 271 publicly traded Chinese firms (1,549 firm-year

THE IMPACTS OF STATE OWNERSHIP ON INFORMATION ASYMMETRY: EVIDENCE FROM AN EMERGING MARkET 45
observations) for the period of 1995-2000. SPREAD = average weekly bid-ask spread in percentage during the year; SIZE = log of average weekly market value of the firm’s equity during the year; TURNOVER = average weekly share turnover during the year where share turnover is defined as the dollar amount of trading volume divided by the market value of the equity of the firm; VOLATILITY = average of 52-week standard deviation of daily returns during the year; INDEX = 1 if the company’s stock is included in the composite share index on Shenzhen Stock Exchange or in the SH180 index on Shanghai Stock Exchange (and 0 otherwise); BETA = systematic market risk of the firm, estimated from weekly return for the 52-week period; INSIDER = the percentage of common equity shares held by managers and directors; STATE = the percentage of state shares; SCINSTI = the percentage of common equity shares held by state controlling enterprises, in which state ownership is no less than 50%; FOREIGNINST = the percentage of common equity shares held by registered foreign institutions; FOREIGN = the percentage of common equity shares held by registered foreign individuals; BLOCK = the percentage of common equity shares held by stockholders with no less than 3% ownership according to the annual report. Data period is from 1995 to 2000.
Table 14. 3SLS Analysis of the Effects of State Ownership and Ownership by State Controlling
Enterprises on the Bid-Ask Spread Prior to Institutional Reforms
Variables Coefficient T-statistics Two-tail p-valueIntercept 0.438 ** 2.25 0.0243
STATE 0.118 *** 4.17 <.0001
SCINSTI 0.129 *** 6.39 <.0001
FOREIGNINST 0.005 0.11 0.9114
FOREIGN 0.105 *** 4.47 <.0001
BLOCk -0.029 -0.87 0.3831
INSIDER -0.018 -0.17 0.8653
VOLTILITY 0.006 0.52 0.6018
TURNOVER 0.058 1.07 0.2828
SIZE -0.028 -1.33 0.1831
YEAR1 0.272 -1.39 0.1656
YEAR2 -0.168 ** -2.52 0.0120
YEAR3 -0.164 *** -4.18 <.0001
YEAR4 -0.171 ** -2.31 0.0209
YEAR5 -0.196 *** -3.48 0.0005
System Weighted R2 58.53%
*** significant at 0.01, ** significant at 0.05, * significant at 0.10, respectively (two-tail test).
Note: Estimation is done by 3SLS based on a fixed-firm sample of 271 publicly traded Chinese firms (1,549 firm-year observations) for the period of 1995-2000. See Table 13 for definitions of variables.
6.3. Other Robustness Checks
In our estimation, we included firms listed on either the Shanghai Stock Exchange or the Shenzhen Stock Exchange. To check whether the results are sensitive to listing in particular exchanges, we re-estimated Table 4 including a dummy variable for exchange listing (and also separately for each of the two samples listed in these exchanges). The results are similar to those reported in our paper.

JONGMOO JAY CHOI, HEIBATOLLAH SAMI AND HAIYAN ZHOU46
Another issue concerns audit quality, which may influence the quality of some corporate variables used in the bid-ask spread model. Audit quality is usually measured by firm size or by the market share of auditors that may correlate with audit quality (eg, Gul et al., 2002). DeFond et al. (2000), in particular, examine the effect of auditor independence on audit market concentration in China. Following their specification, we included an audit dummy variable, which is one if the company is audited by one of the ten largest accounting firms (including the Chinese and Big-Four international accounting firms and their joint ventures) in terms of the total combined assets of client firms, and zero otherwise. The results of this estimation, as they relate to ownership variables, are qualitatively the same as those reported earlier.
Since the majority of firms are state controlled or closely held, the results could be due to the ownership concentration instead of state ownership. To address this concern, we add one control variable for ownership concentration, using the total share percentage of the top ten shareholders as a measure. The results are qualitatively the same as those reported.
In addition to bid-ask spread, the literature also uses volume turnover and price volatility as measures of information asymmetry (eg, Leuz and Verrecchia, 2000). The OLS estimation of volume turnover model – equation (2) for the pooled sample indicates that state ownership increased with volume turnover and return volatility prior to the institutional reforms (not reported in tables). The 3SLS results for the pre-period further confirm that after controlling for simultaneous effects of state ownership and other factors on volume turnover and return volatility, the state ownership significantly and positively affected volume turnover and return volatility (See Panels B and C in Table 9). In contrast, in the post-period, the OLS and 3SLS estimations of the volume turnover model for the pooled sample show that the coefficient for state ownership in the volume turnover model is positive but not statistically significant at a two-tail test (OLS results are not reported; 3SLS results are presented in Panel B of Table 11), whereas the same coefficients regarding trading volume and return volatility are insignificant. These results in general are consistent with those of the primary tests suggesting that changes in institutional environment have significantly affected the role of state ownership in the information environment. In particular, the positive link between state ownership and price volatility for the pre-period is consistent with earlier studies that find return volatility tends to increase with information asymmetry. However, different from earlier studies in developed markets where trading volume tends to decrease with information asymmetry, we find that without a good institutional environment, share turnover in the emerging markets could increase with information asymmetry as informed trading became more pervasive.
Finally, following a suggestion by Leuz and Verrecchia (2000), we also re-estimated equation (1) using the average dollar amount of trading volume and share prices, respectively, as measures of TURNOVER and SIZE. Alternatively, we also included share prices in addition to TURNOVER and SIZE variables. The results of these experiments again are qualitatively similar to those already reported in the paper.

THE IMPACTS OF STATE OWNERSHIP ON INFORMATION ASYMMETRY: EVIDENCE FROM AN EMERGING MARkET 47
7. Conclusions and Implications
The market microstructure models suggest that adverse selection due to information asymmetry increases bid-ask spread. To the extent that the ownership structure of a firm entails information asymmetry, it should also influence the bid-ask spread. In this study, we examine the effect of corporate ownership on information asymmetry measured by bid-ask spread in the emerging markets of China. We find that government ownership has significant and positive impacts on bid-ask spread during 1995-2000. However, when we analyze the data available to us for the subsequent years (2001-2003), we find that the magnitude of state ownership does not raise the bid-ask spread (information asymmetry).
The finding that state ownership raised bid-ask spread over 1995-2000 is consistent with recent studies on emerging markets including China, which indicate that firms with higher state ownership tend to have a greater deviation between cash flow rights and control rights (eg, Wei et al., 2005). When state ownership is high, political influence and ineffective management monitoring can play a greater role in increasing costs associated with agency and information problems. This implies that lower state ownership is associated with lower information asymmetry in the market, an economic consequence of significant economic reform and privatization on the market microstructure, and contrasts with some misconceptions that state ownership does not affect the bid-ask spread because state shares were not tradable in our sample period.
However, the lack of a significant effect of state ownership on bid-ask spread over the period of 2001-2003 indicates that the changes regarding the recent regulations of state ownership and market microstructure, legal litigation risks, and corporate governance mechanisms improved the information environment. In particular, the changes in these institutional features could deter political influence, hold constant or decrease agency costs and information problems associated with high state ownership that work otherwise to increase information asymmetry.
By examining the connection between ownership and information asymmetry as measured by bid-ask spread, we extend the market microstructure literature to corporate governance and information transparency. This paper provides direct evidence on the relationship between ownership and information asymmetry in emerging markets. Beyond that, the study has several important policy implications. Our result that high state ownership is associated with high information asymmetry during 1995-2000 but which disappears during 2001-2003 suggests that the privatization of state enterprises, among other things, can contribute to economic efficiency by reducing the cost of information asymmetry and hence, lower the cost of capital. Similarly, policies should be devised in such a way that institutional investors including foreigners are encouraged to contribute to the enhancement of information transparency rather than acting as another agent to increase information asymmetry in order to exploit their specific informational advantages at the expense of other investors.
Finally, our study is based on the information asymmetry theory, which supports

JONGMOO JAY CHOI, HEIBATOLLAH SAMI AND HAIYAN ZHOU48
the weak or semi-strong version of the efficient market hypothesis but not its strong version. The semi-strong version argues that the market prices reflect all publicly available information and respond instantly to new information, and the strong version argues that market prices reflect inside information. Thus our measure of information asymmetry does not require a strong assumption of market efficiency. However, due to the nature of the emerging markets of China, which is known in the literature for its inefficiency, the generalization potential of our results to other markets or other periods of time requires further study.
References
Aitken, M., Frino, A., 1996. The determinants of market bid-ask spreads on the Australian Stock Exchange: Cross-sectional analysis. Accounting and Finance 36 (1): 51-63.
Amihud, Y., Mendelson, H., 1986. Asset pricing and the bid-ask spread. Journal of Financial Economics 8: 31-53.
Attig, N., Fong, W.-M., Gadhoum, Y., Lang, L. H. P., 2006. Effects of large shareholding on information asymmetry and stock liquidity. Journal of Banking and Finance 30: 2875-2892.
Barclay, M. J., Holderness, C., 1991. Negotiated block trades and corporate control. Journal of Finance 46: 861-878.
Belsley, D., kuh, E., Welsh, R., 1980. Regression diagnostics, identifying influential data and sources of collinearity. New York: Wiley.
Bethel J., Liebeskind, J. P., Opler, T., 1998. Block share purchases and corporate performance. Journal of Finance 53: 605-653.
Boubakri, N., Cosset, J. C., 1998. The financial and operating performance of newly privatized firms: Evidence from developing countries. Journal of Finance 53 (3): 1081-1110.
Bris, A., 2000. Do insider trading laws work? Working Paper, Yale School of Management.Brockman, P., Chung, D. Y., 2000. Informed and uninformed trading in an electronic, order-driven
environment. Financial Review 35: 125-146.Bushman, R. M., Piotroski, J. D., Smith, A. J., 2004. What determines corporate transparency. Journal of
Accounting Research 42 (2): 207-250.Chen, Z., Choi, J. J., Jiang, C., 2009a. Private benefits in IPOs: Evidence from state-owned firms. Presented
in American Finance Association meetings in January 2009, San Francisco.Chen, G., Firth, M., Xu, L., 2009b. Does the type of ownership control matter? Evidence from the China’s
listed companies. Journal of Banking and Finance 33: 171-181.Chen, S., Sun, S., Wu, D., 2010. Client importance, institutional improvements, and audit quality in
China: An office and individual auditor level analysis. The Accounting Review 85: 127-158.Chiang, R., Venkatesh, P., 1988. Insider holdings and perceptions of information asymmetry: A note.
Journal of Finance 43: 1041-1048.Choe, H., kho, B. C., Stulz, R., 1999. Do foreign investors destabilize stock markets? The korean
experience in 1997. Journal of Financial Economics 54: 227-264.Choe, H., kho, B. C., Stulz, R., 2005. Do domestic investors have an edge? The trading experience of
foreign investors in korea. Review of Financial Studies 18: 795-829.Choi, J. J., Park, S., Yoo, S., 2007. The value of outside directors: Evidence from corporate governance
reform in korea. Journal of Financial and Quantitative Analysis 42: 941-962.Chung, k., Charoenwong, C., 1998. Insider trading and the bid-ask spread. The Financial Review 33, 1-20.Claessens, S., Djankov, S., Fan, J., Lang, L., 2002. Disentangling the incentive and entrenchment effects of

THE IMPACTS OF STATE OWNERSHIP ON INFORMATION ASYMMETRY: EVIDENCE FROM AN EMERGING MARkET 49
large shareholdings. Journal of Finance 57: 2741-2771.Copeland, T., Galai, D., 1983. Information effects on the bid-ask spread. Journal of Finance 38: 1457-1469.Cull, R., Xu, L. C., 2005. Institutions, ownership, and finance: The determinants of profit reinvestment
among Chinese firms. Journal of Financial Economics 77: 117-146.DeFond, M., Wong, T. J., Li, S., 2000. The impact of improved auditor independence on audit market
concentration in China. Journal of Accounting and Economics 28: 269-305.Demsetz, H., 1968. The cost of transacting. Quarterly Journal of Economics 82 (February): 33-53.D’Souza, J., Megginson, W. L., 1999. The financial and operating performance of privatized firms during
the 1990s. Journal of Finance 54 (4):1397-1438.Easley, D. O’Hara, M., 1987. Price, trade size, and information in securities market. Journal of Financial
Economics 19: 69-90.Ellul, A., Guntay, L., Lel, U., 2007. External governance and debt agency costs of family firms. Working
Paper, Board of Governors of the Federal Reserve System.Fehle, F., 2004. Bid-Ask spreads and institutional ownership. Review of Quantitative Finance and
Accounting 22 (4): 275-292.George, T. J., kaul, G., Nimalendran, M., 1991. Estimation of the bid-ask spread and its components: A
new approach. Review of Financial Studies 4: 623-656.Glosten, L. R., Milgrom, P. R., 1985. Bid, ask and transaction prices in a specialist market with
heterogeneously informed traders. Journal of Financial Economics 14: 71-100.Greenstein, M. M., Sami, H., 1994. The impact of the SEC’s segment disclosure requirement on bid-ask
spread. The Accounting Review 69 (1): 179-199.Grinblatt, M., keloharju, M., 2000. The investment behavior and performance of various investor types: A
study of Finland’s unique data set. Journal of Financial Economics 55: 43-67.Gujarati, D. N., 1995. Basic Econometrics. Third Edition. New York: McGraw-Hill.Gul, F. A., Lynn, S. G., Tsui, J. S., 2002. Auditor quality, management ownership, and the informativeness
of accounting earnings. Journal of Accounting, Auditing, and Finance 17 (1): 25-50. Gul, F. A., Sami, H., Zhou, H., 2009. The disaffiliation program in China and auditor independence.
Auditing: A Journal of Practice and Theory 28 (11): 29-52.Heflin, F., Shaw, k. W., 2000. Blockholder ownership and market liquidity. Journal of Financial and
Quantitative Analysis 35 (4): 621-633. Hope, O., Thomas, W. B., Vyas, D., 2009. Transparency, ownership, and financial constraints: An
international study using private firms. Working Paper, Toronto University.Jiang, L., kim, J. B., 2004. Foreign equity ownership and information asymmetry: Evidence from Japan.
Journal of International Financial Management & Accounting 15: 185-211.kini, O., Mian, S., 1995. Bid-ask spread and ownership structure. Journal of Financial Research 18 (4):
410-414.Lakonishok, J., Shleifer, A., Vishny, R. W., 1992. The impact of institutional trading on stock prices. Journal
of Financial Economics 32: 23-43.Lang, M., Lins, k. V., Maffet, M., 2009. Transparency, liquidity and valuation: An international study.
Working Paper, University of North Carolina.Leuz, C., Verrecchia, R. E., 2000. The economic consequences of increased disclosure. Journal of
Accounting Research 38 (Supplement): 91-124.Morck, R., Shleifer, A., Vishny, R. W., 1988. Management ownership and market valuation: An empirical
analysis. Journal of Financial Economics 20: 293-315.O’Brien, P., Bhushan, R., 1990. Analyst following and institutional ownership. Journal of Accounting
Research 28: 55-77.Pistor, k., Xu, C., 2005. Governing stock markets in transitional economies: Lessons from China. American
Law and Economics Review 7 (1): 184-210.Sami, H., Wang, T., Zhou, H., 2009. Corporate governance and operating performance of Chinese listed

JONGMOO JAY CHOI, HEIBATOLLAH SAMI AND HAIYAN ZHOU50
firms. Working Papers, Lehigh University. Sami, H., Zhou, H., 2004. Market segmentation and the value relevance of accounting information:
Evidence from A-share and B-share Chinese stock markets. International Journal of Accounting 39: 403-427.
Seyhun, N. H., 1992. The effectiveness of insider-trading sanctions. Journal of Law and Economics 35: 149-182.
Shleifer, A., Vishny, R. W., 1997. A survey of corporate governance. Journal of Finance 52 (2): 737-782.Stoll, H., 2003. Market microstructure. In Constantinides, G., M. Harris, and R. Stulz (eds.), Handbook of
the Economics of Finance. North-Holland, Amsterdam.Su, D., 2004. Adverse selection vs. signaling: Evidence from the pricing of the Chinese IPOs. Journal of
Economics and Business 56: 1-19.Sun, Q., Tong, W. H. S., 2003. China share issue privatization: The extent of its success. Journal of Financial
Economics 70 (2): 183-222.Van Ness, B., Van Ness, R., Warr, R., 2001. How well do adverse selection components measure adverse
selection? Financial Management 30 (3): 77-98.Verrecchia, R. E., 2001. Essays on disclosure. Journal of Accounting and Economics 32 (1-3): 97-180.Wang, J., 2010. A comparison of shareholder identity and governance mechanisms in monitoring CEOs of
listed companies in China. China Economic Review 21: 24-37.Wei, Z., Xie, F., Zhang, S., 2005. Ownership structure and firm value in China’s privatized firms: 1991-
2001. Journal of Financial and Quantitative Analysis 40 (1): 87-108.Xu, L. C., Zhu, T., Lin, Y., 2005. Politician control, agency problems and ownership reform. Economics of
Transition 13 (1): 1-24.