The Impact of the Transfer of Intangible Assets on the ...
84
The Impact of the Transfer of Intangible Assets on the Valuation Effects of High- Tech Cross-Border Mergers and Acquisitions by Andrew John Sinclair A thesis presented to the University of Waterloo in fulfillment of the thesis requirement for the degree of Master of Accounting (Finance) Waterloo, Ontario, Canada, 2009 © Andrew John Sinclair 2009
Transcript of The Impact of the Transfer of Intangible Assets on the ...
The Impact of the Transfer of Intangible Assets on the Valuation Effects of High-
Tech Cross-Border Mergers and Acquisitions
by
Andrew John Sinclair
A thesis
presented to the University of Waterloo
in fulfillment of the
thesis requirement for the degree of
Master of Accounting (Finance)
Waterloo, Ontario, Canada, 2009
© Andrew John Sinclair 2009

Library and Archives Canada
Bibliothèque et Archives Canada
Published Heritage Branch
Direction du Patrimoine de l’édition
395 Wellington Street Ottawa ON K1A 0N4 Canada
395, rue Wellington Ottawa ON K1A 0N4 Canada
Your file Votre référence ISBN: 978-0-494-56221-5Our file Notre référence ISBN: 978-0-494-56221-5
NOTICE: The author has granted a non-exclusive license allowing Library and Archives Canada to reproduce, publish, archive, preserve, conserve, communicate to the public by telecommunication or on the Internet, loan, distribute and sell theses worldwide, for commercial or non-commercial purposes, in microform, paper, electronic and/or any other formats. .
AVIS: L’auteur a accordé une licence non exclusive permettant à la Bibliothèque et Archives Canada de reproduire, publier, archiver, sauvegarder, conserver, transmettre au public par télécommunication ou par l’Internet, prêter, distribuer et vendre des thèses partout dans le monde, à des fins commerciales ou autres, sur support microforme, papier, électronique et/ou autres formats.
The author retains copyright ownership and moral rights in this thesis. Neither the thesis nor substantial extracts from it may be printed or otherwise reproduced without the author’s permission.
L’auteur conserve la propriété du droit d’auteur et des droits moraux qui protège cette thèse. Ni la thèse ni des extraits substantiels de celle-ci ne doivent être imprimés ou autrement reproduits sans son autorisation.
In compliance with the Canadian Privacy Act some supporting forms may have been removed from this thesis. While these forms may be included in the document page count, their removal does not represent any loss of content from the thesis.
Conformément à la loi canadienne sur la protection de la vie privée, quelques formulaires secondaires ont été enlevés de cette thèse. Bien que ces formulaires aient inclus dans la pagination, il n’y aura aucun contenu manquant.

ii
Declaration
I hereby declare that I am the sole author of this thesis. This is a true copy of the thesis, including
any required final revisions, as accepted by my examiners
I understand that my thesis may be made electronically available to the public.

iii
Abstract
The technology industry is characterized by a greater than usual reliance on intangible assets.
During the tech bubble many firms were valued entirely on intangible assets and growth
prospects. In the aftermath of the bubble, intangible assets still play an important role as the
innovative performance of a firm‟s human capital and the value of its patents creates much of the
value of high-tech firms. The problem of transferring human capital and knowledge may be
further exacerbated when the firms belong to separate national cultures. Investor perception of
acquisition announcements may be more favourable if the target workforce is much smaller
relative to the bidder, and thus easier to integrate. Also, perceptions may be favourable when the
target has a high ratio of intangible assets to total assets, as this may be a proxy for the relative
value of the extractible intangible assets. This study uses a sample of 61 acquisition
announcements between 1991 and 2004, where both acquirer and target are high-tech firms and
accounting and trading data is available from three years prior to three years after the acquisition
announcement. There is weak evidence to support the employee ratio hypothesis for bidder
returns, and no evidence to support the intangible assets to total assets hypothesis for either
bidder or target returns. Additionally, it is found that average bidder abnormal returns during the
announcement period (as measured from one day prior to the announcement acquisitions to one
day afterwards) are negative but not significantly different from zero, and that average target
abnormal returns are positive and significant. Average wealth gains to bidders are negative and
to targets are positive over the window from five days prior to the acquisition announcement to
five days afterwards. Furthermore, combined wealth gains are negative, indicating the synergistic
gains from high-tech cross-border acquisitions are offset by high premiums paid by the bidders
for the targets. Relatedness, a lack of tender offers, and non-US acquirer status are demonstrated
to be related to negative returns to bidders, whereas tender offers, US-acquirer status, and
termination provisions are shown to be related to increased returns to target shareholders. In the
long-run, it is found that acquirers experience superior operating cash flow returns when
compared to their industry peers, however, the acquirer experiences diminished performance
when compared to the combined performance of the pre-acquisition acquirer and target firms.

iv
Acknowledgements
I would like to extend my gratitude to my two supervisors, Professor Kenneth Vetzal and
Professor Ranjini Jha. They provided unwavering support and guidance throughout the entire
process. The databases used were graciously provided by them, and they were always available
to review results, and have helped me catch several errors that would have affected the integrity
of this thesis. They have also provided guidance on the types of questions to ask, how to ask
them, and what methods I can use to investigate my questions.
I would also like to thank the program coordinator, Ms. Mary Flatt, for always keeping me
apprised of the latest program developments and assisting me with daily tasks that were difficult
for students living off-campus.

v
Dedication
I dedicate my thesis to my friends and family, for always making me laugh.
vi
Table of Contents
List of Tables ................................................................................................................................. viii
List of Figures .................................................................................................................................. ix
Introduction .................................................................................................................................... 1
I. Literature Review ......................................................................................................................... 5
A. Cross-Border Technology Acquisitions ................................................................................... 5
B. Acquisitions of Technology Firms............................................................................................ 6
C. Cross-Border Acquisitions ....................................................................................................... 7
D. General M&A Papers ............................................................................................................ 10
II. Hypotheses................................................................................................................................ 13
A. Employee Ratio ..................................................................................................................... 13
B. Target Intangible to Total Asset Ratio ................................................................................... 15
C. Long-Term Operational Performance ................................................................................... 16
D. Control Variables .................................................................................................................. 17
1. Related Industry................................................................................................................. 17
2. Relative Size of Target ....................................................................................................... 18
3. Existence of Tender Offer .................................................................................................. 18
4. Technology Bubble ............................................................................................................ 19
5. Cash Payments ................................................................................................................... 19
6. US Domiciled Acquirers and Targets ................................................................................. 20
7. Termination Provision ....................................................................................................... 20
E. Long-Term Operational Performance ................................................................................... 21
III. Data and Sample ...................................................................................................................... 22
IV. Methodology ........................................................................................................................... 32
A. Cumulative Abnormal Returns .............................................................................................. 32
B. Combined Wealth Gains ....................................................................................................... 34
C. Long-term Performance Measurement ................................................................................ 35
V. Results ....................................................................................................................................... 38
A. Gains to Bidders of High-Tech Cross-Border Targets ............................................................ 38
B. Gains to Targets of High-Tech Cross-Border Acquisitions .................................................... 40
C. Combined Wealth Gains to Bidders and Targets .................................................................. 42
D. Employee Ratio ..................................................................................................................... 44

vii
E. Target Intangible Assets to Total Assets Ratio ...................................................................... 47
F. Stratification of Full Sample .................................................................................................. 50
G. Cross Sectional Regression Results ....................................................................................... 55
H. Long-Term Industry-Adjusted Cash Flow Returns ................................................................ 65
VI. Conclusions .............................................................................................................................. 69
References .................................................................................................................................... 72

viii
List of Tables
Table I. Breakdown of SDC Extract................................................................................................ 23
Table II. Sample Characteristics – Annual Breakdown ................................................................. 24
Table III. Sample Characteristics – National Breakdown .............................................................. 26
Table IV. Descriptive Statistics by Sector and Payment Structure................................................ 29
Table V. Descriptive Statistics for Participants in High-Tech Cross-Border Acquisitions ............. 31
Table VI. Valuation Effects for Full Sample ................................................................................... 38
Table VII. Wealth Gains for Full Sample ........................................................................................ 43
Table VIII. Cumulative Abnormal Returns of Subsample Partitioned by Employee Ratio ........... 44
Table IX. CARs of Subsample Partitioned by Employee Ratio – Test of Means ............................ 46
Table X. CARs of Subsample Partitioned by TIA Ratio .................................................................. 48
Table XI. CARs of Subsample Partitioned by TIA Ratio – Test of Means ...................................... 50
Table XII. CARs of Acquirer Subsample Partitioned by Tender Offers, Cash Payments, US Acquirers, and Termination Provisions ......................................................................................... 52
Table XIII. CARs of Target Subsample Partitioned by Tender Offers, Cash Payments, US Acquirers, and Termination Provisions .......................................................................................................... 54
Table XIV. Cross-Sectional Analysis of Valuation Effects for Targets ........................................... 63
Table XV. Median Operating Cash Flow Return on Actual Market Value of Assets ..................... 66
Table XVI. Test of the Relation Between Unexpected Asset Returns and Cash Flow Returns ..... 68

ix
List of Figures
Figure I.A Sample Characteristics – National Breakdown by Acquirer ........................................ 25
Figure I.B Sample Characteristics – National Breakdown by Target ............................................ 27
Figure II.A Plot of all Acquirer CARs .............................................................................................. 39
Figure II.B Plot of Average Acquirer CARs .................................................................................... 40
Figure III.A Plot of all Target CARs................................................................................................ 41
Figure III.B Plot of Average Target CARs ...................................................................................... 42
Figure IV.A. Plot of Average Acquirer CARs Stratified by Related Status .................................... 56
Figure IV.B. Plot of Average Target CARs Stratified by Related Status ........................................ 56
Figure V.A. Plot of Average Acquirer CARs Stratified by Tender Offers ...................................... 57
Figure V.B. Plot of Average Target CARs Stratified by Tender Offers .......................................... 58
Figure VI.A. Plot of Average Acquirer CARs Stratified by Payment Consideration ...................... 59
Figure VI.B. Plot of Average Target CARs Stratified by Payment Consideration ......................... 59
Figure VII.A. Plot of Average Acquirer CARs Stratified by US Acquirer Status ............................ 60
Figure VII.B. Plot of Average Target CARs Stratified by US Acquirer Status ................................ 61

1
Introduction
The technology industry is one characterized by rapid technological change and success is highly
reliant on innovation. Firms need to strategically manage their assets in order to maintain a
competitive position. Mergers and acquisitions (M&A) are important tools for companies
seeking to very quickly enter a new business or product line in a short amount of time.
Acquisitions give companies access to patents, knowledge, and a pool of human capital. The
technology industry is a time-sensitive industry; technologies have a short half-life and become
obsolete quickly. The time-sensitive nature of technological capabilities highlight the importance
of an efficient acquisition, otherwise potentially valuable knowledge or capabilities could be lost.
When acquiring a technological target, transferring its technological and innovative capabilities
is very important. This involves integrating the target in a manner that is both quick and retains
as much of the valuable human capital as possible.
This reliance on human capital and intangible assets creates a high degree of asymmetric
information that makes it difficult for market participants to value acquisitions. Technology
firms have highly specialized knowledge, which may be difficult to understand and value. The
important technological capabilities reside in the codified knowledge owned by the target, and
the innovative and tacit knowledge of the target‟s human capital. Valuation at the acquisition
announcement of these assets will be difficult, and it is quite dependent on the ability of the
acquirer to extract this information. Being able to assimilate codified and tacit knowledge is a
difficult process, but is related to the acquisition process. Retention of human capital will be key
in assimilating this knowledge, as tacit knowledge resides within the social complexities of the

2
human capital, and codified knowledge can be explained and understood with the assistance of
the creators of that knowledge.
The valuation of technology targets is even more obscured in the case of cross-border deals.
The issues of asymmetric information and employee retention are further augmented by
geographical and cultural distances. Assets may be more difficult to evaluate and monitor when
they are geographically distant, resulting in increased costs associated with valuing these assets.
Cultural differences may also affect the ability to manage a foreign workforce, which may
adversely affect the post-acquisition integration process. Transferring knowledge may also prove
to be more difficult since a common culture may provide a foundation that allows for better
communication of complex ideas. There also exists uncertainty over regulations in different
countries that may affect the integration and ownership of assets.
Taking all of these ideas into account, this study investigates whether cross-border
acquisitions of high technology targets creates value for acquirers and targets, and attempts to
identify factors that may be related to value creation. 61 high-tech cross-border acquisition
announcements are studied between 1991 and 2004. There have been no restrictions placed on
the acquirer or target nation. It is found that acquirers experience insignificant negative
cumulative abnormal returns (CARs) in the window surrounding (one day prior to one day after)
the acquisition announcement. Targets on the other hand, experience significantly positive
cumulative abnormal returns during the same window. For acquirers, it was found that not
having tender offers, cash payments, or not being in the US are associated with significant
negative CARs. Targets experience significantly higher CARs when the deal is a tender offer as
opposed to a merger. On average, wealth gains were $-305.1 million (median $-1.0 million) to
acquirers and $23.2 million (median $21.9 million) to targets, with combined wealth gains of $-

3
281.9 million (median $21.4 million) over the period of five days prior to the acquisition
announcement to five days afterwards. This figure may suggest cross-border technology
acquisitions are value destroying endeavours, but the figure may be affected by some large losses
as more than half of the deals (36) have positive combined wealth gains and the median value for
combined wealth gains is $21.4 million. The cross-sectional analysis of the regression model
indicates that tender offers, cash payments, US acquirers, and termination provisions are
significant factors related to target returns. The model has an adjusted R-squared of 44.6% and is
significant at the 1% level.
Tender offers, cash payments, and termination provisions have been found in previous work
to be important in some cases and not in others. The negative wealth gains is at odds with
evidence from Eun, Kolodny, and Scheraga (1996) that found on average between 1979 and
1990, deals involving foreign acquirers of US targets had combined wealth gains of $68 million.
This thesis also investigates the relationship between acquisitions and long term operational
performance. Following Healy, Palepu, and Ruback (1992), industry-adjusted cash flow returns
in the three years following the merger are regressed against combined cash flow returns prior to
the merger, and in another case, against combined announcement window returns (from five
days prior to the acquisition announcement to five days after) as well. Consistent with Healy et al.
(1992), merged firms exhibit significantly higher returns when compared to their respective
industries. It is also shown that there is a significantly positive relationship to premerger
operating performance, but inconsistent with the previous study, a significant negative
relationship between announcement window returns is observed.

4
This thesis is organized as follows. Section I provides a review of the literature. Section II
develops the hypotheses and describes control variables used in this study. Section III describes
the data, sampling methodology, and the final sample. Section IV outlines the analysis
methodology, while Section V provides empirical results. Finally, Section VI discusses
conclusions.

5
I. Literature Review
The literature review can be broken down into four categories. The first category contains studies
that look specifically at cross-border technology acquisitions. This specific research topic is
fairly new and there is only one paper on this topic in the extant literature. The second and third
categories look at papers dealing with the constituents of the first category: acquisitions of
technology firms, and cross-border acquisitions respectively. The final category deals more with
mergers and acquisitions in general and also some important modelling and sampling techniques
that should be taken into account.
A. Cross-Border Technology Acquisitions
Studies in the area of cross-border technology acquisitions have only been conducted fairly
recently. The first such study, and the one most closely related to this study, was conducted by
Benou, Gleason and Madura (2007). Their research takes the premise that foreign high tech firms
will exhibit a high degree of asymmetric information, and hypothesizes that media exposure and
reputable investment banking advisors can help mitigate investors‟ scepticism of the valuation of
the acquisitions. The researchers used the SDC database to identify 503 instances where a US
acquirer had acquired foreign targets over the period from 1985 to 2001. These 503 acquisitions
also had the caveat that acquirer stock price data were available on CRSP. Over the entire 503
firm set and in the window of (-1, +1) days, the results showed insignificantly positive returns.
However, when the target had high credibility (as measured by the investment bank reputation)
and high visibility (as measured by the firm‟s media exposure), the acquirer exhibited
significantly positive returns. This appears to lend credibility to the authors‟ hypotheses.

6
B. Acquisitions of Technology Firms
The extant research on acquisitions of technology firms is still fairly recent. Kohers and
Kohers (2000) studied high-tech bidders, as determined by the “high-tech flag” in the SDC
database. This was one of the few studies that have found positive and significant abnormal
returns to bidders. Also, their results are independent of the type of payment (cash versus stock),
which is also uncommon. Some key factors identified were: time period of acquisitions,
ownership structure of acquirer, ownership status of target, and high-tech affiliation of acquirer.
A possible criticism of this research may be the reliance on the high-tech flag from the SDC
database. While constructing the database for this thesis, it was found that the high-tech flag was
not robust and included many firms that were in fact not related to the high-tech industry
whatsoever.
In a follow-up paper, Kohers and Kohers (2001) study the post acquisition performance of
acquirers that purchase high-tech targets. When compared to a control group, their sample
performs poorly over the three-year period following the acquisition announcement. When
considering these two studies together, the authors conclude that high-tech acquisitions create
excessive enthusiasm in the financial markets, which overestimate the value of the benefits of the
acquisition to the bidder.
Ranft and Lord (2000) conducted survey based research designed to identify factors that are
correlated with post acquisition retention of employees. They hypothesize that the driving forces
behind technology acquisitions is the desire to enhance the bidder‟s strategic technology
capabilities. They claim that these capabilities are likely intertwined in the tacit knowledge of the
target firm‟s human capital. The study indicates that retention of the target‟s human capital, and
the knowledge that resides within, plays an important role in a successful merger.
7
In a study that examines the relatedness (as measured by the firms‟ three-digit SIC codes) of
deals and post acquisition technological performance, Hagedoorn and Duysters (2002) discuss
that when compared to unrelated deals, related deals tend to show superior economic
performance because of the synergistic gains from economies of scale and scope. Taking this
idea further, they show that related deals improve the technological performance of acquirers as
measured by the number of patents filed in the post-acquisition years. Cloodt, Hagedoorn, and
Van Kranenburg (2006) return to this topic and find the relationship is curvilinear. It is optimal
to acquire firms that are related, but performance suffers when there exists too much overlap in
the businesses of the two firms.
Chaudhuri and Tabrizi (1999) and Prentice and Fox (2002) investigate the difficulties in
valuing high-tech assets. The former study concludes that high-tech targets are difficult to value,
especially if they have low-visibility in the financial media. The latter study concludes that high-
tech firms must be evaluated on intangible assets such as human capital and intellectual property.
This emphasis on human capital is similar to the Ranft and Lord (2000) paper.
For a source that discusses some of the general issues associated with the valuation of
intangible assets, please refer to Lev (2001).
C. Cross-Border Acquisitions
The literature on cross-border acquisitions is far more robust. The first study was conducted
by Doukas and Travlos (1988). The main results of their research showed that firms already
operating abroad, but not in the target‟s country, experienced significant and positive returns.
Firms already operating in the target country, or those expanding abroad for the first time, had
insignificant negative and positive abnormal returns respectively.

8
Chatterjee, Lubatkin, Schweiger and Weber (1992) conduct a survey study investigating the
relationship between perceptions of cultural difference and shareholder gains. They find a strong
inverse relationship and provide evidence on the importance of cultural difference on cross-
border mergers and acquisitions.
The first study to consider both target and acquirer returns in cross-border M&A was
conducted by Mathur, Rangan, Chhachhi, and Sundaram (1992). They found significant positive
abnormal gains to targets, and insignificant abnormal returns to acquirers. These results are
generally consistent with most M&A studies in general. The authors conclude that either
investors do not price positively the benefits of foreign direct investment (FDI), or that the costs
associated with the acquisition process and the premium paid outweighs the positive FDI
benefits.
However, a study by Markides and Ittner (1994) found that international acquisitions created
value for the bidder. The study looked at 276 US acquisitions of non-US targets between 1975
and 1988. They noted that factors that played an important role in their analysis were relatedness,
concentration and advertising intensity of bidder‟s industry, bidder‟s prior international
experience, bidder‟s current profitability, tax regulations, and the strength of the US dollar.
In a similar study, Cakici, Hessel, and Tandon (1996) investigate shareholder wealth gains for
195 foreign firms that acquired US targets in 1983 to 1992. They found that foreign acquirers
have significant and positive abnormal returns of nearly 2% over the interval of ten days prior to
the announcement, to ten days afterwards. Also, US acquirers have abnormal returns not
significantly different from zero in the same period. Additionally, bidder returns were found to

9
not be related to the relative size of the target to the bigger, the extent of overseas exposure, the
target‟s R&D intensity, industry factors, or the strength of the dollar.
Eun, Kolodny, and Scheraga (1996) were one of the first to investigate combined wealth gains
in cross-border acquisition announcements. They looked at announcements of foreign acquirers
of US targets between 1979 and 1990. On average, acquisitions produced combined wealth gains
of $68 million, which the authors conclude indicated cross-border acquisitions are synergy-
creating activities. They found Japanese acquisitions had the largest wealth gains, where on
average wealth gains of $398 million were split with 43% to targets and 57% to acquirers.
In a study that focused on Dutch acquirers between 1990 and 1996, Corhay and Rad (2000)
looked at acquisitions involving foreign targets. They found weak evidence that acquisitions are
wealth creating, especially when the target is located in the US. For western European targets,
benefits are larger for acquirers having less international exposure and making acquisitions
outside their main activities.
Aw and Chatterjee (2004) conduct a three-way comparison of UK acquirers with UK targets,
US targets, and Continental Europe targets between 1991 and 1996. The study looks at long-term
cumulative abnormal returns over two years and finds that acquiring large targets yields
significantly negative CARs to acquirers. It is also found that UK acquirers perform best with
UK targets, then less well with US targets, and then even less well with Continental Europe
targets.
Related to this last point, Sie and Yakhlef (2004) theorize knowledge transfer as an alternative
motive for M&A. They claim effective knowledge transfer is a source of value creation and leads
to financial success. Also, given the importance of knowledge transfer, researchers are

10
converging on the idea that a common culture is one of the important factors to knowledge
transfer and financial success.
D. General M&A Papers
To augment this research, a selection of papers on M&A in general is reviewed. It should be
noted that the general literature on M&A is extremely broad and only a small subset will be
discussed here. For an overview on the extant M&A literature, please refer to Betton, Eckbo, and
Thorburn (2008).
Singh and Montgomery (1987) investigate whether related deals create higher value and find
that they produce greater dollar gains, and acquirers experience higher gains, compared with
unrelated deals.
Travlos (1987) was the first to look into the method of payment and found significant
differences in abnormal returns between all cash and all stock offers. The author finds these
results are independent of the type of takeover bid (merger versus tender) and of bid outcome.
Healy, Palepu, and Ruback (1992) analyse corporate performance for sample of the largest 50
US mergers between 1979 and 1984. They find that merged firms tend to experience superior
operating cash flow returns relative to their industry, particularly when deals involve firms with
overlapping businesses. They also find a strong positive relationship between abnormal stock
returns during the acquisition announcement period and postmerger increases in cash flow
returns.
Barber and Lyon (1996 and 1997) discuss robust sampling techniques for ensuring well-
specified test statistics for accounting-based measures of operating performance and cumulative
abnormal returns in event studies. They find that for accounting-based measures, test statistics
11
are only well-specified when sample firms are matched to a group of control firms based on pre-
event performance. For long run (one to five year) event study CARs, they find sample firms
must be matched to control firms based on size and book-to market ratios in order to have well-
specified test statistics.
In an interesting paper, Schwert (1996) investigates the relationships between premiums in
takeover bids and the pre-announcement price run-ups for publicly traded targets between 1975
and 1991. He finds there is an insignificant correlation between the run-up prior to the
acquisition announcement and the mark-up in the post-acquisition price movement. This means
there is little substitution between run-up and mark-up prices, and that the run-up is added cost to
the acquirer.
Loughran and Vijh (1997) study five-year excess returns and look for a relationship between
the form of payment and returns to acquirers. They analyse 947 acquisitions between 1970 and
1989 and find that for all stock mergers, acquirers experience long term returns of -25%. For all
cash mergers, acquirers fare much better, earning long term returns of 61.7%. They also find the
deals characterized by a high target to acquirer size ratio earn significant negative excess returns.
To address the robustness issues raised by Barber and Lyon (1996 and 1997), Ran and
Vermaelen (1998) use methodology that is robust to their criticism. They demonstrate that
bidders in mergers tend to underperform, yet bidders in tender offers tend to overperform during
the three years after the acquisition is announced. The authors attribute this underperformance to
poor post-acquisition performance of low book-to-market (“glamour”) firms, and interpret this as
evidence that both the market and management are overly optimistic when extrapolating the
bidder‟s past performance for assessing the desirability of the acquisition.

12
Mitchell and Stafford (2000) provide another counter argument for long-term studies. The
main idea here is that most methodology at the time involved calculating multiyear buy-and-hold
abnormal returns, but this makes the crucial mistake of assuming independence of multi-year
abnormal returns. After accounting for the positive-correlations from abnormal returns, the study
finds acquirer long-term CARs are not significantly different from zero.
Highlighting the importance of termination provision fees, Bates and Lemmon (2003) find
that the existence of provision fees is related to higher target CARs. They examined deals
between 1989 and 1998, and found fee provisions tend to have greater negotiated takeover
premiums. Also, target-payable fees are observed more frequently when bidding is costly and the
potential for third parties to acquire sensitive information is significant.
Finally, Moeller, Schlingemann, and Stulz (2004) study 12,023 acquisitions by public firms
between 1980 and 2001. They find that on average, the abnormal return is 1.1%, but that
acquiring firms lost $25.2 million at the announcement of the deal. Also, returns are roughly 2%
higher for small acquirers, and for these, returns are not dependent on form of financing or
whether the target is public or private.

13
II. Hypotheses
For cross-border high-tech acquisitions, a key driver of success is the ability to efficiently
integrate the target‟s human capital and knowledge base into the intangible assets of the acquirer.
In this study, two factors that may facilitate knowledge transfer, retention of human capital, and
the value of the transferable knowledge are considered. The first factor is the ratio of employees
of the target to the acquirer, and the second is the ratio of target intangible assets to total assets.
A. Employee Ratio
Employee ratio gives an indication of the digestibility of the target firm. Ranft and Lord (2000)
find that for high-tech firms, retaining key individuals within whom important tacit knowledge
lies is very important for a successful acquisition. The larger the target firm, the more difficult it
will be to integrate everyone, and the higher chance that important human capital, which was
paid for as part of the acquisition premium, will be lost to competitors. For example, this was a
major concern during the proposed Microsoft-Yahoo acquisition. It was suspected that Microsoft
would have a difficult time retaining many top engineers and that if the acquisition went through,
many valuable employees would leave for rival Google.1
What is now needed is a means of linking employee ratio to expected performance. A low
employee ratio may indicate the size of the human capital of the target to the acquirer is quite
small and thus easily digestible, but at the same time, the value to the acquirer is quite small.
Similarly, if the employee ratio is high, it may be difficult to integrate the target firm, but in a
larger employee base, there may be more value. For example, it may be more valuable to retain
20% of a larger employee base than 80% of a smaller employee base.
1 Delaney, K.J., R.A. Guth, M. Karnitschnig. “Microsoft Makes Grab for Yahoo”, February 2, 2008. Wall Street
Journal. Retrieved on August 27, 2009 from <http://online.wsj.com/article/SB120186587368234937.html>

14
This raises some concerns about the relationship between employee ratio and performance,
especially if the nature of technological knowledge is taken into account. Technological
knowledge is, to a large extent, highly codified. It resides in patents, computer code, and
mathematical formulas. In the realm of cross-border acquisitions, this may place less of an
importance on the impact of a common culture. The literature on cross-border acquisitions
stresses the importance a common culture plays in the transfer of knowledge through the
communication of ideas. In the case of technology firms, the common language may be the
codified language that technology is written in.
For these reasons, this study makes the simplifying assumption that digestibility is the most
important implication of employee ratio of the target to the acquirer, and that the relationship
between employee ratio and performance is inversely proportional. Hence, the Employee Ratio
Hypothesis is as follows:
H1: The share price response of the bidder and target will be more favourable when the
ratio of target employees to acquirer employees is lower.
For each deal, the employee ratio is taken to be the ratio of the target employees to the
acquirer employees, where each value is taken at the respective firm‟s prior fiscal year-end to the
announcement date.
If there is evidence to support the hypothesis, it would give credibility to the simplifying
assumption that performance is inversely proportional to the employee ratio, and thus, the
digestibility of the target firm. If however, there is no evidence to support the hypothesis, then
perhaps the relationship is curvilinear, or perhaps the integration of human capital is less
important as long as valuable codified knowledge can be acquired.

15
B. Target Intangible to Total Asset Ratio
The target intangible to total asset ratio, or TIA ratio, seeks to quantify in a comparable way
the amount of intangible assets of the target firm. Much of the value of high-technology
companies lies in its intangible assets, which includes legal intangibles – such as patents, and
competitive intangibles – such as the knowledge stored within the collective human capital of the
company. A study by Prentice and Fox (2002) concluded that intangible assets are of utmost
importance to high-technology firms, and these firms must be evaluated on their intangible assets.
The TIA ratio links directly with one of the contentious issues of the employee ratio. For the
employee ratio, it was mentioned that it should be considered in conjunction with the value of
the human capital, as the interaction of these two may have complicated results. The TIA ratio
and employee ratio may be correlated; while the univariate analysis examines the impact of these
factors independently, the cross-sectional analysis includes both variables and therefore provides
meaningful inferences.
Now, consider what the TIA ratio implies. The higher the ratio, the more intangible assets the
firm has relative to the size of its total assets. If this were a simple metric, it would be
straightforward to analyse, but the value of intangible assets is a highly debateable figure. It is
obscured by the high degree of asymmetric information that is characteristic of technology firms.
Another simplifying assumption that must be made is that while intangible assets are subject to a
high degree of asymmetric information, and may not accurately reflect true values, it must be
assumed that there is a high degree of correlation between the reported and actual intangible
values. This is akin to assuming there is some random deviation for each reported intangible
value, but on average, the discrepancy is about the same.

16
Thus, with the assumption that a higher TIA ratio is desirable because the target contains
more legal and competitive intangible assets, the second hypothesis relating to the Target
Intangible Assets to Total Asset Ratio Hypothesis is as follows:
H2: The share price response of the bidder and target will be more favourable when the
ratio of target intangible assets to total assets is higher.
For each target, this ratio is the value of the intangible assets divided by the total assets, and
these values are taken as at the prior fiscal year-end to the acquisition announcement date.
If there is evidence to support the hypothesis, then it indicates that within the world of the
simplifying assumptions, higher TIA ratios are related to better announcement window
performance. It is important to note that this study is looking only at event-window returns.
C. Long-Term Operational Performance
Healy, Palepu, and Ruback (1992) find increased operational performance for merged firms in
the years following an acquisition. In particular, deals with overlapping businesses perform
particularly well. Given that this study focuses on deals between firms, which are both in the
high-tech industry, it is reasonable to expect a significantly positive industry-adjusted cash flow
returns for merged firms in the sample and for a positive relation between announcement returns
and post-merger cash flow performance. This leads to the third hypothesis:
H3a: Merged firms have increases in post-merger operating cash flow returns in
comparison with their industries.
H3b: There is a positive relation between combined bidder and target announcement
returns and post-merger operating cash flow returns of the merged firms.

17
Consistent with the findings of Barber and Lyon (1996), the long-term cash flow returns are
adjusted for each firm‟s specific industry.
D. Control Variables
When testing for the effects of employee ratio and TIA ratio, other characteristics that could
affect the abnormal returns of the acquirer and target at the time of the acquisition announcement
are taken into account. These control variables have been found to be of some importance in
prior studies, and while there may be some differing results due to the nature of the sample, it is
still prudent to control for these effects.
1. Related Industry
There have been conflicting studies on the topic of how related industries affect M&A
performance. Doukas and Travlos (1988) suggest that cross-border acquisitions are more
favourable when diversified across industries. However research by Markides and Ittner (1994)
and Singh and Montgomery (1987) suggests cross-border acquisitions in the same industry will
yield more favourable results. Specifically dealing with technological acquisitions, Hagedoorn
and Duysters (2002) demonstrate that when compared to unrelated deals, related deals tend to
show superior economic performance because of synergistic gains from economies of scale and
scope. Following up on this work, Cloodt, Hagedoorn, and Van Kranenburg (2006) discover a
curvilinear relationship between relatedness and performance, in that, when firms are too similar
there is too much of an overlap of similar skills. It should also be noted, that Puranam (2001)
mentions that absorbing technological innovation is a very complicated problem and that without
a sufficiently skilled workforce the technology may not be completely absorbed. Given how
difficult it is assigning a true value to an overseas target, it may be the case that related acquirers
may have the upper hand with regards to valuing these assets. To model this, a dummy variable
18
called RELATED is used and set to 1 if the bidder is in the same four-digit SIC industry
classification as the target, and 0 otherwise. It may be the case that using 4-digit SIC codes falls
into the trap Cloodt, Hagedoorn, and Van Kranenburg (2006) mention, which is when firms are
too closely related the acquisition does not perform as well as expected.
2. Relative Size of Target
The extant literature on the importance of relative size has revealed many conflicting results.
Markides and Ittner (1994) find that the relative size of the target is significant and positively
related to the gains to foreign bidders. On the other hand, Cakici, Hessel, and Tandon (1996) and
Corhay and Rad (2000) find no relationship between relative size and bidder returns. To
complicate matters even more, Eun, Kolodny, and Scheraga (1996) find a significant and
negative relationship between relative size and acquirer returns. In the specific case of high-
technology acquisitions, Hennart and Reddy (1999) mention that firms acquiring large targets
may be faced with a “digestibility” issue. This occurs when they are only interested in a fraction
of the target firm‟s business, but must absorb the entire business. However, a counter point to
this could be that given the large technology firms may have more visibility, there would be less
asymmetric information obscuring the true value of the assets. For this study, a variable called
MVRATIO is used to proxy for relative size, defined as the ratio of the market value of the target
to the acquirer, as at 41 days prior to the acquisition announcement.
3. Existence of Tender Offer
In a study that examined the three-year long term performance of acquirers, Ran and
Vermaelen (1998) found that bidders that made tender offers tend to overperform, and those that
do not tend to underperform in the three year period following the acquisition announcement.
Interestingly, Travlos (1987) finds no relationship between the existence of tender offers and

19
abnormal returns to bidders. In this study, a dummy variable named TENDER is set to 1 if there
exists a tender offer as part of the acquisition announcement, and 0 otherwise.
4. Technology Bubble
The technology bubble that collapsed in March of 2001 was a defining moment for the
technology industry. It caused a paradigm shift in how the industry was viewed by investors.
Benou, Gleason, and Madura (2007) mention that the crash wiped out an estimated $5 trillion in
investor wealth, and created general scepticism towards the technology industry. Due to this
scepticism, high-technology cross-border acquisitions valuations may be adversely affected by
market sentiment, resulting in lower expected returns during the post-bubble era. For this study,
a dummy variable called BUBBLE is set to 1 for acquisition announcements occurring after
March 2001, and 0 otherwise. This will monitor any structural breaks that may occur in the post
bubble era.
5. Cash Payments
Studies by Travlos (1987), Brown and Ryngaert (1991), and Loughran and Vijh (1997) find
that when the consideration for the acquisition is all cash, these deals lead to significant positive
returns to bidders. These studies also give evidence that all stock mergers fare significantly
poorly. A later study by Kohers and Kohers (2000) focussed specifically on the technology
industry and found significant and positive returns to bidders, but that this was independent of
the method of payment used. It is a bit difficult here to make a prediction on whether this will be
significant or not for the current sample under study. The studies that found all cash deals to be a
significant indicator did not focus on the technology industry, and the study that did found no
relation between all cash deals and returns. For this study, a dummy variable called CASH is set
equal to 1 if the consideration is all cash, and 0 otherwise.

20
6. US Domiciled Acquirers and Targets
Most studies have anchored either the acquirers or targets as US domiciled firms. For
acquirers, Cakici, Hessel, and Tandon (1996) find returns are not significantly different from
zero. Markides and Ittner (1994) find significantly positive returns. In a related study to this,
Benour, Gleason, and Madura (2007) find insignificantly positive returns to US domiciled
acquirers engaged in cross-border acquisitions of technology firms. As for targets, being
domiciled in the US reduces asymmetric information substantially, and thus, should allow
acquirers and investors to more accurately value the target. With the reduction in asymmetric
information allowed by US domiciled firms, this study expects that for deals that include US
domiciled acquirers or targets, returns should be positively affected. A dummy variable called
USACQ is set equal to 1 if the acquirer is domiciled in the US, and 0 otherwise. A second
dummy variable called USTAR is set equal to 1 if the target is domiciled in the US, and 0
otherwise.
7. Termination Provision
A study by Bates and Lemmon (2003) finds that the existence of termination provisions is
related to higher target abnormal returns. Termination provisions allow targets to be
compensated in the event that the acquirer backs away from completing the deal. By ensuring a
deterrent to cancelling the deal, the target effectively increases the probability that the deal will
be completed, thus reducing the uncertainty. The target‟s stock price thus increases much closer
to the proposed takeover price, allowing for greater target returns in the acquisition
announcement window. For these reasons, this study expects there to be a significant and
positive relationship between termination provisions and target returns. For bidder returns
however, this termination provision is a zero-sum game, and the benefit that has been transferred

21
to the target must be taken from the bidder, so this study expects bidder returns to be adversely
affected by the existence of a termination provision. For this study, a dummy variable called
TERMPROV is set equal to 1 if a termination provision exists and 0 otherwise.
E. Long-Term Operational Performance
Healy, Palepu, and Ruback (1992) find increased operational performance for merged firms in
the years following an acquisition. In particular, deals with overlapping businesses perform
particularly well. Given that this study focuses on deals between firms, which are both in the
high-tech industry, it is reasonable to expect a significantly positive industry-adjusted cash flow
returns for merged firms in the sample. Consistent with the findings of Barber and Lyon (1996),
the long-term cash flow returns are adjusted for each firm‟s specific industry.

22
III. Data and Sample
Data on cross-border mergers and acquisitions in the technology industry has been acquired from
the Thomson Financial Securities Data Corporation (SDC) International M&A database. First,
all cross-border acquisitions between January 1, 1990 and December 31, 2004 are selected using
an SDC cross-border deal identifier. This initial search yields 113,724 acquisitions, and the
sample used in this study is formed by subjecting the initial search to the following criteria:
Each acquirer and target belongs to the high-tech industry as determined by each firm‟s
four-digit SIC code. The SIC codes of interest begin with 357*, 367*, 369*, and 737*.
Prior to the acquisition bid, the acquirer holds less than 50% of the shares of the target, and
at the announcement of the acquisition the acquirer is seeking to own between 50% and
100% of the shares of the target. This ensures the sample contains acquirers seeking to gain
a majority controlling interest in the target firm.
Each deal entry includes the value of the deal in millions of US dollars.
Each acquirer and target is a publicly traded company. This was chosen to ensure trading
data could be found for both acquirers and targets.
After applying these criteria, the sample decreases to 296 deals. Table I details exactly how
the SDC database has been broken down into this sample. Upon further inspection, 16 of these
deals are misclassified as cross-border deals and are removed, resulting in 280 deals. This SDC
dataset contains deal specific information such as announcement date, acquirer and target
country, deal value, tender offer indicator, cash payments indicator, termination provision
indicator, etc.

23
Table I. Breakdown of SDC Extract
This table describes how the Thomson Financial SDC database is broken down to arrive
at a database consisting of the announced cross-border high-tech acquisitions between
publicly traded firms between 1990 and 2004.
Request Hits Request Description 1 - Date Announced: 1/1/1990 to 31/12/2004
2 113,724 Select All Cross Border Deals
3 17,434 Select Acquirer in High Tech based on SIC codes:
3571, 3575, 3572, 3578, 3577, 3579, 3672, 3671,
3674, 3676, 3675, 3677, 3679, 3678, 3691, 3692,
3694, 3695, 3699, 7372, 7371, 7374, 7373, 7375,
7376, 7378, 7377, 7379
4 10,212 Select Target in High Tech based on SIC codes:
3571, 3575, 3572, 3578, 3577, 3579, 3672, 3671,
3674, 3676, 3675, 3677, 3679, 3678, 3691, 3692,
3694, 3695, 3699, 7372, 7371, 7374, 7373, 7375,
7376, 7378, 7377, 7379
5 8,417 Percent of Shares Acquirer is Seeking to Own after
Transaction: 50 to 100
6 8,080 Percent of Shares Held by Acquirer at
Announcement: 0 to 50
7 3,478 Select Deals where a Deal Value is Reported
8 2,736 Select only Publicly Traded Acquirers
9 296 Select only Publicly Traded Targets
The SDC database is then merged with the Datastream database to attach trading and
accounting data to each deal. Only deals where there existed trading and accounting data for
three years prior to the announcement and three years after the announcement were considered
since cash flow return and market value data is required to test the third hypothesis, which
pertains to long term performance of the acquirer. This specification brings the final sample
down to 61 transactions.
Table II lists the acquisitions by year. Over 88% of announcements occur after 1997, which
coincides with the internet revolution and the beginnings of the technology bubble. Table II

24
clearly shows that the peak year did not occur during the bubble, but rather in 2003 once the
global economy had recovered.
Table II. Sample Characteristics – Annual Breakdown
This table provides the sample breakdown by year of
acquisition announcement. These are high-tech acquisitions
announced between 1991 and 2004 where deals were listed
in SDC and both target and bidder had trading and
accounting data in Datastream in the (-3, 3) year window
surrounding the acquisitions announcement.
Panel A. Distribution of Acquisitions by Year
Year Number of Deals Percent of Total
2004 9 14.75%
2003 13 21.31%
2002 7 11.48%
2001 7 11.48%
2000 8 13.11%
1999 5 8.20%
1998 5 8.20%
1997 3 4.92%
1996 0 0.00%
1995 1 1.64%
1994 2 3.28%
1993 0 0.00%
1992 0 0.00%
1991 1 1.64%
Total 61 100.00%

25
The breakdown of deals by acquirer nation raises some interesting results. Altogether there
are 14 unique acquirer nations, and acquirers seem to be concentrated in the English speaking
nations. Figure I.A demonstrates that 58% of acquirers are located in the United States, Canada,
or the United Kingdom. Table III Panel A lists the acquirer nations, and we see the top three
acquirers are the United States (18 deals), Canada (11 deals), and the Netherlands (7 deals).
Following next in order are the United Kingdom, Germany, Switzerland, and France. All
acquirers are North American or Western European firms, except for four acquirers from Hong
Kong, Japan, South Korea, and Taiwan.
Figure I.A Sample Characteristics – National Breakdown by Acquirer This figure provides the sample breakdown by country of acquirer. These are high-tech acquisitions
announced between 1991 and 2004 where deals were listed in SDC and both target and bidder had trading
and accounting data in Datastream in the (-3, 3) year window surrounding the acquisition announcement.
30%
18%
11%
10%
8%
7%
5%
11%
Distribution by Acquirer Nation
United States
Canada
Netherlands
United Kingdom
Germany
Switzerland
France
Other

26
Table III. Sample Characteristics – National Breakdown
This table provides the sample breakdown by country of acquirer (Panel A),
and by country of target (Panel B). These are high-tech acquisitions announced
between 1991 and 2004 where deals were listed in SDC and both target and
bidder had trading and accounting data in Datastream in the (-3, 3) year
window surrounding the acquisitions announcement.
Panel A. Distribution of Acquisitions by Acquirer Country
Country Number of Deals Percent of Total
United States 18 29.51%
Canada 11 18.03%
Netherlands 7 11.48%
United Kingdom 6 9.84%
Germany 5 8.20%
Switzerland 4 6.56%
France 3 4.92%
Other 7 11.48%
Total 61 100.00%
Panel B. Distribution of Acquisitions by Target Country
Country Number of Deals Percent of Total
United States 25 40.98%
United Kingdom 8 13.11%
Canada 7 11.48%
France 4 6.56%
Germany 3 4.92%
Norway 3 4.92%
Netherlands 2 3.28%
South Africa 2 3.28%
Other 7 11.48%
Total 61 100.00%

27
Figure I.B Sample Characteristics – National Breakdown by Target This figure provides the sample breakdown by country of target. These are high-tech acquisitions
announced between 1991 and 2004 where deals were listed in SDC and both target and bidder had trading
and accounting data in Datastream in the (-3, 3) year window surrounding the acquisition announcement.
Table III Panel B and Figure I.B break down deals by target nation. The top three target
nations are all English speaking nations, and account for 66% of all target nations. The United
States is the target nation in 25 acquisitions, which represents 41% of all deals. Next, the United
Kingdom and Canada account for 8 and 7 deals respectively, followed by France, Germany,
Norway, the Netherlands, and South Africa. Much like the case with acquirer nations, target
nations are largely dominated by North American and European firms, except for a handful of
deals in South Africa, Mexico, Singapore, and South Korea. In total there are 15 unique target
nations, and there are 21 unique nations among acquirers and targets covered by this study.
Further descriptive statistics are provided by Table IV This table describes the breakdown of
targets and acquirers by their industry, as classified by their four-digit SIC code. Panel A
describes the target industry, and it is shown that over 26% percent of targets are located in the
Prepackaged Software industry. Most of the higher density industries are all related to either the
41%
13%12%
7%
5%
5%
3%
3% 11%
Distribution of Target Nations
United States
United Kingdom
Canada
France
Germany
Norway
Netherlands
South Africa
Other

28
computer software or hardware industries. For example, these industries focus on programming,
system design and database (information retrieval) management, and electronic components.

29
Table IV. Descriptive Statistics by Sector and Payment Structure
This table provides information regarding the breakdown of the sample by target
industry (Panel A), acquirer industry (Panel B), and method of acquisition payment
(Panel C). Industrial Group was determined by the four-digit SIC codes and were
retrieved from the SDC database. These are high-tech acquisitions announced
between 1991 and 2004 where deals were listed in SDC and both target and bidder
had trading and accounting data in Datastream in the (-3, 3) year window
surrounding the acquisition announcement.
Panel A. Target Industrial Group
Group Number of Deals Percent of Total
Prepackaged Software 16 26.23%
Computer integrated systems design 6 9.84%
Computer programming services 5 8.20%
Information retrieval services 5 8.20%
Semiconductors and related devices 4 6.56%
Electronic components 4 6.56%
Electronic computers 3 4.92%
Other 15 24.59%
Total 61 100.00%
Panel B. Acquirer Industrial Group
Group Number of Deals Percent of Total
Prepackaged Software 16 26.23%
Radio & TV broadcasting &
communications equipment
5 8.20%
Information retrieval services 5 8.20%
Household audio and video equipment 4 6.56%
Semiconductors and related devices 4 6.56%
Computer integrated systems design 4 6.56%
Computer peripheral equipment 3 4.92%
Computer facilities management services 3 4.92%
Other 17 27.87%
Total 61 100.00%
Panel C. Method of Acquisition Payment
Method of Payment Number of Deals Percent of Total
Cash 25 40.98%
Combination 14 22.95%
Stock 9 14.75%
No Data 13 21.31%
Total 61 100.00%

30
Table IV Panel B describes the acquirer industry and while the Prepackaged Software
industry is still dominant at 26%, there are a few changes with the other top industries.
Programming and informational retrieval services are still important, but the electronic
component industries have been replaced by consumer electronics industries, such as TV and
Radio.
Panel C of Table IV describes the method of payment for these deals. 41% of deals are paid
for entirely in cash, 15% are paid for using stock only, 23% are paid for using a combination of
stock and cash, and unfortunately, for 21% of deals there is no information regarding the type of
consideration used.
Additional descriptive statistics are provided in Table V. This table provides details (means
and medians) of operating characteristics for firms in our sample. All values, except deal and
market value, have been winsorized at the 1.635% level. What this means for the sample, is that
the most extreme values have been replaced with the second largest and smallest values. The aim
of this is to eradicate any outliers. According to SDC, the mean and median of the deals in the
sample under study are $731 million USD and $226 million USD respectively. In the measures
of operating performance there is usually a substantial difference of about an order of magnitude
between targets and acquirers. Important variables considered in this table include market value,
cash and equivalents, total assets, total intangibles, short term debt, working capital, long term
debt, capital expenditure, net sales, net cash flow from financing activities, change in cash, net
margin, return on equity, net income to common shareholders, EBIT, and number of employees.
The poor operating performance figures for targets (net margin, ROE, and net income) may be
an indication of firms that are young in its lifecycle, and these targets may be attractive because
of perceived potential synergies.

31
Table V. Descriptive Statistics for Participants in High-Tech Cross-Border Acquisitions
This table provides details (means and medians) of operating characteristics for firms in our
sample. Deal value has not been winsorized, nor has the market value of firms. All other values
have been winsorized at the 3.27% level (the smallest/largest value is replaced with the next
smallest/largest). These firms are all involved in high-tech acquisitions announced between 1991
and 2004 where deals were listed in SDC and both target and bidder had trading and accounting
data in Datastream in the (-3, 3) year window surrounding the acquisition announcement. All
values (except transaction value) are in year 2000 USD figures.
Variable Bidder Mean (Median) Target Mean (Median)
Transaction Value ($Mil) 731(226) 731(226)
Market Value ($Mil) 16,300(3,077) 1,387(175)
Cash and Equivalents ($Mil) 2,003(274) 86(25)
Total Assets ($Mil) 14,018(2,200) 1,149(135)
Total Intangibles ($Mil) 2,080(435) 231(16)
Short Term Debt ($Mil) 688(29) 58(1.5)
Working Capital ($Mil) 1,805(183) 54(24)
Long Term Debt ($Mil) 2,134(183) 172(0.6)
Capital Expenditure ($Mil) 738(79) 34(3)
Net Sales ($Mil) 12,059(1,928) 945(90)
Net Cash Flow – Financing ($Mil) 157(0.5) 31(-0.2)
Inc/Dec in Cash ($Mil) 290(19) -15(-2)
Net Margin (%) 5.8(5.1) -18.1(-0.2)
Return on Equity (%) 2.1(9.0) -33.5(1.8)
Net Income to Common ($Mil) 517(109) -8(0.06)
EBIT ($Mil) 930(178) 30(3)
Employees 60,667(15,385) 5,784(582)
32
IV. Methodology
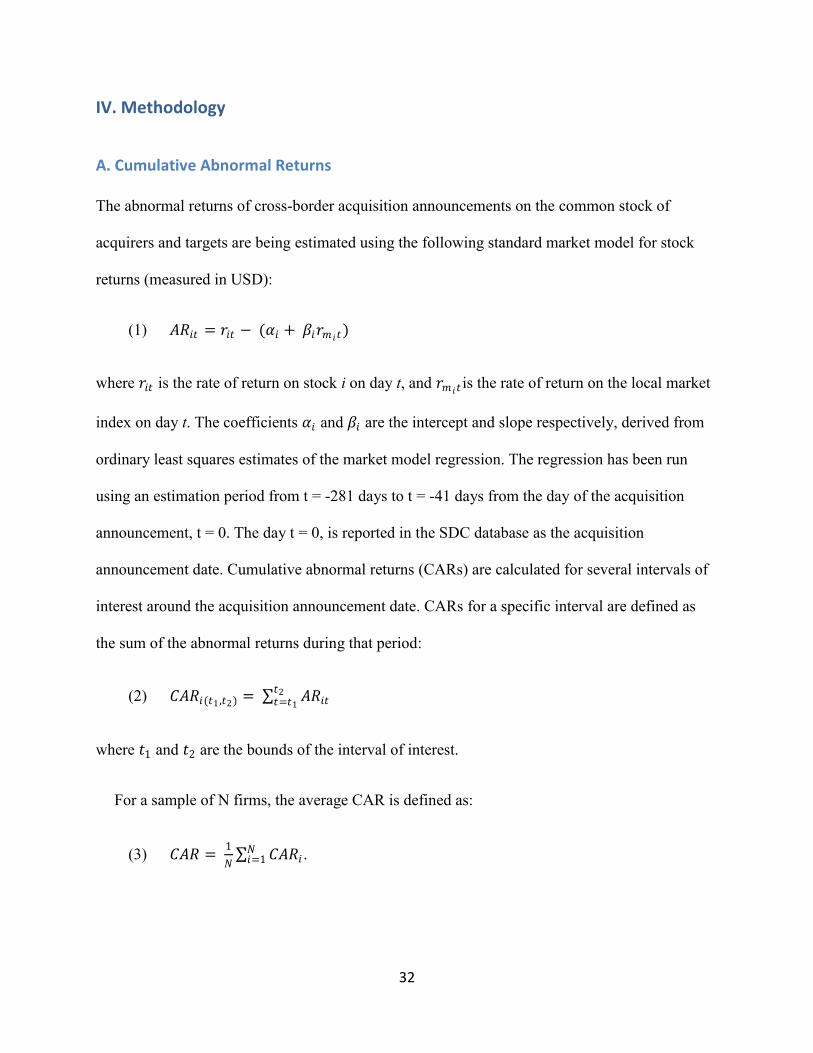
A. Cumulative Abnormal Returns
The abnormal returns of cross-border acquisition announcements on the common stock of
acquirers and targets are being estimated using the following standard market model for stock
returns (measured in USD):
(1) 𝐴𝑅𝑖𝑡 = 𝑟𝑖𝑡 − (𝛼𝑖 + 𝛽𝑖𝑟𝑚 𝑖𝑡)
where 𝑟𝑖𝑡 is the rate of return on stock i on day t, and 𝑟𝑚 𝑖𝑡is the rate of return on the local market
index on day t. The coefficients 𝛼𝑖 and 𝛽𝑖 are the intercept and slope respectively, derived from
ordinary least squares estimates of the market model regression. The regression has been run
using an estimation period from t = -281 days to t = -41 days from the day of the acquisition
announcement, t = 0. The day t = 0, is reported in the SDC database as the acquisition
announcement date. Cumulative abnormal returns (CARs) are calculated for several intervals of
interest around the acquisition announcement date. CARs for a specific interval are defined as
the sum of the abnormal returns during that period:
(2) 𝐶𝐴𝑅𝑖(𝑡1 ,𝑡2) = 𝐴𝑅𝑖𝑡𝑡2𝑡=𝑡1
where 𝑡1 and 𝑡2 are the bounds of the interval of interest.
For a sample of N firms, the average CAR is defined as:
(3) 𝐶𝐴𝑅 = 1
𝑁 𝐶𝐴𝑅𝑖
𝑁𝑖=1 .

33
CARs of various intervals are considered. In the results section below, CARs from (-40, +40)
are plotted and stratified based on certain deal characteristics. Also, CARs surrounding the
announcement date are calculated and tested for statistical significance.
The cross-sectional abnormal returns to targets and acquirers are explained by analysing the
following linear regression model:
(4) 𝐶𝐴𝑅𝑖 = 𝑓 𝑅𝐸𝐿𝐴𝑇𝐸𝐷𝑖 ,𝑀𝑉𝑅𝐴𝑇𝐼𝑂𝑖 ,𝑇𝐸𝑁𝐷𝐸𝑅𝑖 ,𝑇𝐼𝐴𝑅𝐴𝑇𝐼𝑂𝑖 ,𝐸𝑀𝑃𝑅𝐴𝑇𝐼𝑂𝑖 ,
𝐵𝑈𝐵𝐵𝐿𝐸𝑖 ,𝐶𝐴𝑆𝐻𝑖 ,𝑈𝑆𝐴𝐶𝑄𝑖 ,𝑈𝑆𝑇𝐴𝑅𝑖 ,𝑇𝐸𝑅𝑀𝑃𝑅𝑂𝑉𝑖
where:
𝐶𝐴𝑅𝑖 = cumulative abnormal returns for the bidder i in the interval (-1, +1) surrounding
the acquisition announcement day t = 0.
𝑅𝐸𝐿𝐴𝑇𝐸𝐷𝑖 = a dummy variable equal to 1 if the acquirer and target have the same
four-digit SIC industry code.
𝑀𝑉𝑅𝐴𝑇𝐼𝑂𝑖 = the ratio of market values (41 days prior to the acquisition announcement)
of the target to the acquirer.
𝑇𝐸𝑁𝐷𝐸𝑅𝑖 = a dummy variable equal to 1 if the acquirer issues a tender offer
𝑇𝐼𝐴𝑅𝐴𝑇𝐼𝑂𝑖 = the target firm‟s ratio of intangible assets to total assets as at the previous
fiscal year end.
𝐸𝑀𝑃𝑅𝐴𝑇𝐼𝑂𝑖 = the ratio of the number of employees of the target to the acquirer. These
figures are taken from the previous fiscal year end.

34
𝐵𝑈𝐵𝐵𝐿𝐸𝑖 = a dummy variable set equal to 1 if acquisition announcement occurs after
March 2000, which was the end of the technology bubble.
𝐶𝐴𝑆𝐻𝑖 = a dummy variable set equal to 1 if the consideration for the acquisition is
100% cash.
𝑈𝑆𝐴𝐶𝑄𝑖 = a dummy variable set equal to 1 if the acquirer is domiciled in the United
States.
𝑈𝑆𝑇𝐴𝑅𝑖 = a dummy variable set equal to 1 if the target is domiciled in the United
States.
𝑇𝐸𝑅𝑀𝑃𝑅𝑂𝑉𝑖 = a dummy variable set equal to 1 if there exists a termination provision
as part of the acquisition announcement.
For each deal, both acquirers and targets use the same independent variables. The only
difference between the models is the dependent variable (CAR) will be target or acquirer specific.
B. Combined Wealth Gains
The method used in this study for calculating combined wealth gains follows that used by
Eun, Kolodny, and Scheraga (1996). Wealth gains to each acquirer are measured by:
(5) ∆𝑊𝐴 = 𝑊𝐴 ∙ 𝐶𝐴𝑅𝐴
where 𝑊𝐴is the market value of the acquirer stock in Year 2000 US dollars six days prior to the
acquisition announcement, and 𝐶𝐴𝑅𝐴 is the cumulative abnormal return to the acquirer from five
days prior to the acquisition announcement to five days afterwards. Wealth gains to each target
are measured by:
35
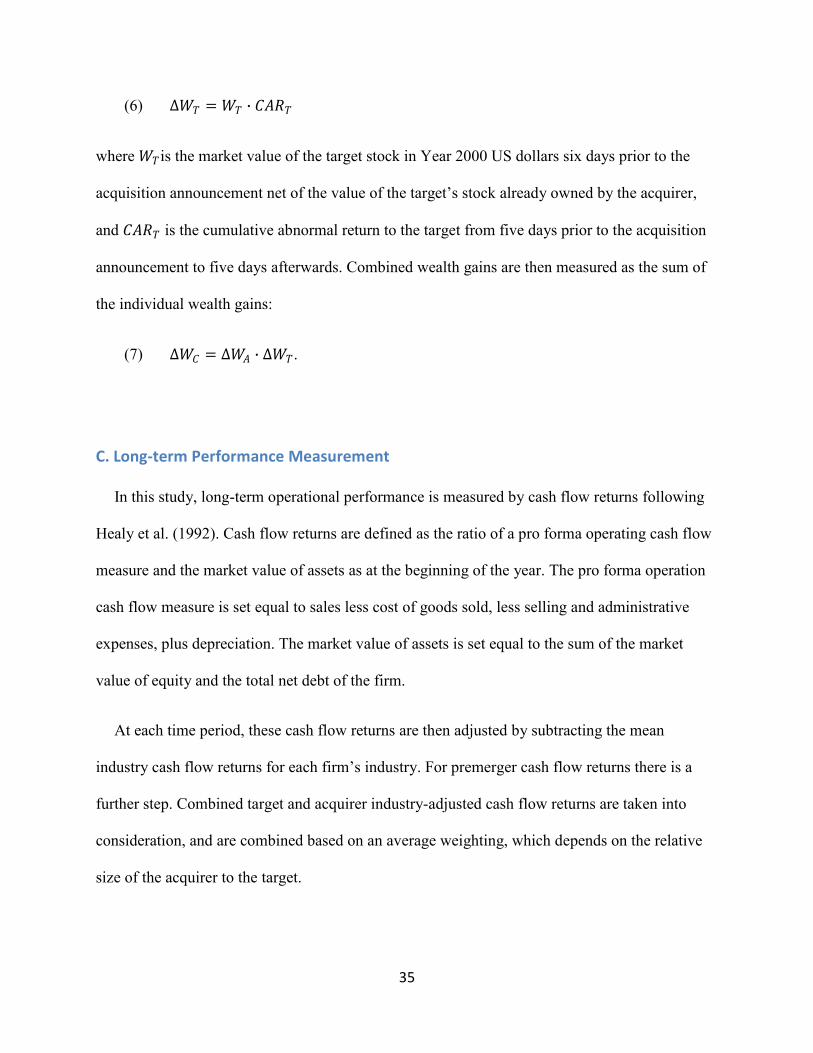
(6) ∆𝑊𝑇 = 𝑊𝑇 ∙ 𝐶𝐴𝑅𝑇
where 𝑊𝑇is the market value of the target stock in Year 2000 US dollars six days prior to the
acquisition announcement net of the value of the target‟s stock already owned by the acquirer,
and 𝐶𝐴𝑅𝑇 is the cumulative abnormal return to the target from five days prior to the acquisition
announcement to five days afterwards. Combined wealth gains are then measured as the sum of
the individual wealth gains:
(7) ∆𝑊𝐶 = ∆𝑊𝐴 ∙ ∆𝑊𝑇.
C. Long-term Performance Measurement
In this study, long-term operational performance is measured by cash flow returns following
Healy et al. (1992). Cash flow returns are defined as the ratio of a pro forma operating cash flow
measure and the market value of assets as at the beginning of the year. The pro forma operation
cash flow measure is set equal to sales less cost of goods sold, less selling and administrative
expenses, plus depreciation. The market value of assets is set equal to the sum of the market
value of equity and the total net debt of the firm.
At each time period, these cash flow returns are then adjusted by subtracting the mean
industry cash flow returns for each firm‟s industry. For premerger cash flow returns there is a
further step. Combined target and acquirer industry-adjusted cash flow returns are taken into
consideration, and are combined based on an average weighting, which depends on the relative
size of the acquirer to the target.

36
Two simple regression models are used to model the relationship between post-merger cash
flow returns with premerger cash flow returns, and acquisition announcement window abnormal
stock returns following Healy et al. (1992). In the first model:
(8) 𝐶𝐹𝑟𝑝𝑜𝑠𝑡 ,𝑖 = 𝛼 + 𝛽𝐶𝐹𝑟𝑝𝑟𝑒 ,𝑖 + 𝜀𝑖
where 𝐶𝐹𝑟𝑝𝑜𝑠𝑡 ,𝑖 is the median combined industry-adjusted cash flow returns in the post-merger
period for deal i, and 𝐶𝐹𝑟𝑝𝑟𝑒 ,𝑖 is the median combined industry-adjusted cash flow returns in the
premerger period for deal i.
The second model incorporates the combined unexpected merger announcement asset
returns:
(9) 𝐶𝐹𝑟𝑝𝑜𝑠𝑡 ,𝑖 = 𝛼 + 𝛽1𝐶𝐹𝑟𝑝𝑟𝑒 ,𝑖 + 𝛽2𝜕𝑉𝑖 + 𝜀𝑖
where 𝜕𝑉𝑖 is the unexpected asset returns as measured by the combined cumulative abnormal
returns of the target and acquirer from five days prior to the announcement to five days
afterwards. The CARs are combined by weighting each CAR by the relative market values of
each firm in the deal.
In both of these models, 𝛼 measures the abnormal industry-adjusted return. That is, 𝛼 is the
expected abnormal industry-adjusted return to the acquire that is attributed solely to the fact a
merger has occurred. The 𝛽𝑗 ‟s measure the correlation between each independent variable and
the postmerger industry-adjusted cash flow returns.
One caveat of this model is that there is an intrinsic issue with using the operating cash flow
returns. Since the denominator is the market value of assets, as a function of the market value of
equity, then a post-merger decrease in market value of equity, combined with maintaining

37
constant cash flows, will force cash flow returns to increase, making the post-merger returns
questionable. Further research needs to be conducted to account for changes in market value of
assets by using industry adjusted market values of assets. Currently, the industry adjusted cash
flow returns tries to address this issue, but it may not be robust.

38
V. Results
The results of the analysis are divided into measurements of valuation effects for participants in
cross-border high-tech mergers and acquisitions, and the explanation of the variation of those
effects.
A. Gains to Bidders of High-Tech Cross-Border Targets
To assess how the market values the prospect of cross-border tech acquisitions, event CARs
are calculated for the bidding firms in the sample. Table VI Panel A describes the average gains
to bidders during windows around the acquisition announcement.
Table VI. Valuation Effects for Full Sample
This table provides the results from the event study analysis for the full
sample of acquisition announcements. Panel A covers the returns to
acquirers and Panel B details the returns to targets. A market model has
been utilised with a 170 day estimation period (from day -281 to day -
41) for parameter estimation. These firms are all involved in high-tech
acquisitions announced between 1991 and 2004 where deals were listed
in SDC and both target and bidder had trading and accounting data in
Datastream in the (-3, 3) year window surrounding the acquisition
announcement. The Window column is listed in terms of days from the
announcement date.
Panel A. Acquirer Cumulative Abnormal Returns
Window CAR (%) P-Value Pos:Neg
(0, 0) -0.95 0.9206 30:31
(-1, 0) -1.25 0.9684 28:33
(-1, +1) -1.54 0.9679 26:35
Panel B. Target Cumulative Abnormal Returns
Window CAR P-Value Pos:Neg
(0, 0) 12.30 0.0000 50:11
(-1, 0) 13.93 0.0000 51:10
(-1, +1) 17.77 0.0000 51:10
39
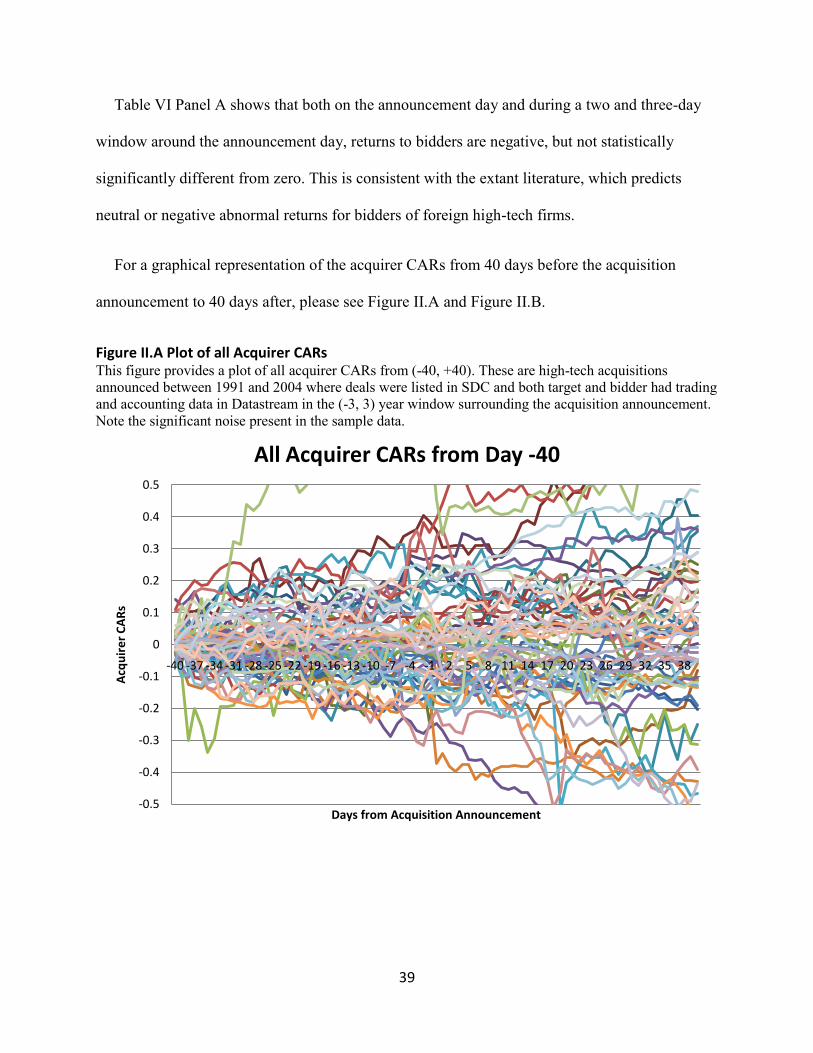
Table VI Panel A shows that both on the announcement day and during a two and three-day
window around the announcement day, returns to bidders are negative, but not statistically
significantly different from zero. This is consistent with the extant literature, which predicts
neutral or negative abnormal returns for bidders of foreign high-tech firms.
For a graphical representation of the acquirer CARs from 40 days before the acquisition
announcement to 40 days after, please see Figure II.A and Figure II.B.
Figure II.A Plot of all Acquirer CARs This figure provides a plot of all acquirer CARs from (-40, +40). These are high-tech acquisitions
announced between 1991 and 2004 where deals were listed in SDC and both target and bidder had trading
and accounting data in Datastream in the (-3, 3) year window surrounding the acquisition announcement.
Note the significant noise present in the sample data.
-0.5
-0.4
-0.3
-0.2
-0.1
0
0.1
0.2
0.3
0.4
0.5
-40 -37 -34 -31 -28 -25 -22 -19 -16 -13 -10 -7 -4 -1 2 5 8 11 14 17 20 23 26 29 32 35 38
Acq
uir
er
CA
Rs
Days from Acquisition Announcement
All Acquirer CARs from Day -40

40
Figure II.B Plot of Average Acquirer CARs This figure provides a plot of average acquirer CARs from (-40, +40). These are high-tech acquisitions announced between 1991
and 2004 where deals were listed in SDC and both target and bidder had trading and accounting data in Datastream in the (-3, 3)
year window surrounding the acquisition announcement.
Over the longer time horizon, CARs from 40 days prior to the announcement to a time near
the announcement window are positive, but not significantly different from zero. Mean and
median CARs generally move in tandem, with mean CARs skewing slightly higher.
B. Gains to Targets of High-Tech Cross-Border Acquisitions
In the case of targets however, it is expected that targets experience significant shareholder
gains at an acquisition announcement. Table VI Panel B describes the average gains to targets
during windows around the acquisition announcement.
During the three- and two-day announcement windows, target shareholder gains are
significantly positive with CARs of 17.8% and 13.9% respectively. This is consistent with
-0.0200
-0.0100
0.0000
0.0100
0.0200
0.0300
0.0400
0.0500
-40 -36 -32 -28 -24 -20 -16 -12 -8 -4 0 4 8 12 16 20 24 28 32 36 40
Acq
uir
er
CA
Rs
Days since Acquisition Announcement
Acquirer CARs from Day -40
Mean
Median

41
findings by Benou, Gleason, and Madura (2007), who find CARs of 14.4% and 12.7% during the
same windows.
For a graphical representation of the target CARs from 40 days before the acquisition
announcement to 40 days after, please see Figure III.A and Figure III.B.
Figure III.A Plot of all Target CARs This figure provides a plot of all target CARs from (-40, +40). These are high-tech acquisitions
announced between 1991 and 2004 where deals were listed in SDC and both target and bidder had trading
and accounting data in Datastream in the (-3, 3) year window surrounding the acquisition announcement.
While this sample data is quite noisy, the clear jump at the announcement date is still recognizable.
-0.5
-0.4
-0.3
-0.2
-0.1
0
0.1
0.2
0.3
0.4
0.5
0.6
0.7
0.8
0.9
1
-40 -37 -34 -31 -28 -25 -22 -19 -16 -13 -10 -7 -4 -1 2 5 8 11 14 17 20 23 26 29 32 35 38
Targ
et
CA
Rs
Days from Acquisition Announcement
All Target CARs from Day -40

42
Figure III.B Plot of Average Target CARs This figure provides a plot of average target CARs from (-40, +40). These are high-tech acquisitions announced between 1991
and 2004 where deals were listed in SDC and both target and bidder had trading and accounting data in Datastream in the (-3, 3)
year window surrounding the acquisition announcement.
Over the longer time horizon, target CARs from 40 days prior to the announcement to a time
near the announcement window are positive, and significantly different from zero. Mean CARs
exhibit a run-up trend that median CARs to not have. Also, there is a sizable post announcement
drop-off in median CARs that is not present in median CARs.
C. Combined Wealth Gains to Bidders and Targets
Eun, Kolodny, and Scheraga (1996) were one of the first to conduct analysis on combined
wealth gains to bidders and targets in cross-border acquisition announcements. They found on
average acquisitions created combined wealth gains of $68 million, indicating cross-border
acquisitions are synergy-creating activities.
-0.0500
0.0000
0.0500
0.1000
0.1500
0.2000
0.2500
0.3000
0.3500
-40 -36 -32 -28 -24 -20 -16 -12 -8 -4 0 4 8 12 16 20 24 28 32 36 40
Targ
et
CA
Rs
Days since Acquisition Announcement
Target CARs from Day -40
Mean
Median

43
In this study, combined wealth gains are calculated for each acquisition. Table VII shows the
result of this analysis, and all figures are in year 2000 US dollars. The precise methodology used
for calculating wealth gains is described in the caption to Table VII.
Table VII. Wealth Gains for Full Sample This table provides the wealth gains for the sample of 61 cross-border technological acquisitions. All gains
stated are in millions of year 2000 US dollars. These firms are all involved in high-tech acquisitions announced
between 1991 and 2004 where deals were listed in SDC and both target and bidder had trading and accounting
data in Datastream in the (-3, 3) year window surrounding the acquisition announcement. The Window column
is listed in terms of days from the announcement date.
N Acquirer Target Combined
Mean (Median)
Gain
Positive Gain Mean (Median)
Gain
Positive Gain Mean (Median)
Gain
Positive Gain
61 -305.1
-1.0
30 23.2
21.9
49 -281.9
21.4
36
For each of 61 acquisitions, wealth gain to acquirer (∆WA) = WA • CARA; wealth gain to target (∆WT) = WT •
CART; and combined wealth gain = WT + WA. Where WA = market value of acquirer‟s stock in terms of Year
2000 US dollars, six days prior to the acquisition announcement made by the acquiring firm; WT = market
value of target‟s stock six days prior to the acquisition announcement, net of value of target‟s stock owned by
the acquirer; CARA = cumulative abnormal return to the acquiring firm from five days prior to the acquisition
announcement to five days after the acquisition announcement; and CART = cumulative abnormal return to the
target firm from five days prior to the acquisition announcement through five days after acquisition
announcement. This is identical to the method used by Eun, Kolodny, and Scheraga (1996).
Wealth gains to acquirers are negative at $-305.1 million, wealth gains to targets are positive
at $23.2 million. The combined wealth gains do not agree with the Eun, Kolodny, and Scheraga
(1996) study as they are negative at $-281.9 million. This may indicate that the market views
high-tech cross-border acquisitions as value destroying endeavours, and that the synergistic gains
to the acquirer are not perceived to recoup the premiums paid in the acquisition price. The
median wealth gains are significantly different from mean wealth gains for acquirers and
combined firms. It appears a few large losses to acquirers have skewed the means. The medians
indicate acquirers have slightly negative wealth gains, and that acquisition announcements
produce positive combined wealth gains in 59% of deals under consideration. Taken together, it

44
appears that in slightly more than half of all deals, the market views high-tech cross-border
acquisitions as value creating endeavours, but there are a small number of deals where the
market believes the acquisition will destroy significant value for the acquirer.
D. Employee Ratio
One of the aims of this paper is to investigate the relevance of the ratio of target employees to
acquirer employees at the announcement of a high-tech cross-border acquisition. Table VIII
describes abnormal returns for both acquirer and targets stratified by the employee ratio of the
firms involved in the deal.
Table VIII. Cumulative Abnormal Returns of Subsample Partitioned by Employee Ratio This table provides the results from the event study analysis for a subsample of acquisition announcements
where the sample is partitioned based on which quartile the deal‟s employee ratio belongs to. Panel A describes
acquirer CARs, whereas Panel B reports target CARs. A market model has been utilised with a 170 day
estimation period (from day -210 to day -41) for parameter estimation. These firms are all involved in high-
tech acquisitions announced between 1991 and 2004 where deals were listed in SDC and both target and bidder
had trading and accounting data in Datastream in the (-3, 3) year window surrounding the acquisition
announcement. The Window column is listed in terms of days from the announcement date. In this analysis,
only deals where employee ratios were available – that is, only 39 of the 61 deals understudy fell in this
category.
Panel A. Employee Ratio – Acquirer CARs
Window CAR – Q1 N = 9
CAR – Q2 N = 11
CAR – Q3 N = 10
CAR – Q4 N = 9
(0, 0) -0.24% -0.07% -2.89% 0.73%
(-1, 0) -0.03% 0.53% -2.83% 1.19%
(-1, +1) -0.39% 0.75% -2.00% -1.82%
Panel B. Employee Ratio – Target CARs
Window CAR – Q1 N = 9
CAR – Q2 N = 11
CAR – Q3 N = 10
CAR – Q4 N = 9
(0, 0) 11.40%** 10.49%** 11.76%* 9.07%**
(-1, 0) 13.10%*** 14.07%** 11.05%* 11.49%**
(-1, +1) 14.07%** 14.09%** 17.59%** 21.30%***
*** Significant at the 1.00% level
** Significant at the 5.00% level
* Significant at the 10.00% level

45
Employee data were obtained during the data collection process outlined above, and these
figures come from the Datastream database. Employee figures are as of each firms‟ fiscal year
end just prior to the acquisition announcement. The deals in the sample have a mean employee
ratio of 36.28%, and a median ratio of 10.58%.
To examine whether employee ratio produces a valuation effect, the sample is stratified along
quartiles of the employee ratio. The figures of interest are the abnormal returns to shareholders of
the bidding firm. Table VIII Panel A reports that for each window and quartile under
consideration, the returns to bidder shareholders in high-tech cross-border acquisitions are not
significantly different from zero. In the case of returns to target shareholders, Table VIII Panel B
shows the abnormal returns in all situations considered are significantly positive and, at least in
the (-1, +1) day window, increasing with employee ratio.
The Employee Ratio Hypothesis stated that the share price response of the bidder and target
will be more favourable when the ratio of target employees to acquirer employees is lower. In
this case it is shown for acquirers that returns are not significantly different than zero, however,
another important aspect is whether the mean significantly changes across quartiles. Table IX
Panel A reports a test of means of acquirer CARs between each quartile and the remaining
sample.

46
Table IX. CARs of Subsample Partitioned by Employee Ratio – Test of Means This table provides the results from the event study analysis for a subsample of acquisition announcements
where the sample is partitioned based on which quartile the deal‟s employee ratio belongs to. Panel A describes
the test of means for acquirer CARs of each quartile versus the rest of the sample, whereas Panel B does the
same for target CARs. A market model has been utilised with a 170 day estimation period (from day -210 to
day -41) for parameter estimation. These firms are all involved in high-tech acquisitions announced between
1991 and 2004 where deals were listed in SDC and both target and bidder had trading and accounting data in
Datastream in the (-3, 3) year window surrounding the announcement. The Window column is listed in terms of
days from the acquisition announcement date. In this analysis, only deals where employee ratios were
available – that is, only 39 of the 61 deals understudy fell in this category.
Panel A. Employee Ratio – Acquirer CARs Test of Means
Window Test of Means – Q1 N = 9
Test of Means – Q2 N = 11
Test of Means – Q3 N = 10
Test of Means – Q4 N = 9
(0, 0) 0.33472 0.544038 -2.08262** 1.149009
(-1, 0) 0.195442 0.672333 -1.97869*** 1.056592
(-1, +1) 0.286798 1.238937 -0.87468 -0.69025
Panel B. Employee Ratio – Target CARs Test of Means
Window Test of Means – Q1 N = 9
Test of Means – Q2 N = 11
Test of Means – Q3 N = 10
Test of Means – Q4 N = 9
(0, 0) 0.182802 -0.06065 0.295049 -0.42439
(-1, 0) 0.146986 0.434675 -0.36383 -0.2338
(-1, +1) -0.52005 -0.58973 0.202784 0.946283
*** Significant at the 1.00% level
** Significant at the 5.00% level
* Significant at the 10.00% level
For acquirers, the negative returns seen in the third quartile for windows (0, 0) and (-1, 0)
have significantly different means when compared to the remaining sample at the 5.00% level.
This may provide weak evidence to support the Employee Ratio Hypothesis, as the hypothesis
predicts returns will be relatively poorer as the ratio of target employees to acquirer employees
increases. A possible explanation as to why the third quartile has significantly different means,
but the fourth quartile does not, may be because when firms acquire very large firms the
digestibility issue is countered by the significantly increased market share and the benefits
associated with a dominant market position.

47
Table IX Panel B indicates that for target returns, the means do not vary significantly across
quartiles. In the case of returns to target shareholders of high-tech cross-border acquisition
announcements, there is no evidence to support the hypothesis that the market will value more
digestible target firms as indicated by a lower employee ratio.
E. Target Intangible Assets to Total Assets Ratio
This study also aims to investigate the role played by the intangible assets of the target firm.
As a proxy for the relative level of intangibles of the target firm, the ratio of the target intangible
assets to target total assets (TIA ratio) is used. Table X reports abnormal returns for both acquirer
and targets stratified by the ratio of target intangible assets to total asset.

48
Table X. CARs of Subsample Partitioned by TIA Ratio This table provides the results from the event study analysis for a subsample of acquisition announcements
where the sample is partitioned based on which quartile the deal‟s ratio of target intangibles to total assets
belongs to. Panel A describes acquirer CARs, whereas Panel B reports target CARs. A market model has been
utilised with a 170 day estimation period (from day -210 to day -41) for parameter estimation. These firms are
all involved in high-tech acquisitions announced between 1991 and 2004 where deals were listed in SDC and
both target and bidder had trading and accounting data in Datastream in the (-3, 3) year window surrounding
the acquisition announcement. The Window column is listed in terms of days from the announcement date. In
this analysis, only deals where target intangibles and total assets were available – that is, only 39 of the 61
deals understudy fell in this category.
Panel A. TIA Ratio – Acquirer CARs
Window CAR – Q1 N = 9
CAR – Q2 N = 11
CAR – Q3 N = 9
CAR – Q4 N = 10
(0, 0) -0.43% -0.62% -2.37% 0.68%
(-1, 0) -0.21% 0.16% -2.04% 0.62%
(-1, +1) -1.28% 0.08% -3.40% 0.97%
Panel B. TIA Ratio – Target CARs
Window CAR – Q1 N = 9
CAR – Q2 N = 11
CAR – Q3 N = 9
CAR – Q4 N = 10
(0, 0) 8.55%** 11.72%** 15.01%** 7.62%**
(-1, 0) 10.04%** 12.80%** 15.56%** 11.53%**
(-1, +1) 20.43%** 17.03%** 18.67%*** 11.00%*
*** Significant at the 1.00% level
** Significant at the 5.00% level
* Significant at the 10.00% level
Target intangible assets and total assets data were obtained during the data collection process
outlined above, and these figures come from the Datastream database. These figures are as of
each firms‟ fiscal year end just prior to the acquisition announcement. The results show that the
deals in the sample have a mean target intangible asset to total asset ratio of 20.48%, and a
median ratio of 18.55%.
To examine whether employee ratio produces a valuation effect, the sample is stratified along
quartiles of the TIA ratio. The figures of interest are the abnormal returns to shareholders of the
49
bidding firm. Table X Panel A reports that for each window and quartile under consideration, the
returns to bidder shareholders in high-tech cross-border acquisitions are not significantly
different from zero. In the case of returns to target shareholders, Table X Panel B shows the
abnormal returns in all situations considered are significantly positive.
The Target Intangible Assets to Total Asset Ratio Hypothesis stated that the share price
response of the bidder and target will be more favourable when the ratio of target intangible
assets to total assets is higher. In this case it is shown for acquirers that returns are not
significantly different than zero, and returns to target shareholders are significantly different
from zero. However, another important aspect is whether the mean significantly changes across
quartiles. Table XI Panel A reports a test of means of acquirer CARs between each quartile and
the remaining sample.

50
Table XI. CARs of Subsample Partitioned by TIA Ratio – Test of Means This table provides the results from the event study analysis for a subsample of acquisition announcements
where the sample is partitioned based on which quartile the deal‟s ratio of target intangibles to total assets
belongs to. Panel A describes the test of means for acquirer CARs of each quartile versus the rest of the
sample, whereas Panel B does the same for target CARs. A market model has been utilised with a 170 day
estimation period (from day -210 to day -41) for parameter estimation. These firms are all involved in high-
tech acquisitions announced between 1991 and 2004 where deals were listed in SDC and both target and bidder
had trading and accounting data in Datastream in the (-3, 3) year window surrounding the acquisition
announcement. The Window column is listed in terms of days from the announcement date. In this analysis,
only deals where target intangibles and total assets were available – that is, only 39 of the 61 deals understudy
fell in this category.
Panel A. TIA Ratio – Acquirer CARs Test of Means
Window Test of Means – Q1 N = 9
Test of Means – Q2 N = 11
Test of Means – Q3 N = 9
Test of Means – Q4 N = 10
(0, 0) 0.180823 0.020427 -1.45134 1.188787
(-1, 0) 0.073053 0.439285 -1.22291 0.700233
(-1, +1) -0.32056 0.692099 -1.83664* 1.327233
Panel B. TIA Ratio – Target CARs Test of Means
Window Test of Means – Q1 N = 9
Test of Means – Q2 N = 11
Test of Means – Q3 N = 9
Test of Means – Q4 N = 10
(0, 0) -0.56152 0.305606 1.140314 -0.86511
(-1, 0) -0.57949 0.088922 0.736285 -0.24049
(-1, +1) 0.767294 0.087242 0.407727 -1.24209
*** Significant at the 1.00% level
** Significant at the 5.00% level
* Significant at the 10.00% level
For both acquirers and targets the test of means reveals no significant differences between
CARs in different quartiles. Thus, it appears there is no evidence to support the hypothesis that
returns to shareholders of targets and acquirers will be higher when the ratio of target intangible
assets to total assets is higher.
F. Stratification of Full Sample
The regression of the previous section highlighted a few factors that may be of some
importance when considering returns to shareholders in high-tech cross-border acquisitions. To

51
investigate these factors on the full sample, the sample has been stratified along these control
variables and their means are compared.
Table XII reports the acquirer CARs stratified by tender offers, cash payments, US acquirers,
and termination provisions.

52
Table XII. CARs of Acquirer Subsample Partitioned by Tender Offers, Cash Payments, US Acquirers, and Termination Provisions
This table provides the results from the event study analysis for a subsample of acquisition announcements.
Acquirer CARs are stratified as follows: Panel A by whether a tender offer was made; Panel B by whether the
consideration was a 100% cash payment or not; Panel C by whether the Acquirer is domiciled in the US; and
Panel D by whether a termination provision was present. A market model has been utilised with a 170 day
estimation period (from day -210 to day -41) for parameter estimation. These firms are all involved in high-
tech acquisitions announced between 1991 and 2004 where deals were listed in SDC and both target and bidder
had trading and accounting data in Datastream in the (-3, 3) year window surrounding the acquisition
announcement. The Window column is listed in terms of days from the announcement date.
Panel A. Tender Offers
Window CAR – Tender Offer N = 32
CAR – No Tender Offer N = 29
Test of Means (t-Values)
(0, 0) -0.24% -1.74% -1.07
(-1, 0) -0.16% -2.45%** -1.69*
(-1, +1) -0.24% -3.49%** -2.26**
Panel B. Cash Payments
Window CAR – Cash Payments N = 25
CAR – Non Cash Payments N = 36
Test of Means (t-Values)
(0, 0) -0.09% -1.55% -1.21
(-1, 0) -0.63% -1.68% -0.84
(-1, +1) -0.33% -2.37%* -1.30
Panel C. US Acquirer
Window CAR – US Acquirer N = 18
CAR – Non US Acquirer N = 43
Test of Means (t-Values)
(0, 0) 0.51% -1.56%* -1.42
(-1, 0) 0.37% -1.93%** -1.57
(-1, +1) 0.33% -2.32%** -1.47
Panel D. Termination Provision
Window CAR – Termination Provision N = 21
CAR – No Termination Provision N = 40
Test of Means (t-Values)
(0, 0) -2.32% -0.23% 1.19
(-1, 0) -2.78%* -0.45% 1.40
(-1, +1) -2.98% -0.78% 1.07
*** Significant at the 1.00% level
** Significant at the 5.00% level
* Significant at the 10.00% level
53
In the window (-1, 0) and (-1, +1), deals without tender offers have significantly negative
abnormal returns to shareholders at the 5.00% level. Additionally, a test of means indicates these
negative CARs are significantly different from deals with tender offers at the 10.00% and 5.00%
levels respectively.
Non-cash payments result in significantly negative CARs at the 10.00% level for the window
(-1, +1), but the mean of these CARs is not significantly different from CARs to acquirers when
the deal consideration is 100% cash.
When a deal involves a non-US acquirer, the CARs to acquirers are significantly negative
across all windows under consideration. Deals with a termination provision have significantly
negative returns to acquirer shareholders at the 10.00% level in the window (-1, 0). The test of
means reveals none of these are significantly different from their counterparts however.
Returns to targets are significantly different from zero across all stratifications, as can be seen
in Table XIII, which is consistent with the extant literature.

54
Table XIII. CARs of Target Subsample Partitioned by Tender Offers, Cash Payments, US Acquirers, and Termination Provisions
This table provides the results from the event study analysis for a subsample of acquisition announcements.
Target CARs are stratified as follows: Panel A by whether a tender offer was made; Panel B by whether the
consideration was a 100% cash payment or not; Panel C by whether the Acquirer is domiciled in the US; and
Panel D by whether a termination provision was present. A market model has been utilised with a 170 day
estimation period (from day -210 to day -41) for parameter estimation. These firms are all involved in high-
tech acquisitions announced between 1991 and 2004 where deals were listed in SDC and both target and bidder
had trading and accounting data in Datastream in the (-3, 3) year window surrounding the acquisition
announcement. The Window column is listed in terms of days from the announcement date.
Panel A. Tender Offers
Window CAR – Tender Offer N = 32
CAR – No Tender Offer N = 29
Test of Means (t-Values)
(0, 0) 18.23%*** 5.76%** -2.69***
(-1, 0) 20.72%*** 6.43%** -2.69***
(-1, +1) 26.18%*** 8.49%** -3.19***
Panel B. Cash Payments
Window CAR – Cash Payments N = 25
CAR – Non Cash Payments N = 36
Test of Means (t-Values)
(0, 0) 12.64%** 12.06%*** -0.10
(-1, 0) 13.28%** 14.38%*** 0.17
(-1, +1) 18.63%*** 17.17%*** -0.22
Panel C. US Acquirer
Window CAR – US Acquirer N = 18
CAR – Non US Acquirer N = 43
Test of Means (t-Values)
(0, 0) 17.72%*** 10.03%*** -1.41
(-1, 0) 19.32%*** 11.67%*** -1.47
(-1, +1) 19.42%*** 17.07%*** -0.43
Panel D. Termination Provision
Window CAR – Termination Provision N = 21
CAR – No Termination Provision N = 40
Test of Means (t-Values)
(0, 0) 18.45%*** 9.07%*** -1.53
(-1, 0) 20.47%*** 10.49%*** -1.39
(-1, +1) 27.52%*** 12.65%*** -1.99*
*** Significant at the 1.00% level
** Significant at the 5.00% level
* Significant at the 10.00% level

55
In the case of tender offers, the existence of tender offers produces significantly higher returns
to target shareholders than otherwise. The test of means reveals that across all windows under
consideration the means are significantly different at the 1.00% level.
Stratification by cash payments yields target CARs that are not significantly different across any
window, which is consistent with the discussion in the next section on the graph of target CARs
partitioned by cash payment status (Figure VI.B).
US acquirers do experience higher acquirer CARs, but the test of means reveals these are not
significantly different from the case with non-US acquirers. This is also the case for deals with a
termination provision, except during the window (-1, +1) where the test of means reveals the
average CARs are significantly different at the 10.00% level.
G. Cross Sectional Regression Results
In this section CARs are stratified by different control variables for a visual representation of
how CARs differ. In the end of the section, the cross-sectional regression results are reported in
Table XIV.
Figure IV.A plots acquirer CARs stratified by whether the deals were related or not, and
Figure IV.B does the same for target CARs.
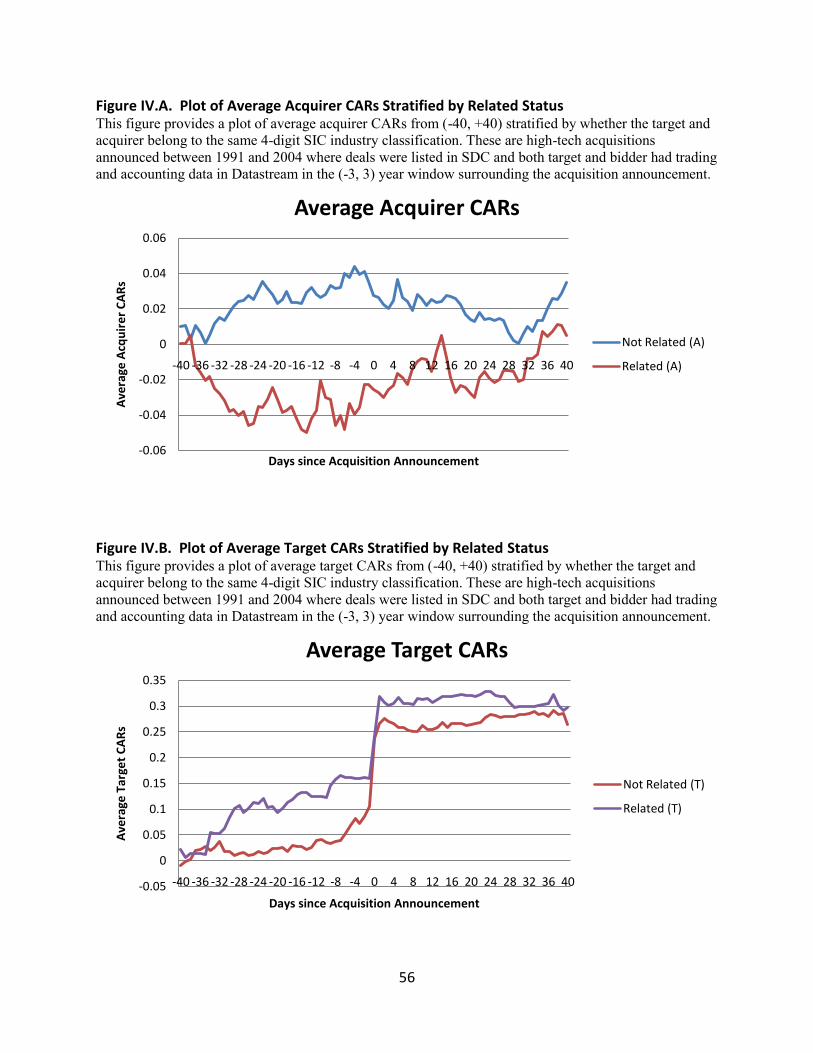
56
Figure IV.A. Plot of Average Acquirer CARs Stratified by Related Status This figure provides a plot of average acquirer CARs from (-40, +40) stratified by whether the target and
acquirer belong to the same 4-digit SIC industry classification. These are high-tech acquisitions
announced between 1991 and 2004 where deals were listed in SDC and both target and bidder had trading
and accounting data in Datastream in the (-3, 3) year window surrounding the acquisition announcement.
Figure IV.B. Plot of Average Target CARs Stratified by Related Status This figure provides a plot of average target CARs from (-40, +40) stratified by whether the target and
acquirer belong to the same 4-digit SIC industry classification. These are high-tech acquisitions
announced between 1991 and 2004 where deals were listed in SDC and both target and bidder had trading
and accounting data in Datastream in the (-3, 3) year window surrounding the acquisition announcement.
-0.06
-0.04
-0.02
0
0.02
0.04
0.06
-40 -36 -32 -28 -24 -20 -16 -12 -8 -4 0 4 8 12 16 20 24 28 32 36 40
Ave
rage
Acq
uir
er
CA
Rs
Days since Acquisition Announcement
Average Acquirer CARs
Not Related (A)
Related (A)
-0.05
0
0.05
0.1
0.15
0.2
0.25
0.3
0.35
-40 -36 -32 -28 -24 -20 -16 -12 -8 -4 0 4 8 12 16 20 24 28 32 36 40
Ave
rage
Tar
get
CA
Rs
Days since Acquisition Announcement
Average Target CARs
Not Related (T)
Related (T)
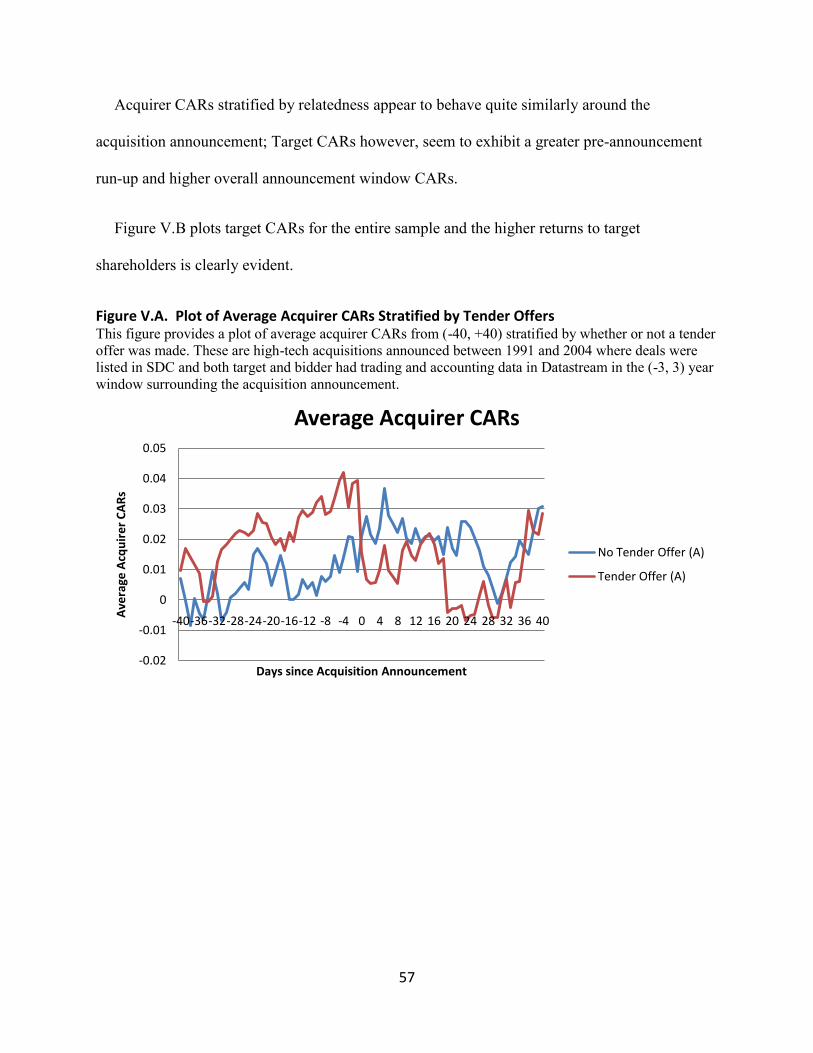
57
Acquirer CARs stratified by relatedness appear to behave quite similarly around the
acquisition announcement; Target CARs however, seem to exhibit a greater pre-announcement
run-up and higher overall announcement window CARs.
Figure V.B plots target CARs for the entire sample and the higher returns to target
shareholders is clearly evident.
Figure V.A. Plot of Average Acquirer CARs Stratified by Tender Offers This figure provides a plot of average acquirer CARs from (-40, +40) stratified by whether or not a tender
offer was made. These are high-tech acquisitions announced between 1991 and 2004 where deals were
listed in SDC and both target and bidder had trading and accounting data in Datastream in the (-3, 3) year
window surrounding the acquisition announcement.
-0.02
-0.01
0
0.01
0.02
0.03
0.04
0.05
-40-36-32-28-24-20-16-12 -8 -4 0 4 8 12 16 20 24 28 32 36 40
Ave
rage
Acq
uir
er
CA
Rs
Days since Acquisition Announcement
Average Acquirer CARs
No Tender Offer (A)
Tender Offer (A)
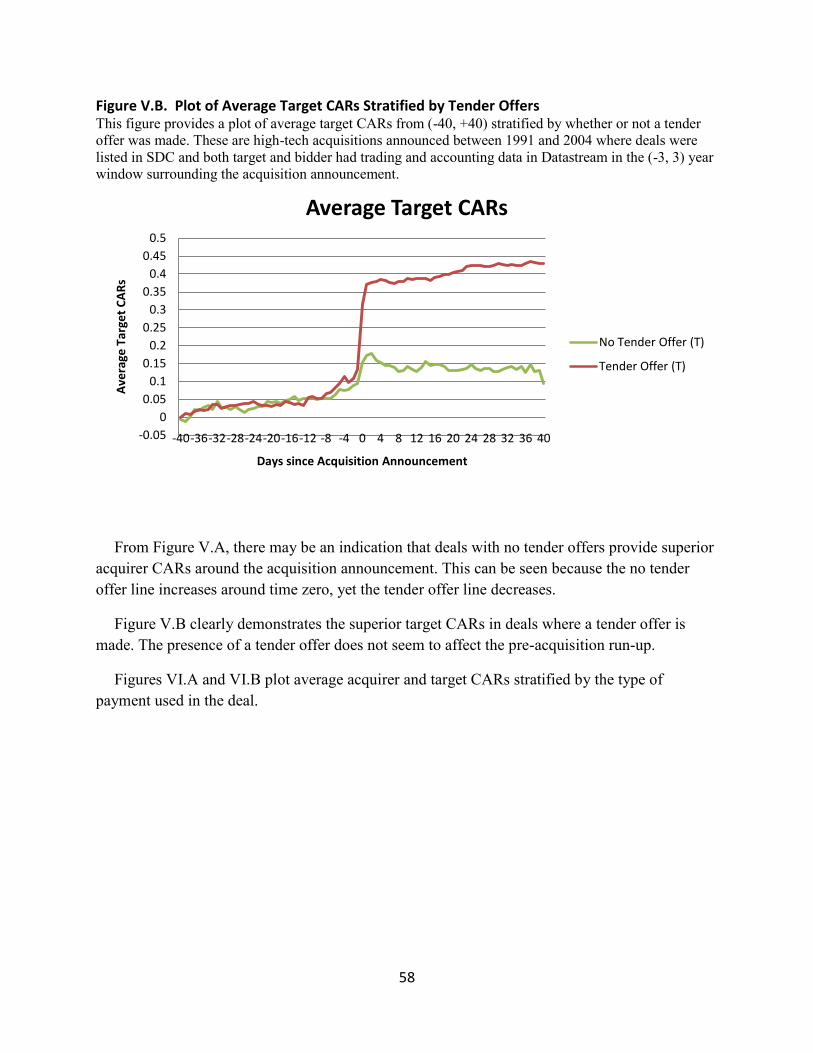
58
Figure V.B. Plot of Average Target CARs Stratified by Tender Offers This figure provides a plot of average target CARs from (-40, +40) stratified by whether or not a tender
offer was made. These are high-tech acquisitions announced between 1991 and 2004 where deals were
listed in SDC and both target and bidder had trading and accounting data in Datastream in the (-3, 3) year
window surrounding the acquisition announcement.
From Figure V.A, there may be an indication that deals with no tender offers provide superior
acquirer CARs around the acquisition announcement. This can be seen because the no tender
offer line increases around time zero, yet the tender offer line decreases.
Figure V.B clearly demonstrates the superior target CARs in deals where a tender offer is
made. The presence of a tender offer does not seem to affect the pre-acquisition run-up.
Figures VI.A and VI.B plot average acquirer and target CARs stratified by the type of
payment used in the deal.
-0.05
0
0.05
0.1
0.15
0.2
0.25
0.3
0.35
0.4
0.45
0.5
-40-36-32-28-24-20-16-12 -8 -4 0 4 8 12 16 20 24 28 32 36 40
Ave
rage
Tar
get
CA
Rs
Days since Acquisition Announcement
Average Target CARs
No Tender Offer (T)
Tender Offer (T)

59
Figure VI.A. Plot of Average Acquirer CARs Stratified by Payment Consideration This figure provides a plot of average acquirer CARs from (-40, +40) stratified by the type of
consideration announced. These are high-tech acquisitions announced between 1991 and 2004 where
deals were listed in SDC and both target and bidder had trading and accounting data in Datastream in the
(-3, 3) year window surrounding the acquisition announcement.
Figure VI.B. Plot of Average Target CARs Stratified by Payment Consideration This figure provides a plot of average target CARs from (-40, +40) stratified by the type of consideration
announced. These are high-tech acquisitions announced between 1991 and 2004 where deals were listed
in SDC and both target and bidder had trading and accounting data in Datastream in the (-3, 3) year
window surrounding the acquisition announcement.
-0.15
-0.1
-0.05
0
0.05
0.1
0.15
-40 -36 -32 -28 -24 -20 -16 -12 -8 -4 0 4 8 12 16 20 24 28 32 36 40
Ave
rage
Acq
uir
er
CA
Rs
Days since Acquisition Announcement
Average Acquirer CARs
Cash (A)
Combination (A)
No Data (A)
Stock (A)
-0.1
0
0.1
0.2
0.3
0.4
0.5
-40 -36 -32 -28 -24 -20 -16 -12 -8 -4 0 4 8 12 16 20 24 28 32 36 40
Ave
rage
Tar
get
CA
Rs
Days since Acquisition Announcement
Average Target CARs
Cash (T)
Combination (T)
No Data (T)
Stock (T)

60
From Figure VI.B it is evident that cash, combination, and stock deals perform about the same,
and that it is deals with no information that perform adversely. It may be the case that by
stratifying the sample into cash payments and non-cash payments, the deals with no information
play too important a role in determining the significance of cash payments in the regression
model. There are 25 cash deals, 14 combination deals, nine stock deals, and 13 deals that have no
information regarding payments.
Most of the extant literature anchors either the acquirer or target as US domiciled firms.
Figure VII.A and VII.B displays acquirer and target CARs as stratified by US acquirer status.
Figure VII.A. Plot of Average Acquirer CARs Stratified by US Acquirer Status This figure provides a plot of average acquirer CARs from (-40, +40) stratified by whether the acquirer in
the acquisition is based in the US. These are high-tech acquisitions announced between 1991 and 2004
where deals were listed in SDC and both target and bidder had trading and accounting data in Datastream
in the (-3, 3) year window surrounding the acquisition announcement.
-0.08
-0.06
-0.04
-0.02
0
0.02
0.04
0.06
0.08
-40
-36
-32
-28
-24
-20
-16
-12 -8 -4 0 4 8
12
16
20
24
28
32
36
40
Ave
rage
Acq
uir
er
CA
Rs
Days since Acquisition Announcement
Average Acquirer CARs
Non US Acquirer (A)
US Acquirer (A)

61
Figure VII.B. Plot of Average Target CARs Stratified by US Acquirer Status This figure provides a plot of average target CARs from (-40, +40) stratified by whether the acquirer in
the acquisition is based in the US. These are high-tech acquisitions announced between 1991 and 2004
where deals were listed in SDC and both target and bidder had trading and accounting data in Datastream
in the (-3, 3) year window surrounding the acquisition announcement.
US acquirer status seems to have an effect on acquirer CARs measured from 40 days prior to
the acquisition announcement, but the behaviour around the time zero (the acquisition
announcement) may not be significantly different. In the case target CARs, performance seems
to be similar whether the acquirer is domiciled in the US or not.
This study considers both the results of regressing bidder and target announcement period
CARs on various target, bidder, and deal characteristics. However, it is found that regressing
bidder CARs produced a model with only relatedness (based on having the same 4-digit SIC
code) being significant at the 10.00% level, and the entire model is insignificant based on its F-
statistic.
The results for target CARs are reported in Table XIV. It should be noted that the regression
was conducted with the 39 deal sample, and the figures in this section were created with the full
-0.05
0
0.05
0.1
0.15
0.2
0.25
0.3
0.35
0.4
-40-36-32-28-24-20-16-12 -8 -4 0 4 8 12 16 20 24 28 32 36 40
Ave
rage
Tar
get
CA
Rs
Days since Acquisition Announcement
Average Target CARs
Non US Acquirer (T)
US Acquirer (T)

62
61 point sample. The reason for the difference is because the regression requires both the
employee ratio and the TIA ratio. The data to create these values were only available for 39 deals.

63
Table XIV. Cross-Sectional Analysis of Valuation Effects for Targets This table provides multivariate regression specifications to explain the valuation effects from high-tech cross-
border acquisitions. The dependent variable is (-1, +1) cumulative abnormal returns. RELATED is a dummy
variable equal to 1 if the acquirer and target have the same 4-digit SIC industry code. MVRATIO is the ratio of
market values (41 days prior to the acquisition announcement) of the target to the acquirer. TENDER is a
dummy variable equal to 1 if the acquirer issues a tender offer. IARATIO is the target firm‟s ratio of intangible
assets to total assets as at the previous fiscal year end. EMPRATIO is the ratio of the number of employees of
the target to the acquirer and is taken from the previous fiscal year end. BUBBLE is a dummy variable set
equal to 1 if the acquisition announcement occurs after March 2000. CASH is a dummy variable set equal to 1
if the consideration for the acquisition is 100% cash. USACQ and USTAR are dummy variables set equal to 1
if the acquirer and target are domiciled in the US respectively. TERMPROV is a dummy variable set equal to 1
if there exists a termination provision in the acquisition announcement. These firms are all involved in high-
tech acquisitions announced between 1991 and 2004 where deals were listed in SDC and both target and bidder
had trading and accounting data in Datastream in the (-3, 3) year window surrounding the acquisition
announcement.
Variable Parameter Estimate Standard Error p-Value
RELATED -0.03231 0.03744 0.3955
MVRATIO -0.00564 0.01252 0.6558
TENDER 0.15755*** 0.04769 0.0026
IARATIO 0.08608 0.10593 0.4233
EMPRATIO -0.01926 0.03275 0.5611
BUBBLE 0.00091634 0.05167 0.9860
CASH -0.16148*** 0.04439 0.0011
USACQ 0.11181** 0.04876 0.0296
USTAR -0.03659 0.06036 0.5493
TERMPROV 0.12841** 0.05901 0.0383
Adjusted R2 44.60%
F 4.06***
N 39
*** Significant at the 1.00% level
** Significant at the 5.00% level
* Significant at the 10.00% level
Note: Here we have N = 39 which is less than our full sample of 61 because not all targets had intangible assets and employee data.
The model is significant at the 1.00% level and consistent with the two hypotheses this study
puts forth, that the coefficient for employee ratio is negative, and for TIA ratio it is positive.
However, these coefficients are insignificantly different from zero.
The coefficient for relatedness is negative and may seem to contradict findings by Hagedoorn
and Duysters (2002), Singh and Montgomery (1987), and Markides and Ittner (1994). But the

64
basis for relatedness is taken to be the four-digit SIC code, which is the closest match for
industry available. Cloodt, Hagedoorn, and Van Kranenburg (2006) find that for technological
firms, there is a curvilinear relationship between relatedness and performance. That is, it is
optimal to acquire related firms, but when the firms are too related nothing new or innovative is
being introduced and there is too much overlap, thus performance suffers. By defining
relatedness based on the four-digit SIC code, this study may have defined relatedness to be on
the down slope of the curvilinear relationship, resulting in a negative coefficient in the bidder
regression model.
As predicted by the hypothesis, the coefficient for the employee ratio variable is negative,
while the coefficient for the TIA ratio is positive. However, both of these coefficients are
insignificantly different from zero.
Benou, Gleason, and Madura (2007) found that the control variable BUBBLE is significant in
three out of the four models they were testing. They found the internet bubble is negatively
correlated with bidder CARs, however in this case the coefficient was positive, but
insignificantly different from zero.
Significant variables appear to be the presence of tender offers, cash payments, whether the
deal involves a US acquirer, and the presence of a termination provision.
Ran and Vermaelen (1998) found that bidders with tender offers will on average over perform
in the long term, and this study finds that the presence of tender offers is related to higher
announcement period returns for target shareholders and is significant at the 1.00% level.
Travlos (1987) and Loughran and Vijh (1997) find that cash payments lead to higher returns
to bidding shareholders. The results from the regression indicate that for targets, cash payments

65
result in higher returns to target shareholders. This may not actually be the case however, as an
inspection of Figure VI.B may indicate.
The presence of a termination provision has been found to be an important factor in target
shareholder returns in a study by Bates and Lemmon (2003). This study finds further evidence of
this as the coefficient of the termination provision in the regression model is positive and
significant at the 5.00% level.
US acquirer status may seem like an important factor for acquirer CARs, but the regression
model uses CARs from one day prior to the acquisition announcement to one day afterwards. In
this window the movement is not substantially different.
For targets however, the regression model indicates that US acquirer status is significant at the
5.00% level and positively affect abnormal returns to target shareholders. This is not reflected in
Figure VII.B and may be a result of the different samples, as the regression is built on the
subsample of 39 firms whereas the graphs are built on the full 61 firm sample.
H. Long-Term Industry-Adjusted Cash Flow Returns
This study also considers the long-term operational performance of the acquiring firm. Pro
forma industry-adjusted cash flow returns are calculated for each deal, and consistent with Healy,
Palepu, and Ruback (1992), these abnormal returns are significantly positive.
Table XV presents the results from calculating the industry-adjusted abnormal cash flow
returns. This sample contains only 26 deals of the original 61 because market value data for the
industry adjustment was only available for deals completed between 2001 and 2004. Also, only
completed deals fall under consideration for this part of the analysis.

66
Table XV. Median Operating Cash Flow Return on Actual Market Value of Assets This table provides median operating cash flow returns on actual market value of assets for 26 combined target
and acquirer firms in the years surrounding mergers announced between 2001 and 2004. Panel A describes pre-
and post-merger operation cash flow returns, whereas Panel B presents abnormal industry-adjusted post-merger
operating cash flow returns. Operating cash flow return on assets is sales minus cost of goods sold, minus
selling and administrative expense, plus depreciation, divided by the market value of assets. Industry adjusted
cash flow returns are computed for each firm and year as the difference between the sample firm value in that
year and the average values for other firms in the same industry, as defined by the sample firm‟s three-digit
SIC classification. Premerger returns for the combined firm are weighted averages of target and acquirer
returns, where the weights are the relative asset values of the two firms each year. These firms are all involved
in high-tech acquisitions announced between 2001 and 2004 where deals were listed in SDC and both target
and bidder had trading and accounting data in Datastream in the (-3, 3) year window surrounding the
announcement. In this analysis, industry information is only available for deals announced between 2001 and
2004. Also, only deals that are completed are considered, which leaves 26 deals for this analysis.
Panel A. Pre- and Post-merger Operating Cash Flow Returns
Year Relative to Merger Firm Median Industry Adjusted – Median
Industry Adjusted – % Positive
-3 10.5% 17.3% 92.3%
-2 14.1% 25.2% 88.5%
-1 9.4% 26.3% 88.5%
1 15.7% 16.2% 96.2%
2 15.4% 19.3% 100%
3 14.4% 17.5% 96.2%
Panel B. Abnormal Industry-Adjusted Post-merger Operating Cash Flow Returns
𝑪𝑭𝒓𝒑𝒐𝒔𝒕,𝒊 = 𝟖.𝟑% + 𝟎.𝟓𝟐∗∗∗𝑪𝑭𝒓𝒑𝒓𝒆,𝒊 𝑅2 = 47.6% F-statistic = 21.8∗∗∗ 𝑁 = 26
𝑪𝑭𝒓𝒑𝒐𝒔𝒕,𝒊 is the median industry-adjusted cash flow return for firm i in the three years prior to the merger. 𝑪𝑭𝒓𝒑𝒓𝒆,𝒊 is the median industry-adjusted cash
flow return for firm i in the three years after the merger.
*** Significant at the 1.00% level
** Significant at the 5.00% level
* Significant at the 10.00% level
Panel A of Table XV demonstrates that for this particular sample, conducting a merger has a
strong effect on long term cash flow returns. At first glance, the median cash flow returns seem
to verify the hypothesis that merged firms exhibit superior operating performance since returns
increase in the post-merger period. Also, industry adjusted returns in the post-merger period are
significantly different from zero, which is consistent with the hypothesis. However, looking at
the industry adjusted medians, the returns clearly decrease in the post-merger period. This is

67
counter-intuitive to hypothesis H3a, but it could be the case that firms that engage in acquisitions
are performing exceptionally well relative to their industry, but over time the firms are unable to
maintain their competitive advantage relative to their industry, thus having a smaller industry
adjustment in the post-merger years.
Panel B of Table XV describes the appropriateness of the first long-term cash flow returns
model under consideration. The intercept of the model, 8.3% is not significantly different from
zero, but the correlation coefficient between premerger and post-merger cash flow returns is
positive and significantly different from zero, with a coefficient of 0.52. It is difficult to interpret
the magnitude of this coefficient, but it being positive and significant is consistent with
hypothesis H3b, that there is a positive relationship between post-merger and pre-merger
operating cash flow returns. The model describes 47.6% of the variation and the model is
internally consistent with an F-statistic of 21.8.
Panel A of Table XVI considers the second regression model, which includes the combined
unexpected asset returns during the announcement window from five days prior to the
acquisitions to five days after.
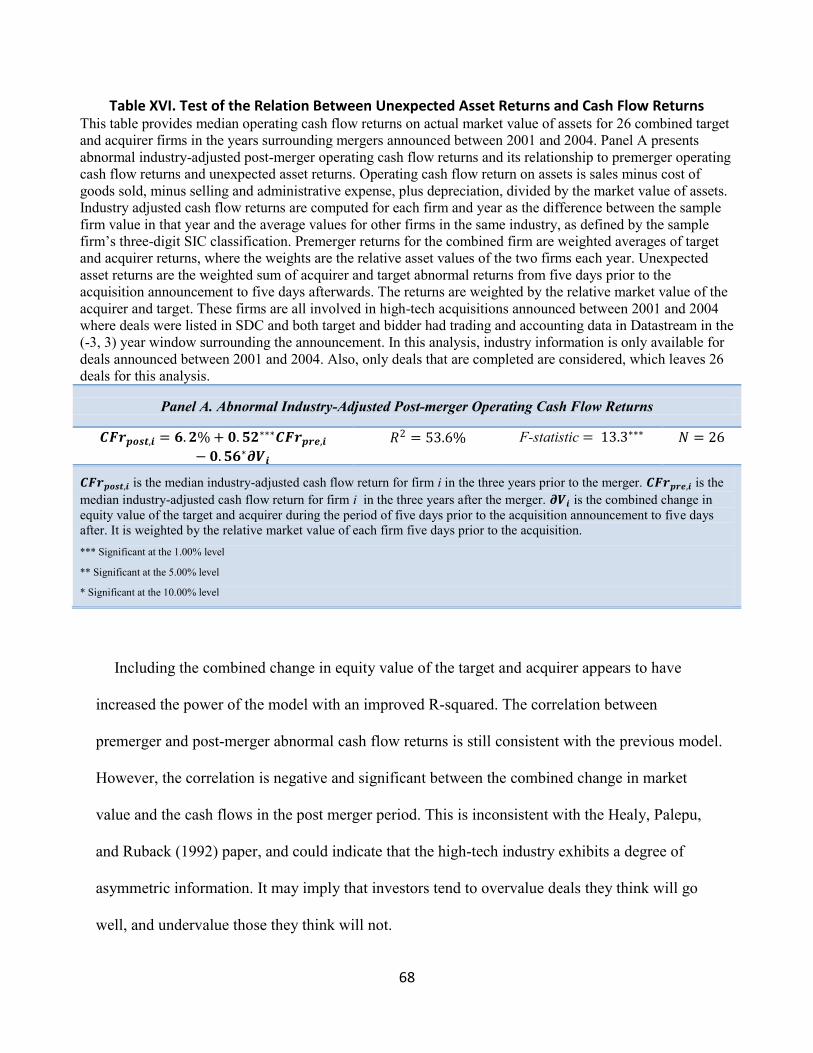
68
Table XVI. Test of the Relation Between Unexpected Asset Returns and Cash Flow Returns This table provides median operating cash flow returns on actual market value of assets for 26 combined target
and acquirer firms in the years surrounding mergers announced between 2001 and 2004. Panel A presents
abnormal industry-adjusted post-merger operating cash flow returns and its relationship to premerger operating
cash flow returns and unexpected asset returns. Operating cash flow return on assets is sales minus cost of
goods sold, minus selling and administrative expense, plus depreciation, divided by the market value of assets.
Industry adjusted cash flow returns are computed for each firm and year as the difference between the sample
firm value in that year and the average values for other firms in the same industry, as defined by the sample
firm‟s three-digit SIC classification. Premerger returns for the combined firm are weighted averages of target
and acquirer returns, where the weights are the relative asset values of the two firms each year. Unexpected
asset returns are the weighted sum of acquirer and target abnormal returns from five days prior to the
acquisition announcement to five days afterwards. The returns are weighted by the relative market value of the
acquirer and target. These firms are all involved in high-tech acquisitions announced between 2001 and 2004
where deals were listed in SDC and both target and bidder had trading and accounting data in Datastream in the
(-3, 3) year window surrounding the announcement. In this analysis, industry information is only available for
deals announced between 2001 and 2004. Also, only deals that are completed are considered, which leaves 26
deals for this analysis.
Panel A. Abnormal Industry-Adjusted Post-merger Operating Cash Flow Returns
𝑪𝑭𝒓𝒑𝒐𝒔𝒕,𝒊 = 𝟔.𝟐% + 𝟎.𝟓𝟐∗∗∗𝑪𝑭𝒓𝒑𝒓𝒆,𝒊
− 𝟎.𝟓𝟔∗𝝏𝑽𝒊
𝑅2 = 53.6% F-statistic = 13.3∗∗∗ 𝑁 = 26
𝑪𝑭𝒓𝒑𝒐𝒔𝒕,𝒊 is the median industry-adjusted cash flow return for firm i in the three years prior to the merger. 𝑪𝑭𝒓𝒑𝒓𝒆,𝒊 is the
median industry-adjusted cash flow return for firm i in the three years after the merger. 𝝏𝑽𝒊 is the combined change in
equity value of the target and acquirer during the period of five days prior to the acquisition announcement to five days
after. It is weighted by the relative market value of each firm five days prior to the acquisition.
*** Significant at the 1.00% level
** Significant at the 5.00% level
* Significant at the 10.00% level
Including the combined change in equity value of the target and acquirer appears to have
increased the power of the model with an improved R-squared. The correlation between
premerger and post-merger abnormal cash flow returns is still consistent with the previous model.
However, the correlation is negative and significant between the combined change in market
value and the cash flows in the post merger period. This is inconsistent with the Healy, Palepu,
and Ruback (1992) paper, and could indicate that the high-tech industry exhibits a degree of
asymmetric information. It may imply that investors tend to overvalue deals they think will go
well, and undervalue those they think will not.

69
VI. Conclusions
High-tech cross-border acquisitions are unique in that much of the value of targets resides in the
difficult to value intangible assets of the firm. Not only is it difficult to value these assets, but
also it is difficult to transfer this knowledge from the target to the acquirer.
This study attempts to identify key factors that may give the market clues as to whether or not
the intangible assets of the target can be integrated efficiently into the acquirer.
The Employee Ratio Hypothesis speculates that while technological knowledge is highly
codified, much of the valuable knowledge still resides in the tacit knowledge of the human
capital. It would then be advantageous to retain a large portion of the target human capital. A
simplifying assumption is made that larger relative workforces will be more difficult to extract
the important knowledge from, and the hypothesis expects an inverse relationship between the
ratio of target employees to acquirer employees and the announcement period returns to
shareholders.
For acquirers, the results demonstrate only weak evidence that the third quartile of employee
ratios had substandard performance relative to the rest of the sample. This may indicate that
while it is easier to retain the entire workforce of smaller firms, the large firms of the fourth
quartile may only require a fraction of the workforce to be retained. For targets there does not
seem to be any indication that relative workforce size plays a role in abnormal returns to
shareholders.
The Target Intangible Assets to Total Asset Ratio Hypothesis speculates that since much of
the value of technology companies lies in their intangible assets, such as patents and human
70
capital, that companies with higher ratios of intangible assets to total assets represented more
value to acquiring firms.
For both targets and acquirers there is no evidence to support this claim. When considering
acquirer CARs between (-1, +1) the third quartile of TIA ratios yield negative CARs that differ
significantly from the remaining sample at the 10.00% level. All other CARs in the periods
under consideration do not yield means that differ significantly across quartiles, and for acquirers,
none of the CARs differ significantly from zero.
The difficulties expected in high-tech cross-border acquisitions related to knowledge transfer
and the integration of intangible assets do not seem to have materialised. This may be due to the
highly codified nature of technological knowledge – that the common culture revolves around
the language of highly codified technical knowledge. It may also be due to the nature of the
sample. The majority of deal participants were from English speaking nations, and a common
language eliminates a major hurdle in integrating a target‟s workforce and knowledge base.
When considering performance over longer time horizons, high-tech cross-border deals
exhibit industry-adjusted cash flow returns are positive and very significant when compared to
industry averages. Post-merger performance is positively and significantly related to pre-merger
performance, which is consistent with the hypothesis that there exists a positive relationship
between pre- and post-merger performance. Furthermore, there exists evidence that there is a
negative relationship between announcement window returns and operating performance,
perhaps indicating that deals investors view favourably are actually overvalued, and those deals
that investors discount are undervalued.

71
The area of high-tech cross-border acquisitions still has much to be explored, particularly in
how different national cultures can affect efficient communication of ideas, and thus the transfer
of valuable intangible assets. ■

72
References
Aw , M. S. B., R. A. Chatterjee (2004). „The performance of UK firms acquiring large cross-
border and domestic takeover targets‟, Applied Financial Economics, 14, pp. 337–349.
Barber, B. M., J. D. Lyon (1996). „Detecting abnormal operating performance: The empirical
power and specification of test statistics‟, Journal of Financial Economics, 41, pp. 359-399.
Barber, B. M., J. D. Lyon (1997). „Detecting long-run abnormal stock returns: The empirical
power and specification of test statistics‟, Journal of Financial Economics, 43, pp. 341-372.
Bates T.W., M.L. Lemmon (2003). „Breaking up is hard to do? An analysis of termination fee
provisions and merger outcomes‟, Journal of Financial Economics, 69, pp. 469-504.
Betton, S., B. E. Eckbo, K. S. Thorburn (2008). „Corporate Takeovers‟, Handbook of Corporate Finance: Empirical Corporate Finance, 2(15), pp. 291-430.
Benou, G., K. C. Gleason and J. Madura (2007). „Impact of Visibility and Investment Advisor
Credibility on the Valuation Effects of High-Tech Cross-Border Acquisitions‟, Financial Management, 36(1), pp. 69-89.
Cakici, N., Hessel, C. and Tandon, K. (1996), “Foreign acquisitions in the United States: effect
on shareholder wealth of foreign acquiring firms”, Journal of Banking & Finance, Vol. 20 No. 2,
pp. 307-29.
Chatterjee, S., M. Lubatkin, D. M. Schweiger and Y. Weber (1992). „Cultural Differences and
Shareholder Value in Related Mergers: Linking Equity and Human Capital‟, Strategic Management Journal, 13, pp. 319–334.
Chauduri, S. and B. Tabrizi (1999), „Capturing the Real Value in High-Tech Acquisitions‟,
Harvard Business Review 77, pp. 123-130.
Cloodt, M., J. Hagedoorn, H. Van Kranenburg (2006). „Mergers and acquisitions: Their effect on
the innovative performance of companies in high-tech industries‟, Research Policy, 35, pp. 642-
654.
Corhay, A., A.T. Rad (2000). „International acquisitions and shareholder wealth: Evidence from
the Netherlands‟, International Review of Financial Analysis, 9(2), pp. 163-174.
Doukas, J., N. G. Travlos (1988). „The effects of corporate multinationalism on shareholders‟
wealth: Evidence from international acquisitions‟, The Journal of Finance, 43(5), pp. 1161-1175.
Eun, C.S., R. Kolodny, C. Scheraga (1996), „Cross-border acquisitions and shareholder wealth:
Tests of the synergy and internalization hypotheses‟, Journal of Banking & Finance, 20, pp.
1559-1582.

73
Hagedoorn, J., G. Duysters (2002), „The effect of mergers and acquisitions on the technological
performance of companies in a high-tech environment‟, Technology Analysis & Strategic Management, 14(1), pp. 67-85.
Healy, P.M., K.G. Palepu, and R.S. Ruback (1992), „Does Corporate Performance Improve After
Mergers‟, Journal of Financial Economics, 31(1992), pp. 135-175.
Jindra, J. and R.A. Walkling (2004). „Speculation spreads and the market pricing of proposed
acquisitions‟, Journal of Corporate Finance, 10(4), pp. 495-526.
Kohers, N. and T. Kohers (2000). „The Value Creation Potential of High-Tech Mergers‟,
Financial Analysts Journal, 56(3), pp. 40-50.
Lev, B. (2001). „Intangibles: Management, Measurement, and Reporting‟, Brookings Institution Press, Washington D.C., USA.
Loughran, T., A.M. Vijh (1997). „Do Long-Term Shareholders Benefit From Corporate
Acquisitions?‟, The Journal of Finance, 52(5), pp. 1765-1790.
Markides, C.C., C.D. Ittner (1994). „Shareholder Benefits from Corporate International
Diversification: Evidence from U.S. International Acquisitions‟, Journal of International Business Studies, 25(2), pp. 343-366.
Mathur, I., N. Rangan, I. Chhachhi, and S. Sundaram (1992). „The market effects of acquisition-
related foreign direct investment‟, North American Journal of Economics & Finance, 3(1), pp.
39-48.
Mitchell, M. L., E. Stafford (2000). „Managerial decisions and long-term stock price
performance‟, Journal of Business, 73(3), pp. 287-329.
Moeller, S.B., F.P. Schlingemann, R.M. Stulz (2004). „Firm size and gains from acquisitions‟,
Journal of Financial Economics, 73(2), pp. 201-228.
Prentice, P., M. Fox (2002). „Technology Firms: The Impact of Mergers and Acquisitions‟,
International Company and Commercial Law Review, 9, pp. 321-330.
Puranam, P. (2001). „The Management and Performance of Technology Grafting Acquisitions‟,
The Wharton School Working Paper.
Ranft, A.L., M.D. Lord (2000). „Acquiring new knowledge: The role of retaining human capital
in acquisitions of high-tech firms‟, The Journal of High Technology Management Research,
11(2), pp. 295-319.
Rau, P.R., T. Vermaelen (1998). „Glamour, value and the post-acquisition performance of
acquiring firms‟, Journal of Financial Economics, 49(2), pp. 223–253.
74
Schwert, G.W. (1996). „Markup pricing in mergers and acquisitions‟, Journal of Financial Economics, 41, pp. 153–192.
Sié, L. and A. Yakhlef (2004). „Knowledge transfer, acculturation, and financial success within
the context of M&As‟, Cahier de Recherche, 3, pp. 5–14.
Singh, H. and C.A. Montgomery (1987). „Corporate acquisition strategies and economic
performance‟, Strategic Management Journal, 8(4), pp. 377-386.
Travlos, N. G. (1987). „Corporate Takeover Bids, Methods of Payment, and Bidding Firms'
Stock Returns‟, The Journal of Finance, 42(4), pp. 943-963.


![INTANGIBLE VALUE –FACT OR FICTION - AI Home | … · [IAS 38.8] 3. INTANGIBLE VALUE –FACT OR FICTION ... 2.36 INTANGIBLE PROPERTY (INTANGIBLE ASSETS): Non-physical assets, …](https://static.fdocuments.us/doc/165x107/5af0812f7f8b9ac2468e1bc2/intangible-value-fact-or-fiction-ai-home-ias-388-3-intangible-value.jpg)