The impact of tax incentives to stimulate investment in South Africa ...
29
_ 1 The impact of tax incentives to stimulate investment in South Africa ESTIAN CALITZ, SALLY WALLACE AND LE ROUX BURROWS Stellenbosch Economic Working Papers: 19/13 KEYWORDS: SOUTH AFRICAN TAX INCENTIVES, INVESTMENT INCENTIVES, TAX POLICY, TAX INCENTIVES, TAX EXPENDITURE JEL: H2, H25, H3 ESTIAN CALITZ DEPARTMENT OF ECONOMICS UNIVERSITY OF STELLENBOSCH PRIVATE BAG X1, 7602 MATIELAND, SOUTH AFRICA E-MAIL: [email protected] SALLY WALLACE DEPARTMENT OF ECONOMICS ANDREW YOUNG SCHOOL OF POLICY STUDIES GEORGIA STATE UNIVERSITY UNITED STATES OF AMERICA E-MAIL: [email protected] LE ROUX BURROWS DEPARTMENT OF ECONOMICS UNIVERSITY OF STELLENBOSCH PRIVATE BAG X1, 7602 MATIELAND, SOUTH AFRICA E-MAIL: [email protected] A WORKING PAPER OF THE DEPARTMENT OF ECONOMICS AND THE BUREAU FOR ECONOMIC RESEARCH AT THE UNIVERSITY OF STELLENBOSCH
-
Upload
truongtuyen -
Category
Documents
-
view
216 -
download
0
Transcript of The impact of tax incentives to stimulate investment in South Africa ...
_ 1
The impact of tax incentives to stimulate investment in South Africa
ESTIAN CALITZ, SALLY WALLACE AND LE ROUX BURROWS
Stellenbosch Economic Working Papers: 19/13
KEYWORDS: SOUTH AFRICAN TAX INCENTIVES, INVESTMENT INCENTIVES, TAX POLICY, TAX INCENTIVES, TAX EXPENDITURE
JEL: H2, H25, H3
ESTIAN CALITZ DEPARTMENT OF ECONOMICS
UNIVERSITY OF STELLENBOSCH PRIVATE BAG X1, 7602
MATIELAND, SOUTH AFRICA E-MAIL: [email protected]
SALLY WALLACE DEPARTMENT OF ECONOMICS ANDREW YOUNG SCHOOL OF
POLICY STUDIES GEORGIA STATE UNIVERSITY UNITED STATES OF AMERICA E-MAIL: [email protected]
LE ROUX BURROWS DEPARTMENT OF ECONOMICS
UNIVERSITY OF STELLENBOSCH PRIVATE BAG X1, 7602
MATIELAND, SOUTH AFRICA E-MAIL: [email protected]
A WORKING PAPER OF THE DEPARTMENT OF ECONOMICS AND THE
BUREAU FOR ECONOMIC RESEARCH AT THE UNIVERSITY OF STELLENBOSCH

The impact of tax incentives to stimulate investment in South Africa
ESTIAN CALITZ, SALLY WALLACE AND LE ROUX BURROWS
ABSTRACT
The purpose of this paper is, very generally, to provide a framework and potential methodology of analysis of tax incentives in one country — South Africa. As incentives are often specific and targeted, the precise methods needed to analyse the effectiveness of incentives may well differ among types of incentives. However, by positing a framework for evaluation based on basic economic principles, we believe that transparency, accountability and rigorous evaluation of individual incentives or regarding the choice of incentives may be enhanced. A classification of different tax incentives is provided, with reference to their acceptability in the economic literature and with an indication of their occurrence in South Africa. The cost of tax incentives to manufacturing in South Africa is estimated by sector of economic activity, indicating a sizeable drain on the national budget, and a multiplier analysis of current tax incentives is undertaken. Keywords: South African tax incentives, Investment incentives, tax policy, tax
incentives, tax expenditure JEL codes: H2, H25, H3
3
THEIMPACTOFTAXINCENTIVESTOSTIMULATEINVESTMENTINSOUTHAFRICA
Estian Calitz, Sally Wallace and Le Roux Burrows1
Few if any contemporary public economists of note laud the virtue of tax incentives. On the
contrary, the general line is to warn against them. Bird (2008: 9) states as follows: “Despite
their continuing popularity almost everywhere, tax incentives are usually redundant and
ineffective: they reduce and complicate the fiscal system without achieving their stated
objectives. Even to the limited extent that some incentives are effective in inducing investors
to behave differently than they would have done in response to market signals, the result is
often inefficient, diverting scarce resources into less than optimal uses.” Zee, Stotsky and Ley
(2002: 1497) observe that the use of tax incentives is widespread even though the available
empirical evidence on the cost‐effectiveness of such incentives in stimulating investment is
highly inconclusive. An FIAS (2001) report on incentives in Indonesia finds little evidence of
success in luring investment via incentives—at least without very high costs.
There is evidence to the contrary as well. Incentives aimed explicitly at increasing foreign
direct investment are used throughout the world. And there is some evidence of their
impact. De Mooij and Ederveen (2003) find that the elasticity of foreign direct capital stock
with respect to changes in the cost of capital is greater than one in developed countries.
Klemm and Van Parys (2009) make a distinction between tax rate differentials and other
incentives and find that the latter have some impact on investment but they do not conclude
that they have a discernable impact on economic growth.
No matter the evidence, tax incentives continue to drive much of the tax policy in developing
and developed countries and there are myriad examples. Competitive tax incentives
between countries in a region are often the order of the day (Keen & Mansour, 2009). For
example: tax incentives are a central part of Rwanda’s economic development plan (UNCTAD
2006; FIAS 2006a); in April 2011 Uganda’s tax exemptions led the IMF to call for their
elimination to broaden tax bases (IMF, 2011); and South Africa has a substantial number of
incentives that reach manufacturing, tourism, and mining among other industries (FIAS,
2006b; IMF, 2008; Deloitte, 2009). Even within countries, such as the U.S., states
(subnational governments) find themselves “at war” with one another over the attraction of
businesses through incentives (for a practical example, see Wisconsin Legislative Reference
Bureau, 2006).
While the impact of tax incentives on economic growth has been the focus of a large amount
of theoretical and empirical research in developed nations, the question of their impact
remains elusive. In developing nations, the empirical evidence of the impact of tax incentives
is growing but the answers are at least as, if not more, elusive. The dearth of evidence is
1University of Stellenbosch, South Africa, Georgia State University, USA, and University of Stellenbosch, South Africa, respectively. The authors thank Niek Schoeman for suggesting the input‐output analysis route and Basil Maseko for inputs and perspectives regarding the nature and magnitude of different tax incentives in South Africa. The normal disclaimer applies.

4
particularly troublesome when these countries experiment with a wide variety of incentives.
What are the goals of these incentives? Are these incentives effective? Are there
distributional implications of incentives that may be counterproductive or enhance first
round impacts? What is the cost‐benefit associated with their use? How can we evaluate
them?
The purpose of this paper is, very generally, to provide a framework and potential
methodology of analysis of tax incentives in one country — South Africa. As incentives are
often specific and targeted, the precise methods needed to analyze the effectiveness of
incentives may well differ among types of incentives. However, by positing a framework for
evaluation based on basic economic principles, we believe that transparency, accountability
and rigorous evaluation of individual incentives or regarding the choice of incentives may be
enhanced.
We choose the case of South Africa as one where tax incentives have been widely used and
for which data are more readily available than in many other sub‐Saharan African countries.
Our focus is on developing a reasonable way to identify and classify incentives so as to
reduce the apples‐to‐oranges comparison syndrome (which may provide cover for a lack of
analysis), positing a hierarchy of incentives based on their likely efficiency enhancing (or
efficiency diminishing) properties, and providing a means to evaluate the potential
macroeconomic effectiveness of these policies up front, which also provides a means to
evaluate the policies ex post. The importance of establishing evidence for policies such as tax
incentives cannot be overstated – too often policies march forward with little consideration
of the cost‐benefit and opportunity cost of specific policy interventions. Using known tools
including Input‐Output (Supply‐Use) tables and analysis, Social Accounting Matrices, and
resulting multipliers and relying on previous research, we provide a framework to compare
alternative incentives ex ante. These tools are also used in computable general equilibrium
models, but we suggest that full blown CGE models may not be the most transparent tool to
evaluate the subtleties of targeted tax incentives, which many countries use. CGE models are
becoming increasingly detailed and disaggregated, but often do not incorporate the sector
specificity found in I‐O models.
Section 1 raises definitional issues and summarizes economic effects of a variety of tax
incentives. Section 2 provides a brief overview of the literature. In Section 3 a classification is
presented of tax incentives as instruments to promote direct fixed investment, with
reference to differences of acceptability and incidence in South Africa. In Section 4 we
estimate the effect of tax incentives, and section 5 considers alternatives to tax incentives.
Section 6 concludes.
1. Economics of Tax Incentives
Tax incentives come in many forms. Incentives may relieve tax liabilities completely (tax
holidays), partially, provide preferred rates, deductions, exemptions and may fall on one tax
5
or many. Incentives are given by central governments as well as subnational governments.
Incentives may be very localized with the expectation of generating investment in one region
of a country or may be developed with the expectation of increasing investment (foreign and
domestic) at large. In section 3 below, we present a means of categorizing incentives.
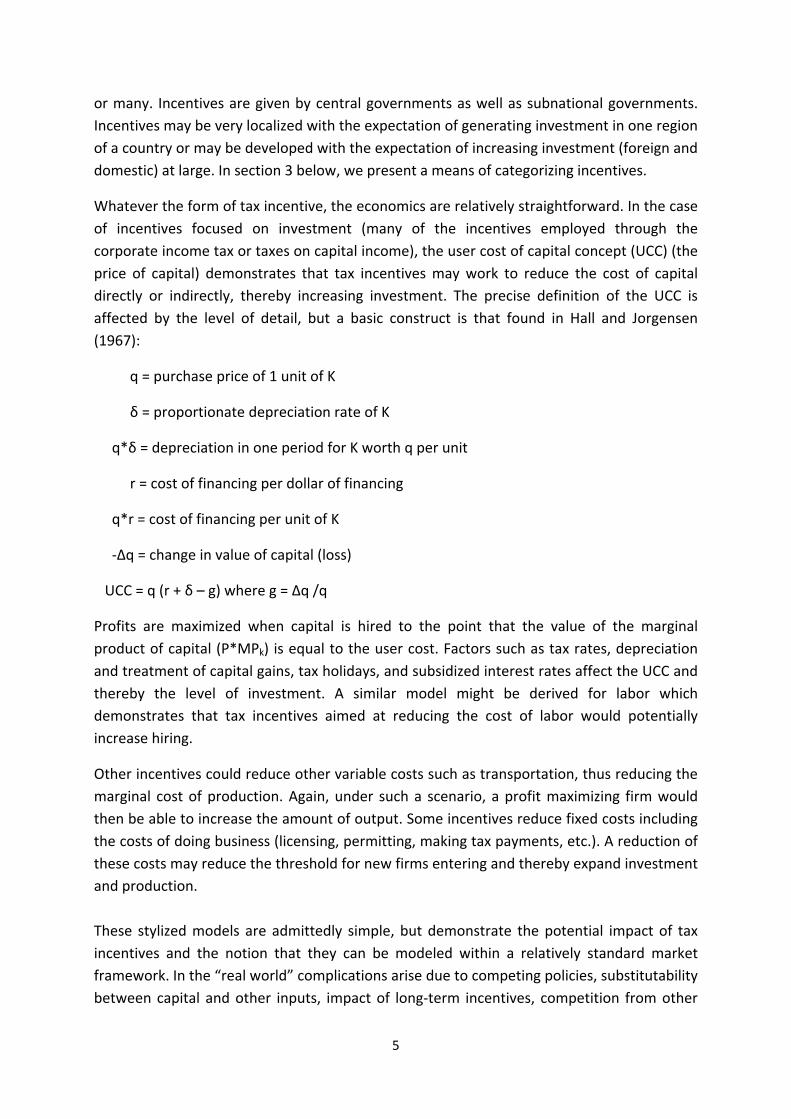
Whatever the form of tax incentive, the economics are relatively straightforward. In the case
of incentives focused on investment (many of the incentives employed through the
corporate income tax or taxes on capital income), the user cost of capital concept (UCC) (the
price of capital) demonstrates that tax incentives may work to reduce the cost of capital
directly or indirectly, thereby increasing investment. The precise definition of the UCC is
affected by the level of detail, but a basic construct is that found in Hall and Jorgensen
(1967):
q = purchase price of 1 unit of K
δ = proportionate depreciation rate of K
q*δ = depreciation in one period for K worth q per unit
r = cost of financing per dollar of financing
q*r = cost of financing per unit of K
‐Δq = change in value of capital (loss)
UCC = q (r + δ – g) where g = Δq /q
Profits are maximized when capital is hired to the point that the value of the marginal
product of capital (P*MPk) is equal to the user cost. Factors such as tax rates, depreciation
and treatment of capital gains, tax holidays, and subsidized interest rates affect the UCC and
thereby the level of investment. A similar model might be derived for labor which
demonstrates that tax incentives aimed at reducing the cost of labor would potentially
increase hiring.
Other incentives could reduce other variable costs such as transportation, thus reducing the
marginal cost of production. Again, under such a scenario, a profit maximizing firm would
then be able to increase the amount of output. Some incentives reduce fixed costs including
the costs of doing business (licensing, permitting, making tax payments, etc.). A reduction of
these costs may reduce the threshold for new firms entering and thereby expand investment
and production.
These stylized models are admittedly simple, but demonstrate the potential impact of tax
incentives and the notion that they can be modeled within a relatively standard market
framework. In the “real world” complications arise due to competing policies, substitutability
between capital and other inputs, impact of long‐term incentives, competition from other

6
countries, etc. Besides, the economic incidence differs from the statutory incidence. These
complications can mitigate or exacerbate the impact of incentives in any one country.
We submit that, if the incentive is substantial, a computable general equilibrium (CGE)
approach may be used to analyze the potential impact. There is no golden rule regarding
when a CGE model is an appropriate tool of analysis, but many tax incentives are small
relative to the size of the economy and in many cases, CGE models will not include detailed
sectors and or administrative detail to deal with specific incentives. This is not true in the
case of broad incentives including a reduction in the corporate income tax.
Many countries target tax incentives to a specific industry as a means to develop new
industries or revive older industries. As a result, in the short run, the UCC in one industry
may be heavily subsidized by tax increases in other industries (or on other factors), creating
a competitive advantage in the short run. Depending on the mobility of factors of
production, we would expect that the net rates of return to all factors would eventually
equilibrate or tend to converge. As a result, the competitive advantage of the original
incentive may be mitigated (or enhanced) depending on the structure of the economy,
factor mobility and substitution and the like, a la Harberger’s general equilibrium corporate
tax incidence analysis.
2. Views on tax incentives
We distinguish between general and selective investment tax incentives. General tax
incentives refer to incentives applying across the board, and with no exception, to all tax
payers, such as a reduction in the corporate tax rate or universal depreciation allowances.
Selective investment tax incentives is defined as a selective deviation from the benchmark
tax, i.e. the standard tax provision as legislated and which is suspended or changed to
benefit a select group of taxpayers. Along with Zee, Stotsky and Ley (2002: 1498) we
distinguish, with reference to investment, between a statutory and an economic tax
incentive. The former is defined as “a special tax provision granted to qualified investment
projects (however determined) that represents a statutorily favorable deviation from a
corresponding provision applicable to investment projects in general (i.e. projects that
receive no special tax provision).” The latter is defined as “a special tax provision granted to
qualified investment projects that has the effect of lowering the effective tax burden –
measured in some way – on those projects, relative to the effective tax burden that would
be borne by the investors in the absence of the special tax provision.” Together, general and
special tax incentives represent total tax expenditure, although a reduction in corporate tax
rates would not be regarded as a tax expenditure.2 Our focus is on incentives focused on
encouraging investment in the home country. The real impact depends on the economic and
not the statutory incidence of the benefit.
2 For an outline of definitional issues, see OECD (2010).
7
Tax incentives which are directed at business activities are aimed at real investment in
productive activities rather than investment in financial assets and often directed to foreign
investors. They are supposed to supplement insufficient domestic capital for the desired
level of economic development in specific sectors or across the board. The accompanying
modern technology and management techniques are viewed as an important side‐benefit,
and in some instances technology transfer is a key objective of incentives (United Nations,
2000) – the positive externality argument. Developing and transition countries have
introduced investment incentives for varying reasons. In some cases, especially in transition
countries that have not reformed the socialist tax system, incentives were seen as
counterweight to investment disincentives inherent in the general tax system. In other
countries, they have been introduced to offset other disadvantages investors may face, e.g.
lack of infrastructure, complicated and antiquated laws, bureaucratic complexities and weak
administration in the area of tax or elsewhere. Sometimes they were introduced to keep up
with other countries in competing for international investment, a kind of ‘race to the
bottom’ in effective corporate tax rates. Although tax incentives might be justified as
temporary measures until more deep‐seated deficiencies have been removed, there are
countries where such incentives were actually introduced or maintained even after
deficiencies in law and administration had been remedied (Holland & Vann, 1998: 987).
Why are many economists and fiscal authorities at best lukewarm about tax incentives?
These incentives distort preferences and allocative efficiency. They are criticised because
they imply that government officials are better able than private investors to decide the best
types and means of production, which would be necessary if economic performance is to be
improved. This amounts to a criticism of any ‘picking‐winners’ industrial strategy. The
criticism is also based on empirical evidence that the investment decision is determined by
more than tax‐related considerations, that is, nontax‐related economic considerations,
noneconomic considerations and social policy considerations. A first best approach would be
to address impediments at source and not through tax incentives.3 Further, tax incentives
create tax‐driven businesses, which are not eventually economically sustainable. In fact, a
vested interest is created in their perpetuation, which makes them very difficult to abolish.
From a fiscal point of view, the real cost is hidden and the tax base is eroded. The growing
call for tax expenditures budgets may be a reflection of the institutionalized nature of tax
incentives and other changes in tax systems over the years.
Often the non‐transparent character of incentives facilitates tax evasion, complicates tax
administration and encourages rent‐seeking behaviour and corruption. Most incentives do
not reach entities unless profit is made; companies with initial high layout cost do not qualify
3 Supporters of tax incentives will often forward the argument of incubators for new businesses in which the barriers to entry are quite high due to technology, information, etc. In some cases, these market‐failure barriers to entry may be mitigated by government supported research and development, regulations on monopolies, etc. Tax incentives to support specific industries are more of a blunt instrument that may also benefit other industries. In the end, the question remains – can the new industry be sustained without additional policy interference?
8
unless excess tax credits can be sold to profitable companies (a growing policy option in
some industry incentives in the U.S.). Empirical research indicate that tax incentives can
stimulate investment, but that a country’s overall economic characteristics may be more
important for the success or the failure of industries than any tax incentives package (Zee,
Stotsky & Ley, 2001:1509). Even if tax incentives stimulate investment, they are not generally
cost effective.
The limited usefulness of tax incentives derives also from the fact that investors often
emphasize the relative unimportance of the tax system in investment decisions compared
with other considerations (Holland & Vann, 1998: 987). Evidence is that firms first examine a
country’s basic economic and institutional situation and are basically attracted to the
potential markets in developing and transition countries and the relatively low‐cost labour.
Factors inhibiting large‐scale investment and for which tax incentives can’t compensate
include uncertainty in the policy stance of governments, political instability and the
rudimentary state of the legal framework for a market economy (in transition economies).
Tax incentives on their own cannot overcome these negative factors and the general
features of the tax system (tax base, tax rates, stability, consistency/predictability,
transparency, etc.) are more important than tax incentives. (Klemm & Van Parys, 2009;
James, 2009; McKinsey Global Institute, 2003).
Why do countries enact tax incentives despite their drawbacks? Legislators may feel the
need to do something to attract investment but may find it difficult to address the chief
reasons that discourage investment. Tax incentives are at least something over which they
have control and which they can enact relatively easily and quickly, precisely because the full
cost is not always visible or disclosed. Alternatives to tax incentives may also involve direct
expenditure of funds, and tax incentives may be seen as a politically easier alternative, since
subsidies involving direct expenditure may undergo closer scrutiny than tax expenditures
aimed at attracting investment. In fact, few countries produce a regular tax expenditure
budget that quantifies the value of incentives while direct expenditures are under scrutiny in
any modern budgeting exercise. In addition, some countries may feel under pressure to
provide “visible” incentives for multinational companies, who threaten to locate investment
elsewhere if they are not given concessions. Incentives also provide a popular way for
officials to show efforts to increase employment and incubate or otherwise support
industries deemed important to the country.
Many economists would admit, however, if pushed, that a market‐failure case can be made
for tax incentives to internalize positive externalities in a Pigouvian way. Examples are in
respect of: projects located in less developed regions of a country (either to reduce
congestion and/or pollution in the developed regions, or to reduce the disparity in income
distribution that could be viewed as having some public‐good characteristics); projects
entailing use of advanced technologies that could raise the general technological absorption
capacity of a country; projects that have a high propensity of leading to a build‐up of key

9
types of human capital whose benefits usually extend beyond the persons embodying them;
and projects that involve research and development activities in targeted areas deemed
important for whatever policy reasons. (see Zee, Stotsky & Ley, 2002: 1500).
3. Classification of tax incentives, with reference to South Africa
In South Africa interest in tax expenditure (of which tax incentives form a subset) has flared
up from time to time. Heyns (1984) listed 164 tax expenditures and the cost of some, arguing
the case for a tax expenditure budget for South Africa. The Margo Commission (RSA, 1988:
67‐68) recommended the phasing out of various tax expenditures, some of which were
indeed terminated even if with some delay (like the phasing out of the general export
incentive scheme). The IMF’s (2008) Country Report on South Africa presents a
comprehensive list of tax expenditures. The first time an official list of tax expenditures was
published, was in the 2011 Budget Review (RSA, 2011: 181). South Africa has yet to publish a
fully‐fledged tax expenditure budget, however, and little – if any – aggregate analysis has
been done on the impact of tax incentives.4
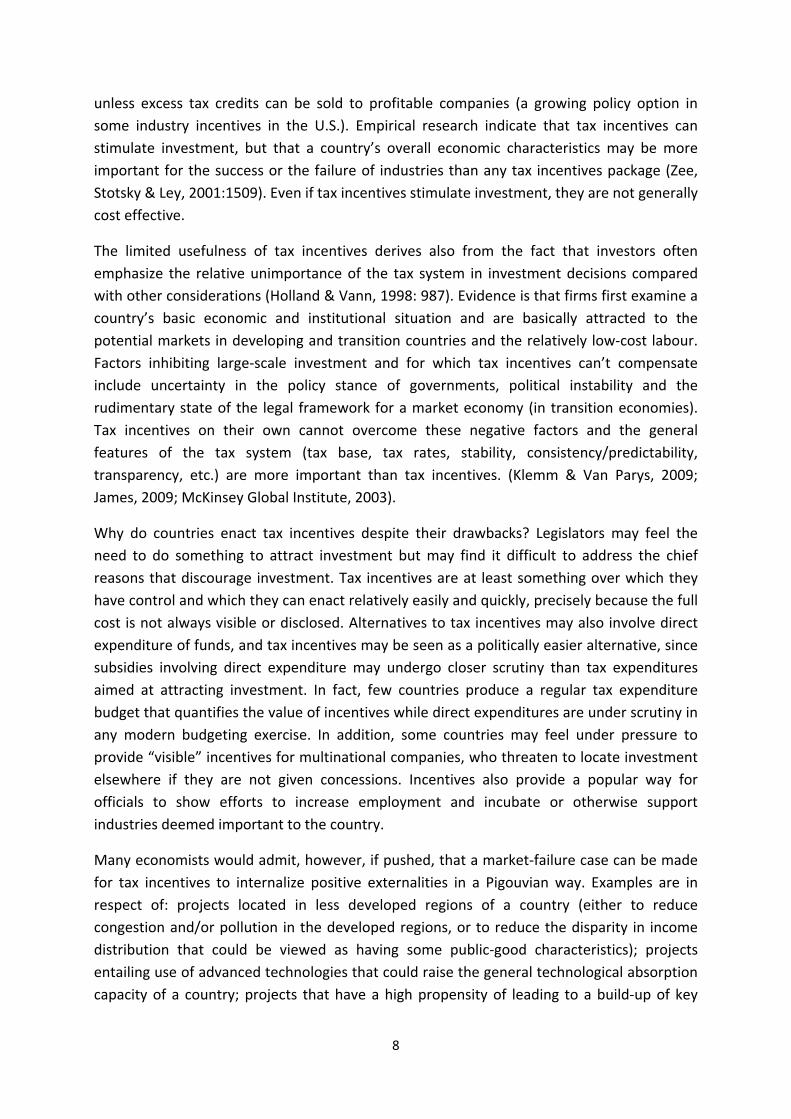
Drawing on Zee, Stotsky and Ley (2002: 1502‐1507), Table 1 contains a codified list of
different types of tax incentives, as well as a brief statement regarding the acceptability (or
unacceptability) of the different types of tax incentives from the point of view of allocative
or tax efficiency and/or administrative feasibility.5 A tick (⥌) in the second column indicates
that this type of incentive is currently applied in South Africa.
Analysis of tax incentives should reflect an absolute analysis (is the incentive “good”?) as
well as a relative analysis (is incentive X better than incentive Y?). The normative analysis of
tax incentives consists of concerns over economic efficiency and equity. The welfare cost of
incentives should be considered when contemplating and comparing incentives. Similarly,
the equity implications are to be taken into account but may be difficult to do so. Tax
incentives by their nature are revenue losers and should be offset with an increase in other
revenue or a decrease in expenditures, unless of course the intent is to stealthily increase
TABLE 1. TYPES OF TAX INCENTIVES
Incentive type and
use in SA Statement on acceptability
Category code
Direct tax incentives
1. Corporate income tax (CIT) rate incentives CITR
1.1 Tax holidays
Bulk of revenue forgone is likely to have no beneficial impact on investment. Benefit‐cost ratio is low.
Particularly susceptible to tax planning (i.e. avoidance schemes), including fictitious foreign‐owned companies.
CITR‐TH
4There has been some analysis of the effectiveness of particular tax incentives, however, such as Flatters (2002) in respect of the motor industrial development programme (MIDP). 5When economists qua economists do not succeed in stemming the tide and dampening the political affinity for tax incentives, they still have a role to play, namely to advise on which tax incentives are the least unacceptable in the second‐ or third‐best world. And sometimes they are listened to.
10
TABLE 1. TYPES OF TAX INCENTIVES
Incentive type and
use in SA Statement on acceptability
Category code
Not recommendable.
1.2 Preferential CIT rates ⥌
Rules are complex and subject to manipulation.
Identifying the qualifying income is problematic. Income from both existing and new operations becomes eligible. It is less likely to be cost‐effective than incentives related to the amount of new investment.
Not recommendable.
CITR‐PR
2. Investment cost‐recovery incentives ICR
2.1 Investment allowances ⥌
Of greatest benefit to firms with income from existing operations, who can shelter a portion of their income from tax with the incentives earned on the new investment.
Firms with low income or start‐up firms cannot begin to take advantage of the incentive until investment begins to earn taxable income.
Revenue impact in theory tied to the degree of new activity: relatively small in early years of program and grows over time as more firms become eligible.
Carry‐forward of deductions by firms that cannot fully use them can considerably raise the revenue cost over time.
Meritorious.
ICR‐IA
2.2 Investment tax credits ⥌
Can be manipulated, using subsidiary costing, to claim benefit for inefficient spending or cost (together with depreciation allowances) exceeding investment.
ICR‐ITC
3. Accelerated depreciation ⥌
Incentive in form of accelerated depreciation.
Amount written off reduces future depreciation base, ensuring total amount written off cannot exceed the actual investment cost.
Has fewest of the shortcomings associated with CIT rate incentives and all of the virtues associated with investment cost‐recovery.
AD
4. Investment subsidies
Can be in form of income tax relief and/or preferential tax rates on interest, dividends and capital gains
Least meritorious.
IS
Indirect incentives
5. Export‐oriented incentives (tariff or VAT exemptions) ⥌
Very prone to abuse, as qualified purchases can easily be diverted to buyers not intended to receive the incentives.
Duty draw‐back schemes a better version.
EO
6. Export processing zones
Tax incentives available in these zones often comprise both indirect and direct taxes – latter often tend to attract economic activities unrelated to exports.
EPZ
tax incentives consists of concerns over economic efficiency and equity. The welfare cost of
incentives should be considered when contemplating and comparing incentives. Similarly,
the equity implications are to be taken into account but may be difficult to do so. Tax
incentives by their nature are revenue losers and should be offset with an increase in other
revenue or a decrease in expenditures, unless of course the intent is to stealthily increase
benefit, such as in the case of new technology, or addressing a structural bias against market
11
entry (although the first‐best solution would be to remove the structural barrier). A central
question then becomes, what is the period of analysis? Incentive schemes are often
designed to generate tax benefits on the basis of performance criteria, such as job creation,
generation of foreign exchange and decentralisation into particular regions (e.g. relocation
of industry to rural areas to counter urbanisation or for some other politico‐economic
reason6). It is difficult to evaluate the efficiency of such types of incentives as one is required
to value allocative efficiency as well as equity.
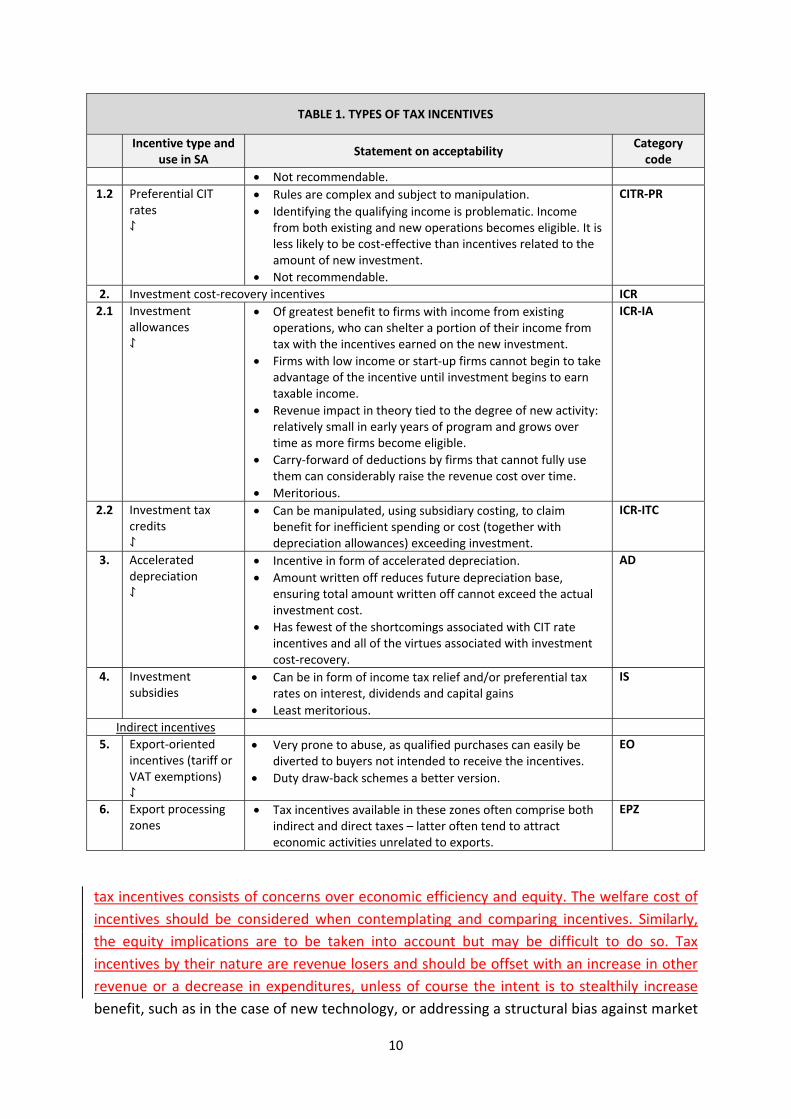
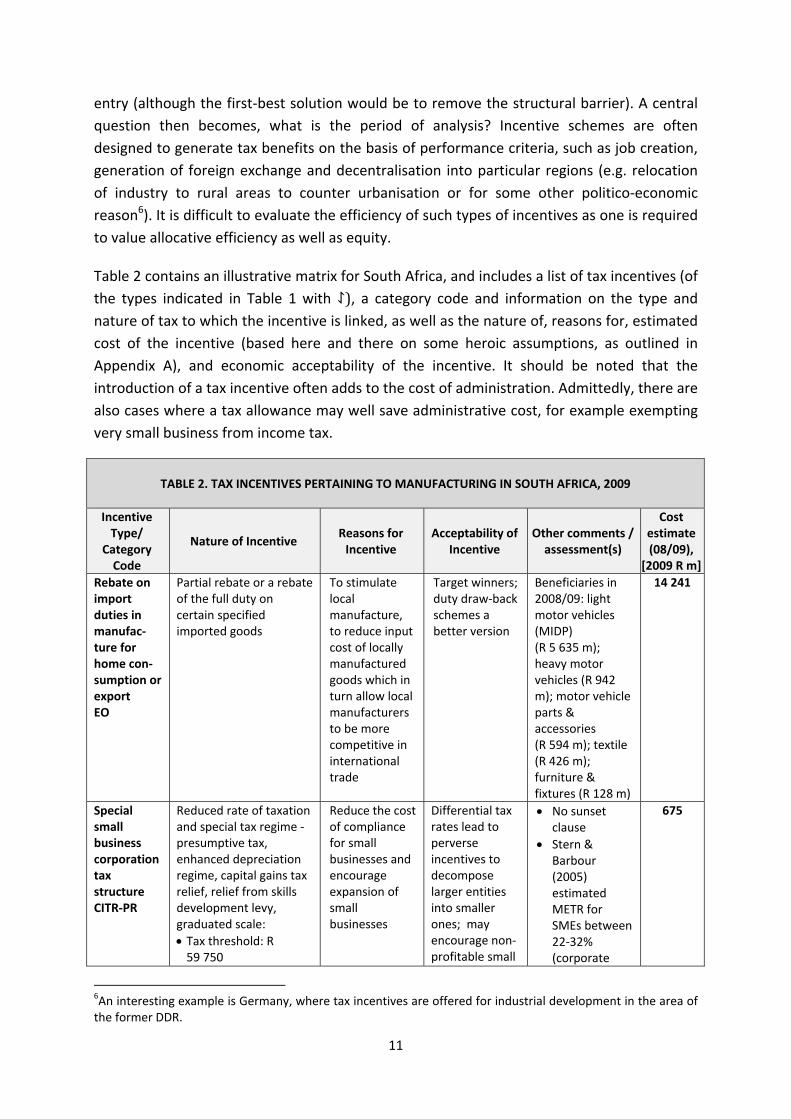
Table 2 contains an illustrative matrix for South Africa, and includes a list of tax incentives (of
the types indicated in Table 1 with ⥌), a category code and information on the type and
nature of tax to which the incentive is linked, as well as the nature of, reasons for, estimated
cost of the incentive (based here and there on some heroic assumptions, as outlined in
Appendix A), and economic acceptability of the incentive. It should be noted that the
introduction of a tax incentive often adds to the cost of administration. Admittedly, there are
also cases where a tax allowance may well save administrative cost, for example exempting
very small business from income tax.
TABLE 2. TAX INCENTIVES PERTAINING TO MANUFACTURING IN SOUTH AFRICA, 2009
Incentive Type/
Category Code
Nature of Incentive Reasons for Incentive
Acceptability of Incentive
Other comments / assessment(s)
Costestimate (08/09),
[2009 R m]
Rebate on import duties in manufac‐ture for home con‐sumption or export EO
Partial rebate or a rebate of the full duty on certain specified imported goods
To stimulate local manufacture, to reduce input cost of locally manufactured goods which in turn allow local manufacturers to be more competitive in international trade
Target winners; duty draw‐back schemes a better version
Beneficiaries in 2008/09: light motor vehicles (MIDP) (R 5 635 m); heavy motor vehicles (R 942 m); motor vehicle parts & accessories (R 594 m); textile (R 426 m); furniture & fixtures (R 128 m)
14 241
Special small business corporation tax structure CITR‐PR
Reduced rate of taxation and special tax regime ‐ presumptive tax, enhanced depreciation regime, capital gains tax relief, relief from skills development levy, graduated scale:
Tax threshold: R 59 750
Reduce the cost of compliance for small businesses and encourage expansion of small businesses
Differential tax rates lead to perverse incentives to decompose larger entities into smaller ones; may encourage non‐profitable small
No sunset clause
Stern & Barbour (2005) estimated METR for SMEs between 22‐32% (corporate
675
6An interesting example is Germany, where tax incentives are offered for industrial development in the area of the former DDR.
12
TABLE 2. TAX INCENTIVES PERTAINING TO MANUFACTURING IN SOUTH AFRICA, 2009
Incentive Type/
Category Code
Nature of Incentive Reasons for Incentive
Acceptability of Incentive
Other comments / assessment(s)
Costestimate (08/09),
[2009 R m]
Taxable income R 59 751 ‐ R300 000: 10% of amount > R 59 750
Taxable income ≥R 300 001: R24 025 (plus 28% of amount > R300 000)
businesses to develop
rate then 29%); higher than standard tax regime in formal sectors; 16% if registered for VAT
Film allowance ICR
An incentive for locally owned productions filming in South Africa; allows rebate up to 35% of qualifying expenditure on productions of a total budget ≥ R2.5 million; R10 m cap
Increase investment in development of new business
Can be manipulated, using to claim benefit for inefficient spending or cost (together with depreciation allowances) > investment; cap contains risk
Number of beneficiaries have dropped from peak of 67 in 2003/04 to 7 in 2008/09
319
Research and Development Allowance ICR‐ITC
Increased expensing of assets and recurrent expenditures Tax allowance for: (a) purchase of equipment and buildings deducted at 50:30:20% (average 33.3%); (b) current expenditure deducted at 150%.
Increase investment in development of new technologies, production techniques, etc.
R&D credits can reduce entrepreneurial risk and encourage innovation and growth; difficult to monitor R&D investments relative to regular costs
No sunset clause
In 2008/09 2 015 companies benefitted, down from the 2006/07 peak of 3 087
219
Learnership Allowance ICR
Additional deductions for training
Increase skill of workforce, reduce cost of expanded training
Providing training via the tax system could lead to evasion; more acceptable if in form of expenditure subsidy
193
Strategic Industrial Policy Incentive ICR
100% deduction for equipment up to a treshholdthreshold
Increase investment in critical areas
Targets winners—critical investment areas;
61
Urban Development Zones ICR‐AD
Accelerated depreciation allowed for investments in qualified zones
Increase investment in urban areas of SA
Long‐term effectiveness? Picking winners
85
13
TABLE 2. TAX INCENTIVES PERTAINING TO MANUFACTURING IN SOUTH AFRICA, 2009
Incentive Type/
Category Code
Nature of Incentive Reasons for Incentive
Acceptability of Incentive
Other comments / assessment(s)
Costestimate (08/09),
[2009 R m]
TOTAL 15 792
In the remainder of this paper, we focus on those incentives aimed at increasing investment,
employment and output and those that are employed through the corporate income tax
system in South Africa. There are many additional incentives afforded producers and
consumers through various taxes. The South African National Treasury (RSA, 2011: 189‐192)
produces an estimate of tax expenditures (including explicit tax incentives as well as more
implicit tax reductions), which help to understand the nature and magnitude of the many
incentives in the country. These incentives form part of a bigger group of incentives
containing many expenditure subsidies designed to benefit particular sectors of the
economy in one way or another.
4. Analysis of the impacts of tax incentives
Many incentives are focused on increasing investment and employment and many
specifically target the UCC in particular industries. Given the link between incentives and the
UCC (and wages), one might argue that the first line of evaluation of a large group of
incentives is to calculate the impact of incentives on the effective marginal tax rate on
factors of production (METR). The METR measures the difference between net and gross
rate of return due to specifics of tax policies within a country.7 A larger decrease in the METR
would be expected to bring greater economic activity. A time series (or cross section)
analysis of investment or employment as a function of the METR could be a useful incentive
evaluation tool ex ante, estimated METRs under various incentives could be a useful way to
inform the process of determining the “best” incentive.
METRs are notoriously difficult to calculate as they should reflect very specific tax treatment
of capital, including depreciation, carry forward/back of losses, and treatment of capital
gains. Calculating METRs over time (or across countries) is that much more difficult due to
changes in tax laws, regulations that affect “doing business”, etc. Incentives also often focus
on a subset of industries (or regions) and attributing a net change in the price of capital as a
result is somewhat subjective.
As a result of these complications, there are few if any analyses of tax incentives that take
this micro approach of measuring the impact of tax incentives on macro aggregates (growth,
7 Regulatory policies may also be considered. METR analysis is derived from a standard model of profit maximization where the marginal investment is made such that the returns equal costs at the margin.

14
employment, etc.) using METRs.8 Such an analysis might be done ex post by regressing
changes in macro aggregates such as employment, GDP, or investment against changes in
the pre and post incentive METR over time. Alternatively, cross sectional analysis may make
use of variation in METRs (overall or by sector) across countries as a determinant of growth
in the same macro aggregates. This type of analysis would tend to be retrospective, although
past experiences could be used to inform future planned incentives. Moreover, as pointed
out by Klem and van Parys (2010: 3), a shortcoming is that METRs do not provide evidence
on actual investment outcomes. An alternative would be to focus on growth, employment,
etc. by sector over time, using the incentive as a “natural experiment.” The problem with
both the above‐mentioned econometric techniques is that many incentives are small relative
to overall GDP, employment, etc. and therefore marginal effects associated with incentives
can be difficult to pick up in a time series analysis. Very targeted incentives such as
investment in certain regions of the country and in certain industries may simply be
monitored with local data on employment and output.
There are at least two alternative approaches that might be used to help evaluate the
relative impact of incentives. If governments’ primary goal of incentives is to increase
output, employment and growth, the most useful analysis of incentives is an ex ante one
that compares the potential impacts of incentive X over incentive Y. Of course, such an
analysis should also include a relative measure of acceptability – a “do the least harm” sort
of approach to tax incentives. In support of this type of analysis, a simple social accounting
matrix (SAM) or input‐output multiplier analysis could be very effective in guiding
government to the most cost‐effective incentive. For want of a better label, we will refer to
these as SAM analyses.9
A SAM analysis provides insight into the following issues: per one rand of tax expenditure on
a particular tax incentive, what is the potential payback country‐wide? What industries are
likely to be impacted by way of the multiplier? If the same incentive were considered for two
different industries but could only be given to one industry, which would be more
expansionary?
8 There are however, a number of studies that estimate the METR at a point in time. For example, the FIAS studies for Zambia and Rwanda report METRs for those countries and also for South Africa, Malawi, Tanzania, Zimbabwe, Kenya and Uganda. These FIAS reports include METRs by major industries. 9 A SAM is different from an input–output matrix because it not only traces the income and expenditure flows of activities and commodities, but it also contains complete information on different institutional accounts, such as households and the government. SAM multipliers are an extension of the classic Leontief input‐output model. While the Leontief model concentrates on inter‐industry production linkages, SAM‐based models also include consumption linkages. Consumption linkages are included by making institutions like households and the government “endogenous.” The SAM multiplier approach therefore makes use of information on household factor endowments and income distribution. SAM multiplier models have been used for a wide range of issues from trade policies and macroeconomic shocks to farm‐nonfarm linkages. The SAM multiplier framework can be used to estimate the impacts of changes in any of the exogenous demand accounts in the model. Because we are treating households as endogenous in the model, this leaves three possible sources of demand stimulus: export demand, government spending, and investment demand. Exogenous changes in demand for these accounts are then transmitted to endogenous accounts, including producing sectors and households. In general SAM multipliers are larger than I‐O or Supply‐Use multipliers.
15
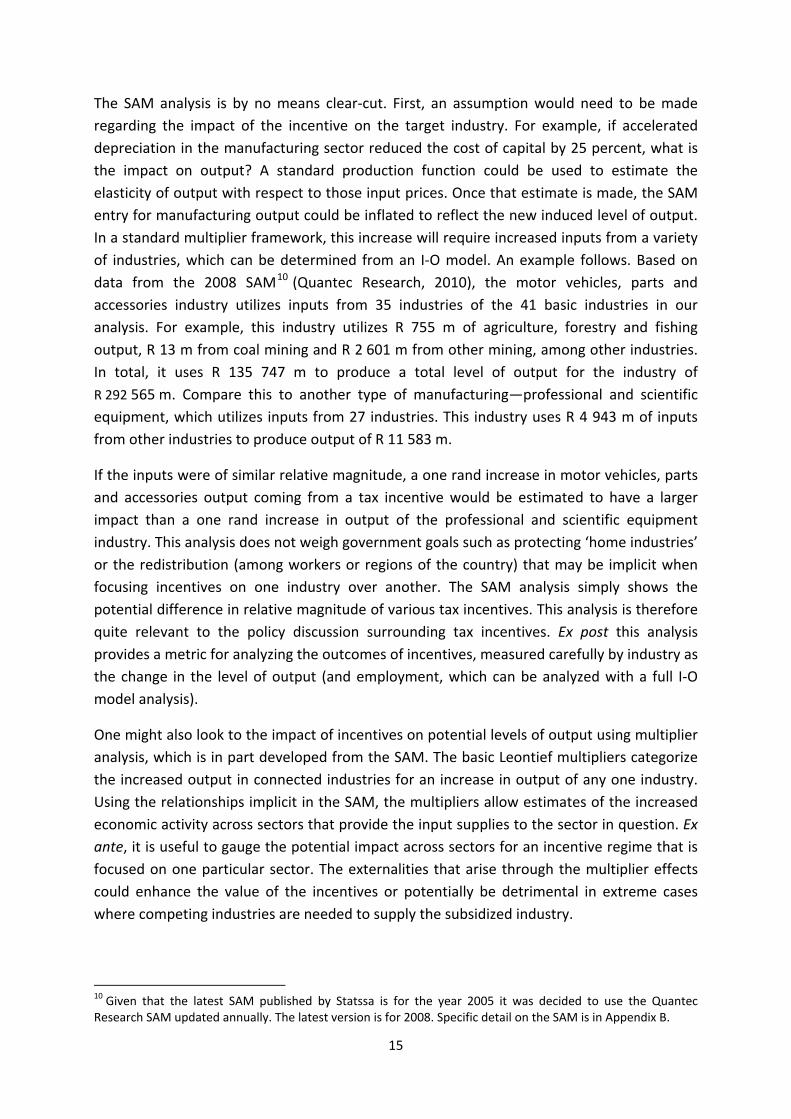
The SAM analysis is by no means clear‐cut. First, an assumption would need to be made
regarding the impact of the incentive on the target industry. For example, if accelerated
depreciation in the manufacturing sector reduced the cost of capital by 25 percent, what is
the impact on output? A standard production function could be used to estimate the
elasticity of output with respect to those input prices. Once that estimate is made, the SAM
entry for manufacturing output could be inflated to reflect the new induced level of output.
In a standard multiplier framework, this increase will require increased inputs from a variety
of industries, which can be determined from an I‐O model. An example follows. Based on
data from the 2008 SAM10 (Quantec Research, 2010), the motor vehicles, parts and
accessories industry utilizes inputs from 35 industries of the 41 basic industries in our
analysis. For example, this industry utilizes R 755 m of agriculture, forestry and fishing
output, R 13 m from coal mining and R 2 601 m from other mining, among other industries.
In total, it uses R 135 747 m to produce a total level of output for the industry of
R 292 565 m. Compare this to another type of manufacturing—professional and scientific
equipment, which utilizes inputs from 27 industries. This industry uses R 4 943 m of inputs
from other industries to produce output of R 11 583 m.
If the inputs were of similar relative magnitude, a one rand increase in motor vehicles, parts
and accessories output coming from a tax incentive would be estimated to have a larger
impact than a one rand increase in output of the professional and scientific equipment
industry. This analysis does not weigh government goals such as protecting ‘home industries’
or the redistribution (among workers or regions of the country) that may be implicit when
focusing incentives on one industry over another. The SAM analysis simply shows the
potential difference in relative magnitude of various tax incentives. This analysis is therefore
quite relevant to the policy discussion surrounding tax incentives. Ex post this analysis
provides a metric for analyzing the outcomes of incentives, measured carefully by industry as
the change in the level of output (and employment, which can be analyzed with a full I‐O
model analysis).
One might also look to the impact of incentives on potential levels of output using multiplier
analysis, which is in part developed from the SAM. The basic Leontief multipliers categorize
the increased output in connected industries for an increase in output of any one industry.
Using the relationships implicit in the SAM, the multipliers allow estimates of the increased
economic activity across sectors that provide the input supplies to the sector in question. Ex
ante, it is useful to gauge the potential impact across sectors for an incentive regime that is
focused on one particular sector. The externalities that arise through the multiplier effects
could enhance the value of the incentives or potentially be detrimental in extreme cases
where competing industries are needed to supply the subsidized industry.
10 Given that the latest SAM published by Statssa is for the year 2005 it was decided to use the Quantec Research SAM updated annually. The latest version is for 2008. Specific detail on the SAM is in Appendix B.
16
To engage a multiplier model, one needs to know the impact of a tax incentive on the output
of the targeted industry. The impact is of course a function of the production function as
well as supply and demand of factors of production and demand for the output and the
relative reduction in the cost of capital from the incentive. For this preliminary analysis, we
assume that the tax incentive lowers the cost of capital by 100 percent of the incentive and
under assumptions of perfect competition, lowers the price of output by the share of capital
in the total of capital (consumption of fixed capital) plus labor (from the SAM). For ease of
analysis, we assume that the change in the level of output is equal to the change in the price
(using total value of output from the SAM as our baseline). Any of these assumptions may be
changed or made more specific to the industry. This analysis is explained in the examples
below.
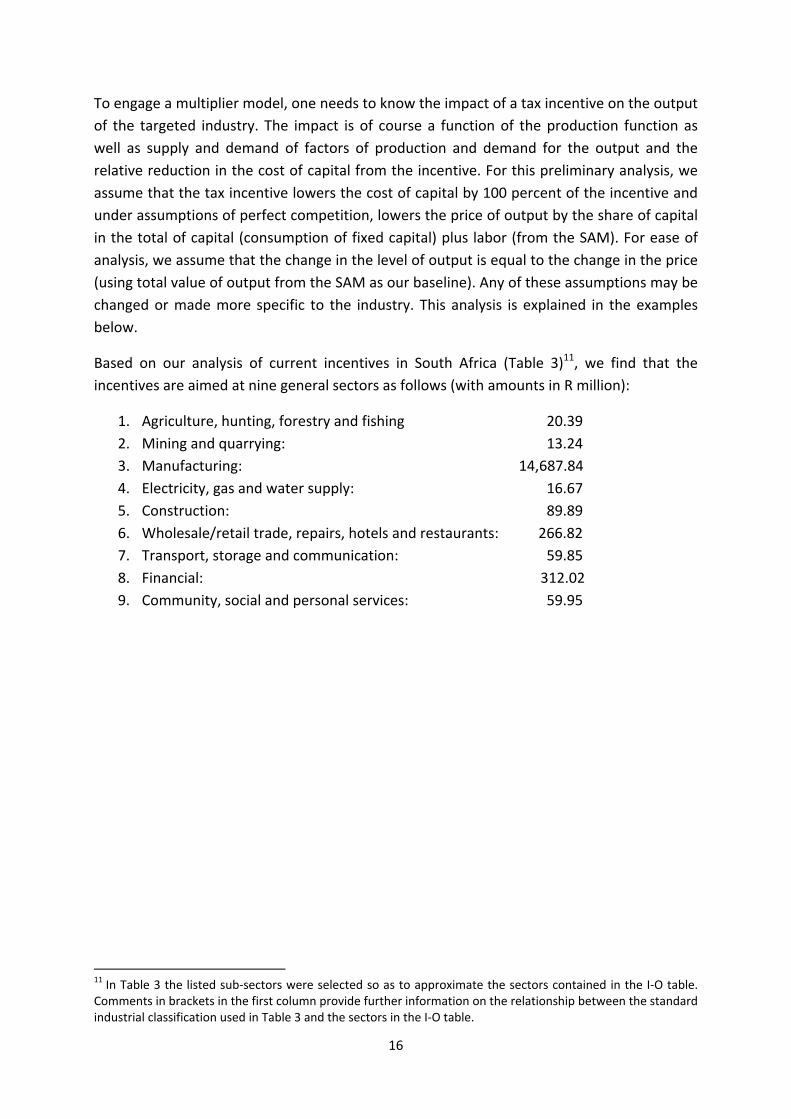
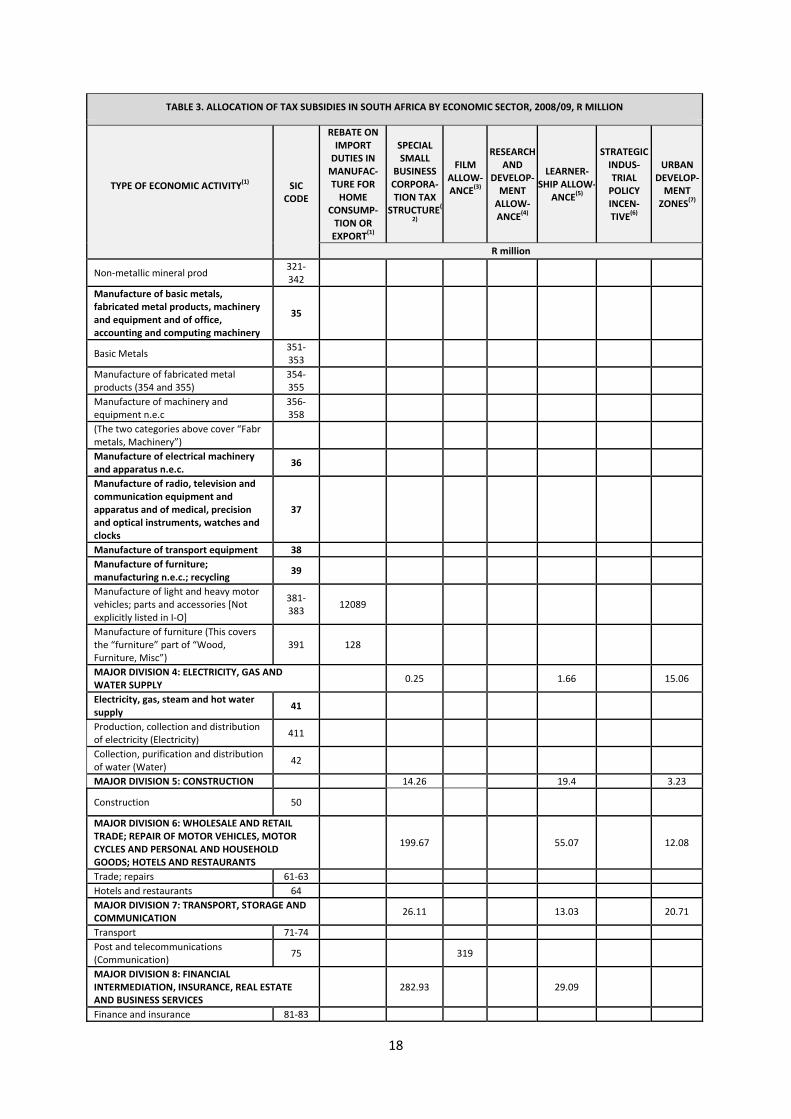
Based on our analysis of current incentives in South Africa (Table 3)11, we find that the
incentives are aimed at nine general sectors as follows (with amounts in R million):
1. Agriculture, hunting, forestry and fishing 20.39
2. Mining and quarrying: 13.24
3. Manufacturing: 14,687.84
4. Electricity, gas and water supply: 16.67
5. Construction: 89.89
6. Wholesale/retail trade, repairs, hotels and restaurants: 266.82
7. Transport, storage and communication: 59.85
8. Financial: 312.02
9. Community, social and personal services: 59.95
11 In Table 3 the listed sub‐sectors were selected so as to approximate the sectors contained in the I‐O table. Comments in brackets in the first column provide further information on the relationship between the standard industrial classification used in Table 3 and the sectors in the I‐O table.

17
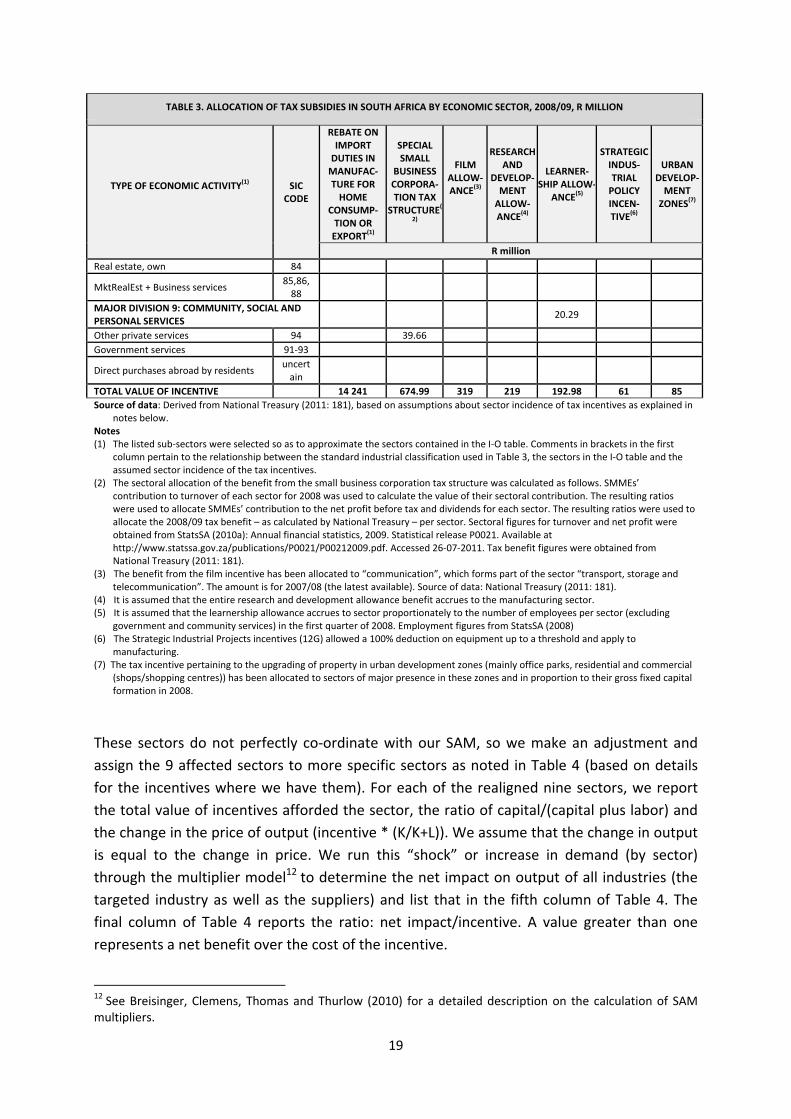
TABLE 3. ALLOCATION OF TAX SUBSIDIES IN SOUTH AFRICA BY ECONOMIC SECTOR, 2008/09, R MILLION
TYPE OF ECONOMIC ACTIVITY(1)
SIC
CODE
REBATE ON IMPORT DUTIES IN MANUFAC‐TURE FOR HOME
CONSUMP‐TION OR EXPORT
(1)
SPECIAL SMALL
BUSINESS CORPORA‐TION TAX
STRUCTURE(
2)
FILM ALLOW‐ANCE
(3)
RESEARCH AND
DEVELOP‐MENT ALLOW‐ANCE
(4)
LEARNER‐SHIP ALLOW‐
ANCE(5)
STRATEGIC INDUS‐TRIAL POLICY INCEN‐TIVE
(6)
URBAN DEVELOP‐MENT ZONES
(7)
R million
MAJOR DIVISION 1: AGRICULTURE, HUNTING, FORESTRY AND FISHING
6.45 13.94
Agriculture, hunting and related services
11
Commercial cereal crops 111
Commercial other crops 111
Commercial animal products 112‐114
Fishing 13
MAJOR DIVISION 2: MINING AND QUARRYING 7.43 5.81
Mining 21‐25
MAJOR DIVISION 3: MANUFACTURING 98.23 219 34.69 61 33.92
Manufacture of food products, beverages and tobacco products
30
Production, processing and preservation of meat, fish, fruit, vegetables, oils and fats
301
Meat processing 3011
Fish processing 3012
Manufacture of grain mill products, starches and starch products and prepared animal feeds
303
Grain milling 3031
Manufacture of beverages and other food products
304‐305
Beverages and other food processing
Manufacture of textiles, clothing and leather goods
31
Textiles 311‐312
2024
Manufacture of wood and of products of wood and cork, except furniture; etc
32
Manufacture of wood and products of wood, except furniture; etc. (This covers the “wood” part of “Wood, Furniture, Misc”)
321‐322
Manufacture of paper and paper products (This covers the “paper” part of “Paper, printing”)
323
Publishing 324
Printing and service activities related to printing (This, together with “publishing” covers the “printing” part of “Paper, printing”)
325
Manufacture of coke, refined petroleum products and nuclear fuel; manufacture of chemicals and chemical products; manufacture of rubber and plastic products
33
Petroleum refineries/synthesisers(Petroleum products)
332
Chemicals & rubber 334,335,337
Manufacture of other non‐metallic mineral products
34
18
TABLE 3. ALLOCATION OF TAX SUBSIDIES IN SOUTH AFRICA BY ECONOMIC SECTOR, 2008/09, R MILLION
TYPE OF ECONOMIC ACTIVITY(1)
SIC
CODE
REBATE ON IMPORT DUTIES IN MANUFAC‐TURE FOR HOME
CONSUMP‐TION OR EXPORT
(1)
SPECIAL SMALL
BUSINESS CORPORA‐TION TAX
STRUCTURE(
2)
FILM ALLOW‐ANCE
(3)
RESEARCH AND
DEVELOP‐MENT ALLOW‐ANCE
(4)
LEARNER‐SHIP ALLOW‐
ANCE(5)
STRATEGIC INDUS‐TRIAL POLICY INCEN‐TIVE
(6)
URBAN DEVELOP‐MENT ZONES
(7)
R million
Non‐metallic mineral prod 321‐342
Manufacture of basic metals, fabricated metal products, machinery and equipment and of office, accounting and computing machinery
35
Basic Metals 351‐353
Manufacture of fabricated metal products (354 and 355)
354‐355
Manufacture of machinery and equipment n.e.c
356‐358
(The two categories above cover “Fabr metals, Machinery”)
Manufacture of electrical machinery and apparatus n.e.c.
36
Manufacture of radio, television and communication equipment and apparatus and of medical, precision and optical instruments, watches and clocks
37
Manufacture of transport equipment 38
Manufacture of furniture; manufacturing n.e.c.; recycling
39
Manufacture of light and heavy motor vehicles; parts and accessories [Not explicitly listed in I‐O]
381‐383
12089
Manufacture of furniture (This covers the “furniture” part of “Wood, Furniture, Misc”)
391 128
MAJOR DIVISION 4: ELECTRICITY, GAS AND WATER SUPPLY
0.25 1.66 15.06
Electricity, gas, steam and hot water supply
41
Production, collection and distribution of electricity (Electricity)
411
Collection, purification and distribution of water (Water)
42
MAJOR DIVISION 5: CONSTRUCTION 14.26 19.4 3.23
Construction 50
MAJOR DIVISION 6: WHOLESALE AND RETAIL TRADE; REPAIR OF MOTOR VEHICLES, MOTOR CYCLES AND PERSONAL AND HOUSEHOLD GOODS; HOTELS AND RESTAURANTS
199.67 55.07 12.08
Trade; repairs 61‐63
Hotels and restaurants 64
MAJOR DIVISION 7: TRANSPORT, STORAGE AND COMMUNICATION
26.11 13.03 20.71
Transport 71‐74
Post and telecommunications (Communication)
75 319
MAJOR DIVISION 8: FINANCIAL INTERMEDIATION, INSURANCE, REAL ESTATE AND BUSINESS SERVICES
282.93 29.09
Finance and insurance 81‐83
19
TABLE 3. ALLOCATION OF TAX SUBSIDIES IN SOUTH AFRICA BY ECONOMIC SECTOR, 2008/09, R MILLION
TYPE OF ECONOMIC ACTIVITY(1)
SIC
CODE
REBATE ON IMPORT DUTIES IN MANUFAC‐TURE FOR HOME
CONSUMP‐TION OR EXPORT
(1)
SPECIAL SMALL
BUSINESS CORPORA‐TION TAX
STRUCTURE(
2)
FILM ALLOW‐ANCE
(3)
RESEARCH AND
DEVELOP‐MENT ALLOW‐ANCE
(4)
LEARNER‐SHIP ALLOW‐
ANCE(5)
STRATEGIC INDUS‐TRIAL POLICY INCEN‐TIVE
(6)
URBAN DEVELOP‐MENT ZONES
(7)
R million
Real estate, own 84
MktRealEst + Business services 85,86,88
MAJOR DIVISION 9: COMMUNITY, SOCIAL AND PERSONAL SERVICES
20.29
Other private services 94 39.66
Government services 91‐93
Direct purchases abroad by residents uncertain
TOTAL VALUE OF INCENTIVE 14 241 674.99 319 219 192.98 61 85
Source of data: Derived from National Treasury (2011: 181), based on assumptions about sector incidence of tax incentives as explained in notes below.
Notes (1) The listed sub‐sectors were selected so as to approximate the sectors contained in the I‐O table. Comments in brackets in the first
column pertain to the relationship between the standard industrial classification used in Table 3, the sectors in the I‐O table and the assumed sector incidence of the tax incentives.
(2) The sectoral allocation of the benefit from the small business corporation tax structure was calculated as follows. SMMEs’ contribution to turnover of each sector for 2008 was used to calculate the value of their sectoral contribution. The resulting ratios were used to allocate SMMEs’ contribution to the net profit before tax and dividends for each sector. The resulting ratios were used to allocate the 2008/09 tax benefit – as calculated by National Treasury – per sector. Sectoral figures for turnover and net profit were obtained from StatsSA (2010a): Annual financial statistics, 2009. Statistical release P0021. Available at http://www.statssa.gov.za/publications/P0021/P00212009.pdf. Accessed 26‐07‐2011. Tax benefit figures were obtained from National Treasury (2011: 181).
(3) The benefit from the film incentive has been allocated to “communication”, which forms part of the sector “transport, storage and telecommunication”. The amount is for 2007/08 (the latest available). Source of data: National Treasury (2011: 181).
(4) It is assumed that the entire research and development allowance benefit accrues to the manufacturing sector. (5) It is assumed that the learnership allowance accrues to sector proportionately to the number of employees per sector (excluding
government and community services) in the first quarter of 2008. Employment figures from StatsSA (2008) (6) The Strategic Industrial Projects incentives (12G) allowed a 100% deduction on equipment up to a threshold and apply to
manufacturing. (7) The tax incentive pertaining to the upgrading of property in urban development zones (mainly office parks, residential and commercial
(shops/shopping centres)) has been allocated to sectors of major presence in these zones and in proportion to their gross fixed capital formation in 2008.
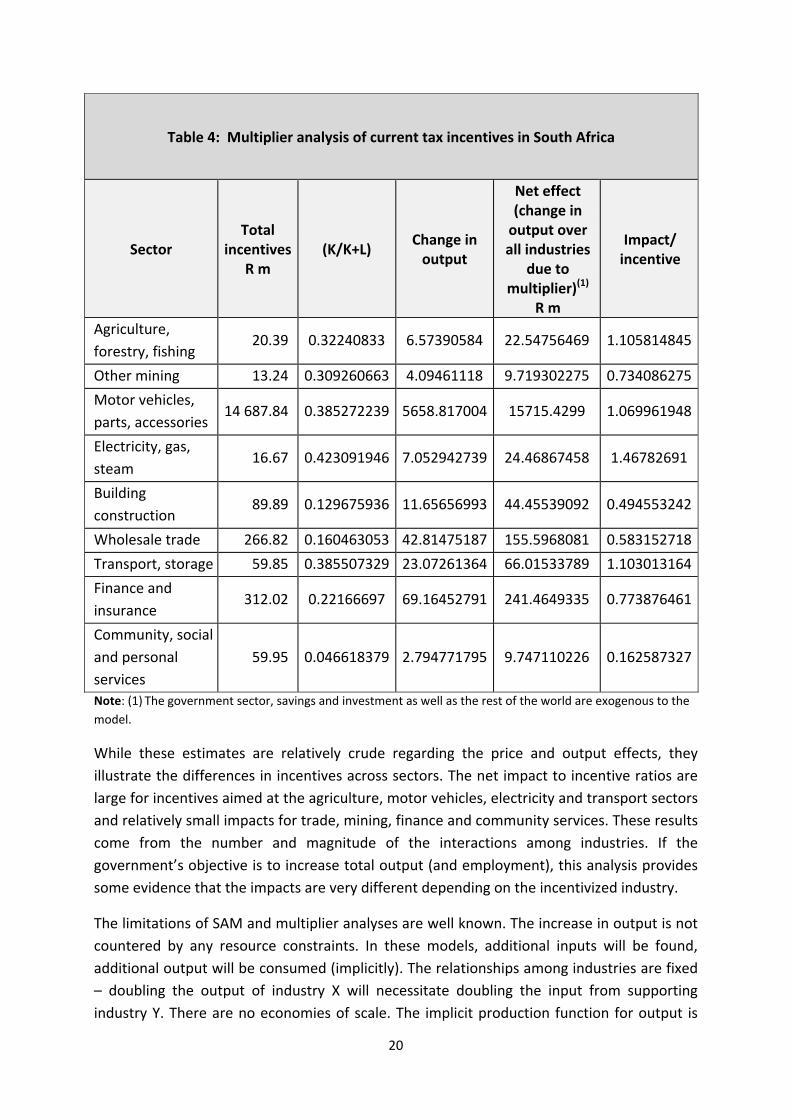
These sectors do not perfectly co‐ordinate with our SAM, so we make an adjustment and
assign the 9 affected sectors to more specific sectors as noted in Table 4 (based on details
for the incentives where we have them). For each of the realigned nine sectors, we report
the total value of incentives afforded the sector, the ratio of capital/(capital plus labor) and
the change in the price of output (incentive * (K/K+L)). We assume that the change in output
is equal to the change in price. We run this “shock” or increase in demand (by sector)
through the multiplier model12 to determine the net impact on output of all industries (the
targeted industry as well as the suppliers) and list that in the fifth column of Table 4. The
final column of Table 4 reports the ratio: net impact/incentive. A value greater than one
represents a net benefit over the cost of the incentive.
12 See Breisinger, Clemens, Thomas and Thurlow (2010) for a detailed description on the calculation of SAM multipliers.
20
Table 4: Multiplier analysis of current tax incentives in South Africa
Sector Total
incentives R m
(K/K+L) Change in output
Net effect (change in output over all industries
due to multiplier)(1)
R m
Impact/ incentive
Agriculture,
forestry, fishing 20.39 0.32240833 6.57390584 22.54756469 1.105814845
Other mining 13.24 0.309260663 4.09461118 9.719302275 0.734086275
Motor vehicles,
parts, accessories 14 687.84 0.385272239 5658.817004 15715.4299 1.069961948
Electricity, gas,
steam 16.67 0.423091946 7.052942739 24.46867458 1.46782691
Building
construction 89.89 0.129675936 11.65656993 44.45539092 0.494553242
Wholesale trade 266.82 0.160463053 42.81475187 155.5968081 0.583152718
Transport, storage 59.85 0.385507329 23.07261364 66.01533789 1.103013164
Finance and
insurance 312.02 0.22166697 69.16452791 241.4649335 0.773876461
Community, social
and personal
services
59.95 0.046618379 2.794771795 9.747110226 0.162587327
Note: (1) The government sector, savings and investment as well as the rest of the world are exogenous to the
model.
While these estimates are relatively crude regarding the price and output effects, they
illustrate the differences in incentives across sectors. The net impact to incentive ratios are
large for incentives aimed at the agriculture, motor vehicles, electricity and transport sectors
and relatively small impacts for trade, mining, finance and community services. These results
come from the number and magnitude of the interactions among industries. If the
government’s objective is to increase total output (and employment), this analysis provides
some evidence that the impacts are very different depending on the incentivized industry.
The limitations of SAM and multiplier analyses are well known. The increase in output is not
countered by any resource constraints. In these models, additional inputs will be found,
additional output will be consumed (implicitly). The relationships among industries are fixed
– doubling the output of industry X will necessitate doubling the input from supporting
industry Y. There are no economies of scale. The implicit production function for output is
21
the same across industries. We have made heroic assumptions regarding the impact of
incentives on output to operationalize these models. For relatively small incentives, these
limitations may be acceptable given the benefit of comparing “apples to apples” impacts of a
set of incentives. At this stage, the SAM and multiplier analyses simply show the potential
difference in relative magnitude of various tax incentives. These analyses are therefore quite
relevant to the policy discussion surrounding tax incentives. Ex post these analyses provide a
metric for analyzing the outcomes of incentives, measured carefully by industry as the
change in the level of output (and employment, which can be analyzed with a full I‐O model
analysis).
An alternative analytic approach to analyzing tax incentives is a computable general
equilibrium model. A CGE model allows analysis of changes in tax rates to affect
consumption and production while respecting assumed resource constraints. Many CGE
models are not disaggregated enough to analyze relative small changes like tax incentives
that reduce the UCC for particular industries and the complicated relationships within the
model make it difficult to analyze relatively small changes. Such changes get “lost” in
recalibration and may introduce non‐convexities that result in non‐convergence of new
equilibrium positions. CGE models are very helpful for understanding the relative impact of
large‐scale “macro” tax incentives such as a change in the corporate tax rate, elimination of
all exemptions, etc.
Additional analyses could be done to consider the distributional implications of tax
incentives – who wins and who loses? The “cost” of the tax incentive in the short run is a
matter of debate. If a government operated under a balanced budget of sorts, the tax
incentive would have to be financed through higher other taxes (perhaps general funds) or
via lower expenditures. The resulting net fiscal burden could be regressive or progressive. It
would also be useful to analyze the subsidy side of the incentives game. The same tools of
public finance can be used to demonstrate the effectiveness, efficiency and equity of using
direct subsidies (versus tax expenditures) to incentivize particular industries. In some
countries, expenditure subsidies may be more politically acceptable in that they are seen as
a short‐term expenditure that can be eliminated in the future. Subsidies should also reach
the regular expenditure budget of governments and thereby be more transparent than tax
incentives.
5. Alternatives
What are the alternatives to tax incentives? The most common approach is to consider the
corporate tax reduction which an abolishment of all investment tax incentives would make
possible. This macro tax incentive could be analyzed and compared to, for example, the cost
of those listed in Table 3. A wide‐scale measure such as reduction in the corporate income
tax rate is difficult to analyze without a full CGE approach. However, using a very similar
approach to that of the multiplier analysis above, we can offer some intuition regarding the
potential impact of a general corporate tax reduction. We cannot at this stage say anything

22
about the welfare or distributional effects of a general tax reduction versus specific tax
incentives.
Using our multiplier model, we assume once again that a decrease in the corporate tax rate
will reduce the user cost of capital in line with capital’s share of factor inputs in each sector.
Using the same methodology as above, we impose a corporate tax reduction “shock” equal
to the total value of incentives investigated in Table 4 (R 15 526.7 million). We allocated a
share to each sector based on the output of the sector as a share of total output according
to the SAM we use. We use sectors 1‐42 in our matrix. The impact of such a change induced
by an overall corporate tax decrease is an increase in output of R 56 017 million—which
yields a benefit (net increase in output) to cost (total cost of incentive) of 3.6. This is much
larger than any of the targeted incentives listed above. We understand that not all sectors
would actually benefit from a corporate tax reduction (those in the non‐profit sector or
industries with large numbers of small and start‐up companies)—however, the overall
magnitude of impact from a general corporate tax reduction certainly seems to warrant
more attention as a potential replacement for the piecemeal approach of targeted
incentives.
Another approach to analysis of tax incentives is to consider the opportunity cost of tax
incentives with reference to other government programmes which could be financed,
particularly of a pro‐poor nature.
Another alternative to tax incentives is cooperation among countries. Such cooperation is
notoriously difficult but interest in cooperation has grown as competition has become more
and more fierce. Cooperation can be of many forms.
It is also possible for countries to address the incentive issue through a general
rationalization of tax systems. If the tax expenditures associated with tax incentives were
used to provide across‐the‐board reductions in tax rates, countries may be able to effectively
and rationally attract investment. In such cases, the market would ‘pick the winners’ instead
of government. Of course this leaves out targeted incentives where government wants to
pick winners. In addition, countries could engage in more rigorous enforcement of rational
transfer pricing, tax shelter laws and regulations, etc.
6. Conclusion
Tax expenditures are likely to continue to be part of development policy in South Africa and
around the world. There is mixed evidence of the impact of targeted incentives. In this
paper, we attempt to shed more light on how we might evaluate tax incentives to assist
policy makers’ decisions regarding particular incentives. We categorize tax incentives by
“type” and provide a context for developing a hierarchy of tax incentives that would be
expected to have more or less economics impacts (“good” and “bad”). We also provide some
early empirical analysis of the potential impacts of various targeted incentives, using data on
incentives that are currently in use in South Africa.

23
Specifically, preliminary analysis demonstrates that relatively simple tools such as social
accounting matrices and Leontief multipliers can provide policy makers a means to evaluate
the relative value of incentives with respect to their output effects. With these models, we
provide preliminary evidence of the superior impact of a general tax incentive such as a
reduced corporate tax rate on output. Future research will focus on the development of a
CGE model that can provide more detailed analysis of such a large scale change. We also
plan to evaluate the expected impact of subsidies versus tax incentives in South Africa.
What remains is identifying an ex post evaluation of tax incentives. Using the estimates of
expected changes in output (from the multiplier analysis and in the future from CGE
analysis), we will attempt to estimate before and after output changes.

24
References Bird, Richard M. (2008), “Tax Challenges Facing Developing Countries”, Rotman Institute for
International Business Working Paper Series IIB Paper no 12. Toronto: University of Toronto Joseph L. Roman School of Management.
Breisinger, Clemens, Marcelle Thomas and James Thurlow (2010), "Social accounting matrices and multiplier analysis ," International Food Policy Research Institute, Washington, D.C.
Deloitte (2009), “Incentives 2009: Complex Issues, Comprehensive Solutions,” Johannesburg, South Africa.
De Mooij, Ruud A. and Sjef Ederveen (2003), “Taxation and Foreign Direct Investment: A Synthesis of Empirical Research” International Tax and Public Finance 10(6): 673‐693.
Flatters, T. (2002), “From import substitution to export promotion: driving the South African motor industry.” Note presented at a session on the success of the South African auto industry at the tips annual forum in Muldersdrift, South Africa September 9‐11, 2002. Available at http://www.tips.org.za/node/1172, accessed 10 August 2011.
Foreign Investment Advisory Service (FIAS) (2001), “Using Tax Incentives to Compete for Foreign Investment: Are They Worth the Costs?” The International Finance Corporation and the World Bank, Washington, D.C.
_____ (2004), “Zambia Sectoral Study of the Effective Tax Burden,” The International Finance Corporation and the World Bank, Washington, D.C.
_____ (2006a), “Sector Study of Effective Tax Burden: Rwanda,” The International Finance Corporation and the World Bank, Washington, D.C.
_____ (2006b), “Sector Study of Effective Tax Burden: South Africa,” The International Finance Corporation and the World Bank, Washington, D.C.
Hall, R. and D.W. Jorgenson (1967), “Tax policy and investment behavior”, American Economic Review 57(3): 391‐414.
Heyns, J. van der S. (1984), “Towards a tax expenditure budget for South Africa”, Economic Research Unit of the University of Natal Occasional Paper no 15, Durban.
Holland, D. and R.J. Vann (1998), “Income Tax Incentives for Investment” in V. Thuronyi (ed) (1998), Tax Law Design and Drafting (Vol 2), International Monetary Fund: Washington DC, chapter 23 (pp 986‐1020).
James, Sebastian (2009), “Incentives and Investments: Evidence and Policy Implications,” Foreign Investment Advisory Service (FIAS), Washington, DC.
IMF (international Monetary Fund) (2008), “South Africa: Selected Issues”. IMF Country Report No. 08/347 October 2008, Washington, D.C.
_____ (2011), Statement by the IMF Mission at the Conclusion of a Visit to Uganda. Press Release No.11/112, April 4, 2011, Washington, D.C. Available at http://www.imf.org/external/np/sec/pr/2011/pr11112.htm.Accessed 19 July 2011.
Keen, Michael and Mario Mansour (2009), “Revenue Mobilization in Sub‐Saharan Africa: Challenges from Globalization,” International Monetary Fund Working Paper 09/157, Washington, D.C.
Klemm, Alexander and Stefan Van Parys (2009), “Empirical Evidence on the Effects of Tax Incentives,” International Monetary Fund Working Paper 09/136.
Margo Commission. 1987. Report of the Commission of Inquiry into the tax structure of the Republic of South Africa (Chairman: C.S. Margo). RP34/1987. Pretoria: Government Printer.
25
McKenzie, Kenneth J. (2007), “Analysis of the Effective Tax Burden on Investment in Ten Sub‐Saharan African Countries,” presentation at the conference “Tax and the Investment Climate in Africa,” sponsored by FIAS and DFID, February 26‐27, 2007, Zambia. Avaiable at http://www.ifc.org/ifcext/fias.nsf/AttachmentsByTitle/Zambiataxconference_Presentation3/$FILE/Presentation+3.pdf, accessed on 1 May 2011.
McKinsey Global Institute (2003), “New Horizons: Multinational Company Investment in Developing Countries.” Available at http://www.mckinsey.com/mgi/, accessed on 13 July 2011.
National Treasury (2010), “Measuring and Reporting Tax Expenditures in South Africa,” Pretoria, South Africa.
OECD (2010), Tax Expenditures in OECD countries, Paris. Available at http://www.oecd.org/publishing/corrigenda.
Perrault, Jean‐Francois, Luc Savard, and Antonio Estache (2008).“The Impact of Infrastructure Spending in Sub‐Saharan Africa: A CGE Modeling Approach,” Africa Infrastructure Country Diagnostic Working Paper 15, The World Bank, Washington, D.C.
Quantec Research (2010). "SAM for South Africa – 2008", Pretoria: Quantec Research. RSA (1988): White Paper of the Commission of Inquiry into the Tax Structure of the Republic
of South Africa (the Margo Report) [WP C‐88]. Pretoria: Government Printer. _____ (2011): Budget Review, 2011. Pretoria: National Treasury. Available at
http://www.treasury.gov.za/, accessed on 10 August 2011. StatsSA (2008): Quarterly Labour Force Survey. Statistical release P0211, 2nd quarter, 2008.
Available at http://www.statssa.gov.za/publications/statspastfuture.asp?PPN=P0211&SCH=4910; accessed 10 August 2011.
_____ (2010a): Survey of businesses not registered for VAT and income tax. Statistical
release P0276, 19 October 2010. Available at:
http://www.statssa.gov.za/publications/P0276/P02762009.pdf; accessed 26 July 2011.
_____ (2010b): Annual financial statistics, 2009. Statistical release P0021. Available at http://www.statssa.gov.za/publications/P0021/P00212009.pdf; accessed 26‐07‐2011.
Stern R and Barbour P, (2005), Designing a Small Business Tax System That Enhances Growth: Lessons From Africa (World Bank Working Paper).
United Nations (2000), “Tax Incentives and Foreign Direct Investment: A Global Survey,” New York and Geneva: www.unctad.org/en/docs/iteipcmisc3_en.pdf
United Nations Conference on Trade and Development (UNCTAD) (2006), “Investment and Policy Review Rwanda,” Geneva: United Nations.
UN on Rwanda (no date): http://www.unctad.org/en/docs/iteipc200611annex_en.pdf Van Parys, S. and S. James (2010), “The Effectiveness of Tax Incentives in Attracting
Investment: Panel Data Evidence from the CFA Franc Zone,” International Tax and Public Finance, DOI: 10.1007/s10797‐010‐9140‐1.
Wisconsin Legislative Reference Bureau (2006), “State Incentives for the Film Industry,” http://legis.wisconsin.gov/lrb/pubs/wb/06wb3.pdf, accessed on August 8, 2011.
Zee, Howell H, Janet G. Stotsky and Eduardo Ley (2002), “Tax Incentives for Business
Investment: A Primer for Policy Makers in Developing Countries”, World Development
30(9): 1497‐1516.

26
APPENDIX A
ASSUMPTIONS UNDERLYING THE CALCULATION OF THE SECTORAL ALLOCATION OF SOUTH
AFRICAN INDUSTRIAL TAX INCENTIVES, 2008/09
Name of incentive
Nature of Incentive Assumptions underlying calculation
of sectoral allocation(1} Cost (08/09),[2009 prices]
Rebate on import duties in manufac‐ture for home consumption or export
Partial rebate or a rebate of the full duty on certain specified imported goods
Entire benefit accrues to manufacturing.
14 241
Special small business corporation tax structure
Reduced rate of taxation and special tax regime ‐ presumptive tax, enhanced depreciation regime, capital gains tax relief, relief from skills development levy, graduated scale:
Tax threshold: R 59 750 Taxable income R 59 751 ‐ R300 000: 10% of amount > R 59 750
Taxable income ≥R 300 001: R24 025 (plus 28% of amount > R300 000)
In the absence of data on SME tax benefits per sector, the tax benefit accruing to SMEs in the manufacturing sector was assumed to be proportional to their sectoral turnover. 2008 data were used to allocate the 2008/09 tax incentive. [Data obtained from StatsSA survey of businesses not registered for VAT and income tax (StatsSA, 2010a)]
675
Film allowance
An incentive for locally owned productions filming in South Africa; allows rebate up to 35% of qualifying expenditure on productions of a total budget ≥ R2.5 million; R10 m cap
The entire tax benefit was assumed to accrue to the subsector “communication”, which is part of “transport, storage and telecommunication”.
319
Research and Development Allowance
Increased expensing of assets and recurrent expenditures Tax allowance for: (a) purchase of equipment and buildings deducted at 50:30:20% (average 33.3%); (b) current expenditure deducted at 150%.
The entire tax benefit was assumed to accrue to manufacturing.
219
Learnership Allowance
Additional deductions for training to increase skill of workforce & reduce cost of expanded training
Benefit assumed accrued to economic sectors proportional to number of employees (excluding government and community services), using employment data for the first quarter of 2008.
193
Strategic Industrial Policy Incentive
100% deduction for equipment up to a threshold
The entire tax benefit was assumed to accrue to manufacturing.
61
Urban Development Zones
Accelerated depreciation allowed for investments in qualified zones
The benefit was allocated to sectors of major presence in these zones, in proportion to gross fixed capital formation in 2008, namely manufacturing, electricity, gas and water, construction, trade, transport and storage.
85
Note: (1) This column contains assumptions required in order to derive, from published figures (National Treasury, 2011: 181), an estimate of the portion of incentives attributed to the different economic sectors.
27
Appendix B
The 2008 Quantec RSA Social Accounting Matrix
One way of depicting the economy is the well‐known circular flow diagram which captures all transfers and real transactions between sectors and institutions. Productive activities purchase land, labour and capital inputs from the factor markets, and intermediate inputs from commodity markets, and use these to produce goods and services. These are supplemented by imports (M) and then sold through commodity markets to households (C), the government (G), investors (I), and foreigners (E). In the circular flow diagram, each institution's expenditure becomes another institution's income. In other words, all income and expenditure flows are accounted for, and there are no leakages from the system. A social accounting matrix (SAM) is also a representation of the economy. More specifically, it is an accounting framework that assigns numbers to the incomes and expenditures in the circular flow diagram. A SAM is laid out as a square matrix in which each row and column is called an "account." Figure A1 shows the 2008 Macro SAM of South Africa. Each cell in the matrix represents, by convention, a flow of funds from a column account to a row account. For example, the circular flow diagram shows private consumption spending as a flow of funds from households to commodity markets. In the SAM, it is entered in the household column and commodity row. The underlying principle of double‐entry accounting requires that, for each account in the SAM, total revenue equals total expenditure. This means that an account's row and column totals must be equal. The SAM distinguishes between "activities" and "commodities". Activities are the entities that produce goods and services, and commodities are those goods and services produced by activities. They are separated because sometimes an activity produces more than one kind of commodity (by‐products). Similarly, commodities can be produced by more than one kind of activity. The values in the activity accounts are usually measured in producer prices. Activities produce goods and services by combining the factors of production with intermediate inputs. This is shown in the activity column of the SAM, where activities pay factors the wages, rents and profits they generate during the production process (that is, value‐added). This is a payment from activities to factors, and so the value‐added entry in the SAM appears in the activity column and the factor row. Similarly, intermediate demand is a payment from activities to commodities. Adding together value‐added and intermediate demand gives gross output. The information on production technologies contained in the activity column is the input part of a typical "input‐output table", or factor and intermediate inputs per unit of output. Commodities are either supplied domestically or imported. Indirect sales taxes and import tariffs are paid on these commodities. This means that the values in the commodity accounts are measured at market prices. A number of economic entities purchase commodities. Activities buy commodities to be used as intermediate inputs for production. Final demand for commodities consists of household consumption spending, government consumption, or recurrent expenditure, gross capital formation or investment, and export demand. All of these sources of demand make up the commodity row. On their own, the commodity row
28
and column accounts are sometimes referred to as a "supply–use table", or the total supply of commodities and their different kinds of uses or demands. The Macro SAM in Figure A1 shows only single activity and commodity rows and columns. The Macro SAM is disaggregated into 49 activities producing 49 commodities to form the Micro SAM used in this paper. These categories are: Agriculture, forestry & fishing; Coal mining; Gold & uranium ore mining ; Other mining; Food; Beverages & tobacco; Textiles; Wearing apparel; Leather & leather products; Footwear; Wood & wood products; Paper & paper products; Printing, publishing & recorded media; Coke & refined petroleum products; Basic chemicals; Other chemicals & man‐made fibres; Rubber products; Plastic products; Glass & glass products; Non‐metallic minerals; Basic iron & steel; Basic non‐ferrous metals; Metal products excluding machinery; Machinery & equipment; Electrical machinery; Television, radio & communication equipment; Professional & scientific equipment; Motor vehicles, parts & accessories; Other transport equipment; Furniture; Other industries; Electricity, gas & steam; Water supply; Building construction; Wholesale & retail trade; Catering & accommodation services; Transport & storage; Communication; Finance & insurance; Business services; Medical, dental & other health & veterinary services; Community, social & personal services; Government: General administration; Government: Defence; Government: Law and order; Government: Education; Government: Health; Government: Social; Government: Economic. A SAM is different from an input–output matrix because it not only traces the income and expenditure flows of activities and commodities, but it also contains complete information on different institutional accounts, such as households and the government. Households are usually the ultimate owners of the factors of production, and so they receive the incomes earned by factors during the production process. They also receive transfer payments from the government and from the rest of the world. Households then pay taxes directly to the government and purchase commodities. The government receives transfer payments from the rest of the world. This is added to all of the different tax incomes to determine total government revenues. The government uses these revenues to pay for recurrent consumption spending and transfers to households. The difference between total revenues and expenditures is the fiscal surplus or deficit. According to the ex post accounting identity, investment or gross capital formation, which includes changes in stocks or inventories, must equal total savings. The difference between total domestic savings and total investment demand is total capital inflows from abroad, or what is called the current account balance. This is also equal to the difference between foreign exchange receipts and expenditures. Labour is disaggregated into four categories: semi‐ and unskilled, skilled, highly skilled and informal. Households are disaggregated into 14 categories using percentiles of the income spectrum. The rest of the world is disaggregated into 12 categories: Africa excluding SADC; SADC; NAFTA; South and Central America; Europe excluding EU; European Union; Eastern Asia; South‐central Asia; South‐Eastern Asia; Western Asia; Oceania and Not allocated.
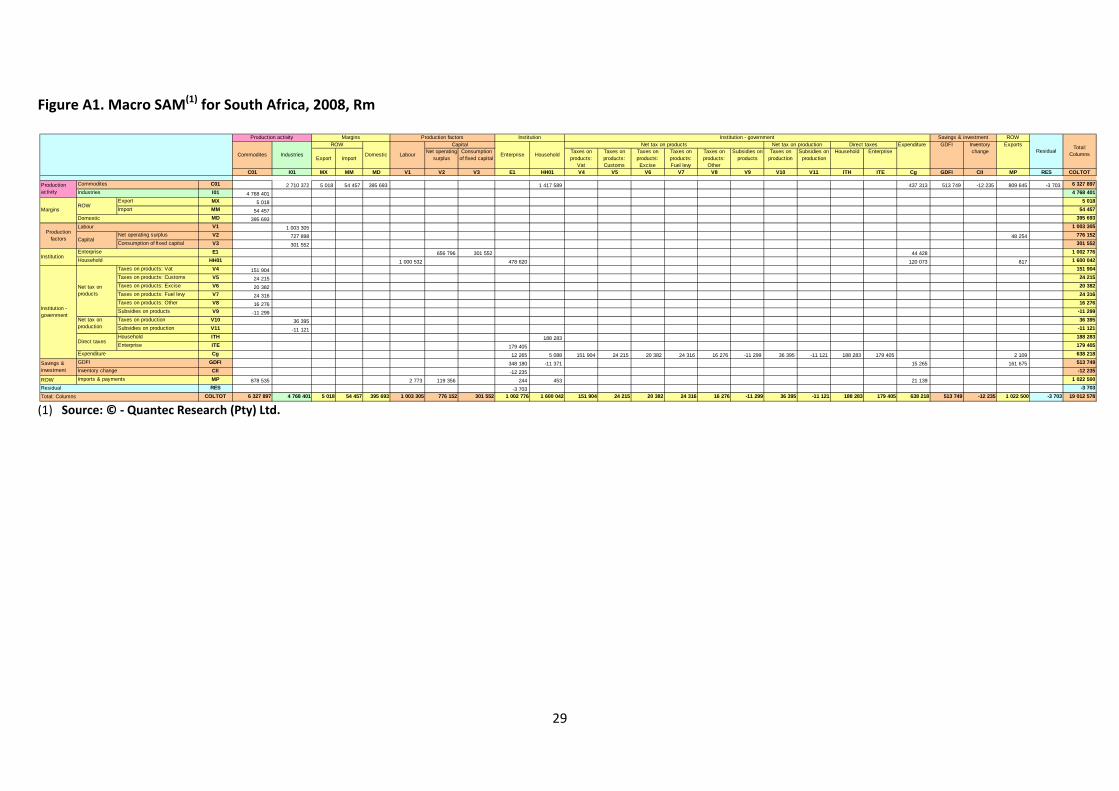
29
Figure A1. Macro SAM(1) for South Africa, 2008, Rm
(1) Source: © ‐ Quantec Research (Pty) Ltd.
ROW
Export ImportNet operating
surplusConsumption
of fixed capitalTaxes on products:
Vat
Taxes on products: Customs
Taxes on products: Excise
Taxes on products: Fuel levy
Taxes on products:
Other
Subsidies on products
Taxes on production
Subsidies on production
Household Enterprise
C01 I01 MX MM MD V1 V2 V3 E1 HH01 V4 V5 V6 V7 V8 V9 V10 V11 ITH ITE Cg GDFI CII MP RES COLTOT
C01 2 710 372 5 018 54 457 395 693 1 417 589 437 313 513 749 -12 235 809 645 -3 703 6 327 897
I01 4 768 401 4 768 401
Export MX 5 018 5 018
Import MM 54 457 54 457
MD 395 693 395 693
V1 1 003 305 1 003 305
Net operating surplus V2 727 898 48 254 776 152
Consumption of fixed capital V3 301 552 301 552
E1 656 796 301 552 44 428 1 002 776
HH01 1 000 532 478 620 120 073 817 1 600 042
Taxes on products: Vat V4 151 904 151 904
Taxes on products: Customs V5 24 215 24 215
Taxes on products: Excise V6 20 382 20 382
Taxes on products: Fuel levy V7 24 316 24 316
Taxes on products: Other V8 16 276 16 276
Subsidies on products V9 -11 299 -11 299
Taxes on production V10 36 395 36 395
Subsidies on production V11 -11 121 -11 121
Household ITH 188 283 188 283
Enterprise ITE 179 405 179 405
Cg 12 265 5 088 151 904 24 215 20 382 24 316 16 276 -11 299 36 395 -11 121 188 283 179 405 2 109 638 218
GDFI 348 180 -11 371 15 265 161 675 513 749
CII -12 235 -12 235
ROW MP 878 535 2 773 119 356 244 453 21 139 1 022 500
RES -3 703 -3 703
COLTOT 6 327 897 4 768 401 5 018 54 457 395 693 1 003 305 776 152 301 552 1 002 776 1 600 042 151 904 24 215 20 382 24 316 16 276 -11 299 36 395 -11 121 188 283 179 405 638 218 513 749 -12 235 1 022 500 -3 703 19 012 578
ResidualTotal:
Columns
ROW Capital Net tax on products Net tax on production Direct taxes Expenditure GDFI Inventory change
Savings & investmentExports
Domestic Enterprise HouseholdLabour
Total: Columns
Production activity Margins
Domestic
Savings & investment
Commodites Industries
Capital
LabourProduction
factors
Institution - government
Net tax on products
Net tax on production
Direct taxes
Expenditure
Production activity
Commodites
Industries
MarginsROW
Institution - governmentProduction factors Institution
Residual
GDFI
Inventory change
Imports & payments
InstitutionHousehold
Enterprise