Effectiveness of Investment Incentives in Developing ... of Investment Incentives in Developing...
41
Effectiveness of Investment Incentives in Developing countries Evidence and Policy Implications Dr. Sebastian James The World Bank Group
Transcript of Effectiveness of Investment Incentives in Developing ... of Investment Incentives in Developing...

Effectiveness of Investment Incentives in Developing countries
Evidence and Policy Implications
Dr. Sebastian James
The World Bank Group

Plan of the Presentation
• The Incentives Framework
• The econometric evidence
– Current literature
– Investment Climate Department research
• The survey evidence
– Previous surveys
– Investment Climate Advisory’s surveys
• Incentives for Public Goods
• Cost of Incentives
• Political Economy
• Policy advice
2

Incentives and Tax - Project scope
This project studies incentives in 41 countries across 4 continents
3

• The Incentives Framework
• The econometric evidence
– Current literature
– Investment Climate Department research
• The survey evidence
– Previous surveys
– Investment Climate Advisory’s surveys
• Incentives for Public Goods
• Cost of Incentives
• Political Economy
• Policy advice
4
Plan of the Presentation

Tax Expenditures around the world
5 The cost of tax incentives are non-trivial in many countries including
the Caribbean
0.0%
1.0%
2.0%
3.0%
4.0%
5.0%
6.0%
7.0%
8.0%
9.0%
10.0%
Tax Expenditure as % of GDP

Prevalence of Tax Incentives around the World
6
Tax Incentives in one form or the other are prevalent in all regions of the
World
Number of
Countries Surveyed
Tax holiday/Tax exemption
Reduced Tax rate
Investment
allowance/Tax credit
R&D Tax Incentive
Super-deductions
SEZ/Free Zones/EPZ/Freepor
t
Discretionary
process
East Asia and Pacific 12 92% 75% 67% 83% 33% 92% 83%
Eastern Europe and Central Asia
16 88% 38% 25% 31% 0% 100% 38%
Latin America and the Caribbean
25 88% 32% 52% 12% 4% 72% 40%
Middle East and North Africa
15 80% 40% 13% 0% 0% 80% 40%
OECD 33 21% 36% 64% 76% 21% 67% 33%
South Asia 7 100% 43% 71% 29% 71% 71% 43%
Sub-Saharan Africa 45 78% 62% 78% 11% 18% 64% 82%

Incentives Framework
7
Revenue rise due to increased investment
Social benefits from increased investment
Indirect cost of incentives
Lost revenue from investments that would have been made anyway
> + +
The Benefits and Costs of an Incentive Policy
Social Benefits include cleaner environment,
better skills, better health, etc.

• The Incentives Framework
• The econometric evidence
– Current literature
– Investment Climate Department research
• The survey evidence
– Previous surveys
– Investment Climate Advisory’s surveys
• Incentives for Public Goods
• Cost of Incentives
• Political Economy
• Policy advice
8
Plan of the Presentation
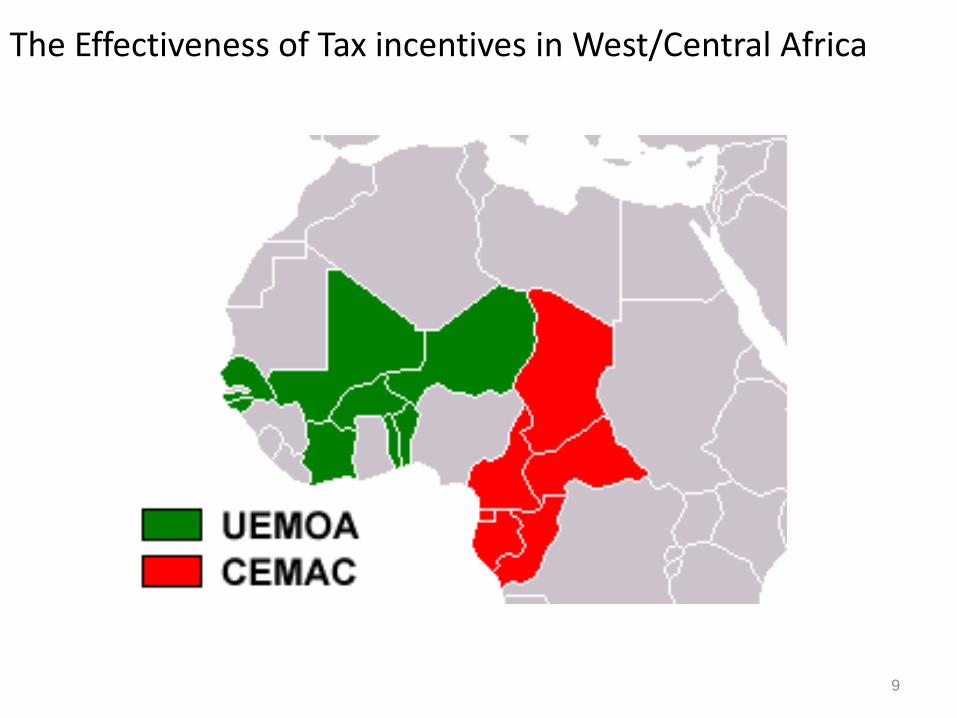
The Effectiveness of Tax incentives in West/Central Africa
9

0.2
.4.6
.81
0.2
.4.6
.81
0.2
.4.6
.81
-50
0
0
50
01
00
0-5
00
0
50
01
00
0-5
00
0
50
01
00
0
1995 2000 2005 1995 2000 2005 1995 2000 2005 1995 2000 2005
BEN BFA CAF CIV
CMR COG GAB MLI
NER SEN TCD TGO
FDI flow current USD change inv climate
FD
I flo
w c
urr
ent U
SD
year
Graphs by country_code
Source: James and Van Parys, 2009 10
Impact of Investment Code on FDI

Finding in UMEOA/CEMAC Case Study
11
General Tax Holiday Investment
Export Tax Holiday Investment
Complexity Incentives Investment
Legal Guarantees Investment
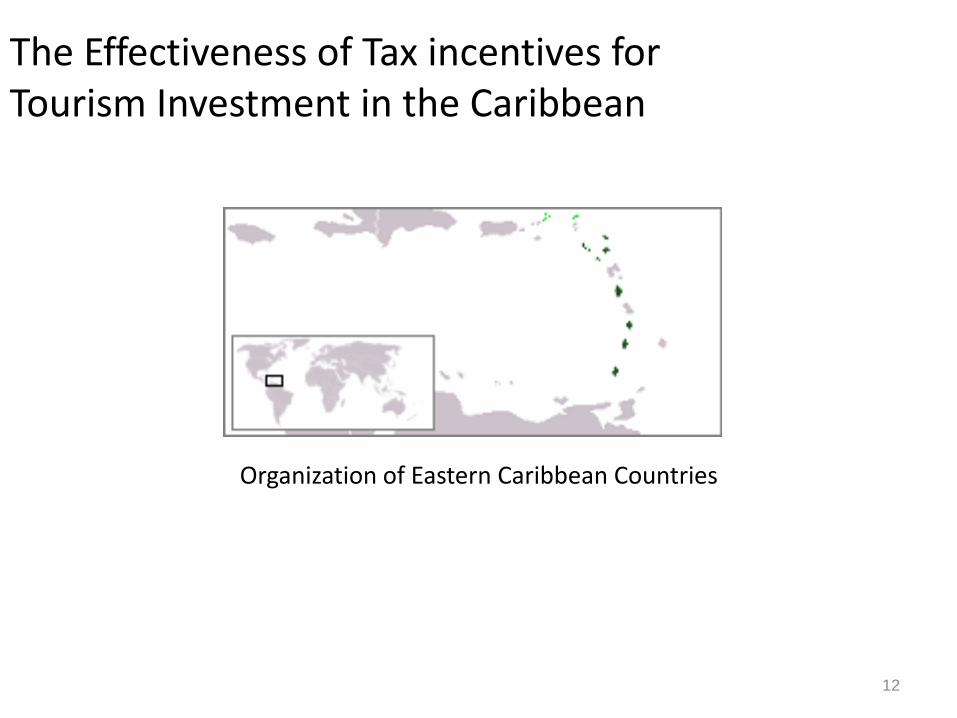
Organization of Eastern Caribbean Countries
12
The Effectiveness of Tax incentives for Tourism Investment in the Caribbean

FDI inflows into the Caribbean
13
0
10
20
30
40
50
60
1997 1998 1999 2000 2001 2002 2003 2004 2005 2006 2007 2008 2009 2010 2011 2012 2013
% o
f G
DP
FDI in OECS Countries (% of GDP)
Anguilla
Antigua and Barbuda
Dominica
Grenada
Montserrat
Saint Kitts and Nevis
Saint Lucia
Saint Vincent and the Grenadines
When Antigua increased the tax holiday from 5 years to 25 years in 2003 investments responded.
However was this investment taken away from other countries ?

14
AUS
AUT
BEL
BWA
BGR
CANCHL
DNK
FJI
FINFRA
GEO
DEU
HKGHUN
ISL
IRL
JAM
JPNKOR
LVA
MYSMUS
MEX
NLD
NZLNOR
PER
PRT
ROM
SGP
SVK
ZAF
ESPSWE
CHE
THATUR
GBR
USAARG
BGDBOLBRA
TCD
CHN
CRI
HRV
CZE
ECUETH
GHA
GRCINDIDN
IRN
ITA
KAZ
JOR
KEN
LSO
MDG
MARNGA PAK
POLRUS
RWA
SRB
SLE
VNM
TUNUGA
UKR
EGY
TZA
UZB
ZMB
010
20
30
FD
I as %
of
GD
P
-20 0 20 40 60METR
High IC countries Low IC Countries
Trend High IC countries Trend Low IC Countries
Fiscal Policy Effectiveness and the Investment Climate
Almost no impact of lowering Effective Tax Rates on FDI in low IC countries
Source: James and Van Parys, 2009

Top inbound and outbound FDI Average FDI
inbound (% of GDP) (2003-2012)
Average FDI outbound (% of GDP)
(2003-2012)
British Virgin Islands 3564.3 British Virgin Islands 3613.5
Cayman Islands 412.3 Cayman Islands 266.7
Marshall Islands 113.5 Cook Islands 137.1
Liberia 38.8 Liberia 51.2
Luxembourg 28.1 Luxembourg 32.1
Anguilla 26.7 China, Hong Kong SAR 27.7
China, Hong Kong SAR 26.4 Belgium 13.4
Congo 21.3 Panama 11.3
Montenegro 20.6 Marshall Islands 10.3
Mongolia 19.2 Singapore 10.2
Singapore 19.1 Iceland 10.0
Sao Tome and Principe 18.0 Switzerland 9.6
Saint Kitts and Nevis 17.9 Netherlands 7.9
Belgium 15.6 Ireland 7.2
Antigua and Barbuda 15.3 Sweden 6.4
15

• The Incentives Framework
• The econometric evidence
– Current literature
– Investment Climate Department research
• The survey evidence
– Previous surveys
– Investment Climate Advisory’s surveys
• Incentives for Public Goods
• Cost of Incentives
• Political Economy
• Policy advice
16
Plan of the Presentation

Investor Motivations to Invest
17
*: Open-ended question, multiple answers possible **: Number of businesses surveyed in respective countries; ***: Includes ease of import/export, employing labor , etc. Source: Investment Climate Department, 2009
14
16
38
Political stability
Little competition
Domestic market
Mozambique – 60 total respondents**
23
25
31
Domestic market
Political stability and security
Investment climate***
Jordan – 61 respondents
Survey asked about three most critical factors for investment decisions* (Answer in Percent)
18
33
37
Personal resons
Skilled and competititvely …
Investment climate
Serbia – 50 total respondents
32
35
77
Attractiveness of incentives
Labor cost
Investment climate
Nicaragua – 71 respondents

Investors who would NOT have invested without tax Incentives
18
0%
10%
20%
30%
40%
50%
60%
70%
80%
90%
100%
Jordan Mozambique Serbia Kenya Nicaragua
Non-Exporters
Exporters

US Outbound FDI and METR in host countries
19
ARGAUSAUT
BEL
BRA
CAN
CHE
CHL
CHN COL
CRI
CZE
DEUDNK
ECU
ESP
FINFRA
GBR
GRC
HKG
HUN
IDN IND
IRL
ISR
ITA JPN
LUX
MEX
MYS
NLD
NORPHLPOL
PRT RUSSAU
SGP
SWE
THA
TUR
VEN
ZAF ARG
AUS
AUTBEL
CAN
CHN
COL
CRICZE DEUDNKECU
ESPFIN FRAGBR
GRCHKG
IDN
ISR ITA JPN
MEX
MYS
NLD
NOR
PHL RUSSAUSGP
SWETHATUR VENZAF05
1015
0 10 20 30 40METR
manufacturing as a % of GDP mining as a % of GDP
Fitted values Fitted values
FDI in Manufacturing responds significantly but not FDI in mining which
depends on the availability of the resource

Typology of FDI and response to Tax Incentives
20
Type of Investment
Factors that drive it Response to investment incentives
Natural Resource/Skill-seeking FDI
Location of Natural Resources/Skills Low response. FDI driven primarily by non-tax factors.
Market-seeking FDI
Market potential - Market dimensions - Income per-capita - Customer specific preferences - Kind of goods and services to be
provided
Low response. Level playing field between firms is critical (same tax system for all competitors).
Strategic Asset-seeking FDI
Acquiring Strategic Assets - Brands and Market positioning - Know-how - Technology - Distribution Networks - Human Capital
Low response. FDI is driven by the location of the asset. However lower taxes on capital gains reduces the costs of the transfer of these assets.
Efficiency-seeking FDI
Lower Costs - Mostly export oriented - Availability of skills at a Low
cost skills - Close to markets - Low relocation costs
High response to tax incentives. Firms are expected to compete globally, hence the lower the costs, the better their ability to compete globally.

Results from Surveys
21
Author Focus of survey Conclusion Did incentives influence Investment level? (% saying yes)
Investment Climate Advisory (FIAS)—investor motivation surveys
Malaysia (2014) Redundancy ratio for incentives (Would have invested even if Incentives were not provided)
81% 33% Guinea (2012) 92% 6% Jordan (2009) 70% 28% Kenya (2012) 61% 11% El Salvador (2013) 37% 13%
Nicaragua (2009) 15% (51% for non-exporting firms
outside free zones)
17%
Serbia (2009) 71% 6% Tanzania (2011) 91% 8% Tunisia (2012) 58% 25%
FIAS Vietnam (2004) 85% - FIAS Thailand (1999) 81% - Nathan Associates Mozambique (2009) 78% 13% Guisinger and Associates (1985) Investment incentives and
performance requirements for export-oriented firms
33%
Reuber (1973) FDI and market orientation 52% for export-oriented firms
Mckinsey—MNE investment in developing economies (2003)
Business process outsourcing (BPO) and automobile sectors in India (2003)
Incentives not among top 3 factors driving location decisions
Fortune/Deloitte and Touche (1997)
Business location study Taxes ranked 13th of 26 factors in importance for investments
G–30 (1984) Study of 52 multinational corporations covering half of world’s FDI stock
Incentives ranked 7th in importance for investments
• The Incentives Framework
• The econometric evidence
– Current literature
– Investment Climate Department research
• The survey evidence
– Previous surveys
– Investment Climate Advisory’s surveys
• Incentives and Public Goods
• Cost of Incentives
• Political Economy
• Policy advice
22
Plan of the Presentation
Incentives and Public Goods
• Investment incentives are recommended when
– investment assets available to general public • This is just another way to pay for public goods
– investments generate positive externalities • Encouraging Green Technologies
• Upgrading skills of workers
• Anchor investments (slippery slope but have to be justified)
23 *: First best is to tackle the tax competition issue

Tax competition • Race to the bottom
– Evidence shows that countries compete
• by lowering tax rates
• by providing more attractive tax holidays (Klemm and Van Parys, 2009)
– Thought this cannot be extended to other kinds of tax incentives
– Fighting off one country with the other is part of a strategy followed by some private sector • However, in many cases the final choice is already made
– ‘Winning’ countries in many cases suffer from the winners curse/buyers remorse, having given up too much
– Only a coordinated response could avoid such a race to the bottom (Ex. agree on common minimum criteria)
• There is also evidence of a race to the top !
24

More Regional Coordination/Harmonization of tax systems
Countries need to avoid HARMFUL TAX COMPETITION
There are several degrees of Tax Harmonization
Does not mean that all the taxes should be the same
Countries could agree to coordinate (EAC pre-budget
meeting of Finance Ministers)
Countries could agree on a Code of Conduct
Countries could define Rules (that can be enforced)
on the use of Tax Incentives (EU State Aid Rules)
Fiscal Union (common tax base and rates across the
union)
Lessons learned on harmonizing tax incentives
• The key to success is not to be too ambitious
• Provide list of prohibited tax incentives (example, Countries shall not offer Tax Holidays longer than 10 years)
• Provide reasonable exceptions to the general strict rule of full harmonization
• Have an enforcement mechanism

• The Incentives Framework
• The econometric evidence
– Current literature
– Investment Climate Department research
• The survey evidence
– Previous surveys
– Investment Climate Advisory’s surveys
• Incentives and Public Goods
• Cost of Incentives
• Political Economy
• Policy advice
27
Plan of the Presentation

Cost of Incentives
28
Distortion costs
Time and money spent by businesses to lobby
the government for incentives
Time and money spent by businesses to qualify
for and receive tax incentives
Revenue lost to illegal activity
Additional costs for tax authorities responsible
for administering tax incentives

Percent
Mozambique (60 respondents)
Jordan (61 respondents)
Serbia (50 respondents)
Nicaragua (71 respondents)
Did obtaining incentives delay project implementation?
20% by 2–12 months 1% by more than 1 year
Did obtaining incentives add to project costs?
What were the main additional costs?
Additional senior management time: 18% Loss of business: 15%
Not an issue Additional senior management time : 6% Additional consulting fees: 12%
Additional senior management time: 26% Legal fees: 24% Loss of business: 17% 29
78
22%
Response
10% by 1–3 months 8% by 3–6 months
82
18
Response
8% by 3–6 months 2% by 18 months or more
72
27
Response
98
2
Response
72
28%
Response
98
5
Response
80
20
Response
87
13
Response
Costs of obtaining incentives

Cost v. Benefit of Tax Incentives - Jobs
Country Surveyed Marginal Investors as a
% of total Investors
Jobs Created by Marginal Investors as a % of total jobs created
(%) Jobs by Marginal Investors – (%) of Marginal
Investors
Burundi 23% 19% -4%
Guinea 8% 13% 5%
Jordan 30% 21% -9%
Kenya 39% 42% 3%
Mozambique 22% 15% -7%
Rwanda 2% 1% -1%
Serbia 29% 31% 2%
Tanzania 9% 16% 7%
Thailand 19% - -
Tunisia 42% 35% -7%
Uganda 7% 7% 0%
30
Tax given up per job created – El Salvador ($2084); Tunisia ($18,487); Yemen
($5819)

• The Incentives Framework
• The econometric evidence
– Current literature
– Investment Climate Department research
• The survey evidence
– Previous surveys
– Investment Climate Advisory’s surveys
• Incentives and Public Goods
• Cost of Incentives
• Political Economy
• Policy advice
31
Plan of the Presentation

Political Economy of Incentives
32
Discretionary Incentives popular
with politicians
Incentives have non-transparent costs
Role of Governance Bargaining for
Incentives

How to tackle Political Economy of Tax Incentives
• Increase Transparency – Measure the cost of Incentives (Tax Expenditure Statements)
– This allows the costs to be scrutinized by the public
– Place a budget on tax incentives
• Reduce Discretion – Replace discretionary Incentives with those that flows out of the Tax
Code
– This ensures the role of the legislature
– Even if a ‘big’ deal has to be given tax incentives ensure that criteria is defined
• Tighten administration – Reduce leakage on the usage of Tax Incentives (filing of tax returns)
• Periodically study the effectiveness – This allow the public to see for themselves if incentives work
33

• The Incentives Framework
• The econometric evidence
– Current literature
– Investment Climate Department research
• The survey evidence
– Previous surveys
– Investment Climate Advisory’s surveys
• Incentives and Public Goods
• Cost of Incentives
• Political Economy
• Policy advice
34
Plan of the Presentation

Principles of Transparency of Tax Incentives
• Make public a statement of fiscal policy objectives outlining policies of the Government in the medium term and the short term relating to taxation, expenditure, market borrowing and other liabilities, lending and investments and the key fiscal measures;
• Consolidate all the tax incentives that are provided either through the tax laws or otherwise
• Calculate the amount of revenue losses attributable to Tax Incentives, in a yearly Statement of Tax Expenditures.
• The Statement of Tax Expenditure shall include the largest beneficiaries of the tax incentives by individual taxpayer, sector, by specific tax provision and other criteria as required
• The Government shall grant tax incentives in accordance with a comprehensive policy on tax incentives, which shall lay down principles and policies for introduction or continuation of a tax incentive.
35

• The Government shall carry out periodic review of the continuance of existing tax incentives by assessing the extent to which the tax incentives could meet the stated objectives
• Tax incentives may be provided only through laws ratified through the
law making body or Parliament • Tax Incentives once provided need to be administered in a transparent
manner • The government shall set up a mechanism for periodic data collection,
which shall be used to prepare the Statement of Tax Expenditure. • Governments shall make commitments through regional agreements to
avoid harmful tax competition
36

Policy questions to ask on new Incentives • Would the Investment Come in anyway?
• Would the Tax Incentive put existing businesses at a disadvantage?
• Would the Investment realize tax revenues after the tax incentives are exhausted?
• Does the Investment provide positive externalities?
– Direct Jobs
– New Technology/Skill up gradation
– Import substitution
– Infrastructure/Public Goods
– New Industry
– Spur Ancillary Industries
• Does the Tax Incentive create opportunities for Tax Evasion?
• Does the Investment cause negative externalities such as pollution?
• Would this result in increasing demand for Incentives by other Investors?
37
In general, few investments satisfy most or all of these criteria. The goal of the
Government should be to improve the investment climate and make it conducive
for businesses to invest and reduce their costs and make the return profitable. It
may be necessary for the government to take a look at the competitiveness of the
overall tax system rather than use tax incentives in specific cases to achieve the
same end.

Use Better Instruments • Use Investment linked Tax incentives rather than
Tax Holidays
• If using Tax Holidays use at least partial tax holidays (i.e. 50% tax exemption rather than 100%)
• VAT incentives are redundant if the system works well
• Re-design customs incentives by product rather than by use
• Use minimum taxes
38

Tax Policy for SEZs • Many countries use SEZs as a means to encourage investments especially export
oriented investments • Investments inside the SEZ are at an advantage due to the better infrastructure
and simplified procedures (especially for border taxes and regulations) • Special tax treatment especially with respect to income tax, for investments inside
SEZs create an uneven playing field between investment inside the SEZs and those outside and may result in:- – Loss of competitiveness of investments made outside SEZs and resulting loss
of investment and jobs; – Pressure to relocate investments from outside the SEZs to inside it to take
advantage of the lower tax; – Resulting in loss of tax revenue because of investments now paying lower
amount of tax after relocation with little additional investment; – Potential for tax evasion by artificially shifting profits for units outside the SEZs
to those inside to take advantage of the lower tax; – Higher complexity of tax administration as a result of the tax incentives as well
as higher cost of compliance both for business inside the SEZs and outside; • It is recommended that the Income Tax regime should be the same for all
investments whether inside the SEZ or outside. • If any tax incentives are provided for investments inside the SEZs they should be
also be made available for investments outside the SEZ
39

Questions
40

Thank You. [email protected]