
The impact of changing lead-time on inbound logistics...
85
The impact of changing lead-time on inbound logistics performance in a global supply chain A case study based on Volvo Powertrain Corporation Master of Science Thesis [in the Master Degree Program, Supply Chain Management] MILEN MÄE RÜNNO OHNO Department of Technology Management and Economics Division of Logistics and Transportation CHALMERS UNIVERSITY OF TECHNOLOGY Göteborg, Sweden, 2012 Report No. E2012:098
Transcript of The impact of changing lead-time on inbound logistics...

The impact of changing lead-time on inbound
logistics performance in a global supply chain
A case study based on Volvo Powertrain Corporation
Master of Science Thesis [in the Master Degree Program, Supply Chain
Management]
MILEN MÄE
RÜNNO OHNO
Department of Technology Management and Economics
Division of Logistics and Transportation
CHALMERS UNIVERSITY OF TECHNOLOGY
Göteborg, Sweden, 2012
Report No. E2012:098

II
The impact of changing lead-time on inbound logistics performance in
a global supply chain
A case study based on Volvo Powertrain Corporation
MILEN MÄE, RÜNNO OHNO
© MILEN MÄE, RÜNNO OHNO, 2012.
Report no E2012:098
Department of Technology Management and Economics
Division of Logistics and Transportation
Chalmers University of Technology
SE-412 96 Göteborg
Sweden
Telephone + 46 (0)31-772 1000
Chalmers Reproservice
Göteborg, Sweden 2012

III
Abstract
Background and problem discussion: Global competition and market uncertainty has
resulted in many companies having international operations and thereby complex logistics
networks. In these circumstances there is a continuous need to increase efficiency in order to
maintain profitability. Latter leads to cost reduction and removal of the waste and slacks.
Meanwhile there is a need to secure some supply chain flexibility in order to react to the fast
changing customer requirements in circumstances of low brand loyalty. The focal company of
this thesis has developed a set of logistics rules to cope with the challenges of the described
business environment. One of these rules, 3 Day Rule, sets a fixed frame for delivery lead
time. From a company’s production perspective there are several benefits coming from this
rule, but its rigidness and validity has been questioned by concerned parties who were not
involved in the creation of this rule.
Purpose: To find out how the changing lead time is influencing production, purchasing and
logistics performance and thereby overall efficiency of inbound logistics process.
Methodology: The research for this thesis began with a literature overview related to the
subject, after which a single case study was conducted in the focal company. The study has
been done dwelled upon the positivistic and deductive method. The analysis has been based
on qualitative data from personal and telephone interviews done at the case study company.
Additional information has been collected from e-mails, company documents and
presentations.
Results: Based on theoretical and empirical findings there have been defined the most
influential factors related to the lead time changes. For production these are costs of
ownership and flexibility. These factors are positively affected by the rule and further
reduction of the lead time requirement.
For purchasing it is most beneficial when goods are picked up from the suppliers’ site. This
due to the product cost will be separated from the logistics costs. Purchasers are measured by
their ability to continuously lower the cost of the products and what gets measured gets done.

IV
The factor for logistics service provider influenced mostly by the lead time rule is the control
of the supply chain. What logisticians believe, is that the actor most capable of arranging
supply chain flow efficiently should be in charge of doing it. Unfortunately, while the rule is
applied, this is not always the case.
From more general perspective, the total cost of an acquisition, which is important for all the
actors involved, is dependent upon the input from purchasing and logistics service providers
work and cannot be directly related to the lead time reduction setup.
Suggestions: It would be beneficial for the focal company to develop a process to define the
most appropriate reaction time and logistics setup, according to specifications of product
category. This work could be done within a cross-functional team that could develop optimal
solutions and probably inspire other employees to commit.

V
Acknowledgements
While working with this thesis there have been confusion, challenges and exciting discoveries.
It has been very interesting and useful to dedicate the investigation to various functions
involved in inbound logistics activities. We have not only found out how different lead time
setups are affecting logistics performance, but also realized how complex working in one
global company can be. Furthermore, we have become aware of that people should make an
effort to work towards common goals and not only sub-optimizing the achievements of one
function.
We would like to thank the people who were involved in helping us during the development of
this thesis. Without them it would have been impossible for us to gain all this knowledge -
starting with Volvo Powertrain Corporations friendly employees who were willing to invest
their time for answering our questions and supporting us with finding the needed data.
Particularly we would like to thank our supervisor in the company, Julie Maes. She has been
helpful from the first steps of the research development by assisting us from the topics
definition until the assessment of the final piece. This guidance has been both valuable and
motivating for us.
We are also very grateful to our supervisor Paulina Rosenberg, at Chalmers University of
Technology, who has given useful feedback and encouraged us during the whole period of
writing from the scratch until the end. We appreciate all the hours she has put to read various
versions of drafts and commenting on them promptly. Additionally, we are thankful to our
examiner, Anna Fredriksson, and to our opponents, because the constructive appraisal helps
us to further improve our writing.
In the end we would like to say thanks to our families and all the friends who have supported
and cheered us during this period and to each other for great teamwork and inducement.
Gothenburg, 12.12.2012
Milen Mäe Rünno Ohno

Table of contents
Abstract .................................................................................................................................... III
Acknowledgements ................................................................................................................... V
Table of contents ...................................................................................................................... VI
List of figures ........................................................................................................................ VIII
List of tables ............................................................................................................................. IX
List of abbreviations .................................................................................................................. X
1. Introduction ............................................................................................................................ 1
1.1 Theoretical background .................................................................................................... 1
1.2 Empirical background ...................................................................................................... 3
1.3 Problem discussion ........................................................................................................... 4
1.4 Purpose ............................................................................................................................. 5
1.5 Project outline .................................................................................................................. 6
2. Methodology .......................................................................................................................... 7
2.1 Research philosophies ...................................................................................................... 7
2.2 Research approach ............................................................................................................ 7
2.3 Research methods ............................................................................................................. 8
2.4 Scope ................................................................................................................................ 8
2.5 Case study design ........................................................................................................... 10
2.6 Sampling ......................................................................................................................... 11
2.7 Data collection ................................................................................................................ 11
2.7.1 Interviews ................................................................................................................ 12
2.8 Data analysis method ..................................................................................................... 13
2.9 Quality of the research ................................................................................................... 14
2.9.1 Construct validity .................................................................................................... 14
2.9.2 Internal validity ....................................................................................................... 14
2.9.3 External validity ...................................................................................................... 14
2.9.4 Reliability ................................................................................................................ 14
2.10 Overview of the work process ...................................................................................... 15
3. Theoretical frame of reference ............................................................................................. 16
3.1 Delivery process ............................................................................................................. 16
3.2 Actors involved in delivery process ............................................................................... 17
3.3 Distribution systems in delivery process ........................................................................ 19
3.4 Lead time ........................................................................................................................ 20
3.5 Financial aspects of companies’ performance ............................................................... 22
3.6 Production perspective - matching cost efficiency and flexibility ................................. 24
3.7 Purchasing perspective – material availability at lower price ........................................ 27
3.8 Logistics perspective – supply chain efficiency ............................................................. 28
3.9 Conclusion of the theory ................................................................................................ 30
4. Focal company presentation ................................................................................................. 33
4.1 Volvo Group ................................................................................................................... 33
4.2 General priority of Volvo Group to reduce the inventory .............................................. 34
4.3 Rules of logistics ............................................................................................................ 34
4.4 Background of the 3DR rule .......................................................................................... 35
4.5 Volvo Powertrain ........................................................................................................... 36
4.6 Volvo Production System. Cost efficient approach of Volvo Group Production .......... 36
4.7 VPT Production. Factory in Skövde .............................................................................. 37
4.8 VPT Purchasing .............................................................................................................. 38

VII
4.9 Volvo Logistics .............................................................................................................. 38
5. Empirical findings and analysis ........................................................................................... 39
5.1 Production perspective - ownership ............................................................................... 39
5.2 Production perspective - flexibility ................................................................................ 40
5.3 Purchasing perspective - product cost ............................................................................ 42
5.4 Logistics perspective - supply chain control .................................................................. 44
5.5 General perspective - acquisition cost ............................................................................ 45
5.6 Conclusion of the findings. Main interests influenced by lead time changes ................ 47
6. Discussion ............................................................................................................................ 49
6.1 Background of the 3DR .................................................................................................. 49
6.2. Production perspective – ownership ............................................................................. 51
6.3. Production perspective - flexibility ............................................................................... 53
6.4 Purchasing perspective – product cost ........................................................................... 55
6.5 Logistics perspective – supply chain control ................................................................. 57
6.6 General perspective - acquisition cost ............................................................................ 58
7. Summary .............................................................................................................................. 61
7.1 How has the impact of 3DR evolved in time? ............................................................... 61
7.2 How is the changing lead time impacting the performance from production, purchasing,
logistics and general perspective? ........................................................................................ 62
8. Implications .......................................................................................................................... 64
8.1 Implications for VPT ...................................................................................................... 64
8.2 General implications ...................................................................................................... 65
8.3 Suggestions for further research ..................................................................................... 66
9. Sensitivity analysis ............................................................................................................... 68
10. Conclusion .......................................................................................................................... 70
List of references ...................................................................................................................... 71
Books .................................................................................................................................... 71
Articles ................................................................................................................................. 72
Documents and presentations ............................................................................................... 73
Interviews ............................................................................................................................. 74
Web pages ............................................................................................................................ 74

VIII
List of figures
Figure 1: Scope of the study
Figure 2: Work process
Figure 3: Porter’s generic value chain, Porter, 1985 p 13
Figure 4: FCA free carrier, Incoterms, 2010
Figure 5: Distribution systems in delivery process, adapted from Lumsden 2007
Figure 6: Lead time gap, Christopher, 2008 p. 160
Figure 7: Forecast error, Christopher, 2008 p. 149
Figure 8: Inventory profile of the automotive supply chain, Christopher, 2008 p. 36
Figure 9: The de-coupling point, Christopher, 2001
Figure 10: Contingency Approach to Supply Chain Strategy Choice, Christopher, 2001
Figure 11: Shipment Consolidation Configurations, adapted from Ulku, 2009
Figure 12: Possible PuP setups
Figure 13: The Volvo Group organization, Volvo Homepage, 2011
Figure 14: Recommended process for defining the inbound logistics flow

IX
List of tables
Table 1: Overview of interviews
Table 2: Summary of the research methodology
Table 3: Summary of the main interests and drivers for different departments
Table 4: Influence of lead time changes

X
List of abbreviations
3DR 3 Day Rule
JIT Just in Time
KPI Key Performance Indicator
LSP Logistics Service Provider
PUP Pick up Point
TAC Total Acquisition Cost
TCO Total Cost of Ownership
TPS Toyota Production System
VLC Volvo Logistics Corporation
VPS Volvo Production System
VPT Volvo Powertrain Corporation

1
1. Introduction
In the following section of the thesis the background of the problem and its importance are
introduced. Furthermore, the topic is discussed and the purpose of the research is stated. The
chapter ends with a description of the scope and limitations in this work.
1.1 Theoretical background
A number of today’s companies have created global strategies to source raw materials,
components and labor from low-cost countries (Ballou, 2004; Bowersox, 2010), which are
often located far from the countries where they will be used. This means that they can have
more options for selecting supplies and negotiate lower piece prices. By that they hope to
achieve competitive advantages (Coyle, 2003) and secure supply sources (Waters, 2011).
Common business strategies influencing global operations are, for example, aiming for
economies of scale by optimization of manufacturing size or cross-border mergers spreading
operations over a large number of countries (Waters, 2011). According to the World Trade
Organization world trade is growing faster than the gross national product in most countries
and most probably will continue to do so for the predictable future (Christopher, 2008)
Thereby, the complexity and expansion of companies keeps increasing continuously as well.
The main challenges resulting from globalization are longer supply lead times, unreliable
transit times, various consolidation possibilities and a number of transportation mode as well
as cost options (Bowersox, 2010). There are a number of reasons causing these challenges
according to Bowersox (2010) such as financial requirements, need for special packaging,
ocean freight scheduling and customs clearance. Moreover he states that supply chains
become less consistent and flexible because of longer supply lead times. Accordingly
planning and coordination of the material flow becomes a demanding task.
The increased distance from suppliers and complexity of logistics in global companies tends
to create longer order lead times and higher inventory levels. Meanwhile in companies that
practice cost efficient philosophies the goal is to move towards reduced lead times and
elimination of excess stock levels. Therefore it creates a challenging task for the logistics to
accomplish both goals. (Rushton et. al, 2006) It has to be considered carefully whether the
benefits gained by long distance sourcing go beyond the challenges caused by it.

2
One of the key business considerations for companies is reaching a balance between supply
and demand (Christopher, 2008) and thereby increasing its profitability. Thus, for optimizing
the performance of the supply chain, product availability has to be met exactly with the
customer requirements. As Lysons (2007) suggests, an important concern in the interest of
supply chain optimization is inventory management. Even though the current developments
like JIT and cost efficient principles are against holding inventory (Waters, 2011), there exists
plenty of reasons for carrying inventory. For example, to lower the risk of supplier failure,
lead time uncertainty, meeting the sudden changes in demand and hedging against foreseen
shortages and price fluctuations (Lysons, 2007). Hereby it could be said that there exist, both,
benefits and disadvantages in holding inventory – from one hand it protects companies against
unforeseen fluctuations in supply and demand, but from the other hand inventories require
high capital involvement, which reduces the financial efficiency.
As described in the previous section, cost efficient approach is more focused on cutting the
expenses and might not always take into consideration the uncertainties that occur in the
supply chain. A somewhat contrasting approach to cost efficient is responsive strategy, which
instead considers flexibility by having buffers and overcapacity, rather than costs concerning
the supply chain. Ignoring the need for responsiveness could lead to cost of stock-outs, which
causes loss of production, idle time of workforce and machines, cost of action taken to
overcome the stock-out and possible loss of customer goodwill (Waters, 2011). Unfortunately
the latter costs are often hidden and hard to estimate, which makes them also difficult to
compare adequately with inventory holding costs. (Lysons, 2007)The above described
situation implies that all the cost drivers should be made clear and considered while planning
inbound logistics operations. The key would be finding the balance between being cost
efficient meanwhile securing necessary responsiveness.
From a theoretical perspective this means looking for opportunities to combine previously
mentioned cost efficient and responsive approaches, in order to compromise between costs
and responsiveness (Christopher, 2000). Christopher (2008) further explains that in today’s
demanding business conditions there is a need to have several supply chain designs, rather
than “one size fits all” solution. He recommends defining the suitable logistics setup based on
the supply and demand characteristics of the product. Thus, after defining the need for
responsiveness, sourcing should compare the various options for finding the solution with the
lowest landed cost to increase the value for final customer. Hereby, the landed cost represents

3
the total cost for acquiring the goods which includes the product price, logistics cost, capital
cost, insurance, taxes etc.
To summarize the theoretical background, the main issues are listed below:
Globalization
Cost efficiency
JIT
Waste reduction
Responsiveness
Uncertainty
Customer satisfaction
Balance between costs and flexibility?
1.2 Empirical background
One example of a global company facing the challenges of tied up capital reduction, while
trying to keep the flexibility in supply chain, is Volvo Powertrain (VPT), part of Volvo
Group. VPT is responsible for the development and production of heavy engines, gearboxes
and drive-shafts. The manufacturing plants for VPT are located in Sweden, France, USA,
Brazil and Japan. (Volvo Group, 2011b) The process of changing from mostly regional to
global sourcing begun at the company in late 90’s up to early 2000, when Volvo Group was
established. During this period they acquired also Renault and Mack Trucks. (Rostén, 2012)
Hence, the complexity of Volvo Groups supply chain, including VPT, has grown notably and
continues in that direction.
At present, Volvo Group is in a situation where the product variety is high and demand
uncertainty causes large levels of inventory (Nygren, 2012). According to Christopher (2008)
the largest cost element of holding inventory is considered to be the cost of capital tied up.
Hence, one possibility to improve company’s financial performance by reducing the cost of
capital is to reduce the amount of its inventories. It has been stressed at top-management level
that capital currently tied up in inventory should be used more efficiently in Volvo Group. In
order to release this money, an inventory reduction program is introduced in VPT with the
goal to decrease stock levels at an average of 50% in all of their plants. (Nygren A., 2012)

4
Volvo Production System (VPS) impacts VPT purchasing by requiring further developed
cross-functional collaboration with the company’s other departments such as production and
logistics (Linsolas, 2009). Having the increasing need for collaboration and the growing
complexity of the logistics flows in mind, five logistics rules have been applied in order to
make the cooperation between functions simplified and sourcing decisions based on the same
facts. One of these rules, the “3 days” rule (3DR), sets fixed requirements on the lead time for
all the suppliers. This rule states that: “In order to meet flexibility and cash flow requests
while optimizing lowest total cost the suppliers must take full responsibility and ownership to
deliver from a pick up point (PUP) meeting lead-time requirements”. The current lead time
requirements are as follows: For batch supply the suppliers’ PuPs must be within 3 days of
normal transport time for all Volvo plants. A suitable material supply strategy for the supplier
has to be selected and if necessary Logistics Service Provider (LSP) should be contracted
(Hellner, 2011). Therefore it is interesting to see how fixed lead time requirement, like the
3DR in VPT is influencing responsiveness and cost efficiency of inbound logistics and could
it be feasible solution to have it even though it is somewhat contradictory to the theory
according to Christopher (2001).
To summarize the empirical background, the main issues are listed below:
Volvo Powertrain
High product variety
High demand uncertainty
High inventory levels
High amount of tied up capital
3 day rule
Supplier takes full responsibility and ownership to deliver to a Pick-up-Point
Pick-up-Point must be located within 3 days from Volvo Plant
1.3 Problem discussion
In the context of growing globalization, which increases the competition among companies
and makes the supply chains more complex, it is vital to understand how this dynamic
business environment might change the requirements for delivery speed and flexibility.
It is generally known that speed and flexibility – responsiveness – for global supply chain
always comes with a certain price, which is reflected either in logistics or purchasing cost.

5
Latter states that in order to accomplish the overall profitability of the company various
departments have to take the cost, which is often a trade-off between the sub-interests of those
departments. Because of that, there exists an attitude of shifting cost between different units
within company’s boarders (Lysons, 2007), which results in different functions like
purchasing, production and logistics trying to reduce their direct cost while it might not be
economic for the company as whole. As stated in Lysons (2007) the problem lies in so called
“silo” mindsets, which focuses on sub optimizing the performance of one unit and thereby
could be reducing the efficiency of the complete system itself. This issue has been often
addressed in literature related to organizational behavior studies, expressing how important it
is to have people in the company working together within cross-functional teams, with
cohesive performance measurement systems, in order to achieve business excellence.
One common problem rising from making trade-offs in global companies, like VPT, is that
different departments have incompatible measurement systems and do not share a common
vision (Lysons, 2007). For instance, from purchasing viewpoint the product piece price is
important key performance indicator (KPI), but the cost efficiency should not be achieved by
lowering the supply chain flexibility and customer service. In that context it would be
valuable to know how different departments are evaluated and how is their attitude towards
lead time restrictions affected by performance indicators. For instance, in the case company it
has been questioned whether the rule really takes into consideration the overall performance
of inbound logistics (Stenhagen, 2010), as only productions’ inbound logistics representatives
were involved in decision making process (Rostén, 2012).
The result of describing the angles of different departments involved in inbound logistics
activities will explain the drivers behind their interest. Analyzing the effects of different lead
times will give an insight how responsive and cost efficient supply chain could be balanced
when geographical distances are long.
1.4 Purpose
The purpose is to examine how changing lead time of inbound supply influences production,
purchasing and logistics performance.
Like it has been described above, lead time can be seen as trade-off between purchasing and
logistics cost, which in the end create total landed cost for production, and is thereby

6
influencing performance of all these departments. Truly understanding the impact of lead time
makes it possible to determine whether it is reasonable to have a fixed lead time for all
deliveries.
For accomplishing the purpose it is good to be aware in which conditions the rule was created
and whether these conditions are still present; thereby authors would also like to study the
background of the rule.
In order to simplify the cooperation between departments and make the sourcing process less
dependent on few single KPI’s there can been created logistic rules, like it has been done in
Volvo Group, which serve as guidance. However, as described earlier, the business
environment is constantly changing and it might appear that the conditions which made the
rules beneficial in the time of their creation are not present anymore. For example, the five
rules of logistics at Volvo Group have been developed more than a decade ago (Rostén,
2012), which means that they might be too rigid or simplistic for company’s circumstances
today.
1.5 Project outline
The thesis began with an introduction chapter (1), which consists of background, problem
discussion, purpose, method and scope. Following chapter (2) will present the methodology
and research design that has been used and explains how the data has been gathered. Next (3),
theoretical frame of reference, will describe the most important parts of theory which will be
used to build up the theoretical framework for the analysis. Theoretical background will be
succeeded by empirical background (4), presenting the case company and additional practical
information related to it. Thereafter, the empirical findings and analysis (5) will be presented,
based on the practical and theoretical information gathered previously. After that, the results
of the analysis will be discussed (6) and summarized (7) proving the fulfillment of the
purpose for this thesis. Some recommendations for the case company and for further research
are given in following chapter (8). In the next chapter (9) will be provided sensitivity analysis.
And lastly, the paper will be summed up in the conclusions chapter (10).

7
2. Methodology
In this chapter our research methodology will be explained. It includes philosophies,
approach, methods and design of the research, also sampling, data collection and
documentation analyse. In the end of the chapter, the validity and reliability will be discussed
and work process described.
2.1 Research philosophies
According to Blumberg (2008) two major research philosophies exist: positivism and
interpretivism. Positivism is a philosophy adopted from the natural sciences. It states that the
social world exists externally and is viewed objectively, research is value free and the
researcher is independent. (Blumberg, Cooper, & Schindler, 2008) Interpretivism, on the
other hand, states that the social world is constructed and given meaning subjectively by
people, the researcher is part of what is observed and research is driven by interests
(Blumberg, Cooper, & Schindler, 2008). During our research process we have not put our
own views or interpretations into the data collected from the company, neither have we
expected personal relations, rivalry etc. among the departments and employees. The research
itself is result-independent, meaning any result is an objective result for the company and not
only the “desired” one. We assume that the facts we collected are objective and free of
influence, also that the social world around our research is not constructed – by doing this we
can focus more on our main goal and do not have to involve into social paradigms.
Considering the latter, in our case we see the world with a positivistic angle.
2.2 Research approach
Bryman and Bell (2007) argue that there are two scientific approaches for a research:
deduction and induction. Deductive theory is the relationship between theory and research –
the researcher deduces a hypothesis that must be subjected to empirical scrutiny (Bryman &
Bell, 2007). The hypothesis will be confirmed or rejected based on the theoretical background
and could lead to the revision of the theory. The deductive research direction is from general
to specific. Induction, on the other hand, presents the researchers findings from empirical
study that leads to theory. Deduction is more associated to qualitative research and induction
to quantitative (Bryman & Bell, 2007). Our analysis and empirical findings are based on the
theoretical background; also we can follow logical deduction and draw the conclusions which

8
are confirmed by a study (interviews). We have applied deductive approach by initiating our
research with theoretical background in order to explain the events.
2.3 Research methods
Bryman and Bell (2007) also argue that there are two different research methods to use as a
base on when conducting a research: quantitative and qualitative. Quantitative consists more
of analyzing numerical data and has more formal and strict structure. The main focus is to test
the theories. Qualitative, on the other hand, is based on qualitative information like words,
sentences and narratives and has more subjective nature, giving wider understanding of the
problem. (Bryman & Bell, 2007). Reaching our purpose requires closer insight of the
problem, also understanding the background and historical driving forces that have created the
lead-time requirements for the suppliers. Thus, in order to study the field from various angles,
different employees and their opinions, knowledge and experience could be used as an
appropriate tool. Also, we consider the limited timeline, scope, accessibility and nature of
relevant data we have in our disposal. A suitable method to gather all this data effectively is to
conduct qualitative interviews since according to Blumberg, Cooper, & Schindler (2008) a
qualitative interview is well accepted method to perceive deeper picture of the researched
subject and to draw relevant conclusions. Additionally, qualitative interview has proved itself
as an appropriate tool for driving generalizations and increasing the external validity of a
research (Bryman & Bell, 2007).
2.4 Scope
In this thesis the focus will be on the changing lead time in delivery process, because it is
directly affected by the 3DR. The performance of this process, which will be referred as
inbound logistics performance, will be qualitatively evaluated from the responsiveness and
cost efficiency perspectives influencing main actors throughout the process. In this study the
main actors are production, purchasing and logistics departments. Authors have chosen to
represent the performance of production by cost of ownership and cost of flexibility. For
purchasing the most suitable parameter would be the product price and for logistics the
amount of control over material flows. The reason behind choosing these KPIs related to
responsiveness and cost efficiency is considering that those metrics represent the main trade
off in accomplishing the overall balance of the inbound logistics process. The affect of
delivery lead time on the chosen KPIs will be estimated based on theoretical investigation and

9
the findings from the interviews conducted in the case company. In order to make it clearer
which is the focal point and limitation of the thesis it is useful to know which process,
departments and KPIs are included. Latter is presented in the figure 1, which shows three
departments, logistics, purchasing and production that are involved in delivery process from
suppliers site to VPT factory. Also the most important KPIs, expressing the interests of each
department are included in the figure 1.
Figure 1: Scope of the study
The research has been carried out in the focal company’s one geographical location and
production plant in Sweden; this has been done due to the restraints of time and financial
resources of the authors. If any other location had been chosen then the mindsets and
collaboration between departments could have been different and same issues might not have
appeared. Regardless, that this limitation might lower the external validity of the outcome
where other KPIs are used, the findings could still be used to make generic conclusions about
the influence of fixed lead time requirement. As the latter is based on theoretical framework
and affects inbound logistics activities nevertheless how they are measured.
Furthermore, the structure of the focal company has been reorganized during the time this
thesis was in process. Therefore, the research is limited and based on the previous structure of
the company which is introduced in the section of empirical background. This might affect the
results of the research as improvement process of many shortcomings that have appeared from

10
this thesis is already started and the actual empirical situation is more compliant with the
recommendations of theory.
2.5 Case study design
According to Yin (2008, p 13) “Case study is an empirical inquiry that investigates a
contemporary phenomenon within its real-life context. When boundaries between
phenomenon and context are not clearly evident multiple sources of evidence are used”. Case
study is more suitable for exploratory, explanatory and descriptive research. (Blumberg,
Cooper, & Schindler, 2008)
In case studies, different designs can be used such as simple case or multiple case studies.
Single case applies for investigating extreme or unique cases or may be justified for pragmatic
reasons (Blumberg, Cooper, & Schindler, 2008). In multiple cases, the selection of cases must
follow replication logic, which means that based on one’s theory one expects that the same
phenomenon occurs in the same circumstances or that phenomenon differs if the
circumstances change (Blumberg, Cooper, & Schindler, 2008). In our case, we are studying
one company (VPT), one phenomenon (3 day rule) and different flows from different
suppliers with various set ups. Therefore we can state that our study is a single case study due
to specific problem of one company. Both of the cases (single and multiple) can be either
holistic or embedded. Holistic means the study of the organization’s global nature, whereas
embedded means multiple units of analysis are included (Yin, 2008). In our case we are
studying one company (VPT) with a specific problem (overall lead time requirement).
Additionally, we did not analyze different sub-units specifically, rather than the general nature
of the company, meaning that in our case we are dealing with holistic single case study.
In our research we are dealing with a single case study since we observed only one company
(VPT). By choosing just one company we expect to save time and resources. As mentioned in
the previous chapter, we draw connections between the background of the 3DR and its
appropriateness to the current business environment in order to ground or reject the relevance
of fixed lead time requirements without exceptions whereas the process and the results are
carried out in a exploratory and descriptive way.

11
The research design is based on the main interests of three departments under investigation -
production, purchasing and logistics. These interests are determined dependent on KPI-s,
which have been revealed during the interviews and are being affected by 3DR. The main
interests selected by the authors are cost of ownership, flexibility and acquisition for
production, piece price for purchasing and supply chain control for logistics. The motivation
and explanation of this choice is written in the empirical findings.
Different effects of the 3DR will be viewed and described in the contexts of three PuP setups
with altered lead times to VPT factory. It should be stated that the suppliers considered in the
research are located further than 3 days normal transportation time from VPT plant. It has
been detected that the main issue that comes from following the rule is the implementation of
a PuP for the suppliers located outside the limits of the rule.
In the thesis the term PuP will be representing the collection point of goods. This point could
be suppliers factory, warehouse operated by LSP or Volvo Group. This structure with three
possible PuP setups is further explained in chapter 5.2. We have expected the comparison
under these different conditions will reveal the necessity to implement the rule without
exceptions.
2.6 Sampling
Sampling is used to save time and resources. There exist two different types of sampling:
probability and non-probability sampling. Probability sampling is used as random selection of
samples, contradictive to non-probability selection (Bryman & Bell, 2007). Since VPT has a
problem in the field of study while granting us an access to a company data we can consider
that we are using non-probability sampling because we have selected our company (VPT)
deliberately. Therefore in our work we are using non-probability selection where the selection
is done for a purpose (Bryman & Bell, 2007).
2.7 Data collection
There are two types of data collection: primary and secondary data. Primary data is collected
by the researcher; they could be interviews, observations, questionnaires etc. Secondary data
therefore includes studies made by others that is used for the research, it could be the
organization’s data archives, books, periodicals, previous researches, Internet sources etc.

12
(Blumberg, Cooper, & Schindler, 2008). Our primary data is collected from the interviews
and secondary data consists of various books, company’s documents, presentations, previous
thesis’s in that field and relevant articles. In our thesis both types of data, primary and
secondary collection is used.
2.7.1 Interviews
Interviews are the most common types of source for collecting information and several types
of interviews can be used: structured, semi-structured and unstructured (Blumberg, Cooper, &
Schindler, 2008). Structured interviews (also standardized interviews) are used more in
quantitative research as all the interviewees are given exactly the same questions (Bryman &
Bell, 2007) Questions are usually very specific and given in the same order. The goal for this
style is to ensure the replies can be aggregated. (Bryman & Bell, 2007) Semi-structured and
unstructured interviews have more informal structure. They have two main objectives: to
know the informant’s perspective on the issue and whether the informant can confirm insights
and information the researcher already holds. (Blumberg, Cooper, & Schindler, 2008) For this
thesis mainly semi-structured interviews have been used, where we follow the interview guide
but the questions for different interviewees can vary to a small degree. All the questions have
been asked by using similar wording for each interviewee. All the interviews are recorded
with the interviewees’ permission. The interviews have been conducted in person at the VPT
site in Gothenburg and at the assembly plant in Skövde. One interview was done by phone.
While targeting our interviewees, our goal was to select the ones who were should to have the
most relevant information regarding our field of study; in addition some extra interviews were
conducted in order to get more detailed information or different points of view. Our purpose
was to cover all the parties involved in terms of whole organization related directly to inbound
logistics.
For this thesis mainly semi-structured interviews have been used, where we follow the
interview guide but the questions for different interviewees can vary to a small degree. All the
questions have been asked by using similar wording for each interviewee. All the interviews
are recorded with the interviewees’ permission. The interviews have been conducted in person
at the VPT site in Gothenburg and at the assembly plant in Skövde. One interview was done
by phone.

13
Name Position Type of interview
Borin, Pär VPT Purchaser Personal interview
Dahl, Fredrik Supply Chain Manager Personal interview
Enerstad, Beatrice VPT Purchaser Personal interview
Köhler, Kristina VPT Purchaser Personal interview
Lindner, Henrik Supplier Relationship Management Personal interview
Nylund, Thomas Global Commodity Director Personal interview
Breman Palm, Lena
& Palm, Lena
Solution Manager and Chief Product Manager Telephone interview
Rostén, Henry Order and Volume Director Personal interview
Stenhagen, Fredrik Global Logistics Development Manager Personal interview
Tengroth, Kristina VPT Purchaser Personal interview
Wirsin, Henrik Commodity Logistics Manager Personal interview
Table 1: Overview of interviews
2.8 Data analysis method
Our data consisted of documents and interviews. Document analyzing provides a rich source
of evidence and plays a crucial role in case study research, documents can be letters, e-mails,
internal memos and reports, newspaper articles, agendas etc. (Blumberg, Cooper, &
Schindler, 2008). In our case the analyzed documents consisted mainly on VPT’s
presentations and memos on a relevant subject we had access to (included in the reference list
under “Documents and presentations”). As all our interviews were recorded, it was possible to
manuscript them in order to get a better overview of collected facts and make it more
convenient for further processing. The processed empirical data were divided into groups and
were compared to theoretical framework of the relevant topic. According to Bryman and Bell
(2007) the content analysis is the most common way of studying qualitative data for a
meaning and conclusions. We have been used the content analysis in order to select the most
appropriate aspects from the context and to understand the content of a studied problem.

14
2.9 Quality of the research
2.9.1 Construct validity
Construct is defined as identifying correct operational measures for the concepts being
studied. In order to face the construct validity, several requirements must be fulfilled: using
multiple source of evidence, establishing a chain of evidence and to have the draft case study
report reviewed by key informants (Yin, 2008). In our case we have used multiple sources of
information such as interviews (with different employees in the same department, also
employees from different departments covering all the studied area) and documents. The data
collected could be connected to each other (no real conflicts) and our draft has been reviewed
and approved by the informants.
2.9.2 Internal validity
Internal validity means to search for establishing a causal relationship, whereby certain
conditions are believed to lead to other conditions, as distinguished from spurious
relationships (why event X leads to event Y). Some tactics can be used as suggestions to
address internal validity: pattern making, explanation building, addressing rival explanations
and using logic models. (Yin, 2008) ). In order to confirm given data, empirical findings and
our intepretations for a relationships of the processes observed, we have continiously asked
our respondents for their confirmation and therefore increasing our internal valditdy.
2.9.3 External validity
External validity states for defining the domain to which a study’s findings can be
generalized. For a single case study to face the criteria is to use a theory (Yin, 2008). In other
words, if we have a similar case then using the same approach and methods the result should
be the same. We have to admit that even the companies in the same business could have
different organizational structures and use dissimilar concepts for their inbound logistic
activities. Since we have observed only one company we rate our external validity to be fairly
low.
2.9.4 Reliability
Reliability means that the operations of a study can be repeated with the same results. Case
study protocols and a case study database should be used during the study. The first one
includes an overview of the case study, data collection procedure, case study questions as well

15
as a guide to the case study report. The case study database contains the case study report and
any means of evidence (Yin, 2008). We have ensured our reliability by recording all the
interviews and keeping them as evidence. All the data sources that we used are included in the
reference list.
2.10 Overview of the work process
Our study started with meetings and discussions with supervisors leading us to our research
purpose. The main problem was related to the 3 Day Rule that states that all the suppliers
should not be more than three days from the Volvo plant. The main question was: should this
requirement always be applicable?
Our first target was to find the main research question and then to move on and map our
further research. It was followed by the theory selection process and data collection by
starting with interviews. It soon revealed that we needed to search deeper the background
behind this rule. The first results showed us direction to the in-depth theory that needed to be
further studied. Based on the outcome, analysis was conducted and conclusions revealed. Our
research ends with discussion and recommendations.
Figure 2: Work process
Preliminary meetings and problem
discussion
Main research questions
Theory selection
Data collection Theoretical framework
Background of the rule
Empirical findings
Deeper theory Findings revealed
Analysis
Conclusion
Discussion

16
3. Theoretical frame of reference
The following chapter will present the theory related to the process, actors, concepts and
strategies focused on in this thesis. Created framework will later on form a theoretical basis
for the analysis of the impact of changing lead time on inbound logistics performance.
3.1 Delivery process
According to Porter (1985) value chain or supply chain consists of value added activities and
a margin received for providing these activities. The value added activities are divided into
primary activities, which are directed to physical changes and handling of the final product,
and supporting activities that enable performing the primary activities. The first part of the
primary activities in Porters’ value chain model is inbound logistics. It consists of activities
like receiving, storing and distributing inputs to the production, which form a part of delivery
process. As it can be seen on the figure 3 below, inbound logistics is closely connected to
supporting “procurement” activities and directly serving following “operations”.
Figure 3: Porter’s generic value chain, Porter (1985)
According to Lambert (2005) one key activity in delivery process is to provide for the
movement of goods from the supplier to the user. This creates both place and time utility for
the user. As delivery process often involves global operations, it requires careful information
sharing regarding terms of shipment between sending and receiving part (Lambert, 2005).
This is very important due to the uncertainties and lack of control that accompany

17
international operations. These terms are developed and defined by the International Chamber
of Commerce and determine who is responsible for various stages of the delivery, who carries
the risks and where is passing the ownership of goods (ICC, 2010)
One commonly used term of delivery is FCA, free carrier, which means that supplier hands
the goods to the carrier at suppliers’ territory or another point that is named in the agreement
(ICC, 2010). As can be seen in the figure 4 the responsibility of delivery, risks and costs will
all shift from supplier to buyer in the named place of delivery.
Figure 4: FCA free carrier, Incoterms (2010)
Like mentioned above there are two possible options to hand over the goods while using
FCA. One is to make the shift at suppliers’ facility and the other to make it at a place picked
by buyer. This implies that there are three alternative delivery setups to use when FCA term is
applied. First alternative would be for the buyer to pick up goods at suppliers’ territory,
second is to hand over the goods somewhere in between suppliers’ and buyers’ location and
finally supplier could deliver goods all the way to the buyers’ facility. Thereby trading
partners can choose the most appropriate party to arrange transportation and carry cost as well
as risks of owning the goods in the delivery process.
3.2 Actors involved in delivery process
“Operations” in Porters’ model, which was introduced in the previous section, is referring to
the production process in the supply chain. Operations activities are connected to
transforming the raw materials into final products by machining or assembly. Often the main
goal for production is to have low manufacturing costs (Jonsson, 2008), which means that
material supply has to be flexible to avoid excessive inventory and obsolescence of goods

18
(Bowersox, 2010). Furthermore, to lower the costs for production the ownership of the
products could be shifted upstream to release tied up capital and reduce the risks coming from
owning goods (Christopher, 2008). Generally assuring the inbound material supply flexibility
is a responsibility of logistics function and necessary inventory investments for acquiring
required input are determined by purchasing departments’ activities (Bowersox, 2010).
Consequently, production performance is affected highly by logistics function and purchasing
best practice.
In manufacturing context purchasing is the typical term for acquisition process, but it can be
called also procurement, buying or supply management (van Weele, 2010). Purchasing is
classified by Porter as a support activity for the primary activities. It is related to buying raw
materials, supplies and other items that serve as an input used to perform company’s
operations. Traditionally, purchasing has been adversarial and transaction focused, thereby
mainly interested in the product price. Today, on the opposite, the focus is shifting to
considering the lowest total cost of ownership. (Bowersox, 2010; Jonsson 2008) This implies
that purchasing should consider all the cost that will incur over the products’ lifetime that is
bought.
Logistics purpose in the supply chain is to move and place the inventory so that the benefits of
time, place and possession are gained with the lowest total cost. (Bowersox, 2010) This means
that the right moment and location of ownership transfer is essential to increase the value of
goods. Some integrated logistics functions that affect the efficiency of total inbound logistics
performance are for example facility network design, transportation and inventory
management. The facility network design determines the number, size and location of
facilities where logistics operations are performed. Also the stock levels in each facility need
to be decided. Therefore, inventory requirements and facility networks are closely connected.
From the inbound logistics transport perspective the three factors influencing the performance
are cost, speed and consistency of a delivery. Finding the balance between these factors is a
primary responsibility of logistics and determines the efficiency of inbound logistics delivery
process. (Bowersox, 2010)

19
3.3 Distribution systems in delivery process
Through time have distribution systems developed from general direct deliveries towards
distribution via terminals. Compared to direct deliveries the terminal system has more
frequent but also more rigid deliveries. (Lumsden, 2007) Those two systems are presented
below in the figure 5. A system based on direct deliveries is fast, but requires also very high
transport resources. Other problems connected to direct deliveries could be low delivery
frequency and low resource utilization. (Lumsden, 2007) This means that from logistics
perspective direct deliveries are not the most efficient solution.
In direct delivery system the goods can be stored both at suppliers’ side, and transported to
customers when needed, or at customers site, from where they can be requested quickly. The
placement of inventory affects the reaction speed for customers demand. Responsiveness to
changing demand is higher the closer the inventory is placed to the customer.
As mentioned in the “Delivery process” paragraph, it depends on the incoterm agreed upon,
which party is responsible for the transportation and owns the goods. This agreement defines
the location where goods are physically handed over from the supplier to the customer – this
location could be called a pick up point. In case customer has agreed to arrange the
transportation from suppliers’ site then the pick up point for goods is located at the suppliers’
factory. On the opposite, when supplier organizes the delivery, then pick up point for
customer is at their premises. This concept is illustrated in figure 5 point 1 and 2 respectively.
In a distribution system with a terminal, goods always pass a depot on their way from supplier
to the customer (Lumsden, 2007). That way the inventory will be stored for some time in an
intermediary location. This system could lead to higher efficiency for the supply chain as
consolidation of goods can be performed. Additionally, higher delivery frequency and
resource utilization can be achieved. (Lumsden, 2007) According to the incoterms it is
possible to agree that supplier will perform the transport until the terminal and customer will
take care of the rest of the delivery. In that situation the terminal represents the pick up point
of goods for the customer.

20
Figure 5: Distribution systems in delivery process, adapted from Lumsden
(2007)
3.4 Lead time
As mentioned previously, historically the purchase decision has been dependent mainly on the
price (Bowersox 2010; Christopher, 2008; Jonsson, 2008). Nowadays the choice of supplier,
not only price, also depends on “the cost of time” while the customer is waiting for the
delivery. (Christopher, 2008) This means that the sourcing process has become more
complex for the purchaser as there should be considered not only cost efficiency, but also
responsiveness of inbound material flow.
One basic issue in most organizations is to meet the customer’s order cycle (the time the
customer is willing to wait for the delivery) with logistics lead time (the time for the supplier
to complete the process from receiving the order to delivering goods) not managing that will
cause the lead time gap. This gap is specially a problem in longer flows because in general the
final customer is not willing to wait longer just because the sourcing is done globally. The
idea of lead time gap is presented in figure 3. (Christopher, 2008) Possible ways to reduce or
close this time gap is shortening the logistics lead time by the aid of such tools as supply
chain mapping and bottleneck management. Simultaneously the customers’ order cycle could
be moved closer by increasing the demand visibility. (Christopher, 2008)

21
Figure 6: Lead time gap, cited in Christopher, 2008 p. 160
Traditionally companies have used inventory to bridge the lead time gap. This inventory is
built up by using a forecast to predict the customers need before the actual demand arises.
However, forecast accuracy is never perfect no matter how advanced the forecasting system
is. Due to forecasting errors there will be always too much or too little inventory (Christopher,
2011)
According to Christopher (2008) forecasting error is increases as the lead time gets longer.
This situation is shown in figure 4. Larger forecasting error in turn causes increased demand
volatility and a need to keep higher levels of safety stocks. (Christopher, 2008) Therefore it is
advisable to decrease the lead time gap in order to have more accurate forecasts that are based
on actual demand and at the same time lower the amount of inventories.
Figure 7: Forecast error, cited in Christopher, 2008 p. 149

22
3.5 Financial aspects of companies’ performance
It is widely discussed that logistics activities create costs for the company but it cannot be
forgotten that these activities also generate revenues. Therefore, it is important to consider the
financial aspect of the company in order to understand how logistics decisions impact the
profit and how required resources, such as working capital should be managed (Christopher,
2008). The term “working capital” refers to company’s short term assets and liabilities like
inventory and money owed to suppliers (Ross, 2008). So, it is important to know the influence
of logistics activities on company’s financial statement in order to make the business more
profitable and competitive.
Important financial indicators for supply chain performance are working capital and cash-to-
cash cycle (Hofmann, 2011). Thereby the goal of efficient working capital management is to
balance costs and incomes successfully. As Hofmann (2011) also states working capital is
described as the difference between current assets like cash, accounts receivable and
inventory, and current liabilities, for example accounts payable. Therefore, working capital
can be seen as current assets which have to be financed with interest bearing capital. The
possibilities for lowering the working capital are reducing inventory and accounts receivable
or rising current liabilities (Hofmann, 2011).
In general, attempts at reducing tied-up capital in the turnover process cause a trade-off
between risk and profitability (Hofmann, 2011). In other words, this means that decreasing
inventory which ties capital creates a trade-off between responsiveness and cost efficiency.
Positive working capital, when inventory and accounts receivable are greater than accounts
payable reduces the risks of loss in production but has a negative effect on profitability due to
high capital commitment (Hofmann, 2011). This implies that the financial resources that the
company could use elsewhere are tied up within inventory. On the opposite side negative
working capital decreases the need for funding but also leads to increased risk of shortages
and possible stoppage in production. According to the research the optimal would be to have a
low level of positive working capital (Hofmann, 2011). Thereby companies should have low
levels of safety buffers to protect themselves against unforeseeable short term fluctuations in
demand but not commit too many financial resources. The key is to find balance between risk
and financial management.
23
Traditionally there are several methods in order to improve the working capital from one
company’s perspective. Nevertheless this approach has its drawbacks from a total supply
chain aspect. For example, when strong buyers enforce the extension of payment to smaller
suppliers it is shifting the working capital upstream to a company that might have higher
weighted average cost of capital (Hofmann, 2011). This way the focal company will
seemingly improve its financial indicators but in the end the profitability could still suffer as
all the expenses of the supplier will be reflected in the product piece price.
The pressure to release tied up capital in stocks forces companies to reduce their raw material,
component and work-in-process inventories. This process has a considerable effect to the
actors upstream of the supply chain. Many suppliers think that the only way to meet clients’
JIT delivery requirements, which are an important part of cost efficient approach, is to carry
the inventory instead of them. The main ideas of cost efficient strategy are introduced in the
following chapter. Yet, this behavior only shifts the costs from one supply chain actor to
another and might even end up in higher total costs. Instead of high inventory levels suppliers
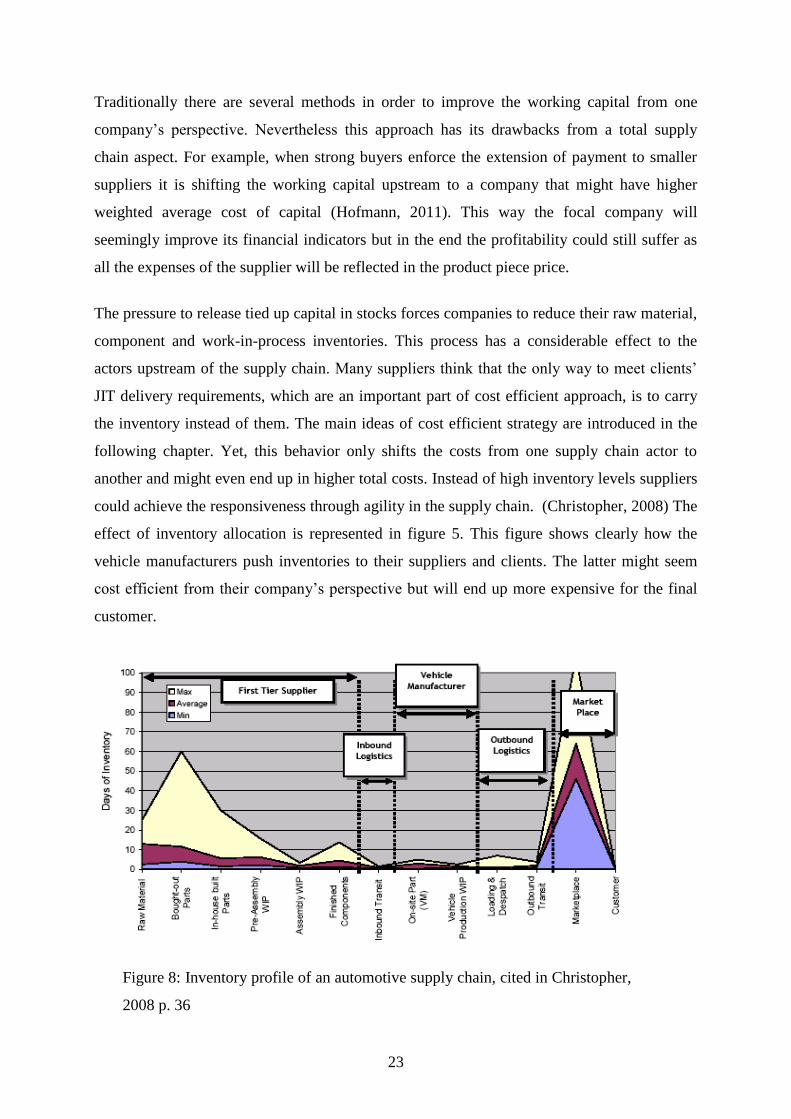
could achieve the responsiveness through agility in the supply chain. (Christopher, 2008) The
effect of inventory allocation is represented in figure 5. This figure shows clearly how the
vehicle manufacturers push inventories to their suppliers and clients. The latter might seem
cost efficient from their company’s perspective but will end up more expensive for the final
customer.
Figure 8: Inventory profile of an automotive supply chain, cited in Christopher,
2008 p. 36

24
In the circumstances when demand is volatile methods like JIT that aim at reducing the
inventory levels might cause an increased cost for transportation when express delivery is
needed due to unexpected shortages. (Hofmann et. al, 2011) Christopher (2000) supports that
idea by stating that the supply chain total product delivery process cost contains physical
delivery costs like distribution and storage cost as well as marketability cost like obsolescence
and stock-outs. Therefore the physical costs and marketability costs should be balanced to
achieve the efficiency of total supply chain product delivery process.
As mentioned in the previous chapter supply chains have become very time sensitive but from
that arises the question of how of a quick response is quick enough? In order to find an
answer to this question the financial benefits from increased speed should be evaluated. The
agility in supply chain for serving the customers better is justified until there is a possibility to
do that while still having competitive prices (Bowersox, 2002).
More effective results can be accomplished when having more a holistic view of the supply
chain and trying to reduce the requirements on working capital by lead time compression
through elimination of non-value-adding activities or waste according to lean philosophy.
(Christopher, 2008)
3.6 Production perspective - matching cost efficiency and flexibility
As the markets are very competitive and customers have little brand loyalty there is a need to
produce a product that is both affordable and available. In order to keep the customer and
improve the supply chain performance, both, cost should be decreased and customer
satisfaction increased at the same time.
One possibility to combine cost efficient and responsive strategy is to hold strategic inventory
in a materials decoupling point of supply chain. This point could be a stock in-between the
beginning and destination of the material flow where the products are kept semi finished. This
set up is described on the image 8 below.

25
Figure 9: The de-coupling point, adapted from Christopher (2001)
The target using responsive strategy is to hold the inventory in a generic mode. This concept
is called postponement which means that products are kept waiting for final configuration and
localization when the exact customer requirement and/or destination is known. (Christopher,
2000)
There are a number of advantages for using postponement. Firstly, holding inventory in
generic form makes it possible to have less SKUs and hence less total inventory. Secondly,
the supply chain flexibility increases as generic products can be configured for using in
several end products. As mentioned above it makes the forecasting more accurate if
predictions are made on general level. (Christopher, 2000) This could mean for example that
some engine parts in automotive industry are sent in big batches and generic form between
continents and customized close to the final destination as the exact demand is known. As the
flow of generic products is more stable it could be forecast driven but after the decoupling
point it should be based on real orders. Ideally this point should be placed as close as possible
to the final user this way the responsiveness is highest and bullwhip effect reduced.
(Christopher, 2000) The latter is caused by the uncertainty of information flowing up and
downstream in the supply chain. As demand moves upstream the reliability of demand
decreases which causes excessive inventory levels, decreased customer service, cash flow
problems, stock-outs, higher piece price and express transport. (Lysons, 2007)
Besides establishing a decoupling point there are few other hybrid strategies to match cost
efficient and responsive supply. One possibility is to divide the product range according to

26
Pareto Rule, for example if 20% of products generate 80% of the total volume the remaining
80% of the products would be managed differently. This could mean that the demand of 20%
is more predictable and cost efficient strategy could be used for their flow, while 80% of the
goods are slow-moving and less predictable requiring responsive supply chain. (Christopher,
2000)
Final combined strategy divides the demand into two parts. Firstly the base demand which is
more stable and secondly the fluctuating surge demand. As base demand can be quite
accurately forecasted it is possible to achieve economies of scale and use cost efficient
approach but surge demand is highly unpredictable so more responsive methods have to be
used for managing it. Possible ways to apply the hybrid strategy is to produce base demand in
low cost countries and fill the extra demand locally. Alternatively the base and surge demand
can be separated at the same location by different product lines or by using slack time in
production to make base inventory.
Figure 9 presents a summary of all the above described hybrid strategies and suggest
appropriate market conditions and operating environment where it is most suitable to use each
strategy.
Figure 10: A Contingency Approach to Supply Chain Strategy Choice,
Christopher (2001)

27
3.7 Purchasing perspective – material availability at lower price
The purchasing theory says: “Purchasing is the management of the company’s external
resources in such a way that the supply of all goods, services capabilities and knowledge
which are necessary for running, maintaining and managing the company’s primary and
support activities is secured under the most favorable conditions.” (van Weele, 2010 p.3)
There are several ways of achieving the favorable conditions. One of the main indicators in
purchasing is the product cost itself. Sourcing from low-cost countries can have remarkable
impact on product price. This applies especially when we are talking about components that
require high labour content. (Bowersox, 2010) Due to lower labor cost product price could be
reduced turning the component and therefore the final product will be more competitive. On
the other hand the low cost countries tend to be remarkably long distances from the assembly
plant generating stress to lead time and supply. The other critical factor for sourcing from
low-cost countries is the product value – low value products do not generate remarkable
inventory cost while in transit. This is also why piece-price focused negotiation and the unit
price based performance is still widely used.
Despite the fact that the purchase price remains on top of the purchasing goals, rather than
focusing on product price, it is to focus on Total Cost of Ownership (TCO). For example you
can lose much more assets due to the quality or difficulties in supply of the product than you
gained from its low price. The theory says: procurement is targeted on continuous supply,
minimizing inventory, improving quality, developing supplier and to achieve the lowest total
cost of ownership. (Bowersox, 2010) However, piece-price focused negotiation is still used
considerably as well as the unit price based performance is widely used. Rather than focusing
on purchase price it is to focus on TCO.
TCO relates to the total costs that the company will incur over the lifetime of the product that
is purchased (van Weele, 2010). It includes all the activities from supplier to assembly line (in
terms of inbound logistics) like purchasing, quality control, transportation, warehousing etc. It
is important to see all involved costs rather than only the purchasing cost itself. TCO also
helps to highlight large cost elements and is a good tool for understanding how different
requirements (delivery, inventory level, customization, etc) to the suppliers would increase
the cost of ownership (Ellram, 1993).

28
There are several possibilities for TCO reduction. One of the factors is the influence over a
supplier. In order to increase the buyer’s bargain power volume consolidation strategy is
applicable by limiting the number of suppliers economies of scale is created and the increase
of bargaining power is achieved and piece price is reduced. Fewer suppliers usually mean
more lasting and tighter supplier relations, additional benefit that comes from this, is the
supplier’s interest to invest in the buyer’s relationship for example capacity and customization
investments etc. (Bowersox, 2010)
3.8 Logistics perspective – supply chain efficiency
3.8.1 Operating arrangements
Bowersox (2010) states that the positive effect of logistic services is directly impacted by the
operating system design. In this system performance, cost and flexibility of the supply chain
have to be balanced. Essentially there are two structures that can be used for operating system
design. First of them is the echeloned structure where warehouses are used to create inventory
assortments and consolidation is applied to gain economies of scale. (Bowersox, 2010)
Second design has a direct system which implies that goods are shipped directly to customers’
destination. In situations where it is economically reasonable the direct setups are preferred as
they lower the amount of intermediate inventory and product handling. (Bowersox, 2010)
Nevertheless, sometimes ownership cost has to be taken in order to gain required flexibility.
Moreover direct logistic solution is often rejected because of its high transport cost and
potential loss of control over the network. (Bowersox, 2010)
3.8.2 Shipment consolidation
Shipment Consolidation is a logistics strategy that combines two or more orders or shipments
so that a larger quantity can be dispatched on the same vehicle to the same market region
(Ulku, 2009). This theory claims that the more the shipment consolidation is used the more
the transport cost will reduce. Logistics planning includes three types of consolidation
methods: vehicle, inventory and terminal consolidation. Vehicle consolidation means
aggregating two or more smaller shipments into one truck. Inventory consolidation focuses on
the number, type, and location of stocking points; it is used by delaying deliveries until certain
accumulation of inventories is reached. Terminal consolidation brings items from different
locations into a single facility (Ulku, 2009).

29
Figure 11: Shipment Consolidation Configurations, adapted from Ulku, 2009
Economies of scale make it possible for the carriers to transport larger shipments at lower
rates. Shipment consolidation mostly lowers the carrier’s pickup, delivery and dock-handling
costs. Consolidation may allow for faster and consistent transit times, which in turn would
result in reduced inventories (safety or in-transit) without changing customer-service
standards. Moreover, with faster transit times, capital is tied up in the consignment for a
shorter time, and fast deliveries may generate earlier payments and speed cash flow (Ulku,
2009).
3.8.3 Elements of time in transportation
Woxenius (2006) claims that in terms of time, transportation speed is a minor player in
overall process of the transportation, and there are some other elements that need to be
considered. Some of the important elements are, for example, transport time, timing and
frequency.

30
Transport time is also known as transit time between point A and point B (Woxenius, 2006).
Transport time depends on lot of factors like distance, modes of transport, infrastructure
capacity, weather conditions, speed of transport, and consolidation level, that all affect the
transit time.
Timing, on the other hand, means the fixed transport time between specific points of time. In
many cases timing is even more important than speed because it enables to avoid congestion
(rush hours) and to consolidate shipments during daytime and having transportation during a
night where the traffic is less intensive and therefore the speed could be higher (Woxenius,
2006).
Frequency is the period between departures, related to timing and punctuality (Woxenius,
2006). As a rule, the larger the capacity of the transport mode is, the lower is the frequency. It
could vary from daily, or even several times a day (truck, airplane) to weekly departure
(vessel, train).
In order for logistics provider to assure an efficient operation, they have to take into
consideration all the time elements of transportation and keep in mind how they are affecting
each other.
3.9 Conclusion of the theory
In the following section, the previous parts of theory that will form the structure of the
analysis are outlined. So, the inbound delivery setup is described in a relation to the 3DR and
the interests of production, purchasing and logistics are highlighted.
In order to benefit from economies of scale and scope and thereby reduce cost as well as
increase flexibility of long distance suppliers the material flows should be combined. This
could be done by establishing PuP with strategic inventory somewhere in the flow, which
would bring the supplies closer to the final user and increase the volumes of products in one
flow. The requirement of establishing PuPs within 3 days from VPT plant is comparable with
the strategy that has been mentioned previously in the literature overview, which combines
cost efficient and responsive approaches and seeks balance between costs and flexibility.

31
As explained in the methodology chapter, to fulfil the purpose of thesis three possible PuP
setups are viewed from perspectives of production, purchasing and logistics. In these three
possible setups the ownership, risk and responsibility of transportation are shifted from
supplier to customer at different points in time and space. Shift is done accordingly to the
incoterm (FCA) that is being used in the purchasing contract (Volvo Group, 2011a). Three
mentioned setups are presented at the following figure 12, where “S” presents the supplier
site, “F” stands for VPT factory and PuP marks the point where goods are picked from the
supplier by LSP. As the logistics rule states the PuP should be located witin 3 days normal
transportation time from VPT plant, therefore setup 1 with PuP at suppliers site is not
comprehensible with 3DR.
By picking up from supplier’s factory hereunder does not only mean by the actual factory but
also could mean overseas consolidation points for Volvo as long as it is outside the 3 days
limit. In second setup the PuP is located somewhere within the current lead time requirement.
The last option represents PuP at VPT factory or a local warehouse situated fairly close by.
Figure 12: Possible PuP setups
Based on the theory about production, purchasing and logistics strategies, it could be summarized
that the main interests of production are keeping the cost of ownership as low as possible and
increasing the flexibility of inbound deliveries. These interests are caused by the pressure to be
more cost efficient, keep the inventory levels low and to have a fast response to the changes in
demand.

32
Purchasing department is interested in keeping the product cost s low as possible while assuring
the availability and acceptable quality of the goods.
Logistics aims mainly for having the control over the supply chain in order to be able to arrange
the material flows in the most efficient way.
Finally, it can be stated that the general interest of a company could be to lower the acquisition
cost as this affects the important financial KPIs mentioned earlier, such as cash flow, capital tied
up and profit.
The main interests of parties involved are summed up in table 3:
Department Interests Drivers
Production OWNERSHIP; FLEXIBILITY cost efficiency, delivery frequency, delivery speed, inventory levels
Purchasing PRODUCT COST cost efficiency, product availability, quality
Logistics SUPPLY CHAIN CONTROL operational efficiency
General ACQUISITION COST cash flow, tied-up capital, profitability
Table 3: Summary of the main interests and drivers for different departments

33
4. Focal company presentation
In this chapter Volvo Group will be shortly described to provide an overview of the concern
and its interest in which our focal company VPT is one business unit. Moreover, VPT will be
presented including its vision, mission and targets. Also the idea of Logistics Rules is
introduced, including the lead time requirement which the research is concentrated on.
Finally, all the departments concerned are presented.
4.1 Volvo Group
Volvo Group is among the leading companies in the world providing products like trucks,
buses, construction equipment, engines and drive systems for boats, as well as aircraft engine
components. Additionally offers Volvo Group financial services to its customers. All in all
employs Volvo Group around 100,000 people around the world and has production sites in 19
countries. (Volvo homepage, 2012) Volvo Group organization is shown in the figure 12
below.
Figure 13: The Volvo Group organization. Volvo Homepage, 2011
34
4.2 General priority of Volvo Group to reduce the inventory
Currently the Volvo Group is facing situation where there is a high number of product
variants. As the forecasts are made on general levels, the accuracy on variant and part number
level is inaccurate. Moreover, they have used inflexible order planning and handling systems
which all cause a large number of inventories. These levels are even increased due to the fact
that many strategic parts have just one supplier resulting in situation where only long distance
supply can be used. Inventory reduction is prioritized by the management because the capital
tied up can be used in much more efficient ways in the Volvo Group. According to the
analysis of Working Capital Management team the inventory levels need to be decreased in
average by 50% for all the plants. (Nygren, 2012) For the Skövde plant the starting level of
inventory was 29 days and the target for year 2012 is to reduce it to 14 days. (Palm, 2012)
4.3 Rules of logistics
On Volvo Group level there have been decided 5 logistics rules, which are to be followed in
all the Business Areas and the Business Units. Nevertheless, the logistic rules are not
mandatory in all companies of Volvo Group including VPT, as they have been both supported
and disapproved. The question stands whether these rules should continue to be optional or to
be made mandatory for everyone. As stated in the introduction, the thesis project will be
focused on one of the logistics rules concerning 3 days lead time requirement for inbound
material supply, which will be referred in this thesis as 3 days rule (3DR). 3DR says: “In
order to meet flexibility and cash flow requests while optimizing lowest total cost the
suppliers must take full responsibility and ownership to deliver from a PuP meeting lead-time
requirements”. The current lead time requirements are as follows:
For batch supply the supplier PuP(s) must be within 3 days of normal transport time for all
Volvo plants
A suitable material supply strategy for the supplier has to be selected and if necessary LSP
should be contracted (Hellner, 2011)
On the other hand the increased amount of product variants sets space restrictions, so the
manufacturer wants to get necessary components exactly when the need arises for them. This
means that the lead time should rather be kept short to keep the inventory levels low and still
provide high customer service.

35
As VPT has been growing globally the distances are also becoming longer and it becomes
more complicated to meet the short lead time requirement. One aspect of complication comes
from involving third parts in the material flow or increasing the need for resources to have
buffers in between the suppliers’ site and VPT plant.
4.4 Background of the 3DR rule
In this section it will be explained by VPTs’ Order and Volume Director when and in which
conditions the 3DR was created. Moreover, it is revealed who were responsible for
developing the rule and how it is supposed to benefit the company.
3DR was created when the amount of long distance sourcing increased in Volvo Group. This
happened in late 90’s when new Volvo Group was established by acquiring Mack Trucks in
U.S and Renault Trucks in France. Back then the rule was named 3M requirement for all three
truck brands. Up to late 90’s there was mainly regional sourcing for Volvo Trucks which
meant that approx. 5-10 suppliers were not regional (outside Europe). Renault Trucks did not
have any sourcing outside 3-day limit and Mack Trucks had as well regional sourcing. The
new concept after acquisition of other truck brands was having united platform so that one
source would be supplying many sites.
One reason behind the rule was to have a common ground to compare the costs of having long
distance sourcing instead of regional suppliers. This means that purchasers could evaluate the
costs of using long distance supplier not only based on product price but also additional costs
driven by transportation as they had to deliver the goods to regional distance. Additionally,
the 3DR should prevent carrying too much inventory and secure having the reaction time
requested from manufacturing. The guidance in creation for the rule was the final customer
satisfaction.
There is a need for 3 days reaction time in order to avoid speculation on call offs. Even when
the supplier is located within the 3 days limit the call offs are made largely based on
speculation instead of firm volumes.
The group of people working out the set of logistics rules, including 3DR, consisted of
inbound logistics responsible of Volvo Trucks, Mack Trucks, Renault Trucks and VPT

36
Originally the Logistics Rules were not connected to VPT, but the Japanese culture has been a
big influence and guidance on which the rules have been based (Rostén, 2012). According to
that, the suppliers should be located close to the plant and able to react quickly. These
conditions enable to create stability in the production and thereby avoid disruptions at the
assembly line.
In Volvo Group the 3DR has been fulfilled with the establishment of PuPs for the long
distance suppliers within the limit of 3 days normal transport time. The idea of PuP is to bring
goods physically closer to the users and postpone their final delivery until the point when
products are actually needed. In the PuP can be also carried out different value adding
activities like final part number configuration and re-packing. The PuP is operated by the
actor for whom it is most cost efficient, it can be original suppliers’ local site, 3PL warehouse
or Volvo Group owned hub. Most of long distance suppliers make the final configuration of
part numbers in Europe (close to the user).
Based on above, it can be concluded that the 3DR was created more than a decade ago and the
company’s structure was quite regional originally. As well it became clear that not all the
departments affected by the rule were involved in its development. Nevertheless, there was
pointed out a number of benefits supporting the creation and existence of 3DR.
4.5 Volvo Powertrain
VPT’s vision is to add value to the Volvo Group, benefit from their global resources, manage
their platforms and master the core competences (VPS booklet, 2009?) which are the
development and production of heavy engines, gearboxes and drive-shafts. The
manufacturing plants for VPT are located globally - in Sweden, France, USA, Brazil and
Japan. This shows clearly that the case company is operating in a complex supply chain where
distances are great.
4.6 Volvo Production System. Cost efficient approach of Volvo Group
Production
Volvo Production System (VPS) is a Volvo Group guidance which supports the journey of
reaching VPTs vision, which was introduced in the previous paragraph. The top class results
are achieved by raising the operation efficiency level even higher. The final goal of VPS is to
have 100% resource utilization through the whole supply chain by eliminating waste defining

37
its sources. VPS is the first common method for the entire Volvo Group that guides them
towards ultimate operational excellence. For the time being VPS has been implemented in all
of the VPT’s factories and the aim is to include the system to the work of the rest of
company’s units. (VPS booklet, 2009?)
One part of VPS is to reduce the wastes that have been categorized into seven types. The
examples of those seven wastes are over-production, inventory, transportation and waiting.
The goal is to create consistent production flow to decrease and remove excessive buffer
stocks. (VPS booklet, 2009?)
VPS consist of five principles - built-in-quality, just-in-time, teamwork, process stability and
continuous improvement. According to the JIT principle supply of materials should be exactly
in the right time and quantity with the shortest possible lead time. It should be based on pull
demand and minimum amount of inventory. (VPS booklet, 2009?)
For VPT Purchasing the VPS means improvement of cross-functional collaboration within the
company, meanwhile aiming to higher efficiency and effectiveness of purchasing processes.
The suppliers are involved in the approach by Volvo Business Partnership Program.
(Linsolas, 2009)
4.7 VPT Production. Factory in Skövde
The production perspective is limited to Volvo Group common engine factory in Skövde,
Sweden. This factory produces engines for most business areas within the Volvo Group,
including engines for trucks, buses, construction equipment and boats. (Volvo Group, 2011b)
Their aim is to have operational excellence accordingly with the lean philosophy; hence their
focus is on the final customer satisfaction meanwhile keeping the costs on an acceptable level.
Thereby production should respond quickly enough to the changing market demand in order
to keep the customer happy while reducing wasteful activities and inventory. In order to
measure their achievements production has several KPI-s, such as, order fulfilment rate, time
of delivery, product quality (% of defect products), inventory level rate, product lifecycle,
level of waste products etc according to Supply Chain Manager.

38
As production is directly carrying out VPTs core business activities, it will be viewed in this
thesis as the department which is responsible for the cost of owning the goods and fulfilling
customers need flexibly.
4.8 VPT Purchasing
Purchasing is one of the key elements in Volvo production system (VPS). Their KPIs are
measured by unit cost, increasing productivity of supplier (by achieving annual discounts) and
meeting the target cost of the project, as per VPT purchaser. According to the Global
Commodity director, the main strategy for VPT purchasing is to optimize the purchasing
strategy to a global strategy level, to as much as possible leverage purchasing volumes, trying
to make the scope as big and attractive as possible and by that try to achieve the best
conditions on the market.
4.9 Volvo Logistics
Volvo Logistics (VLC) is a Business Unit of Volvo Group nominated to take care of logistics
activities. Their mission is to strengthen the competitiveness of Volvo Group’s customers and
not to profit on them, according to the Global Logistics Development Manager. Therefore
VLC can be viewed as the logistics department of VPT.
From VLC’s point of view their main statement is as per the Global Logistics Development
Manager: “There will always be certain cost and risk elements in a supply chain and the most
optimal setup is when the party that can handle those items in the most optimal manner also
controls them”. On the other hand, according to their strategy it is important to also see the
big picture – not everything can come down to a single flow cost, also important is the
consolidation of the flows and therefore volume effect reducing the overall logistics cost.

39
5. Empirical findings and analysis
In the following chapter the empirical findings will be presented and analyzed. The findings
are based mainly on material gathered from personal interviews carried out at VPT.
Additionally, some secondary sources like focal companies’ documents and presentations are
used.
5.1 Production perspective - ownership
An important KPI mentioned by the Order and Volume Director is the level of capital tied up
in inventories; therefore the target for Skövde plant is to reduce the inventory by more than
50% from the present level. He also says that it is aimed to order only based on actual
demand, which would reduce the stock level, but currently a lot of ordering is based on
forecasts due to lack of delivery frequency and long lead times. The time horizon of firm
order to VPT from its customers is 10-15 days. This time frame includes the time spent on
outbound transportation and production lead time at VPT plant. Those activities leave time for
inbound logistics operations on firm orders only 2-3 days.
Supply Chain Manager of Skövde factory states that in order to shorten the lead time and
hence the levels of transit inventory, they have started to send some parts by air transport to
Sweden instead of sea transport in order to keep the capital tied up for shorter period. He adds
that this method is beneficial when parts are extremely expensive and rather light. Storing
parts at the warehouse does not add value, but there is huge cost associated with the
organization needed for taking care of that.
The Order and Volume Director opines: “Of course not all the products should be managed in
the same way”; there should be a categorization of products based on their volumes and
variation. Thereby, sourcing decision can be taken dependent on the product characteristics.
He explains: “If the volume of goods is extremely low then goods should not been sourced
from long distance. Suitable goods for long distance sourcing are in high volume and low
variation, stable flows”. Supply Chain Manager thinks that the sourcing focus should be on
the part category with the biggest spending. He tells that these items should have a flexible
supply chain and an inventory as low as possible in order not to keep capital tied up. The
cheap parts can have even 50days of inventory from the capital management perspective.

40
Even though three days delivery lead time is acceptable for production in the most cases,
there might still be occasions when this time is still too long according to the Supply Chain
Manager of Skövde factory. As stated in the inventory reduction project mentioned earlier, the
inventory should be reduced to 10 days. Due to that there can’t be held 72 h of inventory in
transit (before production). To reach the goal of 10 days with 3 days of tied up inventory in
transit the work-in-progress at Skövde plant should be reduced. Supply Chain Manager of
Skövde thinks this would result in the used capacity decrease. If the allowed inventory level
will be further reduced then the amount of money that is gained from reduction of tied up
capital is lost in decreased output from production.
There is also another reason for having less than 3 days leads time. As mentioned before the
lead time should rather be short when goods are extremely expensive. Consequently, when
these goods can’t be shipped directly, having PuP as close as possible to the plant is the most
beneficial to VPT according to Supply Chain Manager of Skövde. From financial
performance perspectives it is not possible to keep the ownership of those products even for 3
days as would be the situation with the second setup.
5.2 Production perspective - flexibility
The vision of VPT is to add value to Volvo Group by benefitting from their global resources,
managing their platforms and mastering the core competences (VPS booklet, 2009?). VPT has
been using similar philosophy to Toyota Production System (TPS) as guidance to reach its
stated vision. Their philosophy is called Volvo Production System (VPS). According to the
VPS booklet (2009?) the top class results are achieved by raising the operation efficiency
level even higher. The final goal of VPS is to have 100% resource utilization through the
whole supply chain by eliminating sources of waste. (VPS booklet, 2009?) This implies that
VPT production stresses rather on cost efficiency than responsiveness of the operations.
Therefore the production system requires more flexibility from the inbound logistics.
Supply Chain Manager and Supplier Relationship Manager both agree that having PuP closest
to the factory is the best setup, because the responsibility and ownership of the goods are on
supplier. They explain that this creates a lot of savings for production when order volumes are
suddenly going up or down and gives high level of cost control. It takes a lot of time to stop
the flows and the costs are still increasing even when the production decreases. It might cost
more to have higher flexibility when business grows, but might be cheaper to stop the flow
41
when business goes down. Supply Chain Manager adds that the issue is high uncertainty in
market behavior and the need is to be more flexible (adaptive) and responsive to market cost
wise and production wise.
Another issue brought up by the Order and Volume Director is related to uncertainty and need
for flexibility is forecasting accuracy. In a one month forecast Volvo uses around 99% of the
predicted volumes. In three months the target is to be +-10% on total volume. It takes long
time to stop long distance flow when something happens due to a forecasting error. He
suggests if there are big swings in volume then the reaction time should be as short as possible
to stop the flow when necessary.
The Order and Volume Director even remarks if the volume is predicted quite accurately, the
product variants are often changed. He believes that higher frequency and smaller lot sizes
would create stability. 3 days lead time gives quite firm and stable orders. If the firm horizon
would decrease to 2 days then it would create too many fluctuations, because the quantities
and variants will be on less aggregated level. Volvo gives delivery proposals with max and
min quantity. Going to 4 days it would be based more on forecast, as production knows firm
customer orders 3 days beforehand. Forecast based orders create more volatility and might
cause in the end need for rush transport. The main targets according to the Order and Volume
Director are to keep the firm horizon short, deliveries frequent and lot sizes down; this creates
stability in the supply chain.
The Supply Chain Manager and the Order and Volume Director both agree that in some
situations it is thought that suppliers distance within 3 days lead time is still too long. They
say that another aspect, besides transport time, that should be looked into as well is the
frequency of deliveries. Even when the supplier is within 3 days distance the lead time
becomes long if the frequency of pickups is only once per week. This situation happens when
delivery volumes are very low and thereby the transport becomes costly and inventory levels
at production increase. Preferable delivery frequency to production in the Order and Volume
Directors’ opinion is every day or minimum every other day. In order to still gain some
economies of scale there should be a smaller number of PuPs used for all the suppliers.
The Order and Volume Director also affirms that, even though inventory levels and delivery
frequency are important performance indicators, the most critical is service level. As the
satisfaction of final customer is the aim, then material planning needs to change the orders

42
with short notice, because customer is changing the order. Therefore, he believes that the lead
time should be reduced to avoid the rush transport because there is a need to create flexibility
in the supply chain.
Due to legislation and customs, for example, it has not been possible to have PuP in Japan.
This means that goods have to be sent directly without having any safety buffers in between.
The Order and Volume Director says that not having PuP has caused a lot of disturbances
there for the production. Similarly, Mack Trucks has had disturbances in the operations, since
the 3DR is not implied. The disturbances are related to the old operation systems used at
Mack Trucks which are built up to work with a short reaction time. As a result there has been
allot of need for rush transports according to the Order and Volume Director.
Supply Chain Manager explains that with air transport from U.S the lead time is reduced to
approx. one week. There are fewer problems with flying the parts, fewer delays which might
occur, for example, in ports and weather conditions do not have a very significant impact.
Thereby the delivery precision is better. He also points out that in order to see if setup without
PuP is more efficient there should be a business case done to compare the price of transport
with hub versus direct delivery by plane.
5.3 Purchasing perspective - product cost
In order to achieve the best conditions on the market company needs to be flexible. Even
though 3DR enables flexibility for the production, it does not support the overall flexibility of
delivery process, indeed it is quite strict rule. Supplier simply does not have a choice; they
have to set up a PuP or to be within the limited range. Now, with the era of global sourcing,
PuP at the supplier’s factory would give much more opportunities to purchasing, the
flexibility towards the supplier. If looked at the KPIs for purchasing, it can be understood
quickly why 3DR is not very convenient from purchasing point of view. According to VPT
purchaser, their main target is the lowest product cost. However, any additional demands,
rather than the product itself, will reflect negatively in product price. It is natural that supplier
who is not responsible for the transport and inventory is willing to lower the unit price as an
overall purchasing cost. Additionally, the risks for the supplier in these terms are significantly
reduced, like possible rush transports, damages, threat of scrapping, pilferage etc. For
example, supplier from China reduced the product price by 6% by removing the PuP in Japan,
according to the VPT purchaser.

43
One of the main thing suppliers are always arguing about is the payment terms that Volvo
Group demands - usually around 90 days from the dispatch date, as per VPT purchaser.
Meaning there will be a lot of tied up capital involved for a supplier. In their interest it would
be to dispatch the goods as soon as possible to reduce costs and risks. Therefore, product price
could be also reduced which is the main target for purchasing Driving down to conclusion the
sooner the dispatch date the lower the product price, what is the fastest and most favourable in
terms of a supplier.
Volvo purchasing is benefiting from a global supply because it usually means lower product
price achieved by volume-effect, as per the Global Commodity Director. It is due to the fact
that several Volvo assembly plants are supplying from the same supplier, increasing the
volume and decreasing the unit cost. And some cases it is the only choice because of the
limited number of suppliers, for example strategic components, according to the Global
Commodity Director. It leads to situation where the supplier is very likely long-distance
(overseas) type for the assembly plant. In case the 3DR is implemented, it raises the product
price for purchasing due to increased costs and risks for the supplier. Supplier has to take care
of delivery, stock, ownership etc – and everything will be added up to the product cost,
affecting the KPI for purchasing. Another factor is the supplier’s bargain power – if the
supplier is single-source and bigger than VPT itself, it is really difficult to demand the terms
that are not in the interest of the supplier, and in some cases it has already happened where the
conditions are not accepted by the supplier and VPT has no other choice than to agree,
according to the Commodity Logistics Manager.
As previously mentioned, the payment terms are quite rigid for the suppliers, usually around
90 days from the dispatch date. For a long-distance supplier it could mean 6-8 additional
weeks due to long delivery time to PuP, as per the VPT purchaser. Because of the required
PuP, tied up capital will be very high causing unwanted financial tensions to a supplier
addressing these costs back to customer, i.e. VPT by increasing the product cost. Moreover,
these increased financial risks may lead the supplier to financial difficulties forcing VPT to
re-source the supplier in order to avoid the stoppage of VPS, especially when dealing with
single source. And in some cases, VPT has done that.

44
5.4 Logistics perspective - supply chain control
When sourcing, in order to get the goods from a supplier to an assembly plant, VPT has a
need for a competent logistics provider. There are several reasons for that: fluctuating
transport rates, complicated custom procedures, trade barriers (like custom taxes, legal
issues), risks (damages, congestion, bureaucracy) that might appear etc. according to the
Global Logistics Development Manager. VPT cannot expect that the supplier has all the
competence needed. The supplier’s main task is to provide VPS with the product ordered,
meeting the requirements for quality, quantity etc. That leads to statement that VLC is more
than likely more competent at providing the logistics services than the supplier can perform,
making the product cost lower by decreasing the logistics costs. For instance, according to
VPT purchaser, VPT can negotiate better transport terms (for example chartering long-term
slots on boat when sea rates are low) or avoid extra custom fees (like the supplier had because
of using incorrect HS code for the import component to India.
However, some supplier might locate on vast and remote areas where the logistics capabilities
are low (lack of infrastructure), associated with great risks (damage, pilferage) and expensive
(no competition). In that case, according to the Commodity Logistics Manager, it might be not
useful for VLC to take the risks and to take the high logistics costs.
If we look at the VLC strategy, its goal is to consolidate the flows, rather than let the
customers to diverse the whole VPT logistics creating an individual relation transport setup
(Volvo Logistics, 2010).
On the other hand, by consolidating the suppliers and flows in one area/region, the volume
effect could be gained on main long-distance routes due to better utilization and higher
volumes of transport, creating a consolidated transport set-up, resulting in decrease of the
overall logistics costs.
As mentioned earlier, there are lots of risks involved, especially when dealing with long-
distance transport. By simplifying it could be said: the longer the route the more risks there
are involved. Meaning this scenario is not very favorable of landing the risks during the
transportation – protecting the goods, handling customs, dealing with transport rate
fluctuations etc. there are just too many different variables included.
45
Sometimes it is not clear where to draw the line so that PuP will be within 3 days from
factory. According to the VPT purchaser, there have been a lot of discussions on this issue.
For example, in terms of transport it could be (express service) within the 3 day limits but in
reality it takes much more time from PuP to the Volvo factory (1 week) due to lack of
frequency between those two locations, triggered by the low volume caused by consolidation
difficulties, according to the Order and Volume Director. Any additional PuP on the route
would result in increase of the logistics cost. By using VLC in this situation, we can achieve
consolidations effect where more than one supplier is located in the same area, increasing
frequency and utilization towards assembly plant simultaneously, at the same time keeping
the logistics cost low. For example, one truck will pick up the goods from different suppliers,
consolidating them to one transport unit and transporting them to assembly plant more
frequently than it would be separately each supplier.
When the supplier is arranging the transport itself until PuP, the logistics costs for VLC will
decrease dramatically since their risk and transport responsibility will be limited only from
PuP to assembly plant that cannot last more than 3 days.
VLC part in the flow would be minimal in this setup. Due to that they would be responsible
only for arranging transport for short distances. Cost efficiency would be depending on the
delivery frequency, but utilization rate suffers due to bigger volatility and smaller batches.
5.5 General perspective - acquisition cost
One of the most important issues with picking up the goods from suppliers’ factory is the
financial performance of VPT. According to the incoterms that are being used by VPT
purchasing, the responsibility and ownership of the goods shifts from seller to buyer, when
the goods are picked up by VLC. Taking the ownership and responsibility of goods for weeks
while they are transported makes VPTs cash flow suffer. The latter is not acceptable
according to the Order and Volume Director of VPT, as cash flow is one of the main KPIs at
Volvo.
In addition to improved cash flow 3day lead time also helps to prevent disruptions on the
assembly line and lower the safety inventory levels, but most importantly, regarding to the
Order and Volume Director, the rule serves for comparison of regional and long distance

46
suppliers based on same facts. He claims that the long distance supplier delivering with 3days
reaction time should cost the same or less as the regional one.
The Order and Volume Director also considers it to be well known that the total acquisition
cost (TAC) is not just a product price. In his opinion even for the bigger suppliers with whom
it is hard to negotiate establishment of PuP the extra cost should be taken to mitigate the
supply risks. Otherwise this supplier will become the bottleneck in the production. Therefore
the Order and Volume Director thinks that all the suppliers regardless of their power-position
should be implemented with the same rule. Otherwise the benefits of others agility suffers.
This bottleneck issue is mainly realized during the product ramp up and phase off stages.
The point of view of the Order and Volume Director is that regional and long distance flow
always challenge each other. This means that the risks of long distance delivery should be
considered, because there might always appear unforeseen obstacles. If the long distance
supplier is still more cost efficient then they should be used according to him. Unfortunately,
probable risks are not included in the landed cost analysis, which today at VPT typically
considers external logistics costs (transport, packaging, customs, duties and warehousing) and
working capital cost as commented by Commodity Logistics Manager. For example, when
sourcing very bulky and heavy products from long distances the lead time can be about 48
weeks, which means the orders are based on uncertain forecasts. Latter might cause according
to the Order and Volume Director in the end a need for lots of expensive air freight, thereby
when possible bulky and heavy products should be sourced from shorter distances. When
final configuration is done at the PuP then there is stable flow of basic products coming from
long distance. The worst variant stated by the Order and Volume Director is when final
products are produced long distance where there is long sea transport time and goods come to
regional warehouse where parts are distributed to plants.
The Order and Volume Director explains that the rule is created to have more agility and
flexibility thereby getting best service and carrying fewer inventories. He says, when this is
done in a smart way it will be beneficial to all stakeholders - to Volvo, their suppliers and
customers. He further clarifies that thereby operations will be cost efficient and flows will
become more stable. Moreover, high frequency in transport and info communication will take
out the peaks in the system, small lot sizes and transportation time will lead to this target in an
efficient way.

47
5.6 Conclusion of the findings. Main interests influenced by lead time
changes
Built on the findings from interviews and internal documents, authors made conclusions that
production targets and activities influenced by 3DR are based on reaching the balance
between costs of ownership and flexibility. This finding is based on production KPIs like
inventory level and delivery time. With cost of ownership it is meant the cost of holding
inventories. This includes risk cost (insurance, scrap) and the cost of capital. Cost of
flexibility includes the possibility of making changes at short notice in the production.
For the purchasing department it is important to reduce continuously the product cost (piece
price) as their performance is being evaluated by that. Other KPIs, like order processing speed
for example are not relevant to our study as they are not directly affected by delivery lead
time.
VLC is aiming to decrease the cost of their service (logistics cost) by more cost efficient
transport and logistics solutions. In order to be able to deliver most economic service, they
need to have high transport and warehouse utilization the latter is possible when there are high
volumes of products and good consolidation setup. Nevertheless, logistics cost is an important
performance indicator; it is not the most appropriate measurement to evaluate the effect of
changing lead time on VLCs performance. The direct cost will be smaller for LSP in any case
if the lead time is shorter, but quality of logistics service is further affected by their experience
and knowledge. The benefits of VLC competence can be applied the earlier the goods are
shifting ownership from the supplier to VPT.
Consequently, instead of focusing on direct logistics cost, the possibilities to increase the
logistics setup efficiency, should be more important for the logistics service provider in order
to satisfy the final user. Therefore, from the perspective of changing lead time it is more
important to point out how control of the supply chain (logistics control), rather than logistics
costs, is affecting the inbound supply chain efficiency.
In order to highlight the common interest of VPT inbound processes including production,
authors have chosen to bring up the cost of acquisition. By cost of acquisition in this analysis
it is indicated to product cost and costs for external logistics like transportation, packaging,
customs handling, duties and cost for having an external warehouse. By the definition that

48
authors gave for production acquisition cost, both, purchasing and LSP give a direct input to
productions’ final cost, which is showing in the capital tied up in their inventory and
smoothness of the material feed to the production process.
49
6. Discussion
In this chapter the empirical findings and analysis are discussed from the theoretical
perspective, presented in the literature review section of this thesis. Based on the
information, authors have estimated the value of 3DR from present perspective and discussed
the interests of production, purchasing and logistic service provider influenced by the lead
time requirement. The structure of discussion is arranged according to the structure of
previous chapter “Empirical findings and analysis”.
6.1 Background of the 3DR
It is noticeable from studying the company’s documents, that the rule was created when the
Volvo Group was smaller than it is today. By that time they had acquired Renault Trucks in
France and Mac Trucks in U.S., whereas today VPT also has its operations located in Brazil
and Japan. This means that VPTs logistics networks have grown and become more
complicated. As companies start growing globally, the order cycle time gets significantly
longer. Instead of goods being in transit from 1-5 days, global operations cycle time can
generally take weeks or months. (Bowersox, 2010) Until the period when 3DR was developed
most of the sourcing was done regionally and the system was built up to work on a short
reaction time. Therefore it is easy to understand the convenience of three day reaction time to
simplify and stabilize the material control of incoming goods for production when lead times
are increasing and uncertain. On the other hand in current complexity of the network some
cases the fulfillment of 3DR might cost more than it gives benefits.
Several reasons behind increasing lead times are according to Bowersox (2010) financing
requirements, special packaging requirements, ocean freight scheduling and customs
clearance which lead to longer cycle times. These attributing factors mean that the global
supply chain becomes less consistent and flexible compared to regional sourcing. This lack of
consistency makes planning and coordination of material flow a complex task. (Bowersox,
2010) Therefore it is understandable why companies want to shift the risks of uncertainty and
ownership upstream and take the responsibility of goods in as late stage as possible.
Nevertheless, it should not be forgotten that in the end the price for moving and acquiring the
good has to be anyhow, even if it might not be a direct cost.

50
New sourcing strategy, supported using one supplier for all the truck brands, with the reason
that it was clear that even if one supplier was located close by one material user, it still
became long distance source for the others. The benefits of single source strategy (Lysons,
2007) and buying often from a low cost country (Bowersox, 2010) are the reduction of
transaction costs, economies of scale and lower piece price. Unfortunately the total cost
impacts of long distance sourcing are not always considered. Purchasing might have the
benefit of reducing the piece price while sourcing overseas, but the impact should be
considered for the whole supply chain to make the correct sourcing decision. It is necessary to
understand the difference between piece price and total cost. Latter consists of cost elements
like freight, inventory, obsolescence, duties, taxes and other possible risks. (Bowersox, 2010)
Consequently, there was a need to have one common baseline to evaluate the benefits of
sourcing commonly from long distance, compared with the previous regional supplier. The
Three day rule was a reasonable basis for comparison if the long distance supplier really was
more cost efficient than the regional one when additional cost elements are being considered.
There was also a need to reduce the days of inventory held, since cash management has
always been an important performance indicator. As Bowersox (2010) explains, the longer
cycle time results in higher capital involvement, since a large amount of inventory is in transit
at any point in time. Therefore, the preferred way to lower the amount of capital tied up, was
to have a rule which demanded that suppliers keep the goods in their property up to the PuP –
in other words, most of the transit time. By doing so, the company is just shifting the costs of
carrying inventory further upstream (Christopher, 2008) which might be justified in some
cases when it is cheaper to hold products in semi-finished form at the suppliers’. Moreover, it
should not be forgotten that in today’s business environment, it is not just the companies, but
also the supply chains that compete with each other and all the costs will be reflected in the
final price for the customer. (Christopher, 2008) According to Rushton (2006) some costs can
be eliminated when the buyer is taking control over inbound material flow. For example, at
times, the suppler may have a higher cost of capital compared to the buyer which will be
shown in the piece price. Previous reflects that from supply chain perspective it should be
carefully analyzed whether shifting ownership within three days limit is the most efficient
setup for inventory reduction and release of tied up capital.
As mentioned above, when the rule was first introduced, there was less complexity in the
supply chain and the proportion of long distance suppliers was lower. Now when the company

51
has grown and expanded further to emerging markets, its supply chain has become more
complex. Hence, the validity of simplistic rule, such as 3DR, applied without any exceptions
within complicated circumstances, has been questioned. Christopher (2008) writes that today,
there is a need for multiple supply chain designs, instead of the now traditional “one size fits
all” solution. It may be that keeping the supplier responsible and owning the goods is not cost
efficient due to the lack of knowledge, experience, interest or financial state of the supplier.
Therefore VPT should carefully consider whether it is more economical to take the
responsibility and control for the material flow or let suppliers handle it, keeping in mind the
consequences for the final cost to the end customer. On the other hand, in some cases the
required three days might be too long to keep the components in VPTs inventory as they may
be too expensive from a risk and cash management perspective. Bowersox (2010) highlights
that inventory strategy should be based on core customer segmentation, product profitability,
transportation rates that depend on product volume and shipment size, time sensitivity and
competitors’ performance. Similar idea is presented Christopher (2008) who recommends
identifying the appropriate logistics setups based on products’ and its supply and demand
characteristics. This indicates that both ownership and need for flexibility are dependent on a
various number of factors and the lead time requirement should be adapted accordingly.
Finally, the rule was created by production representatives, and other actors, like the
purchasing and logistics service providers who are affected by it, but were not involved in the
decision process. The importance of everyone’s commitment has been mentioned by Bergman
(2003) as one of the principles in quality management, because lack of involvement may
cause rejection to filling the rule by those parties and lead to a conflict between different
functions. This behaviour has been noticed by non-fulfillment of the rule on several occasions
and strong rejection for acknowledging it as a firm requirement, not just as guidance. Thus it
is essential to involve every party concerned in the decision making process.
6.2. Production perspective – ownership
According to the Volvo Group (2011a) for long distance suppliers, the supplier takes full
responsibility and ownership up-to and including the PuP. Therefore the further afield the PuP
is located, means longer lead time, and a larger negative effect for the cash flow of VPT.
However, cash flow is an important performance indicator for VPT and its significance has
been also highlighted in the literature. According to Hofmann (2011) the working capital and
cash flow are important indicators showing supply chain performance. One way of seeing

52
working capital can be as an inventory that has to be financed with interest bearing capital.
This implies that the more inventories are held the bigger is the investment of holding it and
cost of capital carried. Due to the interest cost it is beneficial for VPT to hold the goods in
their property for as short time as possible. Hence, with longer lead times it is beneficial for
VPT to take the ownership and responsibility of goods as late as possible in the process to
prevent high cost of holding inventory.
Like mentioned above, besides cost of capital there is also the cost of holding inventory which
is driven by the value and characteristics of the goods. Lysons (2007) has written that costs
related to physical characteristics of goods are storage and labour costs. Storage costs are
driven from the space required, stores’ rates and energy consumed for heating, light and
power. This implies that the decision of inventory strategy should not only consider the
distance of supplier, but also the characteristics of goods and their storing requirements.
Holding inventory is also related to the insurance cost the risk of goods getting obsolescent,
pilfered or deteriorated (Lysons, 2007) Therefore it is wise for companies to avoid any excess
inventory that could be harmed and useless in the end. Based on the latter, from a financial
aspect the target in VPT to reduce significantly the inventory levels at plants, is correct.
In order to achieve the inventory reduction targets one approach VPT uses is the Volvo
Production System which is comparable with Japanese Philosophy. This philosophy, lean,
(introduced in the theory section) has JIT as one part of that system. Schniederjans (2010)
writes that, one JIT inventory principle is to reduce lot sizes and have more frequent orders.
This, in turn, results in having less average inventory, which reduces tied up capital, interest
costs, insurance costs and frees up the physical space. The final goal would be in JIT to
eliminate all inventories and reduce the buffers. Provided that, from a financial perspective it
is practical to apply cost efficient approach.
Nevertheless in most cases postponing the shift of ownership is beneficial for VPT, additional
financial analysis should be done when VPT is buying goods from small or medium sized
suppliers located in emerging markets. As Hofmann (2011) illustrates, when strong buyers
enforce the extension of payment to smaller suppliers it is shifting the working capital
upstream to a company that might have higher weighted average cost of capital. In this
situation the suppliers pay higher interest rate than VPT which may increase the product price.
Thus, VPT could carry in the end higher total costs for the acquisition.
53
Moreover, it should not be forgotten that smaller inventory levels which reduce tied up capital
and responsibility can end up in trade-off with increased disruptions in production and higher
piece prices. According to Hofmann (2011) bigger inventory levels reduce the risk of loss in
production but require high capital commitment. On the other hand, low levels of inventory
lead to possible shortages and the higher probability of disruptions in production. He has also
stated that the optimal would be to have a low level of positive working capital e.g.
inventories.
Therefore, from an ownership cost perspective the shorter the lead time to the factory, the
more beneficial it is for VPT production, as the capital tied up and holding cost of inventories
is decreased. The latter is valid as long as VPT continues to use the incoterm currently stated
in the purchasing contract (FCA), which indicates that ownership shifts in the PuP. Still it has
to be mentioned that cost of ownership is closely linked to cost of flexibility and acquisition,
which will be analyzed in the following sections, so the savings in one area could cost more in
the other.
6.3. Production perspective - flexibility
Christopher (2001) states that in order to improve the supply chain performance, supply and
demand should be attempted to match. This makes it possible to reduce costs, while at the
same time increasing customer satisfaction. Reducing costs as discussed before is somewhat
connected to reducing the inventory levels and customer satisfaction depends on quick
response to their needs. Unfortunately it is difficult to predict the need of customer in
uncertain environment, while theory suggests that in order to enable the performance
augmentation the uncertainty needs to be reduced. (Christopher, 2001) At times, though, it is
not possible to have certainty if the tolerance towards customer order changes is high and the
market unstable. Subsequently companies need to have flexibility in their operations to handle
the uncertainties. Short lead times, safety buffers and overcapacity are the means to secure
that flexibility. For example, in VPT shortening the lead times to 3 days is one way to cope
with uncertain demand.
In some situations the cost efficient approach is suitable, especially when there is a low level
of uncertainty in demand, small numbers of product variants and volume is high.
(Christopher, 2000) But in circumstances that VPT is facing today, with large numbers of
different parts numbers, and high level of changes in demand, then cost efficient strategy is

54
not the most appropriate. When a company needs to respond quickly to the changes in volume
and variety, then their supply chain needs to be responsive. This means that volatile and
unpredictable demand requires nimbleness.
In order to provide greater customer satisfaction the frozen production plan horizon at VPT is
very short and leaves just a few days for the inbound logistics operations. This means that
products are ordered based on forecasts. As stated by Christopher (2008) forecast are always
wrong and the error increases as the planning horizon increases. At VPT the orders in an
aggregated level are quite accurate, but when it comes to the product number level then it is
very hard to make exact estimations. This creates a need for an increase in stock of a large
number of parts. Christopher (2008) also suggests that in order to reduce the forecast error
and safety stock levels the lead time should be reduced. He states that the target of any
organization should be to reduce lead time as close to zero as possible. From this aspect the
closer the PuP is to the user plant the better it is for VPTs inventory levels, as it allows to
make the order call offs based more on real demand rather than forecasts.
Demand based call offs are also beneficial for the suppliers as the flow is made more stable.
Because of the higher levels of safety stocks caused by long lead times, over time the
fluctuations in order quantities can be much bigger than in demand quantities. This means that
the forecasting error is contributing to a bullwhip effect, which is influenced by passing
uncertain information to other supply chain members (explained previously in theory) In
order to even further decrease the negative effect of fluctuations in demand, the ordering
should be more frequent and in smaller batch sizes.
As found in the interviews, a further need for a fast reaction is due to a number of VPT plants
which have old systems that were suitable to use when most of the suppliers were located
regionally. Those systems need to have a short production and material planning horizon with
fast reaction time in order to prevent rush transport and disruptions at production.
As stated in the literature review, there are occasions, when neither cost efficient nor
responsive strategy is appropriate for the supply chain. Still, there exist a number of situations
where the most reasonable is to combine those two strategies. These hybrid strategies take
into consideration the different characteristics of a product and their supply chain is designed
accordingly. This could result in having cost efficient approach applied for part of the supply
chain and responsive to the rest. (Christopher, 2000) This strategy is exactly what is aimed for

55
by production with having a PuP carrying strategic inventory closer to the plant. This way, for
long distance transport, up to the PuP, larger batches can be delivered in a stable, cost
efficient flow. For small distances, from PuP to the VPT factory, delivery frequency can be
increased and orders based on exactly what is used.
The PuP which represents decoupling in the supply chain should also express the state in
which inventory is kept. The goal in responsive strategy is to have the inventory in a generic
form as possible. This is done by postponement, (introduced in the theory chapter) where the
final configuration or delivery is delayed until there is direct demand. (Christopher, 2000)
There are a number of benefits that a company gains from the postponement strategy. Firstly
there will be less stock keeping units (SKUs) held in inventory because the products are kept
at a generic level. (Christopher, 2000) Therefore, the overall inventory will be reduced, which
is in accordance with the overall goals of Volvo Group. Secondly, the postponement is also
beneficial from a purchasing perspective, as the same parts, modules or platforms can be used
for several end products. (Christopher, 2000) Finally, it is more accurate to forecast at a
generic level than on the end product level. According to theory, the material decoupling
point should be placed as far downstream as possible in the supply chain, hence the PuP
should be located close to the plant.
6.4 Purchasing perspective – product cost
Purchasing at VPT is evaluated by the lowest possible product cost standing the requirements
for quality, suitability, availability etc. The purchasing theory states: “Purchasing is the
management of the company’s external resources in such a way that the supply of all goods,
services capabilities and knowledge which are necessary for running, maintaining and
managing the company’s primary and support activities is secured under the most favourable
conditions.” (van Weele, 2010 p.3)
From the purchasing point of view, considering their main KPI, it is understandable that it is
in their interest is to dispatch the shipment as early stage as possible in order to achieve the
lowest product cost at the time of transaction. The procurement logic says: the later the
dispatch of the goods during the transaction between a buyer and a supplier occurs, the higher
the product cost for a buyer will be (Incoterms 2010). This is due to increased cost for the
supplier since the goods in its disposal are carrying the all the risks (loss, damage, pilferage,
scrapping, fluctuation of rates etc.) and additional expenses (transport, handling, customs

56
duty, tied up capital etc.). Additionally, shortened cash-to cash cycle (due to earlier dispatch)
will reduce the tied up capital cost and financial risks for the supplier. According to Hofmann
et. al (2011), shorter cash-to-cash cycle reduces the tied up capital and leads to increased
capital efficiency, which in turn creates lower cost of capital as well as to better credit rating.
So, in our case, if we use the PuP at the supplier’s factory, both the risk level and cash
turnaround time will be minimal for the supplier and therefore the lowest possible product
cost is achieved.
On the other hand, if the dispatch location would be on a later stage of the supply chain (near
or at the assembly factory in our case), the cash turnaround time and additional costs (due to
the increased risk level) for the supplier would increase quite significantly and would be
included in the increased product cost for the buyer (VPT). Therefore it is understandable that
from the purchasing point of view it is not always applicable to use the 3DR
However, the Landed Cost calculation should be used when executing procurement process. It
means that VPT should know what is the “actual” product cost since a lot of money can be
burned between PuP and assembly line – for example when goods are picked up at supplier’s
factory and thereafter one can allocate a lot of resources for transporting, handling,
experiencing losses, managing risks etc. The Landed Cost or the Total Acquisition Cost will
include these expenses and consider the risks involved. In addition to transportations cost, the
Landed Cost model also includes packaging logistics cost (since all supplies must be packed
to Volvo emballage), customs handling and duty costs, external logistics centre costs
(loading-unloading, packing-repacking etc) and working capital cost (internal/external cost of
capital/inventory). In this case the actual product cost will reveal and comparison between
different set-ups could be done – is it useful to use PuP at supplier’s factory, within 3 days
limit or at Volvo assembly plant.
But the Landed Cost calculation could be denied if in the bigger picture and for the greater
good it is still reasonable to use another setup different from suggestion from the Landed Cost
results. Depending on the product, different strategies (single vs multiple sourcing, global vs
local sourcing, partnership or competitive relationship, buying on contract or on spot basis)
could be applied, depending on an output of the supply market research (one, few or several
suppliers/buyers) and risk assessment (technical, commercial, performance risks). (van Weele,
2010) Meaning, purchasing strategy could be even more important to study since as already
mentioned in a larger scale more money could be saved than the extra cost of single setup. For

57
example, the benefit from single sourcing (cost reduction due to higher volumes, several
plants ordering from the same supplier) is exceeding the additional cost caused by the PuP
setup selection (PuP near the assembly plant resulting increased product cost).
6.5 Logistics perspective – supply chain control
Currently VLC focuses mostly on direct costs like transportation, packaging, customs duty,
warehousing etc. Indirect (quality assurance, increased material control, capital tied up) and
hidden costs (problems due to lack of material, rush transports due to demand fluctuation,
buffer inventory, overseas contract managing cost) are also tried to involve as much as
possible.
Talking about PuP at supplier’s factory, it is related to remarkably high logistics costs due to
increased distance and risks. In a new model, total logistics costs or supply chain costs are
calculated by adding lots of different variables. In addition to TAC mentioned before, there
are other cost drivers: Quality Assurance Risk (costs for damage prevention, claims
administration, insurance, reverse logistics etc.), Internal Logistics Costs (loading/unloading,
stripping/stuffing, storage, repacking), Material Control Administration Costs (material call-
off costs, fire-fighting, forecasting and planning) and Supply Chain Risk (“hidden” costs for
robustness and flexibility to prevent disruptions) according to the Global Logistics
Development Manager. By doing this, more precise and actual logistics cost is achieved.
However, VLC-s main strategy should be also carefully followed: The Consolidated
Transport Set Up. Shipment consolidation is a logistics strategy that combines two or more
orders or shipments so that a larger quantity can be dispatched on the same vehicle to the
same market region. This may enable considerable economies of scale, greatly reducing the
transportation cost per item, per order, or per unit weight (Ulku, 2009). In VPT’s case it
means consolidated delivery to cross dock (for example hub in China) and high volumes
directly to assembly plants (increased volume FCL container loads decreasing the sea freight).
It can be both implemented in distance PuP-s (within 3 day) and long distance PuP (at
supplier’s factory) setups. Nevertheless, the logistics cost from supplier’s factory will be
considerably higher because of the increased cost due to longer transport time and higher risks
that may appear. Also remarkable administration costs would be involved because of
increased communication and networking. Therefore the whole setup process must be
carefully considered.

58
On the other hand, especially when talking about set ups from vast areas where there is no
effective consolidation possible, the supplier can take the risks and costs themselves when the
Landed Cost calculation is the same or almost the same for VLC and for the supplier. It could
also be that some suppliers that are the size or even bigger than Volvo Group itself, can
themselves have an effective set up and competitive price themselves already – again,
according to the Global Logistics Development Manager, it would be very convenient to use
the supplier and it’s efficient logistics set up, following the logistics main principle: “There
will always be certain cost and risk elements in a supply chain and the most optimal setup is
when the party that can handle those items in the most optimal manner also controls them”.
But as mentioned, following the strategy principle, on a big picture the benefit from
consolidation could overrun the cost saving benefit from a single set up. On the other hand, in
some cases frequency, punctuality and timing can have greater impact on cost than the saving
from the consolidation – consolidation usually means somewhat longer lead time due to the
waiting time in order to collect different shipments into one unit of transport because we
cannot expect all the part loads will arrive to the consolidation centre on the same time. The
shipments must be handled, sorted, warehoused etc. It all means extra time what leads to
additional cost (tied up capital, possible delays in production). If the transport schedule is
interrupted it can have an impact to the overall logistics setup (Woxenius, 2006). For example
when consolidation is prioritized (waiting for shipments in order to collect them into one unit)
instead of timing or frequency of scheduled transport it automatically affects punctuality and
transport time of the delivery (Woxenius, 2006). Without saying, in this case the whole
production system could be jeopardized dissolving all the previous cost saving from shipment
consolidation.
6.6 General perspective - acquisition cost
As mentioned earlier, in this research it is meant with acquisition cost the landed cost for
buying goods to production. It consists of the product price generated by purchasing, and
external logistics cost added by 3PL service provider. Dependent on the location of PuP the
logistics cost can be created by VLC and directly carried by production or if supplier delivers
the goods to PuP closer to the plant, then the 3PL costs are added to product price. As Volvo
Group Logistics Requirements (2011) state that all logistics cost like transport, packaging,

59
warehousing etc up-to and including the PuP should be included in the product price. Latter
influences purchasing performance indicators, but does not have to be definitely
uneconomical if the suppliers 3PL provider is more efficient than VLC.
According to Bowersox (2010) the positive impact of logistic services is directly affected by
the operating system design. The system needs to balance the performance, cost and
flexibility of the supply chain. As pointed out earlier the cost and flexibility need are differing
among products, therefore should also the operating system design be adapted to the
characteristics of products. There are two main structures that can be used for operating
system design. The first is called echeloned structure where warehouses are used to create
inventory assortments and gain economies of scale through consolidation. (Bowersox, 2010)
This system could be compared to the second setup that VPT is using for deliveries. Second is
direct system which implies that goods are shipped directly to customers’ destination. If it is
economically feasible the direct alternatives are preferred as they reduce intermediate
inventory and product handling. (Bowersox, 2010) Nevertheless, sometimes this cost has to
be taken in order to have needed flexibility. Furthermore direct logistic solution is often
limited due to its high transport cost and potential loss of control. Even if the direct logistic
system is operated by VLC and the transport cost could be lower, as well as control over flow
gained, the ownership and flexibility cost might still be affecting the total inbound logistics
cost negatively.
All in all, concerning the landed cost for production, the PuP location is not the defining
factor; nevertheless who is paying directly for the delivery process up to buyers’ factory, the
final cost will be reflected in the product price and has to be carried by the buyer anyway.
Hence, for the focal company it is most beneficial to have an efficient logistics system design,
irrelevant of who is operating it. Unfortunately, it is often attempted to push the expenses to
other members of the supply chain in order to appear more profitable. Latter situation is
described by Christopher (2008) who claims that currently a number of companies define
their costs restricted to the ones that are accounted within the borders of their own company.
This indicates that the focus is not on the final price for the end-customer. Yet, in today’s
business environment competition takes place between entire supply chains instead of
individual companies. Therefore, more appropriate ways of looking at costs would be from
total supply chain perspective (Christopher, 2008). This means that cost and responsibility

60
should not be pushed always upstream of the supply chain for suppliers to carry if the landed
cost for the focal company increases in the end.

61
7. Summary
In this chapter the results of the analysis will be put in a nutshell. Answering to the main
issues presented in the beginning of the thesis will thus prove that the work has fulfilled its
purpose.
7.1 How has the impact of 3DR evolved in time?
Investigation of the background of the rule confirmed to researchers that the main reason
behind it was to secure continuous and stable material flow with acceptable level of
flexibility. Furthermore, it supported the release of capital tied up in inventories. These
motives have been clearly stated in the rule itself: “In order to meet flexibility and cash flow
requests while optimizing lowest total cost the suppliers must take full responsibility and
ownership to deliver from a PuP meeting lead-time requirements”. As it was also discovered
more than a decade ago the supply chain of the company was not yet so complex and it was
easier to fulfil the requirement. Even if the purpose of having short lead time is presently as
an important issue as it was, the idea of having one fixed PuP setup option sets limitations to
the possibility that the control of the material flow is in the hands of the party who it fits for
the best. In the end strictly following the rule might result in opposite effect to the costs and
flexibility than stated in the rule.
Another important idea with establishment of this rule was to have a simple basis to make
sourcing decisions not only based on direct product costs, but also considering the risk and
cost of delivering goods from long distance. Even if the rule is quite straight forward and easy
to understand for everybody, it still does not mean that everybody definitely agrees with its
rigidness. As it was discussed and decided by people with production background, it does not
take into considerations other actors involved like purchasing and logistics service provider.
Moreover the second part of the rule which states that the PuP has to be located within 3 days
is not well enough advocated; why is the same reaction time necessary equally to all suppliers
regardless to the pattern of supply and demand, as well as value of their products. It is not
always needed to have strategic decoupling point if the flow of the goods is stable and
predictable or the value of products is somewhat low.
62
7.2 How is the changing lead time impacting the performance from
production, purchasing, logistics and general perspective?
From production perspective the rule is mostly beneficial. As previously defined two of the
most significant considerations for productions inbound flow are the cost for owning the
goods and assuring the necessary flexibility. To ensure that these costs are decreasing the aim
is to shorten the delivery lead time as much as possible. Consequently the closer the PuP is
located to the VPT factory the higher the flexibility will be of making short term changes in
product call offs. Also risk will be the lower and cost of capital related to keeping bigger
safety buffers and inventory in transit for longer time.
Whilst purchasing is evaluated by their ability to lower piece price it is one of their most
important concerns. Therefore they prefer that the indirect costs related for example to the
logistics activities are separated from the direct product cost. This is possible if the logistics
provider takes the goods directly from the supplier, the later the ownership and responsibility
is shifted the more inconvenient it becomes to the purchasing department performance.
Whereas is was decided that for logistics service provider it is not so important to have low
cost for their service depending on the amount of business, but rather how much control they
have in order to gain more efficiency. This means that nevertheless the cost increases while
distances are increasing, VLC will get paid for their service anyhow. What is important is to
satisfy the customer, in this case VPT production, by offering more an efficient setup
compared to what the supplier could provide. In order to fulfil this goal VLC needs to
maintain the control. Dependent on the possibility of having the most suitable logistics setup
the bigger the control of VLC should be, so if they are competitive, the most beneficial is to
have the PuP as close as possible to the supplier.
As from the general perspective it cannot be unambiguously defined which is the most cost
efficient set-up, due to the fact that all the risks and costs have to be carried anyway in the end
and if the production is not paying for it directly it will be still added to the final price as a
hidden cost which is harder to estimate. Therefore, for finding out which setup is the most
cost efficient for acquiring the goods, an individual business case for different product groups,
supplier location, supplier size and competence etc. needs to be looked at.

63
Even though, it cannot be directly decided how the location of the PuP is affecting the
acquisition cost, this information is still included in the results of the lead time impact on
inbound logistics activities. The reason for that is to point out that the issue of delivery
performance and cost efficiency is not a simplistic problem just depending on the length of
lead time and it has to be analyzed case by case which is the best suiting logistics setup.
This has been concluded in the table 3 below illustrating how PuP at different locations
(decreasing lead time) affects the main performance indicators of the actors involved in
inbound logistics activities.
Production Setup 1 – longest lead time
Setup 2 – lead time max 3 days
Setup 3 – shortest lead time
Ownership cost High Medium Low
Flexibility cost High Medium Low
Purchasing
Product cost Low High High
Logistics service provider
Logistics control High Medium Low
General perspective
Acquisition cost BC* BC* BC*
* Business Case needs to be done
Table 4: Influence of lead time changes

64
8. Implications
In this chapter it is discussed wheatear and how focal company could proceed with the three
day lead time requirement. Further general suggestions are given for the companies with
related issues. Finally authors recommend some topics for VPT that could be additionally
investigated in order to continuously improve inbound logistics performance.
8.1 Implications for VPT
Authors think that, yes, there should be a lead time requirement driven by the needs of
production, but not a fixed rule applied to all suppliers. The three day requirement should be
rather seen as guidance to compare different suppliers based on same facts, but the actual
requirement for specific suppliers should be dependent on the results of analysis of the value
and the need for flexibility. These analyses should motivate how long the needed reaction
time is. It does not have to be always 3 days it might be sometimes longer or shorter. For the
simplicity there could be created a small number of product categories based on their physical
characteristics, value and flexibility need, that have certain lead (reaction) time requirement.
This requirement should be respected by other VPT functions and the most efficient way to
fulfil the rule should be sought by making a TAC analysis.
The recommended process with involved actors and information flow is presented at figure
14. The process involves three actors, which are production, purchasing and logistics. These
actors are involved in activities which should end up in deciding upon the most suitable
suppler selection and logistics solution. In the first step of the process all the actors involved
should give their input for value and flexibility analysis about relevant product(group). The
output of the combined results of these two analyses should determine the necessary reaction
time requirement for the product(s) in question. Dependent on this information logistics and
purchasing departments should make a TAC analysis resulting in finding the most cost
efficient logistics setup and selecting the supplier that can meet VPTs requirements in the best
way.

65
Figure 14: Recommended process for VPT defining the inbound logistics flow
8.2 General implications
Based on the study done on focal company, it can be generalized that in complicated networks
of actors, activities and resources, there cannot be applied one cure similarly to all the
problems, nor one strict rule to all suppliers. It is beneficial to have general guidance, but
there will always appear a number of exceptions that make it not possible to follow it as a
rule. There is a threat that by making a rule which is too simplistic it will lose its meaning and
create even more confusion as it is not straight applicable.
On the other hand, when it is decided to create a common guidance like that, it is vital to
include all the involved actors in the problem discussion and solving process. This way there
is more probability to reach optimal results and everyone’s commitment.
Considering it is not always possible to have sub optimization for different departments and
there will be a trade-off between various indicators, it is important that everyone has in mind
the greater goal that is set for the overall company. In order to make that possible,
departments of the company should be measured consistent with general objectives, because
what gets measured gets done.
Finally, as mentioned before this guidance should not be too general. Its requirements have to
be well motivated and dependent on the characteristics of product, its supply and demand. If

66
the latter is ignored then the rigidness and unsuitability of the rule can have a critical affect on
the performance of inbound material flow. For instance, there could not be taken into
consideration the hidden costs of delivery process and the control of activities could end up
not being in the hands of the party who can carry them out most efficiently.
In conclusion, when developing a general logistics rule, it has to be well explained why and
how it should be executed. To well motivate the reasons behind the rule, it should be assured
that the rule is appropriate in the conditions set by market and the product it is applied to. In
order to make the rule serve its defined purpose it has to be accepted and supported by
everyone whom it involves.
8.3 Suggestions for further research
As this research was based on the old structure of Volvo Group, which was reorganized
during the process of writing this thesis, then many improvements are already going on like
developing a process for TAC analysis, improving cross-functional teamwork etc. After
making conclusions about the study researchers believe that the company is heading in the
right direction and should continue with close collaboration between different departments
and secure a steady communication flow. In order to further evolve the advancement, some
additional studies could be conducted about VPT logistics.
During the writing process a number of interesting ideas appeared which could be further
studied in the company. Firstly, as this paper was limited to one production site at the group,
it might be valuable to have an insight how its other sites conceive and work with the rule. It
might appear that they have already solved the issues regarding the requirement and
developed a well working process to handle inbound logistics operations most beneficially for
VPT.
Secondly, it would be good to know the possibilities and effects of shifting the responsibility
and ownership of the goods in different points in time and space. Therefore it could be
interesting to see the alternative possibilities of using and adjusting incoterms. Maybe the
responsibility of transportation and ownership of the goods do not need to be shifted
simultaneously.

67
Thirdly, the actual need for supply chain flexibility could be further investigated involving the
market behaviour and outbound logistics activities to the research. Is the aimed high
responsiveness to customer demand really worth its price always?
Finally, as it has been noted by several employees of the company, not only the distance of
PuP is important for defining the actual time to receive goods, another important factor is the
delivery frequency. Hence, ways to increase delivery frequency should be looked into for
smoothing the inbound material flow. It could be possible to secure stable and accurate supply
of goods even when suppliers are not exactly within 3DR, if the demand is predictable and
shipment from supplier sent often.
68
9. Sensitivity analysis
In this part the possible consequences are brought if another method had been used, people
interviewed in another way, different theories had been used etc. Would the same results have
been made? In general, this part is the critical reflection to the work in this thesis.
Assuming that the data and accessibility would have been the same another way of approach
could have been used. The method is called a survey research. The approach would have been
similar to the one executed – conducting preliminary background interviews in order to
understand the subject and to target the focus groups for interviews. Different departments
should use somewhat different questionnaire related to their specialty in order to survey the
problem more deeply.
Basically the whole build up of survey would have been on a scale basis, meaning that all the
questions would be answered on predefined scale. For example, the answers would be
between “Strongly Agree” and “Strongly Disagree” on five point scale. On the other hand the
scope of the interviews would have been narrower and most likely many aspects would not
have been revealed due to the narrow type of questions. However, by conducting structural
interviews deviation could be an option by leaving some space for personal opinion or giving
the chance to explain something by your own words which would also wider the scope a bit.
Using a structural computer based survey would have given more respondents with more
similar type of answers allowing statistical conclusions and pattern making what would have
been an advantage when proving the conclusions.
Answering the main question of this chapter, whether we would have ended up with the same
answers then probably yes, tough the recommendations would have been somewhat different
since the narrower scope of structured interviews. But it is been admitted that both studies
would answer the main research problem in the same way, stating that lead time requirements
should not be implemented at all costs.
In order to assure the validity of the qualitative data of the research, accuracy and credibility
has highly been taken into consideration. Therefore, all the conducted interviews have been
recorded in order to be able to come back to them later on, while providing descriptions of the

69
empirical findings. To even increase the quality of the study it has been made possible to
check back with interviewees when something has remained unclear and needs further
explanation. Finally, three different departments have been used to investigate one common
issue, which is the lead time requirement. This approach gives us three sources of data about
the phenomenon and helps to find connections between them and create a more holistic
picture about the study problem.

70
10. Conclusion
In the following chapter the results of the analysis and discussion will be concluded.
For a successful supply chain management cost efficiency and flexibility should be balanced.
How it is executed should be agreed between all the parties affected by the decision. Thus,
people with the most expertise about each field should be involved in the decision making.
Every part of the company should carry out what they are best at, like purchasing negotiating
the contracts and choosing best supplier, logistics arranging the most efficient setup and
production producing according to the demand.
In order for everybody to play their best part, there is a need for close collaboration between
above mentioned functions. At the end, smooth collaboration would result in optimized
performance for the inbound logistics.
For performance excellence, it is more and more stressed that business management should be
rather process oriented and instead of different functions working separately. Latter also
implies that more cross-functional work should be applied.
In case a general logistics rule is implemented without taking into consideration the sub-goals
of all departments involved and not aligning their KPIs with the new requirement, it causes
resistance towards this rule. Due to that, the collaboration between people involved and
overall performance of the company suffers.
Additionally to previously mentioned aspects impacting development of a generic rule, there
has to be considered the evolvement of the business environment. It appears that in changed
circumstances the rule is not uniformly applicable to all suppliers. Therefore, it is wise to
assess the feasibility of the rule from time to time.
The company’s structure as well as the market has become more complex and it is not
efficient to implement on every supplier “same size fits all” strategy. This implies that the
requirement should take into consideration the supply and demand of the product.

71
List of references
Books
1. Ballou R. H., 2004. Business logistics/supply chain management: planning, organizing,
and controlling the supply chain. 5th ed. Upper Saddle River, N.J. : Pearson Prentice Hall
2. Bergman B., Klefsjö B., 2003. Quality from customer needs to customer satisfaction.
Lund : Studentlitteratur
3. Blumberg, B., Cooper, D. R., & Schindler, P. S., 2008. Business Research Methods.
London: McGraw-Hill Higher Education.
4. Bowersox D. J., Closs D. J., Cooper M. B., 2002. Supply Chain Logistics Management.
New York : McGraw-Hill
5. Bowersox D. J., Closs D. J., Cooper M. B., 2010. Supply Chain Logistics Management.
3rd
ed. New York : McGraw-Hill
6. Bryman, A., & Bell, E., 2007. Business Research Methods. New York: Oxford University
Press.
7. Christopher M., 2008. Logistics and Supply Chain Management.4th ed. Harlow: Financial
Times Prentice Hall
8. Christopher M., 2011. Logistics and Supply Chain Management.5th ed. Harlow: Financial
Times Prentice Hall
9. Coyle J.J., Bardi E. J., Langley C.J., 2003. The management of business logistics: a
supply chain perspective. 7th ed. Cincinnati, Ohio : South-Western/Thomson Learning
10. Hofmann E., Belin O., 2011. Supply Chain Finance Solutions: Relevance – Propositions –
Market Value. Heidelberg ; New York : Springer
11. ICC. 2010. Incoterms 2010. Paris: Internation Chamber of Commerce.
12. Jonsson, P., 2008. Logistics and supply chain management. Maidenhead : McGraw-Hill
13. Jordan B. D., Westerfield R. W., Ross A. S., 2011. Corporate Finance essentials. 7th ed.
Boston ; London : McGraw-Hill Irwin

72
14. Lambert, D. M., James S. R., Ellram L.M., 2005. Fundamentals of Logistics Management.
London : Irwin/McGraw-Hill
15. Lumsden K, 2007. Fundamentals of Logistics. Gothenburg: Chalmers University of
Technology
16. Lysons K., Farrington B., 2007. Purchasing and Supply Chain Management.7th ed.
Harlow: Financial Times Prentice Hall
17. Porter, Michael E., 1985. Competitive Advantage. New York: The Free Press
18. Ross S. A., Westerfield R. W., Jordan B. D., 2008. Essentials of Corporate Finance. 6th
ed. Boston, Mass. : McGraw-Hill/Irwin
19. Rushton A, Croucher P., Baker P., 2006. The handbook of Logistics and Distribution
Management. 3rd ed. London ; Philadelphia, Pa. : Kogan Page
20. Schniederjans M. J., Schniederjans D. G., Schniederjans A. M., 2010. Topics in Lean
Supply Chain Management. New Jersey ; Hong Kong : World Scientific
21. van Weele, A. J., 2005. Purchasing & Supply Chain Management, 4th Edition. London:
South-Western CENGAGE Learning.
22. van Weele, A. J., 2010. Purchasing & Supply Chain Management, 5th Edition. London:
South-Western CENGAGE Learning.
23. Waters D., 2011. Supply Chain Risk Management: Vulnerability and Resilience in
Logistics. London ; Philadelphia : Kogan Page
24. Yin, R. K., 2008. Case Study Research: Design and Methods, Fourth Edition. Newbury
Park, CA: Sage Publications, Inc.
Articles
25. Christopher M., 2000. The Agile Supply Chain : Competing in Volatile Markets,
Industrial Marketing Management, Vol 29., No. 1, pp. 37- 44

73
26. Christopher M., Towill D., 2001. An integrated model for the design of agile supply
chains, International Journal of Physical Distribution & Logistics Management, Vol. 31
Iss: 4, pp.235 – 246
27. Ellram L., 1993. Total Cost of Ownership: Elements and Implementation. Retrieved May
12, 2012. Journal of Purchasing and MaterialsManagement, Fall, pp. 3-11
28. Gelderman, C. J., Van Weele, A. J. 2003,). Handling measurement issues and strategic
directions in Kraljic’s purchasing portfolio model. Retrieved April 07, 2012, Journal of
Purchasing and Supply Management, Vol. 9, Iss: 5-6: pp 207–216
29. Gunasekaran, C. P. 2003. A framework for supply chain performance measurement. from
International Journal of Production Economics: Retrieved February 9, 2012,
30. Linsolas B, 2009, Voices on the VPS, Volvo Powernews, March, p.15
31. Woxenius J., 2006. Temporal Elements in the Spatial Extension of Production Networks.
Retrieved May 12, 2012. Journal of Growth and Change, December, pp. 526-549
Documents and presentations
32. Hellner C. 2011. Gloden Rules for Logistics. Gothenburg, Sweden
33. Nygren A. 2012. 13 Days Inventory Project. Gothenburg, Sweden
34. Stenhagen F., 2010. VLC reply to new suggested rules. Gothenburg, Sweden.
35. Stenhagen, F, 2012. Landed Cost - outdated/existing tools and approaches, background
and conclusions, Gothenburg, Sweden.
36. Volvo Group, 2011a. Key elements Procedure 7 Logistics Requirements. Iss: 3
37. Wirsin H., 2012. Golden Rule #1 workshop. Gothenburg, Sweden
38. Ulku, Muhammad Ali - University of Waterloo, 2009. Analysis of Shipment
Consolidation in the Logistics Supply Chain. ProQuest Dissertations & Theses A&I:
March 11

74
Interviews
39. Breman Palm, Solution Manager; L. M. Mäe, & R. Ohno, Interviewers; 2012, March 08
40. Borin P., Purchaser; M. Mäe, & R. Ohno, Interviewers; 2012, February 20
41. Dahl F., Supply Chain Manager, Skövde Plant; M. Mäe, & R. Ohno, Interviewers; 2012,
February 29
42. Enerstad, B. Purchaser; M. Mäe, & R. Ohno, Interviewers; 2012, February 20
43. Köhler K., Purchaser; M. Mäe, & R. Ohno, Interviewers; 2012, February 21
44. Lindner, Henrik, Material Controller, Skövde plant; M. Mäe, & R. Ohno, Interviewers;
2012, February 29
45. Nylund, Thomas, Global Commodity Director; M. Mäe, & R. Ohno, Interviewers; 2012,
February 21
46. Palm, Lena Project Manager; M. Mäe, & R. Ohno, Interviewers; 2012, March 08
47. Rostén H., Order and Volume Director; M. Mäe, & R. Ohno, Interviewers; 2012, January
31
48. Stenhagen F., Global Logistics Development Manager; M. Mäe, & R. Ohno, Interviewers;
2012, January 26
49. Tengroth K., Purchaser; M. Mäe, & R. Ohno, Interviewers; 2012, February 21
50. Wirsin H., Commodity Logistics Manager; M. Mäe, & R. Ohno, Interviewers; 2012,
March 05
Web pages
51. Volvo Group, 2011b, Volvo Group Worldwide, [online] Available at:
<http://www.volvogroup.com/group/global/en-gb/pages/group_home.aspx> [Accessed
27-11-2011]
52. Volvo Penta, 2012, Skövde , [online] Available at:
<http://www.volvopenta.com/VOLVOPENTA/GLOBAL/EN-

75
GB/OUR_COMPANY/PRODUCTION/SK%C3%96VDE/Pages/sk%C3%B6vde.aspx>
[Accessed 10-03-2012]


