Russian Jewish Immigration and its Effect on the State of Israel

10
2
The Immigration from the Former Soviet Union to Israel
Evidence and Interpretation
Sarit Cohen Goldner, Zvi Eckstein, and Yoram Weiss
2.1 Introduction
The unexpected collapse of the Soviet regime in 1989 led to a dramatic change in the country’s emigration policy, which now permitted its citizens to emigrate freely. In particular, Jews in the Former Soviet Union (FSU) were now able to immigrate to Israel without restriction. Jews arriving in Israel were automatically entitled to become Israeli citizens with access to a gener-ous package of benefits, including subsidized mortgages or rental assistance, language courses and vocational training. They also gained access to a labour market which is characterized by much higher wages than those available in the FSU. Over the next ten years, Israel absorbed approximately 900,000 immigrants from the FSU (which constituted about 20% of the Israeli popu-lation), with about half of them arriving during the first three years. The change in emigration policy was exogenous to the economic conditions in Israel and to the pre-emigration accumulation of human capital by the immi-grants. As such, it provides a unique platform for evaluating basic issues in the economics of immigration.
The two main features of this wave are its extraordinary magnitude relative to the native population (almost a million immigrants over a decade versus a 1989 Israeli population of over four and a half million) and the immigrants’ exceptionally high level of education. Those who arrived up to January 1992 possessed an average of 14.5 years of schooling; and 68% of the men (76% of the women) held academic and managerial positions before immigrating. In contrast, 69% of native Israelis worked in blue-collar occupations in 1991.
OUP UNCORRECTED PROOF – FIRSTPROOFS, Thu Feb 05 2015, NEWGEN
acprof-9780198729624.indd 10 2/5/2015 12:01:23 PM
The Immigration from the Former Soviet Union to Israel
11
The Israeli government tried to aid immigrants’ integration by providing them a package of benefits that included a free Hebrew language course (called Ulpan) and made them eligible to participate in government-sponsored vocational-training courses. However, there was minimal intervention by the government in the immigrants’ absorption process within the labour market. Thus, occupation, residential location, the Ulpan course and government-provided vocational training courses were chosen by the immi-grants with minimal restrictions or attached criteria.
The purpose of this paper is to describe the process of integration of these immigrants by following the large group of immigrants who came in the first wave of 1989–91. We record their employment and wage history over almost two decades in Israel until 2009. We shall also describe changes in marital status and how they interact with employment. Throughout the paper, we compare the achievement of immigrants to comparable native Israeli workers in the same age group and with the same schooling.
2.2 The Data
Our main source of data is repeated cross sections from the Israeli Labour Force and the Income Survey for the years 1989–2009. We follow immigrants who arrived in 1989–91 in three age groups, 15–18, 25–40, and 41–55, and native Israelis who were in the same age groups in 1989–91.1 We shall use this data to describe labour market outcomes. We also use administrative panel data that allows us to follow individuals from the same cohort from 1995 to 2006. We shall also use panel data to examine marriage patterns and return migration.
Table 2.1 provides summary statistics for natives and immigrants from the Labour Force Survey.2 For both natives and immigrants we present mean attrib-utes as of 1989–91. The age distributions of natives and immigrants are quite different. Youngsters aged 15–18 constitute 22% of the native population aged 15–55 and only 10% of the immigrant population in the same age range. The group aged 25–40 constitutes about half of both natives and immigrants, but the group aged 41–55 is larger among immigrants. Hence, immigrants are older than natives on average. Women constitute 53.7% of immigrants, compared to 50.8% of natives. The percentage of adult immigrants with college educa-tion is much higher than among comparable natives, 55.17% versus 29.96% in the 25–40 age group and 58.13% versus 24.38% in the 41–55 age group. Most immigrants from the FSU came married. The percentage of those married on
1 For the purpose of this study, native Israelis are those born in Israel or immigrated before 1989.2 Information on marital status in 1989–1991 is only for those who were surveyed in these
years. Information on schooling and age at arrival in 1989–1991 is obtained retrospectively, as it is from immigrants who were surveyed in later years.
OUP UNCORRECTED PROOF – FIRSTPROOFS, Thu Feb 05 2015, NEWGEN
acprof-9780198729624.indd 11 2/5/2015 12:01:23 PM

Migration
12
arrival is higher among male immigrants than among female immigrants and this gap is larger in the 41–55 age group at arrival. In the 25–40 age group, the proportion of married men exceeds that of natives, reflecting the fact that men marry younger in the FSU. Overall, the marriage rates of immigrants are similar to those of Israeli natives but far exceed those of ‘normal’ selective migrations, where young single individuals are more likely to migrate.3
Table 2.1. Attributes of Immigrants and Natives during 1989–91*
Variable Immigrants Natives**
Aged 15–18 on Arrival
Aged 25–40 on Arrival
Aged 41–55 on Arrival
1971–1976 Cohorts (Aged 15–18 in 1989–1991)
1949–1966 Cohorts (Aged 25–40 in 1989–1991)
1934–1948 Cohorts (Aged 41–55 in 1989–1991)
Females 47.81% 55.35% 53.07% 48.05% 51.48% 51.63%Age on Arrival 16.52 32.92 47.24 — — —Years of Schooling
12.75 14.25 14.35 12.49 12.59 11.35
0–12 52.11% 27.42% 25.18% 61.98% 57.85% 63.92%13–14 22.83% 17.03% 15.84% 15.36% 11.39% 9.38%15+ 24.53% 55.17% 58.13% 22.02% 29.96% 24.38%Number of Observations
6,220 32,602 22,988 207,640 478,331 263,569
Marital Status on Arrival—MalesMarried 0.00% 85.04% 85.40% 0.18% 75.52% 91.16%Never Married 100.00% 12.35% 7.62% 99.81% 22.04% 3.77%Divorced 0.00% 1.43% 5.71% 0.01% 1.95% 3.54%Widowed 0.00% 1.19% 0.32% 0.00% 0.12% 0.87%Living Separately
0.00% 0.00% 0.95% 0.00% 0.37% 0.66%
Marital Status on Arrival—FemalesMarried 0.00% 79.44% 75.28% 0.15% 80.99% 82.61%Never Married 98.95% 9.09% 2.22% 99.85% 13.28% 3.56%Divorced 0.00% 9.74% 15.56% 0.00% 4.27% 6.72%Widowed 0.00% 1.52% 6.94% 0.00% 0.74% 5.96%Living Separately
1.05% 0.22% 0.00% 0.00% 0.71% 1.16%
Number of Observations
193 883 675 23,202 75,586 44,648
* Marriage at arrival is obtained only for immigrants surveyed in their immigration year, and natives surveyed in 1989–1991. Age at arrival and education are obtained retrospectively also from those surveyed in later years.
** Born in Israel or immigrated prior to 1989.
Source: CBS Labor Force Survey.
3 A recent study by Simon, Ramos, and Sanroma (2011) on immigrants who arrived in Spain in 1997–2007 shows that, among those who were 16–55 on arrival, the average age at entry was 30 and only half of these immigrants were married in 2007.
OUP UNCORRECTED PROOF – FIRSTPROOFS, Thu Feb 05 2015, NEWGEN
acprof-9780198729624.indd 12 2/5/2015 12:01:23 PM

The Immigration from the Former Soviet Union to Israel
13
2.3 Employment, Occupation, and Wages
In this section, we describe the process of integration into the Israeli labour market for immigrants from the FSU who arrived to Israel in the first large wave of 1989–91 and whom we follow for almost two decades. The employ-ment, occupation and wage profiles of FSU immigrants in Israel vary by their gender, level education and age at entry.4
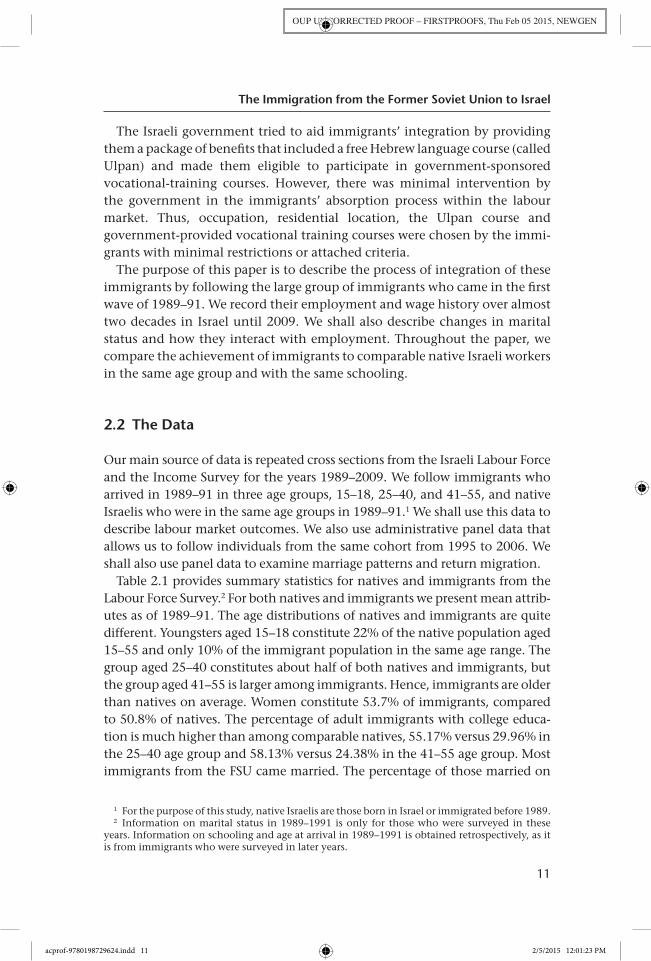
We begin with the cohort that arrived aged 25–40. This cohort acquired its education in the FSU and most of its work experience was acquired in Israel. For both males and females of this cohort, we observe high participation and employment soon after arrival, with gradual occupational upgrading (see Figures 2.1a, b). The proportion of those working in blue-collar jobs went up initially, as immigrants moved from unemployment to blue-collar jobs, and then declined, as some blue-collar workers moved into white-collar jobs. The proportion of immigrants working in white-collar jobs has increased steadily. Female immigrants had initially lower participation rates and higher unem-ployment rates than male immigrants.
After a short period of adjustment, the participation rates of both male and female immigrants who arrived aged 25–40 reached a high level of 90%, which far exceeds the participation rates of natives in the same age group, about 75%. The high participation rates of immigrants from the FSU are con-sistent with the high participation rates of males and females in the FSU in 1989, 87% and 80% respectively (see Vishnevsky, 1992).5
Immigrants from the FSU had initially much higher unemployment rates than comparable natives, but eventually they overtook natives and now have somewhat lower unemployment rates (Figures 2.2a, b). College-educated immigrants initially had the same high unemployment rates in Israel as immi-grants with lower education. However, over time in Israel, college-educated immigrants tend to have lower unemployment rates than less educated immigrants, as is the case among native Israelis.
We now focus on the employment and wage profiles for college-educated immigrants, distinguished by their age at arrival. This allows us to discuss the impact of location, whereby education and work experience were acquired on occupational upgrading and wage growth in Israel. We shall show that education acquired in Israel has a higher return in Israel than that acquired in the FSU, while experience acquired abroad has had a negative return in Israel. (See also Cohen Goldner, Eckstein, and Weiss, 2012, ch. 7.)
4 Cohen Goldner and Weiss (2011) provide further analysis based on panel data provided by the Brookdale Institute.
5 Immigrants from the FSU in Germany also report high participation rates; 87% and 78% for men and women, respectively. See Cohen Goldner and Epstein (2012).
OUP UNCORRECTED PROOF – FIRSTPROOFS, Thu Feb 05 2015, NEWGEN
acprof-9780198729624.indd 13 2/5/2015 12:01:23 PM
100%
90%
80%
70%
60%
50%
40%
30%
20%
10%
0%1 3 5 7 9 11
Years since arrival13 15 17 19
WC employment*BC employment*Unemployment*Participation
Figure 2.1a. Labor Market Integration of Male Immigrants Repeated Cross-Section Data*Proportions of labor force participants immigrated during 1989–1991 and aged 25–40 on arrival.
Source: CBS Labor Force Survey.
100%
90%
80%
70%
60%
50%
40%
30%
20%
10%
0%1 3 5 7 9 11
Years since arrival13 15 17 19
WC employment*BC employment*Unemployment*Participation
Figure 2.1b. Labor Market Integration of Female Immigrants Repeated Cross-Section Data*Proportions of labor force participants immigrated during 1989–1991 and aged 25–40 on arrival.
Source: CBS Labor Force Survey.
OUP UNCORRECTED PROOF – FIRSTPROOFS, Thu Feb 05 2015, NEWGEN
acprof-9780198729624.indd 14 2/5/2015 12:01:23 PM

0%1992 1993 1994 1995 1996 1997 1998 1999 2000 2001
Year
2002 2003 2004 2005 2006 2007 2008 2009
10%
20%
30%
Immigrants*, HS Dropouts and Graduates (<=14 years of schooling)Immigrants, College Graduates (15+ years of schooling) Natives**, HS Dropouts and Graduates (<=14 years of schooling) Natives, College Graduates (15+ years of schooling) Total Population (no schooling or age restrictions)
Figure 2.2a. Unemployment Rate by Schooling—Males*Immigrated during 1989–1991 and aged 25–40 on arrival. **Born in Israel or immigrated prior to 1989: 1949–1966 cohorts (aged 25–40 in 1989–1991).
0%
1992 1993 1994 1995 1996 1997 1998 1999 2000 2001
Year
2002 2003 2004 2005 2006 2007 2008 2009
10%
20%
30%
40%
Immigrants*, HS Dropouts and Graduates (<=14 years of schooling)Immigrants, College Graduates (15+ years of schooling) Natives**, HS Dropouts and Graduates (<=14 years of schooling) Natives, College Graduates (15+ years of schooling) Total Population (no schooling or age restrictions)
Figure 2.2b. Unemployment Rate by Schooling—Females*Immigrated during 1989–1991 and aged 25–40 on arrival. **Born in Israel or immigrated prior to 1989: 1949–1966 cohorts (aged 25–40 in 1989–1991).
OUP UNCORRECTED PROOF – FIRSTPROOFS, Thu Feb 05 2015, NEWGEN
acprof-9780198729624.indd 15 2/5/2015 12:01:23 PM

Migration
16
We first note that college-educated immigrants who arrive at a late age, in the 41–55 group, are represented in a lower proportion in white-collar jobs than younger immigrants at the same educational level (Figures 2.3a, b). Immigrants who arrived aged 41–55 show a slower rate of occupational upgrading. Only 41% of these men and women had a white-collar occupation after 19 years in Israel. In contrast, immigrants who came in youth, aged 15–18, and acquired their college education in Israel, are represented in a higher proportion in white-collar occupations, in the same proportion as for native Israelis. These patterns hold for both men and women (see Figures 2.3a, b).
Immigrants have had lower wages than natives with the same education throughout the period, except for those who came at age 15–18, who have the same level of wages as natives (see Figures 2.4a, b). For those who arrived at later ages, the wage gap declines with time in Israel, but convergence has not been attained. The highest wage gap is for immigrants who were in the late age group, namely 41–55. These patterns are similar for males and females. The lack of convergence in wages for immigrants with college degrees displayed in these figures is more pronounced than for immigrants at lower educational levels. College-educated immigrants enjoyed a substan-tially higher wage growth than less educated immigrants, or college-educated native Israelis. However, because the wages of native Israelis with low edu-cational levels have not risen much, while the wages of native Israelis with
1992 1993 1994 1995 1996 1997 1998 1999 2000 2001
Year
2002 2003 2004 2005 2006 2007 2008 2009
0%
10%
20%
30%
40%
50%
60%
70%
80%
90%
100%
Immigrants*, Aged 25–40 on arrivalImmigrants, Aged 41–55 on arrivalImmigrants, Aged 15–18 on arrivalNatives**, 1949–66 cohorts (aged 25–40 in 1989–91)Natives, 1934–48 cohorts (aged 41–55 in 1989–91)Natives, 1971–76 cohorts (aged 15–18 in 1989–91)
Figure 2.3a. Workers in WC Jobs—Males, College Graduates (15+ years of schooling)*Immigrated during 1989–1991. **Born in Israel or immigrated prior to 1989. % of workers in each year.
OUP UNCORRECTED PROOF – FIRSTPROOFS, Thu Feb 05 2015, NEWGEN
acprof-9780198729624.indd 16 2/5/2015 12:01:23 PM

4.0
3.5
3.0
2.5
2.01992 1993 1994 1995 1996 1997 1998 1999 2000 2001
Year
2002 2003 2004 2005 2006 2007 2008
Immigrants*, 1950–66 cohorts (aged 25–40 in 1990–91)Immigrants, 1935–49 cohorts (aged 41–55 in 1990–91)Immigrants, 1972–76 cohorts (aged 15–18 in 1990–91) Natives**, 1950–66 cohorts (aged 25–40 in 1990–91)Natives, 1935–49 cohorts (aged 41–55 in 1990–91)Natives, 1972–76 cohorts (aged 15–18 in 1990–91)
Figure 2.4a. Log Hourly Wages—Males, College Graduates (15+ years of schooling)* Immigrated during 1990–1991. **Born in Israel or immigrated prior to 1990. Wages expressed in 1992 prices.
1992 1993 1994 1995 1996 1997 1998 1999 2000 2001
Year
2002 2003 2004 2005 2006 2007 2008 2009
0%
10%
20%
30%
40%
50%
60%
70%
80%
90%
100%
Immigrants*, Aged 25–40 on arrivalImmigrants, Aged 41–55 on arrivalImmigrants, Aged 15–18 on arrivalNatives**, 1949–66 cohorts (aged 25–40 in 1989–91)Natives, 1934–48 cohorts (aged 41–55 in 1989–91)Natives, 1971–76 cohorts (aged 15–18 in 1989–91)
Figure 2.3b. Workers in WC Jobs—Females, College Graduates (15+ years of schooling)*Immigrated during 1989–1991. **Born in Israel or immigrated prior to 1989. % of workers in each year.
OUP UNCORRECTED PROOF – FIRSTPROOFS, Thu Feb 05 2015, NEWGEN
acprof-9780198729624.indd 17 2/5/2015 12:01:23 PM

Migration
18
college degrees have risen substantially, educated immigrants have had less success in catching up with natives than have less educated immigrants.
In addition to the changes in their average wages, there were also impor-tant changes in the dispersion of immigrant wages. As time spent in Israel increases, the process of occupational upgrading results in a rise in both the average wage and the variance of wages. Following their arrival, most of the immigrants worked in low-paying low-skilled jobs, and we observe low average wages and low variance according to schooling and experi-ence acquired in the FSU. It can be seen in Figures 2.5a and b that the variance of immigrant wages increases with level of schooling and that for immigrants with 15+ years of schooling it also increases with time in Israel, implying that sorting was more important for immigrants with a high level of imported schooling. This is in part because of employers’ uncertainty about the schooling quality in different regions of the FSU and in part because educated workers were more choosy and willing to wait for a good job offer. As can be seen in the figures, the variance of wages for highly educated immigrants increases faster than for comparable natives and sub-stantially faster than for less educated immigrants. In particular, the vari-ance of the log wage for natives is almost independent of schooling, while
4.0
3.5
3.0
2.5
2.0
1992 1993 1994 1995 1996 1997 1998 1999 2000 2001
Year
2002 2003 2004 2005 2006 2007 2008
Immigrants*, 1950–66 cohorts (aged 25–40 in 1990–91)Immigrants, 1935–49 cohorts (aged 41–55 in 1990–91)Immigrants, 1972–76 cohorts (aged 15–18 in 1990–91)
Natives**, 1950–66 cohorts (aged 25–40 in 1990–91)Natives, 1935–49 cohorts (aged 41–55 in 1990–91)Natives, 1972–76 cohorts (aged 15–18 in 1990–91)
Figure 2.4b. Log Hourly Wages—Females, College Graduates (15+ years of schooling)* Immigrated during 1990–1991. **Born in Israel or immigrated prior to 1990. Wages expressed in 1992 prices.
OUP UNCORRECTED PROOF – FIRSTPROOFS, Thu Feb 05 2015, NEWGEN
acprof-9780198729624.indd 18 2/5/2015 12:01:24 PM

0.6
0.5
0.4
0.3
0.2
0.1
0.01992 1993 1994 1995 1996 1997 1998 1999 2000 2001 2002 2003 2004 2005 2006 2007 2008
Year
Immigrants*, HS Dropouts and Graduates (<=14 years of schooling)Immigrants, College Graduates (15+ years of schooling)Natives**, HS Dropouts and Graduates (<=14 years of schooling)Natives, College Graduates (15+ years of schooling)
Figure 2.5b. Variance of Log Hourly Wages by Schooling—Females1950–1966 cohorts (aged 25–40 in 1990–1991). Wages expressed in 1992 prices. *Immigrated dur-ing 1990–1991. **Born in Israel or immigrated prior to 1990.
0.6
0.5
0.4
0.3
0.2
0.1
0.0
1992 1993 1994 1995 1996 1997 1998 1999 2000 2001
Year
2002 2003 2004 2005 2006 2007 2008
Immigrants*, HS Dropouts and Graduates (<=14 years of schooling)Immigrants, College Graduates (15+ years of schooling)Natives**, HS Dropouts and Graduates (<=14 years of schooling)Natives, College Graduates (15+ years of schooling)
Figure 2.5a. Variance of Log Hourly Wages by Schooling—Males1950–1966 cohorts (aged 25–40 in 1990–1991). Wages expressed in 1992 prices. *Immigrated during 1990–1991. **Born in Israel or immigrated prior to 1990.
acprof-9780198729624.indd 19 2/5/2015 12:01:24 PM

Migration
20
for immigrants it increases with schooling. Finally, although the average wages of educated immigrants do not converge to those of Israeli natives, the variance of wages of educated male immigrants does converge to that of educated Israeli native men. A similar finding regarding convergence of the variance is reported by Eckstein and Weiss (2004). Together, these find-ings suggest that in the longer run immigrants have similar jobs to those of natives but usually at lower wages.
2.4 Return Migration and Out-Migration
The arrival of the initial wave of FSU immigrants during 1989–1991 was sudden and unexpected and thus exogenous to the economic conditions in Israel. At the time, immigrants leaving the FSU had limited options in choosing a destination. Only Israel accepted FSU immigrants immediately and in large numbers and did not impose visa restrictions or eligibility cri-teria for welfare benefits. It is, therefore, interesting to examine the ques-tion of whether Israel was a temporary or permanent destination for these immigrants.
Tables 2.2a and b present the survival rates as of 2004 and 2009 for FSU immigrants who arrived during 1990–1 conditional on them still being in Israel in 1995. The figures are based on the 1995 Israeli Census and on border-control records up to 2009. The survival rates are presented for men and for women by schooling and age on arrival6 and are consistent with findings by Tolts (2009).7 The survival rates are very high by international standards.8 However, the tables show that younger and more educated male immigrants are more likely to leave the country. By 2009, 25% of male immi-grants who arrived in Israel at ages 20–25 and had a college degree had left the country. It is worth noting that these immigrants have acquired their college or advanced degrees in Israel, which may be more transferable than the same levels of education acquired in the FSU. In contrast, older immigrants who arrived aged 36–45 mainly stayed in Israel, irrespective of gender and level of education.
6 We thank Eric Gould for providing us these data. For details, see Gould and Moav (2008).7 Tolts (2011) has calculated the annual flows of all departures of FSU immigrants who arrived
in Israel after 1990 for the years 1990–2009. He finds that annual departures, as a proportion of the annual stock of immigrants from the FSU, reached a peak of 16% in 1992 and then leveled at about 10% in later years.
8 For instance, the OECD 2008 Report ‘Return Migration: A New Perspective’ provides estimated re-emigration rates within five years for the United States, Netherlands, Norway, United Kingdom, Belgium, and Ireland that range between 20% and 60% during the 1990s. See also Dustmann et al. (2011).
OUP UNCORRECTED PROOF – FIRSTPROOFS, Thu Feb 05 2015, NEWGEN
acprof-9780198729624.indd 20 2/5/2015 12:01:24 PM

The Immigration from the Former Soviet Union to Israel
21
The patterns of attrition reported in Tables 2.2a and b have some bear-ing on the results reported in the previous paragraph concerning the wage growth and occupational upgrading of college-educated immigrants in Israel. To the extent that the ‘better’ ” immigrants in terms of unobserved ability have left Israel, the profiles displayed in the previous figures would underes-timate the wage growth and occupational upgrading that an average immi-grant would expect. However, since similar attrition applies to native Israelis (see Gould and Moav, 2008), the bias in the convergence rates to natives is likely to be small.
Table 2.2a. Staying Rates as of 2004—FSU Immigrants Who Arrived during 1990–1991 Conditional on Staying in Israel until 1995 and on Being Alive and Having Data on Staying/Moving in 2004
Age on Arrival HS Dropouts (%)
HS Graduates (%) College Graduates (%)
Any Academic Degree (%)
Females20–25 92.87 92.79 91.84 90.3926–35 96.17 95.71 95.37 94.3536–45 97.67 97.44 97.16 97.12
Males20–25 92.72 90.33 89.78 89.1226–35 96.41 93.98 94.00 92.3036–45 97.37 96.83 96.03 95.99
Stayers are individuals who did not leave the country for a full year or more.
Source: Calculations by Eric Gould. For a description of the data, see Gould and Moav (2008).
Table 2.2b. Staying Rates as of 2009—FSU Immigrants Who Arrived during 1990–1991 Conditional on Staying in Israel until 1995 and on Being Alive and Having Data on Staying/Moving in 2004 and 2009
Age on Arrival HS Dropouts (%)
HS Graduates (%) College Graduates (%)
Any Academic Degree (%)
Females20–25 91.98 88.58 82.02 81.9726–35 95.92 93.93 92.92 90.9736–45 96.86 96.91 95.92 96.15
Males20–25 87.29 83.33 75.65 75.1626–35 93.96 89.30 89.77 86.2936–45 96.85 95.71 93.39 93.70
Stayers are individuals who did not leave the country for a full year or more.
Source: Calculations by Eric Gould. For a description of the data, see Gould and Moav (2008).
OUP UNCORRECTED PROOF – FIRSTPROOFS, Thu Feb 05 2015, NEWGEN
acprof-9780198729624.indd 21 2/5/2015 12:01:24 PM

Migration
22
2.5 Marriage Patterns
As we have already noted, most immigrants who came from the FSU as adults were married on arrival (see Table 2.1). However, those who came single or at a young age married and also divorced and remarried in Israel. Table 2.3 shows the marital status of different cohorts of immigrants and natives dur-ing the period 1989–1991 to 2009. We see that in each of the three cohorts, male immigrants are more likely to be married than native males.
Generally, the marital patterns of immigrants that existed on arrival (see Table 2.1) were maintained throughout the two decades in Israel, mainly because relatively few immigrants of the older cohorts married or remarried in Israel, while those from the young cohort, who marry mainly in Israel, married with immigrants from the FSU.
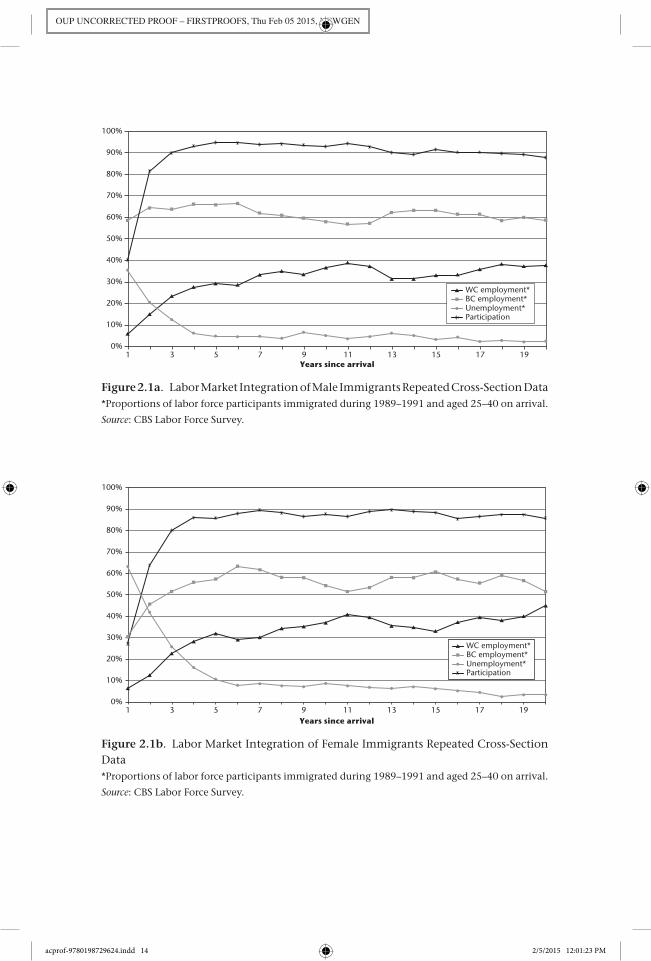
Table 2.4 shows the marital choices of immigrants who married in Israel. Surprisingly, even those immigrants who came from the FSU aged 15–18,
Table 2.3. Marital Status of Immigrants* and Natives**, 1989–2009
Married (%)
Never Married (%)
Divorced (%)
Widowed (%)
Living Separately (%)
MalesAged 15–18 in 1989–1991Immigrants 32.59 65.16 1.82 0.09 0.34Natives 28.28 70.62 0.90 0.05 0.16
Aged 25–40 in 1989–1991Immigrants 88.69 5.93 4.35 0.55 0.49Natives 82.88 12.39 3.71 0.48 0.54
Aged 41–55 in 1989–1991Immigrants 86.92 3.11 6.57 3.02 0.38Natives 86.81 5.10 4.86 2.44 0.79
FemalesAged 15–18 in 1989–1991Immigrants 49.39 43.44 4.91 0.24 2.02Natives 41.88 55.17 2.26 0.15 0.54
Aged 25–40 in 1989–1991Immigrants 78.16 4.19 14.45 2.27 0.93Natives 79.26 9.57 7.78 2.25 1.15
Aged 41–55 in 1989–1991Immigrants 67.31 2.83 16.36 13.02 0.48Natives 73.06 5.03 7.99 12.81 1.11
* Immigrated during 1989–1991.
** Born in Israel or immigrated prior to 1989.
Source: CBS Labor Force Survey.
OUP UNCORRECTED PROOF – FIRSTPROOFS, Thu Feb 05 2015, NEWGEN
acprof-9780198729624.indd 22 2/5/2015 12:01:24 PM
The Immigration from the Former Soviet Union to Israel
23
and who married mostly in Israel, are married with spouses from the FSU. This tendency towards endogamy can be attributed to the large accumu-lated number of immigrants as a proportion of the native population, which allowed immigrants from the FSU to maintain their status as a large and distinct social group. In addition, because immigrants obtain immediate full citizenship, there is no legal reason, such as work permit or access to welfare that would encourage marriage to natives. Nevertheless, we see a clear difference between male and female immigrants in this regard. Among those immigrants who entered Israel aged 15–18, 24% of the women have a native spouse but only 6.5% of the male immigrants in this age group had a native spouse. The corresponding figures for the 25–40 age group are 38.8% and 9.8% respectively. This gender difference is probably an outcome of the larger proportion of single women, relative to single men, that arrived from the FSU.
The percentage of divorced female immigrants is about twice as high as among native women, 14.4% vs 7.7% in the 25–40 age group and 16.4% vs 8% in the 41–55 age group. The proportion of divorced men among male immigrants is substantially smaller and is only slightly larger than for natives (see Table 2.3). One reason for the relatively high proportion of female divor-cees among immigrants is that the divorce rate in the FSU was relatively high, especially for women. According to Tolts (2009), the proportions of divorcees among the Jews aged 30–34 in the FSU, 1988 were 7.4% for men, 13.3% for
Table 2.4. Spouses of Immigrants Who Married in Israel, 1989–1991 Cohorts
Immigrant Native Spouse* (%)
Spouse Unknown (%)
Married in Israel** (%)Spouse Who
Immigrated during 1989–1991 (%)
Spouse Who Immigrated during 1992–2009 (%)
MalesAged 15–18 on Arrival 49.54 28.69 6.48 14.82 97.13Aged 25–40 on Arrival 49.99 37.32 9.81 2.24 6.40Aged 41–55 on Arrival 60.65 29.07 8.68 1.61 1.66
FemalesAged 15–18 on Arrival 50.19 14.90 24.27 10.21 89.99Aged 25–40 on Arrival 41.50 14.85 38.82 3.05 5.14Aged 41–55 on Arrival 57.15 17.72 17.42 7.71 1.74
* Born in Israel or immigrated prior to 1989.
** Proportion of total married immigrants.
Source: CBS Labor Force Survey.
OUP UNCORRECTED PROOF – FIRSTPROOFS, Thu Feb 05 2015, NEWGEN
acprof-9780198729624.indd 23 2/5/2015 12:01:24 PM

Migration
24
women. Indeed, we see in Table 2.1 that on arrival, 9.7% of the women who arrived aged 25–40 and 15.5% of the women who arrived aged 41–55 were divorced. It has been argued that cultural traditions affect divorce and possi-bly immigrants from the FSU import their high divorce tradition to Israel (see Furtado, 2010). In addition, the move to a new country can by itself cause an increase in divorce.
The effect of immigration on marital stability is not obvious a priori. Keeping the family unit intact can ease the first years in a new country, as spouses can support each other and coordinate work activities. On the other hand, immigration can also lead to marital instability, as any unexpected shock that affects married spouses differently can cause divorce (Becker, 1991, ch. 8). If partners acquire local skills such as language and work experience at different rates and their wages change accordingly, a large gap in local skills between partners can destabilize the marriage.9 Indeed, we see in Figures 2.4 and 2.5 that wages of female immigrants rise more sharply than those of males, while the variance of wages rises faster for men. Both of these processes can generate divorce.
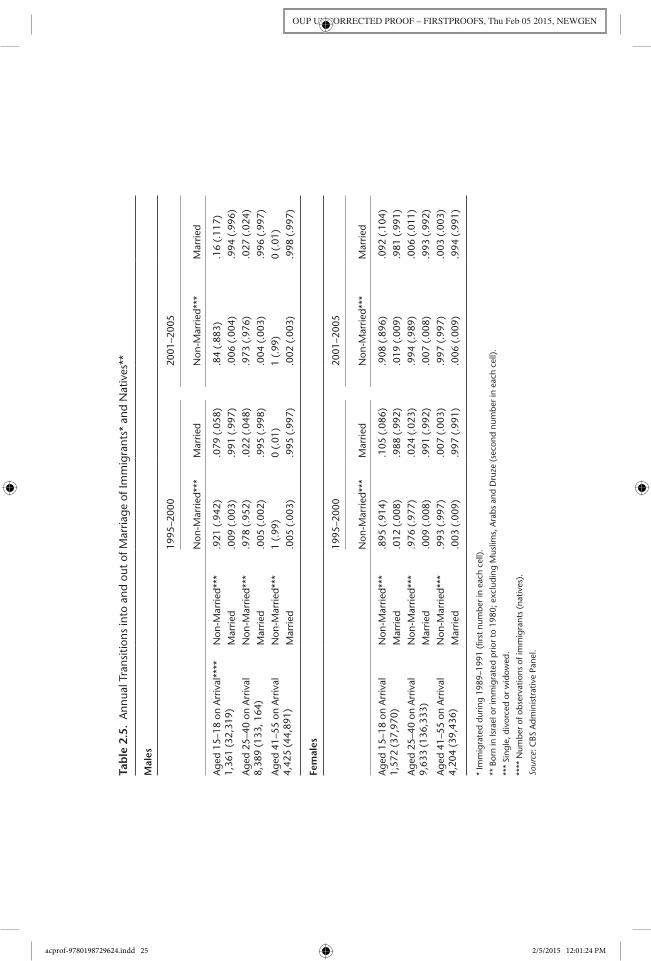
Table 2.5 shows the annual transition rates out of marriage and into mar-riage of natives and immigrants who arrived from the FSU during 1989–1991 in the administrative panel. Here, natives include those born in Israel or immigrated prior to 1980.10 In addition, we exclude non-Jews who have very different marriage patterns.11
We display the average annual transition rates during two periods, 1995–2000 and 2001–5. We see that for immigrants who arrived in Israel aged 15–18, both males and females leave marriage at higher rates than natives (0.9% vs 0.3% for males and 1.2% vs 0.8% for females during 1995–2000). Among these young immigrants, we see also higher rates of entry into mar-riage for both males and females than among comparable natives (7.9% vs 5.8% for males and 10.5% vs 8.6% for females during 1995–2000). Thus, immigrants in this age group have high marital turnover compared to natives. Given that the difference between immigrants and natives in the exit rates from marriage exceeds the difference in the entry rates into mar-riage, a higher proportion of immigrants in this age group are divorced, as seen in Table 2.5.
Among immigrants who arrived aged 25–40, the separation rates are simi-lar to natives, while for those who arrived aged 41–55, marriages of immi-grants tend to be more stable than among natives.
9 Differences in social adjustment in Israel are more likely to arise in mixed couples in which one spouse is Jewish and the other is not. See Lavee and Krivosh (2012).
10 These early FSU immigrants constitute, respectively: 2.1%, 4.2%, 6.6% of the 15–18, 25–40, 41–55 native age groups.
11 Specifically, we excluded Israeli-born Muslims, Arabs, and Druzes.
OUP UNCORRECTED PROOF – FIRSTPROOFS, Thu Feb 05 2015, NEWGEN
acprof-9780198729624.indd 24 2/5/2015 12:01:24 PM
Tab
le 2
.5.
Ann
ual T
rans
ition
s in
to a
nd o
ut o
f Mar
riage
of I
mm
igra
nts*
and
Nat
ives
**
Mal
es
1995
–200
020
01–2
005
Non
-Mar
ried*
**M
arrie
dN
on-M
arrie
d***
Mar
ried
Age
d 15
–18
on A
rriv
al**
**1,
361
(32,
319)
Non
-Mar
ried*
**.9
21 (
.942
).0
79 (
.058
).8
4 (.
883)
.16
(.11
7)M
arrie
d.0
09 (
.003
).9
91 (
.997
).0
06 (
.004
).9
94 (
.996
)A
ged
25–4
0 on
Arr
ival
8,38
9 (1
33, 1
64)
Non
-Mar
ried*
**.9
78 (
.952
).0
22 (
.048
).9
73 (
.976
).0
27 (
.024
)M
arrie
d.0
05 (
.002
).9
95 (
.998
).0
04 (
.003
).9
96 (
.997
)A
ged
41–5
5 on
Arr
ival
4,42
5 (4
4,89
1)N
on-M
arrie
d***
1 (.
99)
0 (.
01)
1 (.
99)
0 (.
01)
Mar
ried
.005
(.0
03)
.995
(.9
97)
.002
(.0
03)
.998
(.9
97)
Fem
ales
1995
–200
020
01–2
005
Non
-Mar
ried*
**M
arrie
dN
on-M
arrie
d***
Mar
ried
Age
d 15
–18
on A
rriv
al1,
572
(37,
970)
Non
-Mar
ried*
**.8
95 (
.914
).1
05 (
.086
).9
08 (
.896
).0
92 (
.104
)M
arrie
d.0
12 (
.008
).9
88 (
.992
).0
19 (
.009
).9
81 (
.991
)A
ged
25–4
0 on
Arr
ival
9,63
3 (1
36,3
33)
Non
-Mar
ried*
**.9
76 (
.977
).0
24 (
.023
).9
94 (
.989
).0
06 (
.011
)M
arrie
d.0
09 (
.008
).9
91 (
.992
).0
07 (
.008
).9
93 (
.992
)A
ged
41–5
5 on
Arr
ival
4,20
4 (3
9,43
6)N
on-M
arrie
d***
.993
(.9
97)
.007
(.0
03)
.997
(.9
97)
.003
(.0
03)
Mar
ried
.003
(.0
09)
.997
(.9
91)
.006
(.0
09)
.994
(.9
91)
* Im
mig
rate
d du
ring
1989
–199
1 (fi
rst
num
ber
in e
ach
cell)
.
** B
orn
in Is
rael
or
imm
igra
ted
prio
r to
198
0; e
xclu
ding
Mus
lims,
Ara
bs a
nd D
ruze
(se
cond
num
ber
in e
ach
cell)
.
***
Sing
le, d
ivor
ced
or w
idow
ed.
****
Num
ber
of o
bser
vatio
ns o
f im
mig
rant
s (n
ativ
es).
Sour
ce: C
BS A
dmin
istr
ativ
e Pa
nel.
OUP UNCORRECTED PROOF – FIRSTPROOFS, Thu Feb 05 2015, NEWGEN
acprof-9780198729624.indd 25 2/5/2015 12:01:24 PM

Migration
26
2.6 Division of Labour within Couples
There is some evidence suggesting coordination of work decisions between spouses in the early stages of their presence in Israel. Figure 2.6 shows the working pattern of married couples. It is seen that the proportion in which both partners work is substantially higher among immigrants than among comparable native Israelis. This may reflect in part work habits acquired in the FSU, where it was common for both men and women to participate in work. However, we can also see a large increase in this pattern over time, while among natives the proportions of different work patterns are stable. Initially, in about 30% of immigrant couples, only the husband worked and in about 50% of these couples, both husband and wife worked (rates that are very similar to those among native Israelis). At the end of the period, the proportion of immigrant couples in which both partners work went up to 80% and the proportion in which only the husband works went down to 10% (compared to 60% and 23% among Israeli couples). The sharp change
1992 1993 1994 1995 1996 1997 1998 1999 2000 2001 2002 2003 2004 2005 2006 2007 2008 2009
Year
100%
90%
80%
70%
60%
50%
40%
30%
20%
10%
0%
Immigrants*, Both employedImmigrants, Husband only employedImmigrants, wife only employedImmigrants, None employed
Natives**, Both employedNatives, Husband only employedNatives, Wife only employedNatives, None employed
Figure 2.6. Employment Status of Married Couples*Both husband and wife immigrated during 1989–1991, and at least one spouse is aged 25–40 on arrival.
**Both husband and wife born in Israel or immigrated prior to 1989, and at least one spouse belongs to the 1949–1966 cohorts (aged 25–40 in 1989–1991).
Source: CBS Labor Force Survey.
OUP UNCORRECTED PROOF – FIRSTPROOFS, Thu Feb 05 2015, NEWGEN
acprof-9780198729624.indd 26 2/5/2015 12:01:24 PM

The Immigration from the Former Soviet Union to Israel
27
among immigrants can be interpreted as a coordinated strategy whereby the low wage earner acquired training, while the high wage earner became the breadwinner.12 This pattern is different from the results for Canada reported by Baker and Benjamin (1997), where immigrant wives act initially as the breadwinners and work more than native females, while their husbands work less than natives.13 We also find that female immigrants in the early years following entry are strongly influenced by the work of their husband. The probability that the wife worked during 1989–2009 is 62% if the husband does not work and 79% if he does work. In contrast, there was no such corre-lation between the husband’s and wife’s work in the period 2001–9. Eckstein and Weiss (2002) attribute the positive correlation in the early years to the government policy of ‘income augmentation’ based on family income, to which immigrants were entitled. Given that the wife has the lower wage, if the husband does not work and she works, the couple is eligible for this trans-fer. However, if the husband works, the couple is not eligible for the transfer anyway, so she works too.14
2.7 Conclusion
In this chapter we have summarized the evidence on absorption of the mas-sive wave of high-skilled immigrants from the FSU which arrived in Israel from the early 1990s, over a period of 18 years. These immigrants found jobs in Israel rather quickly, but initially experienced a substantial occupational downgrading and earned significantly less than their native counterparts, owing to the difficulty in immediately exploiting imported skills in the new country.15 Over time, some of the younger and better-educated immi-grants, who invested more in local skills, were able to switch to jobs that more closely matched their skills, thus achieving significantly higher wages. However, this process was a gradual one and after a decade in Israel there were no substantial dynamics in the immigrants’ labour market integration. After 18 years in Israel substantial wage differences between immigrants and natives remained.
12 Cohen Goldner and Eckstein (2010) show that a higher proportion of women than men par-ticipated in the training programs that the government provided in the early years.
13 See Basilio, Bauer, and Sinning (2009) and Kim and Varanasi (2010) for more recent tests of this ‘family investment’ hypothesis.
14 This impact of transfer applies equally well to low-wage natives. See Giannelli and Micklewright (1995).
15 The occupational downgrading of immigrants is not unique to the Israeli case and has also been found in Britain (Dustmann, Frattini, and Preston 2008).
OUP UNCORRECTED PROOF – FIRSTPROOFS, Thu Feb 05 2015, NEWGEN
acprof-9780198729624.indd 27 2/5/2015 12:01:24 PM

Migration
28
The relatively long process of adjustment experienced by better-educated workers reflects several basic characteristics of the 1989–1990 wave of immigration:
• ImmigrantsfromtheFSUarrivedunpreparedfortheIsraelilabourmarket and had to make substantial investments in local skills and occupational adjustments upon arrival in the new country.
• Better-educatedimmigrantsfromtheFSUwerequiteheterogeneousinterms of quality of schooling, work experience and exposure to modern Western technology. As a result, Israeli employers were uncertain as to their skills and thus prejudiced against them in hiring. Related to that, immigrants with different imported skills invested differently in the acquisition of local skills and chose different acceptance rules for job offers from local employers.
• Thesizeofthewaveofimmigrationandthefactthatitwasunexpectedled to a relatively complex process of matching in the labour market. The gradual nature of the matching process meant that immigrants from the FSU had little impact on the wages and employment of native Israeli workers, despite their high level of education. Initially, these immigrants competed only with less-educated Israeli workers and with foreign workers, whose supply is relatively elastic. By the time they entered skilled jobs, the capital stock had increased (primarily owing to foreign investment), which substantially diluted their effect on the wages and employment of better-educated natives. The flow of investment led to the expansion of new industries, particularly hi-tech and medical services, which absorbed many immigrants.16
• Theratesofunemploymentofimmigrantsdeclinecontinuouslywiththeir stay in Israel and by 2009 converge to very low levels that are equal to or lower than those of comparable Israelis. This dispelled some of the initial prejudice against them with respect to their lack of good work habits and the inferiority of medical and technical education and work experience obtained in the FSU. In fact, immigrants from the FSU did respond to economic incentives in Israel and displayed high participation rates in the labour force, as well as adapting well to unfamiliar advanced technologies.
• Incontrasttotheconvergencetonativesinemployment,convergenceto natives in wages and occupation was not achieved. This lack of convergence is most noticeable for male immigrants with a college
16 See Cohen Goldner (2006) for a discussion of immigrants in hi-tech and Kugler and Sauer (2005) for a detailed analysis of immigrant physicians.
OUP UNCORRECTED PROOF – FIRSTPROOFS, Thu Feb 05 2015, NEWGEN
acprof-9780198729624.indd 28 2/5/2015 12:01:24 PM

The Immigration from the Former Soviet Union to Israel
29
degree. These immigrants enjoyed substantially higher wage growth than less-educated immigrants and than college-educated native Israelis. However, because the wages of native Israelis with low education have not risen much, while those of native Israelis with college degrees have risen substantially, educated immigrants had less success than less-educated immigrants in catching up with natives. Despite their lower wage compared to native Israelis, immigrants from the FSU are generally satisfied with their jobs.
• Despitethehighinitialratesofunemploymentoffemaleimmigrantsrelative to male immigrants, their long-term wage and employment outcomes relative to comparable natives were better than those of male immigrants. In this regard, female immigrants adapted better to the Israeli labour market.
• ImmigrantsfromtheFSUhavemaintainedtheirstatusasalargeanddistinct social group. They generally marry other immigrants and live in enclaves and report high satisfaction from their dwelling. They have about the same level of social interaction as native Israelis. In some respects, they have adapted quickly to Israeli attitudes and norms. They speak functional though less-than-perfect Hebrew, while maintaining the Russian language and culture.
• Thegenerallessonisthatevenalargeandsuddenimmigrationcanbeabsorbed without a negative economic impact on natives. In the case of Israel, the main mechanism was a rise in capital stock, financed by direct foreign investment and government borrowing from abroad. In addition, the gradual entry of immigrants into the labour force has mitigated the impacts on wages and unemployment of natives. This came at some cost, however, as the skills that the immigrants brought with them were not applied immediately at their best use. It has been estimated that 14% of the potential lifetime earnings of immigrants in Israel was lost, owing to non-employment and job-distribution mismatch resulting from search frictions and other costs of adjustment (Weiss, Sauer, and Gotlibovski, 2003).
• Inaddition,ourworkhasledtosomemethodologicalconclusions.The first one is that a search framework, combined with investment in human capital, is the proper unified approach for the analysis of high-skilled immigrants from the FSU. This is indicated by several important features of the data: initial occupational downgrading, followed by a gradual process of upward job and occupational transitions, and an increase in the variance of wages as high-skilled immigrants are sorted. An initial period of waiting in unemployment
OUP UNCORRECTED PROOF – FIRSTPROOFS, Thu Feb 05 2015, NEWGEN
acprof-9780198729624.indd 29 2/5/2015 12:01:25 PM

Migration
30
when immigrants with high education receive few high-skill job offers and reject some low-skill job offers.
• Thecombinationoflearningbyemployers,accumulationoflocalhuman capital, and job search by immigrants leads to a highly non-linear assimilation process, with upward job transitions in the early years, followed by a slower progress in later years. Importantly, this non-linear process strongly depends on the immigrants’ level of imported human capital. It seems to us that structural models with explicit modelling of search frictions, employers’ learning and human capital accumulation are required to capture these non-linear effects. If one uses reduced-form models, the flexible time pattern for the duration in the host country, interacted with the initial level of imported capital, should be used. Equally important is the availability of high-frequency data with annual, quarterly or even monthly data, as used in this book.
• Inthischapter,weconsideredtheinterrelatedprocessesofassimilationin the labour and marriage markets for immigrants from the FSU. Of particular interest is the case of immigrants who came aged only 15–18. These immigrants behave like natives in the labour market but have patterns of marriage that are more similar to those of their source country. This surprising finding indicates the important role of inherited cultural values in the marriage market, which was made feasible by the large numbers of immigrants from the FSU, relative to the local population. These features also apply to other large immigrant minorities, such as Turks in Denmark, for instance. Actors may also explain the low out-migration rates observed among FSU immigrants (Weiss, 2000; Gustaffsson 2000).
•Whatcanbesaidontheapplicationtoothercountriesandothertypes of immigration? First, the large immigration wave of 1989–91 from the FSU can be best compared to refugee migrations. As such, a special feature of the immigration to Israel is the relatively high level of schooling of the immigrants. This possibly slowed the entry into the labour force somewhat, but in the long run, Israel did not experience a problem of low participation rates in the labour force by immigrants, as has emerged in some of the Scandinavian countries. One obvious difference is the less generous support for non-workers in Israel. Secondly, language was not a major obstacle to entry into the labour force, because the government provided free good schools for basic Hebrew (the Ulpans) and, in a country in which most citizens are former immigrants from many different countries, a basic knowledge of the language is sufficient for obtaining a job. In addition, immigrants from the FSU learned in Israel basic English, which is a prerequisite to
OUP UNCORRECTED PROOF – FIRSTPROOFS, Thu Feb 05 2015, NEWGEN
acprof-9780198729624.indd 30 2/5/2015 12:01:25 PM

The Immigration from the Former Soviet Union to Israel
31
enter the high-tech jobs that many educated immigrants entered (see Kheimets and Epstein, 2001).
Acknowledgement
Sarit Cohen Goldner acknowledges financial support from the German Israel Foundation (GIF) for Scientific Research and Development.
References
Baker, M. and D. Benjamin 1997. ‘The Role of the Family in Immigrants’ Labour-Market Activity: An Evaluation of Alternative Explanations’, American Economic Review 87 (4): 705–27.
Basilio, L., T. K. Bauer, and M. Sinning 2009. ‘Analyzing the labor market activity of immigrant families in Germany’, Labour Economics 16 (5): 510–20.
Becker, G. S. 1991. A Treatise on the Family. Cambridge, MA: Harvard University Press.Cohen Goldner, S. 2006. ‘Immigrants in the Israeli Hi-Tech Industry: Comparison to
Natives and the Effect of Training’, Research in Labor Economics 24: 265–92.Cohen Goldner, S. and Z. Eckstein 2008. ‘Labor Mobility of Immigrants: Training,
Experience, Language, and Opportunities’, International Economic Review 49 (3): 837–72.
Cohen Goldner, S. and Z. Eckstein 2010. ‘Estimating the Return to Training and Occupational Experience: The Case of Female Immigrants’, Journal of Econometrics 156 (1): 86–105.
Cohen Goldner, S., Z. Eckstein, and Y. Weiss 2012. Immigration and Labor Market Mobility in Israel 1990 to 2009. Cambridge, MA: MIT Press.
Cohen Goldner, S. and M. D. Paserman 2004. ‘The Dynamic Impact of Immigration on Natives’ Labor Market Outcomes: Evidence from Israel. Institute for the Study of Labor’. (IZA) Discussion Paper 1315.
Cohen Goldner, S. and Y. Weiss 2011. ‘High skilled Russian Immigrants in the Israeli Labor Market: Adjustment and Impact’ in High-Skilled Immigration in a Globalized Labor Market ed. Barry R. Chiswick, 231–63. Washington: American Enterprise Institute for Public Policy Research.
Dustmann, C., I. Fadlon, and Y. Weiss 2011. ‘Return migration, human capital accu-mulation and the brain drain’, Journal of Development Economics 95: 58–67.
Dustmann, C., T. Frattini, and I. Preston. 2008. ‘The Effect of Immigration along the Distribution of Wages’. Centre for Research and Analysis of Migration Discussion Paper 03/08.
Eckstein, Z. and Y. Weiss 2002. ‘The Integration of Immigrants from the Former Soviet Union in the Israeli Labor Market’ in The Israeli Economy, 1985–1998: From Government Intervention to Market Economics, Essays in Memory of Prof. Michael Bruno, ed. A. Ben-Bassat, 349–77. Cambridge MA: MIT Press.
OUP UNCORRECTED PROOF – FIRSTPROOFS, Thu Feb 05 2015, NEWGEN
acprof-9780198729624.indd 31 2/5/2015 12:01:25 PM
Migration
32
Eckstein, Z. and Y. Weiss 2004. ‘On the Wage Growth of Immigrants: Israel 1990–2000’, Journal of the European Economic Association 2 (4): 665–95.
Furtado, D. 2010. ‘Interethnic marriage: a choice between ethnic and educational sim-ilarities’, Journal of Population Economics 24 (4): 1257–79.
Giannelli, G. and J. Micklewright 1995. ‘Why Do Women Married to Unemployed Men have Low Participation Rates?’, Oxford Bulletin of Economics and Statistics 57: 471–86.
Gould, E. D. and O. Moav 2008. ‘When is “Too Much” Inequality Not Enough? The Selection of Israeli Emigrants’. Centre for Economic Policy Research Discussion Paper 6955.
Gustaffsson, B. 2000. ‘Comments on High Skill Immigration: Some Lessons from Israel’, Swedish Economic Policy Review 7 (2): 157–61.
Kheimets, N. G. and A. D. Epstein 2001. ‘The Role of English as a Central Component of Success in the Professional and Social Integration of Immigrant Scientists from the Former Soviet Union in Israel’, Language in Society 30 (2): 187–215.
Kim, S. and N. Varanasi. 2010. ‘Testing the Family Investment Hypothesis: Theory and Evidence’, Working Papers UWEC-2010-01, University of Washington, Department of Economics.
Kugler, A. and R. M. Sauer 2005. ‘Doctors without Borders: The Returns to an Occupational License for Soviet Immigrant Physicians in Israel’, Journal of Labor Economics 23 (3): 437–66.
Lavee, Y. and L. Krivosh 2012. ‘Marital Stability among Jewish and mixed couples fol-lowing immigration to Israel from the former Soviet Union’, European Psychologist,17 (2): 158–67.
Ramos, H. S. and E. Sandrom 2011. ‘Occupational Mobility of Immigrant in a Low Skill Economy, The Case of Spain’, Barcelona Institute of Economics (IEB).
Simon, H., R.Ramos, and E. Sanroma 2011. ‘Occupational Mobility of Immigrants in a Low Skilled Economy: The Spanish Case.’ IZA Discussion Paper 5581, Institute for the Study of Labor.
Tolts, M. 1992. ‘Jewish Marriages in the USSR: A Demographic Analysis’, East European Jewish Affairs 22 (2): 3–19.
Tolts, M. 2009. ‘Demography: Soviet Union, The Russian Federation and other Successor States’ in Jewish Women: A Comprehensive Historical Encyclopedia. Jewish Women’s Archive (http://jwa.org/encyclopedia/article/demography-soviet-union-russian-federation-and-other-successor-states).
Vishnevsky, A. 1996. ‘Family, Fertility, and Demographic Dynamics in Russia: Analysis and Forecast’ in Russia’s Demographic “Crisis”, ed. Julie DaVanzo and Gwen Farnsworth. Santa Monica, CA: RAND Corporation.
Weiss, Y. 2000. ‘High Skill Immigration: Some Lessons from Israel’, Swedish Economic Policy Review 7 (2): 127–55.
Weiss, Y., R. Sauer, and M. Gotlibovski 2003. ‘Immigration, Search, and Loss of Skill’, Journal of Labor Economics 21 (3): 557–92.
OUP UNCORRECTED PROOF – FIRSTPROOFS, Thu Feb 05 2015, NEWGEN
acprof-9780198729624.indd 32 2/5/2015 12:01:25 PM