The Humidity and Meningitis Link in Sub-Saharan Africa · PDF fileThe Humidity and Meningitis...
16
© UCAR 2016 DRAFT 1/8/16 1 The Humidity and Meningitis Link in Sub-Saharan Africa Purpose Students will use weather data to make inferences regarding periods of least weather-related risk for cases of meningitis in the town of Ndop in the North West Province of Cameroon between 2005 and 2009. Overview Students will use data to calculate the least humid and hottest months in Ndop-Bamessing in the North West Province of Cameroon from daily average temperatures and relative humidity data from 2005 to 2009 in order to determine periods of time in this region in which optimal environmental conditions exist for outbreaks of meningitis. While conditions of meningitis onset are due to a confluence of factors, students will identify those times of greatest vulnerability based on weather conditions for those living in Ndop near Bamenda. Student Outcomes Students will be able to • Calculate monthly and annual temperature and relative humidity from GLOBE data; • Organize averages by months and years in a table; identify months of relative humidity below 40% with corresponding high temperatures in order to determine months of greatest vulnerability to meningitis based on environmental factors. • Apply knowledge about weather-related risk factors that correlate with meningitis outbreaks in the meningitis belt of Africa to determine times of greatest vulnerability in Cameroon and make informed inferences about outbreaks and the disease. Science Concepts Earth and Space Science • Weather can be described by quantitative measurements. • Weather changes from day to day and over the seasons. • Weather varies on local, regional, and global spatial scales. • Water vapor is added to the atmosphere by evaporation from Earth’s surface and transpiration from plants. • Condensation and evaporation affect the heat balance of the atmosphere. Geography • Water vapor in the atmosphere affects the characteristics of the physical geographic system. • Weather conditions (temperature and humidity) in some regions of the world can affect the spread of disease related to human geographic system.
Transcript of The Humidity and Meningitis Link in Sub-Saharan Africa · PDF fileThe Humidity and Meningitis...

© UCAR 2016 DRAFT 1/8/16 1
The Humidity and Meningitis Link in Sub-Saharan Africa Purpose Students will use weather data to make inferences regarding periods of least weather-related risk for cases of meningitis in the town of Ndop in the North West Province of Cameroon between 2005 and 2009.
Overview Students will use data to calculate the least humid and hottest months in Ndop-Bamessing in the North West Province of Cameroon from daily average temperatures and relative humidity data from 2005 to 2009 in order to determine periods of time in this region in which optimal environmental conditions exist for outbreaks of meningitis. While conditions of meningitis onset are due to a confluence of factors, students will identify those times of greatest vulnerability based on weather conditions for those living in Ndop near Bamenda. Student Outcomes Students will be able to
• Calculate monthly and annual temperature and relative humidity from GLOBE data; • Organize averages by months and years in a table; identify months of relative humidity below 40% with
corresponding high temperatures in order to determine months of greatest vulnerability to meningitis based on environmental factors.
• Apply knowledge about weather-related risk factors that correlate with meningitis outbreaks in the meningitis belt of Africa to determine times of greatest vulnerability in Cameroon and make informed inferences about outbreaks and the disease.
Science Concepts Earth and Space Science
• Weather can be described by quantitative measurements. • Weather changes from day to day and over the seasons. • Weather varies on local, regional, and global spatial scales. • Water vapor is added to the atmosphere by evaporation from Earth’s surface and transpiration from
plants. • Condensation and evaporation affect the heat balance of the atmosphere.
Geography
• Water vapor in the atmosphere affects the characteristics of the physical geographic system. • Weather conditions (temperature and humidity) in some regions of the world can affect the spread of
disease related to human geographic system.

© UCAR 2016 DRAFT 1/8/16 2
Scientific Inquiry Abilities • Identify answerable questions. • Conduct scientific investigations. • Use appropriate mathematics to analyze data. • Develop descriptions and make scientific inferences and explanations using direct and indirect
evidence. • Recognize and analyze alternative explanations. • Communicate procedures and explanations.
Time: 3 50-minute class periods Level: Middle School and High School Materials and Tools
• Ndop, Cameroon humidity and minimum and maximum daily temperatures available through the GLOBE Visualization system for site 1525
• Student Background: Bacterial Meningitis Fact Sheet • Meningitis Data Template worksheet • Worksheet: Months of Greatest Meningitis Risk between 2005 – 2009 in Ndop, Cameroon • Answer key to the worksheets
Preparation
• Review the GLOBE Protocols for air temperature and relative humidity measurements, the activity instructions, and the student reading about meningitis.
• Download air temperature and relative humidity data between January 2005 and December 2009 for Ndop, Cameroon, Site 1525, for students or have students download the data themselves for use.
• Print for each student: o Student Background: Bacterial Meningitis Fact Sheet o Meningitis Data Template worksheet o Months of Greatest Meningitis Risk between 2005 – 2009 in Ndop, Cameroon
Prerequisites
• Familiarity with basic mathematic procedures such as calculating means and sums • Familiarity with reading and building basic graphs, charts, and tables • Basic familiarity with spreadsheet software such as Excel or Google Sheets • Understanding of the difference between direct and indirect evidence, and how scientists make scientific inferences.
Background The emergence and spread of meningococcal meningitis in Africa has been shown frequently in research to have links to weather and climate - namely relative humidity, which can be used to mark the end of a meningitis outbreak. When relative humidity reaches 40 percent, research consistently shows a positive correlation signaling the end of meningitis outbreaks following periods of high temperatures, low humidity, and the beginning of the rainy season and African monsoon. The disease also depends on a complex interplay of environmental, economic, and sociological factors, as well as patterns, causes, and effects of health and disease conditions often called epidemiological factors. (For more information about meningitis, review the student background reading.)

© UCAR 2016 DRAFT 1/8/16 3
Through class work and group discussions of the data, students should understand the following:
o Scientists learn about the world through observations and measurements of those observations, but they cannot always observe everything firsthand. Sometimes they have to make inferences from indirect evidence. For example, to learn about climates of the past, scientists often use ice cores, tree rings, or other proxy records. In these situations, scientists use indirect evidence to make inferences about something they are studying. An inference is much like a good guess, but it is still based on evidence of some kind.
o That being outside the meningitis belt does not mean an absence of meningitis. In fact, In the last decades, African countries south of the belt have experienced large meningitis epidemics and there has been an extension of the belt into countries like Togo, Cameroon, Côte d'Ivoire and Benin (Cunin, 2006; Molesworth, 2002).
o That limited humidity data, in this case five years, can be used to infer Cameroon’s dry and wet seasons;
o That other GLOBE protocols such as soil moisture and precipitation can also be used to infer periods of low and high humidity, and the typical dry and wet seasons in Cameroon or another country. Those seasons are determined through long-term observations of 30 to 50 years, but can be inferred from a sample of years;
o That an anomaly is something that deviates from what is standard, normal, or expected. About the Data In this activity, students calculate monthly averages for air temperature and relative humidity for a town, Ndop, in the North West Province of Cameroon in Africa. Cameroon is a country about the size of California that is partially located in Africa’s meningitis belt – the area identified to contain high levels of endemic outbreaks of the disease. Ndop, however, is located just outside of the belt, and south and east of Niger – a country that has had severe epidemics, most recently in 2015 and also in 2009 with thousands of confirmed cases and corresponding deaths. What to do and how to do it Step 1: Have students read and process background information on meningitis and the meningitis belt in Africa. It is highly recommended that, after reading the information, students engage in an activity that helps facilitate greater comprehension of what they have read. Doing so will greatly enhance their understanding and engagement of the activity. Four strategies are referenced below from the Denver Public Schools Foundation:
• Preview: Before reading, students brainstorm prior knowledge and predict what will be learned. • Click and Clunk: Students identify words or word parts that were hard to understand (called “clunks”). A
sequence of “fix-up strategies” is used to decode the “clunk.” These strategies are: (a) re-reading the sentence for key ideas, (b) looking for context clues in the sentences before and after, (c) looking for prefixes or suffixes, and (d) breaking the word apart to find smaller words.
• Get the gist: Students learn to ask themselves: What is the most important person, place, or thing? What is the most important idea about the person, place or thing?
• Wrap up: After reading, students construct their own questions to check for understanding of the passage, answer the questions, and summarize what has been learned.
Step 2: Orient students to the geography. Show students a map of Cameroon and its location in Africa. Tell them that in this activity, they will be asked to answer questions using direct evidence and inferences from indirect evidence about meningitis and its connection to environmental conditions as summarized in the Student Background document from the research literature. Unless specified, questions refer to the site of the data, Ndop-Bamessing in the North West Province of Cameroon near Bamenda on the African continent. It is located south and just outside of Africa’s meningitis belt. Step 3: Download the data. Download daily minimum and maximum temperature and relative humidity data for Site 1525, Government Bilingual High School (GBHS), Ndop Campus for years 2005 to 2009 from the GLOBE visualization or data

© UCAR 2016 DRAFT 1/8/16 4
access tool. For those without computer access, the data are also accessible in Excel and CSV formats. Step 4: Calculate. Have students calculate the total monthly averages for the quantities specified on the worksheet. It is recommended that you divide the calculations necessary amongst themselves by group to expedite the process, and then share and review the results collectively. Transcribe the results of your various calculations (and of other’s calculations) onto the Meningitis Data template worksheet. Step 5: Apply what they have learned. Have students apply what they have learned about meningitis through the Student Background: Meningitis Factsheet, answer the questions on the Months of Greatest Meningitis Risk between 2005 – 2009 worksheet in order to help you clarify weather-related risks to meningitis outbreaks. The answers, if correct, will also help to identify months where risks of meningitis were greatest during 2005 – 2009. Step 6: Discuss the worksheet answers. Within your small groups and ultimately as a class, discuss the content of your worksheet and your answers, especially those where there is disagreement or multiple answers. To do so, follow these instructions:
a Form two lines, standing back-to-back with a person from the other line. b Listen to the question the teacher asks related to the activity. c Reflect until the teacher calls “Turn” (usually about 30 seconds), then “turn.” d Discuss their reflections with the individual with whom they were back-to-back. e Repeat the process for additional questions.
Step 7: Consider how climate change is affecting meningitis Climate change has, and continues to influence the weather, the water cycle, weather extremes, and more – in Africa and throughout the world. Show students the graph (below) of the land temperature anomalies on the African continent between 1950 and 2015. Have students describe in writing, small groups, and/or as an entire class how they feel this could, if at all, influence meningitis, especially for the Sahel and sub-Sahel regions? Do you think this might possibly amplify meningitis epidemics in the region?
Source: NOAA
© UCAR 2016 DRAFT 1/8/16 5
Assessment Formative assessment methods are suggested throughout the activity including an evaluation of data calculations and small and whole class discussions. Students can write answers and/or discuss the student worksheet, Months of Greatest Meningitis Risk between 2005 – 2009 in Ndop, Cameroon, that will provide evidence of learning objectives met and each students’ ability to draw inferences and apply data findings appropriately.
Extensions: Delve Deeper into GLOBE Data o Have students research cases of bacterial meningitis in Cameroon between January 2005 and
December 2010 to investigate any correlation between their findings regarding times of weather-related meningitis risk and actual cases that occurred. Students are reminded that a confluence of many factors influence meningitis onset.
o Have students repeat the entire activity, but now for Bamock, the capital of Mali, which is firmly inside the Meningitis belt. Students instead use precipitation and temperature data from the Google Earth KML file from the Global Historical Climatology Network (GHCN) available on the GLOBE Visualization system webpage to determine the likely dry and wet season and temperature averages, and infer humidity and times of greatest weather-related risk to meningitis in Bamock, Mali.
o Ask students to review their answers to questions on the student worksheet, Months of Greatest Meningitis Risk between 2005 – 2009 in Ndop, Cameroon. Ask them to identify answers that required them to make inferences? When were answers based on direct evidence?
o Have students investigate careers associated with human health or invite representatives working for the World Health Organization (WHO), Center for Disease Control and Prevention, Doctors without Borders, or other appropriate organization to a video conference or onsite discussion with the class regarding his or her career. Possible careers to investigate include:
o Epidemiologist o Pharmacoepidemiologist o Vaccine Researcher o Public Health Engineer o Tropical Disease Expert o Public Health Doctor or Medical Investigator o Biostatistician o Environmental Health Emergency Response Expert o Disease Ecologist
© UCAR 2016 DRAFT 1/8/16 6
Name: ______________________________________ Date: _______________________
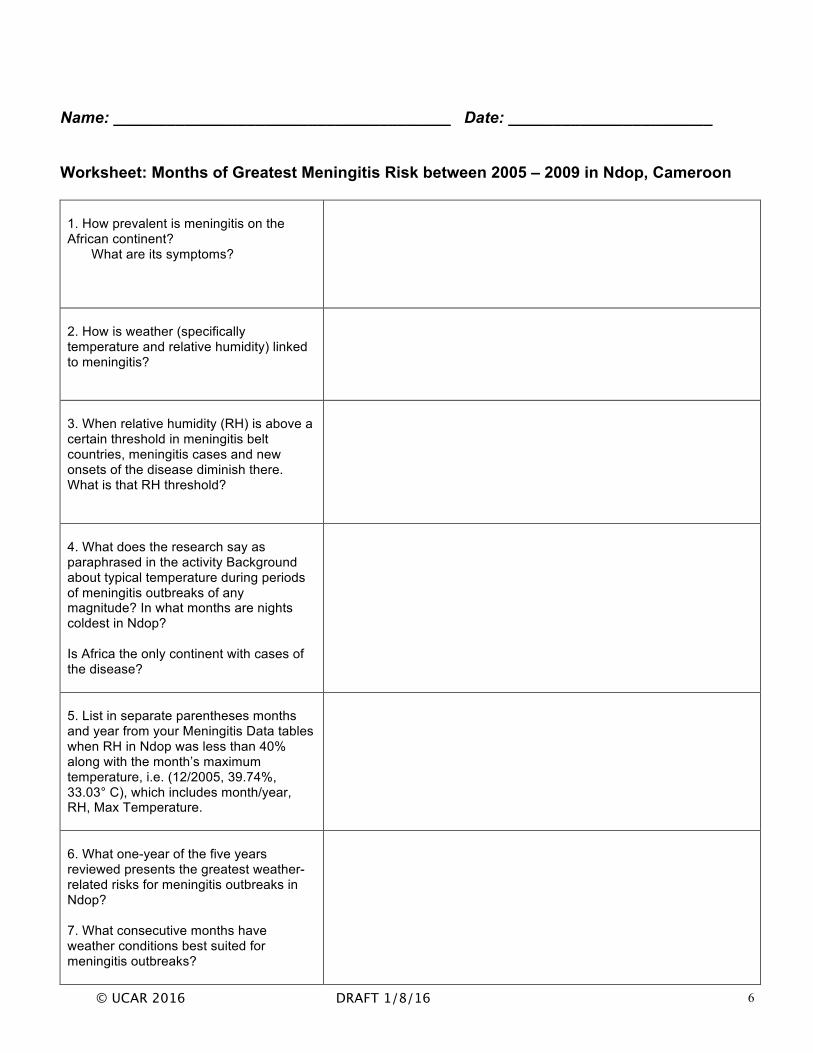
Worksheet: Months of Greatest Meningitis Risk between 2005 – 2009 in Ndop, Cameroon
1. How prevalent is meningitis on the African continent?
What are its symptoms?
2. How is weather (specifically temperature and relative humidity) linked to meningitis?
3. When relative humidity (RH) is above a certain threshold in meningitis belt countries, meningitis cases and new onsets of the disease diminish there. What is that RH threshold?
4. What does the research say as paraphrased in the activity Background about typical temperature during periods of meningitis outbreaks of any magnitude? In what months are nights coldest in Ndop? Is Africa the only continent with cases of the disease?
5. List in separate parentheses months and year from your Meningitis Data tables when RH in Ndop was less than 40% along with the month’s maximum temperature, i.e. (12/2005, 39.74%, 33.03° C), which includes month/year, RH, Max Temperature.
6. What one-year of the five years reviewed presents the greatest weather-related risks for meningitis outbreaks in Ndop? 7. What consecutive months have weather conditions best suited for meningitis outbreaks?

© UCAR 2016 DRAFT 1/8/16 7
8. Is Cameroon in the meningitis belt? Is Ndop? 9. What does being outside of the meningitis belt mean? 10. What factors do you think would lower risk to meningitis in or outside of the meningitis belt in sub-Sahara Africa?
11. Meteorologically speaking, why do you think northern Cameroon is in the meningitis belt but southern Cameroon is not? 12. What factors may help Ndop be less vulnerable than areas in the meningitis belt located at or below Ndop’s latitude of 6.1008° N?

© UCAR 2016 DRAFT 1/8/16 8
Background Reading: Bacterial Meningitis What is meningococcal meningitis? Meningococcal meningitis is a bacterial form of meningitis, a serious infection of the meninges – the three membranes that line the skull and vertebrae canal and enclose the brain and spinal cord. It can cause severe brain damage and is fatal in 50% of cases if untreated. The bacteria are transmitted from person-to-person through droplets of respiratory or throat secretions from carriers. In the meningitis belt, dust winds, cold nights and upper respiratory tract infections combine to damage the back of one’s throat, the upper pharynx, increasing the risk of meningococcal disease especially during dry season weather. There are 13 known subtypes of meningococcal meningitis with types A, B, C, and W135 to be the main causes of epidemics in Africa. There are also four other types of meningitis worldwide beyond bacterial meningitis: viral, fungal, parasitic, and non-infectious meningitis. The average incubation period for bacterial meningitis is 4 days, but can range between 2 and 10 days. The most common symptoms are a stiff neck, high fever, sensitivity to light, confusion, headaches, and vomiting. Symptoms are often confused with the flu. Even when the disease is diagnosed early and adequate treatment is started, 5% to 10% of patients die, typically within 24 to 48 hours after the onset of symptoms, and many experience brain damage or hearing loss. A lumbar puncture is necessary to confirm the diagnosis followed by antibiotics to treat the disease as soon as possible. The disease has existed in the Meningitis-belt region of Africa since the start of the 1900s. In past epidemics, the range of the attack rate has been 100 to 800 people per 100,000. However, communities can have attack rates as high as 1 in 100. During these epidemics, the very young are the most vulnerable according to the World Health Organization and the Meningitis Vaccine Project. Those most vulnerable are below 30 years in age. Do vaccines exist to prevent meningitis? Vaccines have existed to fight certain bacterial strands of the disease for 30 years, however, these are reactive vaccines given in response to outbreaks in a given region for a specific strain of the disease. Traditionally three vaccines have been available and administered reactively, but in 2010 a new vaccine was introduced for the most active and damaging strain of the disease in Africa, Type A. It has several advantages over vaccines available prior: lower price, longer immune response against the disease, effectiveness with children under two years of age who do not respond to the earlier vaccines; and proactive versus reactive administration of the vaccine to prevent sickness before an outbreak occurs. As of June 2015, 220 million people have been vaccinated in 16 countries in Africa with many more still to be vaccinated throughout the meningitis belt. It is important to know, however, that there is no vaccine to protect against all strains of bacterial meningitis. Where and what is the meningitis belt in Africa? The meningitis belt stretches from Senegal in the west to Ethiopia in the east across the Sahel and sub-Sahel regions of the African continent with approximately 430 million people at risk. Meningococcal disease is hyper-endemic in this region and encompasses 26 countries including: Benin, Burkina Faso, Burundi, Cameroon, Central African Republic, Chad, Côte d’Ivoire, Democratic Republic of Congo, Eritrea, Ethiopia, The Gambia, Ghana, Guinea, Guinea Bissau, Kenya, Mali, Mauritania, Niger, Nigeria, Rwanda, Senegal, South Sudan, Sudan, Tanzania, Togo and Uganda. The term, meningitis belt, was coined in 1963 by the researcher, Léon Lapeyssonnie, in a paper on meningitis published in the Bulletin of the World Health Organization.
Fig 1. Area encompassing Meningitis countries is colored in red with the meningitis belt outlined. (Modified with permission from Ezilon Maps) The risk of meningococcal meningitis epidemics differs within and among these 26 countries but the highest rates of the disease are found across the meningitis belt with larger epidemics of meningitis typically occurring within parts of the region every 7-14 years. The region is also endemic to other diseases such as malaria.
© UCAR 2016 DRAFT 1/8/16 9
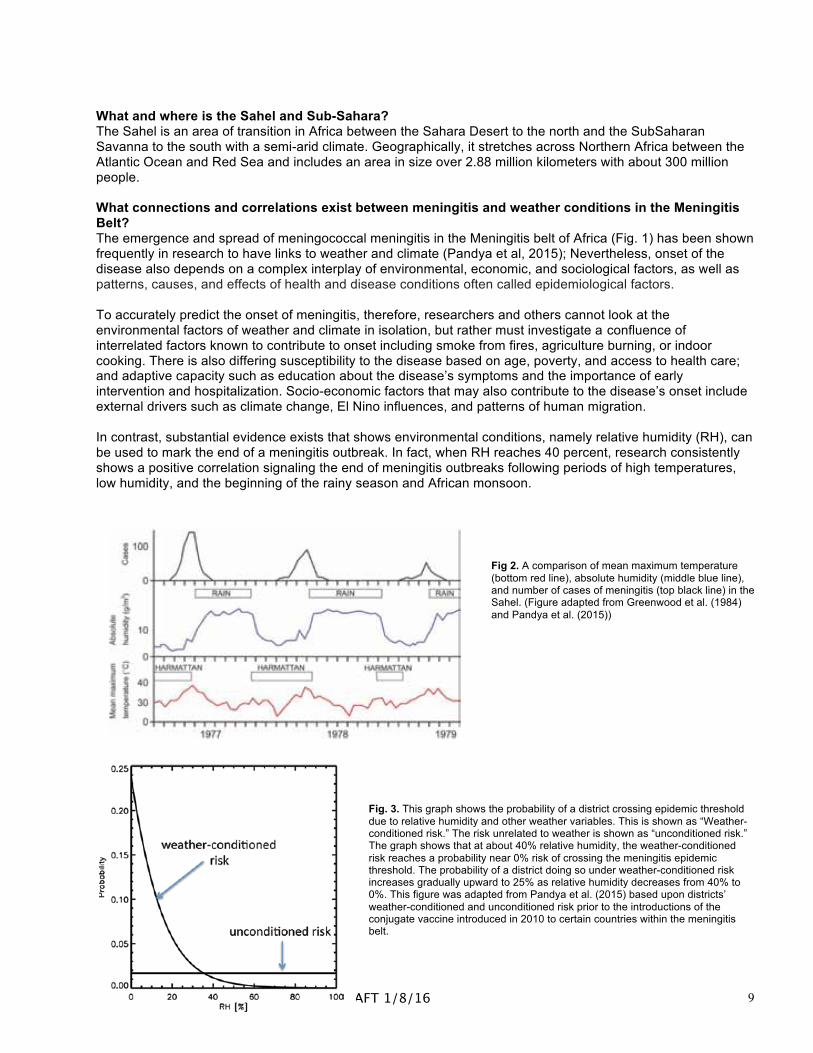
What and where is the Sahel and Sub-Sahara? The Sahel is an area of transition in Africa between the Sahara Desert to the north and the SubSaharan Savanna to the south with a semi-arid climate. Geographically, it stretches across Northern Africa between the Atlantic Ocean and Red Sea and includes an area in size over 2.88 million kilometers with about 300 million people. What connections and correlations exist between meningitis and weather conditions in the Meningitis Belt? The emergence and spread of meningococcal meningitis in the Meningitis belt of Africa (Fig. 1) has been shown frequently in research to have links to weather and climate (Pandya et al, 2015); Nevertheless, onset of the disease also depends on a complex interplay of environmental, economic, and sociological factors, as well as patterns, causes, and effects of health and disease conditions often called epidemiological factors. To accurately predict the onset of meningitis, therefore, researchers and others cannot look at the environmental factors of weather and climate in isolation, but rather must investigate a confluence of interrelated factors known to contribute to onset including smoke from fires, agriculture burning, or indoor cooking. There is also differing susceptibility to the disease based on age, poverty, and access to health care; and adaptive capacity such as education about the disease’s symptoms and the importance of early intervention and hospitalization. Socio-economic factors that may also contribute to the disease’s onset include external drivers such as climate change, El Nino influences, and patterns of human migration. In contrast, substantial evidence exists that shows environmental conditions, namely relative humidity (RH), can be used to mark the end of a meningitis outbreak. In fact, when RH reaches 40 percent, research consistently shows a positive correlation signaling the end of meningitis outbreaks following periods of high temperatures, low humidity, and the beginning of the rainy season and African monsoon.
Fig 2. A comparison of mean maximum temperature (bottom red line), absolute humidity (middle blue line), and number of cases of meningitis (top black line) in the Sahel. (Figure adapted from Greenwood et al. (1984) and Pandya et al. (2015))
Fig. 3. This graph shows the probability of a district crossing epidemic threshold due to relative humidity and other weather variables. This is shown as “Weather-conditioned risk.” The risk unrelated to weather is shown as “unconditioned risk.” The graph shows that at about 40% relative humidity, the weather-conditioned risk reaches a probability near 0% risk of crossing the meningitis epidemic threshold. The probability of a district doing so under weather-conditioned risk increases gradually upward to 25% as relative humidity decreases from 40% to 0%. This figure was adapted from Pandya et al. (2015) based upon districts’ weather-conditioned and unconditioned risk prior to the introductions of the conjugate vaccine introduced in 2010 to certain countries within the meningitis belt.

© UCAR 2016 DRAFT 1/8/16 10
References Abdussalam, A.F., A.J. Monaghan, V.M. Dukic, M.H. Hayden, T.M. Hopson, and G.C. Leckebusch, and J. Thornes. Climate influences on the interannual variability of meningitis incidence in northwest Nigeria. (2014) Wea. Clim. Soc., 6, 62-76. DOI:10.1175/WCAS-D-13-00004.1. Akweongo P, Dalaba MA, Hayden MH, Awine T, Nyaaba GN, Anaseba D, Hodgson A and Pandya, R. (2013) The economic burden of Meningitis to households in the Kassena-Nankana District of Northern Ghana. PLOS ONE http://dx.plos.org/10.1371/journal.pone.0079880 Cunin P, Fonkoua M-C, Kollo B, Bedifeh AB, Bayanak P, Martin PMV. Serogroup A Neisseria meningitidis outside meningitis belt in Southwest Cameroon. Emerg Inf Dis. 2003;9:1351–3. Greenwood, B., 1999: Mason Lecture: Meningococcal meningitis in Africa. Trans. Roy. Soc. Trop. Med. Hyg., 93, 341–353, doi:10.1016/S0035-9203(99)90106-2. Greenwood, B, I. S. Blakebrough, A. K. Bradley, S. Wali, and H. C. Whittle, 1984: Meningococcal disease and season in sub-Saharan Africa. Lancet, 323, 1339–1342, doi:10.1016/S0140-6736(84)91830-0. Greenwood, B., A. M. Greenwood, A. K. Bradley, K. Williams, M. Hassan-King, F. C. Sherton, R. A. Wall, and R. J .Hayes, 1987: Factors influencing the susceptibility to meningococcal disease during an epidemic inthe Gambia, West Africa. J. Infect., 14, 167–184, doi:10.1016/S0163-4453(87)92052-4. Hayden MH, Dalaba M, Akweongo P, Awine T, Nyaaba G, Anaseba D, Pelzman J, Hodgson A, and Pandya R. (2013) Knowledge, Attitudes and Practices Related to Meningitis in Northern Ghana. American Journal of Tropical Medicine and Hygiene 89:265-270. Lapeyssonnie, L., 1963: Cerebrospinal meningitis in Africa. Bull. WHO, 28 (Suppl.), 1–114. Molesworth, A. M., Cuevas, L. E., Connor, S. J., Morse, A. P., and M. C. Thomson, 2003: Environmental risk and meningitis epidemics in Africa. Emer. Infect. Dis., 9, 1287–1293, doi:10.3201/eid0910.030182. Molesworth AM, Thomson MC, Connor SJ, Cresswell MP, Morse AP, Shears P, et al. Where is the meningitis belt? Defining an area at risk of epidemic meningitis in Africa. Trans R Soc Trop Med Hyg. 2002;96:242–9. Rajul Pandya, Rajul, Hodgson, Abraham, Hayden, Mary H., Akweongo, Patricia, Hopson, Thomas, et al, 2015: Using Weather Forecasts to Help Manage Meningitis in the West African Sahel. Bull. Amer. Meteor. Soc., 96, 103–115.doi: http://dx.doi.org/10.1175/BAMS-D-13-00121.1
Weather and Relative Humidity Data – NDop, Cameroon, Africa; GLOBE Site: 1525 Page 1 of 2 Jan Feb Mar Apr May Jun Jul Aug Sep Oct Nov Dec ‘05 Min Temp
‘05 Max Temp
‘06 Min Temp
‘06 Max Temp
‘07 Min Temp
‘07 Max Temp
‘08 Min Temp
‘08 Max Temp
‘09 Min Temp
‘09 Max Temp
‘09 Min Temp
Jan Feb Mar Apr May Jun Jul Aug Sep Oct Nov Dec ‘05 Avg Temp
‘06 Avg Temp
‘07 Avg Temp
‘08 Max Temp
‘09 Min Temp

Page 2 of 2
Jan Feb Mar Apr May Jun Jul Aug Sep Oct Nov Dec ‘05 Max Temp ‘06 Max Temp ‘07 Max Temp ‘08 Max Temp ‘09 Max Temp
Jan Feb Mar Apr May Jun Jul Aug Sep Oct Nov Dec 2005 Avg RH 2006 Avg RH 2007 Avg RH 2008 Avg RH 2009 Avg RH
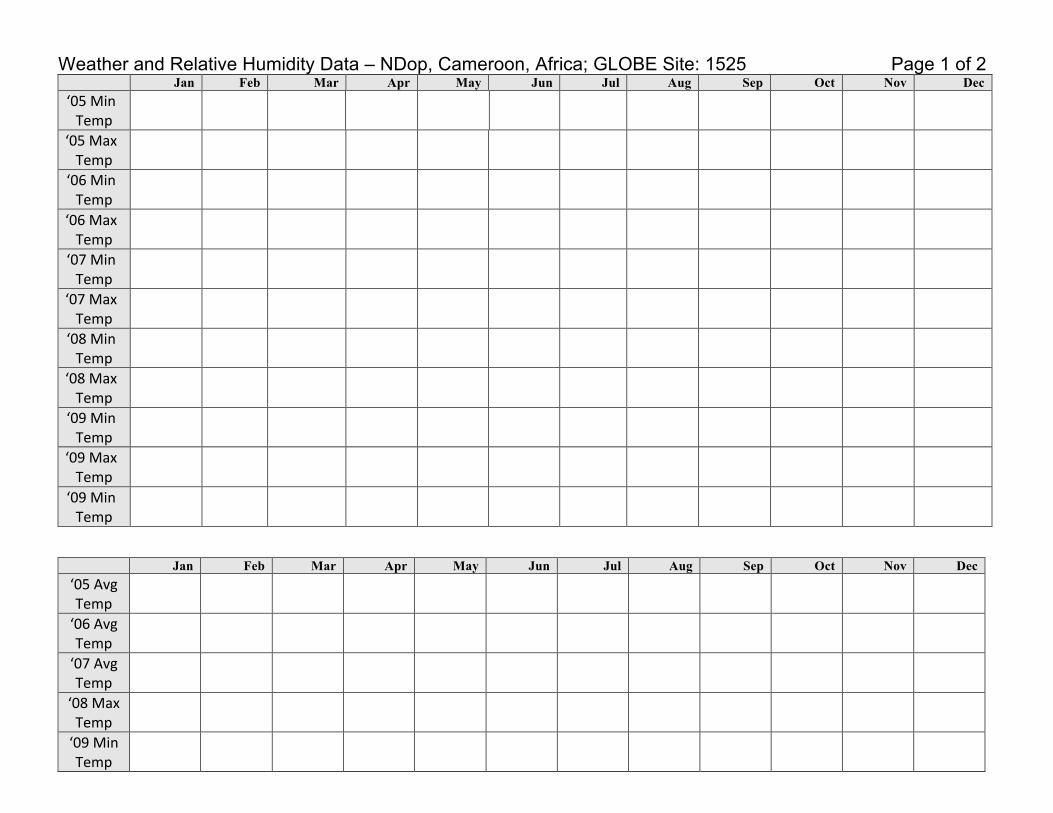
Instructions: Use the GLOBE Visualization System at http://www.globe.gov/globe-data/visualize-and-retrieve-data. Download daily minimum and maximum temperatures and relative humidity data for GLOBE Site 1525, Government Bilingual High School (GBHS) in Ndop, Cameroon to complete the template above. If computers are unavailable, Excel and CSV spreadsheet files are available for printing or computer homework in order to complete the calculations required.
Record your calculations above, rounding each calculation up to two decimal points where applicable. Students may be asked to focus on collecting the data specified for a particular year or a series of months, and then combining each groups’ calculations on the tables above. Follow instructions given to you by your instructor, then use the data to follow steps specified on the Student Activity Sheet: What to do and how to do it and answer questions on the Months of Greatest Meningitis Risk, 2005-2009 worksheet. Temperature is recorded in degrees Celsius; relative humidity is recorded in the amount of water vapor present in air expressed as a percentage of the amount needed for saturation at the same temperature.
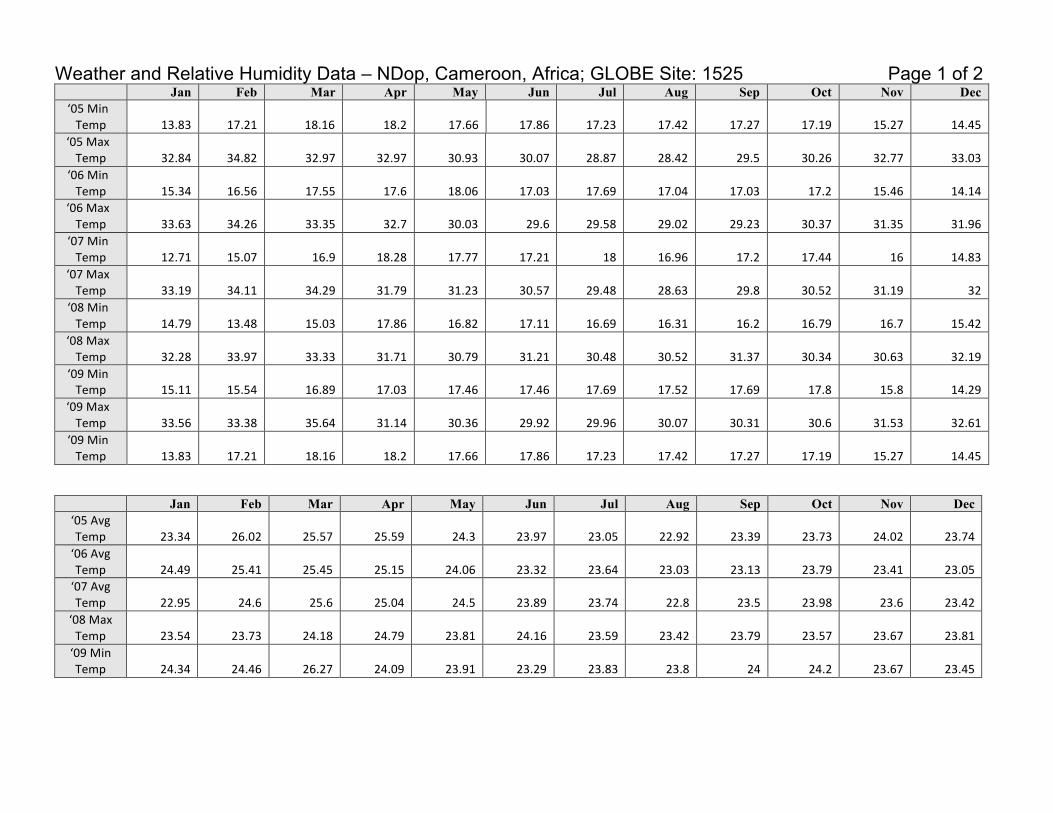
Weather and Relative Humidity Data – NDop, Cameroon, Africa; GLOBE Site: 1525 Page 1 of 2 Jan Feb Mar Apr May Jun Jul Aug Sep Oct Nov Dec
‘05 Min Temp 13.83 17.21 18.16 18.2 17.66 17.86 17.23 17.42 17.27 17.19 15.27 14.45
‘05 Max Temp 32.84 34.82 32.97 32.97 30.93 30.07 28.87 28.42 29.5 30.26 32.77 33.03
‘06 Min Temp 15.34 16.56 17.55 17.6 18.06 17.03 17.69 17.04 17.03 17.2 15.46 14.14
‘06 Max Temp 33.63 34.26 33.35 32.7 30.03 29.6 29.58 29.02 29.23 30.37 31.35 31.96
‘07 Min Temp 12.71 15.07 16.9 18.28 17.77 17.21 18 16.96 17.2 17.44 16 14.83
‘07 Max Temp 33.19 34.11 34.29 31.79 31.23 30.57 29.48 28.63 29.8 30.52 31.19 32
‘08 Min Temp 14.79 13.48 15.03 17.86 16.82 17.11 16.69 16.31 16.2 16.79 16.7 15.42
‘08 Max Temp 32.28 33.97 33.33 31.71 30.79 31.21 30.48 30.52 31.37 30.34 30.63 32.19
‘09 Min Temp 15.11 15.54 16.89 17.03 17.46 17.46 17.69 17.52 17.69 17.8 15.8 14.29
‘09 Max Temp 33.56 33.38 35.64 31.14 30.36 29.92 29.96 30.07 30.31 30.6 31.53 32.61
‘09 Min Temp 13.83 17.21 18.16 18.2 17.66 17.86 17.23 17.42 17.27 17.19 15.27 14.45
Jan Feb Mar Apr May Jun Jul Aug Sep Oct Nov Dec ‘05 Avg Temp 23.34 26.02 25.57 25.59 24.3 23.97 23.05 22.92 23.39 23.73 24.02 23.74 ‘06 Avg Temp 24.49 25.41 25.45 25.15 24.06 23.32 23.64 23.03 23.13 23.79 23.41 23.05 ‘07 Avg Temp 22.95 24.6 25.6 25.04 24.5 23.89 23.74 22.8 23.5 23.98 23.6 23.42 ‘08 Max Temp 23.54 23.73 24.18 24.79 23.81 24.16 23.59 23.42 23.79 23.57 23.67 23.81 ‘09 Min Temp 24.34 24.46 26.27 24.09 23.91 23.29 23.83 23.8 24 24.2 23.67 23.45
lisagard
Typewritten Text
lisagard
Typewritten Text
ANSWER KEY
lisagard
Typewritten Text

Page 2 of 2 Jan Feb Mar Apr May Jun Jul Aug Sep Oct Nov Dec
‘05 Max Temp 32.84 34.82 32.97 32.97 30.93 30.07 28.87 28.42 29.5 30.26 32.77 33.03 ‘06 Max Temp 33.63 34.26 33.35 32.7 30.03 29.6 29.58 29.02 29.23 30.37 31.35 31.96 ‘07 Max Temp 33.19 34.11 34.29 31.79 31.23 30.57 29.48 28.63 29.8 30.52 31.19 32 ‘08 Max Temp 32.28 33.97 33.33 31.71 30.79 31.21 30.48 30.52 31.37 30.34 30.63 32.19 ‘09 Max Temp 33.56 33.38 35.64 31.14 30.36 29.92 29.96 30.07 30.31 30.6 31.53 32.61 5-‐yr Mo
Max Temp 33.1 34.11 33.92 32.06 30.67 30.11 29.67 29.33 30.04 30.42 31.49 32.36
Jan Feb Mar Apr May Jun Jul Aug Sep Oct Nov Dec 2005 Avg
RH 40.27 44.94 55.48 57.39 66.59 69.1 66.87 69 67.19 62.47 41.94 39.74 2006 Avg
RH 42.33 43.31 45.17 48.08 63.28 66.06 74.11 64 60.61 61.44 44 32.61 2007 Avg
RH 29.58 32.13 32.71 55.34 59.75 60 68.1 72.07 51.76 55.11 48.72 47.43 2008 Avg
RH 50.99 44.79 34.55 57.77 62.39 62.46 60.17 51.86 48.56 57.74 45.79 43.42 2009 Avg
RH 41.68 31.74 34.73 48.75 50.26 47.18 46.89 50.43 46.27 45.2 42.63 42.07
Instructions: Use the GLOBE Visualization System at http://www.globe.gov/globe-data/visualize-and-retrieve-data. Download daily minimum and maximum temperatures and relative humidity data for GLOBE Site 1525, Government Bilingual High School (GBHS) in Ndop, Cameroon to complete the template above. If computers are unavailable, Excel and CSV spreadsheet files are available for printing or computer homework in order to complete the calculations required.
Record your calculations above, rounding each calculation up to two decimal points where applicable. Students may be asked to focus on collecting the data specified for a particular year or a series of months, and then combining each groups’ calculations on the tables above. Follow instructions given to you by your instructor, then use the data to follow steps specified on the Student Activity Sheet: What to do and how to do it and answer questions on the Months of Greatest Meningitis Risk, 2005-2009 worksheet. Temperature is recorded in degrees Celsius; relative humidity is recorded in the amount of water vapor present in air expressed as a percentage of the amount needed for saturation at the same temperature.

Teacher Master Worksheet: Months of Greatest Meningitis Risk between 2005 – 2009 in Ndop, Cameroon
1. How dangerous is meningococcal meningitis on the African continent and what are its symptoms?
Meningococcal meningitis is a bacterial form of meningitis that affects the meninges that enclose the brain and spinal cord. During the dry season in meningitis belt countries, respiratory infections commonly occur causing irritation to the back of one’s throat that increase the risk of meningitis outbreaks and epidemics. Symptoms include a stiff neck, high fever, sensitivity to light, confusion, headaches, and vomiting, although for babies, the systems are often not the same. The disease typically kills 5 to 10% of those infected with a 50% fatality rate for those untreated with antibiotics.
2. How is weather linked to meningitis?
Higher humidity is associated with decreased meningitis transmission (Molesworth et al. 2003) and epidemics stop with the onset of the monsoon season (WHO 2012). (For countries in the meningitis belt, the dry season usually falls between December and May, while the wet season typically runs between June and November. This is left for students to infer from their data calculations for Ndop.) Research shows that climatic conditions causing drought, dust, and dust storms are important risk factors for the disease.
3. When relative humidity (RH) is above a certain threshold in meningitis belt countries, meningitis cases and new onsets of the disease diminish significantly. What is that RH threshold? Cold nights also are said to contribute to the disease. In what months are nights coldest in Ndop?
November, December and January most likely have the coldest nights in Npod assuming that each month’s minimum temperature average occurs during evening hours. This is inferred from the data representing a five-year sample vs 30 to 50 years.
4. What does the research say as paraphrased in the activity Background about typical temperature during periods of meningitis outbreaks of any magnitude? Does Africa alone have cases of the disease?
The research shows that large numbers of meningitis cases occur when the maximum temperatures are high and the relative humidity is low, with RH above 40% signaling an end to outbreaks in meningitis belt countries. (The dry season for the entire sub-Saharan Africa region typically falls within the months between December through May. The disease is not endemic to sub-Saharan Africa alone. It is found all over the world including North America, Asia, South America, Europe, and elsewhere.
5. List in separate parentheses the months with their year from your Meningitis Data tables when RH in Ndop was less than 40% along with the month’s maximum temperature, i.e. (month/year, RH, Max Temp). What months do you think typically encompass Ndop’s dry season and wet season?
(12/2005, 39.74%, 33.03° C), (12/2006, 32.61%, 31.96° C), (1/2007, 29.58%, 33.19° C), (2/2007, 32.13%, 34.11° C), (3/2007, 32.71%, 34.29° C), (3/2008, 34.55%, 33.33° C), (2/2009, 31.34%, 33.38° C), (3/2009, 34.73%, 35.64° C) According to the data, Cameroon’s dry season most likely includes the months of December, January, February, and March. The research literature notes that the dry season also includes April and May. It is likely that many students also picked November based on the low means of relative humidity during the 5 years investigated.
6. What one-year of the 5 years reviewed presents the greatest weather-related risks for meningitis outbreaks in Ndop? What consecutive months have weather conditions best suited for meningitis outbreaks?
The year 2007 showed the most favorable weather conditions for meningitis outbreaks from January to March of that year. December of 2006 also can be added to extend this 3 month-period to a four- month period with weather conditions most favorable for meningitis outbreaks. (Research shows almost 55 000 cases and 4000 deaths reported in 2007 in Meningitis belt countries, most of them from Burkina Faso.) Figures for Cameron and Ndop in particular require additional research to determine.
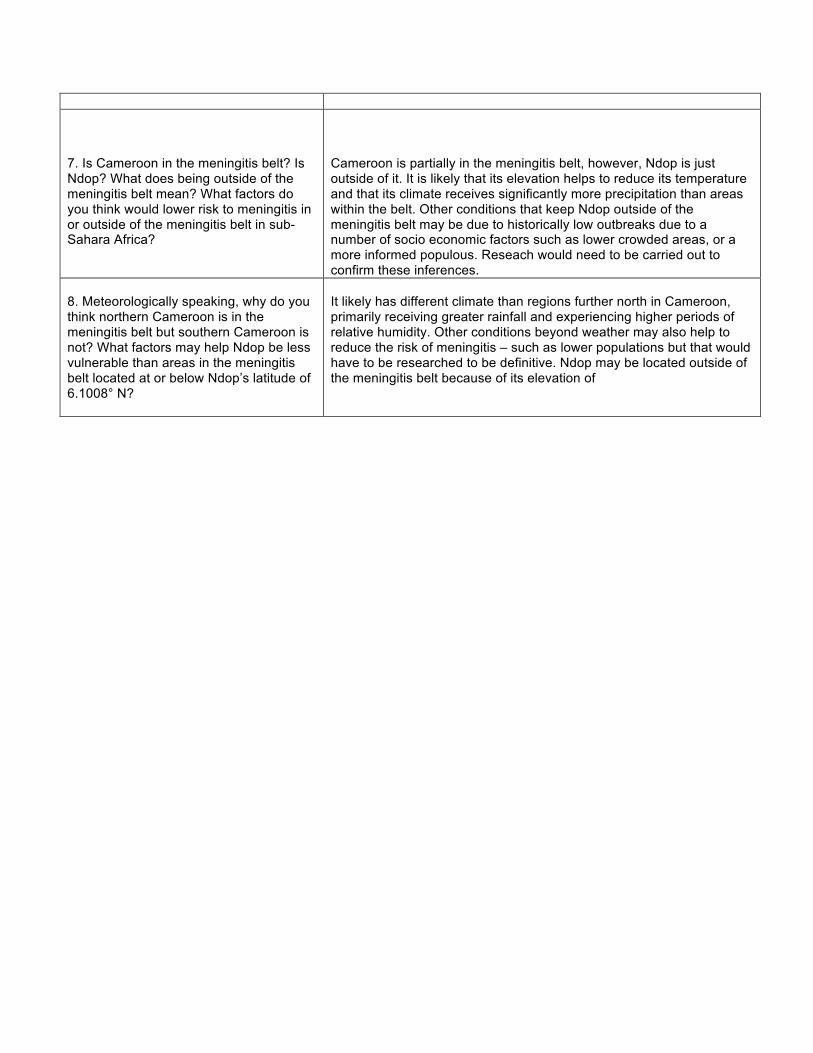
7. Is Cameroon in the meningitis belt? Is Ndop? What does being outside of the meningitis belt mean? What factors do you think would lower risk to meningitis in or outside of the meningitis belt in sub-Sahara Africa?
Cameroon is partially in the meningitis belt, however, Ndop is just outside of it. It is likely that its elevation helps to reduce its temperature and that its climate receives significantly more precipitation than areas within the belt. Other conditions that keep Ndop outside of the meningitis belt may be due to historically low outbreaks due to a number of socio economic factors such as lower crowded areas, or a more informed populous. Reseach would need to be carried out to confirm these inferences.
8. Meteorologically speaking, why do you think northern Cameroon is in the meningitis belt but southern Cameroon is not? What factors may help Ndop be less vulnerable than areas in the meningitis belt located at or below Ndop’s latitude of 6.1008° N?
It likely has different climate than regions further north in Cameroon, primarily receiving greater rainfall and experiencing higher periods of relative humidity. Other conditions beyond weather may also help to reduce the risk of meningitis – such as lower populations but that would have to be researched to be definitive. Ndop may be located outside of the meningitis belt because of its elevation of