The Hidden Wealth of Nations The Scourge of Tax...
23
The Hidden Wealth of Nations The Scourge of Tax Havens Gabriel Zucman (UC Berkeley) September 2015
Transcript of The Hidden Wealth of Nations The Scourge of Tax...

The Hidden Wealth of NationsThe Scourge of Tax Havens
Gabriel Zucman(UC Berkeley)
September 2015

How big are offshore tax avoidance andevasion & what can be done about them?
A growing policy concern, yet hard to quantify:
For some observers, considerable tax revenue losses
For others, most of the activities in tax havens are legitimate
On both sides, generally limited empirical evidence
A number of recent initiatives:
FATCA, automatic exchange of bank information, BEPS
What can we expect from these policies?
⇓In the book I try to explain how published macro statistics can be
used to shed light on these issues

The book is based on a number of recentresearch papers
1. “The Missing Wealth of Nations: Are Europe and the US netDebtors or net Creditors?”, QJE 2013
2. “The End of Bank Secrecy?” (with Niels Johannesen), AEJ2014
3. “Taxing Across Borders: Tracking Personal Wealth andCorporate Profits”, JEP 2014
Extended, improved, updated, and better explained in the book...
...But much more research needed to offer definitive answers
All figures and data available online athttp://gabriel-zucman.eu/hidden-wealth
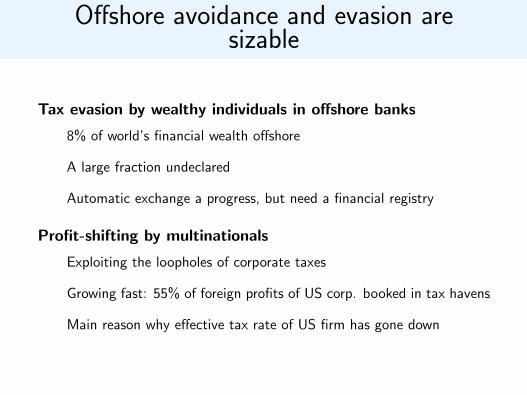
Offshore avoidance and evasion aresizable
Tax evasion by wealthy individuals in offshore banks
8% of world’s financial wealth offshore
A large fraction undeclared
Automatic exchange a progress, but need a financial registry
Profit-shifting by multinationals
Exploiting the loopholes of corporate taxes
Growing fast: 55% of foreign profits of US corp. booked in tax havens
Main reason why effective tax rate of US firm has gone down

I- Tax evasion by wealthyindividuals

A growing fraction of wealth is beingmanaged by offshore financial institutions
0%
2%
4%
6%
8%
10%
1940 1950 1960 1970 1980 1990 2000 2010
% o
f U
.S. e
quity
mar
ket c
apita
lizat
ion
In 2012, 9% of the U.S. listed equity market capitalization was held by tax haven investors (hedge funds in the Cayman Islands, banks in Switzerland, mutual funds in Luxembourg, individuals in Monaco, etc.). Source: author's computations using US TIC data
U.S. equities held by tax haven firms and individuals
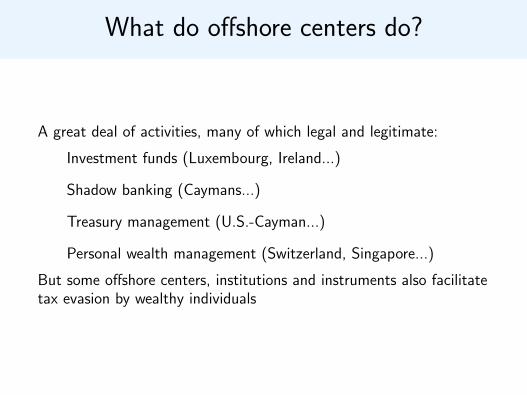
What do offshore centers do?
A great deal of activities, many of which legal and legitimate:
Investment funds (Luxembourg, Ireland...)
Shadow banking (Caymans...)
Treasury management (U.S.-Cayman...)
Personal wealth management (Switzerland, Singapore...)
But some offshore centers, institutions and instruments also facilitatetax evasion by wealthy individuals
How offshore tax evasion works
Shell companies
Fake invoices
Offshore accounts
Disconnecting legal and beneficial ownership
What do we know about the magnitudeof offshore tax evasion?
Monthly statistics by the Swiss National Bank
Systematic anomalies in the international investment positions ofcountries caused by offshore portfolio wealth
8% of the world’s financial wealth offshore
If anything lower bound
Limited data on what fraction evades taxes: evidence suggesting90-95% prior to 2008, down to 80% today

8% of the world’s financial wealth is heldoffshore, costing at least $200bn
Offshore wealth ($ bn)
Share of financial
wealth held offshore
Tax revenue loss ($ bn)
Europe 2,600 10% 75USA 1,200 4% 36Asia 1,300 4% 35
Latin America 700 22% 21Africa 500 30% 15
Canada 300 9% 6Russia 200 50% 1
Gulf countries 800 57% 0
Total 7,600 8.0% 190

Despite recent policy initiatives, muchremains to be done
Automatic exchange of bank information will become global standardby end of 2010s: big progress.
Three obstacles:
Incentives of offshore bankers
Financial opacity
Incentives of tax havens
⇓What is missing: well defined sanctions (FATCA) and a world
financial registry

How Swiss bankers torpedoed previousattempts at curbing tax evasion
0%
10%
20%
30%
40%
50%
60%
70%
1982 1986 1990 1994 1998 2002 2006 2010
% o
f Sw
iss
acco
unts
am
ount
s
Accounts held through sham corporations
Accounts directly held by Europeans
EU Saving Tax
Directive

The case for a world financial register
The companies Clearstream, Euroclear, etc. feed the world financial register. Tax authorities can verify that tax-payers indeed declare all the financial
securities included in the register
Despository Trust Corporation
(USA)
Clearstream (Luxembourg)
Euroclear France (France)
Other central securities depositories
& other sources
World financial register
U.S. tax authority
U.K. tax authority
French tax authority
Other tax administrations

II- Multinational corporations taxavoidance

The taxation of multinationals is basedon 3 principles adopted in the 1920s
Source-based taxation
Taxes are to be paid to countries where profits have been made
Not to countries where shareholders live (= residence taxation)
But how to determine where the profits have been made?
Arm’s length pricing
Subsidiaries of a same group must compute their profits as ifunrelated
I.e., trade goods and services internally at market prices
Bilateral agreements
No multilateral agreement like GATT
Instead, thousands of bilateral tax treaties

The choices made in the 1920s arecoming back to haunt the tax authorities
0%
5%
10%
15%
20%
25%
30%
35%
1930-39 1940-49 1950-59 1960-69 1970-70 1980-89 1990-99 2000-09 2010-13
% o
f U.S
. cor
pora
te p
rofit
s
The share of profits made abroad in U.S. corporate profits
Notes: The figure reports decennial averages (e.g., 1970-79 is the average of 1970, 1971, ..., 1979). Foreign profits include dividends on foreign portfolio equities and income on US direct investment abroad (distributed and retained). Profits are net of interest payments, gross of US but net of foreign corporate income taxes. Source: author's computations using NIPA data, see Online Appendix.

Each of the 3 core principles forinternational taxation raises its own issues
Bilateral agreements
Treaty shopping to generate stateless income
Example: Google
Arm’s length pricing
Easy to manipulate transfer prices
Reference prices often do not exist
Source-based taxation
Artificial profit shifting
Tax competition for real investments
What is the cost of multinationalcorporate tax avoidance?
Hard to quantify: double-counting issues, tax laws vary acrosscountries, etc.
My approach: use national accounts & balance of payments data
Focus on the United States: what is happening to the profits ofUS-owned companies?
⇓Latest data show offshore tax avoidance is sizable and
growing fast

A growing fraction of US corporateprofits are made abroad
0%
5%
10%
15%
20%
25%
30%
35%
1930-39 1940-49 1950-59 1960-69 1970-70 1980-89 1990-99 2000-09 2010-13
% o
f U.S
. cor
pora
te p
rofit
s
The share of profits made abroad in U.S. corporate profits
Notes: The figure reports decennial averages (e.g., 1970-79 is the average of 1970, 1971, ..., 1979). Foreign profits include dividends on foreign portfolio equities and income on US direct investment abroad (distributed and retained). Profits are net of interest payments, gross of US but net of foreign corporate income taxes. Source: author's computations using NIPA data, see Online Appendix.
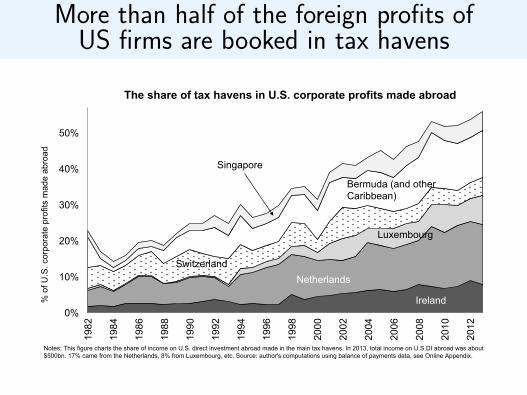
More than half of the foreign profits ofUS firms are booked in tax havens
0%
10%
20%
30%
40%
50%
1982
1984
1986
1988
1990
1992
1994
1996
1998
2000
2002
2004
2006
2008
2010
2012
% o
f U.S
. cor
pora
te p
rofit
s m
ade
abro
ad
The share of tax havens in U.S. corporate profits made abroad
Singapore
Ireland
Netherlands
Luxembourg
Switzerland
Bermuda (and other Caribbean)
Notes: This figure charts the share of income on U.S. direct investment abroad made in the main tax havens. In 2013, total income on U.S.DI abroad was about $500bn. 17% came from the Netherlands, 8% from Luxembourg, etc. Source: author's computations using balance of payments data, see Online Appendix.

20% of all US corporate profits arebooked in tax havens
0%
5%
10%
15%
20%
25%
1984
1986
1988
1990
1992
1994
1996
1998
2000
2002
2004
2006
2008
2010
2012
% o
f US
cor
pora
te p
rofit
s
The share of tax havens in U.S. corporate profits
Notes: This figure charts the ratio of profits made in the main tax havens (Netherlands, Ireland, Switzerland, Singapore, Luxembourg, Bermuda and other Caribbean havens) to total US corporate profits (domestic plus foreign). Source: author's computations using NIPA and balance of payments data, see Online Appendix.

The effective rate paid by US corporationshas been reduced by 1/3 since late 1990s
0%
5%
10%
15%
20%
25%
30%
35%
40%
45%
50%
55%
1950-59 1960-69 1970-70 1980-89 1990-99 2000-09 2010-13
% o
f US
cor
pora
te p
rofit
s
Nominal and effective corporate tax rates on US corporate profits
Nominal U.S. federal rate
Effective rate paid to US government
Effective rate paid to US and foreign gov.
Notes: The figure reports decennial averages (e.g., 1970-79 is the average of 1970, 1971, ..., 1979). In 2013, over $100 of corporate profits earned by US residents, on average $16 is paid in corporate taxes to the U.S. government (federal and States) and $4 to foreign governments. Source: author's computations using NIPA data, see Online Appendix.

Reforming the US corporate tax
Formula apportionment
Works reasonably well for US States
Based on final sales to remove incentives to move real activity
It’s the best way to levy taxes efficiently and fairly
Integration with the personal income tax
Removes incentive to dodge corporate tax
Existed in Europe for a very long time
Can work internationally: reciprocal crediting Europe/US as partof transatlantic free trade agreement (TTIP)