THE HETEROGENEITY OF HOUSING ELDERLY’S PROFILE: EVIDENCE FROM WALLOON DATA Dr. Stéphanie CASSILDE...
28
THE HETEROGENEITY OF HOUSING ELDERLY’S PROFILE: EVIDENCE FROM WALLOON DATA Dr. Stéphanie CASSILDE HSA Conference 2015, 8th-10th April
-
Upload
victor-copeland -
Category
Documents
-
view
213 -
download
0
Transcript of THE HETEROGENEITY OF HOUSING ELDERLY’S PROFILE: EVIDENCE FROM WALLOON DATA Dr. Stéphanie CASSILDE...
THE HETEROGENEITY OF HOUSING ELDERLY’S PROFILE: EVIDENCE
FROM WALLOON DATA
Dr. Stéphanie CASSILDEHSA Conference 2015, 8th-10th April

Why and How Searching of Heterogeneity of Housing Elderly’s
Profile ?
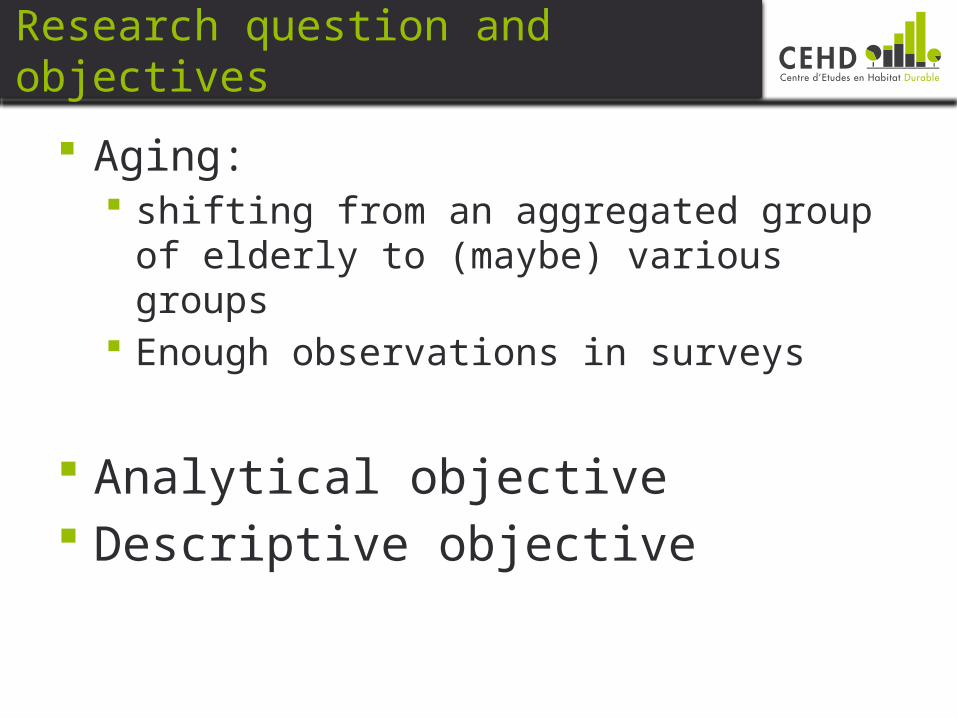
Research question and objectives
Aging: shifting from an aggregated group of elderly to
(maybe) various groups Enough observations in surveys
Analytical objective Descriptive objective

Housing Quality Survey in Wallonia
EQH 2006-2007
Description of each household
1895 retired, 4031 non-retired
EQH 2012-2013
Description of each individual within the household
1954 retired, 4058 non-retired
Housing = Regional Authority ; private households
+: cross sectional comparability
-: lost of information (age, comparable income)
Household level

Methodology
Multiple Correspondence Factorial Analysis
Hierarchical Ascendant Classification Descriptive statistics for the group-specific
characteristics
Full sample Sample of retired Sample of non-retired

With the results, I wish to learn
Is the factorial space of housing conditions the same for all?
Which are the differences between retired groups and non-retired groups?
Which are the similarities between retired groups and non-retired groups?
To which extent is there an heterogeneity of housing elderly’s profile?

The Walloon Context

The Walloon Context
Being landlord is the norm (70%) Promotion to access property (bonus logement;
ends in 2015) High preference for detached-houses High preference for houses (80%) 50-70 sqrt.m. belongs to small housing (very) Old housing stock Poor insulation
Promotion to realize insulation (add of income eligibility criteria in 2015)
The Factorial Space of Housing Conditions in Wallonia
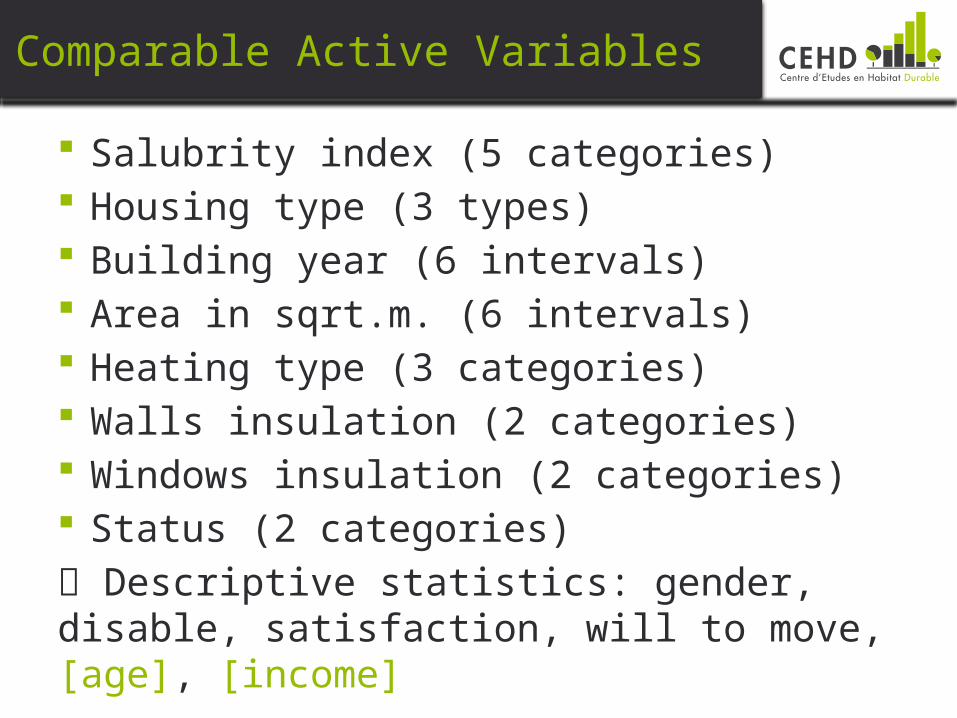
Comparable Active Variables
Salubrity index (5 categories) Housing type (3 types) Building year (6 intervals) Area in sqrt.m. (6 intervals) Heating type (3 categories) Walls insulation (2 categories) Windows insulation (2 categories) Status (2 categories)
Descriptive statistics: gender, disable, satisfaction, will to move, [age], [income]

The Factorial Space
Dimension 1
Housing type Area in sqrt.m. Status
α Cronbach between 0.572 and 0.671
Dimension 2
Salubrity index Heating type Building year Insulation
α Cronbach between 0.394 and 0.463

landlordhouse
huge area
tenantapartmentsmall area
old buildingbad salubrity indexindividual heating
new buildinggood salubrity index
central heatinggood insulation
Dimension 1
Dimension 2
4 groups

EQH 2006-2007
Results
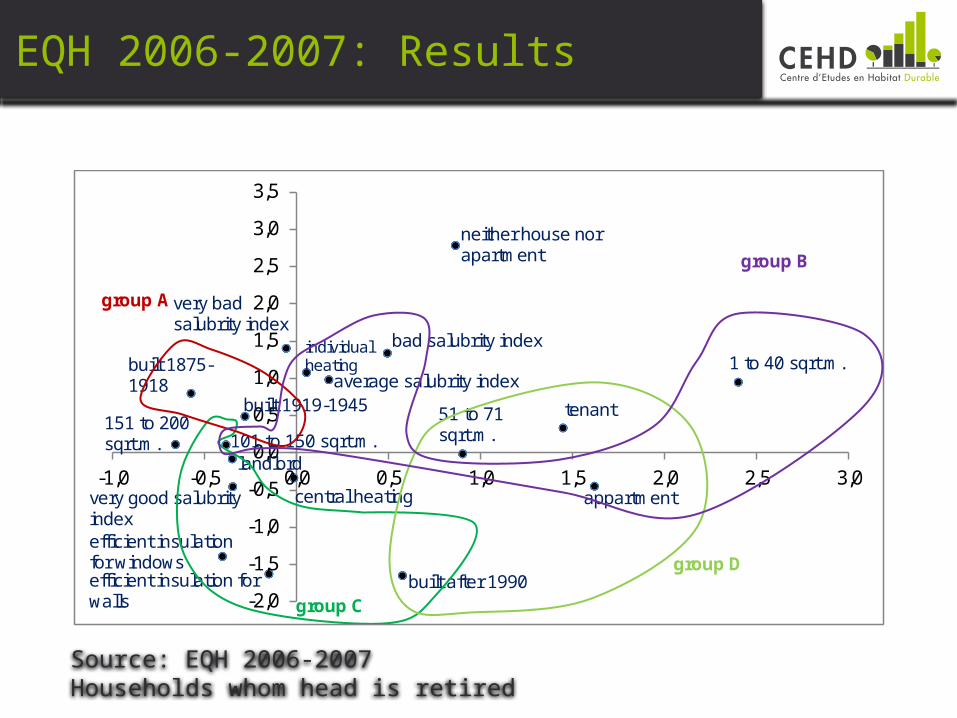
EQH 2006-2007: Results
-2,0
-1,5
-1,0
-0,5
0,0
0,5
1,0
1,5
2,0
2,5
3,0
3,5
-1,0 -0,5 0,0 0,5 1,0 1,5 2,0 2,5 3,0
efficient insulation for windowsefficient insulation for walls
built after 1990
very good salubrity index
central heating appartment
1 to 40 sqrt.m.
tenant51 to 71 sqrt.m.
landlord101 to 150 sqrt.m.
151 to 200 sqrt.m.
built 1919-1945
built 1875-1918 average salubrity index
individualheating
very badsalubrity index
bad salubrity index
neither house nor apartment
group D
group B
group C
group A
Source: EQH 2006-2007Households whom head is retired

EQH 2006-2007: Results
4 groups of retired household head
A: 60.3% (AVERAGE) old housing
B: 13.7% old apartment with individual heating and bad salubrity index
C: 9.1% better housing conditions
D: 16.9% tenant in new small apartment
4 groups of non-retired household head
1: 25.2% better housing conditions
2: 18.3% small housing with average salubrity index
3: 29.4% old huge housing with individual heating and bad/average salubrity index
4: 27.1% tenant in very small apartment

EQH 2006-2007: Results
4 groups of retired household head
A: 60.3% (AVERAGE) B: 13.7% [low income] C: 9.1% very satisfied
[refusal to communicate the income]
D: 16.9% woman [low income]
4 groups of non-retired household head
1: 25.2% very satisfied, do not want to move [good income or refusal]
2: 18.3% [average income] disable in the household
3: 29.4% (AVERAGE) 4: 27.1% not satisfied
[low income]

EQH 2012-2013
Results

EQH 2012-2013: Results
Source: EQH 2012-2013Households whom head is retired
-2,5
-2,0
-1,5
-1,0
-0,5
0,0
0,5
1,0
1,5
2,0
-1,0 -0,5 0,0 0,5 1,0 1,5 2,0 2,5
1 to 40 sqrt.m.
apartment
tenant51 to 70 sqrt.m.
built after 1990individual heating
very bad salubrity index
no heating or only extra heatingbad salubrity index
built 1919-1945built 1875-1918
71 to 100 sqrt.m.landlord
151 to 200 sqrt.m.
101 to 150 sqrt.m.
very good salubrity index
built 1971-1990
efficient insulation for windows
efficient insulation for walls
group A
group C
group D
group B

EQH 2012-2013: Results
4 groups of retired household head
A: 43.5% (AVERAGE) old housing, no heating or only extra heating
B: 4.6% tenant in small apartment
C: 36.7% better housing conditions
D: 15.2% tenant in new small apartment
4 groups of non-retired household head
1: 26.2% better housing conditions
2: 16.1% tenant in small apartment with individual heating
3: 45.2% old housing with average salubrity index
4: 12.6% tenant in small and old apartment with very bad salubrity index and no heating or only extra heating

EQH 2012-2013: Results
4 groups of retired household head
A: 43.5% (AVERAGE) B: 4.6% woman
[low/average income] C: 36.7% very satisfied
[huge income] [55 to 64] D: 15.2% woman
4 groups of non-retired household head
1: 26.2% very satisfied [huge income]
2: 16.1% woman, low satisfaction, will to move [low/average income] [25-34]
3: 45.2% (AVERAGE) 4: 12.6% woman, disable
in the household, low satisfaction, will to move [low income]

Comparing EQH 2006-2007 and 2012-2013
Results
What affect retired and non-retired
What is due to the evolution of the housing sector:
Extra heating is back Decrease of landlord %, even if higher
proportion of landlord among retired than among non-retired

Growing heterogeneity among retired
Decrease of A % (AVERAGE group) Worse housing conditions for A Increase of C % (better conditions) Decrease of B % Stability of D %

Today non-retired are tomorrow retired
Growing heterogeneity that can be expected : Stability of (1) % (better conditions) Stability of (2) % But worse housing conditions for (2) and
feminization Increase of (3) % (AVERAGE) old buiding Decrease of (4) %
Conclusions, Limitations, and Perspectives

Conclusions
4 housing elderly’s profiles in Walloon data Growing differences between these
profiles Invite to a thinner focus for public policy
design
Limitations and Perspectives
Collective households (retired home) Elderly who live with their children Retired status maybe « erases » former
characteristics following life housing path
Curiosity for other countries: which factorial space? Which kind of heterogeneity among elderly?
Thank you for your attention
The Heterogeneity of Housing Elderly’s Profile: Evidence from
Walloon Data
Dr. Stéphanie CASSILDEHSA Conference 2015, 8th-10th April