The Hanover Insurance Group - AnnualReports.com€¦ · · 2016-11-18THE HANOVER INSURANCE GROUP...
168
ANNUAL REPORT The Hanover Insurance Group
Transcript of The Hanover Insurance Group - AnnualReports.com€¦ · · 2016-11-18THE HANOVER INSURANCE GROUP...

A N N U A L R E P O R T
The Hanover Insurance Group
T
HE
HA
NO
VE
R IN
SU
RA
NC
E G
RO
UP
07148 (3/14)
20
13
AN
NU
AL
RE
PO
RT
The Hanover Insurance Company440 Lincoln Street, Worcester, MA 01653
h a n o v e r . c o m
©2014 The Hanover Insurance Group, Inc.

About The Hanover
The Hanover Insurance Group, Inc.
(NYSE: THG), based in Worcester, Mass.,
is one of the top 25 property and casualty
insurers in the United States. For more
than 160 years, The Hanover has provided
a wide range of property and casualty
products and services to businesses,
individuals, and families. The Hanover
distributes its products through a select
group of agents and brokers. Through
its international member company,
Chaucer, The Hanover also underwrites
business at Lloyd’s of London in several
major insurance and reinsurance classes,
including marine, property and energy.
For more information, please visit
hanover.com.
Year Ended December 31 2013 2012($ in millions, except per share amounts)
Revenues $ 4,794 $ 4,591
Net Income 251 56
Income From Continuing Operations 246 46
Operating Income After Taxes1 227 15
Total Assets 13,379 13,485
Shareholders’ Equity 2,595 2,595
Per Share Data
Net Income Per Share — Diluted $ 5.59 $ 1.23
Income From Continuing Operations Per Share $ 5.47 $ 1.02
Book Value Per Share $ 59.43 $ 58.59
Financial Summary
1 Operating income after taxes is a non-GAAP measure. A definition and reconciliation to the closest GAAP measure, income from continuing operations, can be found on page 44 of the enclosed Annual Report on Form 10-K.
Comparison of Cumulative Total Return1
Among The Hanover Insurance Group, Inc., the S&P 500 Index and the S&P Property & Casualty Insurance Index
50
75
100
125
150
175
200
225
250
‘09 ‘10 ‘11 ‘12 ‘13
FIVE-YEAR TOTAL RETURN PERFORMANCE
‘08
The Hanover Insurance Group
S&P 500
S&P P&C Insurance Index
1 The graph above compares the performance of the company’s common stock since December 31, 2008 with the performance of the S&P 500 Index and the S&P Property & Casualty Insurance Index.
Assumes $100 invested on December 31, 2008 in The Hanover Insurance Group, Inc.’s common stock or applicable index — including reinvestment of dividends. Fiscal year ended December 31.
Copyright © 2014, SNL Financial LC, Charlottesville, VA. All rights reserved. www.snl.com.
COMMON STOCK
The common stock of The Hanover Insurance Group, Inc. is traded on the New York Stock Exchange under the symbol “THG.” As of the close of business on February 20, 2014, the company had 21,896 shareholders of record. On the same date, the closing price of the company’s common stock was $58.24 per share.
COMMON STOCK PRICES
2013 High Low
First Quarter $ 49.68 $ 39.19
Second Quarter $ 51.66 $ 46.73
Third Quarter $ 56.06 $ 48.67
Fourth Quarter $ 60.99 $ 54.83
2012 High Low
First Quarter $ 41.52 $ 34.27
Second Quarter $ 41.04 $ 37.17
Third Quarter $ 39.69 $ 33.99
Fourth Quarter $ 39.51 $ 34.58
ANNUAL MEETING OF SHAREHOLDERS
The management and Board of Directors of The Hanover Insurance Group, Inc. invite you to attend the company’s Annual Meeting of Shareholders. The meeting will be held on May 20, 2014, at 9:00 a.m. at The Hanover, 440 Lincoln Street, Worcester, Massachusetts.
CORPORATE GOVERNANCE
Our Corporate Governance Guidelines, Board Committee Charters, Code of Conduct, and other information are available on our Web site at www.hanover.com under “About Us.” For a printed copy of any of these documents, shareholders may contact the company’s secretary at our corporate offices.
The company has filed its CEO and CFO Section 302 certifications as exhibits to its Annual Report on Form 10-K for the year ended December 31, 2013. The company also has submitted its annual CEO certification to the New York Stock Exchange, a copy of which is available on the company’s Web site, www.hanover.com, under “About Us – Corporate Governance.”

THE HANOVER INSURANCE GROUP 2013 ANNUAL REPORT | 1
To Our Shareholders,2013 was a successful year for The Hanover. We made important progress across
our organization, further strengthening our financial foundation and our market
position, as we advanced our goal to become a world class property and casualty
insurer — one that can consistently deliver top-quartile returns.
Our company has never been better
positioned to succeed. Following a period
of significant investments, we have created
a broad and innovative product portfolio,
a strong national distribution platform and
deep partnerships with a select group of
the best agents and brokers in our business
that reach every significant geographic
market in the U.S. We are now poised
to leverage the investments we made in
our organization and to deliver even
greater value to our agent partners, their
customers and our shareholders.
Our financial results for the year
were strong. We delivered improved
underwriting performance, while building
our balance sheet and capital strength.
We were equally pleased with the important
progress we made on our strategic priorities
during the year, and how that progress
positions us for further margin expansion
and growth going forward.
While we recognize there is more to be
accomplished to achieve our ultimate
financial goals, we are very pleased with
the substantial progress we made in 2013.
Fred EppingerPres ident and CEO
| 1

2 | THE HANOVER INSURANCE GROUP 2013 ANNUAL REPORT
INTERNATIONAL LLOYD’S PLATFORM
$1.4BGROSS PREMIUMS
• • • • • • • • • • • • • •
800 EMPLOYEES
8 INTERNATIONAL OFFICES
DOMESTIC
$3.8BGROSS PREMIUMS
• • • • • • • • • • • • • •
4,300 EMPLOYEES
8 BUSINESS CENTERS; 41 OFFICES
DOMESTIC
• Commercial and specialty business countrywide
• Personal Lines business primarily in states east of the Mississippi River
CHAUCER
• International operations through Lloyd’s, headquartered in London — Marine and Aviation, Property, Energy, Nuclear and U.K. Motor
• Locations in Whitstable and Nottingham (U.K.), Copenhagen, Oslo, Singapore, Buenos Aires and Houston
In 2014, we’ll continue to focus on refining
our mix of business to enhance profitability
and mitigate volatility, leveraging our
portfolio and value proposition, and further
strengthening our financial position. At
the same time, we believe the relationships
we developed with our agency partners
will help drive profitable growth going
forward, and reduce the impact of some
unfavorable market trends.
DEMONSTRATING THE FINANCIAL
POWER OF THE BUSINESS WE BUILT
2013 operating income was $227 million,
or $5.06 per share, resulting in a return on
shareholders’ equity of 10%. While we, along

THE HANOVER INSURANCE GROUP 2013 ANNUAL REPORT | 3
with the entire industry, benefited from
relatively good weather last year, the
noteworthy driver of our success was
the strong underlying performance in
each of our businesses.
Setting aside the impact of catastrophe
losses, our operating income before taxes1
increased by 20%, to $533 million in 2013,
demonstrating the earnings power inherent
in the organization. Equally as important,
we delivered on our expectation of a 94%
combined ratio, excluding catastrophes1,
an improvement of more than two points
over 2012. Our underlying underwriting
performance continued to produce profits
above industry averages.
In our domestic business, we improved
our combined ratio, excluding catastrophes1,
by three points, driving an increase of more
than $100 million in our underwriting margin
and underscoring the strong potential of
our domestic franchise.
Looking beyond domestic operations,
Chaucer once again produced very strong
results for the year, proving to be an
outstanding investment since its acquisition
in July 2011, as it has contributed total
cumulative operating income before
taxes of $320 million and significantly
diversified our risks.
Broad Product Mix with Distinctiveness in Every Business $4.6B
2013 NET PREMIUMS WRITTEN
20% Personal Auto
16% U.S. Specialty Lines
14% Small Commercial
14% Middle Market
13% International Specialty Lines
12% Homeowners
7% U.K. Motor
4% Property: Treaty and Facultative
1 See footnote on the next page of this document. THE HANOVER INSURANCE GROUP 2013 ANNUAL REPORT | 3

4 | THE HANOVER INSURANCE GROUP 2013 ANNUAL REPORT
Recent Underwriting Trends
60%
62%
64%
66%
68%
70%
72%
74%
76%
78%
80%
LOSS RATIO
The Hanover Insurance Group1
Industry2
94%
96%
98%
100%
102%
104%
106%
108%
COMBINED RATIO
93%
94%
95%
96%
97%
98%
COMBINED RATIO, EX-CATASTROPHES 3
1 All Hanover data includes Chaucer results since July 1, 2011.2 Source for industry statistics: A.M. Best P&C Review and Preview Feb. 4, 2014; Ratios and growth percentages
for 2013 are forecasted industry estimates.3 Non-GAAP measures. A reconciliation to the closest GAAP measure, Combined Ratio, as shown in the
graph above, and in the case of pre-tax operating income, excluding catastrophes, can be found on page 46 of the Form 10-K, and on pages six and seven of the fourth quarter 2013 Financial Supplement, (available at www.hanover.com under “About Us – Investors”).
-5%
0%
5%
10%
15%
20%
25%
NET PREMIUMS WRITTEN GROWTH
‘09 ‘10 ‘11 ‘12 ‘13
‘09 ‘10 ‘11 ‘12 ‘13
‘09 ‘10 ‘11 ‘12 ‘13
‘09 ‘10 ‘11 ‘12 ‘13
4 | THE HANOVER INSURANCE GROUP 2013 ANNUAL REPORT

THE HANOVER INSURANCE GROUP 2013 ANNUAL REPORT | 5
We also continued to strengthen the
balance sheet during the year through
effective capital management strategies,
thoughtful investment management
and prudent reserving. We ended the
year in an excellent capital position.
All of our financial strength indicators
were at or better than target levels,
demonstrating substantial improvement
year over year.
As of year-end 2013, our book value per
share was $59.43. Excluding net unrealized
investment gains, it grew by 8% per share
in 2013, reflecting strong earnings for the
year, as well as the impact of our capital
management initiatives. During the year,
we repurchased approximately 1.6 million
common shares, or 4% of shares outstanding
at the prior year-end, for an average price
of $48.26 per share.
Additionally, the strength of our position
allowed the Board of Directors to increase
the quarterly shareholder dividend by 12%.
In total, we paid $60 million in shareholder
dividends, which, along with very strong
stock price appreciation, puts us among
the top five companies in the property
and casualty industry for total shareholder
returns in 2013.
2010 – 2013Create More Distinctive Portfolio and Position with Agents
2003 – 2009Repair and Improve Core Capabilities and Position
RATING AGENCY
UPGRADES
2014 & BEYOND Build Earnings Power, Leverage Portfolio and Position for Growth
CHAUCER OPERATING INCOME
before taxes
* From date of acquisition (July 1, 2011)
‘11* ‘12
$32.9
$136.8
$150.4
‘13

6 | THE HANOVER INSURANCE GROUP 2013 ANNUAL REPORT
Strong Financial Foundation RECOGNIZING MEANINGFUL
STRATEGIC ACCOMPLISHMENTS
2013 was a pivotal year for us. After
a number of years of significant
investments in new geographic markets
and product breadth, the past year
was more about further refining our
business mix and portfolio and
leveraging our capabilities.
First, we continued our mix management
actions, positioning our portfolio to
deliver more consistent results through
the cycle.
We reduced volatility by lowering
property concentrations in certain
geographic markets and making coverage
modifications. We are beginning to
see the benefits of our actions, in particular
in our catastrophe ratios, which were
better on a relative basis and lower than
industry averages during the year.
BOOK VALUE PER SHARE
Book Value Per Share, Excluding Unrealized Investment Gains
Book Value Per Share
‘09 ‘10 ‘11 ‘12
$3.2
$3.9
$4.6
$4.8B
‘13
TOTAL REVENUES
Grew revenues at a five-year CAGR of 12% driven by increased written premiums.
$2.8
$8.1BDecember 31, 2013
47% Corporate
16% CMBS/MBS/ABS
12% Municipals (Taxable)
8% Equity Securities & Other
6% Cash & Cash Equivalents
5% U.S. Government & Agencies
4% Foreign Government
2% Municipals (Tax Exempt)
TOTAL INVESTED ASSETS AND CASH
‘09 ‘10 ‘11 ‘12 ‘13
$49.31
$54.23
$55.67
$58.59
$59.43
$47.63
$51.40
$51.58
$51.88
$56.07
6 | THE HANOVER INSURANCE GROUP 2013 ANNUAL REPORT

THE HANOVER INSURANCE GROUP 2013 ANNUAL REPORT | 7
At the same time, we continued to
improve the quality and earnings
potential of our product portfolio.
We shifted our mix to higher-margin
segments and businesses, and executed
targeted underwriting actions to
eliminate lower-margin business.
In the aggregate, our underwriting and
exposure management initiatives reduced
domestic premiums by approximately
$200 million, or 6% for the full year 2013,
and $320 million since the beginning
of 2012. Despite these initiatives, we
still reported growth for the year of
approximately 2% in domestic lines and
4% overall.
Second, we achieved strong pricing
increases throughout the year in both
commercial and personal lines. More
importantly, in this dynamic market
environment, we continued to approach
price changes in a thoughtful and targeted
manner, minimizing disruption, while
improving the overall quality of our book.
As a result, we finished the year with
overall price increases of 9% in commercial
lines and 8% in personal lines. Customer
retention ratios remained strong in both
lines, after adjusting for our exposure
reduction initiatives.
While we anticipate industry rate increases
will likely moderate in 2014, we believe
our commercial book of business, which is
targeted to the smaller end of the market,
and our focus on selling value, will soften
the influence of overall market trends.
Third, with Chaucer, we have built on a very
strong franchise, enhancing the breadth of
our specialty offering. Specifically, we added
additional capabilities to the casualty treaty,
marine and property lines. We maintain very
strong underwriting and proven leadership

8 | THE HANOVER INSURANCE GROUP 2013 ANNUAL REPORT
positions in most lines we write within
Lloyd’s, which enable us to manage
challenging market conditions effectively.
Additionally, we are beginning to
connect our partner agents to our
Lloyd’s platform, capturing attractive
U.S. opportunities together.
TAKING ADVANTAGE
OF OPPORTUNITIES IN
A DYNAMIC MARKETPLACE
As we move into 2014, we are in the best
position we ever have been to produce
increasingly higher returns. We have the
operating platform, the product breadth,
and the position with our distribution
partners to deliver strong profitability
and growth.
Offering Innovative Products
Our personal lines business is poised
to capitalize on expanding market
opportunities. We focus on selling value
and writing account business, which
now represents approximately 75%
of our personal lines book, and provides
customers with comprehensive coverages
and quality insurance protection. Our
new Hanover Platinum product, which
we launched in eight states in 2013 and
expect to roll out in additional markets
in 2014, provides a distinctive service and
coverage offering that should enable us
to write more attractive account business
and further improve our position with
partner agents, especially those that serve
the most attractive personal lines segments.
Our core commercial lines business is equally
well positioned in the small commercial and
middle markets. In both, we leverage our
focus on solutions specifically designed for

THE HANOVER INSURANCE GROUP 2013 ANNUAL REPORT | 9
individual industry classes and, together
with our strong local field presence,
we help our agent partners capitalize on
emerging growth opportunities.
Our domestic specialty offering
represents an increasing competitive
advantage for us. Over the past several
years, we have established a portfolio
of specialty businesses that are relevant
to the best retail agents in the country.
We provide our partner agents with
specialized products and services, such
as management and professional liability,
as well as offerings that enable us to
capitalize on rapidly expanding market
segments, like healthcare and technology.
Finally, Chaucer provides a direct link
for our partner agents to the market
at Lloyd’s. This enables our most
sophisticated partners to meet more
of their customers’ specialized
insurance needs.
Providing Franchise Value for
Partner Agents
Over the last several years, we have
established strong and mutually
beneficial partnerships with many of
the very best independent agents
and brokers in the industry. Our national
network of underwriting offices that
provide local access to broad product
capabilities, and our limited appointment
strategy, are highly valued by agents and
brokers. We believe limiting appointments
to a select group of partners, who are
committed to investing in their businesses
$0.7B2013 NET PREMIUMS
WRITTEN
35% AIX Program Business
28% Marine
10% Professional Liability
10% Surety and Bonds
7% Management Liability
6% Hanover Specialty Industry
4% Healthcare
THE HANOVER’S DOMESTIC SPECIALTY
BUSINESSES

10 | THE HANOVER INSURANCE GROUP 2013 ANNUAL REPORT
and growing with us, will drive greater
value over time. We provide our partners
with exclusive access to our products
and services, extending meaningful
franchise value, which allows them to
further differentiate their agencies in
their respective markets.
Our unique distribution strategy
resonates with winning agents and
brokers. Today, we write over 80%
of our domestic business with our
top 1,000 partners, creating a strong
alignment of interest between us.
By virtue of the strong relationships
we have built with a limited number
of agent partners, we have developed
an unparalleled knowledge of our
agents’ businesses, which, along with
our flexible, local infrastructure, allows
us to react quickly and seize attractive
opportunities in the market. We also
believe that our agency partnerships
will help minimize the effect of slowing
rate increases and disruption from
changes in the competitive landscape.
Broad and Relevant Product Mix
33% Commercial Package
15% Commercial Auto
13% AIX Programs
11% Workers’ Comp
10% Inland Marine
9% Other Products
6% Management and Professional Liability
3% Surety and Bonds
$2.0B2013 NET PREMIUMS
WRITTEN
COMMERCIAL LINES
62% Auto
35% Homeowners
3% Other Products
$1.4B2013 NET PREMIUMS
WRITTEN
PERSONAL LINES
27% U.K. Motor
25% Marine and Aviation
17% Property
16% Energy
15% Casualty and Other
$1.1B2013 NET PREMIUMS
WRITTEN
CHAUCER

THE HANOVER INSURANCE GROUP 2013 ANNUAL REPORT | 11
Small Commercial and Middle Market Core Products
• Business Owner’s Policy
• Commercial Package
• Property
• General Liability
• Commercial Automobile
• Workers’ Compensation
• Umbrella
• Technology
Specialty Products
• Marine (Inland and Ocean)
• Surety (Contract and Commercial)
• Industrial Property Risk
• Professional Liability
• Management Liability
• Healthcare Professional Liability
• Commercial Umbrella and Excess
• AIX Specialty Programs
• Excess & Surplus (Merit Specialty)
Auto and Home Insurance
• Hanover Platinum Protection
• Roofing and/or Siding Restoration
• Mechanical Replacement
• Newer Car Replacement
• Accident Forgiveness
• Roadside Assistance
Companion Products
• Umbrella
• Identity Protection
• Valuable Items
• Watercraft
• Dwelling Fire
• Home Care Services
U.K. Motor
• Private Car
• Specialist Motor
• Fleet
Marine and Aviation
• Cargo and Specie
• Marine Hull and Liability
• Marine Treaty
• Satellite
• Political Violence and Political Risk
• Aviation Hull and Liability
Property
• Property Treaty
• Facultative Property
Energy
• Energy Exploration and Production, Construction and Liability
• Onshore Energy for Midstream, Downstream and Renewables
• Nuclear Property and Liability
Casualty
• Professional and General Liability
• Financial Risks
• Medical Liability
• Institutional Healthcare
• Casualty Treaty
Products and Services
THE HANOVER INSURANCE GROUP 2013 ANNUAL REPORT | 11

12 | THE HANOVER INSURANCE GROUP 2013 ANNUAL REPORT
Comparison of Cumulative Total Return1
Among The Hanover Insurance Group, Inc., the S&P 500 Index and the S&P Property & Casualty Insurance Index
0
50
100
150
200
250
300
TEN-YEAR TOTAL RETURN PERFORMANCE
The Hanover Insurance Group
S&P 500
S&P P&C Insurance Index
1 The graph above compares the performance of the company’s common stock since December 31, 2003 with the performance of the S&P 500 Index and the S&P Property & Casualty Insurance Index.
Assumes $100 invested on December 31, 2003 in The Hanover Insurance Group, Inc.’s common stock or applicable index — including reinvestment of dividends. Fiscal year ended December 31.
Copyright © 2014, SNL Financial LC, Charlottesville, VA. All rights reserved. www.snl.com.
Our Strong Team is Well-Aligned
and Focused to Deliver Value
In keeping with our commitment to build
a company that delivers top-quartile returns,
we have made significant investments in
talent, building one of the best teams
in our business, and a team with the strength,
experience and depth that is needed as
we continue to profitably grow our business.
The alignment and focus we have engrained
in our organization ensures that we are
investing our time, energies and resources
in initiatives and activities that further
improve our competitive position for
continued progress and success. The efforts
of our more than 5,000 dedicated and
talented employees and our valued agent
partners drove progress toward our goals
and generated strong results over the
past year.
‘04 ‘05 ‘06 ‘07‘03 ‘09 ‘10 ‘11 ‘12 ‘13‘08

THE HANOVER INSURANCE GROUP 2013 ANNUAL REPORT | 13
We also were pleased to see that their
contributions and our success were
recognized by our investors through
meaningful stock price appreciation. We
believe there is further substantial earnings
and topline growth embedded in the
capabilities we built, making our company
an attractive investment opportunity.
As we forge ahead on our journey, we
have never felt better about our market
position and ability to compete and win.
In the face of significant market challenges
and extreme weather over the past several
years, we have established a solid financial
foundation, one of the best teams in our
industry, an attractive product portfolio,
and a select and unmatched national
network of the best independent agents
and brokers in our business.
While we know there is still more
work to do, we are very pleased with
the tremendous progress we made in
repositioning our organization as a leading,
value-oriented provider of commercial,
specialty and personal lines products and
services. We look forward with enthusiasm
and confidence, intent on delivering
top-quartile financial performance and
creating meaningful value for our agent
partners and their customers, our
shareholders and all of our stakeholders.
Sincerely,
Frederick H. Eppinger
President and Chief Executive Officer
THE HANOVER INSURANCE GROUP 2013 ANNUAL REPORT | 13

14 | THE HANOVER INSURANCE GROUP 2013 ANNUAL REPORT
Board of Directors
Michael P. Angelini (N) Chairman of the Board The Hanover Insurance Group, Inc. Chairman and Partner Bowditch & Dewey, LLP
Richard Booth (N) Retired Vice Chairman Guy Carpenter & Company LLC Former Chairman and Chief Executive Officer HSB Group, Inc.
P. Kevin Condron (C) Chairman and Chief Executive Officer The Granite Group LLC
Frederick H. Eppinger President and Chief Executive Officer The Hanover Insurance Group, Inc.
Neal F. Finnegan (A) Retired Chairman Citizens Bank of Massachusetts Former President and Chief Executive Officer UST Corporation
David J. Gallitano (N) Chairman and Chief Executive Officer WellCare Health Plans, Inc.
Wendell J. Knox (C) Retired President and Chief Executive Officer Abt Associates
Robert J. Murray (C) Retired Chairman New England Business Service, Inc.
Joseph R. Ramrath (A) Managing Director Colchester Partners LLC
Harriett “Tee” Taggart (A) Retired Partner, Senior Vice President Wellington Management LLC
(A) Audit Committee
(C) Compensation Committee
(N) Nominating and Corporate Governance Committee
Executive Leadership Team
Frederick H. Eppinger President and Chief Executive Officer
David B. Greenfield Executive Vice President and Chief Financial Officer
Bruce P. Bartell Chief Underwriting Officer of Chaucer
Mark R. Desrochers Senior Vice President and President, Personal Lines
J. Kendall Huber Executive Vice President, General Counsel and Assistant Secretary
Richard W. Lavey Senior Vice President and Chief Marketing and Distribution Officer
Andrew Robinson Executive Vice President Corporate Development and President, Specialty Lines
John C. Roche Executive Vice President and President, Business Insurance
Robert A. Stuchbery President, International Operations and Chief Executive Officer of Chaucer
Gregory D. Tranter Executive Vice President, Chief Information Officer and Chief Operations Officer
Mark J. Welzenbach Senior Vice President and Chief Claims Officer
Other Executive Officers
Ann K. Tripp Senior Vice President, Chief Investment Officer and President of Opus Investment Management, Inc.
14 | THE HANOVER INSURANCE GROUP 2013 ANNUAL REPORT

UNITED STATES SECURITIES AND EXCHANGE COMMISSION
Washington, DC 20549
FORM 10-KANNUAL REPORT PURSUANT TO SECTION 13 OR 15(d) OF THE SECURITIES EXCHANGEACT OF 1934
For the fiscal year ended December 31, 2013 or
TRANSITION REPORT PURSUANT TO SECTION 13 OR 15(d) OF THE SECURITIESEXCHANGE ACT OF 1934
For the transition period from: to
Commission file number: 1-13754
THE HANOVER INSURANCE GROUP, INC.(Exact name of registrant as specified in its charter)
Delaware 04-3263626(State or other jurisdiction of (I.R.S. Employerincorporation or organization) Identification No.)
440 Lincoln Street, Worcester, Massachusetts 01653(Address of principal executive offices) (Zip Code)
Registrant’s telephone number, including area code: (508) 855-1000 Securities registered pursuant to Section 12(b) of the Act:
Title of each class Name of each exchange on which registered
Common Stock, $.01 par value New York Stock Exchange7 5/8% Senior Debentures due 2025 New York Stock Exchange
6.35% Subordinated Debentures due 2053 New York Stock Exchange
Securities registered pursuant to Section 12(g) of the Act: NONE
Indicate by check mark if the registrant is a well-known seasoned issuer, as defined in Rule 405 of the Securities Act. Yes No
Indicate by check mark if the registrant is not required to file reports pursuant to Section 13 or Section 15(d) of the Act. Yes No
Indicate by check mark whether the registrant (1) has filed all reports required to be filed by Section 13 or 15(d) of the SecuritiesExchange Act of 1934 during the preceding 12 months (or for such shorter period that the registrant was required to file suchreports), and (2) has been subject to such filing requirements for the past 90 days. Yes No
Indicate by check mark whether the registrant has submitted electronically and posted on its corporate Website, if any, everyInteractive Data File required to be submitted and posted pursuant to Rule 405 of Regulation S-T during the preceding 12 months.Yes No
Indicate by check mark if disclosure of delinquent filers pursuant to Item 405 of Regulation S-K is not contained herein, and willnot be contained, to the best of the registrant’s knowledge, in definitive proxy or information statements incorporated by referencein Part III of this Form 10-K or any amendment to this Form 10-K.
Indicate by check mark whether the registrant is a large accelerated filer, an accelerated filer, a non-accelerated filer, or a smallerreporting company. See the definitions of “accelerated filer”, “large accelerated filer”, and “smaller reporting company” in Rule 12b-2of the Exchange Act.
Large accelerated filer Accelerated filer
Non-accelerated filer (Do not check if a smaller reporting company) Smaller Reporting Company
Indicate by check mark whether the registrant is a shell company (as defined in Rule 12b-2 of the Act). Yes No
Based on the closing sales price of June 28, 2013, the aggregate market value of the voting and non-voting common stock heldby non-affiliates of the registrant was $2,108,212,659.
The number of shares outstanding of the registrant’s common stock, $0.01 par value, was 43,882,063 shares as of February 20,2014.
DOCUMENTS INCORPORATED BY REFERENCE Portions of The Hanover Insurance Group, Inc.’s Proxy Statement relating to the 2014 Annual Meeting of Shareholders to be
held May 20, 2014 to be filed pursuant to Regulation 14A are incorporated by reference in Part III.
×
×
×
×
×
×
×

| THE HANOVER INSURANCE GROUP 2013 ANNUAL REPORT2
The Hanover Insurance Group, Inc.Annual Report on Form 10-KFor the Fiscal Year Ended December 31, 2013
TABLE OF CONTENTS
Item Description Page
PART I
1 Business. . . . . . . . . . . . . . . . . . . . . . . . . . . . . . . . . . . . . . . . . . . . . . . . . . . . . . . . . . . . . . . . . . . . . . . . . . . . . . 31A. Risk Factors . . . . . . . . . . . . . . . . . . . . . . . . . . . . . . . . . . . . . . . . . . . . . . . . . . . . . . . . . . . . . . . . . . . . . . . . . . 211B. Unresolved Staff Comments . . . . . . . . . . . . . . . . . . . . . . . . . . . . . . . . . . . . . . . . . . . . . . . . . . . . . . . . . . . . . 382 Properties . . . . . . . . . . . . . . . . . . . . . . . . . . . . . . . . . . . . . . . . . . . . . . . . . . . . . . . . . . . . . . . . . . . . . . . . . . . 383 Legal Proceedings . . . . . . . . . . . . . . . . . . . . . . . . . . . . . . . . . . . . . . . . . . . . . . . . . . . . . . . . . . . . . . . . . . . . . 384 Mine Safety Disclosures . . . . . . . . . . . . . . . . . . . . . . . . . . . . . . . . . . . . . . . . . . . . . . . . . . . . . . . . . . . . . . . . 38
PART II
5 Market for Registrant’s Common Equity, Related Stockholder Matters and Issuer Purchases of Equity Securities. . . . . . . . . . . . . . . . . . . . . . . . . . . . . . . . . . . . . . . . . . . . . . . . . . . . . 39
6 Selected Financial Data. . . . . . . . . . . . . . . . . . . . . . . . . . . . . . . . . . . . . . . . . . . . . . . . . . . . . . . . . . . . . . . . . 407 Management’s Discussion and Analysis of Financial Condition and Results of Operations . . . . . . . . . . . . . . 41
7A. Quantitative and Qualitative Disclosures About Market Risk . . . . . . . . . . . . . . . . . . . . . . . . . . . . . . . . . . . . 838 Financial Statements and Supplementary Data . . . . . . . . . . . . . . . . . . . . . . . . . . . . . . . . . . . . . . . . . . . . . . . 849 Changes in and Disagreements With Accountants on Accounting and Financial Disclosure. . . . . . . . . . . . 130
9A. Controls and Procedures . . . . . . . . . . . . . . . . . . . . . . . . . . . . . . . . . . . . . . . . . . . . . . . . . . . . . . . . . . . . . . . 1309B. Other Information . . . . . . . . . . . . . . . . . . . . . . . . . . . . . . . . . . . . . . . . . . . . . . . . . . . . . . . . . . . . . . . . . . . . 130
PART III
10 Directors, Executive Officers and Corporate Governance . . . . . . . . . . . . . . . . . . . . . . . . . . . . . . . . . . . . . . 13111 Executive Compensation . . . . . . . . . . . . . . . . . . . . . . . . . . . . . . . . . . . . . . . . . . . . . . . . . . . . . . . . . . . . . . . 13212 Security Ownership of Certain Beneficial Owners and Management and Related Stockholder Matters . . . 13313 Certain Relationships and Related Transactions, and Director Independence. . . . . . . . . . . . . . . . . . . . . . . 13314 Principal Accounting Fees and Services. . . . . . . . . . . . . . . . . . . . . . . . . . . . . . . . . . . . . . . . . . . . . . . . . . . . 133
PART IV
15 Exhibits, Financial Statement Schedules . . . . . . . . . . . . . . . . . . . . . . . . . . . . . . . . . . . . . . . . . . . . . . . . . . . 134Exhibits Index . . . . . . . . . . . . . . . . . . . . . . . . . . . . . . . . . . . . . . . . . . . . . . . . . . . . . . . . . . . . . . . . . . . . . . . 135Signatures . . . . . . . . . . . . . . . . . . . . . . . . . . . . . . . . . . . . . . . . . . . . . . . . . . . . . . . . . . . . . . . . . . . . . . . . . . 140

THE HANOVER INSURANCE GROUP 2013 ANNUAL REPORT | 3
Item 1 — Business
ORGANIZATION
The Hanover Insurance Group, Inc. (“THG”) is a holdingcompany organized as a Delaware corporation in 1995 andtraces its roots to as early as 1852, when the Hanover FireInsurance Company was founded. Our primary businessoperations are property and casualty insurance productsand services. We market our domestic products and servic-es through independent agents and brokers in the UnitedStates (“U.S.”) and conduct business internationallythrough a wholly-owned subsidiary, Chaucer Holdings plc(“Chaucer”), which operates through the Society andCorporation of Lloyd’s (“Lloyd’s”) and is domiciled in theUnited Kingdom (“U.K.”). Our consolidated financialstatements include the accounts of THG; The HanoverInsurance Company (“Hanover Insurance”) and CitizensInsurance Company of America (“Citizens”), which are ourprincipal U.S. domiciled property and casualty sub-sidiaries; Chaucer, which we acquired on July 1, 2011; andcertain other insurance and non-insurance subsidiaries.Our results of operations also include the results of ourdiscontinued operations, consisting primarily of our formerlife insurance businesses, our accident and health businessand prior to April 30, 2012, our third party administrationbusiness.
FINANCIAL INFORMATION ABOUT OPERATING SEGMENTS
We conduct our business operations through four operat-ing segments. These segments are Commercial Lines,Personal Lines, Chaucer and Other. We report interestexpense related to our corporate debt separately from theearnings of our operating segments.Information with respect to each of our segments is
included in “Results of Operations - Segments” inManagement’s Discussion and Analysis of FinancialCondition and Results of Operations and in Note 14 –“Segment Information” in the Notes to the ConsolidatedFinancial Statements included in Financial Statementsand Supplementary Data of this Form 10-K.Information with respect to geographic concentrations
is included in the “Description of Business by Segment” inPart 1 – Item 1 and in Note 14 – “Segment Information”in the Notes to the Consolidated Financial Statementsincluded in Financial Statements and Supplementary Dataof this Form 10-K.
DESCRIPTION OF BUSINESS BY SEGMENT
Following is a discussion of each of our operating segments.
GENERAL
We manage our operations principally through four oper-ating segments, including three in which we provideinsurance products and services: Commercial Lines,Personal Lines, and Chaucer. We underwrite commercialand personal property and casualty insurance throughHanover Insurance, Citizens and other THG subsidiaries,through an independent agent and broker network con-centrated in the Northeast, Midwest and Southeast U.S.We also continue to actively grow our Commercial Linespresence in the Western region of the U.S. Our Chaucersegment is a specialist insurance underwriting groupwhich operates through Lloyd’s and writes business inter-nationally. Included in our fourth operating segment,Other, are Opus Investment Management, Inc. (“Opus”),a wholly-owned subsidiary of THG, which provides invest-ment management services to our insurance and non-insurance companies, our institutions, pension funds andother organizations; earnings on holding company assets;and a run-off voluntary pools business.Our business strategy focuses on providing our agents
and customers stability and financial strength, while pru-dently growing and diversifying our product and geograph-ical business mix. We conduct our business with anemphasis on agency relationships and active agency man-agement, disciplined underwriting, pricing, quality claimhandling, and customer service. Annually, we write over $4billion in premiums, including over $3 billion domestical-ly. Based on direct U.S. premiums written, we rank amongthe top 25 property and casualty insurers in the UnitedStates.
RISKS
The industry’s profitability and cash flow can be, and his-torically has been, significantly affected by numerous factors, including price; competition; volatile and unpredictable developments such as extreme weather con-ditions, catastrophes and other disasters; legal and regula-tory developments affecting pricing, underwriting, policycoverage and other aspects of doing business, as well asinsurer and insureds’ liability; extra-contractual liability;size of jury awards; acts of terrorism; fluctuations in inter-est and currency rates or the value of investments; andother general economic conditions and trends, such asinflationary pressure or unemployment, that may affect theadequacy of reserves or the demand for insurance prod-ucts. Our investment portfolio and its future returns maybe further impacted by the capital markets and currenteconomic conditions, which could affect our liquidity, the
PART I

| THE HANOVER INSURANCE GROUP 2013 ANNUAL REPORT4
amount of realized losses and impairments that will be rec-ognized, credit default levels, our ability to hold suchinvestments until recovery and other factors. Additionally,the economic conditions in geographic locations where weconduct business, especially those locations where ourbusiness is concentrated, may affect the growth and prof-itability of our business. The regulatory environments inthose locations, including any pricing, underwriting orproduct controls, shared market mechanisms or mandato-ry pooling arrangements, and other conditions, such as ouragency relationships, affect the growth and profitability ofour business. In addition, our loss and loss adjustmentexpense (“LAE”) reserves are based on our estimates, prin-cipally involving actuarial projections, at a given time, ofwhat we expect the ultimate settlement and administrationof claims will cost based on facts and circumstances thenknown, predictions of future events, estimates of futuretrends in claims frequency and severity and judicial theo-ries of liability, costs of repairs and replacement, legislativeactivity and other factors. We expect to regularly reassessour estimate of loss reserves and LAE, both for current andpast years, and any resulting changes will affect our report-ed profitability and financial position.Reference is also made to “Risk Factors” in Part 1 – Item
1A of this Form 10-K.
LINES OF BUSINESS
We underwrite commercial and personal property andcasualty insurance coverage through our CommercialLines, Personal Lines and Chaucer operating segments.
Commercial LinesOur Commercial Lines segment generated $2.1 billion, or44.3%, of consolidated operating revenues and $2.0 bil-lion, or 44.1%, of net premiums written, for the year endedDecember 31, 2013.The following table provides net premiums written by
line of business for our Commercial Lines segment.
YEAR ENDED DECEMBER 31, 2013
(in millions, except ratios)Net Premiums % of
Written Total
Commercial multiple peril $ 651.7 32.5%Commercial automobile 304.7 15.2Workers’ compensation 229.6 11.4Other commercial lines:
AIX program business 253.0 12.6Inland marine 197.6 9.8Management and professional liability 116.0 5.8Surety 68.7 3.4Other 185.9 9.3
Total $2,007.2 100.0%
Our Commercial Lines product suite provides agentsand customers with products designed for small, middleand specialized markets.Commercial Lines coverages include:Commercial multiple peril coverage insures businesses
against third party general liability from accidents occur-ring on their premises or arising out of their operations,such as injuries sustained from products sold. It alsoinsures business property for damage, such as that causedby fire, wind, hail, water damage (which may excludeflood), theft and vandalism.
Commercial automobile coverage insures businessesagainst losses incurred from personal bodily injury, bodilyinjury to third parties, property damage to an insured’svehicle and property damage to other vehicles and property.
Workers’ compensation coverage insures employersagainst employee medical and indemnity claims resultingfrom injuries related to work. Workers’ compensation poli-cies are often written in conjunction with other commer-cial policies.
Other commercial lines is comprised of:• AIX program business provides coverage to under-servedmarkets where there are specialty coverage or risk man-agement needs, including commercial multiple peril,workers’ compensation, commercial automobile, gener-al liability and other commercial coverages;
• inland marine coverage insures businesses against phys-ical losses to property, such as contractor’s equipment,builders’ risk and goods in transit, and also covers jew-elers block, fine art and other valuables;
• management and professional liability coverage providesprotection for directors and officers of companies thatmay be sued in connection with their performance,errors and omissions protection to companies and indi-viduals against negligence or bad faith, as well as pro-tection for employment practices insurance and fidelityand crime.
• surety provides businesses with contract surety coveragein the event of performance or non-payment claims, andcommercial surety coverage related to fiduciary or regu-latory obligations; and
• other commercial lines coverages include umbrella,monoline general liability, specialty property, healthcareand miscellaneous commercial property.
Our strategy in Commercial Lines focuses on buildingdeep relationships with partner agents through differenti-ated product offerings, industry segmentation, and fran-chise value through limited distribution. We have made anumber of enhancements to our products and technologyplatforms that are intended to drive more total accountplacements in our small commercial and middle marketbusiness, while delivering enhanced margins in our spe-

THE HANOVER INSURANCE GROUP 2013 ANNUAL REPORT | 5
cialty businesses. This aligns with our focus of improvingand expanding our partnerships with a limited number ofagents.Our small commercial, middle market and specialty
businesses constitute approximately 32%, 33% and 35% ofour total Commercial Lines business, respectively. Smallcommercial offerings, which generally include premiumsof $50,000 or less, deliver value through product expertise,local presence, and ease of doing business. Middle marketaccounts require greater claim and underwriting expertise,as well as a focus on industry segments where we can deliv-er differentiation in the market and value to agents andcustomers. Small and middle market accounts comprise$1.3 billion of the Commercial Lines. Our strategy is tocontinue to grow these businesses over time, even as weseek to reduce property exposures in certain geographicareas and manage our mix of business in the short term.In our small commercial and middle market businesses,
we have developed several niche insurance programs,including for schools, human services organizations, suchas non-profit youth and community service organizations,and religious institutions. We have added additional seg-mentation to our core middle market commercial prod-ucts, including real estate, hospitality and wholesaledistributors and introduced products focused on manage-ment liability, specifically non-profit and private companydirectors and officers liability and employment practicesliability.Part of our strategy is to expand our specialty lines offer-
ings in order to provide our agents and policyholders witha broader product portfolio and to increase our marketpenetration. Net premiums written in our specialty linesaccount for approximately one-third of our CommercialLines net premiums written. As part of our strategy, wehave over time acquired various specialized businessesaimed at further diversifying and growing our specialtylines. We used these acquisitions as platforms to expandour product offerings and grow through our existingagency and broker distribution network.We believe our small commercial capabilities, distinc-
tiveness in the middle market, and continued developmentof specialty business provides us with a more diversifiedportfolio of products and enables us to deliver significantvalue to our agents and policyholders. We believe theseefforts will enable us to continue to improve the overallmix of our business and ultimately our underwriting prof-itability.
Personal LinesOur Personal Lines segment generated $1.5 billion, or32.4%, of consolidated operating revenues and $1.4 bil-lion, or 31.4%, of net premiums written, for the year endedDecember 31, 2013.
The following table provides net premiums written byline of business for our Personal Lines segment.
YEAR ENDED DECEMBER 31, 2013
(in millions, except ratios)Net Premiums % of
Written Total
Personal automobile $ 890.3 62.3%Homeowners 496.7 34.8Other 41.0 2.9
Total $1,428.0 100.0%
Personal Lines coverages include:Personal automobile coverage insures individuals against
losses incurred from personal bodily injury, bodily injury tothird parties, property damage to an insured’s vehicle, andproperty damage to other vehicles and other property.
Homeowners coverage insures individuals for losses totheir residences and personal property, such as thosecaused by fire, wind, hail, water damage (except for flood),theft and vandalism, and against third party liabilityclaims.
Other personal lines are comprised of personal inlandmarine (jewelry, art, etc.), umbrella, fire, personal water-craft, earthquake and other miscellaneous coverages.Our strategy in Personal Lines is to build account–ori-
ented business through our partner agencies, with a focuson greater geographic diversification. The market for ourPersonal Lines business continues to be very competitive,with continued pressure on agents from direct writers, aswell as from the increased usage of real time comparativerating tools and increasingly sophisticated rating and pric-ing tools. We maintain a focus on partnering with highquality, value added agencies that stress the importance ofconsultative selling and account rounding (the conversionof single policy customers to accounts with multiple poli-cies and/or additional coverages). We are focused on mak-ing investments that are intended to help us maintainprofitability, build a distinctive position in the market, andprovide us with profitable growth opportunities. We con-tinue to refine our products and to work closely with thesehigh potential agents to increase the percentage of busi-ness they place with us and to ensure that it is consistentwith our preferred mix of business. Additionally, we remainfocused on further diversifying our state mix beyond thehistorical core states of Michigan, Massachusetts, NewYork and New Jersey, and on reducing property exposuresin concentrated areas or where we have experienced per-sistent weather-related losses. We expect these efforts todecrease our risk concentrations and our dependency onthese four states, as well as to contribute to improved prof-itability over time.

| THE HANOVER INSURANCE GROUP 2013 ANNUAL REPORT6
ChaucerOur Chaucer segment generated $1.1 billion, or 23.1%, ofconsolidated operating revenues and $1.1 billion, or24.5%, of net premiums written, for the year endedDecember 31, 2013.The following table provides net premiums written by
line of business for our Chaucer segment.
YEAR ENDED DECEMBER 31, 2013
(in millions, except ratios)Net Premiums % of
Written Total
U.K. motor $ 300.5 26.9%Marine and aviation 277.1 24.8Property 191.9 17.2Energy 174.2 15.6Casualty and other 173.8 15.5
Total $1,117.5 100.0%
The Chaucer segment is comprised of internationalbusiness written through Lloyd’s, and includes:
Marine and aviation includes worldwide direct, faculta-tive and treaty business. The marine account providescover for hull, liability, war, terrorism, cargo, political risk,specie, fine art, satellite and ports and terminals. The avi-ation account insures airline hull and liability, general avi-ation, refuellers and aviation products.
Energy encompasses exploration and production, con-struction, downstream, operational power and renewables,insuring against physical damage, business interruption,control of well, seepage and pollution and liabilities.Energy also includes a nuclear account, which providescoverage across the nuclear fuel cycle from raw uraniumand nuclear fuel to the shipment and storage of waste, withthe majority of the exposure relating to power generationat nuclear power stations. In addition to providing cover-age for physical damage to civil nuclear power stations,nuclear also provides limited liability coverage.
Property includes treaty business, as well as direct andfacultative coverage for commercial and industrial risksagainst physical damage and business interruption. Thetreaty account covers cedants on a global basis, predomi-nantly on an “excess of loss” basis for both per risk andcatastrophe coverage, with a limited amount of proportion-al treaty and reinsurance assumed business.
U.K. motor provides primary insurance coverage to U.K.motor policyholders. Chaucer writes personal automobile,commercial and fleet polices, as well as specialist classes,including motorcycles, motor trade, and classic and spe-cialist vehicles. In addition, the U.K. motor line includes asmall amount of commercial property damage and liabilitypolices protecting small/medium-sized enterprises.
Casualty and other provides liability coverage for profes-sional and commercial risks on a direct and treaty basis,
crime and professional liability coverage for financial insti-tutions, medical malpractice and excess workers’ compen-sation. Other lines also encompass liabilities arising fromprevious participations on third party Lloyd’s syndicates,principally from Syndicate 4000, which provides liabilitycoverage to financial institutions.Chaucer is a specialist insurance underwriting group
that participates in the Lloyd’s market through the provi-sion of capital to support the underwriting activities of syndicates at Lloyd’s and the ownership of ChaucerSyndicates Limited (“CSL”), a managing agent. CSL man-ages two syndicates currently underwriting at Lloyd’s.Chaucer provides capital to Syndicate 1084, which
underwrites a range of property, marine, aviation, casualtyand energy products for commercial clients worldwide andmotor business for personal and commercial clients in theU.K.; and Syndicate 1176, which primarily provides pro-tection against physical damage and limited liability expo-sures from power generation at nuclear power stations.The energy line of business includes $19.9 million of netpremiums written from Syndicate 1176.We will have an economic interest in Syndicate 1084 of
100% for 2014, increasing from 98% in 2013. Our eco-nomic interest in Syndicate 1176 will also increase to 57%in 2014 from 56% in 2013.Previously, Chaucer managed and participated in
Syndicate 4000, which continues to have exposure topotential claims arising from difficulties within the finan-cial and professional liability markets, primarily during2007 and 2008. Chaucer sold its right to participate inSyndicate 4000 for the 2009 year of account and after.Chaucer has broad underwriting expertise to support its
diversified underwriting portfolio that, we believe, providesmany benefits, including capital diversification, volatilitymanagement and long-term protection of our underwritingcapabilities. We actively manage our portfolio, transferringunderwriting capital to increase premium volumes duringperiods of increased rates, while remaining selective orreducing our capital and premium volumes in those lineswhere rates are under pressure.Overall, we believe that the strength and depth of our
underwriting teams, together with the broad diversity ofour underwriting portfolio and our membership of theLloyd’s market, underpin our ability to manage both thescale and composition of our business. Moreover, thesestrengths, combined with our continued active manage-ment of our portfolio and the underwriting opportunitiesavailable, provide a sound basis for the profitable develop-ment of the Chaucer business.
OtherThe Other segment consists of: Opus, which providesinvestment advisory services to affiliates and also managesapproximately $1.4 billion of assets for unaffiliated institu-tions such as insurance companies, retirement plans and

THE HANOVER INSURANCE GROUP 2013 ANNUAL REPORT | 7
foundations; earnings on holding company assets; and vol-untary pools business, which is in run-off.
MARKETING AND DISTRIBUTION
We serve a variety of standard, specialty and niche mar-kets. Consistent with our objective to diversify our under-writing risks on a geographic and line of business basis, wecurrently have a distribution split of approximately one-third each of domestic standard Commercial Lines, inter-national and domestic specialty lines, and domesticstandard Personal Lines. Our Commercial and PersonalLines segments, comprising our principal domestic U.S.subsidiaries, distribute our products primarily through anindependent agent network. Our Chaucer segment, com-prising our international business, distributes primarilythrough insurance brokers in the Lloyd’s market, as well asthrough comparative website aggregators with respect tothe U.K. motor business.
Commercial and Personal LinesOur Commercial and Personal Lines agency distributionstrategy and field structure are designed to maintain astrong focus on local markets and the flexibility to respondto specific market conditions. During 2013, we wrote21.5% of our Commercial and Personal Lines business inMichigan and 9.5% in Massachusetts. Our structure is a
key factor in the establishment and maintenance of pro-ductive, long-term relationships with mid-sized, well-established independent agencies. We maintain 41 localoffices across 29 states. The majority of processing supportfor these locations is provided from Worcester,Massachusetts; Howell, Michigan; Salem, Virginia; andWindsor, Connecticut.Independent agents account for substantially all of the
sales of our Commercial and Personal Lines property andcasualty products. Agencies are appointed based on prof-itability, track record, financial stability, professionalism,and business strategy. Once appointed, we monitor theirperformance and, subject to legal and regulatory require-ments, may take actions as necessary to change thesebusiness relationships, such as discontinuing the authori-ty of the agent to underwrite certain products or revisingcommissions or bonus opportunities. We compensateagents primarily through base commissions and bonusplans that are tied to an agency’s written premium, growthand profitability.We are licensed to sell property and casualty insurance
in all fifty states in the U.S., as well as in the District ofColumbia. We actively market Commercial Lines policiesthroughout the U.S. in 36 states and Personal Lines poli-cies in 18 states.
The following table provides our top Commercial and Personal Lines geographical markets based on total net premi-ums written in the state in 2013.
YEAR ENDED DECEMBER 31, 2013
(in millions, except ratios)Total Commercial and
Commercial Lines Personal Lines Personal Lines
Net Premiums % of Net Premiums % of Net Premiums % of Written Total Written Total Written Total
Michigan $ 140.5 7.0% $ 596.4 41.8% $ 736.9 21.5%Massachusetts 145.4 7.2 181.2 12.7 326.6 9.5New York 220.5 11.0 95.3 6.7 315.8 9.2California 241.7 12.0 0.3 - 242.0 7.0New Jersey 111.6 5.6 73.4 5.1 185.0 5.4Illinois 90.3 4.5 68.8 4.8 159.1 4.6Texas 142.6 7.1 - - 142.6 4.2Connecticut 49.2 2.5 56.1 3.9 105.3 3.1Virginia 56.6 2.8 35.3 2.5 91.9 2.7Maine 57.6 2.9 33.2 2.3 90.8 2.6Georgia 53.0 2.6 32.3 2.3 85.3 2.5New Hampshire 39.4 2.0 36.6 2.6 76.0 2.2Florida 69.5 3.5 5.1 0.4 74.6 2.2Indiana 37.2 1.9 37.1 2.6 74.3 2.2Louisiana 32.4 1.6 35.3 2.5 67.7 2.0Tennessee 30.9 1.5 29.2 2.0 60.1 1.8Ohio 25.2 1.3 32.8 2.3 58.0 1.7Wisconsin 30.5 1.5 26.3 1.8 56.8 1.7Oklahoma 29.6 1.5 22.3 1.6 51.9 1.5Other 403.5 20.0 31.0 2.1 434.5 12.4
Total $2,007.2 100.0% $1,428.0 100.0% $3,435.2 100.0%

| THE HANOVER INSURANCE GROUP 2013 ANNUAL REPORT8
We manage our Commercial Lines portfolio, whichincludes our core and specialty businesses, with a focus ongrowth from the most profitable industry segments withinour underwriting expertise. Our core business is generallycomprised of several coordinated commercial lines of busi-ness, including small and middle market accounts, whichinclude segmented businesses and niches. CoreCommercial Lines direct premium written is comprised ofsmall and mid-sized accounts; such business is splitbetween small accounts generally having less than$50,000 in premium and middle market accounts, thosewith premium over $50,000, with most accounts havingless than $250,000 of premium. Additionally, we have mul-tiple specialty lines of business, which include programbusiness, inland marine, management and professional lia-bility, surety, specialty property and healthcare. TheCommercial Lines segment seeks to maintain strongagency relationships as a strategy to secure and retain ouragents’ best business. We monitor quality of business writ-ten through an ongoing quality review program, accounta-bility for which is shared at the local, regional andcorporate levels.We manage Personal Lines business with a focus on
acquiring and retaining quality accounts. Currently,approximately 75% of our policies in force are accountbusiness. Approximately 55% of our Personal Lines netpremium written is generated in the combined states ofMichigan and Massachusetts. In Michigan, based upondirect premiums written for 2012, we underwrite approxi-mately 8% of the state’s total market.Approximately 64% of our Michigan Personal Lines
business is in the personal automobile line and 34% is inthe homeowners line. Michigan business representsapproximately 43% of our total personal automobile netpremiums written and 41% our total homeowners net pre-miums written. In Michigan, we are a principal market formany of our appointed agencies with approximately $1.5million of total direct premiums written per agency in2013.Approximately 70% of our Massachusetts Personal
Lines business is in the personal automobile line and 26%is in the homeowners line. Massachusetts business repre-sents approximately 14% of our total personal automobilenet premiums written and approximately 10% of our totalhomeowners net premiums written.We sponsor local and national agent advisory councils
to gain the benefit of our agents’ insight and enhance ourrelationships. These councils provide feedback, input onthe development of products and services, guidance onmarketing efforts, support for our strategies, and assist usin enhancing our local market presence.
ChaucerChaucer underwrites business from two main sources:approximately 77% from Lloyd’s brokers and underwritingagencies, placed in the open market, and 23% from retailbrokers and comparative website aggregators for U.K.motor business. We primarily compensate brokers, under-writing agencies and aggregators through commission payments.In the Lloyd’s open market, brokers approach Chaucer
with individual insurance and reinsurance risk opportuni-ties for underwriter consideration. Brokers also gain accessto Chaucer’s products through selected underwriting agen-cies (also referred to as coverholders), to which Chaucerhas granted limited authority to make underwriting deci-sions on individual risks. In general, risks written throughunderwriting agencies are smaller in terms of both exposureand premium. Risks are placed in Lloyd’s through a sub-scription placement process whereby generally several syn-dicates take a share of a contract rather than one insurertaking 100% on a direct basis. This facilitates the spread-ing of large and complex risks across a number of insurers,while limiting the counterparty risk of each insurer.We have an international network of offices to improve
our access to high quality risks worldwide. This is expect-ed to improve the diversification of our underwriting andour ability to manage our portfolio. We have offices inSingapore; Copenhagen, Denmark; and Buenos Aires,Argentina to capitalize upon specific class of businessopportunities in these regions. We also have offices inHouston, Texas, to extend our energy network to NorthAmerica, and Oslo, Norway, to provide access to theNorwegian and regional North Sea energy sector.The following table provides a geographical breakdown
of Chaucer’s total gross premiums written (“GPW”) basedon the location of risk:
YEAR ENDED DECEMBER 31, 2013
% of Total GPW in Chaucer Segment
United Kingdom(1) 24.0%United States 14.9Americas, excluding the United States 11.1Asia Pacific 5.4Middle East and Africa 5.2Europe 3.1Worldwide and other(2) 36.3
Total 100.0%
(1) Primarily U.K. motor.
(2) “Worldwide and other” comprises insured risks that move across multiplegeographic areas due to their mobile nature or insured risks that are fixed inlocations that span more than one geographic area. These contracts include, forexample, marine and aviation hull, satellite and offshore energy exploration andproduction risks that can move across multiple geographic areas and assumed riskswhere the cedant insures risks in two or more geographic zones.

THE HANOVER INSURANCE GROUP 2013 ANNUAL REPORT | 9
OtherWith respect to our Other segment business, we marketour investment advisory services directly through Opus.
PRICING AND COMPETITION
The property and casualty industry is a very competitivemarket. Our competitors include national, international,regional and local companies that sell insurance throughvarious distribution channels, including independent agen-cies, captive agency forces, brokers and direct to con-sumers through the internet or otherwise. They alsoinclude mutual insurance companies, reciprocals andexchanges. In the Commercial and Personal Lines seg-ments, we market through independent agents and brokersand compete for business on the basis of product, price,agency and customer service, local relationships, ratings,and effective claims handling, among other things. Webelieve that an emphasis on maintaining strong agencyrelationships and a local presence in our markets, coupledwith investments in products, operating efficiency, tech-nology and effective claims handling, will enable us tocompete effectively. Our broad product offerings inCommercial Lines and total account strategy in PersonalLines are instrumental to our strategy to capitalize onthese relationships and improve profitability.We seek to achieve targeted combined ratios in each of
our product lines. Targets vary by product and geographyand change with market conditions. The targeted com-bined ratios reflect competitive market conditions, invest-ment yield expectations, our loss payout patterns, andtarget returns on equity. This strategy is intended to enableus to achieve measured growth and consistent profitability.For all major product lines, we employ pricing teams
which produce exposure and experience-based rating mod-els to support underwriting decisions. In addition, in theCommercial and Personal Lines segments, we seek to uti-lize our understanding of local markets to achieve superiorunderwriting results. We rely on market information pro-vided by our local agents and on the knowledge of staff inthe local branch offices. Since we maintain a strongregional focus and a significant market share in a numberof states, we can better apply our knowledge and experi-ence in making underwriting and rate setting decisions.Also, we seek to gather objective and verifiable informationat a policy level during the underwriting process, such asloss histories, past driving records and, where permitted,credit histories.
The Commercial and Personal Lines segments are notdependent on a single customer or even a few customers,for which the loss of any one or more would have anadverse effect upon the insurance operations for these segments.Although we conduct some business on a direct basis
through the Chaucer segment, we market the majority ofChaucer product offerings through insurance brokers inthe Lloyd’s specialty and the U.K. motor markets, whichprovide access to business from clients and coverholders.We are able to attract business through our recognizedcapability to serve as the lead underwriter in most classeswe write, particularly in classes where such lead ability issought by clients and recognized by following markets.This requires significant underwriting and claims handlingexpertise in very specialized lines of business. Our com-petitors include large international insurance companiesand other Lloyd’s managing underwriters. In the U.K.motor lines, our competitors include large U.K. personallines insurers. Broker relationships that are ten percent ormore of total Chaucer 2013 gross premiums written arewith Marsh & McLennan Companies (14%) and AonBenfield (14%).
CLAIMS MANAGEMENT
Claims management includes the receipt of initial lossnotifications, generation of appropriate responses to claimreports, loss appraisals, identification and handling of cov-erage issues, determination of whether further investiga-tion is required, retention of legal representation whereappropriate, establishment of case reserves, approval ofloss payments and notification to reinsurers. Part of ourstrategy focuses on efficient, timely, and fair claim settle-ments to meet customer service expectations and maintainvaluable independent agent relationships. Additionally,effective claims management is important to our businessas claim payments and related loss adjustment expensesare our single largest expenditures.
Commercial and Personal LinesWe utilize experienced claims adjusters, appraisers, med-ical specialists, managers and attorneys to manage ourclaims. Our U.S. property and casualty operations havefield claims adjusters located throughout the states andregions in which we do business. Claims field staff mem-bers work closely with the independent agents who boundthe policies under which coverage is claimed. Claims officeadjusting staff is supported by general adjusters for largeproperty and large casualty losses, by automobile and

| THE HANOVER INSURANCE GROUP 2013 ANNUAL REPORT10
heavy equipment damage appraisers for automobile mate-rial damage losses, and by medical specialists whose prin-cipal concentration is on workers’ compensation andautomobile injury cases. Additionally, the claims offices aresupported by staff attorneys, both in the home office andin regional locations, who specialize in litigation defenseand claim settlements. We have a catastrophe responseteam to assist policyholders impacted by severe weatherevents. This team mobilizes quickly to impacted regions,often in advance for a large tracked storm, to support ourlocal claims adjusters and facilitate a timely response toresulting claims. We also maintain a special unit thatinvestigates suspected insurance fraud and abuse. We uti-lize claims processing technology which allows most of thesmaller and more routine Personal Lines claims to beprocessed at centralized locations.
ChaucerFor international risks, the Chaucer claims team generallyis responsible for establishing case reserves, loss and LAEcost management, exposure mitigation and litigation man-agement. Chaucer has engaged a third party administratorto handle aviation claims and authorizes selected agenciesto manage claims under risks which they have bound onChaucer’s behalf.For claims under our direct claims team management,
where Chaucer is the lead syndicate or designated claimsmanager, our appointed claims adjusters work with thebroker representing the insured. This may involve appoint-ing attorneys, loss adjusters or other third party experts.Where Chaucer is not the lead underwriter or designatedclaims manager, the lead underwriter and designatedclaims manager together establish case reserves in con-junction with professional third party adjusters, and thenadvise all other syndicates participating on the risk of theloss reserve requirements. In such cases, the Chaucerclaims team review material claims and developments.Chaucer also engages automobile body and repair shops toassist in managing claims for its U.K. motor business.
CATASTROPHES
We are subject to claims arising out of catastrophes, whichhistorically have had a significant impact on our results ofoperations and financial condition. Coverage for suchevents is a core part of our business and we expect to expe-rience catastrophe losses in the future, which could have amaterial adverse impact on us. Catastrophes can be causedby various events, including snow, ice storm, hurricane,earthquake, tornado, wind, hail, flood, drought, terrorism,fire, explosion, or other extraordinary events. The incidenceand severity of catastrophes are inherently unpredictable.
Commercial and Personal LinesWe endeavor to manage our catastrophe risks throughunderwriting procedures, including the use of deductiblesand specific exclusions for floods and earthquakes, subjectto regulatory restrictions, and through geographic exposuremanagement and reinsurance. The catastrophe reinsur-ance program is structured to protect us on a per-occur-rence basis. We monitor geographic location and coverageconcentrations in order to manage corporate exposure tocatastrophic events. Although catastrophes can cause loss-es in a variety of property and casualty lines, commercialmultiple peril and homeowners property coverages have, inthe past, generated the majority of catastrophe-relatedclaims.
ChaucerIndividual commercial and industrial risks within our prop-erty, marine and aviation, and energy lines include protec-tion against natural or man-made catastrophes worldwide.We accept these risks on direct, facultative and proportion-al and excess of loss treaty bases. Such risks are managedthrough limiting the proportion of any individual risk orclass of risk we assume, managing geographic concentra-tion and through the purchase of reinsurance.We purchase reinsurance to limit our exposure to indi-
vidual risks and catastrophic events. This includes faculta-tive reinsurance, to limit the exposure on a specified risk;specific excess and proportional treaty, to limit exposure toindividual contracts or risks within specified classes ofbusiness; and catastrophe excess of loss reinsurance, tolimit exposure to any one event that might affect morethan one individual contract.The level of reinsurance that Chaucer purchases is
dependent on a number of factors, including our under-writing risk appetite for catastrophe risk, the specific risksinherent in each line or class of business risk written andthe pricing, coverage and terms and conditions availablefrom the reinsurance market.
TERRORISM
As a result of the tragic events of September 11, 2001, theinsurance industry has had heightened concern about thepotential for losses caused by terrorist acts. These lossesmay encompass people, property and business operationscovered under workers’ compensation, commercial multi-ple peril and other Commercial Lines policies. In certaincases, we are not able to exclude coverage for these losses,either because of regulatory requirements or competitivepressures. We continually evaluate the potential effect of

THE HANOVER INSURANCE GROUP 2013 ANNUAL REPORT | 11
these low frequency, but potentially high severity events inour overall pricing and underwriting plans, especially forpolicies written in major metropolitan areas. Private sector catastrophe reinsurance is limited and
generally unavailable for losses attributed to acts of terror-ism, particularly those involving nuclear, biological, chem-ical and/or radiological events. As a result, the industry’sprimary reinsurance protection against large-scale terroristattacks in the U.S. is provided through a Federal programthat provides compensation for insured losses resultingfrom acts of terrorism. Additionally, certain terrorism-relat-ed risks embedded in our Commercial and Personal Linesare covered under the existing Catastrophe, Property perRisk and Casualty Excess of Loss corporate reinsurancetreaties (see “Reinsurance” for additional information). The Terrorism Risk Insurance Act of 2002 established
the Terrorism Risk Insurance Program (the “U.S.Program”). Coverage under the U.S. Program applies toworkers’ compensation, commercial multiple peril and cer-tain other Commercial Lines policies for U.S. direct writ-ten policies. The Terrorism Risk Insurance ProgramReauthorization Act of 2007 (“TRIPRA”) extended theU.S. Program through December 31, 2014. All commer-cial property and casualty insurers licensed in the U.S. par-ticipate in the program. Under the program, a participatingissuer, in exchange for making terrorism insurance avail-able, is entitled to be reimbursed by the FederalGovernment for 85% of subject losses, after an insurerdeductible, subject to an annual industry-wide cap of $100billion. The U.S. Program does not cover losses in surety,Personal Lines or certain other lines of insurance. Lossescaused by terrorist acts are not excluded from homeownersor personal automobile policies. Efforts are underway to extend the U.S. Program
beyond 2014, although there can be no assurance thatsuch legislation will pass or be similar to the existing U.S.Program. Accordingly, there is additional uncertaintyregarding our exposure with respect to terrorism coverageafter December 31, 2014, and this uncertainty extends toany policies issued or renewed in 2014, since such policyterms will extend into the 2015 calendar year. As an admitted carrier, we are regulated by state laws
that specifically prohibit the industry’s ability to excludeterrorism losses from workers’ compensation coverage inaddition to requiring the industry to offer terrorism cover-age for virtually all commercial property and casualty prod-ucts. The expiration of the U.S. Program has promptedconsideration by the industry of “conditional renewal pro-
visions”. Such provisions would automatically exclude loss-es caused by terrorism if the U.S. Program is not extend-ed. At this time, we have elected not to take this approach,consistent with most of the industry, because of our expec-tation that the U.S. Program will be extended. We contin-ue to review our approach to this matter as we monitor theprogress of pending legislation and other market consider-ations. See “Risk Factors” for additional information. As required by the current U.S. Program, we offer poli-
cyholders in specific lines of insurance the option to electterrorism coverage. In order for a loss to be covered underthe U.S. Program, the loss must meet aggregate industryloss minimums and must be the result of an act of terror-ism as certified by the Secretary of the Treasury in concur-rence with the Secretary of State and the U.S. AttorneyGeneral. Losses from acts which do not qualify or are notso certified will not receive the benefit of the U.S. Programand in fact, may be deemed covered losses whether or notterrorism coverage was purchased. The current U.S.Program requires insurance carriers to retain 15% of anyclaims from a certified terrorist event in excess of the fed-erally mandated deductible. The deductible represents20% of direct earned premium for the covered lines ofbusiness of the prior year. In 2013, our deductible was$322.7 million, which represents 21.2% of year-end 2012statutory policyholder surplus of our U.S. domestic insur-ers, and is estimated to be $350.4 million in 2014, repre-senting 19.1% of 2013 year-end statutory policyholdersurplus. Given the unpredictable nature of the frequency and
severity of terrorism losses, future losses from acts of ter-rorism could be material to our operating results, financialposition, and/or liquidity. We attempt to manage our expo-sures on an individual line of business basis and in theaggregate by one-half square mile grids. Chaucer’s direct written U.S. policies are also covered
under the provisions of TRIPRA. A limited portion ofChaucer’s business outside of the U.S. is exposed to terror-ism with respect to certain commercial property classesthat are written on a standalone basis. We manage thisexposure through policy limits, monitoring of risk aggrega-tion and reinsurance. Generally, terrorism coverage isexcluded from most commercial property classes and cov-erages that Chaucer writes. For our nuclear energy busi-ness, most of our liability coverage does not exclude lossesresulting from acts of terrorism, although such policies aregenerally subject to a sub-limit of 50% of full policy limits.

| THE HANOVER INSURANCE GROUP 2013 ANNUAL REPORT12
REGULATION
Commercial and Personal LinesOur U.S. property and casualty insurance subsidiaries aresubject to extensive regulation in the various states inwhich they transact business and are supervised by theindividual state insurance departments. Numerous aspectsof our business are subject to regulation, including premi-um rates, mandatory covered risks, limitations on the abil-ity to non-renew or reject business, prohibited exclusions,licensing of agents, investments, restrictions on the size ofrisks that may be insured under a single policy, reservesand provisions for unearned premiums, losses and otherobligations, deposits of securities for the benefit of policy-holders, investments and capital, policy forms and cover-ages, advertising, and other conduct, including restrictionson the use of credit information and other factors inunderwriting, as well as other underwriting and claimspractices. States also regulate various aspects of the con-tractual relationships between insurers and independentagents.Such laws, rules and regulations are usually overseen
and enforced by the various state insurance departments,as well as through private rights of action and increasingly,by state attorneys general. Such regulations or enforce-ment actions are often responsive to current consumer andpolitical sensitivities such as automobile and homeownersinsurance rates and coverage forms, or which may ariseafter a major event such as Superstorm Sandy. Such rulesand regulations may result in rate suppression, and limitour ability to manage our exposure to unprofitable orvolatile risks or other adverse consequences. The federalgovernment also may regulate aspects of our businessessuch as the use of insurance (credit) scores in underwrit-ing and the protection of confidential information.In addition, as a condition to writing business in certain
states, insurers are required to participate in various poolsor risk sharing mechanisms or to accept certain classes ofrisk, regardless of whether such risks meet its underwritingrequirements for voluntary business. Some states also limitor impose restrictions on the ability of an insurer to with-draw from certain classes of business. For example,Massachusetts, New Jersey, New York, and California eachimpose material restrictions on a company’s ability tomaterially reduce its exposures or to withdraw from certainlines of business in their respective states. The state insur-ance departments can impose significant charges on aninsurer in connection with a market withdrawal or refuseto approve withdrawal plans on the grounds that they couldlead to market disruption. Laws and regulations that limitcancellation and non-renewal of policies or that subjectwithdrawal plans to prior approval requirements may sig-nificantly restrict our ability to exit unprofitable markets.
Over the past several years, other state-sponsored insur-ers, reinsurers or involuntary pools have increased, partic-ularly those states which have Atlantic or Gulf Coast stormexposures. As a result, the potential assessment exposureof insurers doing business in such states and the attendantcollection risks have increased. Such actions and relatedregulatory restrictions may limit our ability to reduce ourpotential exposure to hurricane-related losses.The insurance laws of many states subject property and
casualty insurers doing business in those states to statuto-ry property and casualty guaranty fund assessments. Thepurpose of a guaranty fund is to protect policyholders byrequiring that solvent property and casualty insurers payinsurance claims of insolvent insurers. These guarantyassociations generally pay these claims by assessing solventinsurers proportionately based on the insurer’s share ofvoluntary premiums written in the state. While most guar-anty associations provide for recovery of assessmentsthrough subsequent rate increases, surcharges or premiumtax credits, there is no assurance that insurers will ulti-mately recover these assessments, which could be materi-al, particularly following a large catastrophe or in marketswhich become disrupted.We are subject to periodic financial and market conduct
examinations conducted by state insurance departments.We are also required to file annual and other reports withstate insurance departments relating to the financial con-dition of our insurance subsidiaries and other matters.From time to time, proposals have been made to estab-
lish a federal based insurance regulatory system and toallow insurers to elect either federal or state-based regula-tion (“optional federal chartering”). In light of the recentchallenging economic environment, the focus on increasedregulatory controls and the creation of a Federal InsuranceOffice, there has been renewed interest in such proposals.
ChaucerChaucer is regulated by the Prudential RegulationAuthority (“PRA”) and the Financial Conduct Authority(“FCA”), which replaced the Financial Services Authorityin April 2013, who together have responsibility for thefinancial services industry, including insurers, insuranceintermediaries and Lloyd’s in the U.K, and is supervised bythe Council of Lloyd’s, which is the franchisor for allLloyd’s operations.The PRA (which is part of The Bank of England) and
FCA are given statutory powers by the Financial ServicesAct of 2012. The PRA is responsible for the prudentialsupervision of, among other financial institutions, Lloyd’sinsurers, with a particular focus on financial stability. TheFCA focuses on conduct of business issues, with a partic-ular focus on consumer protection and market integrity.

THE HANOVER INSURANCE GROUP 2013 ANNUAL REPORT | 13
The PRA, FCA and Council of Lloyd’s have commonobjectives in ensuring the appropriate regulation of theLloyd’s market and, to minimize duplication, the PRA andFCA have arrangements with Lloyd’s for co-operation onsupervision and enforcement. Lloyd’s, which is regulatedby both the PRA and FCA, has responsibility under theLloyd’s Act 1982 (“the Lloyd’s Act”) for the implementationof certain PRA and FCA prescribed rules relating to theoperation of the Lloyd’s market. Lloyd’s prescribes, inrespect of its managing agents and corporate members,certain minimum standards relating to their managementand control, solvency and various other requirements. ThePRA and FCA directly monitor the compliance of Lloyd’smanaging agents with the systems and controls that Lloyd’sprescribes.The Council of Lloyd’s has wide discretionary powers to
regulate Lloyd’s underwriting. For example, it may changethe basis of allocation for syndicate expenses or the capitalrequirements for syndicate participations. Exercising anyof these powers might affect the return on an investmentof the corporate member in a given underwriting year. Inaddition, the annual business plans of each syndicate aresubject to the review and approval of the Lloyd’s FranchiseBoard, which is responsible for business planning andmonitoring for all syndicates.We participate in the Lloyd’s market through our own-
ership of Chaucer Syndicates Limited, which we refer to asCSL, a managing agent with responsibility for the manage-ment of Syndicates 1084 and 1176, for which we providecapital to support their underwriting activities. Our mem-bership in Lloyd’s requires us to comply with its bylaws andregulations, the Lloyd’s Act and the applicable provisionsof the Financial Services and Markets Act. These includethe requirement to provide capital (referred to as “Funds atLloyd’s”) in the form of cash, securities or letters of creditin an amount agreed with by Lloyd’s under the capital set-ting regime of the PRA. The completion of an annual cap-ital adequacy exercise enables each corporate member tocalculate the capital required. These requirements allowLloyd’s to evaluate whether each corporate member hassufficient assets to meet its underwriting liabilities plus arequired solvency margin.If a corporate member of Lloyd’s is unable to meets its
policyholder obligations, such obligations may be payableby the Lloyd’s Central Fund, which acts similar to a stateguaranty fund in the U.S. If Lloyd’s determines that theCentral Fund needs to be increased, it has the power toassess premium levies on all current Lloyd’s members. TheCouncil of Lloyd’s has discretion to call or assess up to 3%of a member’s underwriting capacity in 2014 as a CentralFund contribution.
Solvency II
In 2009, the European Union (“E.U.”) adopted a directivecovering capital requirements, risk management and regu-latory reporting for insurance organizations. The directive,known as Solvency II, imposes economic risk-based sol-vency requirements across all E.U. member states thatcomprise three pillars. First, there are quantitative capitalrequirements, based on a valuation of the entire balancesheet of an insurance organization. Second, Solvency IIrequires insurance organizations to undertake a qualitativeregulatory review, including governance, internal controls,enterprise risk management and the supervisory reviewprocess. Third, to enhance market discipline, insuranceorganizations must report their financial conditions to reg-ulators. Final E.U. approval of Solvency II is currently duein the first half of 2014, with an anticipated commence-ment date for the new regulatory regime of January 1,2016. Chaucer continues to work to ensure compliancewith the requirements in accordance with the timetable setout by Lloyd’s.
Other
In addition to the U.K. and European regulations, theChaucer segment is subject to regulation in the U.Sthrough the Lloyd’s market. The Lloyd’s market has licens-es to engage in insurance business in Illinois, Kentuckyand the U.S. Virgin Islands and operates as an eligibleexcess and surplus lines insurer in all other states and ter-ritories. Lloyd’s is also an accredited reinsurer in all statesand territories. Lloyd’s maintains various trust funds in thestate of New York to protect its U.S. business and is sub-ject to regulation by the New York Insurance Department,which acts as the domiciliary department for Lloyd’s U.S.trust funds. There are also deposit trust funds in otherU.S. states to support Lloyd’s excess and surplus linesinsurance and reinsurance business.See also to Note 18 — “Commitments and
Contingencies” in the Notes to Consolidated FinancialStatements included in Financial Statements andSupplementary Data of this Form 10-K.
INVOLUNTARY RESIDUAL MARKETS
As a condition of our license to write business in variousdomestic states and international jurisdictions, we arerequired to participate in mandatory property and casualtyresidual market mechanisms which provide various insur-ance coverages where such coverage may not otherwise beavailable at rates deemed reasonable. Such mechanismsprovide coverage primarily for personal and commercialproperty, personal and commercial automobile, and work-ers’ compensation, and include assigned risk plans, rein-surance facilities and involuntary pools, joint underwritingassociations, fair access to insurance requirements (“FAIR”)plans, and commercial automobile insurance plans.

| THE HANOVER INSURANCE GROUP 2013 ANNUAL REPORT14
For example, since most states compel the purchase ofa minimal level of automobile liability insurance, stateshave developed shared market mechanisms to provide therequired coverages and in many cases, optional coverages,to those drivers who, because of their driving records orother factors, cannot find insurers who will insure themvoluntarily. Also, FAIR plans and other similar propertyinsurance shared market mechanisms increase the avail-ability of property insurance in circumstances wherehomeowners are unable to obtain insurance at ratesdeemed reasonable, such as in coastal areas or in areassubject to other hazards. Licensed insurers writing busi-ness in such states are often required to pay assessmentsto cover reserve deficiencies generated by such plans.With respect to FAIR plans and other similar property
insurance shared market mechanisms that have significantexposures, it is difficult to accurately estimate our poten-tial financial exposure for future events. Assessments fol-lowing a large coastal event, particularly affectingMassachusetts, Florida, New York or New Jersey, could bematerial to our results of operations. Our participation insuch shared markets or pooling mechanisms is generallyproportional to our direct writings for the type of coveragewritten by the specific pooling mechanism in the applica-ble state or other jurisdiction. For example, we are subjectto mandatory participation in the Michigan AssignedClaims (“MAC”) facility. MAC is an assigned claim plancovering people injured in uninsured motor vehicle acci-dents. Our participation in the MAC facility is based onour share of personal and commercial automobile directwritten premium in the state and resulted in underwritinglosses of $15.0 million in 2013 and 2012 and $11.1 mil-lion in 2011. Additionally, Chaucer’s U.K. motor line issubject to similar mandatory assessments from the U.K.Motor Insurance Bureau (“MIB”) and these assessmentswere $4.3 million in 2013 and not significant to our resultsof operations in 2012 and 2011. Included in other expens-es in 2011 was a $4.3 million charge related to a write-offof our equity interest in the accumulated surplus of theNorth Carolina Beach Plan (“NCBP”), a mandatory rein-surance facility, as a result of state legislation intended toreform the funding mechanism of the NCBP. There wereno other mandatory residual market mechanisms that weresignificant to our 2013, 2012 or 2011 results of operations.
RESERVE FOR UNPAID LOSSES AND LOSS ADJUSTMENT EXPENSES
Reference is made to “Results of Operations - Segments –Reserve for Losses and Loss Adjustment Expenses” ofManagement’s Discussion and Analysis of FinancialCondition and Results of Operations of this Form 10-K.
The following table reconciles reserves determined inaccordance with accounting principles and practices pre-scribed or permitted by U.S. insurance statutory authori-ties (“U.S. Statutory”) and the U.K. financial servicesregulatory authority (“U.K. Statutory”) for our domesticand Chaucer operations, respectively, to reserves deter-mined in accordance with generally accepted accountingprinciples in the United States of America (“U.S. GAAP”).The primary difference between the U.S. Statutoryreserves and our U.S. GAAP reserves is the requirement,on a U.S. GAAP basis, to present reinsurance recoverablesas an asset, whereas U.S. Statutory guidance provides thatreserves are reflected net of the corresponding reinsurancerecoverables. There are no significant differences betweenU.K. Statutory reserves and our U.S. GAAP reserves. Wedo not use discounting techniques in establishing U.S.GAAP reserves for losses and LAE, nor have we parti -cipated in any loss portfolio transfers or other similartransactions.
DECEMBER 31 2013 2012 2011
(in millions)
U.S. Statutory reserve for losses and LAE $2,725.0 $2,646.7 $2,350.7
U.K. Statutory reserve for losses and LAE 2,373.9 2,397.7 2,319.8
Total Statutory reserve for losses and LAE 5,098.9 5,044.4 4,670.5U.S. GAAP adjustments:Reinsurance recoverables on
unpaid losses of ourU.S. insurance subsidiaries 1,242.2 1,265.0 1,198.5
Reserves for discontinued operations (121.3) (126.8) (124.6)
Other 11.7 14.4 15.9
U.S. GAAP reserve for losses and LAE $6,231.5 $6,197.0 $5,760.3
Reserves for discontinued operations of our U.S. insur-ance subsidiaries are included in liabilities of discontinuedoperations for U.S. GAAP and loss and loss adjustmentexpenses for Statutory reporting.
ANALYSIS OF LOSS AND LOSS ADJUSTMENT EXPENSERESERVE DEVELOPMENT
The following table sets forth the development of our U.S.GAAP reserves (net of reinsurance recoverables) forunpaid losses and LAE from 2003 through 2013. Thistable includes our Chaucer segment U.S. GAAP reservesbeginning December 31, 2011. Conditions and trends thathave affected reserve development in the past will not nec-essarily recur in the future. It is not appropriate to extrap-olate future favorable or unfavorable development basedon amounts experienced in prior periods.
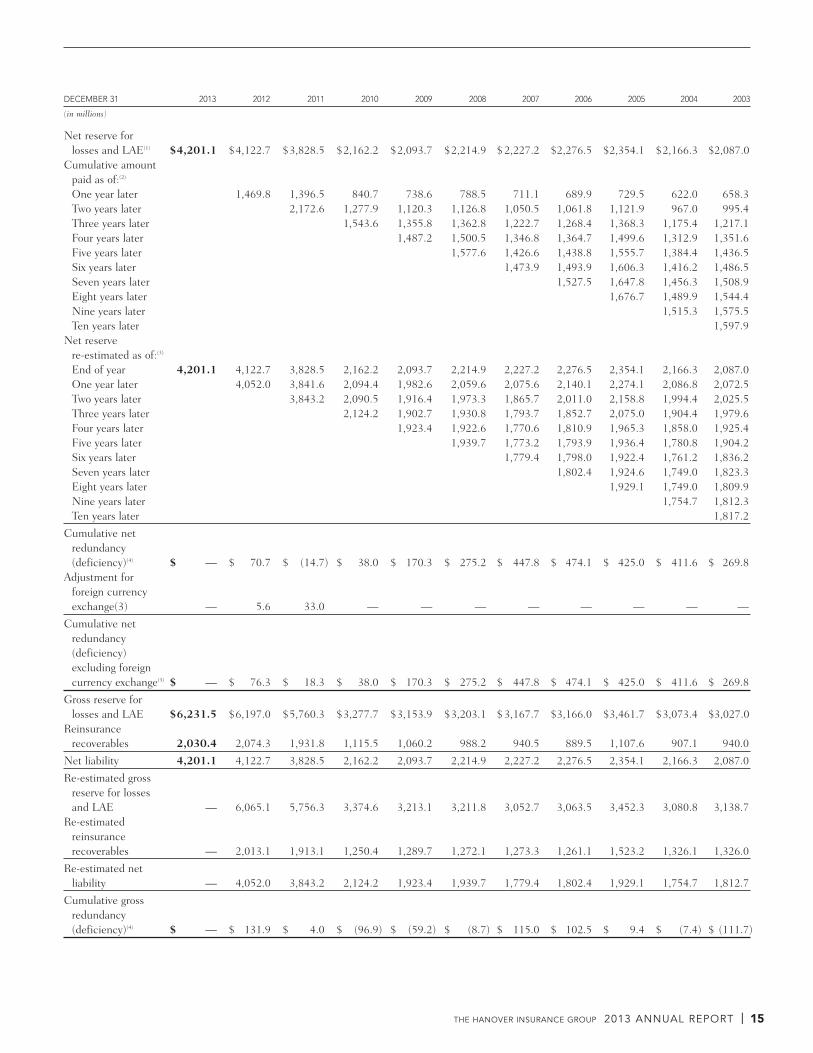
THE HANOVER INSURANCE GROUP 2013 ANNUAL REPORT | 15
DECEMBER 31 2013 2012 2011 2010 2009 2008 2007 2006 2005 2004 2003
(in millions)
Net reserve for losses and LAE(1) $4,201.1 $4,122.7 $3,828.5 $2,162.2 $2,093.7 $2,214.9 $2,227.2 $2,276.5 $2,354.1 $2,166.3 $2,087.0
Cumulative amount paid as of:(2)
One year later 1,469.8 1,396.5 840.7 738.6 788.5 711.1 689.9 729.5 622.0 658.3Two years later 2,172.6 1,277.9 1,120.3 1,126.8 1,050.5 1,061.8 1,121.9 967.0 995.4Three years later 1,543.6 1,355.8 1,362.8 1,222.7 1,268.4 1,368.3 1,175.4 1,217.1Four years later 1,487.2 1,500.5 1,346.8 1,364.7 1,499.6 1,312.9 1,351.6Five years later 1,577.6 1,426.6 1,438.8 1,555.7 1,384.4 1,436.5Six years later 1,473.9 1,493.9 1,606.3 1,416.2 1,486.5Seven years later 1,527.5 1,647.8 1,456.3 1,508.9Eight years later 1,676.7 1,489.9 1,544.4Nine years later 1,515.3 1,575.5Ten years later 1,597.9
Net reserve re-estimated as of:(3)
End of year 4,201.1 4,122.7 3,828.5 2,162.2 2,093.7 2,214.9 2,227.2 2,276.5 2,354.1 2,166.3 2,087.0One year later 4,052.0 3,841.6 2,094.4 1,982.6 2,059.6 2,075.6 2,140.1 2,274.1 2,086.8 2,072.5Two years later 3,843.2 2,090.5 1,916.4 1,973.3 1,865.7 2,011.0 2,158.8 1,994.4 2,025.5Three years later 2,124.2 1,902.7 1,930.8 1,793.7 1,852.7 2,075.0 1,904.4 1,979.6Four years later 1,923.4 1,922.6 1,770.6 1,810.9 1,965.3 1,858.0 1,925.4Five years later 1,939.7 1,773.2 1,793.9 1,936.4 1,780.8 1,904.2Six years later 1,779.4 1,798.0 1,922.4 1,761.2 1,836.2Seven years later 1,802.4 1,924.6 1,749.0 1,823.3Eight years later 1,929.1 1,749.0 1,809.9Nine years later 1,754.7 1,812.3Ten years later 1,817.2
Cumulative net redundancy(deficiency)(4) $ — $ 70.7 $ (14.7) $ 38.0 $ 170.3 $ 275.2 $ 447.8 $ 474.1 $ 425.0 $ 411.6 $ 269.8
Adjustment for foreign currencyexchange(3) — 5.6 33.0 — — — — — — — —
Cumulative net redundancy(deficiency) excluding foreign currency exchange(3) $ — $ 76.3 $ 18.3 $ 38.0 $ 170.3 $ 275.2 $ 447.8 $ 474.1 $ 425.0 $ 411.6 $ 269.8
Gross reserve for losses and LAE $6,231.5 $6,197.0 $5,760.3 $3,277.7 $3,153.9 $3,203.1 $3,167.7 $3,166.0 $3,461.7 $3,073.4 $3,027.0
Reinsurance recoverables 2,030.4 2,074.3 1,931.8 1,115.5 1,060.2 988.2 940.5 889.5 1,107.6 907.1 940.0
Net liability 4,201.1 4,122.7 3,828.5 2,162.2 2,093.7 2,214.9 2,227.2 2,276.5 2,354.1 2,166.3 2,087.0
Re-estimated gross reserve for losses and LAE — 6,065.1 5,756.3 3,374.6 3,213.1 3,211.8 3,052.7 3,063.5 3,452.3 3,080.8 3,138.7
Re-estimated reinsurancerecoverables — 2,013.1 1,913.1 1,250.4 1,289.7 1,272.1 1,273.3 1,261.1 1,523.2 1,326.1 1,326.0
Re-estimated net liability — 4,052.0 3,843.2 2,124.2 1,923.4 1,939.7 1,779.4 1,802.4 1,929.1 1,754.7 1,812.7
Cumulative gross redundancy(deficiency)(4) $ — $ 131.9 $ 4.0 $ (96.9) $ (59.2) $ (8.7) $ 115.0 $ 102.5 $ 9.4 $ (7.4) $ (111.7)

| THE HANOVER INSURANCE GROUP 2013 ANNUAL REPORT16
(1) Sets forth the estimated net liability for unpaid losses and LAE recorded at the balance sheet date at the end of each of the indicated years; represents the estimated amount ofnet losses and LAE for claims arising in the current and all prior years that are unpaid at the balance sheet date, including incurred but not reported (“IBNR”) reserves.
(2) Cumulative loss and LAE payments made in succeeding years for losses incurred prior to the balance sheet date. Chaucer claims payments denominated in foreign currenciesare converted to U.S. dollars at the average foreign exchange rates during the year of payment and are not revalued at the current year foreign exchange rates. Because claimspaid in prior years are not revalued at the current year’s foreign exchange rates, the difference between the cumulative claims paid at the end of any given year and theimmediately previous year represents the claims paid during the year.
(3) Re-estimated amount of the previously recorded liability based on experience for each succeeding year; increased or decreased as payments are made and more informationbecomes known about the severity of remaining unpaid claims. Chaucer unpaid losses and LAE denominated in foreign currencies are re-estimated using the foreign exchangerates in effect as of December 31, 2013 and the resulting cumulative foreign exchange translation effect is shown as an adjustment to the cumulative net redundancy(deficiency).
(4) Cumulative redundancy or deficiency at December 31, 2013 of the net and gross reserve amounts shown in the corresponding column. A redundancy in reserves means thereserves established in prior years exceeded actual losses and LAE or were re-evaluated at less than the original reserved amount. A deficiency in reserves means the reservesestablished in prior years were less than actual losses and LAE or were re-evaluated at more than the original reserved amount.
REINSURANCE
Reinsurance Program OverviewWe maintain ceded reinsurance programs designed to pro-tect against large or unusual loss and LAE activity. We uti-lize a variety of reinsurance agreements, which areintended to control our individual policy and aggregateexposure to large property and casualty losses, stabilizeearnings and protect capital resources. These programsinclude facultative reinsurance (to limit exposure on aspecified policy); specific excess and proportional treatyreinsurance (to limit exposure on individual policies orrisks within specified classes of business); and catastropheexcess of loss reinsurance (to limit exposure to any oneevent that might impact more than one individual con-tract). Catastrophe reinsurance protects us, as the cedinginsurer, from significant losses arising from a single eventsuch as snow, ice storm, hurricane, earthquake, tornado,wind, hail, terrorism, fire, explosion or other extraordinaryevents. We determine the appropriate amount of reinsur-ance based upon our evaluation of the risks insured, expo-sure analyses prepared by consultants, our risk appetiteand on market conditions, including the availability andpricing of reinsurance.We cede to reinsurers a portion of our risk based upon
insurance policies subject to such reinsurance.Reinsurance contracts do not relieve us from our obliga-tions to policyholders. Failure of reinsurers to honor theirobligations could result in losses to us. We believe that theterms of our reinsurance contracts are consistent withindustry practice in that they contain standard terms withrespect to lines of business covered, limit and retention,arbitration and occurrence. We believe our reinsurers arefinancially sound, based upon our ongoing review of theirfinancial statements, financial strength ratings assigned tothem by rating agencies, their reputations in the reinsur-ance marketplace, our collections history, advice fromthird parties, and the analysis and guidance of our reinsur-ance advisors.Although we exclude coverage of nuclear, chemical or
biological events from the Personal Lines and CommercialLines policies we write in the U.S., we are statutorilyrequired to provide this coverage in our workers’ compen-
sation policies. We have workers’ compensation reinsur-ance coverage under our casualty reinsurance treaty ofapproximately $10 million for losses that result fromnuclear, chemical or biological events and approximately$45 million for terrorism losses excluding those that resultfrom nuclear, chemical or biological events. All other U.S.-based exposure or treaties exclude such coverage. Further,under TRIPRA, our retention of U.S. domestic losses in2014 from such events, if deemed certified terrorist events,is limited to 15% of losses in excess of an approximate$350 million deductible, up to a combined annual aggre-gate limit for the federal government and all insurers of$100 billion. Such events could be material to our finan-cial position or results of operations. See “Terrorism” foradditional information.Reference is made to Note 16 — “Reinsurance” in the
Notes to Consolidated Financial Statements included inFinancial Statements and Supplementary Data of this Form10-K. Reference is also made to “Involuntary ResidualMarkets”.
Commercial and Personal LinesOur 2014 reinsurance program for our Commercial Linesand Personal Lines segments is substantially consistentwith our 2013 program design. In light of the favorablereinsurance market conditions at January 1, 2014, weexpanded our reinsurance coverage in some treaties andincreased our limit in others. The following discussionsummarizes both our 2013 and 2014 reinsurance pro-grams for our Commercial Lines and Personal Lines seg-ments (excluding coverage available under the U.S. federalterrorism program which is described under “Terrorism”),but does not purport to be a complete description of theprogram or the various restrictions or limitations whichmay apply:• Our Commercial Lines and Personal Lines segmentswere primarily protected by a property catastropheoccurrence treaty, a property per risk excess of losstreaty, as well as a casualty excess of loss treaty, withretentions of $200 million, $2 million, and $2 million,respectively.

THE HANOVER INSURANCE GROUP 2013 ANNUAL REPORT | 17
• The property catastrophe occurrence treaty providescoverage, on an occurrence basis, up to $700 million(up to $1.1 billion in the Northeast), less a $200 millionretention, with no co-participation, for all defined per-ils. The $700 million to $1.1 billion layer has beenrenewed effective July 1, 2014 and will reinsure allcatastrophe occurrences nationwide. For 2013 and2014, the property per risk excess of loss treaty providescoverage, on a per risk basis, up to $100 million, less a$2 million retention, with co-participations for 2013and 2014 ranging from 10% to 12.75% for reinsuranceplaced in the $2 million to $3 million layer and zero to10% for reinsurance placed in the $3 million to $10 mil-lion layer.
• The casualty excess of loss treaty provides coverage, ona per occurrence basis for each loss, up to $50 millionless a $2 million retention, with no co-participation. Forboth years, umbrella lines share coverage with casualtylines at the $2 million to $10 million layer, with themaximum umbrella limit of $5 million subject to thecasualty treaty. There is also separate umbrella only cov-erage that provides protection in both 2013 and 2014for the $5 million to $25 million layer. Professional lia-bility and management liability risks formerly covered ina separate treaty are covered in the casualty excess ofloss treaty effective January 1, 2014, which nowincludes a $1 million to $2 million layer only for theserisks.
• For 2013 and 2014, Commercial Lines segments arefurther protected by excess of loss treaty agreements forspecific lines of business such as surety and fidelitybond liability, and healthcare liability. Surety and fideli-ty bond excess of loss treaty provides coverage, on a perprincipal basis, up to $35 million, less a $5 millionretention, with co-participations ranging from 5% to15% for individual layers placed within the treaty.
• In addition to certain layers of coverage from ourCommercial and Personal Lines segment reinsuranceprogram as described above, the Commercial Lines AIXprogram business also includes surplus share, quotashare, excess of loss, facultative and other forms of rein-surance that cover the writings from AIX specialty andproprietary programs. There are approximately 45 dif-ferent AIX programs, and the reinsurance structure iscustomized to fit the exposure profile for each program.
Our intention is to renew the surety and fidelity bondtreaty, and the property per risk excess of loss treaty in July2014 with the same or similar terms and conditions, butthere can be no assurance that we will be able to maintainour current levels of reinsurance, pricing and terms andconditions. For our 2014 reinsurance program, all othertreaties described above were effective January 1, 2014 fora twelve month period.
ChaucerChaucer’s 2014 reinsurance program is substantially con-sistent with the 2013 program design. The 2013 and 2014Chaucer reinsurance programs contain a combination ofreinsurance treaties that either provide coverage acrossseveral lines or are specific to individual lines of businessor classes of business within certain lines. Generally, foreach line or class of Chaucer’s business, there are a varietyof proportional, excess of loss (occurrence and aggregatebasis), facultative and other treaty forms, which work inconjunction to provide coverage limits. For 2013, Chaucerincreased its net retentions for certain lines and classespredominantly through various co-participation levelswithin certain treaty layers. For 2014, Chaucer’s net reten-tions are generally consistent with the 2013 levels.The Chaucer programs described below are substantial-
ly in place as of February 1, 2014 and we expect to imple-ment throughout the year any remaining parts of theprogram as described; however, there can be no assurancesthat we will be successful in placing reinsurance for eachline as planned. The following discussion summarizes bothour 2013 and 2014 reinsurance programs for the Chaucersegment, but does not purport to be a complete descriptionof the program or the various restrictions or limitationswhich may apply. The limit figures below are presented netof treaty co-participation.We purchase proportional and non-proportional rein-
surance which is intended to provide sufficient underwrit-ing capacity to effectively conduct business in the Lloyd’smarket and to protect against frequency and severity oflosses.For the property lines reinsurance coverage in 2013 and
2014:• The direct property catastrophe occurrence reinsurancefor selected international territories provides coverageup to approximately $46 million and $38 million, lessretentions of approximately $15 million and $10 million,respectively.
• The assumed property catastrophe reinsurance forselected international territories provides coverage up toapproximately $93 million and $115 million, less reten-tions of approximately $20 million and $24 million,respectively. Additionally, the assumed property catas-trophe occurrence reinsurance for the United Statesand the Caribbean provides coverage up to approximate-ly $112 million and $133 million, less retentions ofapproximately $29 million and $30 million, respective-ly. For 2014 reinsurance programs, our assumed proper-ty catastrophe coverage is placed partially on an occur-rence, and partially on an aggregate basis.
• The direct property per risk excess of loss reinsuranceprovides coverage up to approximately $17 million and$18 million, less retentions of approximately $6 millionand $8 million, respectively.

| THE HANOVER INSURANCE GROUP 2013 ANNUAL REPORT18
For the energy, marine and aviation lines reinsurancecoverage in 2013 and 2014:• The nuclear energy lines occurrence reinsurance pro-vides coverage up to approximately $163 million and$165 million, less retentions of approximately $54 mil-lion and $55 million, respectively.
• The non-nuclear energy lines occurrence reinsuranceprovides coverage up to approximately $158 million and$154 million, respectively, less retentions of approxi-mately $17 million and $20 million, respectively.
• The marine lines excess of loss reinsurance providescoverage, on a per occurrence basis, up to approximate-ly $56 million and $60 million, respectively, less reten-tions of approximately $5 million for both years.
• The aviation lines reinsurance provides coverage, on aper occurrence basis, up to approximately $51 millionand $52 million respectively, less retentions of approxi-mately $2 million and $3million, respectively.
The U.K. motor line has protection from a reinsuranceprogram placed on a losses occurring basis, which isunlimited in excess of $1.6 million, both in terms of theamount and the number of losses sustained. For 2012,2013 and 2014, there is co-participation on the $1.6 mil-lion in excess of $1.6 million layer of 30%, 30% and 15%for each year, respectively.
Reinsurance RecoverablesOther than our investment portfolio, the single largestasset class is our reinsurance receivables, which consist ofour estimate of amounts recoverable from reinsurers withrespect to losses incurred to date (including lossesincurred but not reported) and unearned premiums, net ofamounts estimated to be uncollectible. This estimatedepends upon a number of factors, including an estimateof the amount of reserves attributable to business writtenin various lines and in various years. This estimate isexpected to be revised at each reporting period and suchrevisions, which could be material, affect our results ofoperations and financial position. Reinsurance recover-ables include amounts due from both United States andstate mandatory reinsurance or other risk sharing mecha-nisms, and private reinsurers to whom we have voluntarilyceded business.We are subject to concentration of risk with respect to
reinsurance ceded to various mandatory residual markets,facilities and pooling mechanisms. As a condition to con-duct business in various states, we are required to partici-pate in residual market mechanisms, facilities and pooling
arrangements which usually are designed to provide insur-ance coverages to individuals or other entities that are oth-erwise unable to purchase such coverage voluntarily or atrates deemed reasonable. These market mechanisms, facil-ities and pooling arrangements comprise $887.6 million ofour total reinsurance recoverables on paid and unpaid loss-es and unearned premiums at December 31, 2013 andinclude, among others, the Michigan Catastrophic ClaimsAssociation (“MCCA”).The MCCA is a mandatory reinsurance association
which reinsures claims under Michigan’s unlimited per-sonal injury protection coverage which is required underall Michigan automobile insurance policies. The MCCAreinsures all such claims in excess of a statutorily estab-lished company retention, currently $530,000. Fundingfor MCCA comes from assessments against automobileinsurers based upon their share of insured automobiles inthe state. Insurers are allowed to pass along this cost toMichigan automobile policyholders. This recoverableaccounted for 61% of our total personal automobile grossreserves at December 31, 2013 and 2012. Reinsurancerecoverables related to MCCA were $867.0 million and$856.3 million at December 31, 2013 and 2012, respec-tively. Because the MCCA is supported by assessmentspermitted by statute, and there have been no significantuncollectible balances from MCCA identified during thethree years ending December 31, 2013, we believe that wehave no significant exposure to uncollectible reinsurancebalances from this entity.In addition to the reinsurance ceded to various residual
market mechanisms, facilities and pooling arrangementsand the former capital provision reinsurance treaty withFlagstone Re, as described below, we have $1,315.9 mil-lion of reinsurance assets due from traditional reinsurers.These amounts are due principally from highly-rated rein-surers, defined as rated A- or higher by A.M. Best RatingAgency or other equivalent rating. The following table dis-plays balances recoverable from our ten largest reinsur-ance groups at December 31, 2013, along with the group’srating from the indicated rating agency. The contractualobligations under reinsurance agreements are typicallywith individual subsidiaries of the group or syndicates atLloyd’s and are not typically guaranteed by other groupmembers or syndicates at Lloyd’s. Reinsurance recover-ables are comprised of paid losses recoverable, outstandinglosses recoverable, incurred but not reported losses recov-erable, and ceded unearned premium.
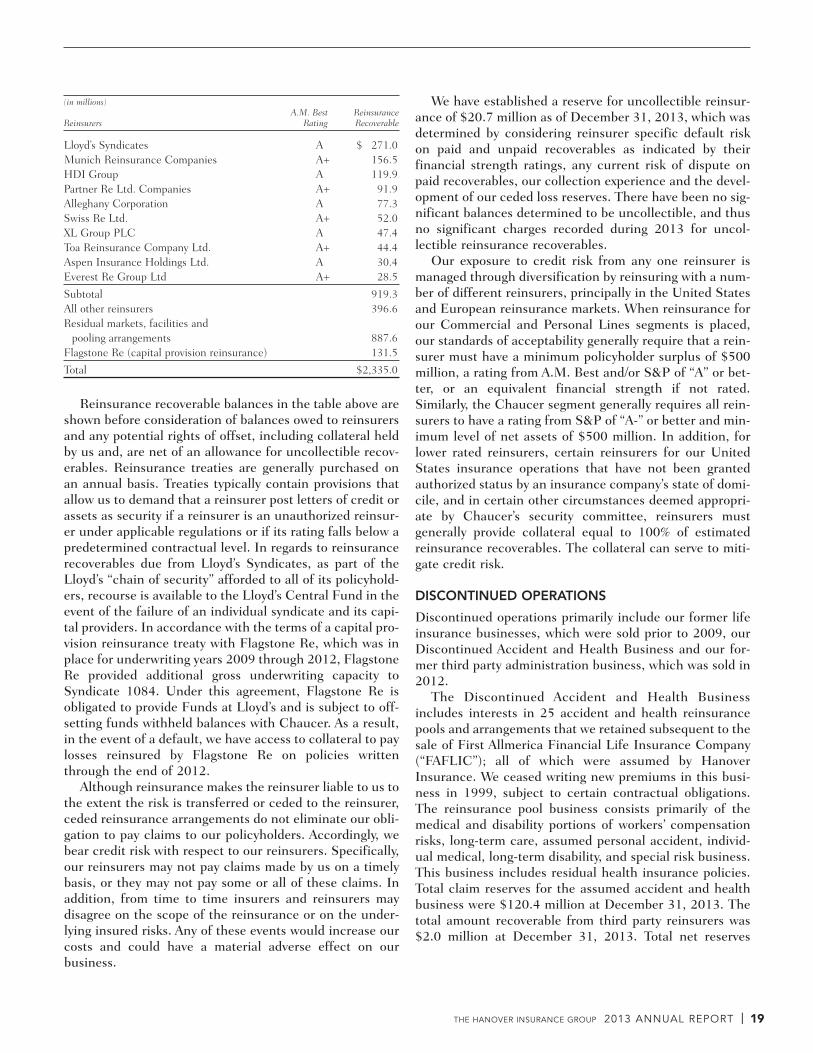
THE HANOVER INSURANCE GROUP 2013 ANNUAL REPORT | 19
(in millions)A.M. Best Reinsurance
Reinsurers Rating Recoverable
Lloyd’s Syndicates A $ 271.0Munich Reinsurance Companies A+ 156.5HDI Group A 119.9Partner Re Ltd. Companies A+ 91.9Alleghany Corporation A 77.3Swiss Re Ltd. A+ 52.0XL Group PLC A 47.4Toa Reinsurance Company Ltd. A+ 44.4Aspen Insurance Holdings Ltd. A 30.4Everest Re Group Ltd A+ 28.5
Subtotal 919.3All other reinsurers 396.6Residual markets, facilities and
pooling arrangements 887.6Flagstone Re (capital provision reinsurance) 131.5
Total $2,335.0
Reinsurance recoverable balances in the table above areshown before consideration of balances owed to reinsurersand any potential rights of offset, including collateral heldby us and, are net of an allowance for uncollectible recov-erables. Reinsurance treaties are generally purchased onan annual basis. Treaties typically contain provisions thatallow us to demand that a reinsurer post letters of credit orassets as security if a reinsurer is an unauthorized reinsur-er under applicable regulations or if its rating falls below apredetermined contractual level. In regards to reinsurancerecoverables due from Lloyd’s Syndicates, as part of theLloyd’s “chain of security” afforded to all of its policyhold-ers, recourse is available to the Lloyd’s Central Fund in theevent of the failure of an individual syndicate and its capi-tal providers. In accordance with the terms of a capital pro-vision reinsurance treaty with Flagstone Re, which was inplace for underwriting years 2009 through 2012, FlagstoneRe provided additional gross underwriting capacity toSyndicate 1084. Under this agreement, Flagstone Re isobligated to provide Funds at Lloyd’s and is subject to off-setting funds withheld balances with Chaucer. As a result,in the event of a default, we have access to collateral to paylosses reinsured by Flagstone Re on policies writtenthrough the end of 2012.Although reinsurance makes the reinsurer liable to us to
the extent the risk is transferred or ceded to the reinsurer,ceded reinsurance arrangements do not eliminate our obli-gation to pay claims to our policyholders. Accordingly, webear credit risk with respect to our reinsurers. Specifically,our reinsurers may not pay claims made by us on a timelybasis, or they may not pay some or all of these claims. Inaddition, from time to time insurers and reinsurers maydisagree on the scope of the reinsurance or on the under-lying insured risks. Any of these events would increase ourcosts and could have a material adverse effect on our business.
We have established a reserve for uncollectible reinsur-ance of $20.7 million as of December 31, 2013, which wasdetermined by considering reinsurer specific default riskon paid and unpaid recoverables as indicated by theirfinancial strength ratings, any current risk of dispute onpaid recoverables, our collection experience and the devel-opment of our ceded loss reserves. There have been no sig-nificant balances determined to be uncollectible, and thusno significant charges recorded during 2013 for uncol-lectible reinsurance recoverables.Our exposure to credit risk from any one reinsurer is
managed through diversification by reinsuring with a num-ber of different reinsurers, principally in the United Statesand European reinsurance markets. When reinsurance forour Commercial and Personal Lines segments is placed,our standards of acceptability generally require that a rein-surer must have a minimum policyholder surplus of $500million, a rating from A.M. Best and/or S&P of “A” or bet-ter, or an equivalent financial strength if not rated.Similarly, the Chaucer segment generally requires all rein-surers to have a rating from S&P of “A-” or better and min-imum level of net assets of $500 million. In addition, forlower rated reinsurers, certain reinsurers for our UnitedStates insurance operations that have not been grantedauthorized status by an insurance company’s state of domi-cile, and in certain other circumstances deemed appropri-ate by Chaucer’s security committee, reinsurers mustgenerally provide collateral equal to 100% of estimatedreinsurance recoverables. The collateral can serve to miti-gate credit risk.
DISCONTINUED OPERATIONS
Discontinued operations primarily include our former lifeinsurance businesses, which were sold prior to 2009, ourDiscontinued Accident and Health Business and our for-mer third party administration business, which was sold in2012.The Discontinued Accident and Health Business
includes interests in 25 accident and health reinsurancepools and arrangements that we retained subsequent to thesale of First Allmerica Financial Life Insurance Company(“FAFLIC”); all of which were assumed by HanoverInsurance. We ceased writing new premiums in this busi-ness in 1999, subject to certain contractual obligations.The reinsurance pool business consists primarily of themedical and disability portions of workers’ compensationrisks, long-term care, assumed personal accident, individ-ual medical, long-term disability, and special risk business.This business includes residual health insurance policies.Total claim reserves for the assumed accident and healthbusiness were $120.4 million at December 31, 2013. Thetotal amount recoverable from third party reinsurers was$2.0 million at December 31, 2013. Total net reserves

| THE HANOVER INSURANCE GROUP 2013 ANNUAL REPORT20
were $118.4 million at December 31, 2013. We will con-tinue to account for this business as discontinued opera-tions. Assets and liabilities related to the DiscontinuedAccident and Health Business are reflected as assets andliabilities of discontinued operations.Loss estimates associated with substantially all of the
Discontinued Accident and Health Business are providedby managers of each pool. We adopt reserve estimates forthis business that consider this information, expectedreturns on assets assigned to this business and other facts.We update these reserves as new information becomesavailable and further events occur that may affect the ulti-mate resolution of unsettled claims. We believe that thereserves recorded related to this business are adequate.However, since reserve and loss cost estimates related tothe Discontinued Accident and Health Business aredependent on several assumptions, including, but not lim-ited to, future health care costs, persistency of medicalcare inflation, investment performance, claims, particular-ly in the long-term care business, morbidity and mortalityassumptions, and these assumptions can be impacted bytechnical developments and advancements in the medicalfield and other factors, there can be no assurance that thereserves established for this business will prove sufficient.Revisions to these reserves could have a material adverseeffect on our results of operations for a particular quarter-ly or annual period or on our financial position.Discontinued operations, in total, generated a net gain
of $5.3 million during 2013 and primarily related to ourformer life insurance business. Reference is made to“Discontinued Operations” in Management’s Discussionand Analysis of Financial Condition and Results ofOperations of this Form 10-K.
INVESTMENT PORTFOLIO
We held $8.1 billion of investment assets, including cashand cash equivalents, at December 31, 2013. Approxi -mately 86% of our investment assets were comprised offixed maturities, which included both investment gradeand below investment grade public and private debt secu-rities; 6% were comprised of cash and cash equivalents; 5%consisted of equity securities; and the remaining 3%included overseas deposits and other investments. Theseinvestments are generally of high quality and our fixedmaturities are broadly diversified across sectors of the fixedincome market.Our investment portfolio is managed by Opus
Investment Management Inc., a wholly-owned subsidiaryof THG, including the selection and monitoring of externalasset managers primarily for our non-U.S. dollar portfolios.Our overall investment strategy is intended to balanceinvestment income with credit and interest rate risk, while
maintaining sufficient liquidity and the opportunity forcapital growth. The asset allocation process takes into con-sideration the types of business written and the level ofsurplus required to support our different businesses andthe risk return profiles of the underlying asset classes. Welook to balance the goals of capital preservation, net invest-ment income stability, liquidity and total return. For cer-tain portfolios in which fixed maturities are primarilydenominated in U.K. pound sterling and Euro, we employtwo external asset managers with international marketexpertise to manage these portfolios, totaling approximate-ly $823 million. We select and monitor managers based oninvestment style, performance and corporate governance.The majority of our assets are invested in the fixed
income markets. Through fundamental research and cred-it analysis, with a focus on value investing, we seek to iden-tify a portfolio of stable income-producing higher qualityU.S. government, foreign government, municipal, corpo-rate, residential and commercial mortgage-backed securi-ties and asset-backed securities. We have a general policyof diversifying investments both within and across majorinvestment and industry sectors to mitigate credit andinterest rate risk. We monitor the credit quality of ourinvestments and our exposure to individual markets, bor-rowers, industries, sectors and, in the case of direct com-mercial mortgages and commercial mortgage-backedsecurities, property types and geographic locations.Investments held by our insurance subsidiaries are sub-
ject to diversification requirements under state insurancelaws and other regulatory requirements. The investmentportfolio duration is approximately 4.1 years and is gener-ally maintained in the range of 1 to 2 times the duration ofour insurance liabilities. We seek to maintain sufficient liq-uidity to support our cash flow requirements by monitor-ing the cash requirements associated with our insuranceand corporate liabilities, laddering the maturities withinthe portfolio, closely monitoring our investment durations,holding high quality liquid public securities and managingthe purchases and sales of assets.Reference is made to “Investments” in Management’s
Discussion and Analysis of the Financial Condition andResults of Operations of this Form 10-K.
RATING AGENCIES
Insurance companies are rated by rating agencies to pro-vide both industry participants and insurance consumersinformation on specific insurance companies. Higher rat-ings generally indicate the rating agencies’ opinion regard-ing financial stability and a stronger ability to pay claims.We believe that strong ratings are important factors in
marketing our products to our agents and customers, sincerating information is broadly disseminated and generally

THE HANOVER INSURANCE GROUP 2013 ANNUAL REPORT | 21
used throughout the industry. We believe that a rating of“A-”or higher from A.M. Best Co. is particularly importantfor our business. Insurance company financial strengthratings are assigned to an insurer based upon factorsdeemed by the rating agencies to be relevant to policyhold-ers and are not directed toward protection of investors.Such ratings are neither a rating of securities nor a recom-mendation to buy, hold or sell any security.
EMPLOYEES
As of December 31, 2013, we have approximately 5,100employees, with approximately 4,300 located in the UnitedStates, and 800 internationally, almost all of whom arelocated in the United Kingdom. We believe our relationswith employees are good.
EXECUTIVE OFFICERS OF THE REGISTRANT
Reference is made to “Directors and Executive Officers ofthe Registrant” in Part III - Item 10 of this Form 10-K.
AVAILABLE INFORMATION
We file our annual report on Form 10-K, quarterly reportson Form 10-Q, periodic information on Form 8-K, ourproxy statement, and other required information with theSecurities Exchange Commission (“SEC”). Shareholdersmay read and copy any materials on file with the SEC atthe SEC’s Public Reference Room at 100 F Street, NE,Washington, DC 20549. Shareholders may obtain infor-mation on the operation of the Public Reference Room bycalling the SEC at 1-800-SEC-0330. In addition, the SECmaintains an Internet website, http://www.sec.gov, whichcontains reports, proxy and information statements andother information with respect to our filings.Our website address is http://www.hanover.com. We
make available free of charge on or through our website,our annual report on Form 10-K, quarterly reports on Form10-Q, current reports on Form 8-K, and amendments tothose reports filed or furnished pursuant to Sections 13(a)or 15(d) of the Securities Exchange Act of 1934, as soonas reasonably practicable after we electronically file suchmaterial with, or furnish it to, the SEC. Additionally, ourCode of Conduct is available, free of charge, on our web-site. Our Corporate Governance Guidelines and the char-ters of our Audit Committee, Compensation Committee,Committee of Independent Directors and Nominating andCorporate Governance Committee, are available on ourwebsite. All documents are also available in print to anyshareholder who requests them.
Item 1A–Risk Factors
RISK FACTORS AND FORWARD LOOKINGSTATEMENTS
We wish to caution readers that the following important fac-tors, among others, in some cases have affected, and in thefuture could affect, our actual results and could cause ouractual results to differ materially from historical results andfrom those expressed in any forward-looking statementsmade from time to time by us on the basis of our then-cur-rent expectations. When used in this Form 10-K, the words“believes”, “anticipates”, “expects”, “projections”, “outlook”,“should”, “could”, “plan”, “guidance”, “likely”, “on track to”,“targeted” and similar expressions are intended to identifyforward-looking statements. Our businesses are in rapidlychanging and competitive markets and involve a high degreeof risk and unpredictability. Forward-looking projections aresubject to these risks and unpredictability.
Our results may fluctuate as a result of cyclical or non-cyclical changes in the property and casualty insuranceindustry.
The property and casualty insurance industry historical-ly has been subject to significant fluctuations and uncer-tainties. Our profitability is affected significantly by thefollowing items:• increases in costs, particularly those occurring after thetime our insurance products are priced and includingconstruction, automobile repair, and medical and reha-bilitation costs. This includes “cost shifting” fromhealth insurers to casualty and liability insurers(whether as a result of an increasing number of injuredparties without health insurance, coverage changes inhealth policies to make such coverage secondary tocasualty policies, the implementation of nationalhealthcare legislation, lower reimbursement rates forthe same procedure by health insurers or government-sponsored insurance, or the implementation of theMedicare Secondary Payer Act, which imposes report-ing and other requirements with respect to medical andrelated claims paid for Medicare eligible individuals). Asit relates to construction, there are often temporaryincreases in the cost of building supplies and construc-tion labor after a significant event (for example, socalled “demand surge” that causes the cost of labor,construction materials and other items to increase in ageographic area affected by a catastrophe). In addition,we are limited in our ability to negotiate and managereimbursable expenses incurred by our policyholders;
• competitive and regulatory pressures, which affect theprices of our products and the nature of the risks covered;
• volatile and unpredictable developments, includingsevere weather, catastrophes and terrorist actions;

| THE HANOVER INSURANCE GROUP 2013 ANNUAL REPORT22
• legal, regulatory and socio-economic developments,such as new theories of insured and insurer liability andrelated claims and extra-contractual awards such aspunitive damages, and increases in the size of juryawards or changes in applicable laws and regulations(such as changes in the thresholds affecting “no fault”liability or when non-economic damages are recoverablefor bodily injury claims or coverage requirements);
• fluctuations in interest rates, inflationary pressures,default rates and other factors that affect investmentreturns; and
• other general economic conditions and trends that mayaffect the adequacy of reserves.
The demand for property and casualty insurance canalso vary significantly based on general economic condi-tions (either nationally or regionally and, with respect toour Chaucer segment, internationally), rising as the over-all level of economic activity increases and falling as suchactivity decreases. Loss patterns also tend to vary inverselywith local economic conditions, increasing during difficulteconomic times and moderating during economicupswings or periods of stability. The fluctuations indemand and competition could produce unpredictableunderwriting results.
Actual losses from claims against our property and casualtyinsurance subsidiaries may exceed their reserves for claims.
Our property and casualty insurance subsidiaries main-tain reserves to cover their estimated ultimate liability forlosses and loss adjustment expenses with respect to report-ed and unreported claims incurred as of the end of eachaccounting period. Reserves do not represent an exact cal-culation of liability. Rather, reserves represent estimates,involving actuarial projections and judgments at a giventime, of what we expect the ultimate settlement andadministration of incurred claims will cost based on factsand circumstances then known, predictions of futureevents, estimates of future trends in claims frequency andseverity and judicial theories of liability, costs of repair andreplacement, legislative activity and myriad other factors.The inherent uncertainties of estimating reserves are
greater for certain types of property and casualty insurancelines. These include automobile bodily injury, personalautomobile personal injury protection, and workers’ com-pensation, where a longer period of time may elapse beforea definitive determination of ultimate liability may bemade, environmental liability, where the technological,judicial and political climates involving these types ofclaims are continuously evolving, and casualty coveragessuch as professional liability. There is also greater uncer-tainty in establishing reserves with respect to new busi-ness, particularly new business that is generated withrespect to newly introduced product lines, such as our pro-fessional liability and healthcare lines, by newly appointed
agents or in geographies where we have less experience inconducting business. In these cases, there is less historicalexperience or knowledge and less data upon which theactuaries can rely. Estimating reserves is further complicat-ed by unexpected claims or unintended coverage thatemerge due to changing conditions. These emerging issuesmay increase the size or number of claims beyond ourunderwriting intent and may not become apparent formany years after a contract is issued.Additionally, the introduction of new Commercial Lines
products, including through several acquired subsidiaries,the development of new niche and specialty lines and theintroduction of new lines of business at Chaucer, presentnew risks. Certain new specialty products, such as thehuman services program, non-profit directors and officersliability and employment practices liability policies,lawyers and other professional liability policies, healthcarelines and private company directors and officers coveragemay also require a longer period of time (the so-called“tail”) to determine the ultimate liability associated withthe claims and may produce more volatility in our resultsand less certainty in our accident year reserves. Some linesof business, such as commercial surety, are less susceptibleto establishing reserves based on actuarial or historicalexperience and losses may be episodic, depending on eco-nomic and other factors.We regularly review our reserving techniques, reinsur-
ance and the overall adequacy of our reserves based upon,among other things:• our review of historical data, legislative enactments,judicial decisions, legal developments in imposition ofdamages, changes in political attitudes and trends ingeneral economic conditions;
• our review of per claim information;
• historical loss experience of our property and casualtyinsurance subsidiaries and the industry as a whole; and
• the terms of our property and casualty insurance policies.
Underwriting results and operating income could beadversely affected by further changes in our net loss andLAE estimates related to significant events or emergingrisks, such as risks related to breaches of computer net-work systems (“cyber-risks”), privacy regulations or disrup-tions caused by solar flares.Estimating losses following any major catastrophe or
with respect to emerging claims is an inherently uncertainprocess. Factors that add to the complexity in these eventsinclude the legal and regulatory uncertainty, the complexi-ty of factors contributing to the losses, delays in claimreporting and with respect to areas with significant proper-ty damage, the impact of “demand surge” and a slowerpace of recovery resulting from the extent of damage sus-tained in the affected areas due, in part, to the availabilityand cost of resources to effect repairs. Emerging claims

THE HANOVER INSURANCE GROUP 2013 ANNUAL REPORT | 23
issues may involve complex coverage, liability and othercosts which could significantly affect LAE. As a result,there can be no assurance that our ultimate costs associat-ed with these events or issues will not be substantially dif-ferent from current estimates (for example, actual lossesarising from an event like Superstorm Sandy may varywidely depending on the interpretation of various policyprovisions). Investors should consider the risks and uncer-tainties in our business that may affect net loss and LAEreserve estimates and future performance, including thedifficulties in arriving at such estimates.Anticipated losses associated with business interruption
exposure, the impact of wind versus water as the cause ofloss, supplemental payments on previously closed claimscaused by the development of latent damages or new the-ories of liability and inflationary pressures could have anegative impact on future loss reserve development.Because of the inherent uncertainties involved in set-
ting reserves and establishing current and prior-year “losspicks”, including those related to catastrophes, we cannotprovide assurance that the existing reserves or futurereserves established by our property and casualty insurancesubsidiaries will prove adequate in light of subsequentevents. Our results of operations and financial conditioncould therefore be materially affected by adverse lossdevelopment for events that we insured in prior periods.
Due to geographical concentration in our U.S. propertyand casualty business, changes in economic, regulatoryand other conditions in the regions where we operate couldhave a significant negative impact on our business as awhole. Geographic concentrations also expose us to lossesthat are potentially disproportionate to our market share inthe event of natural or other catastrophes.
We generate a significant portion of our U.S. propertyand casualty insurance net premiums written and earningsin Michigan, Massachusetts and other states in theNortheast, including New Jersey and New York. For theyear ended December 31, 2013, approximately 22% and10% of our net premiums written in our U.S. property andcasualty business were generated in the states of Michiganand Massachusetts, respectively. Many states in which wedo business impose significant rate control and residualmarket charges, and restrict an insurer’s ability to exit suchmarkets. The revenues and profitability of our property andcasualty insurance subsidiaries are subject to prevailingeconomic, regulatory, demographic and other conditions,including adverse weather in Michigan and the Northeast.Because of our geographic concentration in certainregions, our business as a whole could be significantlyaffected by changes in the economic, regulatory and otherconditions in such areas.
Further, certain new catastrophe models assume anincrease in frequency and severity of certain weatherevents, whether as a result of potential global climatechange or otherwise. Financial strength rating agencies areplacing increased emphasis on capital and reinsuranceadequacy for insurers with certain geographic concentra-tions of risk which may be subject to disproportionate riskof loss. These factors also may result in insurers seeking todiversify their geographic exposure, which could result inincreased regulatory restrictions in those markets whereinsurers seek to exit or reduce coverage, as well as anincrease in competitive pressures in less weather-exposedmarkets.
Our profitability may be adversely affected if our pricingmodels differ materially from actual results.
The profitability of our business depends on the extentto which our actual claims experience is consistent withthe assumptions we use in pricing our policies. We priceour business in a manner that is intended to be consistent,over time, with actual results and return objectives. Ourestimates and models, and/or the assumptions behindthem, may differ materially from actual results.If we fail to appropriately price the risks we insure, or
fail to change our pricing model to appropriately reflectour current experience, or if our claims experience is morefrequent or severe than our underlying risk assumptions,our profit margins may be negatively affected. If we under-estimate the frequency and/or severity of extreme adverseevents occurring, our financial condition may be adverselyaffected. If we overestimate the risks we are exposed to,we may overprice our products, and new business growthand retention of our existing business may be adverselyaffected.
Limitations on the ability to predict the potential impact ofweather events and catastrophes may impact our futureprofits and cash flows.
Our business is subject to claims arising out of catastro-phes that may have a significant impact on our results ofoperations and financial condition. We may experiencecatastrophe losses that could have a material adverseimpact on our business. Catastrophes can be caused byvarious events, including hurricanes, floods, earthquakes,tornadoes, wind, hail, fires, drought, severe winter weath-er, sabotage, terrorist actions, explosions, nuclear acci-dents, solar flares, and power outages. The frequency andseverity of catastrophes are inherently unpredictable.The extent of gross losses from a catastrophe is a func-
tion of the total amount of insured exposure in the areaaffected by the event and the severity of the event. Theextent of net losses depends on the amount and collectabil-ity of reinsurance.

| THE HANOVER INSURANCE GROUP 2013 ANNUAL REPORT24
Additionally, the severity of certain catastrophes couldbe so significant that it impacts the ability of certain loca-tions to recover their economic viability in the near-term,which could also have a significant negative impact on ourbusiness.Although catastrophes can cause losses in a variety of
property and casualty lines, homeowners and commercialmultiple peril property insurance have, in the past, gener-ated the vast majority of our catastrophe-related claims.Our catastrophe losses have historically been principallyweather-related, particularly from hurricanes, as well assnow and ice damage from winter storms. However, withthe acquisition of Chaucer, we are subject to greater diver-sity in the types and geographic distribution of potentialcatastrophe losses. For example, Chaucer incurred catas-trophe losses in 2013 from floods in Europe and hurri-canes in Mexico, in 2012 from the earthquake in Italy andboth the drought and Superstorm Sandy in the U.S., andin 2011 from the earthquake and ensuing tsunami inJapan, the earthquakes in New Zealand, and flooding inAustralia and Thailand.Although the insurance industry and rating agencies
have developed various models intended to help estimatepotential insured losses under thousands of scenarios,there is no reliable way of predicting the probability ofsuch events or the magnitude of such losses before a spe-cific event occurs. We utilize various models and othertechniques in an attempt to measure and manage potentialcatastrophe losses within various income and capital riskappetites. However, such models and techniques havemany limitations. In addition, due to historical concentra-tions of business, regulatory restrictions and other factors,particularly in the Northeast and in the state of Michigan,our ability to manage such concentrations is limited.We purchase catastrophe reinsurance as protection
against catastrophe losses. Based upon an ongoing reviewof our reinsurers’ financial statements, financial strengthratings assigned to them by rating agencies, their reputa-tions in the reinsurance marketplace, our collections histo-ry with them and the analysis and guidance of ourreinsurance advisors, we believe that the financial condi-tion of our reinsurers is sound. However, reinsurance issubject to counterparty risks, including those resultingfrom over-concentration of exposures within the industry.In setting our retention levels and coverage limits, we alsoconsider our level of statutory surplus and exposures, aswell as the current reinsurance pricing environment. Therecan be no assurance that our reinsurance program will pro-vide adequate coverage levels should we experience lossesfrom one significant or several large catastrophes.
Our business is dependent on our ability to manage risk,and the failure of the risk mitigation strategies we utilizecould have a material adverse effect on our financial con-dition or results of operations.
Our business performance is highly dependent on ourability to manage operational risks that arise from a largenumber of day-to-day business activities, including insur-ance underwriting, claims processing, servicing, invest-ment, financial and tax reporting, compliance withregulatory requirements and other activities. We utilize anumber of strategies to mitigate our insurance risk expo-sure, including: engaging in thorough underwriting, utiliz-ing limits, deductibles and exclusions to mitigate policyrisk, reviewing the terms and conditions of our policies,focusing on our risk aggregation by product line, geogra-phy, industry type, credit exposure and other bases, andceding insurance risk. We seek to monitor and control ourexposure to risks arising out of these activities through anenterprise-wide risk management framework. However,there are inherent limitations in all of these tactics and noassurance can be given that these processes and proce-dures will effectively control all known risks or effectivelyidentify unforeseen risks or that an event or series ofevents will not result in loss levels in excess of our proba-ble maximum loss models, which could have a materialadverse effect on our financial condition or results of oper-ations. It is also possible that losses could manifest them-selves in ways that we do not anticipate and that our riskmitigation strategies are not designed to address. Such amanifestation of losses could have a material adverse effecton our financial condition or results of operations. Theserisks may be heightened during challenging economic conditions such as those recently experienced in the U.S.and elsewhere.
We cannot guarantee the adequacy of or ability to main-tain our current level of reinsurance coverage.
Similar to insurance companies, reinsurance companiescan also be adversely impacted when catastrophes occur.There can be no assurance that we will be able to maintainour current levels of reinsurance coverage. In particular,and as discussed under “Reinsurance Program Overview”of this Form 10-K, not all of our 2014 reinsurance pro-grams for the Commercial and Personal Lines andChaucer business are fully placed. Future catastrophicevents and other changes in the reinsurance marketplace,including as a result of investment losses or disruptionsdue to challenges in the financial markets that haveoccurred or could occur in the future, may adversely affectour ability to obtain such coverages, as well as adverselyaffect the cost of obtaining that coverage.Additionally, the availability, scope of coverage, cost,
and creditworthiness of reinsurance could continue to beadversely affected as a result of not only new catastrophes,but also terrorist attacks and the perceived risks associated

THE HANOVER INSURANCE GROUP 2013 ANNUAL REPORT | 25
with future terrorist activities, global conflicts, and thechanging legal and regulatory environment (includingchanges which could create new insured risks).Federal terrorism coverage under TRIPRA is due to
expire by its terms on December 31, 2014, and there havebeen proposals to scale back coverage under TRIPRA. Weare unable to predict the likelihood that TRIPRA will beextended or of adoption of any proposals to reduce cover-age; however, failure to timely reauthorize TRIPRA or areduction in TRIPRA coverage would change our risk pro-file, and could have an adverse effect on our results ofoperations and financial position, because among otherthings, we may deem it prudent to reduce coverage in cer-tain lines of business, such as workers’ compensation, orlimit our exposure concentrations in certain geographicareas or to purchase additional reinsurance. Reinsurancemay not be available at reasonable rates.
Although we monitor their financial soundness, we cannotbe sure that our reinsurers will pay in a timely fashion, ifat all.
We purchase reinsurance by transferring part of the riskthat we have assumed (known as ceding) to reinsurancecompanies in exchange for part of the premium we receivein connection with the risk. As of December 31, 2013, ourreinsurance receivable (including from the MCCA)amounted to approximately $2.3 billion. Although reinsur-ance makes the reinsurer liable to us to the extent the riskis transferred or ceded to the reinsurer, it does not relieveus (the reinsured) of our liability to our policyholders or, incases where we are a reinsurer, to our reinsureds.Accordingly, we bear counterparty risk with respect to ourreinsurers. Although we monitor the credit quality of ourreinsurers, we cannot be sure that they will pay the rein-surance recoverables owed to us currently or in the futureor that they will pay such recoverables on a timely basis.
Climate change may adversely impact our results of operations.
There are concerns that the higher level of weather-related catastrophes and other losses incurred by theindustry in recent years is indicative of changing weatherpatterns, whether as a result of changing climate (“globalclimate change”) or otherwise, which could cause suchevents to persist. This would lead to higher overall losseswhich we may not be able to recoup, particularly in thecurrent economic and competitive environment, andhigher reinsurance costs. As noted above, certain catastro-phe models assume an increase in frequency and severityof certain weather events which could result in a dispro-portionate impact on insurers with certain geographicconcentrations of risk. This would also likely increase therisks of writing property insurance in coastal areas, partic-ularly in jurisdictions which restrict pricing and under-writing flexibility.
In addition, global climate change could have an impacton assets in which we invest, resulting in realized andunrealized losses in future periods which could have amaterial adverse impact on our results of operations and/orfinancial position. It is not possible to foresee which, if any,assets, industries or markets will be materially and adverse-ly affected, nor is it possible to foresee the magnitude ofsuch effect.
We may incur financial losses resulting from our partici-pation in shared market mechanisms, mandatory reinsur-ance programs and mandatory and voluntary poolingarrangements.
In most of the jurisdictions in which we operate, ourproperty and casualty insurance subsidiaries are requiredto participate in mandatory property and casualty sharedmarket mechanisms, government-sponsored reinsuranceprograms or pooling arrangements. These arrangementsare designed to provide various insurance coverages toindividuals or other entities that otherwise are unable topurchase such coverage or to support the costs of unin-sured motorist claims in a particular state or region. Wecannot predict whether our participation in these sharedmarket mechanisms or pooling arrangements will provideunderwriting profits or losses to us. For the year endedDecember 31, 2013, we experienced an underwriting lossof $14.5 million from participation in these mechanismsand pooling arrangements, compared to underwriting loss-es of $15.3 million and $13.1 million in 2012 and 2011,respectively. We may face similar or even more dramaticearnings fluctuations in the future.Additionally, increases in the number of participants or
insureds in state-sponsored reinsurance pools, FAIR Plansor other residual market mechanisms, particularly in thestates of Louisiana, Massachusetts and Florida, combinedwith regulatory restrictions on the ability to adequatelyprice, underwrite, or non-renew business, as well as newlegislation, or changes in existing case law, could expose usto significant exposures and risks of increased assessmentsfrom these residual market mechanisms. There could alsobe significant adverse impact as a result of losses incurredin those states due to hurricane exposure, as well as thedeclining number of carriers providing coverage in thoseregions. We are unable to predict the likelihood or impactof such potential assessments or other actions.We also have credit risk associated with certain manda-
tory reinsurance programs such as the MichiganCatastrophic Claims Association. The MCCA was createdto fund Michigan’s unique unlimited personal injuryprotection benefit. As of December 31, 2013, our estimat-ed reinsurance recoverable from the MCCA was $867.0million. The MCCA operates with a deficit which mayfluctuate significantly based on investment returns, dis-count rates, incurred claims, annual assessments andother factors.

| THE HANOVER INSURANCE GROUP 2013 ANNUAL REPORT26
In addition, we may be adversely affected by liabilitiesresulting from our previous participation in certain volun-tary property and casualty assumed reinsurance pools. Wehave terminated participation in virtually all property andcasualty voluntary pools, but remain subject to claimsrelated to periods in which we participated. The propertyand casualty assumed reinsurance businesses have suf-fered substantial losses during the past several years, par-ticularly related to environmental and asbestos exposurefor property and casualty coverages, in some cases result-ing from incidents alleged to have occurred decades ago.Due to the inherent volatility in these businesses, possibleissues related to the enforceability of reinsurance treatiesin the industry and the recent history of increased losses,we cannot provide assurance that our current reserves areadequate or that we will not incur losses in the future.Although we have discontinued participation in these rein-surance pools, we are subject to claims related to prioryears or from pools we could not exit entirely. Our operat-ing results and financial position may be adversely affect-ed by liabilities resulting from any such claims in excess ofour loss estimates. As of December 31, 2013, our reservesfor these pools totaled $37.1 million.
Our businesses are heavily regulated and changes in regu-lation may reduce our profitability.
Our U.S. insurance businesses are subject to supervi-sion and regulation by the state insurance authority ineach state in which we transact business. This system ofsupervision and regulation relates to numerous aspects ofan insurance company’s business and financial condition,including limitations on the authorization of lines of busi-ness, underwriting limitations, the ability to utilize credit-based insurance scores in underwriting, the ability toterminate agents, supervisory and liability responsibilitiesfor agents, the setting of premium rates, the requirementto write certain classes of business which we might other-wise avoid or charge different premium rates, restrictionson the ability to withdraw from certain lines of business,the establishment of standards of solvency, the licensing ofinsurers and agents, compensation of agents, concentra-tion of investments, levels of reserves, the payment of div-idends, transactions with affiliates, changes of control,protection of private information of our agents, policyhold-ers, claimants and others (which may include highly sensi-tive financial or medical information or other privateinformation such as social security numbers, drivingrecords, drivers license numbers, etc.) and the approval ofpolicy forms. From time to time, various states andCongress have proposed to prohibit or otherwise restrictthe use of credit-based insurance scores in underwriting orrating our Personal Lines business. The elimination of theuse of credit-based insurance scores could cause signifi-cant disruption to our business and our confidence in our
pricing and underwriting. Most insurance regulations aredesigned to protect the interests of policyholders ratherthan stockholders and other investors.Legislative and regulatory restrictions are constantly
evolving and are subject to then current political pressures.For example, following Superstorm Sandy, the states ofNew Jersey and New York are considering proposals suchas homeowners’ “Bill of Rights”, restrictions on stormdeductibles and additional mandatory claim handlingguidelines. Such actions also occur at the federal level,such as the U. S. Department of Housing and UrbanDevelopment’s proposal that may increase the legal risk ofproviding homeowners and commercial residential proper-ty insurance by imposing liability for discrimination on thebasis of a disparate-impact theory even without any evi-dence of discriminatory intent. Some states are also con-sidering mandating owners of firearms to purchase liabilityinsurance.In addition, in July 2010, in response to the global
financial crisis, The Dodd-Frank Wall Street Reform andConsumer Protection Act was enacted. This legislationprovides for enhanced regulation for the financial servicesindustry through initiatives including, but not limited to,the creation of a Federal Insurance Office and several fed-eral oversight agencies, the requiring of more transparen-cy, accountability and focus in protecting investors andbusinesses, input of shareholders regarding executive com-pensation, and enhanced empowerment of regulators topursue those who engage in financial fraud and unethicalbusiness practices. The Securities and Exchange Commis -sion adopted regulations designed to encourage, reward,and protect “whistleblowers”, whether or not they firstreport the potential infraction to the company for correc-tion or remedial action.Also, beginning in 2011, the federal Medicare,
Medicaid and SCHIP Extension Act mandates reportingand other requirements applicable to property and casual-ty insurance companies which make payments to or onbehalf of claimants who are eligible for Medicare benefits.These requirements have made bodily injury claim resolu-tions more difficult, particularly for complex matters or forinjuries requiring treatment over an extended period, andimpose significant penalties for non-compliance andreporting errors. These new requirements also haveincreased the circumstances under which the federal gov-ernment may seek to recover from insurers amounts paidto claimants in circumstances where the government hadpreviously paid benefits. In January 2013, theStrengthening Medicare and Repaying Taxpayers Act wassigned into law. We are not yet certain of the effect of thislaw on our ability to settle cases or exposure to federalrecoupment claims.With respect to our U.S. insurance business, state reg-
ulatory oversight and various proposals at the federal levelmay in the future adversely affect our ability to sustain

THE HANOVER INSURANCE GROUP 2013 ANNUAL REPORT | 27
adequate returns in certain lines of business or in somecases, operate the line profitably. In recent years, the stateinsurance regulatory framework has come under increasedfederal scrutiny, and certain state legislatures have consid-ered or enacted laws that alter and, in many cases, increasestate authority to regulate insurance companies and insur-ance holding company systems.Our business could be negatively impacted by adverse
state, federal and foreign legislation or regulation, includ-ing those resulting in:• decreases in rates;
• limitations on premium levels;
• coverage and benefit mandates;
• limitations on the ability to manage care and utilizationor other claim costs;
• requirements to write certain classes of business or incertain geographies;
• restrictions on underwriting, on methods of compensat-ing independent producers, or on our ability to cancel orrenew certain business (which negatively affects ourability to reduce concentrations of property risks);
• higher liability exposures for our insureds;
• increased assessments or higher premium or othertaxes; and
• enhanced ability to pierce “no fault” thresholds or recov-er non-economic damages (such as “pain and suffering”).
These regulations serve to protect the customers andother third parties who deal with us and are heavily influ-enced by the then current political environment. If we arefound to have violated an applicable regulation, adminis-trative or judicial proceedings may be initiated against uswhich could result in censures, fines, civil penalties(including punitive damages), the issuance of cease-and-desist orders, premium refunds or the reopening of closedclaim files, among other consequences. These actionscould have a material adverse effect on our financial posi-tion and results of operations.Congress, as well as state, local and foreign govern-
ments, also consider from time to time legislation thatcould increase our tax costs. If such legislation is adopted,our consolidated net income could decline.In addition, we are reliant upon independent agents and
brokers to market our products. Changes in regulationsrelated to insurance agents and brokers that materiallyimpact the profitability of the agent and broker business orthat restrict the ability of agents and brokers to market andsell insurance products would have a material adverseeffect on our business.With respect to our U.K. insurance business, Chaucer’s
regulated subsidiaries are subject to the U.K.’s PrudentialRegulation Authority (“PRA”) and the Financial ConductAuthority (“FCA”) regulations, which replaced the
Financial Services Authority in April 2013, and are subjectto limitations and approval requirements with respect topayments of dividends, return of capital and becoming aborrower, guarantor or provider of security interest on anyfinancial obligations and other aspects of its operations.The PRA and FCA have substantial powers of interven-
tion in relation to the Lloyd’s managing agents, such asChaucer, which they regulate, including the power toremove their authorization to manage Lloyd’s syndicates.In addition, each year the PRA requires Lloyd’s to satisfyan annual solvency test that measures whether Lloyd’s hassufficient assets in the aggregate to meet all outstandingliabilities of its members, both current and run-off. IfLloyd’s fails this test, the PRA may require Lloyd’s to ceasetrading and/or its members to cease or reduce underwrit-ing. The FCA focuses on conduct of business issues with aparticular focus on consumer protection and marketintegrity. Future regulatory changes or rulings by the PRAand FCA could interfere with our business strategy orfinancial assumptions, possibly resulting in a materialadverse effect on our profitability.There are a number of regulatory and legal changes that
are aimed at reducing the cost of motor insurance to con-sumers which will have an impact on Chaucer’s U.K.Division, including the Legal Aid and Sentencing ofOffenders Act (“LASPO”) 2012, the Competition Commis -sion inquiry in the U.K. Private Motor Insurance marketand the Department for Transport consultation onwhiplash claims. Of these three initiatives only LASPO iscurrently in effect and the U.K. Division has completed allnecessary steps to ensure that compliance with therequirements of the Act is achieved without any commer-cial disadvantages to the division. We do not yet know theimpact of the Competition Commission inquiry in the U.K.Private Motor Insurance market and the Department forTransport consultation on whiplash claims on Chaucer’sbusiness operations or the U.K. insurance industry.Additionally, the Lloyd’s worldwide insurance and rein-
surance business is subject to various regulations, laws,treaties and other applicable policies of the EuropeanUnion, as well as each nation, state and locality in whichit operates. Material changes in governmental require-ments and laws could have an adverse effect on Lloyd’s andits member companies, including Chaucer.The European Union (“E.U.”) is phasing in a new com-
posite E.U. directive (known as Solvency II) covering theprudential supervision of all insurance and reinsurancecompanies that is being developed to replace the existinglife insurance, non-life insurance and reinsurance direc-tives that govern the insurance business in the U.K.(among various other obligations, Solvency II will imposenew capital requirements on Chaucer). It is estimated thatthe implementation of Solvency II will take effect during2016, but it is possible some rules will come into force

| THE HANOVER INSURANCE GROUP 2013 ANNUAL REPORT28
earlier. We could be impacted by the implementation ofSolvency II, depending on the costs associated with imple-mentation by each E.U. country, any increased capitalrequirements applicable to us, and any costs associatedwith adjustments to our operations. We are also subject torisks and uncertainties relating to changes to the regulato-ry framework in the U.K. with the recent introduction ofthe PRA and FCA. We anticipate new conduct require-ments to develop over the next twelve months.From time to time, we are also involved in investigations
and proceedings by U.S., U.K., state and other governmen-tal and self-regulatory agencies. We cannot provide assur-ance that these investigations, proceedings and inquirieswill not result in actions that would adversely affect ourresults of operations or financial condition.
As a specialist in Lloyd’s insurance group, Chaucer is subjectto a number of risks which could materially and adverselyaffect us.
As a specialist in Lloyd’s insurance group, Chaucer issubject to a number of specific risk factors and uncertain-ties, including without limitation:• its reliance on insurance and reinsurance brokers anddistribution channels to distribute and market its prod-ucts (so called “coverholders”);
• its obligations to maintain funds at Lloyd’s to support itsunderwriting activities; its risk-based capital require-ment being assessed periodically by Lloyd’s and beingsubject to variation;
• its reliance on ongoing approvals from Lloyd’s, the PRAand FCA and other regulators to conduct its business,including a requirement that its Annual Business Planbe approved by Lloyd’s before the start of underwritingfor each account year;
• its obligations to contribute to the Lloyd’s Central Fundand pay levies to Lloyd’s;
• its financial strength rating is derived from the ratingassigned to Lloyd’s, and Chaucer has very limited abili-ty to directly affect the overall Lloyd’s rating;
• its ongoing ability to utilize Lloyd’s trading licenses inorder to underwrite business outside the UnitedKingdom;
• its ongoing exposure to levies and charges in order tounderwrite at Lloyd’s; and
• the requirement to maintain deposits in the UnitedStates for U.S. site risks it underwrites.
Whenever a member of Lloyd’s is unable to pay its pol-icyholder obligations, such obligations may be payable bythe Lloyd’s Central Fund. If Lloyd’s determines that theCentral Fund needs to be increased, it has the power toassess premium levies on current Lloyd’s members up to3% of a member’s underwriting capacity in any one year.We do not believe that any assessment is likely in the fore-
seeable future and have not provided allowance for suchan assessment. However, based on our 2014 estimatedunderwriting capacity at Lloyd’s of £878.0 million, theDecember 31, 2013 exchange rate of 1.66 dollars per GBPand assuming the maximum 3% assessment, we could beassessed up to approximately $43.6 million in 2014.
We are subject to litigation risks, including risks relating tothe application and interpretation of contracts, and adverseoutcomes in litigation and legal proceedings could adverse-ly affect our results of operations and financial condition.
We are subject to litigation risks, including risks relatingto the application and interpretation of insurance and rein-surance contracts, and are routinely involved in litigationthat challenges specific terms and language incorporatedinto property and casualty contracts, such as claims reim-bursements, covered perils and exclusion clauses, amongothers, or the interpretation or administration of such con-tracts. We are also involved in legal actions that do notarise in the ordinary course of business, some of whichassert claims for substantial amounts. Adverse outcomes,including with respect to the matter captioned “DurandLitigation” under “Commitments and Contingencies –Legal Proceedings” in Note 18 in the Notes to theConsolidated Financial Statements included in FinancialStatements and Supplementary Data of this Form 10-K,could materially affect our results of operations and finan-cial condition.
We are subject to mandatory assessments by state guarantyfunds; an increase in these assessments could adverselyaffect our results of operations and financial condition.
All fifty states of the United States and the District ofColumbia have insurance guaranty fund laws requiringproperty and casualty insurance companies doing businesswithin the state to participate in guaranty associations.These associations are organized to pay contractual obliga-tions under insurance policies issued by impaired or insol-vent insurance companies. The associations levyassessments, up to prescribed limits, on all member insur-ers in a particular state on the basis of the proportionateshare of the premiums written by member insurers in thelines of business in which the impaired or insolvent insur-er is engaged. Although mandatory assessments by stateguaranty funds that are used to cover losses to policyhold-ers of insolvent or rehabilitated companies can be substan-tially recovered through policyholder surcharges or areduction in future premium taxes in many states (provid-ed the collecting insurer continues to write business insuch state), there can be no assurance that all funds willbe recoupable in the future. During 2013, we had a totalassessment of $6.0 million levied against us, with refundsof $0.4 million received in 2013 for a total net assessmentof $5.6 million. As of December 31, 2013, we have $0.7million of reserves related to guaranty fund assessments.

THE HANOVER INSURANCE GROUP 2013 ANNUAL REPORT | 29
In the future, these assessments may increase above levelsexperienced in the current and prior years. Future increas-es in these assessments depend upon the rate of insolven-cies of insurance companies. An increase in assessmentscould adversely affect our results of operations and finan-cial condition.
If we are unable to attract and retain qualified personnel,or if we experience the loss or retirement of key executivesor other key employees, we may not be able to competeeffectively and our operations could be impacted significantly.
Our future success will be affected by our continuedability to attract and retain qualified executives and otherkey employees, particularly those experienced in the prop-erty and casualty industry and the Lloyd’s market.
Our profitability could be adversely affected by periodicchanges to our relationships with our agencies.
We periodically review agencies, including managinggeneral agencies, with which we do business to identifythose that do not meet our profitability standards or arenot strategically aligned with our business. Following theseperiodic reviews, we may restrict such agencies’ access tocertain types of policies or terminate our relationship withthem, subject to applicable contractual and regulatoryrequirements which limit our ability to terminate agents orwhich require us to renew policies. We may not achievethe desired results from these measures, and our failure todo so could negatively affect our operating results andfinancial position.
We may be affected by disruptions caused by the introduc-tion of new products, related technology changes, and newoperating models in Commercial Lines, Personal Lines andChaucer businesses and recent or future acquisitions, andexpansion into new geographic areas. We could also beaffected by an inability to retain profitable policies in forceand attract profitable policies in our Commercial Lines,Personal Lines and Chaucer segments, particularly in lightof a competitive product pricing environment and theadoption by competitors of strategies to increase agencyappointments and commissions and increased advertising.
There are increased underwriting risks associated withpremium growth and the introduction of new products orprograms in our Commercial Lines, Personal Lines andChaucer businesses. Additionally, we have increasedunderwriting risks associated with the appointment of newagencies and managing general agencies and with theexpansion into new geographical areas, including interna-tional expansion.The introduction of new Commercial Lines products,
including through our acquired subsidiaries and the devel-opment of new niche and specialty lines, presents new
risks. Certain new specialty products may present longer“tail” risks and increased volatility in profitability. Ourexpansion into western states, including California, pres-ents additional underwriting risks since the regulatory, geo-graphic, natural risk, legal environment, demographic,business, economic and other characteristics of thesestates present challenges different from those in the statesin which we historically have conducted business.Our Personal Lines production and earnings may be
unfavorably affected by the continued introduction of newproducts and our focus on account business (i.e., policy-holders who have both automobile and homeowner insur-ance with us) which we believe, despite pricing discounts,will ultimately be more profitable business. We may alsoexperience adverse selection, which occurs when insuredswith larger risks purchase our products because of favor-able pricing, under-pricing, operational difficulties orimplementation impediments with independent agents orthe inability to grow new markets after the introduction ofnew products or the appointment of new agents.There can be no assurance that as we enter new states
or regions or grow business in our identified growth states,we won’t experience higher loss trends than anticipated.
Integration of acquired businesses involves a number ofrisks and there can be no assurance that we will be success-ful integrating recent and future acquisitions.
There can be no assurance that we will be able to suc-cessfully integrate recent and any future acquisitions orthat we will not assume unknown liabilities and reservedeficiencies in connection with such acquisitions. If weare unable to successfully integrate new businesses, thenwe could be impeded from realizing the benefits of anacquisition. The integration process could disrupt ourbusiness and a failure to successfully integrate newer busi-nesses could have a material adverse effect on our busi-ness, financial condition and results of operations. Thedifficulties of integrating an acquisition and risks to ourbusiness include, among others:• unanticipated issues in integrating information, com-munications and other systems;
• unanticipated incompatibility of logistics, marketing andadministration methods;
• maintaining employee morale and retaining keyemployees;
• integrating the business cultures of different companies;
• preserving important strategic, reinsurance and otherrelationships;
• integrating legal and financial controls in multiple jurisdictions;
• consolidating corporate and administrative infrastruc-tures and eliminating duplicative operations;

| THE HANOVER INSURANCE GROUP 2013 ANNUAL REPORT30
• the diversion of management’s attention from ongoingbusiness concerns;
• integrating geographically separate organizations;
• unexpected or overlapping concentrations of risk whereone event or series of events can affect many insuredparties;
• significant transaction costs, including the effect ofexchange rate fluctuations;
• risks and uncertainties in our ability to increase theinvestment yield on the investment portfolio;
• uncertainties in our ability to decrease leverage as aresult of adding future earnings to our capital base;
• risks and uncertainties regarding the volatility of under-writing results in a combined entity;
• an ability to more efficiently manage capital;
• an ability to improve renewal rates and increase newproperty and casualty policy counts;
• an ability to increase or maintain certain property andcasualty insurance rates;
• complying with laws, rules and regulations in multiplejurisdictions, including new and multiple employmentregulations, regulations relating to the conduct of busi-ness activities such as the U.K. Bribery Act, sanctionsimposed by the U.S. or U.K. on doing business with cer-tain foreign countries or other persons, privacy, infor-mation security, and environmental-related laws; and
• the impact of new product or line of business introduc-tions and our ability to meet projected return on capitaltargets.
In addition, even if we are able to integrate successful-ly recent and future acquisitions, we may not realize thefull benefits of such acquisitions, including the synergies,cost savings or underwriting or growth opportunities thatwe expect. It is possible that these benefits may not beachieved within the anticipated time frame, or at all.
Our international operations expose us to additional riskswhich could cause a material adverse effect on our busi-ness, financial position and results of operations.
Our operations extend to countries outside the U.S. andoperating globally increases the scope of our risks andexposes us to certain additional risks including but not lim-ited to:• an expansion in the scope of the risks to which our U.S.operations are subject as an insurance company, such asrisk of adverse loss development, litigation, investmentrisks and the possibility of significant catastrophe losses(as a result of natural disasters, nuclear accidents,severe weather and terrorism) occurring outside theU.S.;
• compliance with a variety of national and local laws,regulations and practices of the countries in which wedo business and adherence to any changes in such laws,regulations and practices affecting the insurance indus-try in such countries;
• adverse changes in the economies in which we operate;and
• requirements, such as those enforced by Her Majesty’sTreasury, Asset Freezing Unit (U.K.) and the U.S.Treasury’s Office of Foreign Asset Controls, to complywith various U.K., U.S., E.U. or other sanctionsimposed on doing business with, or affecting, certaincountries, their citizens, specially designated nationalsor other persons doing business with any such countriesor persons.
Intense competition could negatively affect our ability tomaintain or increase our profitability.
We compete, and will continue to compete, with a largenumber of companies, including international, nationaland regional insurers, mutual companies, specialty insur-ance companies, so called “off-shore” companies whichenjoy certain tax advantages, underwriting agencies andfinancial services institutions. We also compete with mutu-al insurance companies, reciprocal and exchange compa-nies which may not have shareholders and may havedifferent profitability targets than publicly or privatelyowned companies. Chaucer competes with numerousother Lloyd’s syndicates and managing agents, domesticand international insurers and government or government-sponsored insurance or reinsurance mechanisms. In recentyears, there has been substantial consolidation and conver-gence among companies in the financial services industry,resulting in increased competition from large, well-capital-ized financial services firms. Many of our competitors havegreater financial, technical and operating resources thanwe do and may be able to offer a wider range of, or moresophisticated, commercial and personal line products.Some of our competitors also have different marketing andsales strategies than we do and market and sell their prod-ucts to consumers directly. Some companies are seeking toprotect new products with patents or other legal protec-tions, which may create new legal exposures or limit ourability to develop competing products. In addition, compe-tition in the U.S. and international property and casualtyinsurance markets has intensified over the past severalyears. This competition has had and may continue to havean adverse impact on our revenues and profitability.

THE HANOVER INSURANCE GROUP 2013 ANNUAL REPORT | 31
A number of new, proposed or potential legislative orindustry developments could further increase competitionin our industry. These developments include:• the implementation of commercial lines deregulation inseveral states;
• programs in which state-sponsored entities provideproperty insurance in catastrophe-prone areas or otheralternative markets types of coverage;
• changes in, or restrictions on, the way independentagents may be compensated by insurance companies;
• increased competition from off-shore tax advantagedinsurance companies; and
• changing practices caused by the internet and theincreased usage of real time comparative rating tools,which have led to greater competition in the insurancebusiness in general, particularly on the basis of price.
In addition, we could face heightened competitionresulting from the entry of new competitors and the intro-duction of new products by new and existing competitors.Increased competition could make it difficult for us toobtain new customers, retain existing customers or main-tain policies in force by existing customers. It could alsoresult in increasing our service, administrative, policyacquisition or general expense due to the need for addi-tional advertising and marketing of our products. In addi-tion, our administrative, technology and managementinformation systems expenditures could increase substan-tially as we try to maintain or improve our competitiveposition. We cannot provide assurance that we will be ableto maintain a competitive position in the markets in whichwe operate, or that we will be able to expand our opera-tions into new markets. If we fail to do so, our businesscould be materially adversely affected.
We are rated by several rating agencies, and changes to ourratings could adversely affect our operations.
Our ratings are important in establishing our competi-tive position and marketing the products of our insurancecompanies to our agents and customers, since rating infor-mation is broadly disseminated and generally usedthroughout the industry.Our insurance company subsidiaries are rated by A.M.
Best, Moody’s, and Standard & Poor’s. These ratingsreflect a rating agency’s opinion of our insurance sub-sidiaries’ financial strength, operating performance, strate-gic position and ability to meet their obligations topolicyholders. These ratings are not evaluations directed toinvestors, and are not recommendations to buy, sell or holdour securities. Our ratings are subject to periodic review bythe rating agencies and we cannot guarantee the continuedretention or improvement of our current ratings. This is
particularly true in the current economic environmentwhere rating agencies may increase their capital require-ments or other criteria for various rating levels. In addi-tion, Chaucer’s rating is derived from the rating assigned toLloyd’s, and Chaucer has very limited ability to directlyaffect the overall Lloyd’s rating.A downgrade in one or more of our or any of our sub-
sidiaries’ claims-paying ratings could negatively impact ourbusiness and competitive position, particularly in lineswhere customers require us to maintain minimum ratings.Additionally, a downgrade in one or more of our debt rat-ings could adversely impact our ability to access the capi-tal markets and other sources of funds, increase the cost ofcurrent credit facilities, and/or adversely affect pricing ofnew debt sought in the capital markets in the future.
Negative changes in our level of statutory surplus couldadversely affect our ratings and profitability.
The capacity for a U.S. insurance company’s growth inpremiums is in part a function of its statutory surplus.Maintaining appropriate levels of statutory surplus, asmeasured by state insurance regulators, is consideredimportant by state insurance regulatory authorities and byrating agencies that rate insurers’ claims-paying abilitiesand financial strength. As our business grows, or due toother factors, regulators may require that additional capi-tal be contributed to increase the level of statutory surplus.Failure to maintain certain levels of statutory surplus couldresult in increased regulatory scrutiny, action by state reg-ulatory authorities or a downgrade by private rating agen-cies. Our surplus is affected by, among other things, resultsof operations and investment gains, losses, impairments,and dividends from the insurance operating company to itsparent company. A number of these factors affecting ourlevel of statutory surplus are, in turn, influenced by factorsthat are out of our control, including the frequency andseverity of catastrophes, changes in policyholder behavior,changes in rating agency models and economic factorssuch as changes in equity markets, credit markets, interestrates or foreign currency exchange rates.The National Association of Insurance Commissioners,
or NAIC, uses a system for assessing the adequacy of statu-tory capital for U.S. property and casualty insurers. Thesystem, known as risk-based capital, is in addition to thestates’ fixed dollar minimum capital and other require-ments. The system is based on risk-based formulas thatapply prescribed factors to the various risk elements in aninsurer’s business and investments to report a minimumcapital requirement proportional to the amount of riskassumed by the insurer. We believe that any failure tomaintain appropriate levels of statutory surplus would havean adverse impact on our ability to grow our business profitably.

| THE HANOVER INSURANCE GROUP 2013 ANNUAL REPORT32
We may not be able to grow as quickly or as profitably aswe intend, which is important to our current strategy.
Over the past several years, we have made and our cur-rent plans are to continue to make, significant investmentsin our Commercial and Personal Lines of business, and wehave increased expenses and made acquisitions in order to,among other things, strengthen our product offerings andservice capabilities, expand into new geographic areas,improve technology and our operating models, buildexpertise in our personnel, and expand our distributioncapabilities, with the ultimate goal of achieving significant,sustained growth. The ability to achieve significant prof-itable premium growth in order to earn adequate returnson such investments and expenses, and to grow furtherwithout proportionate increases in expenses, is an impor-tant part of our current strategy. There can be no assur-ance that we will be successful at profitably growing ourbusiness, or that we will not alter our current strategy dueto changes in our markets or an inability to successfullymaintain acceptable margins on new business or for otherreasons, in which case premiums written and earned, oper-ating income and net book value could be adversely affected.
An impairment in the carrying value of goodwill andintangible assets could negatively impact our consolidatedresults of operations and shareholders’ equity.
Upon an acquisition of a business, we record goodwilland intangible assets at fair value. Goodwill and intangibleassets determined to have indefinite useful lives are notamortized, while other intangible assets are amortized overtheir estimated useful lives. Goodwill and intangible assetsthat are not amortized are reviewed for impairment at leastannually. Evaluating the recoverability of such assetsrequires us to rely on estimates and assumptions related toreturn on equity, margin, growth rates, discount rates, andother data. There are inherent uncertainties related tothese factors, and significant judgment is required inapplying these factors. Goodwill and intangible assetimpairment charges can result from declines in operatingresults, divestitures or sustained market declines and otherfactors. As of December 31, 2013, goodwill and intangibleassets represented 12.1% of shareholders’ equity. Althoughwe believe these assets are recoverable, we cannot provideassurance that future market or business conditions wouldnot result in the impairment of a portion of these assets.Impairment charges could materially affect our financialposition and our financial results in the quarter or annualperiod in which they are recognized.
We could be subject to additional losses related to the saleof our Discontinued FAFLIC and variable life insuranceand annuity businesses.
On January 2, 2009, we sold our remaining life insur-ance subsidiary, FAFLIC, to Commonwealth Annuity andLife Insurance Company, a subsidiary of Goldman Sachs.Coincident with the sale transaction, Hanover Insuranceand FAFLIC entered into a reinsurance contract wherebyHanover Insurance assumed FAFLIC’s discontinued acci-dent and health insurance business. Goldman Sachs previ-ously purchased, in 2005, our variable life insurance andannuity business.In connection with these transactions, we have agreed
to indemnify Commonwealth Annuity and Goldman Sachsfor certain contingent liabilities, including litigation andother regulatory matters. We have established a reserverelated to these contractual indemnifications. Although webelieve that this reserve is adequate, we cannot provideassurance that costs related to these indemnificationswhen they ultimately settle, will not exceed our currentreserve.
We may incur financial losses related to our discontinuedassumed accident and health reinsurance pools andarrangements.
We previously participated, through FAFLIC, in approx-imately 40 assumed accident and health reinsurance poolsand arrangements. The business was retained in the sale ofFAFLIC and assumed by Hanover Insurance through areinsurance agreement. During 1999, we ceased writingnew premiums in this business, subject to certain contrac-tual obligations. The reinsurance pool business consistedprimarily of the medical and disability portions of workers’compensation risks, long-term care pools, assumed person-al accident, individual medical, long-term disability andspecial risk business. We are currently monitoring andmanaging the run-off of our related participation in the 25pools with remaining liabilities.Under these arrangements, we variously acted as a rein-
surer, a reinsured or both. In some instances, we ceded sig-nificant exposures to other reinsurers in the marketplace.The potential risk to us as a participant in these pools isprimarily that other companies that reinsured this businessfrom us may seek to avoid or fail to timely pay their rein-surance obligations (especially in light of the fact that his-torically these pools sometimes involved multiple layers ofoverlapping reinsurers, or so-called “spirals”) or maybecome insolvent. Thus, we are exposed to both assumedlosses and to credit risk related to these pools. We are notcurrently engaged in any significant disputes in respect tothis business. At this time, we do not anticipate that anysignificant portion of recorded reinsurance recoverableswill be uncollectible. However, we cannot provide assur-

THE HANOVER INSURANCE GROUP 2013 ANNUAL REPORT | 33
ance that all recoverables are collectible and should theserecoverables prove to be uncollectible, our results of oper-ations and financial position may be negatively affected.We believe our reserves for the accident and health
assumed and ceded reinsurance business appropriatelyreflect current claims, unreported losses and likely invest-ment returns on related assets supporting these reserves.However, due to the inherent volatility in this business andthe reporting lag of losses that tend to develop over timeand which ultimately affect excess covers, there can be noassurance that current reserves are adequate or that wewill not have additional losses in the future. Although wehave discontinued participation in these reinsurancearrangements, unreported claims related to the years inwhich we were a participant may be reported and previous-ly reported claims may develop unfavorably. If any suchunreported claims or unfavorable development is reportedto us, our results of operations and financial position maybe negatively impacted. In addition, at this time it isunclear what impact the Federal Healthcare Act has on ourobligations under the residual healthcare policies whichare outstanding, but we may be required to significantlyexpand benefits without a commensurate ability toincrease premiums.
Other market fluctuations and general economic, marketand political conditions may also negatively affect ourbusiness, profitability and investment portfolio.
It is difficult to predict the impact of a challenging eco-nomic environment on our business. In Commercial Lines,a difficult economy has resulted in reductions in demandfor insurance products and services as there are more com-panies ceasing to do business and there are fewer businessstart-ups, particularly as small businesses are affected by adecline in overall consumer and business spending.Additionally, claims frequency could increase as policy-holders submit and pursue claims more aggressively thanin the past, fraud incidences may increase, or we may expe-rience higher incidents of abandoned properties or poorermaintenance, which may also result in more claims activi-ty. We have experienced higher workers’ compensationclaims as injured employees take longer to return to work,increased surety losses as construction companies experi-ence financial pressures and higher retroactive premiumreturns as audit results reflect lower payrolls. Our businesscould also be affected by an ensuing consolidation of inde-pendent insurance agencies. Our ability to increase pricinghas been impacted as agents and policyholders have beenmore price sensitive, customers shop for policies more fre-quently or aggressively, utilize comparative rating modelsor, in Personal Lines in particular, turn to direct saleschannels rather than independent agents. We have alsoexperienced decreased new business premium levels,
retention and renewal rates, and renewal premiums.Specifically in Personal Lines, policyholders may reducecoverages or change deductibles to reduce premiums,experience declining home values, or be subject toincreased foreclosures, and policyholders may retain olderor less expensive automobiles and purchase or insure fewerancillary items such as boats, trailers and motor homes forwhich we provide coverages. Additionally, if as a result of adifficult economic environment, drivers continue to elimi-nate automobile insurance coverage or to reduce their bod-ily injury limit, we may be exposed to more uninsured andunderinsured motorist coverage losses.Chaucer’s business is similarly subject to risks related to
the economy, both in its traditional Lloyd’s business, andits U.K. motor business. In addition to the risks notedabove, adverse economic conditions could negatively affectour ability to obtain letters of credit utilized by Chaucer tounderwrite business through Lloyd’s.At December 31, 2013, we held approximately $8 bil-
lion of investment assets in categories such as fixed matu-rities, cash and short-term investments, equity securities,and other long-term investments. Our investments are pri-marily concentrated in the U.S. domestic market; however,we have exposure to international markets as well, withapproximately 28% of our cash and investment assetsinvested in foreign markets. Our investment returns, andthus our profitability, statutory surplus and shareholders’equity, may be adversely affected from time to time by con-ditions affecting our specific investments and, more gener-ally, by bond, stock, real estate and other marketfluctuations and general economic, market and politicalconditions, including concerns regarding sub-prime andprime mortgages, as well as residential and commercialmortgage-backed or other debt securities, increasing con-cerns relating to the municipal bond markets andEuropean sovereign debt, and developments that negative-ly impact our investment in real estate such as increaseddevelopment costs. Many of these broader market condi-tions are out of our control. Our ability to make a profit oninsurance products depends in part on the returns oninvestments supporting our obligations under these prod-ucts, and the value of specific investments may fluctuatesubstantially depending on the foregoing conditions. Wemay use a variety of strategies to hedge our exposure tointerest and currency rates and other market risks. How -ever, hedging strategies are not always available and carrycertain credit risks, and our hedging could be ineffective.Additionally, the aggregate performance of our invest-
ment portfolio depends to a significant extent on the abili-ty of our investment managers to select and manageappropriate investments. As a result, we are also exposed tooperational risks which may include, but are not limited to,

| THE HANOVER INSURANCE GROUP 2013 ANNUAL REPORT34
a failure to follow our investment guidelines, technologicaland staffing deficiencies and inadequate disaster recoveryplans. The failure of these investment managers to performtheir services in a manner consistent with our expectationsand investment objectives could adversely affect our abili-ty to conduct our business.Debt securities comprise a material portion of our
investment portfolio. The concentration of our investmentportfolio in any one type of investment, industry or geogra-phy could have a disproportionately adverse effect on ourinvestment portfolio. The issuers of debt securities, as wellas borrowers under the loans we make, customers, tradingcounterparties, counterparties under swaps and otherderivative contracts, banks which have commitmentsunder our various borrowing arrangements, and reinsurers,may be affected by declining market conditions or creditweaknesses. These parties may default on their obligationsto us due to lack of liquidity, downturns in the economy orreal estate values, operational failure, bankruptcy or otherreasons. Future increases in interest rates from currentnear-historic lows could result in increased defaults as bor-rowers are unable to pay the additional borrowing costs onvariable rate securities or obtain refinancing. We cannotassure you that further impairment charges will not benecessary in the future. In addition, evaluation of avail-able-for-sale securities for other-than- temporary impair-ment includes inherent uncertainty and subjectivedeterminations. We cannot be certain that such impair-ments are adequate as of any stated date. Our ability to ful-fill our debt and other obligations could be adverselyaffected by the default of third parties on their obligationsowed to us.Deterioration in the global financial markets may
adversely affect our investment portfolio and have a relat-ed impact on our other comprehensive income, sharehold-ers’ equity and overall investment performance. In recentyears, global financial markets experienced unprecedentedand challenging conditions, including a tightening in theavailability of credit, the failure of several large financialinstitutions and concerns about the creditworthiness ofthe sovereign debt of several European and other coun-tries. As a result, certain government bodies and centralbanks worldwide, including the U.S. Treasury Departmentand the U.S. Federal Reserve, provided for unprecedentedintervention programs, the efficacy of which remainuncertain.In addition, our current borrowings from the FHLBB
are secured by collateral. If the fair value of pledged collat-eral falls below specific levels, we would be required topledge additional collateral or repay any outstandingFHLBB borrowings.
Market conditions also affect the value of assets underour employee pension plans, including our U.S. CashBalance Plan and Chaucer pension plan. The expense orbenefit related to our employee pension plans results fromseveral factors, including changes in the market value ofplan assets, interest rates, regulatory requirements or judi-cial interpretation of benefits. For the year endedDecember 31, 2013, we recognized net expenses ofapproximately $13 million related to our employee pensionplans. At December 31, 2013, our U.S. plan assets includ-ed approximately 84% of fixed maturities and 16% of equi-ty securities and other assets. At December 31, 2013, ourChaucer pension plan assets included approximately 74%of equities, 19% of fixed maturities, and 7% of real estatefunds. The Chaucer pension plan had net liabilities thatexceeded assets by approximately $8 million as ofDecember 31, 2013. Additionally our net liabilities exceedassets by approximately $37 million and $7 million for ourU.S. non-qualified and U.S. qualified pension plans,respectively, at December 31, 2013. Declines in the mar-ket value of plan assets and interest rates from levels atDecember 31, 2013, among other factors, could impactour funding estimates and negatively affect our results ofoperations. Deterioration in market conditions and differ-ences between our assumptions and actual occurrences,and behaviors, including judicial determinations of ulti-mate benefit obligations pursuant to the Durand case dis-cussed elsewhere, or otherwise, could result in a need tofund more into the qualified plans to maintain an appro-priate funding level.
We may experience unrealized losses on our investments,especially during a period of heightened volatility, whichcould have a material adverse effect on our results of oper-ations or financial condition.
Our investment portfolio and shareholders’ equity canbe, and in the past have been, significantly impacted by thechanges in the market values of our securities. U.S. andglobal financial markets and economies remain uncertain.This could result in unrealized and realized losses in futureperiods, and adversely affect the liquidity of our invest-ments, which could have a material adverse impact on ourresults of operations and our financial position. AtDecember 31, 2013, our financial position is benefited by$219.1 million as a result of unrealized gains, largely driv-en by the low interest rate environment. Information withrespect to interest rate sensitivity is included in“Quantitative and Qualitative Disclosures” inManagement’s Discussion and Analysis of FinancialCondition and Results of Operations of this Form 10-K.Valuation of financial instruments (i.e. Level 1, 2, or 3)include methodologies, estimates, assumptions and judg-

THE HANOVER INSURANCE GROUP 2013 ANNUAL REPORT | 35
ments that are subject to different interpretations andcould result in changes to investment valuations or theability to receive such valuations on sale. During periods ofmarket disruption it may be difficult to value certain of oursecurities if trading becomes less frequent and/or marketdata becomes less observable. In addition, in times offinancial market disruption, certain asset classes that werein active markets with significant observable data maybecome illiquid. In those cases, the valuation processincludes inputs that are less observable and require moresubjectivity and judgment by management.If, following such declines, we are unable to hold our
investment assets until they recover in value, or if suchasset value never recovers, we would incur other-than-tem-porary impairments which would be recognized as realizedlosses in our results of operations, reduce net income andearnings per share and adversely affect our liquidity.Temporary declines in market value are recorded as unre-alized losses, which do not affect net income and earningsper share, but reduce other comprehensive income, whichis reflected on our Consolidated Balance Sheets. We can-not provide assurance that we will not have additionalother-than-temporary impairments and/or unrealizedinvestment losses in the future. Likewise, there can be noassurance that our investment portfolio will retain the netunrealized gains reflected on the balance sheet as ofDecember 31, 2013, since such gains are dependent onprevailing interest rates, credit ratings and creditworthi-ness and general economic and other factors.We invest a portion of our portfolio in common stock or
preferred stocks. The value of these assets fluctuates withthe equity markets. Particularly in times of economicweakness, the market value and liquidity of these assetsmay decline, and may impact net income, capital and cashflows.
We are exposed to significant capital market risks relatedto changes in interest rates, credit spreads, equity pricesand foreign exchange rates, which may adversely affect ourresults of operations, financial position or cash flows.
We are exposed to significant capital markets risk relat-ed to changes in interest rates, credit spreads, equity pricesand foreign currency exchange rates. If significant,declines in equity prices, changes in interest rates, changesin credit spreads and the strengthening or weakening offoreign currencies against the U.S. dollar could have amaterial adverse effect on our results, financial position orcash flows. Our exposure to interest rate risk relates prima-rily to the market price and cash flow variability associatedwith changes in interest rates. Our investment portfoliocontains interest rate sensitive instruments, such as fixedincome securities, which may be adversely affected by
changes in interest rates from governmental monetary poli-cies, domestic and international economic and politicalconditions and other factors beyond our control. A rise ininterest rates would reduce the fair value of our investmentportfolio, but provide the opportunity to earn higher ratesof return on funds reinvested. A further decline in interestrates, on the other hand, would increase the fair value ofour investment portfolio, but we would earn lower rates ofreturn on reinvested assets. We may be forced to liquidateinvestments prior to maturity at a loss in order to cover lia-bilities and such liquidation could be accelerated in theevent of significant loss events, such as catastrophes.Although we take measures to manage the economic risksof investing in a changing interest rate environment, wemay not be able to mitigate the interest rate risk of ourassets relative to our liabilities.Our fixed income portfolio is invested primarily in high
quality, investment-grade securities. However, we alsoinvest in alternative investments such as non-investment-grade high yield fixed income securities. These securities,which pay a higher rate of interest, also have a higherdegree of credit or default risk. These securities may alsobe less liquid in times of economic weakness or market dis-ruptions. Additionally, the reported value of our invest-ments do not necessarily reflect the lowest current marketprice for the asset, and if we require significant amounts ofcash on short notice, we may have difficulty selling ourinvestments in a timely manner, be forced to sell them forless than we otherwise would have been able to realize, orboth. While we have procedures to monitor the credit riskand liquidity of our invested assets, we expect from time totime, and particularly in periods of economic weakness, toexperience default losses in our portfolio. This wouldresult in a corresponding reduction of net income, capitaland cash flows.
Inflationary pressures may negatively impact expenses,reserves and the value of investments.
Inflationary pressures in the geographies in which weoperate may negatively impact reserves and the value ofinvestments. In particular, inflationary pressures in theU.S. with respect to medical and health care, automobilerepair and construction costs, all of which are significantcomponents of our indemnity liabilities under policies weissue to our customers, and which could also impact theadequacy of reserves we have set aside for prior accidentyears, may have a negative effect on our results of opera-tions. Inflationary pressures also cause or contribute to, orare the result of, increases in interest rates, which wouldreduce the fair value of our investment portfolio.

| THE HANOVER INSURANCE GROUP 2013 ANNUAL REPORT36
Our operations may be adversely impacted by foreign cur-rency fluctuations.
Our reporting currency is the U.S. dollar. The function-al currencies of our Chaucer segment are the U.S. dollar,U.K. pound sterling and the Canadian dollar. Exchangerate fluctuations relative to the functional currencies maymaterially impact our financial position. Further, ourChaucer segment maintains assets and liabilities in cur-rencies different than its functional currency, which expos-es us to changes in currency exchange rates. In addition,locally required capital levels are invested in local curren-cies in order to satisfy regulatory requirements and to sup-port local insurance operations regardless of currencyfluctuations. We attempt to manage our foreign currencyexposure through matching of assets and liabilities, as wellas through the use of derivatives. Despite our mitigationefforts, exposure to foreign exchange loss could have amaterial adverse effect on our reported earnings and bookvalue.
We are a holding company and rely on our insurance com-pany subsidiaries for cash flow; we may not be able toreceive dividends from our subsidiaries in needed amountsand may be required to provide capital to support theiroperations.
We are a holding company for a diversified group ofinsurance companies, and our principal assets are theshares of capital stock of these subsidiaries. Our ability tomake required interest payments on our debt, as well asour ability to pay operating expenses and pay dividends toshareholders depends upon the receipt of sufficient fundsfrom our subsidiaries. The payment of dividends by ourinsurance company subsidiaries is subject to regulatoryrestrictions and will depend on the surplus and futureearnings of these subsidiaries, as well as these regulatoryrestrictions. We are required to notify insurance regulatorsprior to paying any dividends from our U.S. insurance sub-sidiaries and pre-approval is required with respect to“extraordinary dividends”, and distributions from Chaucerare subject to various requirements imposed by Lloyd’s andthe PRA and FCA.Because of the regulatory limitations on the payment of
dividends from our insurance company subsidiaries, wemay not always be able to receive dividends from thesesubsidiaries at times and in amounts necessary to meet ourdebt and other obligations. The inability of our subsidiariesto pay dividends to us in an amount sufficient to meet ourdebt interest and funding obligations would have a materi-al adverse effect on us. These regulatory dividend restric-tions also impede our ability to transfer cash and othercapital resources among our subsidiaries.Similarly, our insurance subsidiaries may require capital
from the holding company to support their operations. Forexample, our holding company has provided a guaranty for
the benefit of our Chaucer segment to support the letter ofcredit agreement supplied to support Chaucer’s Funds atLloyd’s requirements.Our dependence on our insurance subsidiaries for cash
flow, and their potential need for capital support, exposesus to the risk of changes in their ability to generate suffi-cient cash inflows from new or existing customers or fromincreased cash outflows. Cash outflows may result fromclaims activity, expense payments or investment losses.Because of the nature of our business, claims activity canarise suddenly and in amounts which could outstrip ourcapital or liquidity resources. Reductions in cash flow orcapital demands from our subsidiaries could have a materi-al adverse effect on our business and results of operations.
We may require additional capital or credit in the future,which may not be available or only available on unfavor-able terms.
We monitor our capital adequacy on a regular basis.Our future capital and liquidity requirements depend onmany factors, including our premiums written, lossreserves and claim payments, investment portfolio compo-sition and risk exposures, the availability of letters andlines of credit, as well as regulatory and rating agency cap-ital requirements. In addition, our capital strength canaffect our ratings, and therefore is important to our abilityto underwrite. The quality of our claims paying and finan-cial strength ratings are evaluated by independent ratingagencies. Such ratings affect our ability to write qualitybusiness, our borrowing expenses and our ability to raisecapital.Our Chaucer business is required to satisfy Lloyd’s min-
imum capital standards. We satisfy Lloyd’s “memberdeposit funds” requirement (referred to as Funds at Lloyd’sor “FAL”), in part, through a standby letter of credit. If theletters of credit were drawn, we would expect to use a syn-dicated credit facility to pay such obligation, which wouldincrease our debt borrowings. Our ability to borrow underthis facility is conditioned upon the satisfaction ofcovenants and other requirements contained in the facili-ty. If the syndicated credit facility was not available torepay this letter of credit facility, we would need to obtaincapital elsewhere, and face the risk that alternative financ-ing, such as through cash or other borrowings, would notbe available at acceptable terms, if at all. In addition, noassurance can be given as to how much business Lloyd’swill permit Chaucer to underwrite in any single year nor asto the viability and cost of the capital structure we may useas a substitute for the external capital and reinsurance cur-rently used by Chaucer.To the extent that our existing capital is insufficient or
unavailable to fund our future operating requirementsand/or cover claim losses, we may need to raise additionalfunds through financings or limit our growth. Any equity or

THE HANOVER INSURANCE GROUP 2013 ANNUAL REPORT | 37
We may experience difficulties with technology, data secu-rity and/or outsourcing relationships, which could have anegative impact on our ability to conduct our business.
We use computer systems to store, retrieve, evaluateand utilize customer and company data and information.Our computer, information technology and telecommuni-cations systems, in turn, interface with and rely uponthird-party systems. Our business is highly dependent onour ability, and the ability of certain third parties, to accessthese systems to perform necessary business functions,including, without limitation, providing insurance quotes,processing premium payments, making changes to existingpolicies, filing and paying claims, providing customer sup-port and managing our investment portfolios. Systems fail-ures or outages could compromise our ability to performthese functions in a timely manner, which could harm ourability to conduct business and hurt our relationships withour business partners and customers. In the event of a dis-aster such as a natural catastrophe, an industrial accident,a blackout, a computer virus, a terrorist attack or war, orinterference from solar flares, our systems may be inacces-sible to our employees, customers or business partners foran extended period of time. Even if our employees are ableto report to work, they may be unable to perform theirduties for an extended period of time if our data or systemsare disabled or destroyed. This could result in a materiallyadverse effect on our business results and liquidity.Our systems, like others in the financial services indus-
try, are potentially vulnerable to cyber security risks, andwe are subject to potential disruption caused by such activ-ities. Large corporations such as ours are subject to neardaily attacks on their systems. Such attacks may have var-ious goals, from seeking confidential information to caus-ing operational disruption. Although to date such activitieshave not resulted in material disruptions to our operationsor, to our knowledge, breach of any security or confidentialinformation, no assurance can be provided that such dis-ruptions or breach will not occur in the future.Additionally, we could be subject to liability if confiden-
tial customer information is misappropriated from ourcomputer systems, those of our vendors or others withwhom we do business, or otherwise. Despite whateversecurity measures may be in place, any such systems maybe vulnerable to physical break-ins, computer viruses, pro-gramming errors, attacks by third parties or similar disrup-tive problems. Any well-publicized compromise of securitycould deter people from entering into transactions thatinvolve transmitting confidential information, which couldhave a material adverse effect on our business.We outsource certain technology and business process
functions to third parties and may do so increasingly in thefuture. If we do not effectively develop, implement andmonitor our outsourcing strategy, third party providers do
debt financing, if available, may be on terms that are unfa-vorable to us. In the case of equity financings, dilution toour shareholders could result and, in any case, such secu-rities may have rights, preferences, and privileges that aresenior to our common stock. If we are not able to obtainadditional capital as necessary, our business, results ofoperations and financial condition could be adverselyaffected.
Errors or omissions in connection with the administrationof any of our products may cause our business and prof-itability to be negatively impacted.
We are responsible to our policyholders for administer-ing their policies, premiums and claims and ensuring thatappropriate records are maintained which reflect theirtransactions. We are subject to risks that errors or omis-sions of information occurred with respect to the adminis-tration of our products. As a result, we are subject to risksof liabilities associated with “bad faith”, unfair claims prac-tices, unfair trade practices or similar allegations. Suchrisks may stem from allegations of agents, vendors, policy-holders, claimants, members of Lloyd’s syndicates, reinsur-ers, regulators, states’ attorneys general, Lloyd’s, the PRAand FCA, or other international regulators, or others. Wemay incur charges associated with any errors and omis-sions previously made or which are made in future periods.These charges may result from our obligation to policy-holders to correct any errors or omissions or refund premi-ums, non-compliance with regulatory requirements, fromfines imposed by regulatory authorities, or from otheritems, which may affect our financial position or results ofoperations.
We are subject to the U.S. Foreign Corrupt Practices Act,the U.K. Bribery Act and similar worldwide anti-briberylaws, which impose restrictions and may carry substantialpenalties. Violations of these laws or allegations of suchviolations could cause a material adverse effect on ourbusiness, financial position and results of operations.
The U.S. Foreign Corrupt Practices Act and anti-briberylaws in other jurisdictions, including anti-bribery legisla-tion in the U.K. that took effect in 2011, generally prohib-it companies and their intermediaries from makingimproper payments for the purpose of obtaining or retain-ing business or other commercial advantage. OurCompany policies mandate compliance with these anti-bribery laws, which often carry substantial penalties. Wecannot assure you that our internal control policies andprocedures always will protect us from reckless or otherinappropriate acts committed by our affiliates, employees,agents or coverholders. Violations of these laws, or allega-tions of such violations, could have a material adverseeffect on our business, financial position and results ofoperations.

| THE HANOVER INSURANCE GROUP 2013 ANNUAL REPORT38
not perform as anticipated or we experience technologicalor other problems with a transition, we may not realize pro-ductivity improvements or cost efficiencies and may expe-rience operational difficulties, increased costs and a loss ofbusiness. Our outsourcing of certain technology and busi-ness process functions to third parties may expose us toenhanced risk related to data security, which could resultin monetary and reputational damages. In addition, ourability to receive services from third party providers outsideof the United States might be impacted by cultural differ-ences, political instability, unanticipated regulatoryrequirements or policies inside or outside of the UnitedStates. As a result, our ability to conduct our businessmight be adversely affected.
Item 1B — Unresolved Staff CommentsNone.
Item 2 — PropertiesWe own our headquarters, located at 440 Lincoln Street,Worcester, Massachusetts, with approximately 919,000square feet.We also own office space located in a three-building
complex located at 808 North Highlander Way, Howell,Michigan, with approximately 176,000 square feet, wherevarious business operations are conducted, and officespace located at Thanet Way, Whitstable, United Kingdom,with approximately 40,000 square feet, where we operateour U.K. motor line of business. In 2013, we consolidatedthe business operations in Howell, Michigan. Accordingly,
approximately 108,000 square feet of owned office spacelocated at 645 W. Grand River in Howell, Michigan is nolonger required for our business operations. Certain of ourproperties have been leased to unrelated third parties orare available for lease.We lease office space located at 30 Fenchurch Street,
London, United Kingdom. We also lease offices through-out the United States and in select locations worldwide forbranch sales, underwriting and claims processing func-tions, and the operations of acquired subsidiaries.We believe that our facilities are adequate for our pres-
ent needs in all material respects.
Item 3 — Legal ProceedingsReference is made to the litigation matter captioned“Durand Litigation” under “Commitments andContingencies – Legal Proceedings” in the Notes toConsolidated Financial Statements included in FinancialStatements and Supplementary Data of this Form 10-K.
Item 4 — Mine Saftey DisclosuresNot applicable.

THE HANOVER INSURANCE GROUP 2013 ANNUAL REPORT | 39
Item 5 — Market for Registrant’s CommonEquity, Related StockholderMatters fnd Issuer Purchases of Equity Securities
COMMON STOCK AND STOCKHOLDER OWNERSHIP
Our common stock is traded on the New York StockExchange under the symbol “THG”. On February 20, 2014,we had approximately 21,896 shareholders of record and43,882,063 shares outstanding. On the same date, thetrading price of our common stock was $58.24 per share.
COMMON STOCK PRICES
The following tables set forth the high and low closingsales prices of our common stock for the periods indicated:
HIGH(1) LOW(1)
2013
First Quarter $49.68 $39.19Second Quarter $51.66 $46.73Third Quarter $56.06 $48.67Fourth Quarter $60.99 $54.83
2012
First Quarter $ 41.52 $ 34.27Second Quarter $ 41.04 $ 37.17Third Quarter $ 39.69 $ 33.99Fourth Quarter $ 39.51 $ 34.58
(1) Common stock prices were obtained from a third party service provider.
DIVIDENDS
The Board of Directors declared dividends in 2013 and2012 as follows:
PER SHARE AMOUNT 2013 2012
First Quarter $ 0.33 $ 0.30Second Quarter $ 0.33 $ 0.30Third Quarter $ 0.33 $ 0.30Fourth Quarter $ 0.37 $ 0.33
We currently expect that comparable cash dividends willbe paid in the future; however, the payment of future divi-dends on our common stock will be determined by theBoard of Directors from time to time based upon cashavailable at our holding company, our results of operationsand financial condition and such other factors as theBoard of Directors considers relevant.Dividends to shareholders may be funded from divi-
dends paid to us from our subsidiaries. Dividends frominsurance subsidiaries are subject to restrictions imposedby state insurance laws and regulations and for our foreignsubsidiaries, to restrictions imposed by the PrudentialRegulation Authority and Lloyd’s. See “Liquidity andCapital Resources” in Management’s Discussion andAnalysis of Financial Condition and Results of Operationsand Note 13 – “Dividend Restrictions” in the Notes toConsolidated Financial Statements included in FinancialStatements and Supplementary Data of this Form 10-K.
ISSUER PURCHASES OF EQUITY SECURITIES
The Board of Directors has authorized a stock repurchaseprogram which provides for aggregate repurchases of up to$600 million, including a $100 million increase in the pro-gram in May 2013. Under the repurchase authorizations,we may repurchase our common stock from time to time,in amounts and prices and at such times as deemed appro-priate, subject to market conditions and other considera-tions. Our repurchases may be executed using open marketpurchases, privately negotiated transactions, acceleratedrepurchase programs or other transactions. We are notrequired to purchase any specific number of shares or tomake purchases by any certain date under this program.Total repurchases under this program as of December 31,2013 were 10.7 million shares at a cost of $463.0 million.Shares purchased in the fourth quarter of 2013 are as
follows:
PART II
Total Number of Shares Approximate Dollar ValuePurchased as Part of of Shares That May Yet be
Total Number of Average Price Publicly Announced Purchased Under the PlansPeriod Shares Purchased Paid per Share Plans or Programs or Programs (in millions)
October 1 – 31, 2013 1,021 $ 56.10 — $ 137November 1 – 30, 2013 27,024 59.32 — 137December 1 – 31, 2013 820 56.45 — 137
Total 28,865 $ 59.12 — $ 137
The total number of shares purchased reflects shares withheld to satisfy tax withholding amounts due from employ-ees related to the receipt of stock which resulted from the exercise or vesting of equity awards.

| THE HANOVER INSURANCE GROUP 2013 ANNUAL REPORT40
Item 6 — Selected Financial Data
FIVE YEAR SUMMARY OF SELECTED FINANCIAL HIGHLIGHTS(1)
YEARS ENDED DECEMBER 31 2013 2012 2011 2010 2009
(in millions, except per share data)
Statements of IncomeRevenues
Premiums $ 4,450.5 $ 4,239.1 $ 3,598.6 $2,841.0 $2,546.4 Net investment income 269.0 276.6 258.2 247.2 252.1 Net realized investment gains 33.5 23.6 28.1 29.7 1.4 Fees and other income 40.7 51.4 46.7 34.3 34.2
Total revenues 4,793.7 4,590.7 3,931.6 3,152.2 2,834.1
Losses and ExpensesLosses and loss adjustment expenses 2,761.1 2,974.4 2,550.8 1,856.3 1,639.2 Amortization of deferred acquisition costs 971.0 938.1 778.9 600.8 524.3 Net loss (gain) from repayment of debt 27.7 5.1 2.3 2.0 (34.5)Other operating expenses 704.8 644.4 578.0 487.5 439.8
Total losses and expenses 4,464.6 4,562.0 3,910.0 2,946.6 2,568.8
Income before income taxes 329.1 28.7 21.6 205.6 265.3 Income tax expense (benefit) 83.4 (17.4) (9.9) 56.0 81.2
Income from continuing operations 245.7 46.1 31.5 149.6 184.1 Discontinued operations 5.3 9.8 5.2 1.6 9.4
Net income $ 251.0 $ 55.9 $ 36.7 $ 151.2 $ 193.5
Net income per common share (diluted) $ 5.59 $ 1.23 $ 0.80 $ 3.27 $ 3.79
Dividends declared per common share $ 1.36 $ 1.23 $ 1.13 $ 1.00 $ 0.75
Balance Sheets (at December 31)Total assets $13,378.7 $13,484.9 $12,598.6 $8,546.8 $8,023.2 Debt 903.9 849.4 911.1 605.9 433.9 Total liabilities 10,784.2 10,889.5 10,114.6 6,109.4 5,684.1 Shareholders’ equity 2,594.5 2,595.4 2,484.0 2,437.4 2,339.1
(1) Includes results of Chaucer Holdings plc since the July 1, 2011 acquisition date.

THE HANOVER INSURANCE GROUP 2013 ANNUAL REPORT | 41
Item 7 — Management’s Discussion and Analysis of Financial Condition and Results of Operations
TABLE OF CONTENTS
Introduction . . . . . . . . . . . . . . . . . . . . . . . . . . . . . . . . . . . . . . . . . . . . . . . . . . . . . . . . . . 42
Executive Overview . . . . . . . . . . . . . . . . . . . . . . . . . . . . . . . . . . . . . . . . . . . . . . . . . . . . . 42
Description of Operating Segments . . . . . . . . . . . . . . . . . . . . . . . . . . . . . . . . . . . . . . . . . 43
Results of Operations - Consolidated . . . . . . . . . . . . . . . . . . . . . . . . . . . . . . . . . . . . . . . . 44
Results of Operations - Segments . . . . . . . . . . . . . . . . . . . . . . . . . . . . . . . . . . . . . . . . . . 45
Investments . . . . . . . . . . . . . . . . . . . . . . . . . . . . . . . . . . . . . . . . . . . . . . . . . . . . . . . . . . . 61
Other Items . . . . . . . . . . . . . . . . . . . . . . . . . . . . . . . . . . . . . . . . . . . . . . . . . . . . . . . . . . . 66
Quantitative and Qualitative Disclosures about Market Risk . . . . . . . . . . . . . . . . . . . . . 67
Discontinued Operations . . . . . . . . . . . . . . . . . . . . . . . . . . . . . . . . . . . . . . . . . . . . . . . . . 69
Income Taxes . . . . . . . . . . . . . . . . . . . . . . . . . . . . . . . . . . . . . . . . . . . . . . . . . . . . . . . . . . 70
Critical Accounting Estimates . . . . . . . . . . . . . . . . . . . . . . . . . . . . . . . . . . . . . . . . . . . . . 71
Statutory Surplus of U.S. Insurance Subsidiaries . . . . . . . . . . . . . . . . . . . . . . . . . . . . . . 76
Lloyd’s Capital Requirement . . . . . . . . . . . . . . . . . . . . . . . . . . . . . . . . . . . . . . . . . . . . . . 76
Liquidity and Capital Resources . . . . . . . . . . . . . . . . . . . . . . . . . . . . . . . . . . . . . . . . . . . 77
Off-Balance Sheet Arrangements . . . . . . . . . . . . . . . . . . . . . . . . . . . . . . . . . . . . . . . . . . . 80
Contingencies and Regulatory Matters . . . . . . . . . . . . . . . . . . . . . . . . . . . . . . . . . . . . . . 80
Rating Agencies . . . . . . . . . . . . . . . . . . . . . . . . . . . . . . . . . . . . . . . . . . . . . . . . . . . . . . . . 80
Risks and Forward-Looking Statements . . . . . . . . . . . . . . . . . . . . . . . . . . . . . . . . . . . . . . 81
Glossary of Selected Insurance Terms . . . . . . . . . . . . . . . . . . . . . . . . . . . . . . . . . . . . . . . 81

| THE HANOVER INSURANCE GROUP 2013 ANNUAL REPORT42
INTRODUCTION
The following Management’s Discussion and Analysis ofFinancial Condition and Results of Operations is intendedto assist readers in understanding the consolidated resultsof operations and financial condition of The HanoverInsurance Group, Inc. and its subsidiaries (“THG”).Consolidated results of operations and financial conditionare prepared in accordance with generally acceptedaccounting principles in the United States of America(“U.S. GAAP”). This discussion should be read in conjunc-tion with the Consolidated Financial Statements and relat-ed footnotes included elsewhere herein.Results of operations include the accounts of The
Hanover Insurance Company (“Hanover Insurance”) andCitizens Insurance Company of America (“Citizens”), ourprincipal U.S. domiciled property and casualty companies;Chaucer Holdings plc (“Chaucer”), our United Kingdom(U.K.) domiciled specialist insurance underwriting groupwhich operates through the Society and Corporation ofLloyd’s (“Lloyd’s”); and certain other insurance and non-insurance subsidiaries. The acquisition of Chaucer on July1, 2011, which has added meaningful business volumes toour results, has affected the comparability of our results ofoperations for the years ended December 31, 2013, 2012and 2011. Results of operations for the years endedDecember 31, 2013 and 2012 include results from all ofour business segments, while results of operations for theyear ended December 31, 2011 include Chaucer’s resultsfor only the period from July 1, 2011 through December31, 2011. Additionally, results of operations include ourdiscontinued operations, consisting primarily of our formerlife insurance businesses, accident and health businessand prior to April 30, 2012, our third party administrationbusiness.
EXECUTIVE OVERVIEW
Business operations consist of four operating segments:Commercial Lines, Personal Lines, Chaucer and Other.Operating income (formally referred to as segment
income) before interest expense and income taxes was$393.4 million in 2013 compared to $75.1 million in2012, an increase of $318.3. This increase was primarilydue to lower catastrophe and non-catastrophe related loss-es, and higher favorable development on prior years’ lossand loss adjustment expense (“LAE”) reserves (“prior years’loss reserves”). Pre-tax catastrophe losses were $140.0 mil-lion, compared to $369.9 million during 2012.Catastrophe losses in 2012 were primarily the result of
$198.1 million of pre-tax losses related to SuperstormSandy during the fourth quarter, and from several torna-does during the first six months of the year. There wasfavorable development on prior years’ loss reserves of$76.3 million in 2013, compared to $15.8 million in 2012.Over recent years, weather-related catastrophe and non-
catastrophe losses have been in excess of longer term aver-ages. Pricing in our Commercial and Personal Linesremained strong throughout 2013 as the industry contin-ues to respond to these increased weather-related losses,as well as to the earnings impact of reduced investmentincome as a result of low interest rates, and other factors.We are continuing efforts to improve our underwritingresults in both our Commercial and Personal Lines,through rate increases and improvements to our mix ofbusiness.
COMMERCIAL LINES
We believe our unique approach to the small commercialmarket, distinctiveness in the middle market, and contin-ued development of specialty lines provides us with a diver-sified portfolio of products and delivers significant value toagents and policyholders. The small commercial and mid-dle market businesses are expected to contribute to premi-um growth in Commercial Lines over the next several yearsas we continue to pursue our core strategy of developingstrong partnerships with agents, distinctive products, fran-chise value through limited distribution, and industry seg-mentation. Growth in our specialty lines continues to bean important part of our strategy, with the expansion of ourproduct offerings in these lines supported by acquisitionsof specialized business over the past several years.We believe these efforts have driven, and will continue
to drive, improvement in our overall mix of business andultimately our underwriting profitability. CommercialLines net premiums written grew by 5.5% in 2013, drivenby our core commercial businesses. This growth is prima-rily due to rate increases, strong retention and targetednew business expansion.Underwriting results improved in 2013, as compared to
2012, primarily due to lower catastrophe losses, improvednon-catastrophe current accident year results and lowerunfavorable development on prior years’ loss reserves. Thecompetitive nature of the Commercial Lines marketrequires us to be highly disciplined in our underwritingprocess to ensure that we write business at acceptablemargins and we continue to seek rate increases across ourlines of business.

THE HANOVER INSURANCE GROUP 2013 ANNUAL REPORT | 43
PERSONAL LINES
Personal Lines focuses on partnering with high quality,value-oriented agencies that deliver consultative sellingand stress the importance of account rounding (the con-version of single policy customers to accounts with multi-ple policies and additional coverages). Approximately 75%of our policies in force are account business. We arefocused on making investments that help maintain prof-itability, build a distinctive position in the market, helpdiversify us geographically from our historical core statesof Michigan, Massachusetts, New York and New Jersey,and provide us with profitable growth opportunities.Underwriting results improved in 2013, as compared to
2012, primarily due to lower catastrophe losses, improvednon-catastrophe current accident year results and lowernet unfavorable development on prior years’ loss reserves.We continue to seek additional rate increases, subject toregulatory and competitive considerations, in our personalautomobile line, particularly as a result of recent trends ofhigher loss severity in bodily injury and personal injury pro-tection claims. We also continue to seek rate increases inour homeowners lines as a result of the catastrophe andnon-catastrophe weather-related losses that the industryexperienced in the past several years.
CHAUCER
Chaucer deploys specialist underwriters in over 30 majorinsurance and reinsurance classes, including energy,marine and aviation, U.K. motor, property, and casualtyand other coverages. We obtain business through Lloyd’s,the leading international insurance and reinsurance mar-ket, which provides us with access to specialist business inover 200 countries and territories worldwide through itsinternational licenses, brand reputation and strong securi-ty rating. Our underwriting strength, diverse portfolio andLloyd’s membership underpin our ability to actively man-age the scale, composition and profitable development ofthis business.Underwriting results improved in 2013, as compared to
2012, primarily due to higher favorable development onprior years’ loss reserves and lower catastrophe losses, par-tially offset by higher non-catastrophe losses. Favorabledevelopment on prior years’ loss reserves during 2013 was$94.6 million, compared to $72.6 million during 2012, achange of $22.0 million. Chaucer net premiums writtengrew by 12.8% in 2013, primarily due to an increase inChaucer’s economic interests in Syndicate 1084 to 98% for2013, up from 84% in 2012. While we benefited fromfavorable rates in certain catastrophe-exposed marine and
property lines following high levels of insured market loss-es in recent years, we experienced overall downward pres-sure on rates throughout 2013 because of new capitalinflows and an absence of major market losses in the cur-rent year. Rates in the energy market remained under pres-sure throughout 2013 due to a continued absence of majormarket losses. Also, net premiums written in our energyline were lower due to a reduction of estimated premiumsfor both the exploration and production coverage class andthe construction coverage class. The aviation and casualtymarkets continued to remain soft as a result of low lossactivity and industry excess capacity. U.K. motor marketrates continued their modest decline, following the signif-icant increases in 2010 and 2011. In response, we contin-ue to actively manage Chaucer’s underwriting portfolio,using our expertise, distinctive underwriting capabilitiesand market knowledge to target specific attractive under-writing opportunities despite an uncertain internationalLloyd’s market environment.
DESCRIPTION OF OPERATING SEGMENTS
Primary business operations include insurance productsand services currently provided through four operating seg-ments. Our domestic operating segments are CommercialLines, Personal Lines, and Other. Our international oper-ating segment is Chaucer. Commercial Lines includescommercial multiple peril, commercial automobile, work-ers’ compensation and other commercial coverages, suchas specialty program business, inland marine, managementand professional liability and surety. Personal Linesincludes personal automobile, homeowners and other per-sonal coverages. Chaucer includes marine and aviation,energy, property, U.K. motor, and casualty and other cover-ages (which includes international liability, specialist cov-erages, and syndicate participations). Included in Otherare Opus Investment Management, Inc., which marketsinvestment management services to institutions, pensionfunds and other organizations; earnings on holding compa-ny assets; and, a voluntary pools business which is in run-off. We present the separate financial information of eachsegment consistent with the manner in which our chiefoperating decision maker evaluates results in deciding howto allocate resources and in assessing performance.We report interest expense on debt separately from the
earnings of our operating segments. This consists of inter-est on our senior debentures, subordinated debentures,collateralized borrowings with the Federal Home LoanBank of Boston (“FHLBB”), and letter of credit facility.

| THE HANOVER INSURANCE GROUP 2013 ANNUAL REPORT44
RESULTS OF OPERATIONS – CONSOLIDATED
2013 Compared to 2012Consolidated net income was $251.0 million in 2013,compared to $55.9 million in 2012. The $195.1 millionincrease is primarily due to improved operating resultsafter taxes, which was principally attributable to a decreasein catastrophe losses, higher favorable development onprior years’ loss reserves and an improvement in non-catas-trophe current accident year results. In addition, netincome increased in 2013 as a result of higher realizedgains from the sale of securities, partially offset by lossesresulting from the repayment of debt.
2012 Compared to 2011Consolidated net income was $55.9 million in 2012, com-pared to $36.7 million in 2011. The $19.2 million increaseis primarily due to income from our Chaucer segment andlower costs in 2012 related to the Chaucer acquisition.Additionally, we recognized a $10.8 million gain from thesale of our third party administration business, CitizensManagement, Inc. (“CMI”), which was completed on April30, 2012 (see also “Discontinued Operations”). Theseincreases were partially offset by a decrease in operatingresults in our domestic operations.In addition to consolidated net income, we assess our
financial performance based upon pre-tax “operatingincome (loss),” and we assess the operating performance ofeach of our four operating segments based upon the pre-tax operating income (loss) generated by each segment. Weformerly referred to these pre-tax measures as “segmentincome (loss).” Operating income (loss) before taxesexcludes interest expense on debt and certain other itemswhich we believe are not indicative of our core operations,such as net realized investment gains and losses (includingnet gains and losses on certain derivative instruments).Such gains and losses are excluded since they are deter-mined by interest rates, financial markets and the timing ofsales. Also, operating income (loss) before taxes excludesnet gains and losses on disposals of businesses, gains andlosses related to the repayment of debt, discontinued oper-ations, costs to acquire businesses, restructuring costs,extraordinary items, the cumulative effect of accountingchanges and certain other items. Although the itemsexcluded from operating income (loss) before taxes may beimportant components in understanding and assessing ouroverall financial performance, we believe a discussion ofoperating income before taxes enhances an investor’sunderstanding of our results of operations by segregating
income attributable to the core operations of the business.However, operating income (loss) before taxes should notbe construed as a substitute for income (loss) beforeincome taxes and operating income (loss) should not beconstrued as a substitute for net income (loss).Catastrophe losses and prior years’ reserve development
are significant components in understanding and assessingthe financial performance of our business. Managementreviews and evaluates catastrophes and prior years’ reservedevelopment separately from the other components ofearnings. Catastrophes and prior years’ reserve develop-ment are not predictable as to timing or the amount thatwill affect the results of our operations and have affectedour results in the past few years. Management believesthat providing certain financial metrics and trends exclud-ing the effects of catastrophes and prior years’ reservedevelopment helps investors to understand the variabilityin periodic earnings and to evaluate the underlying per-formance of our operations.The following table reflects operating income and a rec-
onciliation of total operating income to consolidated netincome.
YEARS ENDED DECEMBER 31 2013 2012 2011
(in millions)
Operating income (loss) before interest expense and income taxes:
Commercial Lines $132.4 $ (80.3) $ 16.3Personal Lines 118.6 25.5 23.1Chaucer 150.4 136.8 32.9Other (8.0) (6.9) (0.5)
Operating income before interest expense and income taxes 393.4 75.1 71.8
Interest expense on debt (65.3) (61.9) (55.0)
Operating income before income taxes 328.1 13.2 16.8Income tax benefit (expense) on
operating income (100.9) 1.9 (2.6)Net realized investment gains 33.5 23.6 28.1Loss on real estate (4.7) — —Net loss from repayment of debt (27.7) (5.1) (2.3)Net costs related to acquired
businesses (0.1) (2.6) (16.4)Loss on derivative instruments — — (11.3)Net foreign exchange gains (losses) — (0.4) 6.7Income tax benefit on non-
operating items 17.5 15.5 12.5
Income from continuing operations, net of taxes 245.7 46.1 31.5
Net gain from discontinued operations, net of taxes 5.3 9.8 5.2
Net income $251.0 $ 55.9 $ 36.7

THE HANOVER INSURANCE GROUP 2013 ANNUAL REPORT | 45
RESULTS OF OPERATIONS - SEGMENTS
The following is our discussion and analysis of the resultsof operations by business segment. The operating resultsare presented before interest expense, taxes and otheritems which management believes are not indicative of ourcore operations, including realized gains and losses.Results for Chaucer include activity since the July 1, 2011acquisition.The following table summarizes the results of opera-
tions for the periods indicated:
YEARS ENDED DECEMBER 31 2013 2012 2011
(in millions)
Operating revenues:Net premiums written $4,552.7 $4,368.4 $3,593.4
Net premiums earned 4,450.5 4,239.1 3,598.6Net investment income 269.0 276.3 258.2Other income 40.7 58.2 51.9
Total operating revenues 4,760.2 4,573.6 3,908.7
Losses and operating expenses:Losses and LAE 2,761.1 2,974.4 2,550.8Amortization of deferred
acquisition costs 971.0 938.1 778.9Other operating expenses 634.7 586.0 507.2
Total losses and operating expenses 4,366.8 4,498.5 3,836.9
Operating income before interest expense and income taxes $ 393.4 $ 75.1 $ 71.8
2013 Compared to 2012Operating income before interest expense and incometaxes was $393.4 million for the year ended December 31,2013, compared to $75.1 million for the year endedDecember 31, 2012, an increase of $318.3 million reflect-ing improvements in each of our insurance segments. Thisincrease in operating income is primarily due to lowercatastrophe and non-catastrophe related losses and higherfavorable development.Our consolidated catastrophe related activity for the
year ended December 31, 2013 was $140.0 million, com-pared to $369.9 million for the year ended December 31,2012, a decrease of $229.9 million. Our 2012 catastrophelosses included $198.1 million of pre-tax losses related toSuperstorm Sandy.Favorable development on prior years’ loss reserves was
$76.3 million for the year ended December 31, 2013, com-pared to $15.8 million for the year ended December 31,2012, an increase of $60.5 million. For 2013, $94.6 mil-lion of favorable development related to our Chaucer seg-ment was partially offset by $18.3 million of unfavorabledevelopment related to our domestic operations. For theyear ended December 31, 2012, $72.6 million of favorabledevelopment related to our Chaucer segment was partiallyoffset by $56.8 million of unfavorable development relatedto our domestic operations.
Net premiums written grew by $184.3 million for theyear ended December 31, 2013, compared to the yearended December 31, 2012, and net premiums earned grewby $211.4 million. Chaucer accounted for $127.0 millionof the net premiums written increase and $71.1 million ofthe net premiums earned increase, primarily due to theaforementioned increase in Chaucer’s economic interestsin Syndicate 1084. Additionally, growth in our core com-mercial businesses, resulting from rate increases, strongretention and targeted new business expansion, was par-tially offset by a decrease in our Personal Lines net premi-ums written.
2012 Compared to 2011Operating income before interest expense and incometaxes was $75.1 million for the year ended December 31,2012, compared to $71.8 million for the year endedDecember 31, 2011, an increase in earnings of $3.3 mil-lion. This increase is primarily due to a $103.9 millionincrease in Chaucer operating income, reflecting a fullyear of earnings for Chaucer compared to only six monthsin 2011 and lower loss activity in most Chaucer productclasses, partially offset by a $96.6 million decrease inCommercial Lines earnings. The Commercial Lines earn-ings decrease was primarily due to unfavorable develop-ment on prior years’ loss reserves and increasedcatastrophe losses.Our consolidated catastrophe related activity for the
year ended December 31, 2012 was $369.9 million, com-pared to $361.6 million for the year ended December 31,2011, an increase of $8.3 million. Both our 2012 and 2011results reflected significantly elevated levels of catastrophelosses compared to our historical averages. Catastrophelosses in 2012 were primarily the result of $198.1 millionof pre-tax losses related to Superstorm Sandy during thefourth quarter, and from several tornadoes during the firstsix months of the year. Our 2011 catastrophe losses result-ed principally from winter storms, tornado, hail and wind-storm activity in the first half of the year, and fromHurricane Irene and floods in Thailand and Denmark dur-ing the second half of the year.Favorable development on prior years’ loss reserves was
$15.8 million for the year ended December 31, 2012, com-pared to $103.3 million for the year ended December 31,2011, a decrease of $87.5 million. For 2012, $72.6 millionof favorable development related to our Chaucer segmentwas partially offset by $56.8 million of unfavorable devel-opment related to our domestic operations. For the yearended December 31, 2011, $67.8 million of favorabledevelopment was related to our domestic operations and$35.5 million was related to our Chaucer segment.Net premiums written grew by $775.0 million for the
year ended December 31, 2012, compared to the yearended December 31, 2011, and net premiums earned grew

| THE HANOVER INSURANCE GROUP 2013 ANNUAL REPORT46
The following table summarizes net premiums written,and loss and LAE and catastrophe loss ratios by line ofbusiness for the Commercial Lines and Personal Lines seg-ments. Loss and LAE and catastrophe loss ratios includeprior year reserve development.
by $640.5 million, in each case primarily as a result ofincluding a full year of Chaucer’s net premiums in 2012compared to only six months in 2011. Chaucer accountedfor $561.7 million of the net premiums written increaseand $460.5 million of the net premiums earned increase.The balance of the growth is primarily attributable toCommercial Lines, resulting from rate increases, strongretention and targeted new business expansion.
PRODUCTION AND UNDERWRITING RESULTS
The following table summarizes premiums written on agross and net basis, net premiums earned and loss, LAE,expense and combined ratios for the Commercial Lines,Personal Lines and Chaucer segments. Loss, LAE, catas-trophe loss and combined ratios shown below include prioryear reserve development. These items are not meaningfulfor our Other segment.
YEAR ENDED DECEMBER 31, 2013
(dollars in millions)Gross Premiums Net Premiums Net Premiums Catastrophe Loss & LAE Expense Combined
Written Written Earned Loss Ratios Ratios Ratios Ratios
Commercial Lines $2,295.9 $2,007.2 $1,958.4 2.0 62.4 38.0 100.4Personal Lines 1,531.6 1,428.0 1,454.2 4.6 68.8 27.9 96.7Chaucer 1,374.2 1,117.5 1,037.9 3.3 51.8 37.8 89.6
Total $5,201.7 $4,552.7 $4,450.5 3.1 62.0 34.7 96.7
YEAR ENDED DECEMBER 31, 2012
(dollars in millions)Gross Premiums Net Premiums Net Premiums Catastrophe Loss & LAE Expense Combined
Written Written Earned Loss Ratios Ratios Ratios Ratios
Commercial Lines $ 2,182.4 $ 1,902.0 $ 1,811.5 10.7 74.5 37.7 112.2Personal Lines 1,611.7 1,475.6 1,459.9 9.2 76.5 27.3 103.8Chaucer 1,409.8 990.5 966.8 4.3 52.4 37.9 90.3
Total $ 5,203.9 $ 4,368.1 $ 4,238.2 8.7 70.2 34.2 104.4
YEAR ENDED DECEMBER 31, 2011
(dollars in millions)Gross Premiums Net Premiums Net Premiums Catastrophe Loss & LAE Expense Combined
Written Written Earned Loss Ratios Ratios Ratios Ratios
Commercial Lines $ 1,938.0 $ 1,703.1 $ 1,641.7 9.0 68.2 39.0 107.2Personal Lines 1,561.3 1,461.2 1,450.5 11.3 77.1 27.1 104.2Chaucer 559.6 428.8 506.3 9.8 61.9 35.7 97.6
Total $ 4,058.9 $ 3,593.1 $ 3,598.5 10.0 70.8 33.9 104.7
YEAR ENDED DECEMBER 31, 2013
(dollars in millions)Net Catastrophe
Premiums Loss & LAE LossWritten Ratios Ratios
Commercial Lines:Commercial multiple peril $ 651.7 57.4 4.6Commercial automobile 304.7 74.4 0.2Workers’ compensation 229.6 62.1 —Other commercial 821.2 62.1 1.1
Total Commercial Lines 2,007.2 62.4 2.0
Personal Lines:Personal automobile 890.3 75.9 0.4Homeowners 496.7 58.0 12.0Other personal 41.0 43.7 5.0
Total Personal Lines 1,428.0 68.8 4.6
Total $3,435.2 65.1 3.1

THE HANOVER INSURANCE GROUP 2013 ANNUAL REPORT | 47
The following table summarizes premiums written on agross and net basis and net premiums earned by line ofbusiness for the Chaucer segment.
YEAR ENDED DECEMBER 31, 2013
(in millions)Gross Net Net
Premiums Premiums PremiumsWritten Written Earned
Chaucer:Marine and aviation $ 348.0 $ 277.1 $ 250.0U.K. motor 319.4 300.5 284.2Property 254.6 191.9 183.6Energy 233.3 174.2 169.6Casualty and other 218.9 173.8 150.5
Total Chaucer $1,374.2 $1,117.5 $1,037.9
YEAR ENDED DECEMBER 31, 2012
(in millions)Gross Net Net
Premiums Premiums PremiumsWritten Written Earned
Chaucer:Marine and aviation $ 338.9 $ 234.3 $ 227.2U.K. motor 311.6 259.8 247.0Property 248.6 161.3 180.9Energy 303.8 195.1 181.8Casualty and other 206.9 140.0 129.9
Total Chaucer $ 1,409.8 $ 990.5 $ 966.8
PERIOD JULY 1, 2011 (DATE OF ACQUISITION) TO DECEMBER 31, 2011
(in millions)Gross Net Net
Premiums Premiums PremiumsWritten Written Earned
Chaucer:Marine and aviation $ 140.0 $ 107.4 $ 119.0U.K. motor 139.8 121.8 124.4Property 94.8 72.8 121.7Energy 97.2 66.7 82.6Casualty and other 87.8 60.1 58.6
Total Chaucer $ 559.6 $ 428.8 $ 506.3
YEAR ENDED DECEMBER 31, 2012
(dollars in millions)Net Catastrophe
Premiums Loss & LAE LossWritten Ratios Ratios
Commercial Lines:Commercial multiple peril $ 612.9 72.9 19.2Commercial automobile 276.5 79.0 3.7Workers’ compensation 201.4 69.9 -Other commercial 811.2 75.2 9.3
Total Commercial Lines 1,902.0 74.5 10.7
Personal Lines:Personal automobile 922.7 79.6 2.3Homeowners 510.2 73.3 21.8Other personal 42.7 48.4 7.7
Total Personal Lines 1,475.6 76.5 9.2
Total $ 3,377.6 75.4 10.0
YEAR ENDED DECEMBER 31, 2011
(dollars in millions)Net Catastrophe
Premiums Loss & LAE LossWritten Ratios Ratios
Commercial Lines:Commercial multiple peril $ 569.5 74.6 19.3Commercial automobile 248.9 65.1 1.0Workers’ compensation 174.5 65.9 -Other commercial 710.2 64.4 5.7
Total Commercial Lines 1,703.1 68.2 9.0
Personal Lines:Personal automobile 910.5 72.5 1.3Homeowners 507.2 88.1 30.0Other personal 43.5 50.2 7.9
Total Personal Lines 1,461.2 77.1 11.3
Total $ 3,164.3 72.4 10.1

| THE HANOVER INSURANCE GROUP 2013 ANNUAL REPORT48
The following table summarizes GAAP underwriting results for the Commercial Lines, Personal Lines, Chaucer andOther segments and reconciles it to operating income.
YEAR ENDED DECEMBER 31, 2013
(in millions)Commercial Lines Personal Lines Chaucer Other Total
GAAP underwriting profit (loss), excluding prior year reservedevelopment and catastrophes $ 31.0 $ 118.2 $ 47.5 $ (2.1) $ 194.6
Prior year favorable (unfavorable) loss and LAE reservedevelopment (3.3) (13.7) 94.6 (1.3) 76.3
Pre-tax catastrophe effect (38.7) (66.9) (34.4) — (140.0)
GAAP underwriting profit (loss) (11.0) 37.6 107.7 (3.4) 130.9Net investment income 143.5 75.8 42.7 7.0 269.0Fees and other income 7.6 12.5 17.6 3.0 40.7Other operating expenses (7.7) (7.3) (17.6) (14.6) (47.2)
Operating income (loss) before interest expense and income taxes $ 132.4 $ 118.6 $ 150.4 $ (8.0) $ 393.4
YEAR ENDED DECEMBER 31, 2012
(in millions)Commercial Lines Personal Lines Chaucer Other Total
GAAP underwriting profit (loss), excluding prior year reservedevelopment and catastrophes $ (1.8) $ 94.0 $ 62.6 $ (2.2) $ 152.6
Prior year favorable (unfavorable) loss and LAE reservedevelopment (29.0) (26.5) 72.6 (1.3) 15.8
Pre-tax catastrophe effect (193.4) (134.8) (41.7) — (369.9)
GAAP underwriting profit (loss) (224.2) (67.3) 93.5 (3.5) (201.5)Net investment income 142.4 86.5 40.2 7.2 276.3Fees and other income 12.3 13.6 23.0 9.3 58.2Other operating expenses (10.8) (7.3) (19.9) (19.9) (57.9)
Operating income (loss) before interest expense and income taxes $ (80.3) $ 25.5 $ 136.8 $ (6.9) $ 75.1
YEAR ENDED DECEMBER 31, 2011
(in millions)Commercial Lines Personal Lines Chaucer Other Total
GAAP underwriting profit (loss), excluding prior year reservedevelopment and catastrophes $ (9.3) $ 58.1 $ 25.9 $ (0.4) $ 74.3
Prior year favorable (unfavorable) loss and LAE reservedevelopment 34.7 33.0 35.5 0.1 103.3
Pre-tax catastrophe effect (148.4) (163.7) (49.5) — (361.6)
GAAP underwriting profit (loss) (123.0) (72.6) 11.9 (0.3) (184.0)Net investment income 136.5 92.1 16.9 12.7 258.2Fees and other income 20.7 13.3 10.9 7.0 51.9Other operating expenses (17.9) (9.7) (6.8) (19.9) (54.3)
Operating income (loss) before interest expense and income taxes $ 16.3 $ 23.1 $ 32.9 $ (0.5) $ 71.8

THE HANOVER INSURANCE GROUP 2013 ANNUAL REPORT | 49
2013 Compared to 2012Commercial Lines
Commercial Lines net premiums written were $2,007.2million in the year ended December 31, 2013, comparedto $1,902.0 million in the year ended December 31, 2012.This $105.2 million increase was primarily driven by rateincreases, strong retention, and targeted new businessexpansion in our core commercial businesses, partially off-set by exposure management actions that focus on reduc-ing volatility from weather-related events and driving profitimprovement.Commercial Lines underwriting loss for the year ended
December 31, 2013 was $11.0 million, compared to$224.2 million for the year ended December 31, 2012, adecrease of $213.2 million. This improvement reflectsdecreased catastrophe losses and lower unfavorable devel-opment on prior years’ loss reserves. Catastrophe relatedlosses for the year ended December 31, 2013 were $38.7million, compared to $193.4 million for the year endedDecember 31, 2012, a decrease of $154.7 million.Catastrophe losses in 2012 included $124.8 million of pre-tax losses related to Superstorm Sandy. Unfavorable devel-opment on prior years’ loss reserves for the year endedDecember 31, 2013 was $3.3 million, compared to unfa-vorable development of $29.0 million for the year endedDecember 31, 2012, a decrease of $25.7 million.Commercial Lines current accident year underwriting
profit, excluding catastrophes, was $31.0 million for theyear ended December 31, 2013, compared to a loss of $1.8million for the year ended December 31, 2012. This $32.8million improvement in current accident year results wasprimarily due to lower losses in our commercial multipleperil, surety and workers’ compensation lines, partially off-set by higher losses in our commercial automobile line.The improvement in current accident year losses in ourcommercial multiple peril and surety lines was primarilydue to fewer large losses and underwriting actions, whilecommercial multiple peril also benefited from price increas-es. The improvement in current accident year losses in ourworkers’ compensation line primarily resulted from priceincreases. In our commercial automobile line, currentaccident year losses increased in our liability coverages.Pricing in Commercial Lines continued to be favorable
in 2013 due to recent years’ weather-related losses, as wellas to reduced investment income as a result of low interestrates, and other factors. We are continuing efforts toimprove our underwriting results, including throughincreased rates; however, our ability to increaseCommercial Lines net premiums written while maintain-ing or improving underwriting results may be affected by
price competition and the current challenging economicenvironment. We also expect to continue our efforts toreduce our property exposures in certain geographic areasand classes of business, with a goal of improving ourlonger-term profitability and reducing earnings volatility.Also, in the past several years, weather-related catastropheand non-catastrophe losses have been in excess of longerterm averages. We continue to monitor these trends andconsider them in our rate actions.
Personal Lines
Personal Lines net premiums written were $1,428.0 mil-lion in the year ended December 31, 2013, compared to$1,475.6 million in the year ended December 31, 2012, adecrease of $47.6 million. The primary factors contribut-ing to this decrease were our continued property-focusedexposure management actions and actions to improveunderwriting results in all lines of business. These decreas-es were partially offset by higher rates in both our home-owners and personal automobile lines.Net premiums written in the personal automobile line
of business for the year ended December 31, 2013 were$890.3 million compared to $922.7 million for the yearended December 31, 2012, a decrease of $32.4 million.This decrease was primarily due to a decline in policies inforce of 11.0%, primarily from ongoing exposure manage-ment actions and actions to improve underwriting results.This reduction in policies in force was partially offset byrate increases. Net premiums written in the homeownersline of business for the year ended December 31, 2013were $496.7 million compared to $510.2 million for theyear ended December 31, 2012, a decrease of $13.5 mil-lion. This is attributable to a decline in policies in force of11.7%, as a result of aforementioned exposure manage-ment actions, partially offset by rate increases.Personal Lines underwriting profit for the year ended
December 31, 2013 was $37.6 million, compared to a lossof $67.3 million for the year ended December 31, 2012, animprovement of $104.9 million. This was primarily due todecreased catastrophe losses and improved non-catastro-phe current accident year results. Catastrophe losses forthe year ended December 31, 2013 were $66.9 million,compared to $134.8 million for the year ended December31, 2012, a decrease of $67.9 million. Catastrophe lossesin 2012 included $45.2 million of pre-tax losses related toSuperstorm Sandy. Unfavorable development on prioryears’ loss reserves for the year ended December 31, 2013was $13.7 million, compared to unfavorable developmentof $26.5 million for the year ended December 31, 2012, achange of $12.8 million.

| THE HANOVER INSURANCE GROUP 2013 ANNUAL REPORT50
Personal Lines current accident year underwriting prof-it, excluding catastrophes, was $118.2 million in the yearended December 31, 2013, compared to $94.0 million forthe year ended December 31, 2012. This $24.2 millionimprovement in non-catastrophe current accident yearresults was primarily due to lower losses in our homeown-ers line, which we attribute to rate increases and profitimprovement actions.Although we have been able to obtain rate increases in
our Personal Lines markets and believe that our ability toobtain these increases will continue, our ability to main-tain Personal Lines net premiums written and to maintainand improve underwriting results may be affected by pricecompetition, recent years’ weather-related losses, our expo-sure management actions, recent loss trends in bodilyinjury and personal injury protection claims, and regulato-ry and legal developments. In the past several years prior to2013, weather-related catastrophe and non-catastrophelosses have been in excess of longer term averages. Wemonitor these trends and consider them in our rateactions.
Chaucer
Chaucer’s net premiums written were $1,117.5 million forthe year ended December 31, 2013, compared to $990.5million for the year ended December 31, 2012, an increaseof $127.0 million, or 12.8%. This growth was primarily dueto the aforementioned increase in Chaucer’s economicinterests in Syndicate 1084. Written premium growth wasalso driven by growth in our marine, casualty, and proper-ty lines, due to favorable pricing and specific underwritingopportunities in these markets. Partially offsetting thisgrowth was a reduction in net premiums written in ourenergy line, primarily due to a reduction of estimated pre-miums for the exploration and production coverage class,specifically control of well business, and the constructioncoverage class. This change was based on a reduced vol-ume in actual well footage drilled, following tighter safetyregulations worldwide and a reduction of offshore gasexploration in the U.S., and a reduced number and sizeof new construction projects worldwide. Additionally,strong market competition decreased net premiums in ouraviation line.Chaucer’s underwriting profit for the year ended
December 31, 2013 was $107.7 million, compared to$93.5 million for the year ended December 31, 2012, animprovement of $14.2 million. These improved resultswere primarily due to increased favorable development onprior years’ loss reserves and lower catastrophe losses, par-tially offset by higher non-catastrophe losses. Favorabledevelopment on prior years’ loss reserves for the year endedDecember 31, 2013 was $94.6 million, compared to $72.6million for the year ended December 31, 2012, a change
of $22.0 million. Catastrophe losses for the year endedDecember 31, 2013 were $34.4 million, compared to$41.7 million for the year ended December 31, 2012, adecrease of $7.3 million. Higher non-catastrophe losseswere primarily due to several single large losses in ourenergy, U.K. motor and aviation lines.After a profitable year in our international insurance
business and against a very competitive market back-ground, we expect few rate increases in 2014. Currentpricing conditions for international energy, marine and avi-ation and both direct and assumed property reinsurancemarkets continue to be affected by an absence of majorlosses, excess capacity and high levels of competition.Overall, we expect rates to remain flat in these markets,with any increases in these areas to be negligible andrestricted to local market conditions in specific classes.Also, a reduction in worldwide energy industry projects islowering the demand and pricing for exploration, produc-tion and construction coverages. Casualty market rates areflat overall, although after several years of continued ratedecline, there are now signs of potential modest rateincreases in certain classes. We will seek rate increases inthe U.K. motor market in 2014 to maintain margins atacceptable overall levels. There can be no assurance thatwe will be able to maintain adequate rates in light of eco-nomic and regulatory conditions in our markets.
Other
Other operating loss was $8.0 million for the year endedDecember 31, 2013, compared to $6.9 million for the yearended December 31, 2012. The $1.1 million increased lossis primarily due to higher employee retirement costs.
2012 Compared to 2011Commercial Lines
Commercial Lines net premiums written were $1,902.0million in the year ended December 31, 2012, comparedto $1,703.1 million in the year ended December 31, 2011.This $198.9 million increase was primarily driven by rateincreases, strong retention, and targeted new businessexpansion, including growth in the AIX program business,which grew by approximately $69 million. These factorswere partially offset by the effects of exposure manage-ment actions and business mix improvement initiatives.Commercial Lines underwriting loss for the year ended
December 31, 2012 was $224.2 million, compared to$123.0 million for the year ended December 31, 2011, or$101.2 million of increased losses. This was primarily dueto unfavorable development on prior years’ loss reservesand increased catastrophe related activity. Unfavorabledevelopment on prior years’ loss reserves for the year endedDecember 31, 2012 was $29.0 million, compared to favor-able development of $34.7 million for the year ended

THE HANOVER INSURANCE GROUP 2013 ANNUAL REPORT | 51
December 31, 2011, a change of $63.7 million. Includedin these amounts are $26.5 million and $9.2 million,respectively, of unfavorable development in our surety linein 2012 and 2011. Catastrophe related activity for the yearended December 31, 2012 was $193.4 million, comparedto $148.4 million for the year ended December 31, 2011,an increase of $45.0 million. The impact of SuperstormSandy was $124.8 million for the year ended December31, 2012.Commercial Lines current accident year underwriting
loss, excluding catastrophes, was $1.8 million for the yearended December 31, 2012, compared to $9.3 million forthe year ended December 31, 2011. This $7.5 millionimprovement was primarily due to growth in earned premi-um and the resulting positive effect on our expense ratio,partially offset by higher current accident year losses.There were higher non-catastrophe losses in our commer-cial automobile lines, including automobile coverages inour AIX program business, partially offset by lower non-catastrophe losses in our commercial multiple peril andinland marine lines.
Personal Lines
Personal Lines net premiums written were $1,475.6 mil-lion in the year ended December 31, 2012, compared to$1,461.2 million in the year ended December 31, 2011, anincrease of $14.4 million. The factors contributing to thismodest increase were higher rates in both our homeown-ers and personal automobile lines. These increases werepartially offset by our continued property-focused exposuremanagement actions. Our actions to reduce homeownerspolicy exposures, including increases in rate, have resultedin an increase in policy attrition.Net premiums written in the personal automobile line
of business for the year ended December 31, 2012 were$922.7 million compared to $910.5 million for the yearended December 31, 2011. Growth in premiums resultingprimarily from rate increases were partially offset by adecline in policies in force of 2.2%, primarily as a result offewer policies in force in Michigan, Florida, New York,Connecticut and Oklahoma. Net premiums written in thehomeowners line of business increased 0.6%, resulting pri-marily from rate increases, partially offset by a 3.7%decline in policies in force primarily attributable to fewerpolicies in force in Michigan, New York and New Jersey.These declines in both our personal automobile and home-owners lines are attributed to more selective portfolio man-agement, including attrition resulting from rate increaseswe have implemented despite the competitive pricing environment.Personal Lines underwriting loss for the year ended
December 31, 2012 was $67.3 million, compared to $72.6million for the year ended December 31, 2011, an
improvement of $5.3 million. This was primarily due todecreased catastrophe related activity and non-catastropheweather-related losses, partially offset by unfavorabledevelopment on prior years’ loss reserves. Catastropherelated activity for the year ended December 31, 2012 was$134.8 million, including Superstorm Sandy of $45.2 mil-lion, compared to $163.7 million for the year endedDecember 31, 2011, a decrease of $28.9 million.Unfavorable development on prior years’ loss reserves forthe year ended December 31, 2012 was $26.5 million,compared to favorable development of $33.0 million forthe year ended December 31, 2011, a change of $59.5 mil-lion. The unfavorable development was primarily in thepersonal automobile bodily injury and personal injury pro-tection coverages as we and the industry have experiencedhigher loss severity.Personal Lines current accident year underwriting prof-
it, excluding catastrophes, was $94.0 million in the yearended December 31, 2012, compared to $58.1 million forthe year ended December 31, 2011. This $35.9 millionincrease was primarily due to lower non-catastropheweather-related losses in our homeowners line, partiallyoffset by the aforementioned increase in liability and per-sonal injury protection losses in the automobile line.
Chaucer
Chaucer’s net premiums written were $990.5 million forthe year ended December 31, 2012. By line of business,Chaucer’s net premiums written were comprised of 26.2%U.K. motor, 23.7% marine and aviation, 19.7% energy,16.3% property, and 14.1% casualty and other lines. Thismix of business was driven and supported by our specialistunderwriting strategy which is focused on actively manag-ing the premium portfolio and risk exposures.Chaucer’s underwriting profit for the year ended
December 31, 2012 was $93.5 million, $72.6 million ofwhich is attributable to favorable development on prioryears’ loss reserves. Catastrophe losses for the year endedDecember 31, 2012 were $41.7 million, principally due toSuperstorm Sandy and the U.S. drought.Chaucer’s underwriting profit, excluding prior year loss
development and catastrophes, was $62.6 million for theyear ended December 31, 2012. Underwriting expenses of$366.1 million represented 37.9% of earned premium.
Other
Other operating loss was $6.9 million for the year endedDecember 31, 2012, compared to $0.5 million for the yearended December 31, 2011. The $6.4 million increased lossis primarily due to lower net investment income in ourholding company.

| THE HANOVER INSURANCE GROUP 2013 ANNUAL REPORT52
RESERVE FOR LOSSES AND LOSS ADJUSTMENT EXPENSES
Overview of Loss Reserve Estimation ProcessWe maintain reserves for our property and casualty prod-ucts to provide for our ultimate liability for losses and lossadjustment expenses (our “loss reserves”) with respect toreported and unreported claims incurred as of the end ofeach accounting period. These reserves are estimates, tak-ing into account past loss experience, modified for currenttrends, as well as prevailing economic, legal and socialconditions. Loss reserves represent our largest liability.Management’s process for establishing loss reserves is a
comprehensive process that involves input from multiplefunctions throughout our organization, including finance,actuarial, claims, legal, underwriting, distribution andbusiness operations management. The process incorpo-rates facts currently known and the current, and in somecases, the anticipated, state of the law and coverage litiga-tion. Based on information currently available, we believethat the aggregate loss reserves at December 31, 2013were adequate to cover claims for losses that had occurredas of that date, including both those known to us and thoseyet to be reported. However, as described below, there aresignificant uncertainties inherent in the loss reservingprocess. Our estimate of the ultimate liability for lossesthat had occurred as of December 31, 2013 is expected tochange in future periods as we obtain further information,and such changes could have a material effect on ourresults of operations and financial condition.Our loss reserves include case estimates for claims that
have been reported and estimates for claims that have beenincurred but not reported (“IBNR”) at the balance sheetdate. They also include estimates of the expenses associat-ed with processing and settling all reported and unreport-ed claims, less estimates of anticipated salvage andsubrogation recoveries. Our property and casualty lossreserves are not discounted to present value.Case reserves are established by our claim personnel
individually on a claim by claim basis and based on infor-mation specific to the occurrence and terms of the under-lying policy. For some classes of business, average casereserves are used initially. Case reserves are periodicallyreviewed and modified based on new or additional infor-mation pertaining to the claim.IBNR reserves are estimated by management and our
reserving actuaries on an aggregate basis for each line ofbusiness or coverage for loss and loss expense liabilities notreflected within the case reserves. The sum of the casereserves and the IBNR reserves represents our estimate oftotal unpaid losses and loss adjustment expenses.We regularly review our loss reserves using a variety of
industry accepted analytical techniques. We update theloss reserves as historical loss experience develops, addi-tional claims are reported and resolved and new informa-
tion becomes available. Net changes in loss reserves arereflected in operating results in the period in which thereserves are changed.The IBNR reserve includes a provision for claims that
have occurred but have not yet been reported to us, someof which may not yet be known to the insured, as well as aprovision for future development on reported claims.IBNR represents a significant proportion of our total netloss reserves, particularly for long-tail liability classes. Infact, approximately 46% of our aggregate net loss reservesat December 31, 2013 were for IBNR losses and lossexpenses.
Critical Judgments and Key AssumptionsWe determine the amount of our loss reserves based on anestimation process that is very complex and uses informa-tion from both company specific and industry data, as wellas general economic and other information. The estima-tion process is a combination of objective and subjectiveinformation, the blending of which requires significantprofessional judgment. There are various assumptionsrequired, including future trends in frequency and severityof claims, operational changes in claim handling, andtrends related to general economic and social conditions.Informed subjective estimates and judgments as to ourultimate exposure to losses are an integral component ofour loss reserve estimation process.Given the inherent complexity of our loss reserve esti-
mation process and the potential variability of the assump-tions used, the actual emergence of losses will vary,perhaps substantially, from the estimate of losses includedin our financial statements, particularly in those instanceswhere settlements or other claim resolutions do not occuruntil well into the future. Our net loss reserves atDecember 31, 2013 were $4.3 billion. Therefore, a rela-tively small percentage change in the estimate of net lossreserves would have a material effect on our results ofoperations.There is greater inherent uncertainty in estimating
insurance reserves for certain types of property and casu-alty insurance lines, particularly liability lines, where alonger period of time may elapse before a definitive deter-mination of ultimate liability and losses may be made. Inaddition, the technological, judicial, regulatory and politi-cal climates involving these types of claims are continuous-ly evolving. There is also greater uncertainty in establishingreserves with respect to business that is new to us, partic-ularly new business which is generated with respect tonewly introduced product lines, by newly appointed agentsor in geographies in which we have less experience in con-ducting business, such as the program business written byour AIX subsidiary, Chaucer’s international liability lines,our professional liability specialty lines, and business writ-ten in the western part of the United States. In some of

THE HANOVER INSURANCE GROUP 2013 ANNUAL REPORT | 53
these cases, there is less historical experience or knowl-edge and less data upon which we can rely. A combinationof business that is both new to us and has longer develop-ment periods, provides even greater uncertainty in estimat-ing insurance reserves. In our management andpro fessional liability and healthcare lines, we are modestlyincreasing, and expect to continue to increase, our expo-sure to longer-tailed liability lines, including directors andofficers liability, errors and omissions liability and productliability coverages. The Chaucer business acquired in 2011contains several international and U.S. liability lines, ofwhich financial institution and professional liability, inter-national liability and energy liability, contribute the mostuncertainty.We regularly update our reserve estimates as new infor-
mation becomes available and additional events occurwhich may impact the resolution of unsettled claims.Reserve adjustments are reflected in the results of opera-tions as adjustments to losses and LAE. Often, theseadjustments are recognized in periods subsequent to theperiod in which the underlying policy was written and theloss event occurred. When these types of subsequentadjustments affect prior years, they are described separate-ly as “prior year reserve development”. Such developmentcan be either favorable or unfavorable to our financialresults and may vary by line of business. As discussedbelow, estimated loss and LAE reserves for claims occur-ring in prior years developed favorably by $76.3 million,$15.8 million, and $103.3 million for the years endedDecember 31, 2013, 2012, and 2011, respectively. How -ever, we have experienced unfavorable development andthere can be no assurance that current loss and LAEreserves will be sufficient.We regularly review our reserving techniques, our over-
all reserving position and our reinsurance. Based on (i) ourreview of historical data, legislative enactments, judicialdecisions, legal developments in impositions of damagesand policy coverage, political attitudes and trends in gen-eral economic conditions, (ii) our review of per claim infor-mation, (iii) our historical loss experience and that of theindustry, (iv) the nature of policies written by us, and (v)our internal estimates of required reserves, we believe thatadequate provision has been made for loss reserves.However, establishment of appropriate reserves is aninherently uncertain process and there can be no certain-ty that current established reserves will prove adequate inlight of subsequent actual experience. A significant changeto the estimated reserves could have a material impact onour results of operations and financial position. Anincrease or decrease in reserve estimates would result in acorresponding decrease or increase in financial results. Forexample, each one percentage point change in the aggre-gate loss and LAE ratio resulting from a change in reserveestimation is currently projected to have an approximate
$45 million impact on operating income, based on 2013full year premiums.The major causes of material uncertainty relating to
ultimate losses and loss adjustment expenses (“risk fac-tors”) generally vary for each line of business, as well as foreach separately analyzed component of the line of busi-ness. In some cases, such risk factors are explicit assump-tions of the estimation method and in others, they areimplicit. For example, a method may explicitly assume thata certain percentage of claims will close each year, but willimplicitly assume that the legal interpretation of existingcontract language will remain unchanged. Actual resultswill likely vary from expectations for each of these assump-tions, resulting in an ultimate claim liability that is differ-ent from that being estimated currently.Some risk factors affect multiple lines of business.
Examples include changes in claim department practices,changes in settlement patterns, regulatory and legislativeactions, court actions, timeliness of claim reporting, statemix of claimants, and degree of claimant fraud.Additionally, there is also a higher degree of uncertaintydue to growth in our newly acquired businesses, withrespect to which we have less familiarity and, in somecases, limited historical claims experience. The extent ofthe impact of a risk factor will also vary by componentswithin a line of business. Individual risk factors are subjectto interactions with other risk factors within line of busi-ness components. Thus, risk factors can have offsetting orcompounding effects on required reserves.Inflation generally increases the cost of losses covered
by insurance contracts. The effect of inflation varies byproduct. Our property and casualty insurance premiumsare established before the amount of losses and LAE andthe extent to which inflation may affect such expenses areknown. Consequently, we attempt, in establishing ratesand reserves, to anticipate the potential impact of inflationin the projection of ultimate costs. For example, we haveexperienced increasing medical and attendant care costs,including those associated with automobile personal injuryprotection claims, particularly in Michigan, as well as inour workers’ compensation line in most states. Also, theU.K. motor business written by Chaucer recently has expe-rienced high levels of claims inflation and increases inpotential fraud-type claims. Increases are reflected in ourcurrent reserve estimates, but continued increases couldcontribute to increased losses and LAE in the future.We are also defendants in various litigation matters,
including putative class actions, which may claim punitivedamages, bad faith or extra-contractual damages, legal feesand interest, or claim a broader scope of policy coverage orsettlement and payment obligations than our interpreta-tion. Resolution of these cases are often highly unpre-dictable and could involve material unanticipated damageawards.
| THE HANOVER INSURANCE GROUP 2013 ANNUAL REPORT54
Loss and LAE Reserves by Line of BusinessReserving Process Overview
Our loss reserves include amounts related to short-tail andlong-tail classes of business. “Tail” refers to the time peri-od between the occurrence of a loss and the final settle-ment of the claim. The longer the time span between theincidence of a loss and the settlement of the claim (i.e. alonger tail), the more the ultimate settlement amount islikely to vary from our original estimate.Short-tail classes consist principally of automobile phys-
ical damage, homeowners property, commercial propertyand marine business. The Chaucer business, while havinga longer-tail on average than our traditional U.S. business,contains a substantial book of U.K. motor property dam-age, worldwide property insurance and reinsurance busi-ness, including certain high excess property layers, marineproperty, aviation property and energy property businesswhich has relatively short development patterns. For theseproperty coverages, claims are generally reported and set-tled shortly after the loss occurs because the claims relateto tangible property and are more likely to be discoveredshortly after the loss occurs, and property losses are oftenmore easily valued. Consequently, the estimation of lossreserves for these classes is generally less complex.However, this is less true for our Chaucer reinsurancebusiness and high excess property layers where there isoften a longer period of time between the date a claim isincurred and the date the claim is reported compared withour direct insurance operations. Therefore, the risk ofdelayed recognition of loss reserve development is higherfor our assumed reinsurance and high excess property lay-ers than for our direct insurance lines.While we estimate that a majority of our written premi-
um is in what we would characterize as shorter-tailedclasses of business, most of our loss reserves relate tolonger-tail liability classes of business. Long-tailed classesinclude commercial liability, automobile liability, workers’compensation and other types of third party coverage.Chaucer’s longer-tailed lines include aviation liability,marine liability, energy liability, nuclear liability, U.K.motor medical and liability, international liability, special-ist liability, and financial institutions and professional lia-bility. For many liability claims, significant periods of time,ranging up to several years or more, may elapse betweenthe occurrence of the loss, the discovery and reporting ofthe loss to us and the settlement of the claim. As a result,loss experience in the more recent accident years for long-tailed liability coverage has limited statistical credibilitybecause a relatively small proportion of losses in theseaccident years (the calendar years in which losses areincurred) are reported claims and an even smaller propor-tion are paid losses. Liability claims are also more suscep-
tible to litigation and can be significantly affected bychanging contract interpretations, the legal environmentand the risk and expense of protracted litigation.Consequently, the estimation of loss reserves for these cov-erages is more complex and typically subject to a higherdegree of variability and uncertainty compared to short-tailed coverages.Most of our indirect business from voluntary and invol-
untary pools is long-tailed casualty reinsurance. Reserveestimates for this business are therefore subject to the vari-ability caused by extended loss emergence periods. Theestimation of loss reserves for this business is further com-plicated by delays between the time the claim is reportedto the ceding insurer and when it is reported by the cedinginsurer to the pool manager and then to us, and by ourdependence on the quality and consistency of the lossreporting by the ceding company and actuarial estimatesby the pool manager.A comprehensive review of loss reserves for each of the
classes of business which we write is conducted regularly,generally quarterly. This review process takes into consid-eration a variety of trends that impact the ultimate settle-ment of claims. Where appropriate, the review includes areview of overall payment patterns and the emergence ofpaid and reported losses relative to expectations.The loss reserve estimation process relies on the basic
assumption that past experience, adjusted for the effects ofcurrent developments and likely trends, is an appropriatebasis for predicting future outcomes. As part of thisprocess, we use a variety of analytical methods that consid-er experience, trends and other relevant factors. IBNRreserves are generally calculated by first projecting the ulti-mate cost of all claims that have been reported or expect-ed to be reported in the future and then subtractingreported losses and loss expenses. Reported losses includecumulative paid losses and loss expenses plus casereserves. Within the comprehensive loss reserving process,standard actuarial methods which include: (1) loss devel-opment factor methods; (2) expected loss methods(Bornheutter-Ferguson); and (3) adjusted loss methods(Berquist-Sherman), are given due consideration. Thesemethods are described below:• Loss development factor methods generally assume thatthe losses yet to emerge for an accident year are propor-tional to the paid or reported loss amount observed todate. Historical patterns of the development of paid andreported losses by accident year can be predictive of theexpected future patterns that are applied to current paidand reported losses to generate estimated ultimate loss-es by accident year.

THE HANOVER INSURANCE GROUP 2013 ANNUAL REPORT | 55
• Bornheutter-Ferguson methods utilize the product ofthe expected ultimate losses times the proportion ofultimate losses estimated to be unreported or unpaid tocalculate IBNR. The expected ultimate losses are basedupon current estimates of ultimate losses from prioraccident years, adjusted to reflect expected earned pre-mium, current rating, claims cost levels and changes inbusiness mix. The expected losses, and correspondingloss ratios, are a critical component of Bornheutter-Ferguson methodologies and provide a general reason-ability guide.
• Berquist-Sherman methods are used for estimatingreserves in business lines where historical developmentpatterns may be deemed less reliable for more recentaccident years’ ultimate losses. Under these methods,patterns of historical paid or reported losses are firstadjusted to reflect current payment settlement patternsand case reserve adequacy and then evaluated in thesame manner as the loss development factor methodsdescribed above. When the adequacy of case reserveschange, the Berquist-Sherman incurred method may bedeemed more reliable than the reported loss develop-ment factor method. Likewise, when the settlement pat-terns change, the Berquist-Sherman paid method maybe deemed more reliable than the paid loss developmentfactor method.
In addition to the methods described above, various tai-lored reserving methodologies are used for certain busi-nesses. For example, for some low volume and highvolatility classes of business, special reserving techniquesare utilized that estimate IBNR by selecting the loss ratiothat balances actual reported losses to expected reportedlosses as defined by the estimated underlying reportingpattern. Also, for some classes with long exposure periods(e.g. energy construction, engineering and political risks),earnings patterns plus an estimated reporting lag appliedto the Bornheutter-Ferguson initial expected loss ratio areused to estimate IBNR. This is done in order to reflect thechanging average exposure periods by policy year (and con-sequently accident year).In completing the loss reserve analysis, a variety of
assumptions must be made for each line of business, cov-erage and accident year. Each estimation method has itsown pattern, parameter and/or judgmental dependencies,with no estimation method being better than the others inall situations. The relative strengths and weaknesses of thevarious estimation methods, when applied to a particularclass of business, can also change over time, depending onthe underlying circumstances. In many cases, multipleestimation methods will be valid for the particular factsand circumstances of the relevant class of business. Themanner of application and the degree of reliance on agiven method will vary by line of business and coverage,
and by accident year based on an evaluation of the abovedependencies and the potential volatility of the loss fre-quency and severity patterns. The estimation methodsselected or given weight at a particular valuation date arethose that are believed to produce the most reliable indica-tion for the loss reserves being evaluated. Selections incor-porate input from claims personnel, pricing actuaries, andunderwriting management on loss cost trends and otherfactors that could affect ultimate losses.For most classes of shorter-tailed business in our
Commercial and Personal Lines segments, the emergenceof paid and incurred losses generally exhibits a relativelystable pattern of loss development from one accident yearto the next. Thus, for these classes, the loss developmentfactor method is generally appropriate. For many of theclasses of shorter-tailed business in our Chaucer segment,the emergence of paid and incurred losses may exhibit arelatively volatile pattern of loss development from oneaccident year to the next. In certain cases where there is arelatively low level of reliability placed on the available paidand incurred loss data, expected loss methods or adjustedloss methods are considered appropriate for the mostrecent accident year.For longer-tailed lines of business, applying the loss
development factor method often requires even more judg-ment in selecting development factors, as well as more sig-nificant extrapolation. For those long-tailed lines ofbusiness with high frequency and relatively low per-lossseverity (e.g., personal automobile liability), volatility willoften be sufficiently modest for the loss development fac-tor method to be given significant weight, even in the mostrecent accident years, but expected loss methods andadjusted loss methods are always considered and frequent-ly utilized in the selection process. For those long-tailedlines of business with low frequency and high loss poten-tial (e.g., commercial liability), anticipated loss experienceis less predictable because of the small number of claimsand erratic claim severity patterns. In these situations, theloss development factor methods may not produce a reli-able estimate of ultimate losses in the most recent accidentyears since many claims either have not yet been reportedor are only in the early stages of the settlement process.Therefore, the loss reserve estimates for these accidentyears are based on methods less reliant on extrapolation,such as Bornheutter-Ferguson. Over time, as a greaternumber of claims are reported and the statistical credibili-ty of loss experience increases, loss development factormethods or adjusted loss methods are given increasingweight.Management endeavors to apply as much available data
as practicable to estimate the loss reserve amount for eachline of business, coverage and accident year, utilizing vary-ing assumptions, projections and methods. The ultimate

outcome is likely to fall within a range of potential out-comes around this loss reserve estimated amount.Our carried reserves for each line of business and cov-
erage are determined based on this quarterly loss reservingprocess. In making the determination, we consider numer-ous quantitative and qualitative factors. Quantitative fac-tors include changes in reserve estimates in the period, thematurity of the accident year, trends observed over therecent past, the level of volatility within a particular classof business, the estimated effects of reinsurance, includingreinstatement premiums, general economic trends, andother factors. Qualitative factors may include legal andregulatory developments, changes in claim handling,recent entry into new markets or products, changes inunderwriting practices, concerns that we do not have suf-ficient or quality historical reported and paid loss and LAEinformation with respect to a particular line or segment ofour business, effects of the economy and political outlook,perceived anomalies in the historical results, evolvingtrends or other factors. In doing so, we must evaluatewhether a change in the data represents credible action-able information or an anomaly. Such an assessmentrequires considerable judgment. Even if a change is deter-mined to be apparent, it is not always possible to determinethe extent of the change. As a result, there can be a timelag between the emergence of a change and a determina-tion that the change should be partially or fully reflected inthe carried loss reserves. In general, changes are mademore quickly to reserves for more mature accident yearsand less volatile classes of business.
Reserving Process Uncertainties
As stated above, numerous factors (both internal andexternal) contribute to the inherent uncertainty in theprocess of establishing loss reserves, including changes inthe rate of inflation for goods and services related toinsured damages (e.g., medical care, home repairs, etc.),changes in the judicial interpretation of policy provisions,and settlement obligations, changes in the general attitudeof juries in determining damage awards, legislative actions,changes in the extent of insured injuries, changes in thetrend of expected frequency and/or severity of claims,changes in our book of business (e.g., change in mix due tonew product offerings, new geographic areas, etc.),changes in our underwriting practices, and changes inclaim handling procedures and/or systems. Regarding ourindirect business from voluntary and involuntary pools, weare provided loss estimates by managers of each pool. Weadopt reserve estimates for the pools that consider thisinformation and other facts.In addition, we must consider the uncertain effects of
emerging or potential claims and coverage issues that ariseas legal, judicial, social conditions, political risks, and eco-
nomic conditions change. For example, claims which weconsider closed may be re-opened as additional damagessurface or new liability or damage theories are presented.These and other issues could have a negative effect on ourloss reserves by either extending coverage beyond the orig-inal underwriting intent or by increasing the number orsize of claims. Additionally, the effect of the recent U.K.legislation (the Legal Aid, Sentencing and Punishment ofOffenders Act) on our U.K. motor business is unclear.Effective April 2013, key changes introduced by this legis-lation are limiting the level of success fees paid to lawyers,banning referral fees and increasing general damages by10% for all bodily injury claims. As a result, the uncertain-ties inherent in estimating ultimate claim costs on thebasis of past experience further complicate the alreadycomplex loss reserving process.As part of our loss reserving analysis, we consider the
various factors that contribute to the uncertainty in theloss reserving process. Those factors that could materiallyaffect our loss reserve estimates include loss developmentpatterns and loss cost trends, reporting lags, rate and expo-sure level changes, the effects of changes in coverage andpolicy limits, business mix shifts, the effects of regulatoryand legislative developments, the effects of changes injudicial interpretations, the effects of emerging claims andcoverage issues and the effects of changes in claim han-dling practices. In making estimates of reserves, however,we do not necessarily make an explicit assumption for eachof these factors. Moreover, all estimation methods do notutilize the same assumptions and typically no singlemethod is determinative in the reserve analysis for a line ofbusiness and coverage. Consequently, changes in our lossreserve estimates generally are not the result of changes inany one assumption. Instead, the variability will be affect-ed by the interplay of changes in numerous assumptions,many of which are implicit to the approaches used.For each line of business and coverage, we regularly
adjust the assumptions and methods used in the estima-tion of loss reserves in response to our actual loss experi-ence, as well as our judgments regarding changes in trendsand/or emerging patterns. In those instances where we pri-marily utilize analyses of historical patterns of the develop-ment of paid and reported losses, this may be reflected, forexample, in the selection of revised loss development fac-tors. In longer-tailed classes of business and for which lossexperience is less predictable due to potential changes injudicial interpretations, potential legislative actions, thecost of litigation or determining liability and the ultimateloss, inflation and potential claims issues, this may bereflected in a judgmental change in our estimate of ulti-mate losses for particular accident years.The Chaucer segment contains run-off business com-
prised of liability lines, notably financial institutions andprofessional liability business written by Lloyd’s Syndicate
| THE HANOVER INSURANCE GROUP 2013 ANNUAL REPORT56

THE HANOVER INSURANCE GROUP 2013 ANNUAL REPORT | 57
our estimation process. In such situations, we may adaptour practices to accommodate the circumstances.For events designated as catastrophes which affect our
Commercial and Personal Lines business segments, wegenerally calculate IBNR reserves directly as a result of anestimated IBNR claim count and an estimated averageclaim amount for each event. Such an assessment involvesa comprehensive analysis of the nature of the event, of pol-icyholder exposures within the affected geographic areaand of available claims intelligence. Depending on thenature of the event, available claims intelligence couldinclude surveys of field claims associates within the affect-ed geographic area, feedback from a catastrophe claimsteam sent into the area, as well as data on claims reportedas of the financial statement date. In addition, loss emer-gence from similar historical events is compared to theestimated IBNR for our current catastrophe events to helpassess the reasonableness of our estimates.For events designated as catastrophes which affect our
Chaucer business segment, we initially calculate IBNRreserves using a ground up exposure by exposure analysisbased on each cedant or insured. These are supported bybroker supplied information, catastrophe modeling andindustry event estimates. As more specific claim level databecomes available over time for each catastrophe event,these initial estimates are revised and updated by claim fre-quency and severity modeling as described above, as appro-priate for each event.
Reserving Sensitivity Analysis
The following discussion presents disclosure related topossible variation in net reserve estimates due to changesin key assumptions. This information is provided for illus-trative purposes only. Many other assumptions may alsolead to material reserve adjustments. If any such variationsdo occur, they would likely occur over a period of severalyears and therefore their impact on our results of opera-tions would be recognized during the same period. It isimportant to note, however, that there is the potential forfuture variations greater than the amounts described belowand for any such variations to be recognized in a singlequarterly or annual period. No consideration has beengiven to potential correlation or lack of correlation amongkey assumptions or among lines of business and coverageas described below. As a result and because there are somany other factors which affect our net reserve estimate,it would be inappropriate to take the amounts describedbelow and simply add them together in an attempt to esti-mate volatility in total. While we believe these are reason-ably likely scenarios, the reader should not consider thefollowing sensitivity analysis as illustrative of a reserverange.
4000. There is particular uncertainty around the reserveestimates in respect of business written in 2007 and 2008which have been subject to claims arising out of the finan-cial turmoil in that time period, particularly in the finan-cial institutions book. These claims are unlikely to besettled for some time since they contain numerous cover-age issues and in many cases involve class action lawsuitsthat are likely to take several years to resolve. We have uti-lized substantially all of our available reinsurance withrespect to losses and LAE related to Syndicate 4000 busi-ness written in 2008. Effective January 1, 2014, Syndicate1084 accepted the reinsurance to close of the unpaid lia-bilities of Syndicate 4000 for the 2008 year of account andprior. This transaction resulted in the closure of theSyndicate 4000 and has no impact on a consolidated basis.The future impact of the various factors that contribute
to the uncertainty in the loss reserving process is impossi-ble to predict. There is potential for significant variation inthe development of loss reserves, particularly for long-tailed classes of business and classes of business that aremore vulnerable to economic or political risks. We do notderive statistical loss distributions or confidence levelsaround our loss reserve estimate, and as a result, we do notestablish reserve range estimates.
Reserving Process for Catastrophe Events
The estimation of claims and claims expense reserves forcatastrophes also comprises estimates of losses fromreported claims and IBNR, primarily for damage to proper-ty. In general, our estimates for catastrophe reserves aredetermined on an event basis by considering varioussources of available information, including specific lossestimates reported to us based on claim adjuster inspec-tions, overall industry loss estimates, and our internal dataregarding exposures related to the geographical location ofthe event. However, depending on the nature of the catas-trophe, the estimation process can be further complicatedby other impediments. For example, for hurricanes andother severe wind storms, complications often include theinability of insureds to promptly report losses, delays in theability of claims adjusting staff to inspect losses, difficul-ties in determining whether losses are covered by ourhomeowners policy (generally for damage caused by windor wind driven rain) or are specifically excluded from cov-erage caused by flood, and challenges in estimating addi-tional living expenses, assessing the impact of demandsurge, exposure to mold damage, and the effects of numer-ous other considerations. Another example is the compli-cation of estimating the cost of business interruptioncoverage on commercial lines policies. Estimates for catas-trophes which occur at or near the end of a financialreporting period may be even less reliable since we willhave less claims data available and little time to complete

| THE HANOVER INSURANCE GROUP 2013 ANNUAL REPORT58
• Personal and Commercial Automobile Bodily Injury –reserves recorded for bodily injury on U.S. voluntarybusiness were $495.9 million as of December 31, 2013.A key assumption for bodily injury is the inflation rateunderlying the estimated reserve. A five point change(e.g. 4% changed to 9% or -1%) in the imbedded infla-tion would have changed estimated IBNR by approxi-mately $49 million, either positive or negative, respec-tively, at December 31, 2013.
• Personal Automobile Personal Injury Protection MedicalPayment – reserves recorded for personal injury protec-tion medical payment on U.S. voluntary business were$179.2 million as of December 31, 2013. A key assump-tion for this coverage is the inflation rate underlying theestimated reserve. Given the long reporting pattern forthis line of business, an additional key assumption is theamount of additional development required to reach fullmaturity, thereby reflecting ultimate costs, as represent-ed by the tail factor. A five point change in the imbeddedinflation and a one point change to the tail factorassumption (e.g. 1.02 changed to 1.01 or 1.03) wouldhave changed estimated IBNR by approximately $27 mil-lion, either positive or negative, at December 31, 2013.
• Workers’ Compensation – reserves recorded for workers’compensation on U.S. voluntary business were $349.5million as of December 31, 2013. A key assumption forworkers’ compensation is the inflation rate underlyingthe estimated reserve. Given the long reporting patternfor this line of business, an additional key assumption isthe amount of additional development required to reachfull maturity, thereby reflecting ultimate costs, as repre-sented by the tail factor. A five point change in theimbedded inflation and a one point change to the tailfactor assumption would have changed estimated IBNRby approximately $37 million, either positive or nega-tive, at December 31, 2013.
• Monoline and Multi-Peril General Liability – reservesrecorded for general liability on U.S. voluntary businesswere $402.0 million as of December 31, 2013. A keyassumption for general liability is the implied adequacyof the underlying case reserves. A ten point change incase adequacy (e.g. 10% deficiency changed to 0% or20% deficiency) would have changed estimated IBNRby approximately $32 million, either positive or nega-tive, at December 31, 2013.
• Specialty Programs – reserves recorded (including allo-cated LAE) for the AIX Companies were $252.2 millionas of December 31, 2013. Two key assumptions under-lying the actuarial reserve analysis for specialty pro-grams are the expected loss and allocated LAE ratio(“ELR”) and the tail factor selection. A ten point changeto the ELR and a five point change in the tail factor onAIX would have changed estimated IBNR by approxi-mately $23 million at December 31, 2013.
• New classes of business – reserves recorded for newclasses of Chaucer business (primarily within energy,engineering and international liability lines) were $292million as of December 31, 2013. An increase in theultimate loss by 5%, 10%, and 15% in the 2011 andprior, 2012, and 2013 years of account, respectively, onthese classes would have increased estimated IBNR byapproximately $49 million at December 31, 2013.
• Catastrophe events – a 25% increase in estimated grossultimate claim deterioration for the 2011 Japan earth-quakes and Thailand floods and Superstorm Sandy,would have reduced underwriting income by approxi-mately $14 million, including reinstatement premiums.
Carried Reserves and Reserve Rollforward
The table below provides a reconciliation of the grossbeginning and ending reserve for unpaid losses and lossadjustment expenses.
YEARS ENDED DECEMBER 31 2013 2012 2011
(in millions)
Gross loss and LAE reserves, beginning of year $6,197.0 $5,760.3 $3,277.7
Reinsurance recoverable on unpaid losses 2,074.3 1,931.8 1,115.5
Net loss and LAE reserves, beginning of year 4,122.7 3,828.5 2,162.2
Net incurred losses and LAE in respect of losses occurring in:
Current year 2,837.4 2,990.2 2,654.1Prior years (76.3) (15.8) (103.3)
Total incurred losses and LAE 2,761.1 2,974.4 2,550.8
Net payments of losses and LAE in respect of losses occurring in:
Current year 1,213.5 1,317.6 1,482.4Prior years 1,469.8 1,396.5 1,010.3
Total payments 2,683.3 2,714.1 2,492.7
Purchase of Chaucer, net of reinsurance recoverable on unpaid losses of $669.6 — — 1,631.0
Effect of foreign exchange rate changes 0.6 33.9 (22.8)
Net reserve for losses and LAE, end of year 4,201.1 4,122.7 3,828.5
Reinsurance recoverable on unpaid losses 2,030.4 2,074.3 1,931.8
Gross reserve for losses and LAE, end of year $6,231.5 $6,197.0 $5,760.3

THE HANOVER INSURANCE GROUP 2013 ANNUAL REPORT | 59
The table below summarizes the gross reserve for lossesand LAE by line of business.
DECEMBER 31 2013 2012 2011
(in millions)
Commercial multiple peril $ 597.5 $ 629.7 $ 550.0Workers’ compensation 596.1 571.8 544.7Commercial automobile 297.9 269.7 234.9AIX 337.5 321.6 239.6Other 470.7 454.2 360.1
Total Commercial and Other 2,299.7 2,247.0 1,929.3
Personal automobile 1,413.1 1,400.7 1,366.3Homeowners and other personal 137.2 141.3 131.9
Total Personal 1,550.3 1,542.0 1,498.2
Total Chaucer 2,381.5 2,408.0 2,332.8
Total loss and LAE reserves $6,231.5 $6,197.0 $5,760.3
Other lines are primarily comprised of our general lia-bility, umbrella, professional and management liability,marine, voluntary pools, surety, and healthcare lines.Included in the above table, primarily in other lines, are$61.9 million, $60.5 million and $59.8 million of asbestosand environmental reserves as of December 31, 2013,2012 and 2011, respectively. Included in the Chaucer seg-ment in the above table are $230.6 million, $272.4 millionand $302.8 million of reserves as of December 31, 2013,2012 and 2011, respectively, related to Chaucer’sSyndicate 4000, which consists of financial and profes-sional liability lines written in 2008 and prior.
Prior Year DevelopmentLoss and LAE reserves for claims occurring in prior yearsdeveloped favorably by $76.3 million, $15.8 million and$103.3 million during the years ended December 31,2013, 2012 and 2011, respectively. The 2013 activity bysegment includes favorable development of $94.6 millionfor Chaucer, partially offset by unfavorable development of$18.3 million in our domestic operations, consisting of$3.3 million, $13.7 million and $1.3 million forCommercial Lines, Personal Lines and Other, respectively.The 2012 activity by segment includes favorable develop-ment of $72.6 million for Chaucer, partially offset by unfa-vorable development of $56.8 million in our domesticoperations, consisting of $29.0 million, $26.5 million and$1.3 million for Commercial Lines, Personal Lines andOther, respectively.
The primary drivers of reserve development for the yearended December 31, 2013 were as follows:• Lower than expected losses within Chaucer’s businessas follows:
– energy line, primarily in the 2009 through 2012 acci-dent years,
– property line, primarily in the 2011 and 2012 acci-dent years,
– within casualty and other lines, specialist liabilitylines, primarily in the 2008 accident year, and
– marine and aviation line, primarily in the 2010through 2012 accident years.
– favorable impact of foreign exchange rate movementson prior years’ loss reserves.
• Lower than expected losses within our workers’ com-pensation line, primarily related to accident years 2006through 2011 and lower involuntary pool losses includ-ing a $3.2 million benefit from the settlement of a legalproceeding.
• Lower than expected losses within our commercialmulti-peril line, primarily related to accident year 2012.
Partially offsetting the favorable development discussedabove were the following:• Higher than expected losses within our personal auto-mobile line, due to severity in bodily injury coverage foraccident years 2010 through 2012.
• Higher than expected large losses within our commer-cial automobile line, primarily related to liability cover-age in accident years 2009 through 2011.
• Higher than expected losses within our other commer-cial lines, primarily related to accident years 2010through 2012.
The primary drivers of reserve development for the yearended December 31, 2012 were as follows:• Favorable development of previously establishedreserves in Chaucer’s lines of business as follows:
– energy line, primarily in the 2008 through 2011 acci-dent years,
– marine and aviation lines, primarily in the 2007through 2011 accident years,
– within casualty lines, primarily in the 2010 and 2011accident years, and
– property line, primarily in the 2009 through 2011accident years.
• Favorable development within Commercial Lines wasdue to lower than expected losses within our commer-cial multiple peril line related to the 2008 through 2011accident years.

| THE HANOVER INSURANCE GROUP 2013 ANNUAL REPORT60
Partially offsetting the favorable development discussedabove were the following:• Within other commercial lines, higher than expectedlosses in our contract surety line due to the challengingmacroeconomic environment for contractors, and to alesser extent, our AIX program business primarily relat-ed to unexpected severity in commercial automobile lia-bility, commercial multiple peril and general liability ina limited number of programs.
• Within Personal Lines, higher than expected losseswithin our personal automobile line, primarily related tobodily injury severity in the 2010 and 2011 accidentyears, and higher than expected homeowners propertylosses from non-catastrophe weather related activity inthe 2011 accident year.
• Higher than expected large losses within our commer-cial automobile line, primarily related to liability cover-age in the 2011 accident year.
The primary drivers of reserve development for the yearended December 31, 2011 were as follows:• Lower than expected losses within our personal auto-mobile line, primarily related to bodily injury coveragein the 2008 through 2010 accident years.
• Lower than expected losses within our commercial mul-tiple peril line related to the 2007 through 2010 acci-dent years.
• Lower than expected losses within our workers’ com-pensation line related to the 2007 through 2010 acci-dent years.
• Lower than expected losses in Chaucer’s energy, proper-ty and U.K. motor lines, primarily related to the 2009and 2010 accident years.
• Additionally, within other commercial lines, unfavorabledevelopment in our professional liability and suretylines were partially offset by favorable development inour healthcare and other commercial property lines.
It is not possible to know whether the factors thataffected loss reserves in the year ended December 31,2013 will also occur in future periods. As discussed indetail in this Form 10-K, there are inherent uncertaintiesin estimating reserves for losses and loss adjustmentexpenses and we encourage you to read this Form 10-K formore information about our reserving process and thejudgments, uncertainties and risks associated therewith.
Asbestos and Environmental ReservesAlthough we attempt to limit our exposures to asbestos andenvironmental damage liability through specific policyexclusions, we have been and may continue to be subjectto claims related to these exposures. Ending loss and LAEreserves for all direct business written by our property andcasualty companies related to asbestos and environmentaldamage liability were $11.5 million, $9.8 million and$10.0 million, net of reinsurance of $20.6 million, $20.4million, and $18.7 million for the years ended December31, 2013, 2012 and 2011, respectively.Activity for our asbestos and environmental reserves was
not significant to our 2013, 2012 or 2011 financial results.In recent years, average asbestos and environmental pay-ments have declined modestly. As a result of our historicaldirect underwriting mix of Commercial Lines policiestoward smaller and middle market risks, past asbestos andenvironmental damage liability loss experience hasremained minimal in relation to our total loss and LAEincurred experience.In addition, we have established gross loss and LAE
reserves for assumed reinsurance pool business withasbestos and environmental damage liability of $29.8 mil-lion, $30.3 million and $31.1 million at December 31,2013, 2012 and 2011, respectively. These reserves relate topools in which we have terminated our participation; how-ever, we continue to be subject to claims related to years inwhich we were a participant. Results of operations fromthese pools are included in our Other segment. A signifi-cant part of our pool reserves relates to our participation inthe Excess and Casualty Reinsurance Association(“ECRA”) voluntary pool from 1950 to 1982. In 1982, thepool was dissolved and since that time, the business hasbeen in run-off. Our percentage of the total pool liabilitiesvaried from 1% to 6% during these years. Our participationin this pool has resulted in average paid losses of approxi-mately $2 million annually over the past ten years.We estimate our ultimate liability for asbestos, environ-
mental and toxic tort liability claims, whether resultingfrom direct business, assumed reinsurance or pool busi-ness, based upon currently known facts, reasonableassumptions where the facts are not known, current lawand methodologies currently available. Although these out-standing claims are not significant, their existence givesrise to uncertainty and are discussed because of the possi-bility that they may become significant. We believe that,notwithstanding the evolution of case law expanding liabil-ity in asbestos and environmental claims, recorded reservesrelated to these claims are adequate. Nevertheless, theasbestos, environmental and toxic tort liability reserves
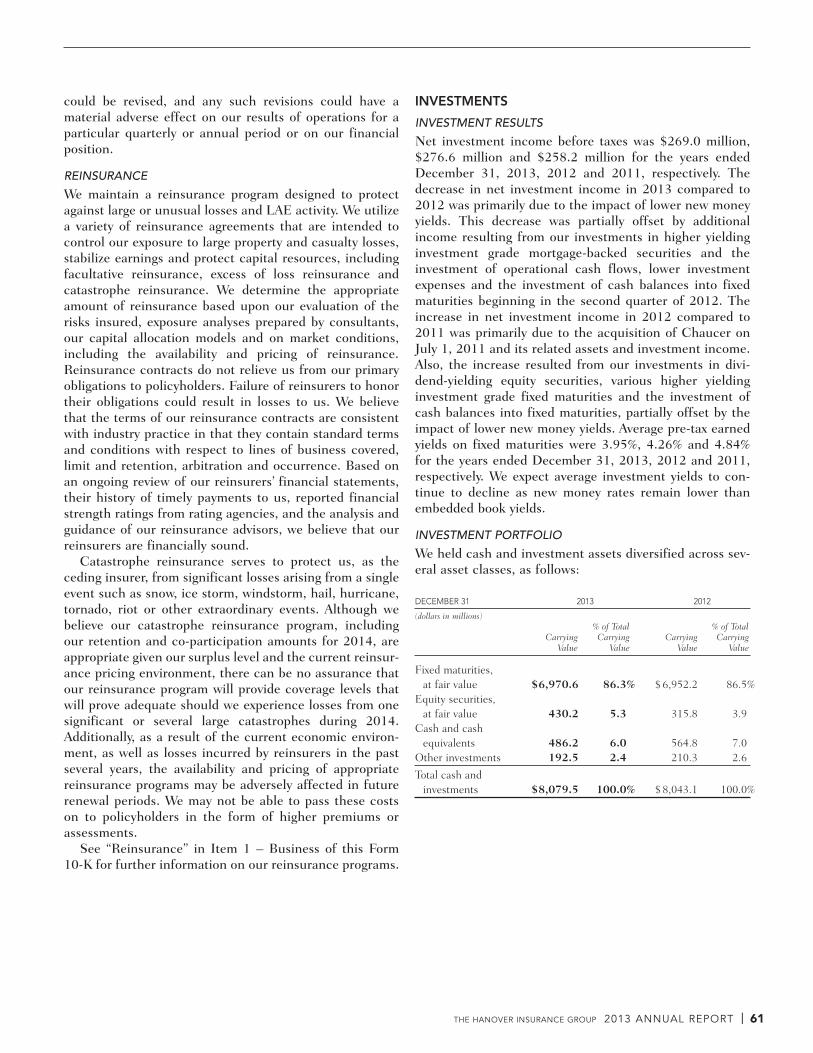
THE HANOVER INSURANCE GROUP 2013 ANNUAL REPORT | 61
could be revised, and any such revisions could have amaterial adverse effect on our results of operations for aparticular quarterly or annual period or on our financialposition.
REINSURANCE
We maintain a reinsurance program designed to protectagainst large or unusual losses and LAE activity. We utilizea variety of reinsurance agreements that are intended tocontrol our exposure to large property and casualty losses,stabilize earnings and protect capital resources, includingfacultative reinsurance, excess of loss reinsurance andcatastrophe reinsurance. We determine the appropriateamount of reinsurance based upon our evaluation of therisks insured, exposure analyses prepared by consultants,our capital allocation models and on market conditions,including the availability and pricing of reinsurance.Reinsurance contracts do not relieve us from our primaryobligations to policyholders. Failure of reinsurers to honortheir obligations could result in losses to us. We believethat the terms of our reinsurance contracts are consistentwith industry practice in that they contain standard termsand conditions with respect to lines of business covered,limit and retention, arbitration and occurrence. Based onan ongoing review of our reinsurers’ financial statements,their history of timely payments to us, reported financialstrength ratings from rating agencies, and the analysis andguidance of our reinsurance advisors, we believe that ourreinsurers are financially sound.Catastrophe reinsurance serves to protect us, as the
ceding insurer, from significant losses arising from a singleevent such as snow, ice storm, windstorm, hail, hurricane,tornado, riot or other extraordinary events. Although webelieve our catastrophe reinsurance program, includingour retention and co-participation amounts for 2014, areappropriate given our surplus level and the current reinsur-ance pricing environment, there can be no assurance thatour reinsurance program will provide coverage levels thatwill prove adequate should we experience losses from onesignificant or several large catastrophes during 2014.Additionally, as a result of the current economic environ-ment, as well as losses incurred by reinsurers in the pastseveral years, the availability and pricing of appropriatereinsurance programs may be adversely affected in futurerenewal periods. We may not be able to pass these costson to policyholders in the form of higher premiums orassessments.See “Reinsurance” in Item 1 – Business of this Form
10-K for further information on our reinsurance programs.
INVESTMENTS
INVESTMENT RESULTS
Net investment income before taxes was $269.0 million,$276.6 million and $258.2 million for the years endedDecember 31, 2013, 2012 and 2011, respectively. Thedecrease in net investment income in 2013 compared to2012 was primarily due to the impact of lower new moneyyields. This decrease was partially offset by additionalincome resulting from our investments in higher yieldinginvestment grade mortgage-backed securities and theinvestment of operational cash flows, lower investmentexpenses and the investment of cash balances into fixedmaturities beginning in the second quarter of 2012. Theincrease in net investment income in 2012 compared to2011 was primarily due to the acquisition of Chaucer onJuly 1, 2011 and its related assets and investment income.Also, the increase resulted from our investments in divi-dend-yielding equity securities, various higher yieldinginvestment grade fixed maturities and the investment ofcash balances into fixed maturities, partially offset by theimpact of lower new money yields. Average pre-tax earnedyields on fixed maturities were 3.95%, 4.26% and 4.84%for the years ended December 31, 2013, 2012 and 2011,respectively. We expect average investment yields to con-tinue to decline as new money rates remain lower thanembedded book yields.
INVESTMENT PORTFOLIO
We held cash and investment assets diversified across sev-eral asset classes, as follows:
DECEMBER 31 2013 2012
(dollars in millions)% of Total % of Total
Carrying Carrying Carrying CarryingValue Value Value Value
Fixed maturities, at fair value $6,970.6 86.3% $6,952.2 86.5%
Equity securities, at fair value 430.2 5.3 315.8 3.9
Cash and cash equivalents 486.2 6.0 564.8 7.0
Other investments 192.5 2.4 210.3 2.6
Total cash and investments $8,079.5 100.0% $8,043.1 100.0%

| THE HANOVER INSURANCE GROUP 2013 ANNUAL REPORT62
CASH AND INVESTMENTS
Total cash and investments increased $36.4 million, or0.5%, for the year ended December 31, 2013, of whichequities increased $114.4 million, fixed maturitiesincreased $18.4 million, cash and cash equivalentsdecreased $78.6 million and other investments decreased$17.8 million. Equity securities increased primarily frompurchases of dividend yielding stocks and exchange tradedfunds, as well as market value appreciation, partially offsetby sales of mutual funds. Fixed maturities increased due tothe investment of positive operational cash flows and avail-able cash, partially offset by market value depreciation of$267.3 million for the year. Cash and cash equivalentsdecreased due to funding net investments and financingactivities. Cash used in financing activities in 2013 includ-ed repayment of debt, common stock repurchases andexternal dividend payments, partially offset by cash pro -vided by net proceeds from the issuance of subordinated debentures.Our fixed maturity portfolio is comprised of corporate
securities, taxable and tax-exempt municipal securities,residential mortgage-backed securities, commercial mort-gage-backed securities, U.S. governmental securities, for-eign government securities and asset-backed securities.Equity securities primarily consist of common stocks,exchange traded funds and non-redeemable preferredstocks.
The following table provides information about theinvestment types of our fixed maturities portfolio:
DECEMBER 31 2013
(in millions)Change
Net in NetAmortized Unrealized Unrealized
Investment Type Cost Fair Value Gain (Loss) for the Year
U.S. Treasury and government agencies $ 417.5 $ 406.6 $ (10.9) $ (19.3)
Foreign government 304.5 305.0 0.5 (3.9)Municipals:
Taxable 959.3 977.2 17.9 (61.2)Tax exempt 148.7 149.1 0.4 (6.6)
Corporate 3,690.2 3,824.2 134.0 (126.6)Asset-backed:
Residential mortgage-backed 722.8 728.8 6.0 (30.2)
Commercial mortgage-backed 405.9 411.6 5.7 (17.2)
Asset-backed 166.3 168.1 1.8 (2.3)
Total fixed maturities $6,815.2 $6,970.6 $155.4 $(267.3)
Net unrealized gains on fixed maturities decreased$267.3 million, or 63.2%, to a net unrealized gain of$155.4 million at December 31, 2013, compared to$422.7 million at December 31, 2012, primarily due tohigher prevailing interest rates.
Amortized cost and fair value by rating category were as follows:
DECEMBER 31 2013 2012
(dollars in millions)
NAIC Rating Agency Amortized Fair % of Total Amortized Fair % of TotalDesignation Equivalent Designation Cost Value Fair Value Cost Value Fair Value
1 Aaa/Aa/A $4,934.1 $5,009.7 71.9% $4,744.0 $ 5,017.9 72.2%2 Baa 1,494.0 1,555.5 22.3 1,443.5 1,569.3 22.63 Ba 164.7 173.1 2.5 143.1 156.2 2.24 B 170.8 178.4 2.5 135.1 143.5 2.15 Caa and lower 44.1 46.0 0.7 50.1 50.7 0.76 In or near default 7.5 7.9 0.1 13.7 14.6 0.2
Total fixed maturities $6,815.2 $6,970.6 100.0% $6,529.5 $ 6,952.2 100.0%
Based on ratings by the National Association ofInsurance Commissioners (“NAIC”), approximately 94% ofthe fixed maturity portfolio consisted of investment gradesecurities at December 31, 2013, compared to 95% atDecember 31, 2012. The quality of our fixed maturity port-folio remains strong based on ratings, capital structureposition, support through guarantees, underlying security,issuer diversification and yield curve position.We deposit funds with various state and governmental
authorities as well as with Lloyd’s. See Note 3 -“Investments” in the Notes to Consolidated Financial
Statements included in Financial Statements andSupplementary Data of this Form 10-K for additionalinformation.Our fixed maturity and equity securities are classified as
available-for-sale and are carried at fair value. Financialinstruments whose value was determined using significantmanagement judgment or estimation constituted less than2% of the total assets we measured at fair value. (See alsoNote 5 - “Fair Value” in the Notes to ConsolidatedFinancial Statements included in Financial Statementsand Supplementary Data of this Form 10-K).
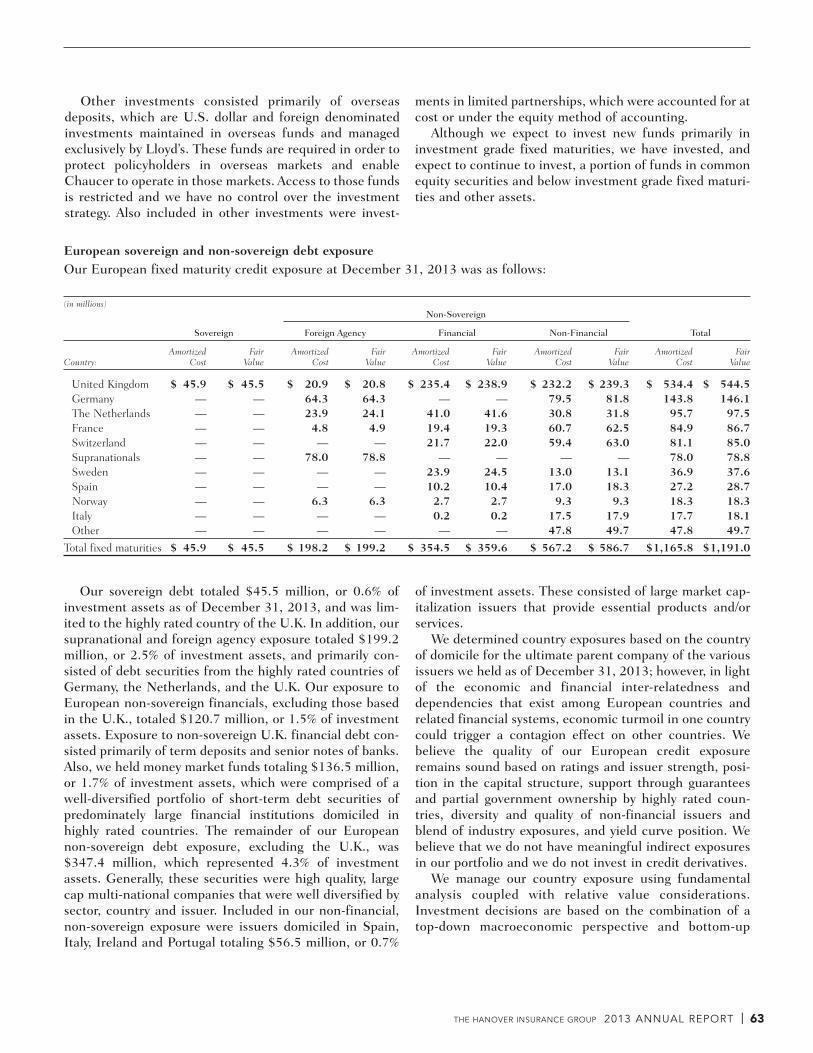
ments in limited partnerships, which were accounted for atcost or under the equity method of accounting.Although we expect to invest new funds primarily in
investment grade fixed maturities, we have invested, andexpect to continue to invest, a portion of funds in commonequity securities and below investment grade fixed maturi-ties and other assets.
European sovereign and non-sovereign debt exposureOur European fixed maturity credit exposure at December 31, 2013 was as follows:
(in millions)Non-Sovereign
Sovereign Foreign Agency Financial Non-Financial Total
Amortized Fair Amortized Fair Amortized Fair Amortized Fair Amortized FairCountry: Cost Value Cost Value Cost Value Cost Value Cost Value
United Kingdom $ 45.9 $ 45.5 $ 20.9 $ 20.8 $ 235.4 $ 238.9 $ 232.2 $ 239.3 $ 534.4 $ 544.5Germany — — 64.3 64.3 — — 79.5 81.8 143.8 146.1The Netherlands — — 23.9 24.1 41.0 41.6 30.8 31.8 95.7 97.5France — — 4.8 4.9 19.4 19.3 60.7 62.5 84.9 86.7Switzerland — — — — 21.7 22.0 59.4 63.0 81.1 85.0Supranationals — — 78.0 78.8 — — — — 78.0 78.8Sweden — — — — 23.9 24.5 13.0 13.1 36.9 37.6Spain — — — — 10.2 10.4 17.0 18.3 27.2 28.7Norway — — 6.3 6.3 2.7 2.7 9.3 9.3 18.3 18.3Italy — — — — 0.2 0.2 17.5 17.9 17.7 18.1Other — — — — — — 47.8 49.7 47.8 49.7
Total fixed maturities $ 45.9 $ 45.5 $ 198.2 $ 199.2 $ 354.5 $ 359.6 $ 567.2 $ 586.7 $1,165.8 $1,191.0
THE HANOVER INSURANCE GROUP 2013 ANNUAL REPORT | 63
Other investments consisted primarily of overseasdeposits, which are U.S. dollar and foreign denominatedinvestments maintained in overseas funds and managedexclusively by Lloyd’s. These funds are required in order toprotect policyholders in overseas markets and enableChaucer to operate in those markets. Access to those fundsis restricted and we have no control over the investmentstrategy. Also included in other investments were invest-
Our sovereign debt totaled $45.5 million, or 0.6% ofinvestment assets as of December 31, 2013, and was lim-ited to the highly rated country of the U.K. In addition, oursupranational and foreign agency exposure totaled $199.2million, or 2.5% of investment assets, and primarily con-sisted of debt securities from the highly rated countries ofGermany, the Netherlands, and the U.K. Our exposure toEuropean non-sovereign financials, excluding those basedin the U.K., totaled $120.7 million, or 1.5% of investmentassets. Exposure to non-sovereign U.K. financial debt con-sisted primarily of term deposits and senior notes of banks.Also, we held money market funds totaling $136.5 million,or 1.7% of investment assets, which were comprised of awell-diversified portfolio of short-term debt securities ofpredominately large financial institutions domiciled inhighly rated countries. The remainder of our Europeannon-sovereign debt exposure, excluding the U.K., was$347.4 million, which represented 4.3% of investmentassets. Generally, these securities were high quality, largecap multi-national companies that were well diversified bysector, country and issuer. Included in our non-financial,non-sovereign exposure were issuers domiciled in Spain,Italy, Ireland and Portugal totaling $56.5 million, or 0.7%
of investment assets. These consisted of large market cap-italization issuers that provide essential products and/orservices.We determined country exposures based on the country
of domicile for the ultimate parent company of the variousissuers we held as of December 31, 2013; however, in lightof the economic and financial inter-relatedness anddependencies that exist among European countries andrelated financial systems, economic turmoil in one countrycould trigger a contagion effect on other countries. Webelieve the quality of our European credit exposureremains sound based on ratings and issuer strength, posi-tion in the capital structure, support through guaranteesand partial government ownership by highly rated coun-tries, diversity and quality of non-financial issuers andblend of industry exposures, and yield curve position. Webelieve that we do not have meaningful indirect exposuresin our portfolio and we do not invest in credit derivatives.We manage our country exposure using fundamental
analysis coupled with relative value considerations.Investment decisions are based on the combination of atop-down macroeconomic perspective and bottom-up

| THE HANOVER INSURANCE GROUP 2013 ANNUAL REPORT64
credit security analysis. We monitor political and econom-ic developments; progress toward attainment of growthand budget targets; developments related to policy, reformand regulatory initiatives from European officials; progresstoward funding objectives, including the availability andcost of funding; outlook for credit ratings; ability of banksto meet increased regulatory capital standards, operate ina weakened macroeconomic environment, and maintainadequate liquidity and sufficient access to capital to meetfunding requirements; and contagion throughout thefinancial system as evidenced by increased costs for inter-bank funding, volatility in prices for stocks and corporatebonds, as well as the availability of capital.We actively manage our credit exposure and seek secu-
rities with the best combination of credit strength and val-uation. As we invest new capital, we consider expectationsfor the strength and duration of economic recovery inEurope and the possibility of additional volatility.Accordingly, we focus on providers of essential services orproducts best positioned to navigate the period of weakgrowth; industrials with greater international exposure,either locally or via exports, particularly to the developingworld, which we view favorably based on higher growthassumptions for emerging market economies; and financialinstitutions best positioned regarding asset quality, liquidi-ty and capital adequacy.Overall economic growth remains weak throughout
Europe but modestly improved versus the prior year.Volatility, while currently suppressed, could increase sud-denly as officials in Europe continue to address the twinobjectives of stimulating economic growth while balancingfiscal budgets. We believe that leaders remain committedto protecting the currency union and improving financialstability. Although the timing and degree of success towardachieving these goals remains uncertain, we do not antici-pate that future developments related to our European sov-ereign and non-sovereign debt exposure will have amaterial effect on our financial condition, results of oper-ations or liquidity.
OTHER-THAN-TEMPORARY IMPAIRMENTS
For the year ended December 31, 2013, we recognized inearnings $6.0 million of other-than-temporary impair-ments (“OTTI”), of which $4.1 million related to equitysecurities and $1.9 million related to debt securities. OTTIon equity securities consisted of $2.5 million from anemerging markets exchange-traded fund and $1.6 millionof common stocks. OTTI on debt securities consisted of$1.4 million of estimated credit losses, including $0.8 mil-lion of corporate securities in the industrial sector and$0.6 million on residential mortgage-backed securities,and $0.5 million on below investment grade corporatesecurities that we intended to sell. For the year ended
December 31, 2012, we recognized in earnings $7.8 mil-lion of OTTI, of which $6.6 million related to debt securi-ties and $1.2 million related to equity securities. OTTI ondebt securities consisted of $4.6 million of below invest-ment grade corporate bonds in the utilities and industrialsectors that we intended to sell and $2.0 million related toestimated credit losses, consisting of $0.9 million onmunicipal bonds, $0.7 million on residential mortgage-backed securities and $0.4 million on corporate bonds. Forthe year ended December 31, 2011, we recognized in earn-ings $6.9 million of OTTI, of which $5.5 million related todebt securities and $1.4 million related to equity securi-ties. OTTI on debt securities consisted of $4.6 million ofprimarily below investment grade corporate and municipalbonds that we intended to sell and $0.9 million related toestimated credit losses on residential mortgage-backedsecurities.
UNREALIZED LOSSES
The following table provides information about our fixedmaturities and equity securities that were in an unrealizedloss position. (See also Note 3 - “Investments” in the Notesto Consolidated Financial Statements included inFinancial Statements and Supplementary Data of thisForm 10-K).
DECEMBER 31 2013 2012
(in millions)Gross Gross
Unrealized Fair Unrealized FairLosses Value Losses Value
Fixed maturities:Investment grade:
12 months or less $ 64.7 $2,102.4 $ 3.4 $ 546.0Greater than 12 months 21.9 203.7 9.5 106.5
Total investment grade fixed maturities 86.6 2,306.1 12.9 652.5
Below investment grade:12 months or less 3.0 73.9 1.2 28.2Greater than 12 months 1.9 22.9 5.9 55.1
Total below investment grade fixed maturities 4.9 96.8 7.1 83.3
Equity securities:12 months or less 2.8 45.2 4.8 74.4Greater than 12 months 0.4 0.7 — —
Total equity securities 3.2 45.9 4.8 74.4
Total $ 94.7 $2,448.8 $ 24.8 $ 810.2
Gross unrealized losses on fixed maturities and equitysecurities increased $69.9 million compared to December31, 2012, primarily attributable to higher prevailing inter-est rates. At December 31, 2013, gross unrealized lossesconsisted primarily of $37.5 million of corporate fixed

THE HANOVER INSURANCE GROUP 2013 ANNUAL REPORT | 65
maturities, $19.1 million in municipal securities, $14.2million of U.S. Treasury and government agency securitiesand $14.1 million of residential mortgage-backed securities.We view gross unrealized losses on fixed maturities and
equity securities as temporary since it is our assessmentthat these securities will recover in the near term, allowingus to realize their anticipated long-term economic value.With respect to gross unrealized losses on fixed maturities,we do not intend to sell, nor is it more likely than not wewill be required to sell, such debt securities before thisexpected recovery of amortized cost (See also “Liquidityand Capital Resources” in Management’s Discussion andAnalysis of Financial Condition and Results of Operationsof this Form 10-K). With respect to equity securities, wehave the intent and ability to retain such investments forthe period of time anticipated to allow for this expectedrecovery in fair value. Inherent in our assessment are therisks that, subsequent to the balance sheet date, marketfactors may differ from our expectations; the global eco-nomic recovery is less robust than we expect or reverts torecessionary trends; we may decide to subsequently sell asecurity for unforeseen business needs; or changes in thecredit assessment or equity characteristics from our origi-nal assessment may lead us to determine that a sale at thecurrent value would maximize recovery on such invest-ments. To the extent that there are such adverse changes,an OTTI would be recognized as a realized loss. Althoughunrealized losses are not reflected in the results of finan-cial operations until they are realized or deemed “other-than-temporary”, the fair value of the underlyinginvestment, which does reflect the unrealized loss, isreflected in our Consolidated Balance Sheets.The following table sets forth gross unrealized losses for
fixed maturities by maturity period and for equity securi-ties at December 31, 2013 and 2012. Actual maturitiesmay differ from contractual maturities because borrowersmay have the right to call or prepay obligations, with orwithout call or prepayment penalties, or we may have theright to put or sell the obligations back to the issuers.
DECEMBER 31 2013 2012
(in millions)
Due in one year or less $ 0.5 $ 0.5Due after one year through five years 8.4 4.7Due after five years through ten years 36.6 2.5Due after ten years 26.9 8.8
72.4 16.5Mortgage-backed and asset-backed securities 19.1 3.5
Total fixed maturities 91.5 20.0Equity securities 3.2 4.8
Total fixed maturities and equity securities $ 94.7 $ 24.8
The carrying values of defaulted fixed maturity securi-ties on non-accrual status at December 31, 2013 and 2012were not material. The effects of non-accruals comparedwith amounts that would have been recognized in accor-dance with the original terms of the fixed maturities, werereductions in net investment income of $2.3 million, $2.5million and $2.3 million for the years ended December 31,2013, 2012 and 2011, respectively. Any defaults in thefixed maturities portfolio in future periods may negativelyaffect investment income.Our investment portfolio and shareholders’ equity can
be significantly impacted by changes in market values ofour securities. Market volatility could increase anddefaults on fixed income securities could occur. As a result,we could incur additional realized and unrealized losses infuture periods, which could have a material adverse impacton our results of operations and/or financial position.Monetary policies in the developed economies, particu-
larly in the United States, Europe and Japan, are support-ive of moderate economic growth, while fiscal policies aremore divergent and subject to change. During 2014 in theUnited States, the Federal Reserve (the “Fed”) begantapering its $85 billion of monthly bond purchases, knownas quantitative easing, which has put upward pressure oninvestment yields. However, the Fed’s balance sheet ofmore than $4 trillion is expected to keep rates low. The Fedhas indicated that it does not plan to begin raising short-term rates in the near future and is expected to continueto provide forward guidance to keep rates relatively stableeven as the economy strengthens. As a result, we anticipatemarginally higher new money yields and lower fixed matu-rity market values in 2014.While the United States is beginning to reduce its
extraordinary measures, other major central banks, such asthe Bank of England, the European Central Bank and theBank of Japan, continue with their stimulus policies asthey seek higher growth, and in the case of the latter two,fight deflation. The removal, modification or suggestion ofchanges in these policies could have an adverse effect onprevailing market interest rates and on issuers’ level ofbusiness activity or liquidity, increasing the probability offuture defaults. While we may experience defaults on fixedincome securities, particularly with respect to non-invest-ment grade securities, it is difficult to foresee whichissuers, industries or markets will be affected. As a result,the value of our fixed maturity portfolio could change rap-idly in ways we cannot currently anticipate and we couldincur additional realized and unrealized losses in futureperiods.
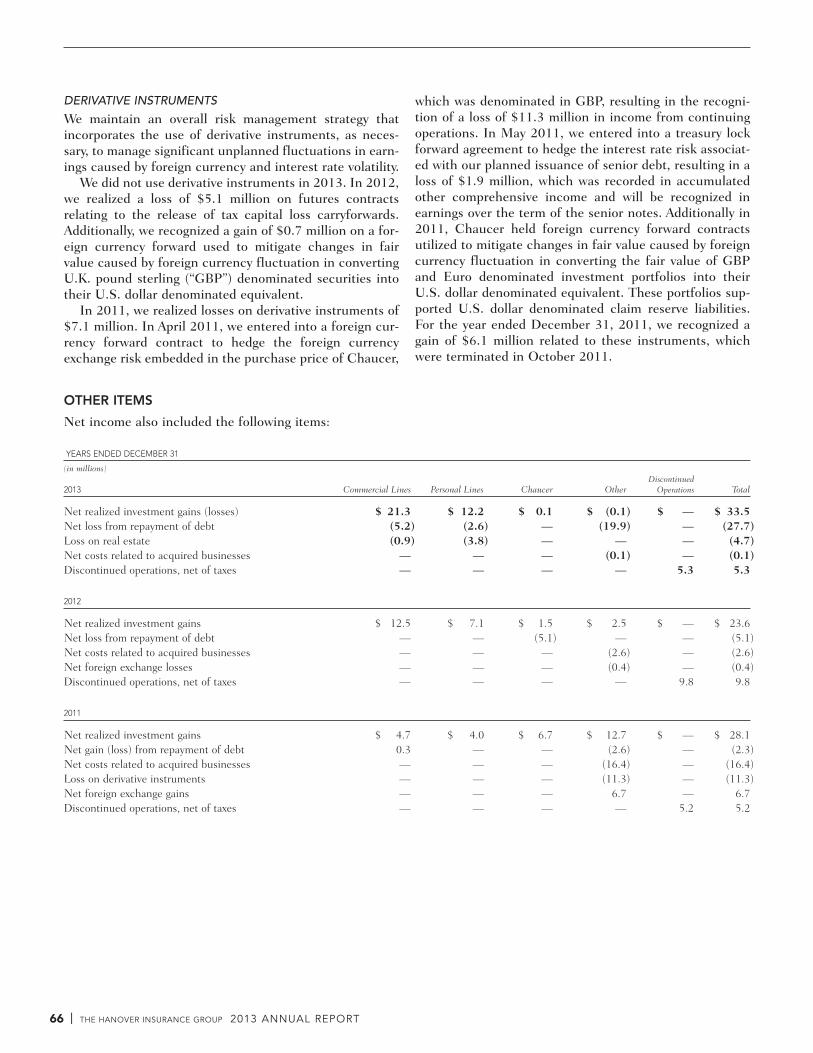
| THE HANOVER INSURANCE GROUP 2013 ANNUAL REPORT66
DERIVATIVE INSTRUMENTS
We maintain an overall risk management strategy thatincorporates the use of derivative instruments, as neces-sary, to manage significant unplanned fluctuations in earn-ings caused by foreign currency and interest rate volatility.We did not use derivative instruments in 2013. In 2012,
we realized a loss of $5.1 million on futures contractsrelating to the release of tax capital loss carryforwards.Additionally, we recognized a gain of $0.7 million on a for-eign currency forward used to mitigate changes in fairvalue caused by foreign currency fluctuation in convertingU.K. pound sterling (“GBP”) denominated securities intotheir U.S. dollar denominated equivalent.In 2011, we realized losses on derivative instruments of
$7.1 million. In April 2011, we entered into a foreign cur-rency forward contract to hedge the foreign currencyexchange risk embedded in the purchase price of Chaucer,
which was denominated in GBP, resulting in the recogni-tion of a loss of $11.3 million in income from continuingoperations. In May 2011, we entered into a treasury lockforward agreement to hedge the interest rate risk associat-ed with our planned issuance of senior debt, resulting in aloss of $1.9 million, which was recorded in accumulatedother comprehensive income and will be recognized inearnings over the term of the senior notes. Additionally in2011, Chaucer held foreign currency forward contractsutilized to mitigate changes in fair value caused by foreigncurrency fluctuation in converting the fair value of GBPand Euro denominated investment portfolios into theirU.S. dollar denominated equivalent. These portfolios sup-ported U.S. dollar denominated claim reserve liabilities.For the year ended December 31, 2011, we recognized again of $6.1 million related to these instruments, whichwere terminated in October 2011.
OTHER ITEMS
Net income also included the following items:
YEARS ENDED DECEMBER 31
(in millions)Discontinued
2013 Commercial Lines Personal Lines Chaucer Other Operations Total
Net realized investment gains (losses) $ 21.3 $ 12.2 $ 0.1 $ (0.1) $ — $ 33.5Net loss from repayment of debt (5.2) (2.6) — (19.9) — (27.7)Loss on real estate (0.9) (3.8) — — — (4.7)Net costs related to acquired businesses — — — (0.1) — (0.1)Discontinued operations, net of taxes — — — — 5.3 5.3
2012
Net realized investment gains $ 12.5 $ 7.1 $ 1.5 $ 2.5 $ — $ 23.6Net loss from repayment of debt — — (5.1) — — (5.1)Net costs related to acquired businesses — — — (2.6) — (2.6)Net foreign exchange losses — — — (0.4) — (0.4)Discontinued operations, net of taxes — — — — 9.8 9.8
2011
Net realized investment gains $ 4.7 $ 4.0 $ 6.7 $ 12.7 $ — $ 28.1Net gain (loss) from repayment of debt 0.3 — — (2.6) — (2.3)Net costs related to acquired businesses — — — (16.4) — (16.4)Loss on derivative instruments — — — (11.3) — (11.3)Net foreign exchange gains — — — 6.7 — 6.7Discontinued operations, net of taxes — — — — 5.2 5.2

THE HANOVER INSURANCE GROUP 2013 ANNUAL REPORT | 67
We manage investment assets for our CommercialLines, Personal Lines, and Other segments based on therequirements of our U.S. combined property and casualtycompanies. We allocate the investment income, expensesand realized gains and losses to our Commercial Lines,Personal Lines and Other segments based on actuarialinformation related to the underlying businesses. We man-age investment assets separately for our Chaucer segment.Net realized gains on investments were $33.5 million,
$23.6 million, and $28.1 million for 2013, 2012, and2011, respectively. Net realized gains in 2013 were prima-rily due to $41.3 million of gains recognized from the saleof equities and fixed maturities, partially offset by $6.0 mil-lion of other-than-temporary impairments. Net realizedgains in 2012 were primarily due to $31.8 million of gainsrecognized from the sale of equities and fixed maturities,partially offset by $7.8 million of other-than-temporaryimpairments. Net realized gains in 2011 were primarilydue to $27.7 million of gains recognized from the sale offixed maturities and equity securities and $6.1 million ofgains on foreign currency hedges, partially offset by $6.9million of other-than-temporary impairments.In 2013, through several transactions, we repurchased
senior debentures with a net carrying value of $73.8 mil-lion at a cost of $93.7 million, resulting in a loss of $19.9million. Additionally in 2013, we repaid $46.3 million ofour FHLBB advances plus prepayment fees of $7.8 millionfor a total payment of $54.1 million. In 2012, we repur-chased $65.4 million of our subordinated unsecured notesrelated to Chaucer at a par value. These notes had a carry-ing value of $60.3 million, resulting in a net loss of $5.1million on the repurchases. In addition, we repurchased$7.0 million of capital securities related to AIX Holdings,Inc. (“AIX”) at par value. In 2011, we repurchased in sev-eral transactions, $69.5 million of our subordinated deben-tures at a cost of $72.1 million, resulting in a net loss of$2.6 million on the repurchases. In addition, we repur-chased $8.0 million of capital securities related to AIX at acost of $7.7 million, resulting in a gain of $0.3 million.In 2013, we consolidated our operations in Howell,
Michigan from two buildings into one building. Thisresulted in a plan to relocate the employees and pursue thesale of one of the buildings. In conjunction with theplanned relocation, we recognized a loss of $4.7 million.This is included in other operating expenses in theConsolidated Statements of Income during the year endedDecember 31, 2013.
Acquisition costs were $0.1 million and $2.6 million in2013 and 2012, respectively, and $16.4 million in 2011,which primarily consisted of advisory, legal, and account-ing costs associated with the acquisition of Chaucer onJuly 1, 2011. For information on the loss on derivativeinstruments and net foreign exchange gains recognizedduring 2011, see Note 2 – “Acquisitions and DiscontinuedOperations” of the Notes to Consolidated FinancialStatements included in Financial Statements andSupplementary Data of this Form 10-K.
QUANTITATIVE AND QUALITATIVE DISCLOSURESABOUT MARKET RISK
INTEREST RATE SENSITIVITY
Operations are subject to risk resulting from interest ratefluctuations which may adversely impact the valuation ofthe investment portfolio. In a rising interest rate environ-ment, the value of the fixed income sector, which compris-es 86% of our investment portfolio, may decline as a resultof decreases in the fair value of the securities. Our intentis to hold securities to maturity and recover the decline invaluation as prices accrete to par. However, our intent maychange prior to maturity due to changes in the financialmarkets, our analysis of an issuer’s credit metrics andprospects, or as a result of changes in cash flow needs.Interest rate fluctuations may also reduce net investmentincome and as a result, profitability. The portfolio mayrealize lower yields and therefore lower net investmentincome on securities because the securities with prepay-ment and call features may prepay at a different rate thanoriginally projected. Also, funds may not be available toinvest at higher interest rates.In a declining interest rate environment, prepayments
and calls may increase as issuers exercise their option torefinance at lower rates. The resulting funds would bereinvested at lower yields.The following table illustrates the estimated impact on
the fair value of our investment portfolio at December 31,2013 of hypothetical changes in prevailing interest rates,defined as changes in interest rates on U.S. Treasury debt.It does not reflect changes in credit spreads, liquidityspreads and other factors that affect the value of securities.Since changes in prevailing interest rates are often accom-panied by changes in these other factors, the reader shouldnot assume that an actual change in interest rates wouldresult in the values illustrated.

| THE HANOVER INSURANCE GROUP 2013 ANNUAL REPORT68
(dollars in millions)
Investment Type +300bp +200bp +100bp 0 –100bp –200bp –300bp
Residential mortgage-backed securities $ 650 $ 675 $ 700 $ 730 $ 755 $ 770 $ 775Municipal securities 955 1,010 1,065 1,125 1,190 1,245 1,285All other fixed income securities 4,580 4,745 4,925 5,115 5,295 5,435 5,515
Total $ 6,185 $ 6,430 $ 6,690 $ 6,970 $ 7,240 $ 7,450 $ 7,575
invest fixed income assets at similar rates of return; there-fore, earnings on a similar level of assets are not sufficientto cover current debt interest costs.The following tables for the years ended December 31,
2013 and 2012 provide information about financial instru-ments that are sensitive to changes in interest rates. Thetables present principal cash flows and related weighted-average interest rates by expected maturities. Expectedmaturities may differ from contractual maturities becauseborrowers may have the right to call or prepay obligationswith or without call or prepayment penalties, or we mayhave the right to put or sell the obligations back to theissuers. Mortgage-backed and asset-backed securities areincluded in the category representing their expected matu-rity. Available-for-sale securities include both U.S. and for-eign-denominated fixed maturities. Additionally, we haveassumed available-for-sale securities are similar enough toaggregate those securities for presentation purposes.Specifically, variable rate available-for-sale securities com-prise an immaterial portion of the portfolio and do nothave a significant impact on weighted-average interestrates. Therefore, the variable rate investments are not pre-sented separately; instead they are included in the tables attheir current interest rate. Debt is presented at contractu-al maturities, except for the FHLBB advances which wererepaid in January 2013.
Our overall investment strategy is intended to balanceinvestment income with credit and interest rate risk, whilemaintaining sufficient liquidity and the opportunity forcapital growth. The asset allocation process takes into con-sideration the types of business written, the level of surplusrequired to support our different businesses and the riskreturn profiles of the underlying asset classes. We look tobalance the goals of capital preservation, net investmentincome stability, liquidity and total return.The majority of our assets are invested in the fixed
income markets. Through fundamental research and cred-it analysis, with a focus on value investing, our investmentprofessionals seek to identify a portfolio of stable income-producing higher quality U.S. government, foreign govern-ment, municipal, corporate, residential and commercialmortgage-backed securities and asset-backed securities.We have a general policy of diversifying investments bothwithin and across major investment and industrial sectorsto mitigate credit and interest rate risk. We monitor thecredit quality of our investments and our exposure to indi-vidual markets, borrowers, industries, sectors and, in thecase of direct commercial mortgages and commercialmortgage-backed securities, property types and geographiclocations. In addition, we currently carry debt which issubject to interest rate risk, which was issued at fixed inter-est rates between 5.50% and 8.207%. Current market con-ditions, in light of our risk tolerance, restrict our ability to

THE HANOVER INSURANCE GROUP 2013 ANNUAL REPORT | 69
FAIRVALUE
DECEMBER 31, 2013 2014 2015 2016 2017 2018 THEREAFTER TOTAL 12/31/13
(dollars in millions)
Rate Sensitive Assets:Available-for-sale securities $ 663.6 $768.9 $843.3 $ 670.6 $ 607.5 $3,248.6 $6,802.5 $6,970.6Average interest rate 3.68% 3.83% 4.25% 4.04% 3.75% 4.17% 4.04%
Rate Sensitive Liabilities:Debt $ — $ — $ — $ — $ — $ 903.9 $ 903.9 $ 961.7Average interest rate — — — — — 6.70% 6.70%
FAIRVALUE
DECEMBER 31, 2012 2013 2014 2015 2016 2017 THEREAFTER TOTAL 12/31/12
(dollars in millions)
Rate Sensitive Assets:Available-for-sale securities $ 669.3 $ 791.1 $ 830.5 $ 759.6 $ 627.9 $ 2,841.3 $ 6,519.7 $ 6,952.2Average interest rate 3.98% 4.11% 3.91% 4.62% 4.15% 4.46% 4.29%
Rate Sensitive Liabilities:Debt $ 46.3 $ — $ — $ — $ — $ 803.1 $ 849.4 $ 995.2Average interest rate 3.88% — — — — 6.84% 6.68%
EQUITY PRICE RISK
Our equity securities portfolio is exposed to equity pricerisk arising from potential volatility in equity market prices.Portfolio characteristics are analyzed regularly and pricerisk is actively managed through a variety of techniques. Ahypothetical increase or decrease of 10% in the marketprice of our equity securities would have resulted in anincrease or decrease in the fair value of the equity securi-ties portfolio of approximately $43 million at December 31,2013 and approximately $32 million at December 31, 2012.
FOREIGN CURRENCY EXCHANGE RISK
Chaucer has exposure to foreign currency risk, mostnotably in insurance contracts and invested assets. Someof the insurance contracts provide that ultimate losses maybe payable in foreign currencies depending on the countryof original loss. Foreign currency exchange rate risk existsto the extent that there is an increase in the exchange rateof the foreign currency in which losses are ultimatelyowed. Thus, Chaucer attempts to manage foreign curren-cy risk by seeking to match liabilities under insurance andreinsurance policies that are payable in foreign currencieswith cash and investments that are denominated in suchcurrencies. We may also utilize foreign currency forwardcontracts as part of our investment strategy. The principalcurrency creating foreign exchange risk for us is the U.K.pound sterling, and to a lesser extent, the Euro and theCanadian dollar. A hypothetical 10% reduction in the valueof foreign denominated investments would be expected toproduce a loss in fair value of approximately $112 millionat December 31, 2013 and approximately $124 million atDecember 31, 2012.
DISCONTINUED OPERATIONS
Discontinued operations primarily consist of our formerlife insurance businesses which were sold prior to 2009,our Discontinued Accident and Health Business and ourformer third party administration business, CMI, whichwas sold in 2012.The Discontinued Accident and Health Business had no
significant financial results that impacted 2013, 2012 or2011.Results from discontinued operations for the year ended
December 31, 2013 include $5.8 million relating to ourformer life insurance businesses. This was primarily due toan insurance settlement related to a class action lawsuit,net of tax.Discontinued operations for the year ended December
31, 2012 primarily included the net gain on the sale of ourthird party administration subsidiary, CMI, which was com-pleted on April 30, 2012. CMI provided third party workers’compensation and disability program administration servic-es (such as claims administration, loss prevention and med-ical cost containment and in-house excess workers’compensation coverage) to public entities, self-insuredemployers and group programs. CMI generated total rev-enues of $4.4 million during the four months ended April30, 2012 and $12.5 million during the year endedDecember 31, 2011. Income before taxes totaled $0.7 mil-lion during the first four months of 2012, while contribut-ing $2.0 million during 2011. Assets and shareholder’sequity transferred as part of this sale totaled $10.9 millionand $0.6 million, respectively. This sale resulted in a netgain of $10.8 million after taxes and is included in discon-tinued operations for the year ended December 31, 2012.

| THE HANOVER INSURANCE GROUP 2013 ANNUAL REPORT70
INCOME TAXES
We are subject to the tax laws and regulations of the U.S.and foreign countries in which we operate. We file a con-solidated U.S. federal income tax return that includes theholding company and its U.S. subsidiaries. Generally, taxesare accrued at the U.S. statutory tax rate of 35% forincome from the U.S. operations. Our primary non-U.S.jurisdiction is the U.K. In July 2012, the U.K. statutoryrate decreased from 26% to 24% effective April 1, 2012and from 24% to 23% effective April 1, 2013. Furtherdecreases were enacted in July 2013 to reduce the statuto-ry rate from 23% to 21% effective April 1, 2014 and from21% to 20% effective April 1, 2015. We accrue taxes oncertain non-U.S. income that is subject to U.S. tax at theU.S. tax rate. Foreign tax credits, where available, are uti-lized to offset U.S. tax as permitted. Certain of our non-U.S. income is not subject to U.S. tax until repatriated.Foreign taxes on this non-U.S. income are accrued at thelocal foreign rate and do not have an accrual for U.S.deferred taxes since these earnings are intended to beindefinitely reinvested overseas.The provision for income taxes from continuing opera-
tions was an expense of $83.4 million in 2013, comparedto benefits of $17.4 million and $9.9 million in 2012 and2011, respectively. These amounts resulted in consolidat-ed effective tax rates of 25.3%, (60.6)%, and (45.8)% onpre-tax income for 2013, 2012, and 2011, respectively.These provisions reflect benefits related to tax planningstrategies implemented in prior years of $17.5 million,$14.3 million and $9.7 million in 2013, 2012 and 2011,respectively. The provisions in 2012 and 2011 also reflectdecreases in our valuation allowance related to capital losscarryforwards of $7.7 million and $7.5 million, respective-ly. Absent these benefits, the provision for income taxes for2013, 2012, and 2011 would have been expenses of$100.9 million or 30.7%, $4.6 million, or 16.0%, and $7.3million, or 33.8%, respectively. The increase in 2013 effec-tive tax rate is primarily due to higher underwriting income.The income tax provision on operating income was an
expense of $100.9 million for 2013, compared to a benefitof $1.9 million for 2012 and an expense of $2.6 million in2011. These provisions resulted in effective tax rates foroperating income of 30.8%, (14.4)% and 15.5% in 2013,2012 and 2011, respectively. The increase in expense for2013 is primarily due to higher underwriting income. Thetax benefit in 2012 is primarily due to income from foreignoperations not subject to U.S. tax and lower domesticunderwriting income.Included in our deferred tax asset as of December 31,
2013 is an asset of $42.1 million related to U.S. net oper-ating loss carryforwards and a deferred tax asset of $22.4
million related to foreign net operating loss carryforwards.Our pre-tax U.S. operating loss carryforwards of $120.3million will expire beginning in 2031. Our pre-tax foreignoperating loss carryforwards of $66.2 million were gener-ated in the U.K. and have no expiration date. It is our opin-ion that there will be sufficient future U.S. and U.K.taxable income to utilize these loss carryforwards. Our esti-mate of the gross amount and likely realization of loss car-ryforwards may change over time.Included in our deferred tax net asset as of December
31, 2013 are assets of $110.3 million related to alternativeminimum tax (“AMT”) credit carryforwards and $12.8 mil-lion related to foreign tax credit carryforwards. We may uti-lize these credits to offset future taxable income. Theresult of their utilization will be a lower current tax rateoffset by a higher deferred tax provision, and also lowercash expenditures for federal income taxes during the uti-lization period. There is no expiration on AMT credit car-ryforwards and our foreign tax credit carryforwards willexpire beginning in 2022. It is our opinion that there willbe sufficient future U.S. and U.K. taxable income to utilizethese tax credit carryforwards. Our estimate of the grossamount and likely realization of tax credit carryforwardsmay change over time.The IRS audits of the years 2007 and 2008 commenced
in April 2010. In 2011, we received a Revenue AgentReport for the 2007 and 2008 IRS audit. We agreed to allproposed adjustments other than the disallowance ofdeduction for certain loss reserves, for which we filed a for-mal protest. In December 2013, we reached a tentativesettlement on the disallowance of deduction for certainloss reserves and as a result a liability for uncertain taxpositions was established for $4.8 million, with an offset-ting deferred tax asset. The net impact is a decrease toincome from continuing operations of $0.5 million. Weexpect to reach a final settlement of this issue during 2014.During 2013, we recorded a valuation allowance of $2.9
million related to our deferred tax asset on the unrealizeddepreciation in our investment portfolio. It is our opinionthat it is more likely than not that this asset will not berealized and accordingly, we recorded this valuationallowance as an adjustment to accumulated other compre-hensive income.In prior years, we completed several transactions which
resulted in the realization, for tax purposes only, of unreal-ized gains in our investment portfolio. We realized $69.6million and $98.4 million, respectively, in 2012 and 2011as a result of such transactions. These transactionsenabled us to realize capital loss carryforwards to offsetthese gains, and resulted in the release of the valuationallowance we held against the deferred tax asset related tothese capital loss carryforwards. In 2012, we released

THE HANOVER INSURANCE GROUP 2013 ANNUAL REPORT | 71
$24.4 million of our valuation allowance which wasrecorded as a benefit in accumulated other comprehensiveincome. In 2011, we released $29.0 million of our valua-tion allowance which $0.2 million was reflected in incomefrom continuing operations and the remaining $28.8 mil-lion was reflected as a benefit in accumulated other com-prehensive income. During 2013, 2012 and 2011, werecognized in income from continuing operations, relatedto non-operating income, $17.5 million, $14.3 million and$9.7 million, respectively. The remaining amount of$107.7 million in accumulated other comprehensiveincome will be released into income from continuing oper-ations in future years, as the investment securities subjectto these transactions are sold or mature.During 2012, we released $35.9 million of our valuation
allowance related to our deferred tax asset held at thebeginning of the year. The release of this valuationallowance resulted from the aforementioned transactionwhich utilized our capital loss carryforwards, unrealizedappreciation in our investment portfolio, and net realizedcapital gains in our Consolidated Statements of Income.Accordingly, we recorded decreases in our valuationallowance of $25.3 million as an adjustment to accumulat-ed other comprehensive income, $7.7 million as an adjust-ment to income tax expense from continuing operations,and $2.9 million in discontinued operations.During 2011, we reduced the valuation allowance relat-
ed to our deferred tax asset by $55.6 million, from $91.5million to $35.9 million. There were four principal compo-nents to this reduction. First, we decreased the valuationallowance by $29.0 million as a result of the transactionsdescribed above which utilized our capital loss carryfor-wards. Second, we decreased the valuation allowance by$21.9 million on certain unrealized losses as a result ofunrealized appreciation in our investment portfolio. Thisdecrease was reflected as an increase in accumulated othercomprehensive income. Third, as a result of $28.1 millionin net realized gains during 2011, we decreased the valua-tion allowance by $7.5 million as an increase to incomefrom continuing operations, since these gains utilized ourcapital loss carryforwards. Fourth, in the 2010 U.S. feder-al income tax return, we were able to utilize an additional$7.6 million of capital loss carryforwards that expired in2010. As such, we increased the valuation allowance by$2.6 million with an equal and offsetting increase to therelated deferred tax asset. The remaining increase of $0.2million was attributable to other items reflected as expensefrom discontinued operations.
CRITICAL ACCOUNTING ESTIMATES
The discussion and analysis of our financial condition andresults of operations are based upon the consolidatedfinancial statements. These statements have been preparedin accordance with U.S. GAAP, which requires us to makeestimates and assumptions that affect the reportedamounts of assets and liabilities and disclosure of contin-gent assets and liabilities at the date of the financial state-ments and the reported amount of revenues and expensesduring the reporting period. Actual results could differfrom those estimates. The following critical accountingestimates are those which we believe affect the more sig-nificant judgments and estimates used in the preparationof our financial statements. Additional information aboutother significant accounting policies and estimates may befound in Note 1—“Summary of Significant AccountingPolicies” in the Notes to Consolidated FinancialStatements included in Financial Statements andSupplementary Data of this Form 10-K.
RESERVE FOR LOSSES AND LOSS EXPENSES
See “Results of Operations – Segments - Reserve forLosses and Loss Adjustment Expenses” in Management’sDiscussion and Analysis of Financial Condition andResults of Operations of this Form 10-K for a discussion ofour critical accounting estimates for loss reserves.
REINSURANCE RECOVERABLE BALANCES
We share insurance risk of the primary underlying con-tracts with various insurance entities through the use ofreinsurance contracts. As a result, when we experience lossevents that are subject to a reinsurance contract, reinsur-ance recoveries are recorded. The amount of the reinsur-ance recoverable can vary based on the size of theindividual loss or the aggregate amount of all losses in aparticular line, book of business or an aggregate amountassociated with a particular accident year. The valuation oflosses recoverable depends on whether the underlying lossis a reported loss, or an incurred but not reported loss. Forreported losses, we value reinsurance recoverables at thetime the underlying loss is recognized, in accordance withcontract terms. For incurred but not reported losses, weestimate the amount of reinsurance recoverable based onthe terms of the reinsurance contracts and historical rein-surance recovery information and apply that informationto the gross loss reserve estimates. The most significantassumption we use is the average size of the individuallosses for those claims that have occurred but have not yetbeen recorded by us. The reinsurance recoverable is basedon what we believe are reasonable estimates and is dis-
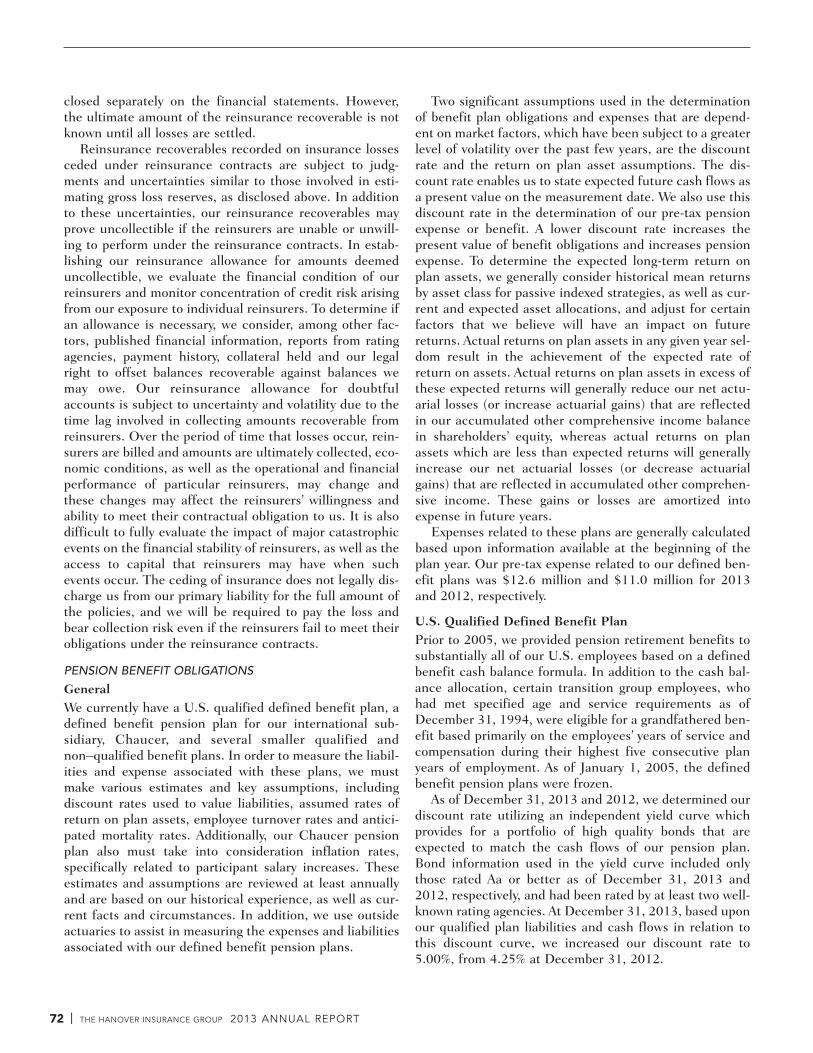
| THE HANOVER INSURANCE GROUP 2013 ANNUAL REPORT72
closed separately on the financial statements. However,the ultimate amount of the reinsurance recoverable is notknown until all losses are settled.Reinsurance recoverables recorded on insurance losses
ceded under reinsurance contracts are subject to judg-ments and uncertainties similar to those involved in esti-mating gross loss reserves, as disclosed above. In additionto these uncertainties, our reinsurance recoverables mayprove uncollectible if the reinsurers are unable or unwill-ing to perform under the reinsurance contracts. In estab-lishing our reinsurance allowance for amounts deemeduncollectible, we evaluate the financial condition of ourreinsurers and monitor concentration of credit risk arisingfrom our exposure to individual reinsurers. To determine ifan allowance is necessary, we consider, among other fac-tors, published financial information, reports from ratingagencies, payment history, collateral held and our legalright to offset balances recoverable against balances wemay owe. Our reinsurance allowance for doubtfulaccounts is subject to uncertainty and volatility due to thetime lag involved in collecting amounts recoverable fromreinsurers. Over the period of time that losses occur, rein-surers are billed and amounts are ultimately collected, eco-nomic conditions, as well as the operational and financialperformance of particular reinsurers, may change andthese changes may affect the reinsurers’ willingness andability to meet their contractual obligation to us. It is alsodifficult to fully evaluate the impact of major catastrophicevents on the financial stability of reinsurers, as well as theaccess to capital that reinsurers may have when suchevents occur. The ceding of insurance does not legally dis-charge us from our primary liability for the full amount ofthe policies, and we will be required to pay the loss andbear collection risk even if the reinsurers fail to meet theirobligations under the reinsurance contracts.
PENSION BENEFIT OBLIGATIONS
GeneralWe currently have a U.S. qualified defined benefit plan, adefined benefit pension plan for our international sub-sidiary, Chaucer, and several smaller qualified andnon–qualified benefit plans. In order to measure the liabil-ities and expense associated with these plans, we mustmake various estimates and key assumptions, includingdiscount rates used to value liabilities, assumed rates ofreturn on plan assets, employee turnover rates and antici-pated mortality rates. Additionally, our Chaucer pensionplan also must take into consideration inflation rates,specifically related to participant salary increases. Theseestimates and assumptions are reviewed at least annuallyand are based on our historical experience, as well as cur-rent facts and circumstances. In addition, we use outsideactuaries to assist in measuring the expenses and liabilitiesassociated with our defined benefit pension plans.
Two significant assumptions used in the determinationof benefit plan obligations and expenses that are depend-ent on market factors, which have been subject to a greaterlevel of volatility over the past few years, are the discountrate and the return on plan asset assumptions. The dis-count rate enables us to state expected future cash flows asa present value on the measurement date. We also use thisdiscount rate in the determination of our pre-tax pensionexpense or benefit. A lower discount rate increases thepresent value of benefit obligations and increases pensionexpense. To determine the expected long-term return onplan assets, we generally consider historical mean returnsby asset class for passive indexed strategies, as well as cur-rent and expected asset allocations, and adjust for certainfactors that we believe will have an impact on futurereturns. Actual returns on plan assets in any given year sel-dom result in the achievement of the expected rate ofreturn on assets. Actual returns on plan assets in excess ofthese expected returns will generally reduce our net actu-arial losses (or increase actuarial gains) that are reflectedin our accumulated other comprehensive income balancein shareholders’ equity, whereas actual returns on planassets which are less than expected returns will generallyincrease our net actuarial losses (or decrease actuarialgains) that are reflected in accumulated other comprehen-sive income. These gains or losses are amortized intoexpense in future years.Expenses related to these plans are generally calculated
based upon information available at the beginning of theplan year. Our pre-tax expense related to our defined ben-efit plans was $12.6 million and $11.0 million for 2013and 2012, respectively.
U.S. Qualified Defined Benefit PlanPrior to 2005, we provided pension retirement benefits tosubstantially all of our U.S. employees based on a definedbenefit cash balance formula. In addition to the cash bal-ance allocation, certain transition group employees, whohad met specified age and service requirements as ofDecember 31, 1994, were eligible for a grandfathered ben-efit based primarily on the employees’ years of service andcompensation during their highest five consecutive planyears of employment. As of January 1, 2005, the definedbenefit pension plans were frozen.As of December 31, 2013 and 2012, we determined our
discount rate utilizing an independent yield curve whichprovides for a portfolio of high quality bonds that areexpected to match the cash flows of our pension plan.Bond information used in the yield curve included onlythose rated Aa or better as of December 31, 2013 and2012, respectively, and had been rated by at least two well-known rating agencies. At December 31, 2013, based uponour qualified plan liabilities and cash flows in relation tothis discount curve, we increased our discount rate to5.00%, from 4.25% at December 31, 2012.

THE HANOVER INSURANCE GROUP 2013 ANNUAL REPORT | 73
For the years ended December 31, 2013 and 2012, theexpected rate of return on our qualified plan assets was5.25% and 6.0%, respectively. The decrease reflectsdeclines in the fixed maturities markets in general. Actualreturns of the plan investments generated approximately$3 million of losses and $57 million of gains during 2013and 2012, respectively, as compared to expected returns ofapproximately $30 million and $33 million, respectively.The plan assets consisted of 84% fixed maturities and 16%equities at December 31, 2013.In 2013, actuarial gains of approximately $37 million
primarily resulting from the increase in the discount ratefrom the prior year were partially offset by investment loss-es of approximately $33 million. Actuarial losses of approx-imately $48 million experienced in 2012 primarily as aresult of a decrease in the discount rate from the prior yearwere offset by the benefit from investment gains of approx-imately $24 million. The net gain in 2013 resulted in anadjustment to our accumulated actuarial loss of $4.2 mil-lion, which is reflected as an increase to our accumulatedother comprehensive income. The net loss in 2012 result-ed in an adjustment to our accumulated net actuarial loss-es of $23.7 million, which is reflected as a decrease to ouraccumulated other comprehensive income. The change inthese actuarial gains and losses is amortized into earningsin future years. In addition to the adjustments to accumu-lated other comprehensive income from the actuarial gainsoccurring in 2013 was amortization of actuarial lossesfrom prior years of $12.9 million. The adjustments toaccumulated other comprehensive income from the actu-arial losses occurring in 2012 were offset by the amortiza-tion of actuarial losses from prior years of $10.8 million.Given the effect of our actual investment experience in2013, and taking into consideration the increase in dis-count rates in 2014, U.S. pension related expenses areexpected to increase slightly from 2013. Accordingly, in2014 we expect our pre-tax pension expense for the U.S.qualified defined benefit pension plan to remain consistentwith that in 2013 at approximately $8 million.Holding all other assumptions constant, sensitivity to
changes in our key assumptions related to our U.S. quali-fied defined benefit pension plan is as follows:
Discount Rate – A 25 basis point increase in the dis-count rate would decrease our pension expense in 2014by $1.6 million and decrease our projected benefit obli-gation by $11.9 million. A 25 basis point reduction inthe discount rate would increase our pension expenseby $1.5 million and increase our projected benefit obli-gation by $12.4 million.
Expected Return on Plan Assets – A 25 basis point increaseor decrease in the expected return on plan assets woulddecrease or increase our pension expense in 2014 by$1.3 million.
Chaucer Pension PlanPrior to 2002, Chaucer provided defined benefit pensionretirement benefits to certain of its employees. As ofDecember 31, 2001, the defined benefit section of thepension plan was closed to new members. The definedbenefit obligation for this plan is based on the employees’years of service and final pensionable salary.As of December 31, 2013 and 2012, we determined the
discount rate utilizing an independent yield curve whichprovides for a portfolio of high quality bonds that areexpected to match the cash flows of the Chaucer plan. AtDecember 31, 2013, based upon Chaucer’s plan liabilitiesand cash flows in relation to these yield curves, wedecreased the discount rate to 4.50% from 4.80% atDecember 31, 2012.For the years ended December 31, 2013 and 2012, the
expected rate of return on plan assets was 6.70% and7.50%, respectively. The composition of Chaucer’s planassets are 74% equities, 19% fixed maturities, and 7% realestate funds at December 31, 2013. Actual returns of theplan investments generated approximately $17 million and$10 million of gains during the years ended December 31,2013 and 2012, respectively, as compared to expectedreturns of approximately $6 million in each year.The benefits from the investment gains experienced in
2013 and 2012 were partially offset by decreases in thediscount rate from the prior year, resulting in net actuarialgains for the Chaucer plan of approximately $7.5 millionand $2.5 million in 2013 and 2012, respectively. Thesegains are reflected as increases to our accumulated othercomprehensive income. This balance is amortized intoearnings in future periods. Given the effect of our actualinvestment experience in 2013, expected rates of return oninvestments in 2014 and taking into consideration theslight decrease in discount rates, pension related expensesfor the Chaucer plan are expected to decrease by approxi-mately $1 million (using the December 31, 2013 GBP toU.S. dollar conversion rate of 1.56) to a benefit of $0.4million.Holding all other assumptions constant (using the
December 31, 2013 GBP to U.S. dollar conversion rate of1.56), sensitivity to changes in our key assumptions relat-ed to our Chaucer pension plan is as follows:
Discount Rate – A 25 basis point increase in the dis-count rate would decrease our pension expense in 2014by $0.1 million and decrease our projected benefit obli-gation by $7.1 million. A 25 basis point reduction in thediscount rate would increase our pension expense by$0.1 million and increase our projected benefit obliga-tion by $7.5 million.
Expected Return on Plan Assets – A 25 basis point increaseor decrease in the expected return on plan assets woulddecrease or increase our pension expense in 2014 by$0.3 million.

| THE HANOVER INSURANCE GROUP 2013 ANNUAL REPORT74
OTHER-THAN-TEMPORARY IMPAIRMENTS
We employ a systematic methodology to evaluate declinesin fair values below amortized cost for all fixed maturityand equity security investments. The methodology utilizesa quantitative and qualitative process which seeks toensure that available evidence concerning the declines infair value below amortized cost is evaluated in a disciplinedmanner. In determining whether a decline in fair valuebelow amortized cost is other-than-temporary, we evaluateseveral factors and circumstances, including the issuer’soverall financial condition; the issuer’s credit and financialstrength ratings; the issuer’s financial performance, includ-ing earnings trends, dividend payments and asset quality;any specific events which may influence the operations ofthe issuer; the general outlook for market conditions in theindustry or geographic region in which the issuer operates;and the length of time and the degree to which the fairvalue of an issuer’s securities remains below our cost. Withrespect to fixed maturity investments, we consider factorsthat might raise doubt about the issuer’s ability to makecontractual payments as they become due and whether weexpect to recover the entire amortized cost basis of thesecurity. With respect to equity securities, we consider ourability and intent to hold the investment for a period oftime to allow for a recovery in value.We monitor corporate fixed maturity securities with
unrealized losses on a quarterly basis and more frequentlywhen necessary to identify potential credit deterioration asevidenced by ratings downgrades, unexpected price vari-ances, and/or company or industry specific concerns. Weapply consistent standards of credit analysis whichincludes determining whether the issuer is current on itscontractual payments and we consider past events, currentconditions and reasonable forecasts to evaluate whetherwe expect to recover the entire amortized cost basis of thesecurity. We utilize valuation declines as a potential indica-tor of credit deterioration and apply additional levels ofscrutiny in our analysis as the severity of the declineincreases or duration persists.For our impairment review of asset-backed fixed matu-
rity securities, we forecast our best estimate of theprospective future cash flows of the security to determineif we expect to recover the entire amortized cost basis ofthe security. Our analysis includes estimates of underlyingcollateral default rates based on historical and projecteddelinquency rates and estimates of the amount and timingof potential recovery. We consider available informationrelevant to the collectability of cash flows, including infor-mation about the payment terms of the security, prepay-
ment speeds, the financial condition of the underlying bor-rowers, collateral trustee reports, credit ratings analysisand other market data when developing our estimate of theexpected cash flows.When an OTTI of a debt security occurs, and we intend
to sell or more likely than not will be required to sell theinvestment before recovery of its amortized cost basis, theamortized cost of the security is reduced to its fair value,with a corresponding charge to earnings, which reducesnet income and earnings per share. If we do not intend tosell the fixed maturity investment or more likely than notwill not be required to sell it, we separate the OTTI intothe amount we estimate represents the credit loss and theamount related to all other factors. The amount of the esti-mated loss attributable to credit is recognized in earnings,which reduces net income and earnings per share. Theamount of the estimated OTTI that is non-credit related isrecognized in other comprehensive income, net of applica-ble taxes.We estimate the amount of the OTTI that relates to
credit by comparing the amortized cost of the debt securi-ty with the net present value of the debt security’s project-ed future cash flows, discounted at the effective interestrate implicit in the investment prior to impairment. Thenon-credit portion of the impairment is equal to the differ-ence between the fair value and the net present value ofthe debt security at the impairment measurement date.OTTIs of equity securities are recorded as realized loss-
es, which reduce net income and earnings per share. Thenew cost basis of an impaired security is not adjusted forsubsequent increases in estimated fair value.For equity method investments, we recognize an impair-
ment when evidence demonstrates that a loss in value thatis other-than-temporary has occurred. Evidence of a loss invalue that is other-than-temporary may include theabsence of an ability to recover the carrying amount of theinvestment or the inability of the investee to sustain a levelof earnings that would justify the carrying amount of theinvestment. During each period, we evaluate whether animpairment indicator has occurred that may have a signif-icant adverse effect on the carrying value of the invest-ment. Impairment indicators may include: lowerexpectations of residual value from a limited partnership,reduced valuations of the investments held by limited part-nerships, actual recent cash flows that are significantly lessthan expected cash flows or any other adverse events sincethe last financial statements received that might affect thevalue of the investee’s capital. OTTIs of equity methodinvestments are recorded as realized losses, which reducenet income and earnings per share.

THE HANOVER INSURANCE GROUP 2013 ANNUAL REPORT | 75
Temporary declines in market value are recorded asunrealized losses, which do not affect net income andearnings per share, but reduce accumulated other compre-hensive income, which is reflected in our ConsolidatedBalance Sheets. We cannot provide assurance that theOTTIs will be adequate to cover future losses or that wewill not have substantial additional impairments in thefuture. (See “Investments” in Management’s Discussion andAnalysis of Financial Condition and Results of Operationsof this Form 10-K for further discussion regarding OTTIsand securities in an unrealized loss position).
DEFERRED TAX ASSETS
Deferred tax assets and liabilities primarily result fromtemporary differences between the amounts recorded inour consolidated financial statements and the tax basis ofour assets and liabilities and loss and tax credit carryfor-wards. These temporary differences are measured at thebalance sheet date using enacted tax rates expected toapply to taxable income in the years the temporary differ-ences are expected to reverse.The realization of deferred tax assets depends upon the
existence of sufficient taxable income within the carrybackor carryforward periods under the tax law in the applicabletax jurisdiction. Consideration is given to available positiveand negative evidence, including reversals of deferred taxliabilities, projected future taxable income in each taxjurisdiction, tax planning strategies and recent financialoperations. Valuation allowances are established if, basedon the weight of available information, it is more likelythan not that all or some portion of the deferred tax assetswill not be realized. The determination of the valuationallowance for our deferred tax assets requires managementto make certain judgments and assumptions. Our judg-ments and assumptions are subject to change given theinherent uncertainty in predicting future performance andspecific industry and investment market conditions.Changes in valuation allowances are generally reflected inincome tax expense or as an adjustment to other compre-hensive income (loss) depending on the nature of the itemfor which the valuation allowance is being recorded.The following are the components of our deferred tax
assets and liabilities with the associated valuationallowance as of December 31, 2013.
DEFERRED TAX ASSETS (LIABILITIES)
(in millions)Gross Valuation Net
Amount Allowance Amount
Tax attributes:Tax credit carryforwards $ 123.1 $ — $ 123.1Operating loss carryforwards 64.5 — 64.5
187.6 — 187.6
Other:Loss, LAE and unearned premium reserves, net 185.0 — 185.0Deferred acquisition costs (123.5) — (123.5)Employee benefit plans 38.2 — 38.2Investments, net (8.4) (2.9) (11.3)Software capitalization (30.1) — (30.1)Deferred Lloyd’s underwriting
income (13.8) — (13.8)Deferred foreign sourced income (5.1) — (5.1)Other, net 12.7 — 12.7
55.0 (2.9) 52.1
Total $ 242.6 $ (2.9) $ 239.7
We have $110.3 million of alternative minimum taxcredit carryforwards and $12.8 million of foreign tax cred-it carryforwards. The alternative minimum tax credit carry-forwards have no expiration date and may be used to offsetregular federal income taxes due from future income. Theforeign tax credit carryforwards will expire beginning in2022 and may be used to offset federal income taxes duefrom future foreign sourced income. In addition, we haveoperating loss carryforwards that relate to current yearU.S. net operating loss and foreign net operating loss car-ryforwards from our Chaucer segment. The U.S. net oper-ating loss carryforwards expire beginning in 2031 and theChaucer net operating loss carryforwards have no expira-tion date. Based on our projection of future economic con-ditions, taxable income, reversals of existing taxabletemporary liabilities, and our strategic tax planning strate-gies, we believe that these tax credit carryforwards andoperating loss carryforwards will be fully realized.At December 31, 2013, the deferred tax liability on our
investment portfolio is comprised of a deferred tax liabilityof $14.7 million related to our foreign portfolio and adeferred tax asset of $6.3 million related to our U.S. port-folio. Due to the nature of the deductibility of these unre-alized tax losses in our federal tax return, we recorded avaluation allowance against this asset. In making our valu-ation allowance assessment, we considered our carrybackcapacity, reversals of deferred tax liabilities related to ourinvestment portfolio, and tax planning strategies thatinclude holding a portion of debt securities with market

| THE HANOVER INSURANCE GROUP 2013 ANNUAL REPORT76
value losses until recovery. Given the nature and the mag-nitude of the unrealized loss and current market condi-tions, it is more likely than not that this asset will not berealized.We believe the remaining deferred tax asset from other
temporary differences is fully realizable based on ourprojected future taxable income and recent financial oper-ations. Although we believe that these assets are fullyrecoverable, there can be no certainty that future eventswill not affect their recoverability. Future economic condi-tions and debt market volatility, including increases ininterest rates, can adversely impact our tax planningstrategies.
STATUTORY SURPLUS OF U.S. INSURANCESUBSIDIARIES
The following table reflects statutory surplus for our U.S.insurance subsidiaries:
DECEMBER 31 2013 2012
(in millions)
Total Statutory Capital and Surplus–U.S. Insurance Subsidiaries $1,834.3 $1,523.4
The statutory capital and surplus for our U.S. insurancesubsidiaries increased $310.9 million during 2013, prima-rily due to operating results, an increase in admitted assets,and unrealized and realized gains on investments.The NAIC prescribes an annual calculation regarding
risk based capital (“RBC”). RBC ratios for regulatory pur-poses, as described in the glossary, are expressed as a per-centage of the capital required to be above the AuthorizedControl Level (the “Regulatory Scale”); however, in theinsurance industry, RBC ratios are widely expressed as apercentage of the Company Action Level. The followingtable reflects the Company Action Level, the AuthorizedControl Level and RBC ratios for Hanover Insurance(which includes Citizens and other U.S. insurance sub-sidiaries), as of December 31, 2013 and 2012, expressedboth on the Industry Scale (Total Adjusted Capital dividedby the Company Action Level) and Regulatory Scale (TotalAdjusted Capital divided by Authorized Control Level):
DECEMBER 31, 2013
(dollars in millions)Company Authorized RBC Ratio RBC Ratio
Action Control Industry Regulatory Level Level Scale Scale
The Hanover Insurance Company $709.1 $354.5 257% 515%
DECEMBER 31, 2012
The Hanover Insurance Company $ 658.0 $ 329.0 230% 460%
LLOYD’S CAPITAL REQUIREMENT
Chaucer corporate members operate in the Lloyd’s market,which requires that these members deposit funds, referredto as “Funds at Lloyd’s”, to support their underwritinginterests. Lloyd’s sets required capital annually for all par-ticipating syndicates based on each syndicate’s businessplans, the rating and reserving environment, and discus-sions with regulatory and rating agencies. Although theminimum capital levels are set by Lloyd’s, it is the respon-sibility of Chaucer to continually monitor the risk profilesof its managed syndicates to ensure that the level of fund-ing remains appropriate. Such capital is comprised of cashand cash equivalents, investments, undrawn letters ofcredit provided by various banks and other assets. AtDecember 31, 2013, we are in compliance with the capitalrequirements. We have the following securities, assets andletters of credit pledged to Lloyd’s to satisfy these capitalrequirements at December 31, 2013. In 2012, we decidednot to renew the capital provision reinsurance treaty forthe 2013 underwriting year with Flagstone Re. In accor-dance with the terms of the capital provision reinsurancetreaty, Flagstone Re is obligated to provide funds at Lloyd’sin relation to its participation during the 2009 through2012 underwriting years, until such time that these yearsclose. We expect to be able to meet these capital require-ments in the future.
DECEMBER 31, 2013
(in millions)
Letters of credit $ 215.3Reinsurance treaty 71.2Fixed maturities, at fair value 334.4Cash and cash equivalents 1.0
Total securities, assets and letters of credit pledged to Lloyd’s $ 621.9

THE HANOVER INSURANCE GROUP 2013 ANNUAL REPORT | 77
LIQUIDITY AND CAPITAL RESOURCES
Liquidity is a measure of our ability to generate sufficientcash flows to meet the cash requirements of business oper-ations. As a holding company, our primary ongoing sourceof cash is dividends from our insurance subsidiaries.However, dividend payments to us by our U.S. insurancesubsidiaries are subject to limitations imposed by regula-tors, such as prior notice periods and the requirement thatdividends in excess of a specified percentage of statutorysurplus or prior year’s statutory earnings receive priorapproval (so called “extraordinary dividends”). No divi-dends were paid to the holding company by HanoverInsurance in 2013 or 2012. In 2011, a $99 million ordi-nary dividend was paid by Hanover. This dividend was usedto help fund the acquisition of Chaucer.Dividend payments to the holding company by Chaucer
are regulated by U.K. law. Dividends from Chaucer aredependent on dividends from its subsidiaries. Annual divi-dend payments from Chaucer are limited to retained earn-ings that are not restricted by capital and otherrequirements for business at Lloyd’s. Also, Chaucer mustprovide advance notice to the U.K.’s Prudential RegulationAuthority (“PRA”), one of the successors to the FinancialServices Authority, of certain proposed dividends or otherpayments from PRA regulated entities. Chaucer paidapproximately $14 million in dividends during 2013 to theholding company. No dividends were paid by Chaucer tothe holding company in 2012 or 2011.In connection with an intercompany borrowing arrange-
ment between Chaucer and the holding company, intereston a $300 million note is paid by Chaucer on a quarterlybasis to the holding company. This interest may bedeferred at the election of the holding company. Ifdeferred, the interest is added to the principal. Chaucerpaid $28.1 million and $27.4 million of interest during2013 and 2012, respectively.At December 31, 2013, THG, as a holding company,
held approximately $122.4 million of fixed maturities andcash. We believe our holding company assets are sufficientto meet our future obligations, which consist primarily ofdividends to our shareholders (as and to the extentdeclared), the interest on our senior and subordinateddebentures, certain costs associated with benefits due toour former life employees and agents, additional fundsrelating to the purchase of Chaucer, and, to the extentrequired, payments related to indemnification of liabilitiesassociated with the sale of various subsidiaries. We do notexpect that it will be necessary to dividend additional fundsfrom our insurance subsidiaries in order to fund 2014holding company obligations; however, we may decide todo so.
Sources of cash for our insurance subsidiaries primarilyconsist of premiums collected, investment income andmaturing investments. Primary cash outflows are paidclaims, losses and loss adjustment expenses, policy andcontract acquisition expenses, other underwriting expens-es and investment purchases. Cash outflows related tolosses and loss adjustment expenses can be variablebecause of uncertainties surrounding settlement dates forliabilities for unpaid losses and because of the potential forlarge losses either individually or in the aggregate. We peri-odically adjust our investment policy to respond to changesin short-term and long-term cash requirements.Net cash provided by operating activities was $383.9
million during 2013, as compared to $408.2 million in2012 and $221.7 million in 2011. The $24.3 milliondecrease in 2013 compared to 2012 is primarily due to thetiming of reimbursements made to Lloyd’s related to claimpayments made on our behalf, partially offset by lowerclaims payments in 2013. The $186.5 million increase in2012 compared to 2011 primarily resulted from anincrease in premiums, partially offset by an increase in lossand LAE payments.Net cash used in investing activities was $358.7 million
during 2013, as compared to $562.8 million in 2012 andnet cash provided by investing activities of $182.8 millionin 2011. During 2013, cash used was primarily related tonet purchases of fixed maturities and equity securities.During 2012, cash used was primarily related to net pur-chases of fixed maturities as we invested cash fromChaucer and net investments in equity securities. Cashused to purchase investments was partially offset by cashreceived from the sale of a building. See Note 3 –“Investments” in the Notes to Consolidated FinancialStatements included in Financial Statements andSupplementary Data of this Form 10-K. During 2011, cashprovided by investing activities primarily resulted from$756.1 million of cash and cash equivalents acquired fromChaucer. This increase was partially offset by cash paid forthe Chaucer acquisition totaling $468.4 million, whichincluded an $11.3 million payment related to a foreigncurrency exchange forward contract, and the investmentof a portion of our Chaucer segment’s cash into fixed maturities.Net cash used in financing activities was $105.5 million
during 2013, as compared to $133.4 million in 2012 andnet cash provided by financing activities of $127.3 millionin 2011. During 2013, cash used in financing activities pri-marily resulted from the repayment of approximately $121million of debt, repurchases of common stock and the pay-ment of dividends to shareholders, partially offset by theproceeds from the issuance, on March 20, 2013, of $175.0million of unsecured subordinated debentures. During

| THE HANOVER INSURANCE GROUP 2013 ANNUAL REPORT78
2012, cash used in financing activities primarily resultedfrom the repayment of $72.4 million of debt, the paymentof dividends to shareholders, repurchases of our commonstock and repayments of collateral held for our securitieslending program, partially offset by the proceeds from theFHLBB debt borrowings. During 2011, cash provided byfinancing activities primarily resulted from the issuance,on June 17, 2011, of $300.0 million of unsecured seniordebentures. Cash received from the issuance of debt waspartially offset by the repayment of $86.8 million of debt,the payment of dividends to our shareholders, repaymentsof collateral related to our securities lending program, andrepurchases of common stock.Dividends to common shareholders are subject to quar-
terly board approval and declaration. During 2013, asdeclared by the Board, we paid three quarterly dividends of$0.33 per share and one quarterly dividend of $0.37 pershare to our shareholders totaling $60.0 million. Webelieve that our holding company assets are sufficient toprovide for future shareholder dividends should the Boardof Directors declare them.We expect to continue to generate sufficient positive
operating cash to meet all short-term and long-term cashrequirements relating to current operations, including thefunding of our qualified defined benefit pension plan andthe Chaucer pension plan. Based upon the current esti-mate of liabilities and certain assumptions regardinginvestment returns and other factors, our qualified definedbenefit pension plans and Chaucer pension plan collec-tively have plan liabilities in excess of plan assets byapproximately $15 million. The ultimate payment amountsfor our benefit plans are based on several assumptions,including but not limited to, the rate of return on planassets, the discount rate for benefit obligations, mortalityexperience, interest crediting rates, inflation and the ulti-mate valuation and determination of benefit obligations.Since differences between actual plan experience and ourassumptions are almost certain, changes both positive andnegative to our current funding status and ultimately ourobligations in future periods are likely.Our insurance subsidiaries maintain a high degree of
liquidity within their respective investment portfolios infixed maturity and short-term investments. We believe thatthe quality of the assets we hold will allow us to realize thelong-term economic value of our portfolio, including secu-rities that are currently in an unrealized loss position. Wedo not anticipate the need to sell these securities to meetour insurance subsidiaries’ cash requirements since weexpect our insurance subsidiaries to generate sufficientoperating cash to meet all short-term and long-term cashrequirements. However, there can be no assurance that
unforeseen business needs or other items will not occurcausing us to have to sell those securities in a loss positionbefore their values fully recover, thereby causing us to rec-ognize impairment charges in that time period.Since October 2007 and through December 2013, our
Board of Directors has authorized aggregate repurchases ofour common stock of up to $600 million, including a $100million increase in the program in 2013. Repurchases maybe executed using open market purchases, privately nego-tiated transactions, accelerated repurchase programs orother transactions. We are not required to purchase anyspecific number of shares or to make purchases by any cer-tain date under this program. During 2013, we repur-chased 1.6 million shares of our common stock at a cost of$78.2 million.Over the past several years, we have issued, through two
separate transactions, $500 million in senior debenturesand have received advances of $171.3 million through ourmembership in FHLBB as part of a collateralized borrow-ing program. In March 2013, we issued $175 millionaggregate principal amount of subordinated unsecureddebentures due March 30, 2053. These subordinateddebentures pay interest quarterly. We may redeem thesesubordinated debentures in whole at any time, or in partfrom time to time, on or after March 30, 2018, at aredemption price equal to their principal amount plusaccrued and unpaid interest.Additionally, from time to time, we may also repurchase
our debt on an opportunistic basis. During 2013, we repur-chased senior debentures with a net carrying value of$73.8 million at a cost of $93.7 million, resulting in a lossof $19.9 million. Additionally in 2013, we repaid $46.3million of our FHLBB advances plus prepayment fees of$7.8 million for a total payment of $54.1 million. Weexpect these repurchases will reduce our annual pre-taxinterest costs by approximately $7 million. In 2012, wecalled $65.4 million of our subordinated unsecured notesrelated to Chaucer at par value. These notes had a carry-ing value of $60.3 million, resulting in a net loss of $5.1million on the repayment. Additional information relatedto all borrowings is in Note 6 – “Debt and CreditArrangements” in the Notes to Consolidated FinancialStatements included in Financial Statements andSupplementary Data of this Form 10-K.In November 2013, we entered into a $200.0 million
credit agreement which expires in November 2018, withan option to increase the facility to $300.0 million assum-ing no default and satisfaction of certain other conditions.Borrowings, if any, under the agreement are unsecured andincur interest at a rate per annum equal to, the higher of

THE HANOVER INSURANCE GROUP 2013 ANNUAL REPORT | 79
(a) the prime commercial lending rate of the administra-tive agent, (b) the Federal Funds Rate plus half of a per-cent, or (c) the one month Adjusted LIBOR plus onepercent and any applicable margin. The agreement con-tains financial covenants substantially similar to those inour prior credit agreement including, but not limited to,maintaining at least a certain level of consolidated equity,maximum consolidated leverage ratios and requires certainof our subsidiaries to maintain a minimum RBC ratio. Thisagreement replaces the previous committed syndicatedcredit agreement entered in August 2011 for $200.0 mil-lion, which was set to expire in August 2015. Both the cur-rent and the terminated agreement also include a $50million sub-facility for standby letters of credit that can beused for general corporate purposes. We had no borrow-ings under either of the agreements in 2012 and 2013.In November 2013, we amended and restated our exist-
ing Standby Letter of Credit Facility (the “AmendedFacility Agreement”) not to exceed £130.0 million (or$215.8 million) outstanding at any one time, with theoption to increase the amount available for issuances ofletters of credit to £195.0 million (or $323.7 million) inthe aggregate on one occasion only during the term of theAmended Facility Agreement (subject to the consent of alllenders and assuming no default and satisfaction of otherspecified conditions). Amounts in U.S. dollars were con-verted based on the foreign currency exchange rate of 1.66at December 31, 2013. Prior to the amendment, we had aStandby Letter of Credit Facility Agreement in place not toexceed $180.0 million outstanding at any one time, with asimilar option to increase the amount available forissuances of letters of credit to $270.0 million. Theamended agreement provides certain covenants including,but not limited to, the syndicates’ financial conditionwhich were also in place prior to the amendment of theagreement. The Amended Facility Agreement provides reg-ulatory capital supporting Chaucer’s underwriting activi-ties for the 2014 and 2015 years of account and each prioropen year of account and is generally renewed biennially tosupport new underwriting years. A letter of credit commis-sion fee on outstanding letters of credit is payable quarter-ly, and ranges from 1.375% to 1.75% per annum,depending on our credit ratings for portions that are notcash collateralized, and 0.275% per annum for portionsthat are cash collateralized. We may, from time to time,collateralize a portion of the outstanding letter of credit. Inaddition to the commission fee on the uncollateralized out-standing letter of credit, a commitment fee in respect ofthe unutilized commitments under the Amended FacilityAgreement is payable quarterly, and ranges from 0.55% to
0.70% per annum, depending on our credit ratings.Chaucer is also required to pay customary agency fees.Under the previous agreement we paid $2.7 million ininterest in 2013. We expect lower interest payments underthe new agreement based on current prevailing interestrates.Simultaneous with the Amended Facility Agreement, we
entered into a Guaranty Agreement (the “GuarantyAgreement”) with Lloyds Bank plc, as Facility Agent andSecurity Agent, pursuant to which, we unconditionallyguarantee the obligations of Chaucer under the AmendedFacility Agreement. The Guaranty Agreement contains cer-tain financial covenants that require us to maintain a min-imum net worth, a minimum risk-based capital ratio at ourprimary U.S. domiciled property and casualty companiesand a maximum leverage ratio, and certain negativecovenants that limit our ability, among other things, toincur or assume certain debt, grant liens on our property,merge or consolidate, dispose of assets, materially changethe nature or conduct of our business and make restrictedpayments (except, in each case, as provided by certainexceptions). The Guaranty Agreement also contains cer-tain customary representations and warranties. The cur-rent Guaranty Agreement contains terms and conditionssubstantially similar to the previous guaranty agreementwe had in place with Lloyds Bank plc in connection withChaucer’s previous Facility Agreement.At December 31, 2013, we were in compliance with the
covenants of the aforementioned debt agreements.
CONTRACTUAL OBLIGATIONS
Financing obligations generally include repayment of oursenior debentures, subordinated debentures, borrowingsfrom the FHLBB, and operating lease payments. The fol-lowing table represents our annual payments related to thecontractual principal and interest payments of thesefinancing obligations as of December 31, 2013 and oper-ating lease payments reflect expected cash payments basedupon lease terms. In addition, we also have included ourestimated payments related to our loss and LAE obliga-tions and our current expectation of payments to be madeto support the obligations of our benefit plans. The follow-ing table also includes commitments to purchase invest-ment securities at a future date. Actual payments maydiffer from the contractual and/or estimated payments inthe table.

| THE HANOVER INSURANCE GROUP 2013 ANNUAL REPORT80
DECEMBER 31, 2013
(in millions)Maturity Maturityless than Maturity Maturity in excess1 year 1-3 years 4-5 years of 5 years Total
Debt(1) $ — $ — $ — $ 903.9 $ 903.9Interest associated with debt(1) 60.7 121.4 121.4 606.9 910.4Operating lease commitments(2) 17.0 22.6 7.0 0.6 47.2Qualified defined benefit pension plan funding obligations(3) 3.3 — — — 3.3Non-qualified defined benefit pension and post-retirement benefit obligations(4) 5.7 10.3 8.9 19.7 44.6Investment commitments(5) 24.4 25.8 8.4 — 58.6Loss and LAE obligations(6) 1,977.6 1,958.7 892.7 1,402.5 6,231.5
(1) Debt includes our senior debentures due in 2025, which pay annual interest at a rate of 7 5/8%, our senior debentures due in 2020, which pay annual interest at a rate of7.50%, our senior debentures due in 2021, which pay annual interest at a rate of 6.375%, our subordinated debentures due in 2053, which pay annual interest at a rate of6.35% and our subordinated debentures due in 2027, which pay cumulative dividends at an annual rate of 8.207%. Payments related to the principal amounts of theseagreements represent contractual maturity; therefore, principal and interest associated with these obligations are reflected in the above table based upon the contractualmaturity dates. In addition, we have $125.0 million of borrowings under a collateralized borrowing program with the FHLBB which pays interest monthly at a rate of 5.50%annually. Such borrowings are available for a twenty-year term or through September 25, 2029.
(2) Our U.S. and international subsidiaries are lessees with a number of operating leases.
(3) Reflects funding associated with the expectation of terminating one of our qualified plans in 2014, and approximately $2 million associated with the Chaucer plan, based uponcurrent funded status. We do not expect to make any significant contributions in order to meet our minimum funding requirements. However, additional contributions may berequired in the future based on the level of pension assets and liabilities in future periods.
The ultimate payment amount for our pension plans are based on several assumptions, including, but not limited to, the rate of return on plan assets, the discount rate forbenefit obligations, mortality experience, interest crediting rates and the ultimate valuation of benefit obligations. Differences between actual plan experience and ourassumptions are likely and will likely result in changes to our funding obligations in future periods.
(4) Non-qualified defined benefit pension and postretirement benefit obligations reflect estimated payments to be made through plan year 2023 for pension, postretirement andpostemployment benefits. Estimates of these payments and the payment patterns are based upon historical experience.
(5) Investment commitments relate primarily to partnerships.
(6) Unlike many other forms of contractual obligations, loss and LAE reserves do not have definitive due dates and the ultimate payment dates are subject to a number of variablesand uncertainties. As a result, the total loss and LAE reserve payments to be made by period, as shown in the table, are estimates based principally on historical experience.
OFF-BALANCE SHEET ARRANGEMENTS
We currently do not have any material off-balance sheetarrangements that are reasonably likely to have an effecton our financial position, revenues, expenses, results ofoperations, liquidity, capital expenditures, or capitalresources.
CONTINGENCIES AND REGULATORY MATTERS
Information regarding litigation and legal contingenciesappears in Note 18—“Commitments and Contingencies”in the Notes to Consolidated Financial Statements includ-ed in Financial Statements and Supplementary Data ofthis Form 10-K. Information related to certain regulatoryand industry developments are contained in “Regulation”in Part 1 - Item 1 of this Form 10-K and in “Risk Factors”in Part 1 – Item 1A of this Form 10-K.
RATING AGENCIES
Insurance companies are rated by rating agencies to pro-vide both industry participants and insurance consumersinformation on specific insurance companies. Higher rat-ings generally indicate the rating agencies’ opinion regard-ing financial stability and a stronger ability to pay claims.We believe that strong ratings are important factors in
marketing our products to our agents and customers, sincerating information is broadly disseminated and generallyused throughout the industry. Insurance company finan-cial strength ratings are assigned to an insurer based uponfactors deemed by the rating agencies to be relevant to pol-icyholders and are not directed toward protection ofinvestors. Such ratings are neither a rating of securities nora recommendation to buy, hold or sell any security.Customers typically focus on claims-paying ratings, whilecreditors focus on debt ratings. Investors use both to eval-uate a company’s overall financial strength.

THE HANOVER INSURANCE GROUP 2013 ANNUAL REPORT | 81
RISKS AND FORWARD-LOOKING STATEMENTS
Management’s Discussion and Analysis contains “forward-looking statements” within the meaning of the PrivateSecurities Litigation Reform Act of 1995. For a discussionof indicators of forward-looking statements and specificimportant factors that could cause actual results to differmaterially from those contained in forward-looking state-ments, see “Risk Factors” in Part 1 – Item 1A of this Form10-K. This Management’s Discussion and Analysis shouldbe read and interpreted in light of such factors.
GLOSSARY OF SELECTED INSURANCE TERMS
Account rounding – The conversion of single policy cus-tomers to accounts with multiple policies and/or addition-al coverages.
Benefit payments – Payments made to an insured ortheir beneficiary in accordance with the terms of an insur-ance policy.
Capacity – The maximum amount of business whichmay be accepted by a syndicate or a corporate member ona syndicate, expressed in terms of gross premium written,net of commission.
Casualty insurance – Insurance that is primarily con-cerned with the losses caused by injuries to third personsand their property (other than the policyholder) and therelated legal liability of the insured for such losses.
Catastrophe – A severe loss, resulting from natural andmanmade events, including risks such as hurricane, fire,earthquake, windstorm, tornado, hailstorm, severe winterweather, drought, explosion, terrorism, riots and other sim-ilar events.
Catastrophe loss – Loss and directly identified lossadjustment expenses from catastrophes. The InsuranceServices Office (“ISO”) Property Claim Services (“PCS”)defines a catastrophe loss as an event that causes $25 mil-lion or more in U.S. industry insured property losses andaffects a significant number of property and casualty poli-cyholders and insurers. In addition to those catastropheevents declared by ISO, claims management also generallyincludes within the definition of a “catastrophe loss”, aproperty loss event that causes approximately $5 million ormore in company insured losses and affects in excess ofone hundred policyholders or multiple independent risks.For the international business in our Chaucer segment,management utilizes a “catastrophe loss” definition that issubstantially consistent with the ISO definition frame-work.
Cede; cedent; ceding company – When a party rein-sures its liability with another, it “cedes” business and isreferred to as the “cedent” or “ceding company”.
Combined ratio, GAAP – This ratio is the GAAP equiv-alent of the statutory ratio that is widely used as a bench-mark for determining an insurer’s underwritingperformance. A ratio below 100% generally indicates prof-itable underwriting prior to the consideration of invest-ment income. A combined ratio over 100% generallyindicates unprofitable underwriting prior to the considera-tion of investment income. The combined ratio is the sumof the loss ratio, the loss adjustment expense ratio and theunderwriting expense ratio.
Corporate member – A company admitted to member-ship of Lloyd’s and which provides capital in support of aLloyd’s syndicate to enable the syndicate to undertakeunderwriting risks.
Credit spread – The difference between the yield on thedebt securities of a particular corporate debt issue and theyield of a similar maturity of U.S. Treasury debt securities.
Current accident year loss results – A non-GAAPmeasure of the estimated earnings impact of current pre-miums offset by estimated loss experience and expenses forthe current accident year. This measure includes the esti-mated increase in revenue associated with higher prices(premiums), including those caused by price inflation andchanges in exposure, partially offset by higher volume driv-en expenses and inflation of loss costs. Volume drivenexpenses include acquisition costs such as commissionspaid to agents, which are typically based on a percentageof premium dollars.
Earned premium – The portion of a premium that isrecognized as income, or earned, based on the expired por-tion of the policy period, that is, the period for which losscoverage has actually been provided. For example, after sixmonths, $50 of a $100 annual premium is generally con-sidered earned premium. The remaining $50 of annualpremium is unearned premium. Net earned premium isearned premium net of reinsurance.
Economic interest– The share of syndicate underwritingcapacity supported by capital from Chaucer Holdings plc.
Excess of loss reinsurance – Reinsurance that indem-nifies the insured against all or a specific portion of lossesunder reinsured policies in excess of a specified dollaramount or “retention”.
Expense Ratio, GAAP – The ratio of underwritingexpenses to premiums earned for a given period.
Exposure – As it relates to underwriting, a measure ofthe rating units or premium basis of a risk; for example, anexposure of a number of automobiles. As it relates to lossevents, the maximum value of claims made on an insurerfrom an event or events that would result in the totalexhaustion of the cover or indemnity offered by an insur-ance policy.

| THE HANOVER INSURANCE GROUP 2013 ANNUAL REPORT82
Exposure management actions – Actions that focus onimproving underwriting profitability and/or lessening earn-ings volatility by reducing our exposures and property con-centrations in certain geographies and lines that are moreprone to both catastrophe and non-catastrophe losses.These actions include, but are not limited to, non-renew-al, rate increases, stricter underwriting standards and high-er deductible utilization, agency management actions, andmore selective portfolio management by modifying ourbusiness mix.
Frequency – The number of claims occurring during agiven coverage period.
Funds at Lloyd’s – Funds held in trust at Lloyd’s assecurity for the policyholders and to support a corporatemember’s overall underwriting activities. The funds mustbe in a form approved by Lloyd’s and be maintained at cer-tain specified levels.
Inland Marine Insurance – In Commercial Lines, thisis a type of coverage developed for shipments that do notinvolve ocean transport. It covers articles in transit by allforms of land and air transportation as well as bridges, tun-nels and other means of transportation and communica-tion. In the context of Personal Lines, this term relates tofloater policies that cover expensive personal items such asfine art and jewelry.
Loss adjustment expenses (“LAE”) – Expenses incurredin the adjusting, recording, and settlement of claims.These expenses include both internal company expensesand outside services. Examples of LAE include claimsadjustment services, adjuster salaries and fringe benefits,legal fees and court costs, investigation fees and claimsprocessing fees.
Loss adjustment expense (“LAE”) ratio, GAAP – Theratio of loss adjustment expenses to earned premiums for agiven period.
Loss costs – An amount of money paid for an insuranceclaim.
Loss ratio, GAAP – The ratio of losses to premiumsearned for a given period.
Loss reserves – Liabilities established by insurers toreflect the estimated cost of claims payments and the relat-ed expenses that the insurer will ultimately be required topay in respect of insurance it has written. Reserves areestablished for losses and for LAE.
Managing agent – An agent that runs the affairs of asyndicate.
Multivariate product – An insurance product, the pric-ing for which is based upon the magnitude of, and correla-tion between, multiple rating factors. In practicalapplication, the term refers to the foundational analyticsand methods applied to the product construct. OurConnections Auto product is an example of a multivariateproduct.
Peril – A cause of loss.
Price(ing) increase or decrease (Commercial Linesand Chaucer) – Represents the average change in premi-um on renewed policies caused by the estimated net effectof base rate changes, discretionary pricing, inflation orchanges in policy level exposure or insured risk.
Price(ing) increase or decrease (Personal Lines) –The estimated cumulative premium effect of approved rateactions applied to policies available for renewal, regardlessof whether or not policies are actually renewed. Pricingchanges do not represent actual increases or decreasesrealized by the Company.
Property insurance – Insurance that provides coveragefor tangible property in the event of loss, damage or loss ofuse.
Rate – The estimated pure pricing factor upon whichthe policyholder’s premium is based excluding changes inexposure or risk.
Reinstatement premium – A pro-rata reinsurance pre-mium that may be charged for reinstating the amount ofreinsurance coverage reduced as the result of a reinsur-ance loss payment under a reinsurance treaty. For eventsthat we are the insured party, the charge would decreasepremiums; for events where we provide reinsurance cover-age, the charge would increase premiums. For example, in2005, this premium was required to ensure that our prop-erty catastrophe occurrence treaty, which was exhausted byHurricane Katrina, was available again in the event ofanother large catastrophe loss in 2005.
Reinsurance – An arrangement in which an insurancecompany, or a reinsurance company, known as the reinsur-er, agrees to indemnify another insurance or reinsurancecompany, known as the ceding company, against all or aportion of the insurance or reinsurance risks underwrittenby the ceding company under one or more policies.Reinsurance can provide a ceding company with severalbenefits, including a reduction in net liability on risks andcatastrophe protection from large or multiple losses.Reinsurance does not legally discharge the primary insurerfrom its liability with respect to its obligations to theinsured.
Risk based capital (“RBC”) – A method of measuringthe minimum amount of capital appropriate for an insur-ance company to support its overall business operations inconsideration of its size and risk profile. The RBC ratio forregulatory purposes is calculated as total adjusted capitaldivided by required risk based capital. Total adjusted capi-tal for property and casualty companies is capital and sur-plus, adjusted for the non-tabular reserve discountapplicable to our assumed discontinued accident andhealth insurance business. The Company Action Level isthe first level at which regulatory involvement is specifiedbased upon the level of capital.

Statutory accounting principles – Recording transac-tions and preparing financial statements in accordancewith the rules and procedures prescribed or permitted byinsurance regulatory authorities including the NAIC,which in general reflect a liquidating, rather than goingconcern, concept of accounting.
Supranational – An international organization, orunion, whereby member states transcend national bound-aries or interests to share in the decision-making and voteon issues pertaining to the wider grouping. EuropeanInvestment Bank is an example of a supranational.
Syndicate – A group of members underwriting insur-ance at Lloyd’s through the agency of a managing agent, towhom a particular syndicate number is assigned.
Underwriting – The process of selecting risks for insur-ance and determining in what amounts and on what termsthe insurance company will accept risks.
Underwriting expenses – Expenses incurred in connec-tion with the acquisition, pricing and administration of apolicy or contract.
Underwriting expense ratio, GAAP – The ratio of under -writing expenses to earned premiums in a given period.
Unearned premiums – The portion of a premium rep-resenting the unexpired amount of the contract term as ofa certain date.
Written premium – The premium assessed for theentire coverage period of an insurance policy or contractwithout regard to how much of the premium has beenearned. See also earned premium. Net written premium iswritten premium net of reinsurance.
Item 7A — Quantitative and QualitativeDisclosures about Market Risk
Reference is made to “Quantitative and QualitativeDisclosures about Market Risk” in Management’sDiscussion and Analysis of Financial Condition andResults of Operations of this Form 10-K.
Regulators may take action for reasons other than trig-gering various RBC action levels. The various action levelsare summarized as follows:• The Company Action Level, which equals 200% of theAuthorized Control Level, requires a company to pre-pare and submit a RBC plan to the commissioner of thestate of domicile. A RBC plan proposes actions which acompany may take in order to bring statutory capitalabove the Company Action Level. After review, the commissioner will notify the company if the plan is satisfactory.
• The Regulatory Action Level, which equals 150% of theAuthorized Control Level, requires the insurer to sub-mit to the commissioner of the state of domicile an RBCplan, or if applicable, a revised RBC plan. After exami-nation or analysis, the commissioner will issue an orderspecifying corrective actions to be taken.
• The Authorized Control Level authorizes the commis-sioner of the state of domicile to take whatever regula-tory actions considered necessary to protect the bestinterest of the policyholders and creditors of the insurer.
• The Mandatory Control Level, which equals 70% of theAuthorized Control Level, authorizes the commissionerof the state of domicile to take actions necessary toplace the company under regulatory control (i.e., reha-bilitation or liquidation).
Security Lending – We engage our banking provider tolend securities from our investment portfolio to third par-ties. These lent securities are fully collateralized by cash.We monitor the fair value of the securities on a daily basisto assure that the collateral is maintained at a level of atleast 102% of the fair value of the loaned securities. Werecord securities lending collateral as a cash equivalent,with an offsetting liability in expenses and taxes payable.
Severity – A monetary increase in the loss costs associ-ated with the same or similar type of event or coverage.
Solvency II – European Commission-led fundamentalreview of the capital adequacy regime for the Europeaninsurance industry.
Specialty Lines – A major component of our other com-mercial lines. There is no accepted industry definition of“specialty lines”, but for our purpose specialty lines consistof products such as inland and ocean marine, surety, spe-cialty property, professional liability, management liabilityand various other program businesses. When discussingnet premiums written and other financial measures of ourspecialty businesses, we may include non-specialty premi-ums that are written as part of the entire account.
THE HANOVER INSURANCE GROUP 2013 ANNUAL REPORT | 83

| THE HANOVER INSURANCE GROUP 2013 ANNUAL REPORT84
To the Board of Directors and Shareholders of The Hanover Insurance Group, Inc.:
In our opinion, the consolidated financial statements list-ed in the index appearing under Item 15(a)(1) present fair-ly, in all material respects, the financial position of TheHanover Insurance Group, Inc. and its subsidiaries atDecember 31, 2013 and December 31, 2012, and theresults of their operations and their cash flows for each ofthe three years in the period ended December 31, 2013 inconformity with accounting principles generally acceptedin the United States of America. In addition, in our opin-ion, the financial statement schedules listed in the indexappearing under Item 15(a)(2) present fairly, in all materi-al respects, the information set forth therein when read inconjunction with the related consolidated financial state-ments. Also in our opinion, the Company maintained, inall material respects, effective internal control over finan-cial reporting as of December 31, 2013, based on criteriaestablished in Internal Control – Integrated Framework(1992) issued by the Committee of SponsoringOrganizations of the Treadway Commission (COSO). TheCompany’s management is responsible for these financialstatements and financial statement schedules, for main-taining effective internal control over financial reportingand for its assessment of the effectiveness of internal con-trol over financial reporting, included in Management’sReport on Internal Control Over Financial Reportingappearing under Item 9A. Our responsibility is to expressopinions on these financial statements, on the financialstatement schedules, and on the Company’s internal con-trol over financial reporting based on our integrated audits.We conducted our audits in accordance with the standardsof the Public Company Accounting Oversight Board(United States). Those standards require that we plan andperform the audits to obtain reasonable assurance aboutwhether the financial statements are free of material mis-statement and whether effective internal control overfinancial reporting was maintained in all material respects.Our audits of the financial statements included examining,on a test basis, evidence supporting the amounts and dis-closures in the financial statements, assessing the account-ing principles used and significant estimates made bymanagement, and evaluating the overall financial state-ment presentation. Our audit of internal control over
financial reporting included obtaining an understanding ofinternal control over financial reporting, assessing the riskthat a material weakness exists, and testing and evaluatingthe design and operating effectiveness of internal controlbased on the assessed risk. Our audits also included per-forming such other procedures as we considered necessaryin the circumstances. We believe that our audits provide areasonable basis for our opinions.A company’s internal control over financial reporting is
a process designed to provide reasonable assurance regard-ing the reliability of financial reporting and the preparationof financial statements for external purposes in accordancewith generally accepted accounting principles. A compa-ny’s internal control over financial reporting includes thosepolicies and procedures that (i) pertain to the maintenanceof records that, in reasonable detail, accurately and fairlyreflect the transactions and dispositions of the assets of thecompany; (ii) provide reasonable assurance that transac-tions are recorded as necessary to permit preparation offinancial statements in accordance with generally accept-ed accounting principles, and that receipts and expendi-tures of the company are being made only in accordancewith authorizations of management and directors of thecompany; and (iii) provide reasonable assurance regardingprevention or timely detection of unauthorized acquisition,use, or disposition of the company’s assets that could havea material effect on the financial statements.Because of its inherent limitations, internal control over
financial reporting may not prevent or detect misstate-ments. Also, projections of any evaluation of effectivenessto future periods are subject to the risk that controls maybecome inadequate because of changes in conditions, orthat the degree of compliance with the policies or proce-dures may deteriorate.
PricewaterhouseCoopers LLPBoston, MAFebruary 24, 2014
Item 8 — Financial Statements and Supplementary Data
REPORT OF INDEPENDENT REGISTERED PUBLIC ACCOUNTING FIRM

THE HANOVER INSURANCE GROUP 2013 ANNUAL REPORT | 85
THE HANOVER INSURANCE GROUP, INC. AND SUBSIDIARIES
CONSOLIDATED STATEMENTS OF INCOME
YEARS ENDED DECEMBER 31 2013 2012 2011
(in millions, except per share data)
RevenuesPremiums $4,450.5 $4,239.1 $3,598.6 Net investment income 269.0 276.6 258.2 Net realized investment gains (losses):
Net realized gains from sales and other 39.5 31.4 35.0 Net other–than–temporary impairment losses on investments recognized in earnings (6.0) (7.8) (6.9)
Total net realized investment gains 33.5 23.6 28.1
Fees and other income 40.7 51.4 46.7
Total revenues 4,793.7 4,590.7 3,931.6
Losses and expensesLosses and loss adjustment expenses 2,761.1 2,974.4 2,550.8 Amortization of deferred acquisition costs 971.0 938.1 778.9 Interest expense 65.3 61.9 55.0 Other operating expenses 667.2 587.6 525.3
Total losses and expenses 4,464.6 4,562.0 3,910.0
Income before income taxes 329.1 28.7 21.6
Income tax expense (benefit):Current 8.6 18.4 (0.6)Deferred 74.8 (35.8) (9.3)
Total income tax expense (benefit) 83.4 (17.4) (9.9)
Income from continuing operations 245.7 46.1 31.5 Net gain from discontinued operations (net of income tax expense
(benefit) of $4.1, $(0.5) and $(2.5) in 2013, 2012 and 2011) 5.3 9.8 5.2
Net income $ 251.0 $ 55.9 $ 36.7
Earnings per common shareBasic
Income from continuing operations $ 5.58 $ 1.03 $ 0.70 Net gain from discontinued operations 0.12 0.22 0.11
Net income per share $ 5.70 $ 1.25 $ 0.81
Weighted average shares outstanding 44.1 44.7 45.2
DilutedIncome from continuing operations $ 5.47 $ 1.02 $ 0.69 Net gain from discontinued operations 0.12 0.21 0.11
Net income per share $ 5.59 $ 1.23 $ 0.80
Weighted average shares outstanding 44.9 45.3 45.8
The accompanying notes are an integral part of these consolidated financial statements.

| THE HANOVER INSURANCE GROUP 2013 ANNUAL REPORT86
THE HANOVER INSURANCE GROUP, INC. AND SUBSIDIARIES
CONSOLIDATED STATEMENTS OF COMPREHENSIVE INCOME
YEARS ENDED DECEMBER 31 2013 2012 2011
(in millions)
Net income $ 251.0 $ 55.9 $ 36.7Other comprehensive income (loss), net of tax:
Available-for-sale securities and derivative instruments:Net appreciation (depreciation) during the period (167.3) 109.4 83.6Change in other-than-temporary impairment losses recognized in other
comprehensive income 0.6 7.9 6.8
Total available-for-sale securities and derivative instruments (166.7) 117.3 90.4
Pension and postretirement benefits:Net actuarial gain (loss) arising in the period 10.8 (15.9) (11.8)Amortization recognized as net periodic benefit and postretirement cost 9.7 6.1 6.6
Total pension and postretirement benefits 20.5 (9.8) (5.2)
Cumulative foreign currency translation adjustment:Amount recognized as cumulative foreign currency translation during the period (2.0) 7.9 (11.5)
Other comprehensive income (loss), net of tax (148.2) 115.4 73.7
Comprehensive income $ 102.8 $ 171.3 $ 110.4
The accompanying notes are an integral part of these consolidated financial statements.

THE HANOVER INSURANCE GROUP 2013 ANNUAL REPORT | 87
THE HANOVER INSURANCE GROUP, INC. AND SUBSIDIARIES
CONSOLIDATED BALANCE SHEETS
DECEMBER 31 2013 2012
(in millions, except share data)
AssetsInvestments:
Fixed maturities, at fair value (amortized cost of $6,815.2 and $6,529.5) $ 6,970.6 $ 6,952.2Equity securities, at fair value (cost of $366.5 and $299.0) 430.2 315.8Other investments 192.5 210.3
Total investments 7,593.3 7,478.3
Cash and cash equivalents 486.2 564.8Accrued investment income 68.0 69.0Premiums and accounts receivable, net 1,324.6 1,308.8Reinsurance recoverable on paid and unpaid losses and unearned premiums 2,335.0 2,479.7Deferred acquisition costs 506.0 489.5Deferred income taxes 239.7 267.6Goodwill 184.9 184.9Other assets 526.1 511.8Assets of discontinued operations 114.9 130.5
Total assets $13,378.7 $13,484.9
LiabilitiesLoss and loss adjustment expense reserves $ 6,231.5 $ 6,197.0Unearned premiums 2,515.8 2,474.8Expenses and taxes payable 637.2 775.8Reinsurance premiums payable 374.7 466.2Debt 903.9 849.4Liabilities of discontinued operations 121.1 126.3
Total liabilities 10,784.2 10,889.5
Commitments and contingencies
Shareholders’ EquityPreferred stock, par value $0.01 per share; 20.0 million shares authorized; none issued — —Common stock, par value $0.01 per share; 300.0 million shares authorized; 60.5 million shares issued 0.6 0.6Additional paid-in capital 1,830.1 1,787.1Accumulated other comprehensive income 177.6 325.8Retained earnings 1,349.1 1,211.6Treasury stock at cost (16.8 and 16.2 million shares) (762.9) (729.7)
Total shareholders’ equity 2,594.5 2,595.4
Total liabilities and shareholders’ equity $13,378.7 $13,484.9
The accompanying notes are an integral part of these consolidated financial statements.

| THE HANOVER INSURANCE GROUP 2013 ANNUAL REPORT88
THE HANOVER INSURANCE GROUP, INC. AND SUBSIDIARIES
CONSOLIDATED STATEMENTS OF SHAREHOLDERS’ EQUITY
YEARS ENDED DECEMBER 31 2013 2012 2011
(in millions)
Preferred StockBalance at beginning and end of year $ — $ — $ —
Common StockBalance at beginning and end of year 0.6 0.6 0.6
Additional Paid-in CapitalBalance at beginning of year 1,787.1 1,784.8 1,796.5
Employee and director stock-based awards and other 43.0 2.3 (11.7)
Balance at end of year 1,830.1 1,787.1 1,784.8
Accumulated Other Comprehensive Income (Loss), net of taxNet Unrealized Appreciation (Depreciation) on Investments and Derivative Instruments:Balance at beginning of year 426.0 308.7 218.3
Net appreciation (depreciation) on available-for-sale securities and derivative instruments (166.7) 117.3 90.4
Balance at end of year 259.3 426.0 308.7
Defined Benefit Pension and Postretirement Plans:Balance at beginning of year (96.6) (86.8) (81.6)
Net actuarial gain (loss) arising in the period 10.8 (15.9) (11.8)Net amount recognized as net periodic benefit cost 9.7 6.1 6.6
Balance at end of year (76.1) (96.6) (86.8)
Cumulative Foreign Currency Translation Adjustment:Balance at beginning of year (3.6) (11.5) -
Amount recognized as cumulative foreign currency translation during the year (2.0) 7.9 (11.5)
Balance at end of year (5.6) (3.6) (11.5)
Total accumulated other comprehensive income 177.6 325.8 210.4
Retained EarningsBalance at beginning of year 1,211.6 1,211.3 1,223.7
Cumulative effect of accounting change, net of tax — — (2.3) Net income 251.0 55.9 36.7Dividends to shareholders (60.0) (55.1) (50.9)Stock-based compensation (53.5) (0.5) 4.1
Balance at end of year 1,349.1 1,211.6 1,211.3
Treasury StockBalance at beginning of year (729.7) (723.1) (720.1)
Shares purchased at cost (78.2) (20.0) (21.7)Net shares reissued at cost under employee stock-based compensation plans 45.0 13.4 18.7
Balance at end of year (762.9) (729.7) (723.1)
Total shareholders’ equity $2,594.5 $2,595.4 $2,484.0
The accompanying notes are an integral part of these consolidated financial statements.

THE HANOVER INSURANCE GROUP 2013 ANNUAL REPORT | 89
THE HANOVER INSURANCE GROUP, INC. AND SUBSIDIARIES
CONSOLIDATED STATEMENTS OF CASH FLOWS
YEARS ENDED DECEMBER 31 2013 2012 2011
(in millions)
Cash Flows From Operating ActivitiesNet income $ 251.0 $ 55.9 $ 36.7Adjustments to reconcile net income to net cash provided by operating activities:
Net realized investment gains (33.5) (22.8) (16.2)Net loss from repurchase of debt 19.9 5.1 2.3Gain on sale of Citizens Management, Inc. — (10.8) —Gain on discontinued operations — (0.7) (5.2)Net amortization and depreciation 35.0 35.6 26.7Stock-based compensation expense 12.4 12.8 12.0Amortization of defined benefit plan costs 14.9 9.3 10.2Deferred income taxes expense (benefit) 74.9 (35.5) (9.2)Change in deferred acquisition costs (16.3) (30.8) 18.3Change in premiums receivable, net of reinsurance premiums payable (107.4) (53.3) 69.4Change in loss, loss adjustment expense and unearned premium reserves 65.9 598.3 78.5Change in reinsurance recoverable 148.8 (230.7) (48.1)Change in expenses and taxes payable (62.9) 87.6 48.2Other, net (18.8) (11.8) (1.9)
Net cash provided by operating activities 383.9 408.2 221.7
Cash Flows From Investing ActivitiesProceeds from disposals and maturities of fixed maturities 1,394.3 1,684.8 1,624.2Proceeds from disposals of equity securities and other investments 217.8 218.2 101.2Purchase of fixed maturities (1,698.8) (2,170.4) (1,688.0)Purchase of equity securities and other investments (249.1) (274.9) (128.6)Proceeds from disposal of Citizens Management, Inc., net of cash transferred — 5.2 —Cash provided by business acquisitions, net of cash acquired — — 287.7Capital expenditures (22.9) (21.3) (16.5)Net proceeds (payments) related to derivative agreements — (4.4) 2.8
Net cash provided by (used in) investing activities (358.7) (562.8) 182.8
Cash Flows From Financing ActivitiesProceeds from exercise of employee stock options 25.0 2.6 3.9Proceeds from debt borrowings, net 168.6 7.4 325.4Increase (decrease) in cash collateral related to securities lending program (15.9) 5.2 (42.1)Dividends paid to shareholders (60.0) (55.1) (50.9)Repurchases of debt (139.9) (73.1) (86.8)Repurchases of common stock (78.2) (20.0) (21.7)Other financing activities (5.1) (0.4) (0.5)
Net cash provided by (used in) financing activities (105.5) (133.4) 127.3
Effect of exchange rate changes on cash 1.6 32.1 (3.9)
Net change in cash and cash equivalents (78.7) (255.9) 527.9Net change in cash related to discontinued operations 0.1 0.3 2.1Cash and cash equivalents, beginning of year 564.8 820.4 290.4
Cash and cash equivalents, end of year $ 486.2 $ 564.8 $ 820.4
Supplemental Cash Flow informationInterest payments $ 66.1 $ 62.7 $ 55.5Income tax net payments (refunds) $ 9.5 $ (5.5) $ 3.0
The accompanying notes are an integral part of these consolidated financial statements.
| THE HANOVER INSURANCE GROUP 2013 ANNUAL REPORT90
1. SUMMARY OF SIGNIFICANT ACCOUNTING POLICIES
A. BASIS OF PRESENTATION AND PRINCIPLES OF CONSOLIDATION
The consolidated financial statements of The HanoverInsurance Group, Inc. (“THG” or the “Company”), includethe accounts of The Hanover Insurance Company(“Hanover Insurance”) and Citizens Insurance Companyof America (“Citizens”), THG’s principal U.S. domiciledproperty and casualty companies; Chaucer Holdings plc(“Chaucer”), a specialist insurance underwriting groupwhich operates through the Society and Corporation ofLloyd’s (“Lloyd’s”); and certain other insurance and non-insurance subsidiaries. These legal entities conduct theiroperations through several business segments discussed inNote 14 – “Segment Information”. The acquisition ofChaucer on July 1, 2011, which has added meaningfulbusiness volumes to THG results, has affected the compa-rability of the consolidated financial statements and relat-ed footnotes for the years ended December 31, 2013, 2012and 2011. Results of operations for the years endedDecember 31, 2013 and 2012 include results from all ofthe Company’s business segments, while results of opera-tions for the year ended December 31, 2011 includeChaucer’s results for only the period from July 1, 2011through December 31, 2011. Additionally, the consolidat-ed financial statements include the Company’s discontin-ued operations, consisting primarily of the Company’sformer life insurance businesses, its accident and healthbusiness and prior to April 30, 2012, its third party admin-istration business. All intercompany accounts and transac-tions have been eliminated. During 2013, the Companyincreased additional paid-in capital and decreased retainedearnings by $34 million to correct the classification ofamounts relating to stock-based compensation in priorperiods. This reclassification within shareholders’ equityhad no impact on net income, assets, liabilities or totalshareholders’ equity of the Company for the current or anyprior period.The preparation of financial statements in conformity
with generally accepted accounting principles in theUnited States of America (“U.S. GAAP”) requires theCompany to make estimates and assumptions that affectthe reported amounts of assets and liabilities and disclo-sure of contingent assets and liabilities at the date of thefinancial statements and the reported amount of revenuesand expenses during the reporting period. Actual resultscould differ from those estimates. In the opinion of theCompany’s management these financial statements reflectall adjustments, consisting of normal recurring items nec-essary for a fair presentation of the financial position andresults of operations.
B. VALUATION OF INVESTMENTS
The Company is required to classify its investments intoone of three categories: held-to-maturity, available-for-saleor trading. It determines the appropriate classification offixed maturity and equity securities at the time of purchaseand re-evaluates such designation as of each balance sheetdate.Fixed maturities and equity securities are classified as
available-for-sale. Available-for-sale securities are carriedat fair value, with the unrealized gains and losses, net oftaxes, reported in accumulated other comprehensiveincome, a separate component of shareholders’ equity. Theamortized cost of fixed maturities is adjusted for amortiza-tion of premiums and accretion of discounts to maturity.Such amortization is included in net investment income.Fixed maturities that are delinquent are placed on non-
accrual status, and thereafter interest income is recognizedonly when cash payments are received.Realized investment gains and losses are reported as a
component of revenues based upon specific identificationof the investment assets sold. When an other-than-tempo-rary decline in value of a specific investment is deemed tohave occurred, and a charge to earnings is required, theCompany recognizes a realized investment loss.The Company reviews investments in an unrealized loss
position to identify other-than-temporary declines in value.When it is determined that a decline in value of an equitysecurity is other-than-temporary, the Company reduces thecost basis of the security to fair value with a correspondingcharge to earnings. When an other-than-temporary declinein value of a debt security is deemed to have occurred, theCompany must assess whether it intends to sell the secu-rity or more likely than not will be required to sell the secu-rity before recovery of its amortized cost basis. If the debtsecurity meets either of these two criteria, an other-than-temporary impairment (“OTTI”) is recognized in earningsequal to the entire difference between the security’s amor-tized cost basis and its fair value at the impairment meas-urement date. If the Company does not intend to sell thedebt security and it is not more likely than not theCompany will be required to sell the security before recov-ery of its amortized cost basis, the credit loss portion of anOTTI is recorded through earnings while the portionattributable to all other factors is recorded separately as acomponent of other comprehensive income. The amountof the OTTI that relates to credit is estimated by compar-ing the amortized cost of the fixed maturity security withthe net present value of the security’s projected future cashflows, discounted at the effective interest rate implicit inthe investment prior to impairment. The non-credit por-tion of the impairment is equal to the difference betweenthe fair value and the net present value of the security’scash flows at the impairment measurement date. Once an
Notes to Consolidated Financial Statements

THE HANOVER INSURANCE GROUP 2013 ANNUAL REPORT | 91
OTTI has been recognized, the new amortized cost basis ofthe security is equal to the previous amortized cost less theamount of OTTI recognized in earnings. For equitymethod investments, an impairment is recognized whenevidence demonstrates that an other-than-temporary lossin value has occurred, including the absence of the abilityto recover the carrying amount of the investment or theinability of the investee to sustain a level of earnings thatwould justify the carrying amount of the investment.
C. FINANCIAL INSTRUMENTS
In the normal course of business, the Company may enterinto transactions involving various types of financialinstruments, including debt, investments such as fixedmaturities, equity securities and mortgage loans, invest-ment and loan commitments, swap contracts, option con-tracts, forward contracts and futures contracts. Theseinstruments involve credit risk and could also be subject torisk of loss due to interest rate and foreign currency fluc-tuation. The Company evaluates and monitors each finan-cial instrument individually and, when appropriate,obtains collateral or other security to minimize losses.
D. OTHER INVESTMENTS
Other investments consist primarily of overseas deposits,which are investments maintained in overseas funds andmanaged exclusively by Lloyd’s. These funds are requiredin order to protect policyholders in overseas markets andenable the Company to operate in those markets. Overseasdeposits are carried at fair value. Realized and unrealizedgains and losses on overseas deposits, including the impactof foreign currency movements, are reflected in the incomestatement in the period the gain or loss was generated.
E. CASH AND CASH EQUIVALENTS
Cash and cash equivalents includes cash on hand,amounts due from banks and highly liquid debt instru-ments purchased with an original maturity of three monthsor less.
F. DEFERRED ACQUISITION COSTS
Acquisition costs consist of commissions, underwritingcosts and other costs, which vary with, and are primarilyrelated to, the successful production of premiums.Acquisition costs are deferred and amortized over theterms of the insurance policies.Deferred acquisition costs (“DAC”) for each line of
business are reviewed to determine if the costs are recov-erable from future income, including investment income.If such costs are determined to be unrecoverable, they areexpensed at the time of determination. Although recover-ability of DAC is not assured, the Company believes it ismore likely than not that all of these costs will be recov-
ered. The amount of DAC considered recoverable, howev-er, could be reduced in the near term if the estimates oftotal revenues discussed above are reduced or permanent-ly impaired as a result of a disposition of a line of business.The amount of amortization of DAC could be revised inthe near term if any of the estimates discussed above arerevised.
G. REINSURANCE RECOVERABLES
The Company shares certain insurance risks it has under-written, through the use of reinsurance contracts, withvarious insurance entities. Reinsurance accounting is fol-lowed for ceded transactions when the risk transfer provi-sions of ASC 944, Financial Services – Insurance (“ASC944”), have been met. As a result, when the Companyexperiences loss or claims events that are subject to a rein-surance contract, reinsurance recoverables are recorded.The amount of the reinsurance recoverable can vary basedon the terms of the reinsurance contract, the size of theindividual loss or claim, or the aggregate amount of alllosses or claims in a particular line or book of business oran aggregate amount associated with a particular accidentyear. The valuation of losses or claims recoverable dependson whether the underlying loss or claim is a reported lossor claim, or an incurred but not reported loss. For report-ed losses and claims, the Company values reinsurancerecoverables at the time the underlying loss or claim is rec-ognized, in accordance with contract terms. For incurredbut not reported losses, the Company estimates theamount of reinsurance recoverables based on the terms ofthe reinsurance contracts and historical reinsurance recov-ery information and applies that information to the grossloss reserve. Amounts recoverable from reinsurers are esti-mated in a manner consistent with the claim liability asso-ciated with the reinsured business and the balance isdisclosed separately in the financial statements. However,the ultimate amount of the reinsurance recoverable is notknown until all losses and claims are settled. Allowancesare established for amounts deemed uncollectible andreinsurance recoverables are recorded net of theseallowances. The Company evaluates the financial condi-tion of its reinsurers and monitors concentration risk tominimize its exposure to significant credit losses from indi-vidual reinsurers.
H. PROPERTY, EQUIPMENT AND CAPITALIZED SOFTWARE
Property, equipment, leasehold improvements and capital-ized software are recorded at cost, less accumulated depreciation and amortization. Depreciation is generallyprovided using the straight-line method over the estimateduseful lives of the related assets, which generally rangefrom 3 to 30 years. The estimated useful life for capitalized

| THE HANOVER INSURANCE GROUP 2013 ANNUAL REPORT92
software is generally 5 to 7 years. Amortization of leaseholdimprovements is provided using the straight-line methodover the lesser of the term of the leases or the estimateduseful life of the improvements.The Company tests for the recoverability of long-lived
assets whenever events or changes in circumstances indi-cate that the carrying amounts may not be recoverable.The Company recognizes impairment losses only to theextent that the carrying amounts of long-lived assetsexceed the sum of the undiscounted cash flows expected toresult from the use and eventual disposition of the assets.When an impairment loss occurs, the Company reducesthe carrying value of the asset to fair value and no longerdepreciates the asset. Fair values are estimated using dis-counted cash flow analysis.In 2013, the Company consolidated its operations in
Howell, Michigan from two buildings into one building.This resulted in a plan to relocate the employees and pur-sue the sale of one of the buildings. In conjunction withthe planned relocation, the Company recognized a loss of$4.7 million. This is included in other operating expensesin the Consolidated Statements of Income for the yearended December 31, 2013.
I. GOODWILL AND INTANGIBLE ASSETS
In accordance with the provisions of ASC 350, Intangibles –Goodwill and Other, the Company carries its goodwill atcost, net of amortization prior to January 1, 2002 and netof impairments. Increases to goodwill are generatedthrough acquisition and represent the excess of the cost ofan acquisition over the fair value of net assets acquired,including any intangibles acquired. Since January 1, 2002goodwill is no longer amortized but rather, is reviewed forimpairment. Additionally, acquisitions can also produceintangible assets, which have either a definite or indefinitelife. Intangible assets with definite lives are amortized overthat life, whereas those intangible assets determined tohave an indefinite life are reviewed at least annually forimpairment.The Company tests for the recoverability of goodwill
and intangible assets with indefinite lives annually orwhenever events or changes in circumstances indicate thatthe carrying amounts may not be recoverable. The Companyrecognizes impairment losses only to the extent that thecarrying amounts of reporting units with goodwill exceedthe fair value. The amount of the impairment loss that isrecognized is determined based upon the excess of the car-rying value of goodwill compared to the implied fair valueof the goodwill, as determined with respect to all assetsand liabilities of the reporting unit. The Company has per-formed its annual review of goodwill and intangible assetswith indefinite lives for impairment in the fourth quartersof 2013 and 2012 with no impairments recognized.
J. LIABILITIES FOR LOSSES, LAE, AND UNEARNEDPREMIUMS
Liabilities for outstanding claims, losses and loss adjust-ment expenses (“LAE”) are estimates of payments to bemade for reported losses and LAE and estimates of lossesand LAE incurred but not reported. These liabilities aredetermined using case basis evaluations and statisticalanalyses of historical loss patterns and represent estimatesof the ultimate cost of all losses incurred but not paid.These estimates are continually reviewed and adjusted asnecessary; adjustments are reflected in current operations.Estimated amounts of salvage and subrogation on unpaidlosses are deducted from the liability for unpaid claims.Premiums for direct and assumed business are reported
as earned on a pro-rata basis over the contract period. Theunexpired portion of these premiums is recorded asunearned premiums.All losses, LAE and unearned premium liabilities are
based on the various estimates discussed above. Althoughthe adequacy of these amounts cannot be assured, theCompany believes that it is more likely than not that theseliabilities and accruals will be sufficient to meet futureobligations of policies in force. The amount of liabilitiesand accruals, however, could be revised in the near-term ifthe estimates discussed above are revised.
K. DEBT
The Company’s debt at December 31, 2013 includes sen-ior debentures, subordinated debentures, and collateral-ized borrowings with the Federal Home Loan Bank ofBoston (“FHLBB”). The senior debentures are carried atprincipal amount borrowed, net of any applicable un -amortized discounts. The subordinated debentures andborrowings under the FHLBB program are carried at prin-cipal amount borrowed (See Note 6 – “Debt and CreditArrangements”).
L. PREMIUM, PREMIUM RECEIVABLE, FEE REVENUE AND RELATED EXPENSES
Insurance premiums written are generally recorded at thepolicy inception and are primarily earned on a pro ratabasis over the terms of the policies for all products.Premiums written include estimates, primarily in theChaucer segment, that are derived from multiple sources,which include the historical experience of the underlyingbusiness, similar businesses and available industry infor-mation. These estimates are regularly reviewed and updat-ed and any resulting adjustments are included in thecurrent year’s results. Unearned premium reserves repre-sent the portion of premiums written that relates to theunexpired terms of the underlying in-force insurance poli-cies and reinsurance contracts. Premium receivablesreflect the unpaid balance of premium written as of thebalance sheet date. Premium receivables are generallyshort-term in nature and are reported net of an allowance

THE HANOVER INSURANCE GROUP 2013 ANNUAL REPORT | 93
for estimated uncollectible premium accounts. The Com -pany reviews its receivables for collectability at the balancesheet date. The allowance for uncollectible accounts wasnot material as of December 31, 2013 and 2012. Cededpremiums are charged to income over the applicable termof the various reinsurance contracts with third party rein-surers. Reinsurance reinstatement premiums, whenrequired, are recognized in the same period as the lossevent that gave rise to the reinstatement premiums. Lossesand related expenses are matched with premiums, result-ing in their recognition over the lives of the contracts. Thismatching is accomplished through estimated and unpaidlosses and amortization of deferred acquisition costs.
M. INCOME TAXES
The Company is subject to the tax laws and regulations ofthe U.S. and foreign countries in which it operates. TheCompany files a consolidated U.S. federal income taxreturn that includes the holding company and its U.S. sub-sidiaries. Generally, taxes are accrued at the U.S. statutorytax rate of 35% for income from the U.S. operations. TheCompany’s primary non-U.S. jurisdiction is the UnitedKingdom (“U.K.”). In July 2012, the U.K. statutory ratedecreased from 26% to 24% effective April 1, 2012 andfrom 24% to 23% effective April 1, 2013. Further decreas-es were enacted in July 2013 to reduce the statutory ratefrom 23% to 21% effective April 1, 2014 and from 21% to20% effective April 1, 2015. The Company accrues taxeson certain non-U.S. income that is subject to U.S. tax atthe U.S. tax rate. Foreign tax credits, where available, areutilized to offset U.S. tax as permitted. Certain of our non-U.S. income is not subject to U.S. tax until repatriated.Foreign taxes on this non-U.S. income are accrued at thelocal foreign rate and do not have an accrual for U.S.deferred taxes since these earnings are intended to beindefinitely reinvested overseas.The Company’s accounting for income taxes represents
its best estimate of various events and transactions.Deferred income taxes are generally recognized when
assets and liabilities have different values for financialstatement and tax reporting purposes, and for other tempo-rary taxable and deductible differences as defined by ASC740, Income Taxes (“ASC 740”). These temporary differ-ences are measured at the balance sheet date using enact-ed tax rates expected to apply to taxable income in theyears the temporary differences are expected to reverse.These differences result primarily from insurance reserves,deferred acquisition costs, tax credit carryforwards, losscarryforwards and employee benefit plans.The realization of deferred tax assets depends upon the
existence of sufficient taxable income within the carrybackor carryforward periods under the tax law in the applicabletax jurisdiction. Consideration is given to all available pos-itive and negative evidence, including reversals of deferredtax liabilities, projected future taxable income, tax plan-
ning strategies and recent financial operations. Valuationallowances are established if, based on available informa-tion, it is determined that it is more likely than not that allor some portion of the deferred tax assets will not be real-ized. Changes in valuation allowances are generally reflectedin income tax expense or as an adjustment to other com-prehensive income (loss) depending on the nature of theitem for which the valuation allowance is being recorded.
N. STOCK-BASED COMPENSATION
The Company recognizes the fair value of compensationcosts for all share-based payments, including employeestock options, in the financial statements. Unvestedawards are generally expensed on a straight line basis, bytranche, over the vesting period of the award. TheCompany’s stock-based compensation plans are discussedfurther in Note 11 – “Stock-Based Compensation Plans”.
O. EARNINGS PER SHARE
Earnings per share (“EPS”) for the years ended December31, 2013, 2012 and 2011 is based on a weighted averageof the number of shares outstanding during each year.Basic and diluted EPS is computed by dividing incomeavailable to common stockholders by the weighted averagenumber of shares outstanding for the period. The weight-ed average shares outstanding used to calculate basic EPSdiffer from the weighted average shares outstanding usedin the calculation of diluted EPS due to the effect of dilu-tive employee stock options, nonvested stock grants andother contingently issuable shares. If the effect of suchitems is antidilutive, the weighted average shares outstand-ing used to calculate diluted EPS are equal to those usedto calculate basic EPS.Options to purchase shares of common stock whose
exercise prices are greater than the average market price ofthe common shares are not included in the computation ofdiluted earnings per share because the effect would beantidilutive.
P. FOREIGN CURRENCY
The Company’s reporting currency is the U.S. dollar. Thefunctional currencies of the Company’s foreign operationsare the U.K. pound sterling (“GBP”), U.S. dollar, andCanadian dollar. Assets and liabilities of foreign operationsare translated into the U.S. dollar using the exchange ratesin effect at the balance sheet date. Revenues and expensesof foreign operations are translated using the averageexchange rate for the period. Gains or losses from translat-ing the financial statements of foreign operations arerecorded in the cumulative translation adjustment, as aseparate component of accumulated other comprehensiveincome. Gains and losses arising from transactions denom-inated in a foreign currency, other than the Company’sfunctional currencies, are included in net income (loss),

| THE HANOVER INSURANCE GROUP 2013 ANNUAL REPORT94
except for the Company’s foreign currency denominatedavailable-for-sale investments. The Company’s foreign cur-rency denominated available-for-sale investments’ changein exchange rates between the local currency and the func-tional currency at each balance sheet date represents anunrealized appreciation or depreciation in value of thesesecurities, and is included as a component of accumulatedother comprehensive income.The Company manages its exposure to foreign currency
risk primarily by matching assets and liabilities denominat-ed in the same currency. To the extent that assets and lia-bilities in foreign currencies are not matched, theCompany is exposed to foreign currency risk. For function-al currencies, the related exchange rate fluctuations arereflected in other comprehensive income (loss). TheCompany translated Chaucer’s balance sheet at December31, 2013, 2012 and 2011 from GBP to U.S. dollars usinga conversion rate of 1.66, 1.63 and 1.55, respectively. TheCompany recognized approximately $4.2 million and $6.3million in foreign currency transaction gains in theStatement of Income during the years ended December31, 2013 and 2012, respectively. During the six monthsended December 31, 2011, the Company recognized $5.1million of foreign exchange transaction gains including the$6.4 million gain recognized on the foreign currency for-ward contract associated with the purchase price ofChaucer. See Note 2 – “Acquisitions and DiscontinuedOperations” for further information.
Q. NEW ACCOUNTING PRONOUNCEMENTS
Recently Implemented StandardsIn February 2013, the Financial Accounting StandardsBoard (“FASB”) issued Accounting Standards Codification(“ASC”) Update No. 2013-02 (Topic 220) ComprehensiveIncome Reporting of Amounts Reclassified Out ofAccumulated Other Comprehensive Income (“ASC UpdateNo. 2013-02”). This guidance requires an entity to provideinformation about the amounts reclassified out of accumu-lated other comprehensive income (“AOCI”) either on theface of the Statement of Income or in the Notes to theConsolidated Financial Statements. Significant amountsreclassified out of AOCI should be provided by the respec-tive line items of net income but only if the amount reclas-sified is required under U.S. GAAP to be reclassified in itsentirety to net income in the same reporting period. Foramounts not required to be reclassified in their entirety tonet income, a cross-reference to other disclosures provid-ed for in accordance with U.S. GAAP is required. Thisguidance was applicable for reporting periods beginningafter December 15, 2012. The Company implemented theguidance effective January 1, 2013. The effect of imple-menting the guidance relates to financial statement pres-entation and disclosures. (See disclosures in Note 10 –Other Comprehensive Income.)
In July 2012, the FASB issued ASC Update No. 2012-02 (Topic 350) Testing Indefinite – Lived Intangible Assetsfor Impairment. This ASC update allows an entity to firstassess qualitative factors to determine whether the exis-tence of events and circumstances indicates that it is morelikely than not that the indefinite – lived intangible asset isimpaired. This assessment should be used as a basis fordetermining whether it is necessary to perform the quanti-tative impairment test. An entity would not be required tocalculate the fair value of the intangible asset and performthe quantitative test unless the entity determines, basedupon its qualitative assessment, that it is more likely thannot that its fair value is less than its carrying value. Theupdate further improves previous guidance by expandingupon the examples of events and circumstances that anentity should consider in determining whether it is morelikely than not that the fair value of an indefinite – livedintangible asset is less than its carrying amount. Theupdate also allows an entity the option to bypass the qual-itative assessment for any indefinite-lived intangible assetin any period and proceed directly to performing the quan-titative impairment test. An entity will be able to resumeperforming the qualitative assessment in any subsequentperiod. This ASC update was effective for annual andinterim periods beginning after September 15, 2012, withearly adoption permitted. The Company implemented thisguidance effective October 1, 2012. The effect of imple-menting this guidance was not material to the Company’sfinancial position or results of operations.In September 2011, the FASB issued ASC Update No.
2011-08 (Topic 350) Testing Goodwill for Impairment. ThisASC update allows an entity to first assess qualitative fac-tors to determine whether it is necessary to perform thetwo-step quantitative goodwill impairment test. Theupdate provides that an entity would not be required to cal-culate the fair value of a reporting unit unless the entitydetermines, based on its qualitative assessment, that it ismore likely than not that its fair value is less than its car-rying amount. The update further improves previous guid-ance by expanding upon the examples of events andcircumstances that an entity should consider in determin-ing whether it is more likely than not that the fair value ofa reporting unit is less than its carrying amount. Also, theupdate improves the examples of events and circumstancesthat should be considered by an entity that has a reportingunit with a zero or negative carrying amount in determin-ing whether to measure an impairment loss, if any, underthe second step of the goodwill impairment test. This ASCupdate was effective for annual and interim periods begin-ning after December 15, 2011, with early adoption permit-ted. The Company implemented this guidance effectiveJanuary 1, 2012. The effect of implementing this guidancewas not material to the Company’s financial position orresults of operations.

THE HANOVER INSURANCE GROUP 2013 ANNUAL REPORT | 95
In June 2011, the FASB issued ASC Update No. 2011-05 (Topic 220) Presentation of Comprehensive Income(“ASC Update No. 2011-05”). This ASC update requirescompanies to present net income and other comprehensiveincome in either a single continuous statement or in twoseparate, but consecutive, statements of income and othercomprehensive income. The option to present items ofother comprehensive income in the statement of changesin equity is eliminated. In addition, an entity is required topresent on the face of the financial statements reclassifica-tion adjustments from other comprehensive income to netincome. This ASC update should be applied retrospective-ly and except for the provisions related to reclassificationadjustment, was effective for interim and annual periodsbeginning after December 15, 2011. In December 2011,the FASB issued ASC Update 2011-12 (Topic 220)Comprehensive Income which deferred the implementa-tion date of the reclassification adjustment guidance inASC Update No. 2011-05 and was subsequently replacedby ASC Update No. 2013-02, as described above. TheCompany implemented the guidance related to financialstatements presentation effective January 1, 2012. Theeffect of implementing the guidance related to financialstatements presentation did not have a significant impactto the Company’s financial statement presentation.In May 2011, the FASB issued ASC Update No. 2011-
04 (Topic 820) Amendments to Achieve Common Fair ValueMeasurement and Disclosure Requirements in U.S. GAAPand IFRSs. This ASC update results in a consistent defini-tion of fair value and common requirements for measure-ment of and disclosure about fair value for both U.S.GAAP and International Financial Reporting Standards(“IFRS”). The new guidance includes changes to how andwhen the valuation premise of highest and best useapplies, clarification on the application of blockage factorsand other premiums and discounts, as well as new andrevised disclosure requirements. This ASC update waseffective for interim and annual periods beginning afterDecember 15, 2011. The Company implemented thisguidance as of January 1, 2012. The effect of implement-ing this guidance was not material to the Company’s finan-cial position or results of operations.In October 2010, the FASB issued ASC Update No.
2010-26 (Topic 944), Accounting for Costs Associated withAcquiring or Renewing Insurance Contracts (a consensus ofthe FASB Emerging Issues Task Force). This ASC updateprovides clarity in defining which costs relating to theacquisition of new or renewal insurance contracts qualifyfor deferral, commonly known as deferred acquisitioncosts. Additionally, this update specifies that only costsassociated with the successful acquisition of a policy orcontract may be deferred, whereas industry practice histor-ically included costs relating to unsuccessful contractacquisition. This ASC was effective for fiscal years begin-ning after December 15, 2011. Retrospective application
to all prior periods upon the date of adoption was permit-ted. The Company implemented this guidance effectiveJanuary 1, 2012 and elected to apply this guidance retro-spectively. Retrospective application required that the newaccounting principle be reflected in the earliest period pre-sented as if the accounting principle had always been used.Upon adoption in 2012, the Company applied this guid-ance to the then earliest period, which was January 1,2010. Additionally, since the Company purchased ChaucerJuly 1, 2011, it has reflected the impact of the retrospec-tive application for Chaucer through equity, as a cumula-tive effect of a change in accounting principle, during2011. The implementation of this ASC resulted in an after-tax reduction to our shareholders’ equity as of January 1,2012 of $25.8 million, or 1%. The effect of implementingthis guidance was not material to our results of operationsor cash flows on either a historical basis or a prospectivebasis.
Recently Issued StandardsIn July 2013, the FASB issued ASC Update No. 2013-11(Topic 740) Presentation of an Unrecognized Tax BenefitWhen a Net Operating Loss Carryforward, a Similar TaxLoss, or a Tax Credit Carryforward Exists (a consensus of theFASB Emerging Issues Task Force). This ASC update clari-fies the applicable guidance for the presentation of anunrecognized tax benefit when a net operating loss carry-forward, a similar tax loss, or a tax credit carryforwardexists. An unrecognized tax benefit, or a portion of anunrecognized tax benefit, should be presented in the finan-cial statements as a reduction to a deferred tax asset for anet operating loss carryforward, a similar tax loss, or a taxcredit carryforward as long as it is available, at the report-ing date under the tax law of the applicable jurisdiction, tosettle any additional income taxes that would result fromthe disallowance of a tax position (with certain exceptions).The assessment of whether a deferred tax asset is availableis based on the unrecognized tax benefit and deferred taxasset that exist at the reporting date and should be madepresuming disallowance of the tax position at the reportingdate. This ASC update is effective for annual and interimperiods beginning after December 15, 2013, with earlyadoption permitted, and is to be applied prospectively to allunrecognized tax benefits that exist at the effective date.Retrospective application is permitted. The Company doesnot expect the adoption of ASC Update 2013-11 to have amaterial impact on its financial position or results of operations.In March 2013, the FASB issued ASC Update No.
2013-05 (Topic 830) Foreign Currency Matters-Parent’sAccounting for the Cumulative Translation Adjustmentupon Derecognition of Certain Subsidiaries or Groups ofAssets within a Foreign Entity or of an Investment in aForeign Entity (a consensus of the FASB Emerging IssuesTask Force). This ASC update clarifies the applicable guid-

| THE HANOVER INSURANCE GROUP 2013 ANNUAL REPORT96
ance for the release of the cumulative translation adjust-ment into net income when a parent either sells all or aportion of its investment in a foreign entity. This guidanceis also required to be applied when an entity no longerholds a controlling financial interest in a subsidiary orgroup of assets that is a nonprofit activity or a businesswithin a foreign entity (with certain exceptions). Addition -ally, this update clarifies that the sale of an investment ina foreign entity includes events that result in an acquirerobtaining control of an acquiree in which it held an equityinterest immediately before the acquisition date in a busi-ness combination achieved in stages. This ASC update iseffective for annual and interim periods beginning afterDecember 15, 2013, with early adoption permitted, and isto be applied prospectively to derecognition events occur-ring after the effective date. The Company does not expectthe adoption of ASC Update 2013-05 to have a materialimpact on its financial position or results of operations.
R. RECLASSIFICATIONS
Certain prior year amounts have been reclassified to con-form to the current year presentation.
2. ACQUISITIONS AND DISCONTINUEDOPERATIONS
ACQUISITIONS
Chaucer AcquisitionOn July 1, 2011, the Company acquired Chaucer, a U.K.insurance business. Shareholders of Chaucer received53.3 pence for each Chaucer share, which was paid ineither cash or loan notes to those shareholders who elect-ed to receive such notes in lieu of cash. The following tablesummarizes the transaction in both GBP and U.S. dollars:
(in millions)
Aggregate purchase price announced on April 20, 2011
Based on 53.3p contract price £ 297.7 $485.3Actual consideration on July 14, 2011:
Cash £ 287.4 $455.0Loan notes and other payables 9.5 15.3Foreign exchange forward settlement — 11.3
Total £ 296.9 $481.6
The difference between the aggregate purchase price atsigning and closing is attributable to the effect of currencyfluctuations between the GBP and the U.S. dollar, as wellas a change in outstanding shares.In connection with the transaction, the Company
entered into a foreign exchange forward contract, whichprovided for an economic hedge between the agreed uponpurchase price of Chaucer in GBP and currency fluctua-tions between the GBP and U.S. dollar prior to close. This
contract effectively locked in the U.S. dollar equivalent ofthe purchase price to be delivered in GBP and was settledat a loss of $11.3 million during the year ended December31, 2011. The loss on the contract was due to a decreasein the exchange rate between the GBP and U.S. dollar, butwas partially offset by the lower U.S. dollars required tomeet the GBP-based purchase price, resulting in a $6.4million gain on foreign exchange during the year endedDecember 31, 2011.Acquisition costs, which include advisory, legal, and
accounting costs, totaled $11.7 million and were expensedas incurred.
Pro Forma ResultsThe following unaudited pro forma information presentsthe combined revenues, net income (loss) and net income(loss) per share of THG and Chaucer for the year endedDecember 31, 2011 with pro forma purchase accountingadjustments as if the acquisition had been consummatedas of January 1, 2011. This pro forma information is notnecessarily indicative of what would have occurred had theacquisition and related transactions been made on the dateindicated, or of future results of the Company. Amounts in2011 are converted from GBP to U.S. dollar at a 1.60exchange rate.
(UNAUDITED)
YEAR ENDED DECEMBER 31 2011
(in millions, except per share data)
Revenue $4,364.8Net income (loss) $ (12.1)Net income (loss) per share – basic $ (0.27)Net income (loss) per share – diluted(1) $ (0.27)Weighted average shares outstanding – basic 45.2Weighted average shares outstanding – diluted(1) 45.2
(1) Weighted average shares outstanding and per diluted share amounts in 2011exclude common stock equivalents, since the impact of these instruments would beantidilutive.
DISCONTINUED OPERATIONS
Discontinued operations primarily consist of theCompany’s former life insurance businesses, which weresold prior to 2009, its Discontinued Accident and HealthBusiness and its former third party administration busi-ness, Citizens Management, Inc. (“CMI”), which was soldin 2012.During 1999, the Company exited its accident and
health insurance business, consisting of its EmployeeBenefit Services business, its Affinity Group Underwritersbusiness and its accident and health assumed reinsurancepool business. Prior to 1999, these businesses comprisedsubstantially all of the former Corporate Risk ManagementServices segment. Accordingly, the operating results of thediscontinued segment have been reported in accordancewith Accounting Principles Board Opinion No. 30,

THE HANOVER INSURANCE GROUP 2013 ANNUAL REPORT | 97
Reporting the Results of Operations – Reporting the Effectsof Disposal of a Segment of a Business, and Extraordinary,Unusual and Infrequently Occurring Events andTransactions (“APB Opinion No. 30”). On January 2, 2009,Hanover Insurance directly assumed a portion of the acci-dent and health business; and therefore continues to applyAPB Opinion No. 30 to this business. In addition, theremainder of the Discontinued First Allmerica FinancialLife Insurance Company (“FAFLIC”) accident and healthbusiness was reinsured by Hanover Insurance in connec-tion with the sale of FAFLIC to Commonwealth Annuity,and has been reported in accordance with ASC 205,Presentation of Financial Statements.The accident and health business had no significant
financial results that impacted 2013, 2012 or 2011. AtDecember 31, 2013 and 2012, the portion of the discon-tinued accident and health business that was directlyassumed had assets of $66.6 million and $72.9 million,
respectively, consisting primarily of invested assets, and lia-bilities of $51.3 million and $52.5 million, respectively,consisting primarily of policy liabilities. At December 31,2013 and 2012, the assets and liabilities of this business,as well as those of the reinsured portion of the accident andhealth business are classified as assets and liabilities of dis-continued operations in the Consolidated Balance Sheets.In 2013, the Company recognized a $5.8 million gain
relating to its former life insurance businesses. This wasprimarily due to an insurance settlement related to a classaction lawsuit, net of tax.On April 30, 2012, the Company completed the sale of
its third party administration subsidiary, CMI. TheCompany recognized net gains of $10.8 million after taxesrelated to this transaction during the year ended December31, 2012. Included in this amount was a contingent gainwith a fair value of $1.7 million that was entirely con-tributed to the Company’s charitable foundation.
3. INVESTMENTS
A. FIXED MATURITIES AND EQUITY SECURITIES
The amortized cost and fair value of available-for-sale fixed maturities and the cost and fair value of equity securitieswere as follows:
DECEMBER 31, 2013
(in millions)Gross Gross OTTI
Amortized Unrealized Unrealized UnrealizedCost or Cost Gains Losses Fair Value Losses
Fixed maturities:U.S. Treasury and government agencies $ 417.5 $ 3.3 $ 14.2 $ 406.6 $ —Foreign government 304.5 2.1 1.6 305.0 —Municipal 1,108.0 37.4 19.1 1,126.3 —Corporate 3,690.2 171.5 37.5 3,824.2 8.6Residential mortgage-backed 722.8 20.1 14.1 728.8 1.6Commercial mortgage-backed 405.9 10.5 4.8 411.6 —Asset-backed 166.3 2.0 0.2 168.1 —
Total fixed maturities $6,815.2 $ 246.9 $ 91.5 $6,970.6 $ 10.2
Equity securities $ 366.5 $ 66.9 $ 3.2 $ 430.2 $ —
DECEMBER 31, 2012
(in millions)Gross Gross OTTI
Amortized Unrealized Unrealized UnrealizedCost or Cost Gains Losses Fair Value Losses
Fixed maturities:U.S. Treasury and government agencies $ 317.2 $ 8.8 $ 0.4 $ 325.6 $ —Foreign government 348.5 4.6 0.2 352.9 —Municipal 1,010.2 87.2 1.1 1,096.3 —Corporate 3,512.8 275.4 14.8 3,773.4 9.3Residential mortgage-backed 769.0 39.4 3.2 805.2 1.7Commercial mortgage-backed 373.3 23.2 0.3 396.2 —Asset-backed 198.5 4.1 — 202.6 —
Total fixed maturities $ 6,529.5 $ 442.7 $ 20.0 $ 6,952.2 $ 11.0
Equity securities $ 299.0 $ 21.6 $ 4.8 $ 315.8 $ —

| THE HANOVER INSURANCE GROUP 2013 ANNUAL REPORT98
OTTI unrealized losses in the tables above representOTTI recognized in accumulated other comprehensiveincome. This amount excludes net unrealized gains onimpaired securities relating to changes in the value of suchsecurities subsequent to the impairment measurementdate of $16.4 million and $20.5 million as of December31, 2013 and 2012, respectively.The Company participates in a security lending program
for the purpose of enhancing income. Securities on loan tovarious counterparties had a fair value of $13.6 million and$29.2 million at December 31, 2013 and 2012, respective-ly, and were fully collateralized by cash. The fair value ofthe loaned securities is monitored on a daily basis, and thecollateral is maintained at a level of at least 102% of thefair value of the loaned securities. Securities lending col-lateral is recorded by the Company in cash and cash equiv-alents, with an offsetting liability included in expenses andtaxes payable.At December 31, 2013 and 2012, fixed maturities with
fair values of $142.4 million and $115.7 million, respec-tively, and amortized cost of $135.2 million and $106.2million, respectively, were on deposit with various state andgovernmental authorities.In accordance with Lloyd’s operating guidelines, the
Company deposits funds at Lloyd’s to support underwritingoperations. These funds are available only to fund claimobligations. At December 31, 2013 and 2012, fixed matu-rities with a fair value of approximately $334 million and$497 million, respectively, and cash of $1 million and $3million, respectively, were on deposit with Lloyd’s.The Company enters into various agreements that may
require its fixed maturities to be held as collateral by oth-ers. At December 31, 2013 and 2012, fixed maturities witha fair value of $160.9 million and $213.8 million, respec-tively, were held as collateral for collateralized borrowingsand other arrangements. Of these amounts, $148.1 millionand $200.8 million related to the FHLBB collateralizedborrowing program at December 31, 2013 and 2012,respectively. See Note 6—“Debt and Credit Arrangements”for additional information related to the Company’sFHLBB program.
The amortized cost and fair value by maturity periodsfor fixed maturities are shown below. Actual maturitiesmay differ from contractual maturities because borrowersmay have the right to call or prepay obligations with orwithout call or prepayment penalties, or the Company mayhave the right to put or sell the obligations back to theissuers.
DECEMBER 31 2013
(in millions)Amortized Fair
Cost Value
Due in one year or less $ 495.5 $ 501.4Due after one year through five years 2,234.5 2,327.9Due after five years through ten years 2,100.2 2,139.6Due after ten years 690.0 693.2
5,520.2 5,662.1Mortgage-backed and asset-backed securities 1,295.0 1,308.5
Total fixed maturities $6,815.2 $6,970.6
B. DERIVATIVE INSTRUMENTS
The Company maintains an overall risk management strat-egy that incorporates the use of derivative instruments, asnecessary, to manage significant unplanned fluctuations inearnings that may be caused by foreign currency exchangeand interest rate volatility.The Company did not use derivative instruments in 2013.
In 2012, the Company realized a loss of $5.1 million onfutures contracts relating to the realization for tax purpos-es only, of unrealized gains in its investment portfolio.Additionally, the Company utilized a foreign currency for-ward contract to mitigate changes in fair value caused byforeign currency fluctuation in converting GBP denomi-nated securities into their U.S. dollar denominated equiv-alent. The contract was terminated in March 2012 and theCompany recognized a gain of $0.7 million.

THE HANOVER INSURANCE GROUP 2013 ANNUAL REPORT | 99
In 2011, the Company realized losses on derivativeinstruments of $7.1 million. In April 2011, the Companyentered into a foreign currency forward contract as an eco-nomic hedge of the foreign currency exchange risk embed-ded in the purchase price of Chaucer, which wasdenominated in GBP resulting in a loss of $11.3 million,reflected in other operating expenses in the ConsolidatedStatements of Income. In May 2011, the Companyentered into a treasury lock forward agreement to hedgethe interest rate risk associated with the planned issuanceof senior debt resulting in a loss of $1.9 million which wasrecorded in accumulated other comprehensive income andis being recognized as an expense over the term of the sen-ior notes. This hedge qualified as a cash flow hedge.Additionally in 2011, Chaucer held foreign currency for-ward contracts utilized to mitigate changes in fair valuecaused by foreign currency fluctuation in converting thefair value of GBP and Euro denominated investment port-folios into their U.S. dollar denominated equivalent.During the year ended December 31, 2011, the Companyrecognized a net gain of $6.1 million, reflected in net real-ized investment gains in the Consolidated Statements ofIncome, related to these instruments, which were termi-nated in October 2011.
C. UNREALIZED GAINS AND LOSSES
Unrealized gains and losses on available-for-sale and othersecurities are summarized in the following table.
YEARS ENDED DECEMBER 31
(in millions)Equity
Fixed Securities2013 Maturities and Other Total
Net appreciation, beginning of year $ 410.1 $ 15.9 $ 426.0Net appreciation (depreciation)
on available-for-sale securities and derivative instruments (273.6) 48.1 (225.5)
Change in OTTI losses recognized in other comprehensive income 0.8 — 0.8
Benefit (provision) for deferred income taxes 74.8 (16.8) 58.0
(198.0) 31.3 (166.7)
Net appreciation, end of year $ 212.1 $ 47.2 $ 259.3
2012
Net appreciation, beginning of year $ 300.2 $ 8.5 $ 308.7Net appreciation on available-
for-sale securities and derivative instruments 140.7 10.6 151.3
Change in OTTI losses recognized in other comprehensive income 12.2 — 12.2
Provision for deferred income taxes (43.0) (3.2) (46.2)
109.9 7.4 117.3
Net appreciation, end of year $ 410.1 $ 15.9 $ 426.0
2011
Net appreciation, beginning of year $ 210.3 $ 8.0 $ 218.3Net appreciation (depreciation) on
available-for-sale securities andderivative instruments 66.4 (1.3) 65.1
Change in OTTI losses recognized in other comprehensive income 10.5 — 10.5
Benefit for deferred income taxes 13.0 1.8 14.8
89.9 0.5 90.4
Net appreciation, end of year $ 300.2 $ 8.5 $ 308.7
Equity securities and other balances at December 31,2013, 2012 and 2011 include after-tax net appreciation onother invested assets of $2.9 million, $2.1 million and $1.9million, respectively. Fixed maturities at December 31,2013, 2012 and 2011 include after-tax net depreciation onderivative instruments of $0.9 million, $1.0 million and$1.2 million, respectively.

| THE HANOVER INSURANCE GROUP 2013 ANNUAL REPORT100
D. SECURITIES IN AN UNREALIZED LOSS POSITION
The following tables provide information about the Company’s fixed maturities and equity securities that were in anunrealized loss position at December 31, 2013 and 2012:
DECEMBER 31, 2013
(in millions)12 months or less Greater than 12 months Total
Gross Unrealized Gross Unrealized Gross Unrealized Losses Fair Value Losses Fair Value Losses Fair Value
Fixed maturities:Investment grade:
U.S. Treasury and government agencies $ 12.3 $ 247.9 $ 1.9 $ 18.8 $ 14.2 $ 266.7Foreign governments 1.5 129.0 0.1 17.3 1.6 146.3Municipal 14.8 345.3 4.3 39.9 19.1 385.2Corporate 21.4 872.7 11.6 87.7 33.0 960.4Residential mortgage-backed 10.3 321.1 3.4 29.5 13.7 350.6Commercial mortgage-backed 4.2 155.4 0.6 10.2 4.8 165.6Asset-backed 0.2 31.0 — 0.3 0.2 31.3
Total investment grade 64.7 2,102.4 21.9 203.7 86.6 2,306.1
Below investment grade:Corporate 2.9 71.9 1.6 21.4 4.5 93.3Residential mortgage-backed 0.1 2.0 0.3 1.5 0.4 3.5
Total below investment grade 3.0 73.9 1.9 22.9 4.9 96.8
Total fixed maturities 67.7 2,176.3 23.8 226.6 91.5 2,402.9
Equity securities 2.8 45.2 0.4 0.7 3.2 45.9
Total $ 70.5 $2,221.5 $ 24.2 $ 227.3 $ 94.7 $2,448.8
DECEMBER 31, 2012
(in millions)12 months or less Greater than 12 months Total
Gross Unrealized Gross Unrealized Gross Unrealized Losses Fair Value Losses Fair Value Losses Fair Value
Fixed maturities:Investment grade:
U.S. Treasury and government agencies $ 0.2 $ 89.5 $ 0.2 $ 8.5 $ 0.4 $ 98.0Foreign governments 0.2 81.2 — 0.4 0.2 81.6Municipal 0.5 61.9 0.6 24.0 1.1 85.9Corporate 1.8 224.8 6.6 59.0 8.4 283.8Residential mortgage-backed 0.5 47.3 2.0 9.4 2.5 56.7Commercial mortgage-backed 0.2 29.9 0.1 4.9 0.3 34.8Asset-backed — 11.4 — 0.3 — 11.7
Total investment grade 3.4 546.0 9.5 106.5 12.9 652.5
Below investment grade:Municipal — — — 2.0 — 2.0Corporate 1.1 26.6 5.3 50.6 6.4 77.2Residential mortgage-backed 0.1 1.6 0.6 2.5 0.7 4.1
Total below investment grade 1.2 28.2 5.9 55.1 7.1 83.3
Total fixed maturities 4.6 574.2 15.4 161.6 20.0 735.8
Equity securities 4.8 74.4 — — 4.8 74.4
Total $ 9.4 $ 648.6 $ 15.4 $ 161.6 $ 24.8 $ 810.2

THE HANOVER INSURANCE GROUP 2013 ANNUAL REPORT | 101
The Company views gross unrealized losses on fixedmaturities and equity securities as being temporary since itis its assessment that these securities will recover in thenear term, allowing the Company to realize the anticipat-ed long-term economic value. The Company employs a sys-tematic methodology to evaluate declines in fair valuebelow amortized cost for fixed maturity securities or costfor equity securities. In determining OTTI of fixed maturi-ty and equity securities, the Company evaluates severalfactors and circumstances, including the issuer’s overallfinancial condition; the issuer’s credit and financialstrength ratings; the issuer’s financial performance, includ-ing earnings trends, dividend payments and asset quality;any specific events which may influence the operations ofthe issuer; the general outlook for market conditions in theindustry or geographic region in which the issuer operates;and the length of time and the degree to which the fairvalue of an issuer’s securities remains below theCompany’s cost. With respect to fixed maturity invest-ments, the Company considers any factors that might raisedoubt about the issuer’s ability to make contractual pay-ments as they come due and whether the Company expectsto recover the entire amortized cost basis of the security.With respect to equity securities, the Company considersits ability and intent to hold the investment for a period oftime to allow for a recovery in value.
E. OTHER
The Company had no concentration of investments in asingle investee that exceeded 10% of shareholders’ equityexcept for fixed maturities invested in Federal Home LoanMortgage Corp., which had a fair value of $341.8 millionand $415.7 million as of December 31, 2013 and 2012,respectively.On December 21, 2012, the Company sold an office
building and adjacent garage that it had developed for$75.9 million, and recognized an estimated gain of $3.3million. In 2013, upon receipt of final construction costs,the gain was adjusted by $(0.9) million, to $2.4 million.The project was financed, in part, with $46.3 million ofFHLBB advances through the Company’s membership inthe FHLBB, which was repaid in January 2013.At December 31, 2013, there were contractual invest-
ment commitments of up to $58.6 million.The Company held overseas deposits of $149.6 million
and $169.2 million at December 31, 2013 and 2012,respectively, which are investments held in overseas fundsand managed exclusively by Lloyd’s. These investments arereflected in other investments in the Consolidated BalanceSheets.
4. INVESTMENT INCOME AND GAINS AND LOSSES
A. NET INVESTMENT INCOME
The components of net investment income were as follows:
YEARS ENDED DECEMBER 31 2013 2012 2011
(in millions)
Fixed maturities $ 254.8 $ 264.2 $ 254.3Equity securities 15.6 15.3 6.8Other investments 8.8 7.0 4.8
Gross investment income 279.2 286.5 265.9Less investment expenses (10.2) (9.9) (7.7)
Net investment income $ 269.0 $ 276.6 $ 258.2
The carrying value of non-income producing fixedmaturities, as well as the carrying value of fixed maturitysecurities on non-accrual status, at December 31, 2013and 2012 were not material. The effects of non-accrualsfor the years ended December 31, 2013, 2012 and 2011,compared with amounts that would have been recognizedin accordance with the original terms of the fixed maturi-ties, were reductions in net investment income of $2.3 mil-lion, $2.5 million and $2.3 million, respectively.
B. NET REALIZED INVESTMENT GAINS AND LOSSES
Net realized gains (losses) on investments were as follows:
YEARS ENDED DECEMBER 31 2013 2012 2011
(in millions)
Equity securities 26.7 15.5 0.9Fixed maturities $ 8.6 $ 9.7 $ 20.4Real estate (0.9) 3.3 —Derivative instruments — (4.4) 5.8Other investments (0.9) (0.5) 1.0
Net realized investment gains $ 33.5 $ 23.6 $ 28.1
Included in the net realized investment gains (losses)were other-than-temporary impairments of investmentsecurities recognized in earnings totaling $6.0 million,$7.8 million and $6.9 million in 2013, 2012 and 2011,respectively.
Other-than-temporary-impairmentsFor 2013, total OTTI was $7.0 million. Of this amount,$6.0 million was recognized in earnings and $1.0 millionwas recorded as unrealized losses in accumulated othercomprehensive income. Of the $6.0 million recorded inearnings, $2.5 million related to an emerging marketsexchange-traded fund, $1.6 million related to commonstocks, $1.4 million was estimated credit losses on fixed

| THE HANOVER INSURANCE GROUP 2013 ANNUAL REPORT102
maturity securities and $0.5 million related to fixed matu-rity securities that the Company intends to sell.For 2012, total OTTI was $7.3 million. Of this amount,
$7.8 million was recognized in earnings, including $0.5million that was transferred from unrealized losses in accu-mulated other comprehensive income. Of the $7.8 millionrecorded in earnings, $5.4 million related to fixed maturi-ty securities that the Company intends to sell, $1.2 millionwas estimated credit losses on fixed maturity securities and$1.2 million related to common stocks.For 2011, total OTTI was $4.9 million. Of this amount,
$6.9 million was recognized in earnings, including $2.0million that was transferred from unrealized losses in accu-mulated other comprehensive income. Of the $6.9 millionrecorded in earnings, $4.6 million related to fixed maturi-ty securities that the Company intends to sell, $1.4 millionrelated to common stocks and $0.9 million was estimatedcredit losses on fixed maturity securities.The methodology and significant inputs used to meas-
ure the amount of credit losses on fixed maturities in 2013,2012 and 2011 were as follows:Corporate bonds – the Company utilized a financialmodel that derives expected cash flows based on proba-bility-of-default factors by credit rating and asset dura-tion and loss-given-default factors based on securitytype. These factors are based on historical data provid-ed by an independent third-party rating agency.
Asset-backed securities, including commercial and resi-dential mortgage-backed securities – the Company uti-lized cash flow estimates based on bond specific factsand circumstances that include collateral characteris-tics, expectations of delinquency and default rates, lossseverity, prepayment speeds and structural support,including subordination and guarantees.
Municipals – the Company utilized cash flow estimatesbased on bond specific facts and circumstances thatmay include the political subdivision’s taxing authority,the issuer’s ability to adjust user fees or other sources ofrevenue to satisfy its debt obligations and the ability toaccess insurance or guarantees.
The following table provides rollforwards of the cumu-lative amounts related to the Company’s credit loss portionof the OTTI losses on fixed maturity securities for whichthe non-credit portion of the loss is included in other com-prehensive income.
YEARS ENDED DECEMBER 31 2013 2012 2011
(in millions)
Credit losses as of the beginning of the year $ 8.6 $ 14.5 $ 16.7
Credit losses for which an OTTI was not previously recognized 1.1 0.6 —
Additional credit losses on securities for which an OTTI was previously recognized 0.3 0.6 0.9
Reductions for securities sold, matured or called (2.2) (6.9) (1.8)
Reductions for securities reclassified as intend to sell — (0.2) (1.3)
Credit losses as of the end of the year $ 7.8 $ 8.6 $ 14.5
The proceeds from sales of available-for-sale securitiesand the gross realized gains and gross realized losses onthose sales, were as follows:
YEARS ENDED DECEMBER 31
(in millions)Proceeds Gross Gross
2013 from Sales Gains Losses
Fixed maturities $ 450.4 $ 6.0 $ 4.0Equity securities $ 193.5 $ 31.2 $ 0.4
2012
Fixed maturities $ 616.3 $ 12.1 $ 2.0Equity securities $ 141.3 $ 17.5 $ 0.7
2011
Fixed maturities $ 678.1 $ 20.0 $ 1.1Equity securities $ 86.6 $ 3.0 $ 0.5
5. FAIR VALUE
Fair value is defined as the price that would be received tosell an asset or paid to transfer a liability, i.e., exit price, inan orderly transaction between market participants. TheCompany emphasizes the use of observable market datawhenever available in determining fair value. Fair valuespresented for certain financial instruments are estimateswhich, in many cases, may differ significantly from theamounts that could be realized upon immediate liquida-tion. A hierarchy of the three broad levels of fair value areas follows, with the highest priority given to Level 1 asthese are the most observable, and the lowest priority givento Level 3:Level 1 – Unadjusted quoted prices in active markets foridentical assets or liabilities.

THE HANOVER INSURANCE GROUP 2013 ANNUAL REPORT | 103
Level 2 – Quoted prices for similar assets or liabilities inactive markets, quoted prices for identical or similarassets or liabilities in markets that are not active, orother inputs that are observable or can be corroboratedby observable market data, including model-derived valuations.
Level 3 – Unobservable inputs that are supported by littleor no market activity.
When more than one level of input is used to determinefair value, the financial instrument is classified as Level 2or 3 according to the lowest level input that has a signifi-cant impact on the fair value measurement.The following methods and assumptions were used to
estimate the fair value of each class of financial instru-ments and have not changed since last year.
CASH AND CASH EQUIVALENTS
The carrying amount approximates fair value. Cash equiv-alents primarily consist of money market instruments,which are generally valued using unadjusted quoted pricesin active markets that are accessible for identical assetsand are classified as Level 1.
FIXED MATURITIES
Level 1 securities generally include U.S. Treasury issuesand other securities that are highly liquid and for whichquoted market prices are available. Level 2 securities arevalued using pricing for similar securities and pricing mod-els that incorporate observable inputs including, but notlimited to yield curves and issuer spreads. Level 3 securi-ties include issues for which little observable data can beobtained, primarily due to the illiquid nature of the securi-ties, and for which significant inputs used to determinefair value are based on the Company’s own assumptions.Non-binding broker quotes are also included in Level 3.The Company utilizes a third party pricing service for
the valuation of the majority of its fixed maturity securitiesand receives one quote per security. When quoted marketprices in an active market are available, they are providedby the pricing service as the fair value and such values areclassified as Level 1. Since fixed maturities other than U.S.Treasury securities generally do not trade on a daily basis,the pricing service prepares estimates of fair value forthose securities using pricing applications based on a mar-ket approach. Inputs into the fair value pricing common toall asset classes include: benchmark U.S. Treasury securi-ty yield curves; reported trades of identical or similar fixedmaturity securities; broker/dealer quotes of identical orsimilar fixed maturity securities and structural characteris-tics such as maturity date, coupon, mandatory principalpayment dates, frequency of interest and principal pay-ments, and optional redemption features. Inputs into thefair value applications that are unique by asset classinclude, but are not limited to:
• U.S. government agencies – determination of directversus indirect government support and whether anycontingencies exist with respect to the timely pay-ment of principal and interest.
• Foreign government – estimates of appropriate mar-ket spread versus underlying related sovereign treas-ury curve(s) dependent on liquidity and direct or con-tingent support.
• Municipals – overall credit quality, including assess-ments of the level and variability of: sources of pay-ment such as income, sales or property taxes, levies oruser fees; credit support such as insurance; state orlocal economic and political base; natural resourceavailability; and susceptibility to natural or man-madecatastrophic events such as hurricanes, earthquakesor acts of terrorism.
• Corporate fixed maturities – overall credit quality,including assessments of the level and variability of:economic sensitivity; liquidity; corporate financialpolicies; management quality; regulatory environ-ment; competitive position; ownership; restrictivecovenants; and security or collateral.
• Residential mortgage-backed securities – estimates ofprepayment speeds based upon: historical prepay-ment rate trends; underlying collateral interest rates;geographic concentration; vintage year; borrowercredit quality characteristics; interest rate and yieldcurve forecasts; government or monetary authoritysupport programs; tax policies; delinquency/defaulttrends; and, in the case of non-agency collateralizedmortgage obligations, severity of loss upon defaultand length of time to recover proceeds followingdefault.
• Commercial mortgage-backed securities – overallcredit quality, including assessments of the value andsupply/demand characteristics of: collateral type suchas office, retail, residential, lodging, or other; geo-graphic concentration by region, state, metropolitanstatistical area and locale; vintage year; historical col-lateral performance including defeasance, delinquen-cy, default and special servicer trends; and capitalstructure support features.
• Asset-backed securities – overall credit quality,including assessments of the underlying collateraltype such as credit card receivables, auto loan receiv-ables and equipment lease receivables; geographicdiversification; vintage year; historical collateral per-formance including delinquency, default and casualtytrends; economic conditions influencing use ratesand resale values; and contract structural supportfeatures.

| THE HANOVER INSURANCE GROUP 2013 ANNUAL REPORT104
Generally, all prices provided by the pricing service,except actively traded securities with quoted market prices,are reported as Level 2.The Company holds privately placed fixed maturity
securities and certain other fixed maturity securities thatdo not have an active market and for which the pricingservice cannot provide fair values. The Company deter-mines fair values for these securities using either matrixpricing utilizing the market approach or broker quotes.The Company will use observable market data as inputsinto the fair value applications, as discussed in the deter-mination of Level 2 fair values, to the extent it is available,but is also required to use a certain amount of unobserv-able judgment due to the illiquid nature of the securitiesinvolved. Unobservable judgment reflected in theCompany’s matrix model accounts for estimates of addi-tional spread required by market participants for factorssuch as issue size, structural complexity, high bondcoupon, long maturity term or other unique features.These matrix-priced securities are reported as Level 2 orLevel 3, depending on the significance of the impact ofunobservable judgment on the security’s value.Additionally, the Company may obtain non-binding brokerquotes which are reported as Level 3.
EQUITY SECURITIES
Level 1 consists of publicly traded securities, includingexchange traded funds, valued at quoted market prices.Level 2 includes securities that are valued using pricing forsimilar securities and pricing models that incorporateobservable inputs. Level 2 also includes fair valuesobtained from net asset values provided by mutual fundinvestment managers, upon which subscriptions andredemptions can be executed. Level 3 consists of commonor preferred stock of private companies for which observ-able inputs are not available. Non-binding broker quotesare also included in Level 3.
The Company utilizes a third party pricing service forthe valuation of the majority of its equity securities andreceives one quote for each equity security. When quotedmarket prices in an active market are available, they areprovided by the pricing service as the fair value and suchvalues are classified as Level 1. Generally, all prices provid-ed by the pricing service, except quoted market prices, arereported as Level 2. The Company holds certain equitysecurities that have been issued by privately-held entitiesthat do not have an active market and for which the pric-ing service cannot provide fair values. Generally, theCompany estimates fair value for these securities based onthe issuer’s book value and market multiples. These secu-rities are reported as Level 3 as market multiples representsignificant unobservable inputs.
OTHER INVESTMENTS
Other investments consist primarily of overseas trustfunds, for which fair values are provided by the investmentmanager based on quoted prices for similar instruments inactive markets and are reported as Level 2. Also includedin other investments are cost basis limited partnershipsand mortgage loans. Cost basis limited partnerships’ fairvalues are based on the net asset value provided by thegeneral partner and recent financial information and arereported as Level 3. Mortgage loans’ fair values are esti-mated by discounting the future contractual cash flowsusing the current rates at which similar loans would bemade to borrowers with similar credit ratings and arereported as Level 2.
DEBT
The fair value of debt is estimated based on quoted marketprices. If a quoted market price is not available, fair valuesare estimated using discounted cash flows that are basedon current interest rates and yield curves for debtissuances with maturities and credit risks consistent withthe debt being valued. Debt is reported as Level 2.
The estimated fair value of the financial instruments were as follows:
DECEMBER 31 2013 2012
(in millions)Carrying Fair Carrying Fair
Value Value Value Value
Financial AssetsCash and cash equivalents $ 486.2 $ 486.2 $ 564.8 $ 564.8Fixed maturities 6,970.6 6,970.6 6,952.2 6,952.2Equity securities 430.2 430.2 315.8 315.8Other investments 173.1 173.7 188.9 189.4
Total financial assets $8,060.1 $8,060.7 $ 8,021.7 $ 8,022.2
Financial LiabilitiesDebt $ 903.9 $ 961.7 $ 849.4 $ 995.2

THE HANOVER INSURANCE GROUP 2013 ANNUAL REPORT | 105
The Company has processes designed to ensure that thevalues received from its third party pricing service areaccurately recorded, that the data inputs and valuationtechniques utilized are appropriate and consistentlyapplied and that the assumptions are reasonable and con-sistent with the objective of determining fair value. TheCompany performs a review of the fair value hierarchyclassifications and of prices received from its pricing serv-ice on a quarterly basis. The Company reviews the pricingservices’ policies describing its methodology, processes,practices and inputs, including various financial modelsused to value securities. Also, the Company reviews theportfolio pricing, including securities with changes inprices that exceed a defined threshold are verified to inde-pendent sources, if available. If upon review, the Companyis not satisfied with the validity of a given price, a pricingchallenge would be submitted to the pricing service alongwith supporting documentation for its review. TheCompany does not adjust quotes or prices obtained fromthe pricing service unless the pricing service agrees withthe Company’s challenge. During 2013 and 2012, the
Company did not adjust any prices received from brokersor its pricing service.Changes in the observability of valuation inputs may
result in a reclassification of certain financial assets or lia-bilities within the fair value hierarchy. Reclassificationsbetween levels of the fair value hierarchy are reported as ofthe beginning of the period in which the reclassificationoccurs. As previously discussed, the Company utilizes athird party pricing service for the valuation of the majorityof its fixed maturities and equity securities. The pricingservice has indicated that it will only produce an estimateof fair value if there is objectively verifiable information toproduce a valuation. If the pricing service discontinuespricing an investment, the Company will use observablemarket data to the extent it is available, but may also berequired to make assumptions for market based inputs thatare unavailable due to market conditions.The following tables provide, for each hierarchy level,
the Company’s assets that were measured at fair value ona recurring basis.
DECEMBER 31, 2013
(in millions)Total Level 1 Level 2 Level 3
Fixed maturities:U.S. Treasury and government agencies $ 406.6 $ 167.2 $ 239.4 $ —Foreign government 305.0 45.6 259.4 —Municipal 1,126.3 — 1,100.7 25.6Corporate 3,824.2 — 3,811.2 13.0Residential mortgage-backed, U.S. agency backed 573.2 — 573.2 —Residential mortgage-backed, non-agency 155.6 — 155.1 0.5Commercial mortgage-backed 411.6 — 388.7 22.9Asset-backed 168.1 — 168.1 —
Total fixed maturities 6,970.6 212.8 6,695.8 62.0Equity securities 420.9 382.3 — 38.6Other investments 153.2 — 149.6 3.6
Total investment assets at fair value $7,544.7 $ 595.1 $6,845.4 $ 104.2
DECEMBER 31, 2012
(in millions)Total Level 1 Level 2 Level 3
Fixed maturities:U.S. Treasury and government agencies $ 325.6 $ 144.2 $ 181.4 $ —Foreign government 352.9 60.9 292.0 —Municipal 1,096.3 — 1,076.9 19.4Corporate 3,773.4 — 3,747.0 26.4Residential mortgage-backed, U.S. agency backed 610.8 — 610.8 —Residential mortgage-backed, non-agency 194.4 — 193.7 0.7Commercial mortgage-backed 396.2 — 369.5 26.7Asset-backed 202.6 — 201.1 1.5
Total fixed maturities 6,952.2 205.1 6,672.4 74.7Equity securities 306.1 226.9 54.8 24.4Other investments 172.8 — 169.2 3.6
Total investment assets at fair value $ 7,431.1 $ 432.0 $ 6,896.4 $ 102.7

| THE HANOVER INSURANCE GROUP 2013 ANNUAL REPORT106
The following tables provide, for each hierarchy level, the Company’s estimated fair values of financial instrumentsthat were not carried at fair value.
DECEMBER 31, 2013
(in millions)Total Level 1 Level 2 Level 3
Assets:Cash and cash equivalents $ 486.2 $ 486.2 $ — $ —Equity securities 9.3 — 9.3 —Other investments 20.5 — 2.7 17.8
Liabilities:Debt $ 961.7 $ — $ 961.7 $ —
DECEMBER 31, 2012
(in millions)Total Level 1 Level 2 Level 3
Assets:Cash and cash equivalents $ 564.8 $ 564.8 $ — $ —Equity securities 9.7 — 9.7 —Other investments 16.6 — 4.8 11.8
Liabilities:Debt $ 995.2 $ — $ 995.2 $ —
The following tables provide a reconciliation for all assets measured at fair value on a recurring basis using signifi-cant unobservable inputs (Level 3).
YEAR ENDED DECEMBER 31, 2013
(in millions)Fixed Maturities
Residentialmortgage- Commercialbacked, mortgage- Asset- Equity
Municipal Corporate non-agency backed backed Total and Other Total Assets
Balance at beginning of year $ 19.4 $ 26.4 $ 0.7 $ 26.7 $ 1.5 $ 74.7 $ 28.0 $102.7Transfers into Level 3 9.7 0.2 — — — 9.9 — 9.9Transfers out of Level 3 — (2.2) — — (1.5) (3.7) (0.9) (4.6)Total gains (losses):
Included in earnings — 1.5 — — — 1.5 — 1.5Included in other comprehensive income
-net appreciation (depreciation) on available-for-sale securities (0.8) (1.6) — (1.3) — (3.7) 15.1 11.4
Sales (2.7) (11.3) (0.2) (2.5) — (16.7) — (16.7)
Balance at end of year $ 25.6 $ 13.0 $ 0.5 $ 22.9 $ — $ 62.0 $ 42.2 $104.2

THE HANOVER INSURANCE GROUP 2013 ANNUAL REPORT | 107
YEAR ENDED DECEMBER 31, 2012
(in millions)Fixed Maturities
Residentialmortgage- Commercialbacked, mortgage- Asset- Equity
Municipal Corporate non-agency backed backed Total and Other Total Assets
Balance at beginning of year $ 13.6 $ 23.8 $ 5.2 $ 23.7 $ 9.2 $ 75.5 $ 27.0 $ 102.5Transfers into Level 3 2.6 4.3 — — — 6.9 0.1 7.0Transfers out of Level 3 — (2.3) — — (8.7) (11.0) — (11.0)Total gains (losses):
Included in earnings — 0.4 — — — 0.4 (0.2) 0.2Included in other comprehensive income
-net appreciation (depreciation) onavailable-for-sale securities 1.1 0.7 0.1 (0.4) — 1.5 1.8 3.3
Purchases and sales:Purchases 3.0 1.5 0.1 5.2 1.5 11.3 — 11.3Sales (0.9) (2.0) (4.7) (1.8) (0.5) (9.9) (0.7) (10.6)
Balance at end of year $ 19.4 $ 26.4 $ 0.7 $ 26.7 $ 1.5 $ 74.7 $ 28.0 $ 102.7
During the years ended December 31, 2013 and 2012,the Company transferred fixed maturities between Level 2and Level 3 primarily as a result of assessing the signifi-cance of unobservable inputs on the fair value measure-ment. There were no transfers between Level 1 and Level2 during 2013 or 2012.The following table summarizes gains and losses due to
changes in fair value that are recorded in net income forLevel 3 assets.
YEARS ENDED DECEMBER 31 2013 2012
(in millions)Net realized investment
gains (losses)
Level 3 Assets:Fixed maturities:
Corporate $ 1.5 $ 0.4Equity securities — (0.2)
Total assets $ 1.5 $ 0.2
There were no Level 3 liabilities held by the Companyfor years ended December 31, 2013 and 2012.The following table provides quantitative information
about the significant unobservable inputs used by theCompany in the fair value measurements of Level 3 assets.Where discounted cash flows were used in the valuation offixed maturities, the internally-developed discount rate wasadjusted by the significant unobservable inputs shown inthe table. Valuations for securities based on broker quotesfor which there was a lack of transparency as to inputsused to develop the valuations have been excluded.

| THE HANOVER INSURANCE GROUP 2013 ANNUAL REPORT108
DECEMBER 31, 2013 2012
(in millions)Fair Range Fair Range
Valuation Technique Significant Unobservable Inputs Value (Wtd Average) Value (Wtd Average)
Fixed maturities:Municipal Discounted cash flow Discount for: $ 25.6 $ 19.4
Small issue size 1.0-4.0% (2.3%) 1.0-4.0% (3.1%)Above-market coupon 0.3-1.0% (0.5%) 0.3-1.0% (0.5%)Long maturity N/A 0.5% (0.5%)
Corporate Discounted cash flow Discount for: 12.8 26.4Above-market coupon 0.3-0.8% (0.6%) 0.3-1.0% (0.7%)Small issue size 0.3-1.0% (0.5%) 0.3-3.0% (0.5%)Credit stress N/A 1.0-3.0% (1.1%)Long maturity N/A 0.5% (0.5%)
Residential mortgage- Discounted cash flow Discount for: 0.5 0.7backed, non-agency Small issue size 0.5% (0.5%) 0.5% (0.5%)
Commercial mortgage- Discounted cash flow Discount for: 22.9 26.7backed Above-market coupon 0.5-0.8% (0.6%) 0.3-0.8% (0.4%)
Credit stress 0.5% (0.5%) 1.0% (1.0%)Small issue size 0.5% (0.5%) 0.5% (0.5%)Lease structure 0.3% (0.3%) 0.3% (0.3%)Long maturity N/A 0.5-0.8% (0.7%)
Asset backed Discounted cash flow Discount for: — 1.5Small issue size N/A 0.7-2.0% (1.6%)
Equity securities Market comparables Net tangible asset 38.5 24.3market multiples 1.3X (1.3X) 0.9X (0.9X)
Other Discounted cash flow Discount rate 3.6 18.0% (18.0%) 3.6 18.0% (18.0%)
Significant increases (decreases) in any of the aboveinputs in isolation would result in a significantly lower(higher) fair value measurement. There were no interrela-tionships between these inputs which might magnify ormitigate the effect of changes in unobservable inputs onthe fair value measurement.
6. DEBT AND CREDIT ARRANGEMENTS
Debt consists of the following:
DECEMBER 31 2013 2012
(in millions)
Senior debentures maturing June 15, 2021 $300.0 $300.0Senior debentures maturing March 1, 2020 165.1 200.0Senior debentures maturing October 15, 2025 81.2 120.9Subordinated debentures maturing
March 30, 2053 175.0 —Subordinated debentures maturing
February 3, 2027 59.7 59.7FHLBB borrowings (secured) 125.0 171.3
Total principal debt 906.0 851.9Unamortized debt discount (2.1) (2.5)
Total $903.9 $849.4
On March 20, 2013, the Company issued $175.0 mil-lion aggregate principal amount of 6.35% subordinatedunsecured debentures due March 30, 2053. These deben-tures pay interest quarterly. The Company may redeemthese debentures in whole at any time, or in part from timeto time, on or after March 30, 2018, at a redemption priceequal to their principal amount plus accrued and unpaidinterest.On June 17, 2011, the Company issued $300.0 million
aggregate principal amount of 6.375% senior unsecureddebentures due June 15, 2021. Additionally, on February23, 2010, the Company issued $200.0 million aggregateprincipal amount of 7.50% senior unsecured debenturesdue March 1, 2020. The Company also issued 7.625% sen-ior unsecured debentures with a par value of $200.0 mil-lion on October 16, 1995. As of December 31, 2013 and2012, the remaining 7.625% senior debentures have a parvalue of $81.2 million and $120.9 million, respectively,and mature on October 15, 2025. All of the Company’ssenior debentures are subject to certain restrictivecovenants, including limitations on the issuance or dispo-sition of stock of restricted subsidiaries and limitations onliens. These debentures pay interest semi-annually. Inaddition, the Company’s subordinated debentures matur-ing February 3, 2027 have a par value of $59.7 million as

THE HANOVER INSURANCE GROUP 2013 ANNUAL REPORT | 109
of December 31, 2013 and 2012 and pay cumulative divi-dends semi-annually at 8.207%.In 2013, the Company repurchased senior debentures
maturing October 15, 2025, with a net carrying value of$39.2 million at a cost of $50.5 million, resulting in a lossof $11.3 million. Also in 2013, the Company repurchasedsenior debentures maturing March 1, 2020, with a net car-rying value of $34.6 million at a cost of $43.2 million,resulting in a loss of $8.6 million.In 2009, Hanover Insurance received a $125.0 million
FHLBB advance through its membership in the FHLBB.This collateralized advance bears interest at a fixed rate of5.50% per annum over a twenty-year term. In July 2010,Hanover Insurance committed to an additional $46.3 mil-lion of FHLBB advances. These advances were drawn inseveral increments from July 2010 to January 2012 andcarried fixed interest rates with a weighted average of3.88%. In January 2013, Hanover Insurance repaid the$46.3 million of FHLBB advances plus prepayment fees of$7.8 million for a total payment of $54.1 million. Theseadvances would have matured on July 30, 2020.As collateral to FHLBB, Hanover Insurance pledged
government agency securities with a fair value of $148.1million and $200.8 million, for the aggregate borrowings of$125.0 million and $171.3 million as of December 31,2013 and December 31, 2012, respectively. The amount ofrequired collateral decreased in conjunction with therepayment of the $46.3 million of FHLBB advances. Thefair value of the collateral pledged must be maintained atcertain specified levels of the borrowed amount, which canvary depending on the type of assets pledged. If the fairvalue of this collateral declines below these specified lev-els, Hanover Insurance would be required to pledge addi-tional collateral or repay outstanding borrowings. HanoverInsurance is permitted to voluntarily repay the outstandingborrowings at any time, subject to a repayment fee. As arequirement of membership in the FHLBB, HanoverInsurance maintains a certain level of investment inFHLBB stock. Total holdings of FHLBB stock were $9.3million and $9.7 million at December 31, 2013 and 2012,respectively.On July 1, 2011, the Company acquired all of the out-
standing shares of Chaucer. As part of this acquisition,€12.0 million aggregate principal amount of floating ratesubordinated unsecured notes due November 16, 2034were assumed. These notes paid interest semi-annuallybased on the European Inter bank offer rate (Euribor) plus3.75%. Additionally, the Company also assumed $50.0 mil-lion aggregate principal amount of floating rate subordi-nated unsecured notes due September 21, 2036. Thesenotes paid interest quarterly based on the three-monthLIBOR plus 3.1%. During 2012, the Company called thesesubordinated unsecured notes at par value. These noteshad a carrying value of $60.3 million resulting in a net losson the repurchases of $5.1 million.
At December 31, 2013, the Company had a $200.0 mil-lion credit agreement which expires in November 2018.The Company had no borrowings under this agreement.Additionally, the Company had a Standby Letter of CreditFacility not to exceed £130.0 million (or $215.8 millionbased on the foreign currency exchange rate of 1.66 atDecember 31, 2013). This Letter of Credit Facility pro-vides regulatory capital supporting Chaucer’s underwritingactivities for the 2014 and 2015 years of account and eachprior open year of account. Simultaneous with this agree-ment, THG entered into a Guaranty Agreement withLloyds Bank plc, as Facility Agent and Security Agent, pur-suant to which, THG unconditionally guarantees the obli-gations of Chaucer under the Letter of Credit Facility.Interest expense was $65.3 million, $61.9 million, and
$55.0 million in 2013, 2012 and 2011, respectively. AtDecember 31, 2013, the Company was in compliance withthe covenants associated with all of its debt indentures andcredit arrangements.
7 . INCOME TAXES
Provisions for income taxes have been calculated in accor-dance with the provisions of ASC 740. A summary of thecomponents of income before income taxes and income taxexpense (benefit) in the Consolidated Statements ofIncome are shown below:
YEARS ENDED DECEMBER 31 2013 2012 2011
(in millions)
Income (loss) before income taxes:U.S. $ 183.5 $ (99.1) $ (13.3)Non-U.S. 145.6 127.8 34.9
$ 329.1 $ 28.7 $ 21.6
Income tax expense (benefit) includes the followingcomponents:
YEARS ENDED DECEMBER 31 2013 2012 2011
(in millions)
Current:U.S. $ 8.0 $ 2.3 $ (0.6)Non-U.S. 0.6 16.1 —
Total current 8.6 18.4 (0.6)
Deferred:U.S. 52.9 (42.7) (20.3)Non-U.S. 21.9 6.9 11.0
Total deferred 74.8 (35.8) (9.3)
Total income tax expense (benefit) $ 83.4 $ (17.4) $ (9.9)
The income tax expense attributable to the consolidatedresults of continuing operations is different from theamount determined by multiplying income from continu-

| THE HANOVER INSURANCE GROUP 2013 ANNUAL REPORT110
ing operations before income taxes by the U.S. statutoryfederal income tax rate of 35%. The sources of the differ-ence and the tax effects of each were as follows:
YEARS ENDED DECEMBER 31 2013 2012 2011
(in millions)
Expected income tax expense $115.2 $ 10.0 $ 7.5Tax difference related to investment
disposals and maturities (17.5) (14.3) (9.7)Effect of foreign operations (10.8) (3.5) (1.5)Dividend received deduction (2.5) (2.8) (1.1)Tax-exempt interest (1.7) (1.5) (2.0)Nondeductible expenses 1.1 2.8 4.7Change in foreign tax rate (0.7) (0.4) —Change in valuation allowance — (7.7) (7.5)Other, net 0.3 — (0.3)
Income tax expense (benefit) $ 83.4 $ (17.4) $ (9.9)
Effective tax rate 25.3% (60.6)% (45.8)%
The following are the components of the Company’sdeferred tax assets and liabilities (excluding those associat-ed with its discontinued operations).
DECEMBER 31 2013 2012
(in millions)
Deferred tax assets:Loss, LAE and unearned premium
reserves, net $185.0 $ 190.6Tax credit carryforwards 123.1 126.8Operating loss carryforwards 64.5 75.1Employee benefit plans 38.2 56.4Deferred Lloyd’s underwriting losses — 13.5Other 74.9 60.7
485.7 523.1
Less: Valuation allowance 2.9 —
482.8 523.1
Deferred tax liabilities:Deferred acquisition costs 123.5 115.8Software capitalization 30.1 31.4Deferred Lloyd’s underwriting income 13.8 -Investments, net 8.4 43.3Deferred foreign sourced income 5.1 8.0Other 62.2 57.0
243.1 255.5
Net deferred tax asset $239.7 $ 267.6
Deferred tax assets are reduced by a valuation allowanceif it is more likely than not that all or some portion of thedeferred tax assets will not be realized.Included in the Company’s deferred tax asset as of
December 31, 2013 are assets of $42.1 million related toU.S. net operating loss carryforwards and a deferred taxasset of $22.4 million related to foreign net operating carry -
forwards. The pre-tax U.S. operating loss carryforwards of$120.3 million will expire beginning in 2031. The pre-taxforeign operating loss carryforwards of $66.2 million weregenerated in the U.K. and have no expiration date. It is theCompany’s opinion that there will be sufficient future U.S.and U.K. taxable income to utilize these loss carryforwards.The Company’s estimate of the gross amount and likelyrealization of loss carryforwards may change over time.Included in the Company’s deferred tax asset as of
December 31, 2013 are assets of $110.3 million related toalternative minimum tax credit carryforwards and $12.8million related to foreign tax credit carryforwards. Thealternative minimum tax credit carryforwards have no expi-ration date and the foreign tax credit carryforwards willexpire beginning in 2022. The Company may utilize thecredits to offset regular federal income taxes due fromfuture income, and although the Company believes thatthese assets are fully recoverable, there can be no certain-ty that future events will not affect their recoverability. TheCompany believes, based on objective evidence, it is morelikely than not that the remaining deferred tax assets willbe realized.During 2013, the Company recorded a valuation
allowance of $2.9 million related to its deferred tax asseton the unrealized depreciation in its investment portfolio.It is the Company’s opinion that it is more likely than notthat this asset will not be realized and accordingly, theCompany recorded this valuation allowance as an adjust-ment to other comprehensive income.In prior years, the Company completed several transac-
tions which resulted in the realization, for tax purposesonly, of unrealized gains in its investment portfolio. TheCompany realized $69.6 million and $98.4 million, respec-tively, in 2012 and 2011 as a result of such transactions.These transactions enabled the Company to realize capitalloss carryforwards to offset these gains, and resulted in therelease of the valuation allowance the Company heldagainst the deferred tax asset related to these capital losscarryforwards. In 2012, the Company released $24.4 mil-lion of its valuation allowance which was recorded as abenefit in accumulated other comprehensive income. In2011, the Company released $29.0 million of its valuationallowance which $0.2 million was reflected in income fromcontinuing operations and the remaining $28.8 millionwas reflected as a benefit in accumulated other compre-hensive income. During 2013, 2012 and 2011, theCompany recognized in income from continuing opera-tions, related to non-operating income, $17.5 million,$14.3 million and $9.7 million, respectively. The remain-ing amount of $107.7 million in accumulated other com-prehensive income will be released into income fromcontinuing operations in future years, as the investment

THE HANOVER INSURANCE GROUP 2013 ANNUAL REPORT | 111
securities subject to these transactions are sold or mature.During 2012, the Company released $35.9 million of itsvaluation allowance related to its deferred tax asset held atthe beginning of the year. The release of this valuationallowance resulted from the aforementioned transactionwhich utilized capital loss carryforwards, unrealized appre-ciation in its investment portfolio, and net realized capitalgains in its Consolidated Statements of Income.Accordingly, the Company recorded decreases in its valua-tion allowance of $25.3 million as an adjustment to accu-mulated other comprehensive income, $7.7 million as anadjustment to income tax expense from continuing opera-tions, and $2.9 million in discontinued operations.During 2011, the Company reduced its valuation
allowance, for both continuing and discontinued opera-tions, related to its deferred tax asset by $55.6 million,from $91.5 million to $35.9 million. There were four prin-cipal components to this reduction. First, the Companydecreased its valuation allowance by $29.0 million as aresult of the aforementioned transaction, which utilizedthe capital loss carryforwards. Second, the Companydecreased its valuation allowance by $21.9 million on cer-tain unrealized losses as a result of unrealized appreciationin its investment portfolio. This decrease was reflected asan increase in accumulated other comprehensive income.Third, as a result of $28.1 million in net realized gains dur-ing 2011, the Company decreased its valuation allowanceby $7.5 million as an increase to income from continuingoperations, since these gains utilized the Company’s capi-tal loss carryforwards. Fourth, in the 2010 U.S. federalincome tax return the Company was able to utilize an addi-tional $7.6 million of capital loss carryforward that expiredin 2010. As such, the valuation allowance was increased by$2.6 million with an equal and offsetting increase to therelated deferred tax asset. The remaining increase of $0.2million was attributable to other items reflected as anexpense from discontinued operations.Although most of the Company’s non – U.S. income is
subject to U.S. federal income tax, certain of its non-U.S.income is not subject to U.S. federal income tax until repa-triated. Foreign taxes on this non – U.S. income areaccrued at the local foreign tax rate, as opposed to thehigher U.S. statutory tax rate, since these earnings cur-rently are expected to be indefinitely reinvested overseas.This assumption could change, as a result of a sale of thesubsidiaries, the receipt of dividends from the subsidiaries,a change in management’s intentions, or as a result of var-ious other events. The Company has not made a provisionfor U.S. taxes on $20.3 million, $10.0 million and $4.2million of non-U.S. income for 2013, 2012 and 2011,respectively. However, in the future, if such earnings weredistributed to the Company, taxes of $13.0 million wouldbe payable on such undistributed earnings and would be
reflected in the tax provision for the year in which theseearnings are no longer intended to be indefinitely reinvest-ed overseas, assuming all foreign tax credits are realized.The table below provides a reconciliation of the begin -
ning and ending liability for uncertain tax position asfollows:
YEARS ENDED DECEMBER 31 2013 2012 2011
(in millions)
Liability at beginning and end of year, net $ 0.8 $ 0.8 $ 0.8
Additions for tax positions of prior years 5.4 — —
Deferred deductions (4.8) — —
Liability at end of year, net $ 1.4 $ 0.8 $ 0.8
The IRS audits of the years 2007 and 2008 commencedin April 2010. In 2011, the Company received a RevenueAgent Report for the 2007 and 2008 IRS audit. TheCompany agreed to all proposed adjustments other thanthe disallowance of deduction for certain loss reserves, forwhich it filed a formal protest. In December 2013, theCompany reached a tentative settlement on the disal-lowance of deduction for certain loss reserves and as aresult a liability for uncertain tax positions was establishedfor $4.8 million, with an offsetting deferred tax asset. TheCompany expects to reach a final settlement of this issueduring 2014.The ultimate deductibility of the aforementioned $4.8
million payable is highly certain, but there is uncertaintyabout the timing of such deductibility. Because of theimpact of deferred tax accounting, other than interest andpenalties, a change in the timing of deductions would notimpact the annual effective tax rate. There are no tax posi-tions at December 31, 2012 and 2011 for which the ulti-mate deductibility is highly certain, but for which there isuncertainty about the timing of such deductibility.The Company recognizes interest and penalties related
to unrecognized tax benefits in federal income tax expense.The Company had accrued interest of $1.2 million and$0.4 million as of December 31, 2013 and 2012, respec-tively. The Company has not recognized any penalties asso-ciated with unrecognized tax benefits.The Company or its subsidiaries files income tax returns
in the U.S. federal jurisdiction and various state jurisdic-tions, as well as foreign jurisdictions. With few exceptions,the Company and its subsidiaries are no longer subject toU.S. federal income tax examinations by tax authorities foryears before 2007. The IRS audits of the years 2009 and2010 commenced in June 2012. The Company and its sub-sidiaries are still subject to U.S. state income tax examina-tions by tax authorities for years after 2006 and foreignexaminations for years after 2010.
| THE HANOVER INSURANCE GROUP 2013 ANNUAL REPORT112
8. PENSION PLANS
DEFINED BENEFIT PLANS
The Company recognizes the funded status of its definedbenefit plans in its Consolidated Balance Sheets. Thefunded status is measured as the difference between thefair value of plan assets and the projected benefit obliga-tion of the Company’s defined benefit plans. The Companyis required to aggregate separately all overfunded plansfrom all underfunded plans.
U.S. Defined Benefit Plans
Prior to 2005, THG provided retirement benefits to sub-stantially all of its employees under defined benefit pen-sion plans. These plans were based on a defined benefitcash balance formula, whereby the Company annually pro-vided an allocation to each covered employee based on apercentage of that employee’s eligible salary, similar to adefined contribution plan arrangement. In addition to thecash balance allocation, certain transition group employ-ees who had met specified age and service requirements asof December 31, 1994 were eligible for a grandfatheredbenefit based primarily on the employees’ years of serviceand compensation during their highest five consecutiveplan years of employment. The Company’s policy for theplans is to fund at least the minimum amount required bythe Employee Retirement Income Security Act of 1974(“ERISA”).As of January 1, 2005, the defined benefit pension plans
were frozen and since that date, no further cash balanceallocations have been credited to participants. Participants’accounts are credited with interest daily, based upon theGeneral Agreement of Trades and Tariffs. In addition, thegrandfathered benefits for the transition group were alsofrozen at January 1, 2005 levels with an annual transitionpension adjustment calculated at an interest rate equal to5% per year up to 35 years of completed service, and 3%thereafter. As of December 31, 2013, based on currentestimates of plan liabilities and other assumptions, theprojected benefit obligation of the qualified defined benefit pension plans exceeds plan assets by approximately$7 million.
Chaucer Pension Plan
Prior to 2002, the Chaucer segment provided defined ben-efit pension retirement benefits to certain of its employees.As of December 31, 2001, the defined benefit pensionplan was closed to new members. The defined benefit obli-gation for this plan is based on the employees’ years ofservice and final pensionable salary. Contributions aremade at least annually to this plan by both the Companyand by employees. As of December 31, 2013, based on cur-rent estimates of plan liabilities and other assumptions, theprojected benefit obligation of the qualified defined benefitpension plan exceeds plan assets by approximately $8 million.
AssumptionsIn order to measure the expense associated with theseplans, management must make various estimates andassumptions, including discount rates used to value liabil-ities, assumed rates of return on plan assets, employeeturnover rates and anticipated mortality rates, for example.The estimates used by management are based on theCompany’s historical experience, as well as current factsand circumstances. In addition, the Company uses outsideactuaries to assist in measuring the expense and liabilityassociated with these plans.The Company measures the funded status of its plans as
of the date of its year-end statement of financial position.The Company utilizes a measurement date of December31st to determine its benefit obligations, consistent withthe date of its Consolidated Balance Sheets.Weighted-average assumptions used to determine pen-
sion benefit obligations are as follows:
DECEMBER 31 2013 2012 2011
U.S.:Discount rate—qualified plan 5.00% 4.25% 5.13%Discount rate—non-qualified plan 5.00% 4.13% 5.00%Cash balance interest crediting rate 3.50% 3.50% 4.00%
Chaucer:Discount rate 4.50% 4.80% 4.90%Rate of increase in future compensation 3.15% 4.20% 4.30%
The Company utilizes a measurement date of January1st to determine its periodic pension costs. Weighted-aver-age assumptions used to determine net periodic pensioncosts for the defined benefit plans are as follows:
YEARS ENDED DECEMBER 31 2013 2012 2011
U.S.:Qualified plan
Discount rate 4.25% 5.13% 5.63%Expected return on plan assets 5.25% 6.00% 6.50%Cash balance interest crediting rate 3.50% 4.00% 4.50%
Non-qualified planDiscount rate 4.13% 5.00% 5.50%
Chaucer:Discount rate 4.80% 4.90% 5.50%Rate of increase in future compensation 4.20% 4.30% 4.60%Expected return on plan assets 6.70% 7.50% 7.40%
The expected rates of return were determined by usinghistorical mean returns for each asset class, adjusted forcertain factors believed to have an impact on futurereturns. Specifically, for the U.S. defined benefit plans,because the allocation of assets between fixed maturitiesand equities has changed over time, the historical meanreturns were adjusted downward slightly to reflect theplan’s asset mix. The adjusted mean returns were weighted
THE HANOVER INSURANCE GROUP 2013 ANNUAL REPORT | 113
to the plan’s expected target asset allocation at December31, 2013, resulting in an expected rate of return on planassets for 2013 of 5.25%. The Company reviews andupdates, at least annually, its expected return on planassets based on changes in the actual assets held by theplans.
Plan AssetsU.S. Qualified Defined Benefit Plans
The Company utilizes a target allocation strategy, whichfocuses on creating a mix of assets that will generate mod-est growth from equity securities while minimizing volatil-ity in the Company’s earnings from changes in the marketsand economic environment. Various factors are taken intoconsideration in determining the appropriate asset mix,such as census data, actuarial valuation information andcapital market assumptions. During 2013 and 2012, theplan assets were invested 84% in fixed income securitiesand 16% in equity securities. The Company reviews andupdates, at least annually, the target allocation and makeschanges periodically.
The following table provides 2013 target allocations andactual invested asset allocations for 2013 and 2012.
2013TARGET
DECEMBER 31 LEVELS 2013 2012
Fixed income securities:Fixed maturities 83% 83% 83%Money market funds 2 1 1
Total fixed income securities 85 84 84
Equity securities:Domestic 11 12 10International 4 4 3THG common stock — — 3
Total equity securities 15 16 16
Total plan assets 100% 100% 100%
The following tables present for each hierarchy level theU.S. qualified defined benefit plan’s investment assets thatare measured at fair value at December 31, and 2012.(Refer to Note 5 – “Fair Value” for a description of the dif-ferent levels in the Fair Value Hierarchy).
DECEMBER 31 2013 2012
(in millions)Total Level 1 Level 2 Level 3 Total Level 1 Level 2 Level 3
Fixed income securities:Fixed maturities $ 449.6 $ 2.1 $ 447.5 $ — $ 491.4 $ 3.3 $ 488.1 $ —Money market funds 5.3 5.3 — — 5.0 5.0 — —
Total fixed income securities 454.9 7.4 447.5 — 496.4 8.3 488.1 —
Equity securities:Domestic 67.8 0.2 67.6 — 58.3 0.4 57.9 —International 19.3 0.1 19.2 — 18.8 0.1 18.7 —THG common stock — — — — 18.1 18.1 — —
Total equity securities 87.1 0.3 86.8 — 95.2 18.6 76.6 —
Total investments at fair value $ 542.0 $ 7.7 $ 534.3 $ — $ 591.6 $ 26.9 $ 564.7 $ —
Fixed Income Securities
Securities classified as Level 1 at December 31, 2013 and2012 include actively traded mutual funds and publiclytraded securities, which are valued at quoted marketprices. Securities classified as Level 2 at December 31,2013 and 2012 include a separate investment account,which is invested entirely in the Vanguard Total BondMarket Index Fund, a mutual fund that in turn invests ininvestment grade fixed maturities, as well as commingledpools and investment grade fixed income securities that areheld in a custom fund. The fair value of each of the Level2 investments is determined daily as the Net Asset Value(“NAV”) based on the value of the underlying investments,which is determined independently by the investment
manager. The daily NAV, which is not published as a quot-ed market price for these investments, is used as the basisfor transactions. Redemption of these funds is not subjectto restriction.
Equity Securities
Securities classified as Level 1 at December 31, 2013 and2012 include actively traded mutual funds that are pub-licly traded and which primarily invest in equity securitiesthat are valued at quoted market prices. Additionally, Level1 securities at December 31, 2012 include 466,755 sharesof THG common stock held by the plan, which were val-ued at quoted market prices. The plan held no shares ofTHG common stock at December 31, 2013. Securities

| THE HANOVER INSURANCE GROUP 2013 ANNUAL REPORT114
classified as Level 2 include investments in commingledpools that primarily invest in publicly traded commonstocks and international equity securities. The fair value ofeach of the Level 2 investments is determined daily as theNAV based on the value of the underlying investments,which is determined independently by the investmentmanager. The daily NAV, which is not published as a quot-ed market price for these investments, is used as the basisfor transactions. Redemption of these funds is not subjectto restriction.
Chaucer Pension Plan
The investment strategy of the Chaucer defined benefitpension plan is to invest primarily in growth assets in theform of equity funds which are expected to provide a posi-tive return that exceeds inflation over the longer term inorder to protect the existing and future liabilities of thepension plan. In order to reduce volatility and diversify theportfolio, the target allocation includes an exposure to cor-porate bond and commercial property funds. In 2013, theCompany modified its investment allocation strategy andbegan shifting assets from equity securities into fixedmaturities. The Company will continue shifting assetsuntil it reaches its current ultimate target level of 60%equities, 30% fixed maturities and 10% real estate funds.
This allocation plan will be reviewed annually and targetallocation changes will be made as appropriate. The fol-lowing table provides 2013 target allocations and actualinvested asset allocations for 2013 and 2012.
2013TARGET
DECEMBER 31 LEVELS 2013 2012
Fixed income securities:Fixed maturities 20% 19% 14%
Equity securities:Domestic (United Kingdom) 25 26 33International 45 48 44
Total equity securities 70 74 77
Real estate funds 10 7 9
Total plan assets 100% 100% 100%
Included in total plan assets of $120.2 million atDecember 31, 2013 were $119.9 million of invested assetscarried at fair value and $0.3 million of cash and equiva-lents. Total plan assets at December 31, 2012 of $90.9 mil-lion included $90.7 million of invested assets carried atfair value and $0.2 million of cash and equivalents.The following table presents for each hierarchy level the
Chaucer defined benefit plan’s investment assets that aremeasured at fair value at December 31, 2013 and 2012.
DECEMBER 31 2013 2012
(in millions)Total Level 1 Level 2 Level 3 Total Level 1 Level 2 Level 3
Fixed income securities:Fixed maturities $ 22.8 $ — $ 22.8 $ — $ 12.9 $ — $ 12.9 $ —
Equity securities:Domestic 30.5 — 30.5 — 29.9 — 29.9 —International 57.8 — 57.8 — 39.7 — 39.7 —
Total equity securities 88.3 — 88.3 — 69.6 — 69.6 —
Real estate funds 8.8 — — 8.8 8.2 — — 8.2
Total investments at fair value $ 119.9 $ — $111.1 $ 8.8 $ 90.7 $ — $ 82.5 $ 8.2
Fixed Income and Equity Securities
Securities classified as Level 2 at December 31, 2013 and2012 include pooled funds which are valued at the close ofbusiness using a third party pricing service. These valuesare adjusted by the fund manager to reflect outstandingdividends, taxes and investment fees and other expenses tocalculate the NAV.
Real Estate Funds
Real estate fund investments classified as Level 3 atDecember 31, 2013 and 2012 are valued based upon thevalues of the net assets of the fund. Although the NAV iscalculated daily, transactions also consider cash inflowsand outflows of the fund. The price where units are trans-acted includes the NAV, which is adjusted for investmentcharges and other estimated acquisition costs such as legalfees, taxes, planning and architect fees, survey and agentfees, among others.

THE HANOVER INSURANCE GROUP 2013 ANNUAL REPORT | 115
The table below provides a reconciliation for all assetsmeasured at fair value on a recurring basis using signifi-cant unobservable inputs (Level 3).
YEARS ENDED DECEMBER 31 2013 2012
(in millions)
Balance at beginning of period $ 8.2 $ 7.7Actual return on plan assets related to
assets still held 0.5 —Foreign currency translation 0.1 0.5
Balance at end of year $ 8.8 $ 8.2
Obligations and Funded StatusThe Company recognizes the current net underfunded sta-tus of its plans in its Consolidated Balance Sheets.Changes in the funded status of the plans are reflected ascomponents of accumulated other comprehensive loss orincome. The components of accumulated other compre-hensive loss or income are reflected as either a net actuar-ial gain or loss or a net prior service cost. The followingtable reflects the benefit obligations, fair value of planassets and funded status of the plans at December 31,2013 and 2012.
DECEMBER 31 2013 2012 2013 2012 2013 2012
(in millions)U.S. Qualified U.S. Non-Qualified Chaucer Pension Plans Pension Plans Pension Plan
Accumulated benefit obligation $ 548.8 $ 607.0 $ 37.4 $ 41.2 $ 128.5 $ 116.6
Change in benefit obligation:Projected benefit obligation, beginning of period $ 607.0 $ 570.8 $ 41.2 $ 39.2 $ 116.6 $ 104.4Employee contributions — — — — 0.4 0.4Service cost – benefits earned during the period — — — — 1.5 1.6Interest cost 24.8 28.1 1.6 1.9 5.4 5.2Actuarial losses (gains) (36.5) 49.0 (2.3) 3.3 3.6 1.8Benefits paid (46.5) (40.9) (3.1) (3.2) (1.5) (2.4)Foreign currency translation — — — — 2.5 5.6
Projected benefit obligation, end of year 548.8 607.0 37.4 41.2 128.5 116.6
Change in plan assets:Fair value of plan assets, beginning of period 591.6 574.7 — — 90.9 74.3Actual return on plan assets (3.1) 57.8 — — 17.1 9.9Contributions — — 3.1 3.2 10.6 4.9Benefits paid (46.5) (40.9) (3.1) (3.2) (1.5) (2.4)Foreign currency translation — — — — 3.1 4.2
Fair value of plan assets, end of year 542.0 591.6 — — 120.2 90.9
Funded status of the plans $ (6.8) $ (15.4) $ (37.4) $ (41.2) $ (8.3) $ (25.7)
Contributions include $0.4 million of Chaucer employ-ee contributions during 2013 and 2012. All other contribu-tions for all plans were made by the Company.
Components of Net Periodic Pension CostThe components of total net periodic pension cost are asfollows:
YEARS ENDED DECEMBER 31 2013 2012 2011
(in millions)
Service cost - benefits earned during the period $ 1.5 $ 1.6 $ 0.7
Interest cost 31.9 35.2 34.3Expected return on plan assets (35.9) (38.7) (37.1)Recognized net actuarial loss 14.7 12.8 15.0Amortization of prior service cost — 0.1 0.1Settlement loss 0.4 — —
Net periodic pension cost $ 12.6 $ 11.0 $ 13.0
The following table reflects the total amounts recog-nized in accumulated other comprehensive income relat-ing to both the U.S. defined benefit pension plans and theChaucer pension plan as of December 31, 2013 and 2012.
DECEMBER 31 2013 2012
(in millions)
Net actuarial loss $ 118.7 $ 147.3Net prior service cost 0.1 —
$ 118.8 $ 147.3

| THE HANOVER INSURANCE GROUP 2013 ANNUAL REPORT116
The unrecognized net actuarial gains (losses) whichexceed 10% of the greater of the projected benefit obliga-tion or the fair value of plan assets are amortized as a com-ponent of net periodic pension cost in future years. Thefollowing table reflects the total estimated amount of actu-arial losses that will be amortized from accumulated othercomprehensive income into net periodic pension cost in2014:
ESTIMATED AMORTIZATION IN 2014 EXPENSE
(in millions)
Net actuarial loss $ 11.3Net prior service cost 0.1
$ 11.4
ContributionsIn accordance with ERISA guidelines, the Company is notrequired to fund its U.S. qualified benefit plan in 2014.The Company expects to contribute $3.3 million to its U.S.non-qualified pension plans to fund 2014 benefit pay-ments, and approximately $2 million to the Chaucer pen-sion plan. At this time, no additional discretionarycontributions are expected to be made to the plans during2014 and the Company does not expect that any funds willbe returned from the plans to the Company during 2014.
Benefit PaymentsThe Company estimates that benefit payments over thenext 10 years will be as follows:
YEARS ENDED 2019-DECEMBER 31 2014 2015 2016 2017 2018 2023
(in millions)
U.S. qualified pension plans $ 43.9 $ 40.6 $ 40.1 $ 41.8 $ 41.7 $205.2
U.S. non-qualified pension plans $ 3.3 $ 3.4 $ 3.1 $ 3.1 $ 3.0 $ 14.2
Chaucer pension plan $ 1.6 $ 1.7 $ 1.7 $ 1.8 $ 1.9 $ 10.3
The benefit payments are based on the same assump-tions used to measure the Company’s benefit obligations atthe end of 2013. Benefit payments related to the U.S.qualified plans and the Chaucer plan will be made fromplan assets, whereas those payments related to the non-qualified plans will be provided for by the Company.
DEFINED CONTRIBUTION PLAN
In addition to the defined benefit plans, THG provides adefined contribution 401(k) plan for its U.S. employees,whereby the Company matches employee elective 401(k)contributions, up to a maximum percentage of 6% in 2013,2012, and 2011. The Company’s expense for this matching
provision was $18.3 million, $17.9 million and $17.8 mil-lion for 2013, 2012 and 2011, respectively. In addition tothis matching provision, the Company can elect to makean annual contribution to employees’ accounts. Additionalcontributions amounted to $2.8 million for the 2013 planyear. There were no additional contributions in 2012 and2011.Chaucer also provides a defined contribution plan for
its employees which provides for employer provided contri-butions. The Company’s expense for 2013 and 2012 was$5.0 million and $4.8 million, respectively.
9. OTHER POSTRETIREMENT BENEFIT PLANS
In addition to the Company’s pension plans, the Companyalso has postretirement medical benefits that it provides toformer agents and retirees and their dependents, and alimited number of full-time employees. The medical plansprovide benefits including hospital and major medical,with certain limits, and have varying co-payments anddeductibles, depending on the plan. Generally, employeeswho were actively employed on December 31, 1995became eligible with at least 15 years of service after theage of 40. Effective January 1, 1996, the Company revisedthese benefits so as to establish limits on future benefitpayments to beneficiaries of retired participants and torestrict eligibility to then current employees. In 2009, theCompany changed the postretirement medical benefits,only as they relate to current employees who still qualifiedfor participation in the plan under the above formula. Forthese participants, the plan now provides for only post age65 benefits. The population of agents receiving postretire-ment benefits was frozen as of December 31, 2002, whenthe Company ceased its distribution of proprietary life andannuity products. This plan is unfunded.Prior to June 2013, the Company also had postretire-
ment death benefits providing for payment at death up tothe retirees’ final annual salary. In May 2013, theCompany settled and defeased the life insurance portion ofits postretirement benefits by decreasing the level of deathbenefits and concurrently fully funding the remaining ben-efits through the purchase of life insurance policies for theplan beneficiaries from an unaffiliated life insurer, result-ing in a net settlement gain. This plan was also unfunded.The Company has recognized the funded status of its
postretirement benefit plans in its Consolidated BalanceSheets. Since the plans are unfunded, the amount recog-nized in the Consolidated Balance Sheets is equal to theaccumulated benefit obligation of the plans. The compo-nents of accumulated other comprehensive income or lossare reflected as either a net actuarial gain or loss or a netprior service cost.

THE HANOVER INSURANCE GROUP 2013 ANNUAL REPORT | 117
Obligation and Funded StatusThe following table reflects the funded status of theseplans:
DECEMBER 31 2013 2012
(in millions)
Change in benefit obligation:Accumulated postretirement benefit
obligation, beginning of year $ 45.2 $ 46.0Service cost 0.1 0.1Interest cost 1.2 2.1Net actuarial gains (1.0) (0.2)Benefits paid (2.8) (2.8)Plan amendment (8.4) —Settlement of death benefits (17.2) —
Accumulated postretirement benefit obligation, end of year 17.1 45.2
Fair value of plan assets, end of year — —
Funded status of plans $ (17.1) $ (45.2)
Benefit PaymentsThe Company estimates that benefit payments over thenext 10 years will be as follows:
YEARS ENDING DECEMBER 31
(in millions)
2014 $ 2.12015 1.92016 1.72017 1.52018 1.32019-2023 5.5
The benefit payments are based on the same assump-tions used to measure the Company’s benefit obligation atthe end of 2013 and reflect benefits attributable to esti-mated future service.
Components of Net Periodic Postretirement Expense(Benefit)The components of net periodic postretirement expense(benefit) were as follows:
YEARS ENDED DECEMBER 31 2013 2012 2011
(in millions)
Service cost $ 0.1 $ 0.1 $ 0.1Interest cost 1.2 2.1 2.4Recognized net actuarial loss 0.2 0.2 0.4Amortization of prior service cost (3.7) (3.8) (5.3)Net settlement gain (1.6) — —
Net periodic postretirement benefit $ (3.8) $ (1.4) $ (2.4)
The following table reflects the balances in accumulat-ed other comprehensive income relating to the Company’spostretirement benefit plans:
DECEMBER 31 2013 2012
(in millions)
Net actuarial loss $ 1.9 $ 7.2Net prior service cost (3.5) (7.5)
$ (1.6) $ (0.3)
The following table reflects the estimated amortizationto be recognized in net periodic benefit cost in 2014:
ESTIMATED AMORTIZATION IN 2014 EXPENSE (BENEFIT)
(in millions)
Net actuarial loss $ 0.1Net prior service cost (1.9)
$ (1.8)
AssumptionsEmployers are required to measure the funded status oftheir plans as of the date of their year-end statement offinancial position. As such, the Company has utilized ameasurement date of December 31, 2013 and 2012, todetermine its postretirement benefit obligations, consis-tent with the date of its Consolidated Balance Sheets.Weighted-average discount rate assumptions used to deter-mine postretirement benefit obligations and periodicpostretirement costs are as follows:
YEARS ENDED DECEMBER 31 2013 2012
Postretirement benefit obligations discount rate 5.00% 4.25%Postretirement benefit cost discount rate 4.25% 5.00%
Assumed health care cost trend rates are as follows:
DECEMBER 31 2013 2012
Health care cost trend rate assumed for next year 7.00% 7.00%Rate to which the cost trend is assumed to
decline (ultimate trend rate) 5.00% 5.00%Year the rate reaches the ultimate trend rate 2020 2017
A one-percentage point change in assumed health carecost trend rates in each year would have an immaterialeffect on net periodic benefit cost during 2013 and accu-mulated postretirement benefit obligation at December 31,2013.
| THE HANOVER INSURANCE GROUP 2013 ANNUAL REPORT118
10. OTHER COMPREHENSIVE INCOME
The following table provides changes in other comprehensive income.
YEARS ENDED DECEMBER 31 2013 2012 2011
(in millions)Tax Benefit Tax Benefit Tax Benefit
Pre-Tax (Expense) Net of Tax Pre-Tax (Expense) Net of Tax Pre-Tax (Expense) Net of Tax
Unrealized gains (losses) onavailable-for-sale securities andderivative instruments:Unrealized gains (losses) arising
during period (net of pre-tax, ceded unrealized losses of $1.2 million for the twelve months ended December 31, 2013) $ (189.4) $ 63.1 $ (126.3) $ 186.4 $ (40.2) $ 146.2 $ 96.0 $ 24.1 $ 120.1
Amount of realized gains from sales and other (41.3) (3.0) (44.3) (31.8) (3.3) (35.1) (28.8) (6.9) (35.7)
Portion of other-than-temporaryimpairment losses recognizedin earnings 6.0 (2.1) 3.9 8.9 (2.7) 6.2 8.4 (2.4) 6.0
Net unrealized gains (losses) (224.7) 58.0 (166.7) 163.5 (46.2) 117.3 75.6 14.8 90.4Pension and postretirement benefits:
Net actuarial gain (loss) arising in the period 15.0 (4.2) 10.8 (24.9) 9.0 (15.9) (16.0) 4.2 (11.8)
Amortization of net actuarial loss and prior service cost recognized as netperiodic benefit cost 14.9 (5.2) 9.7 9.3 (3.2) 6.1 10.2 (3.6) 6.6
Cumulative foreign currencytranslation adjustment:Foreign currency translation
recognized during the period (3.1) 1.1 (2.0) 12.2 (4.3) 7.9 (17.7) 6.2 (11.5)
Other comprehensive income (loss) $ (197.9) $ 49.7 $ (148.2) $ 160.1 $ (44.7) $ 115.4 $ 52.1 $ 21.6 $ 73.7
YEARS ENDED DECEMBER 31 2013 2012 2011
(in millions)
Details about Accumulated Other Amount Reclassified from Accumulated Affected Line Item in the StatementComprehensive Income Components Other Comprehensive Income Where Net Income is Presented
Unrealized gains (losses) on available- $ 41.3 $ 31.8 $ 27.8 Net realized gains from sales and otherfor-sale securities and derivative instruments (6.0) (7.8) (6.9) Net other-than-temporary impairment
losses on investments recognized in earnings
35.3 24.0 20.9 Total before tax5.1 6.0 9.3 Tax benefit (expense)
40.4 30.0 30.2— (0.9) (0.5) Discontinued operations, net of tax
40.4 29.1 29.7 Net of tax
Amortization of defined benefitpension and postretirement plans 14.9 9.3 10.2 Loss adjustment expenses and other operating expenses
(5.2) (3.2) (3.6) Tax benefit (expense)
9.7 6.1 6.6 Net of tax
Total reclassifications for the period $ 50.1 $ 35.2 $ 36.3 Net of tax

THE HANOVER INSURANCE GROUP 2013 ANNUAL REPORT | 119
The amount reclassified from accumulated other com-prehensive income for the pension and postretirementbenefits was allocated approximately 40% to loss adjust-ment expenses and 60% to other operating expenses foreach of the years ended December 31, 2013, 2012 and2011.
11. STOCK-BASED COMPENSATION PLANS
On May 16, 2006, the shareholders approved the adoptionof The Hanover Insurance Group, Inc. 2006 Long-TermIncentive Plan (the “Plan”). Key employees, directors andcertain consultants of the Company and its subsidiaries areeligible for awards pursuant to the Plan, which is adminis-tered by the Compensation Committee of the Board ofDirectors (the “Committee”) of the Company. Under thePlan, awards may be granted in the form of non-qualifiedor incentive stock options, stock appreciation rights, per-formance awards, restricted stock, unrestricted stock,stock units, or any other award that is convertible into orotherwise based on the Company’s stock, subject to certainlimits. The Plan authorized the issuance of 3,000,000 newshares that may be used for awards. In addition, shares ofstock underlying any award granted and outstanding underthe Company’s Amended Long-Term Stock Incentive Plan(the “1996 Plan”) as of the adoption date of the Plan that
are forfeited, cancelled, expire or terminate without theissuance of stock become available for future grants underthe Plan. As of December 31, 2013, there were 1,033,786shares available for grants under the Plan. The Companyutilizes shares of stock held in the treasury account foroption exercises and other awards granted under bothplans.Compensation cost for the years ended December 31,
2013, 2012, and 2011 totaled $12.4 million, $12.8 millionand $12.2 million, respectively. Related tax benefits were$4.3 million, $4.5 million and $4.3 million, respectively.
STOCK OPTIONS
Under the Plan, options may be granted to eligible employ-ees, directors or consultants at an exercise price equal tothe market price of the Company’s common stock on thedate of grant. Option shares may be exercised subject tothe terms prescribed by the Committee at the time ofgrant. Options granted in 2013 generally vest over 3 yearswith 33 1/3% vesting in each year, whereas options grant-ed in 2012, and 2011 generally vest over 4 years with a50% vesting rate in the third year and a 50% vesting rate inthe fourth year. Options must be exercised not later thanten years from the date of grant.Information on the Company’s stock option plans is
summarized below.
YEARS ENDED DECEMBER 31 2013 2012 2011
(in whole shares and dollars)
Weighted Weighted WeightedAverage Average Average
Shares Exercise Price Shares Exercise Price Shares Exercise Price
Outstanding, beginning of year 2,892,882 $ 38.28 2,715,430 $ 38.57 2,843,909 $ 39.22Granted 537,800 42.53 529,500 36.84 297,000 46.47Exercised (1,192,134) 34.70 (90,624) 25.47 (120,064) 32.82Forfeited or cancelled (189,375) 41.54 (101,574) 41.45 (49,165) 41.67Expired — — (159,850) 44.05 (256,250) 57.00
Outstanding, end of year 2,049,173 $ 41.18 2,892,882 $ 38.28 2,715,430 $ 38.57
Exercisable, end of year 783,873 $ 41.16 1,630,382 $ 37.18 1,686,930 $ 37.69
Cash received for options exercised for the years endedDecember 31, 2013, 2012 and 2011 was $24.4 million,$2.3 million and $3.9 million, respectively. The intrinsicvalue of options exercised for the years ended December31, 2013, 2012 and 2011 was $19.9 million, $1.2 millionand $1.8 million, respectively.
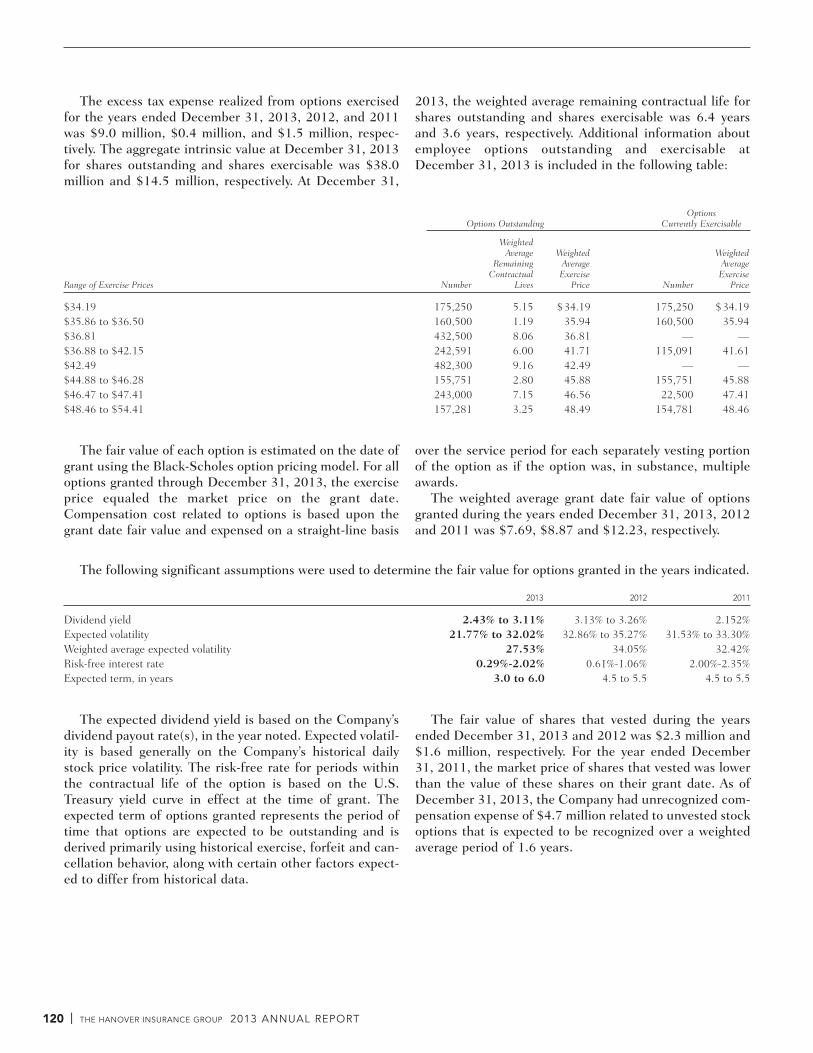
| THE HANOVER INSURANCE GROUP 2013 ANNUAL REPORT120
Options Options Outstanding Currently Exercisable
WeightedAverage Weighted Weighted
Remaining Average AverageContractual Exercise Exercise
Range of Exercise Prices Number Lives Price Number Price
$34.19 175,250 5.15 $34.19 175,250 $34.19$35.86 to $36.50 160,500 1.19 35.94 160,500 35.94$36.81 432,500 8.06 36.81 — —$36.88 to $42.15 242,591 6.00 41.71 115,091 41.61$42.49 482,300 9.16 42.49 — —$44.88 to $46.28 155,751 2.80 45.88 155,751 45.88$46.47 to $47.41 243,000 7.15 46.56 22,500 47.41$48.46 to $54.41 157,281 3.25 48.49 154,781 48.46
The fair value of each option is estimated on the date ofgrant using the Black-Scholes option pricing model. For alloptions granted through December 31, 2013, the exerciseprice equaled the market price on the grant date.Compensation cost related to options is based upon thegrant date fair value and expensed on a straight-line basis
The excess tax expense realized from options exercisedfor the years ended December 31, 2013, 2012, and 2011was $9.0 million, $0.4 million, and $1.5 million, respec-tively. The aggregate intrinsic value at December 31, 2013for shares outstanding and shares exercisable was $38.0million and $14.5 million, respectively. At December 31,
2013, the weighted average remaining contractual life forshares outstanding and shares exercisable was 6.4 yearsand 3.6 years, respectively. Additional information aboutemployee options outstanding and exercisable atDecember 31, 2013 is included in the following table:
over the service period for each separately vesting portionof the option as if the option was, in substance, multipleawards.The weighted average grant date fair value of options
granted during the years ended December 31, 2013, 2012and 2011 was $7.69, $8.87 and $12.23, respectively.
The following significant assumptions were used to determine the fair value for options granted in the years indicated.
2013 2012 2011
Dividend yield 2.43% to 3.11% 3.13% to 3.26% 2.152%Expected volatility 21.77% to 32.02% 32.86% to 35.27% 31.53% to 33.30%Weighted average expected volatility 27.53% 34.05% 32.42%Risk-free interest rate 0.29%-2.02% 0.61%-1.06% 2.00%-2.35%Expected term, in years 3.0 to 6.0 4.5 to 5.5 4.5 to 5.5
The expected dividend yield is based on the Company’sdividend payout rate(s), in the year noted. Expected volatil-ity is based generally on the Company’s historical dailystock price volatility. The risk-free rate for periods withinthe contractual life of the option is based on the U.S.Treasury yield curve in effect at the time of grant. Theexpected term of options granted represents the period oftime that options are expected to be outstanding and isderived primarily using historical exercise, forfeit and can-cellation behavior, along with certain other factors expect-ed to differ from historical data.
The fair value of shares that vested during the yearsended December 31, 2013 and 2012 was $2.3 million and$1.6 million, respectively. For the year ended December31, 2011, the market price of shares that vested was lowerthan the value of these shares on their grant date. As ofDecember 31, 2013, the Company had unrecognized com-pensation expense of $4.7 million related to unvested stockoptions that is expected to be recognized over a weightedaverage period of 1.6 years.

THE HANOVER INSURANCE GROUP 2013 ANNUAL REPORT | 121
RESTRICTED STOCK UNITS
Stock grants may be awarded to eligible employees at aprice established by the Committee (which may be zero).Under the Plan, the Company may award shares ofrestricted stock, restricted stock units, as well as shares ofunrestricted stock. Restricted stock grants may vest basedupon performance criteria, market criteria or continuedemployment and be in the form of shares or units. Vestingperiods are established by the Committee.The Company granted market-based restricted share
units in 2013 and 2012 and performance-based restrictedshare units in 2011 to certain employees. Share units
granted in 2013 generally vest after 3 years of continuedemployment and after the achievement of certain stockperformance targets and share units granted in 2012 and2011 vest after the achievement of certain performancetargets at a rate of 50% after 3 years and the remaining50% after 4 years of continued employment. The Companyalso granted restricted stock units to eligible employeesthat for awards granted in 2013 generally vest after 3 yearsof continued employment and for those granted in 2012and 2011 generally vest at a rate of 50% after 3 years andthe remaining 50% after 4 years of continued employment.The following table summarizes information aboutemployee restricted stock units:
YEARS ENDED DECEMBER 31 2013 2012 2011
Weighted Weighted WeightedAverage Grant Average Grant Average Grant
Shares Date Fair Value Shares Date Fair Value Shares Date Fair Value
Time-based restricted stock units:Outstanding, beginning of year 750,837 $40.15 768,529 $ 40.17 838,129 $ 40.93
Granted 141,073 43.31 174,841 37.01 198,957 42.08Vested (298,388) 39.51 (137,194) 36.19 (230,613) 44.40Forfeited (67,542) 41.33 (55,339) 40.47 (37,944) 41.23
Outstanding, end of year 525,980 $41.20 750,837 $ 40.15 768,529 $ 40.17
Performance and market-based restricted stock units:Outstanding, beginning of year 132,775 $39.97 69,500 $ 45.37 101,680 $ 39.62
Granted 82,795 41.85 96,150 36.91 42,500 46.47Vested — — — — (27,059) 45.21Forfeited (30,944) 42.33 (32,875) 43.28 (47,621) 34.16
Outstanding, end of year 184,626 $40.42 132,775 $ 39.97 69,500 $ 45.37
In 2013 and 2012, the Company granted market-basedawards totaling 76,175 and 92,400, respectively, to certainmembers of senior management, which are included in thetable above as performance and market-based restrictedstock activity. The vesting of these stock units is based onthe relative total shareholder return (“TSR”) of theCompany. This metric is generally based on relative TSRfor a three year period as compared to a Property andCasualty Index of peer companies. The fair value of mar-ket based awards was estimated at the date of grant usinga valuation model. These units have the potential to rangefrom 0% to 150% of the shares disclosed.Performance-based restricted stock units are based
upon the achievement of the performance metric at 100%.These units have the potential to range from 0% to 200%of the shares disclosed, which varies based on grant yearand individual participation level. Increases above the100% target level are reflected as granted in the period inwhich performance-based stock unit goals are achieved.Decreases below the 100% target level are reflected as for-feited. In 2013, performance-based stock units of 8,244were included as forfeited due to completion levels less
than 100% for units granted in 2011. The weighted aver-age grant date fair value for these awards was $46.47. In2012, performance-based stock units of 31,750 wereincluded as forfeited due to completion levels of less thanthe threshold achievement level for shares granted in2010. The weighted average grant date fair value for theseawards was $42.15. In 2011, performance-based stockunits of 47,375 were included as forfeited due to comple-tion levels of less than the threshold achievement level forshares granted in 2009. The weighted average grant datefair value for these awards was $34.19.The intrinsic value, which is equal to the fair value for
restricted stock and for restricted stock units that vestedduring the year ended December 31, 2013 and 2012, was$1.8 million and $1.7 million, respectively. For perform-ance-based restricted stock units that would have vested in2013 and 2012, there was no intrinsic value since theseawards were forfeited due to the aforementioned comple-tion levels of less than threshold. The intrinsic value ofrestricted stock units and performance-based restrictedunits that vested during the year ended December 31,2011 were $10.2 million and $1.3 million, respectively.

| THE HANOVER INSURANCE GROUP 2013 ANNUAL REPORT122
At December 31, 2013, the aggregate intrinsic value ofrestricted stock and restricted stock units was $31.4 mil-lion and the weighted average remaining contractual lifewas 1.1 years. The aggregate intrinsic value of perform-ance and market-based restricted stock units was $11.0million and the weighted average remaining contractuallife was 2.0 years. As of December 31, 2013, there was$12.1 million of total unrecognized compensation costrelated to unvested restricted stock units and performanceand market-based restricted stock units, assuming per-formance and market-based restricted stock units areachieved at 100% of the performance metric. The cost isexpected to be recognized over a weighted-average periodof 1.8 years. Compensation cost associated with restrictedstock, restricted stock units and performance and market-based restricted stock units is generally calculated basedupon grant date fair value, which is determined using cur-rent market prices.
12. EARNINGS PER SHARE AND SHAREHOLDERS’EQUITY TRANSACTIONS
The following table provides weighted average share infor-mation used in the calculation of the Company’s basic anddiluted earnings per share:
DECEMBER 31 2013 2012 2011
(in millions, except per share data)
Basic shares used in the calculation of earnings per share 44.1 44.7 45.2
Dilutive effect of securities:Employee stock options 0.3 0.2 0.2Non-vested stock grants 0.5 0.4 0.4
Diluted shares used in the calculation of earnings per share 44.9 45.3 45.8
Per share effect of dilutive securities on income from continuing operations $(0.11) $ (0.01) $ (0.01)
Per share effect of dilutive securities on net income $(0.11) $ (0.02) $ (0.01)
Diluted earnings per share during 2013, 2012 and 2011excludes 0.1 million, 1.8 million and 1.6 million, respec-tively, of common shares issuable under the Company’sstock compensation plans, because their effect would beantidilutive.Since October 2007 and through December 2013, the
Company’s Board of Directors has authorized aggregaterepurchases of the Company’s common stock of up to$600 million, including a $100 million increase in the pro-
gram in 2013. As of December 31, 2013, the Company has$137.0 million available for repurchases under theserepurchase authorizations. Repurchases may be executedusing open market purchases, privately negotiated transac-tions, accelerated repurchase programs or other transac-tions. The Company is not required to purchase anyspecific number of shares or to make purchases by any cer-tain date under this program. During 2013, the Companypurchased 1.6 million shares of the Company’s commonstock at a cost of $78.2 million.
13. DIVIDEND RESTRICTIONS
U.S. INSURANCE SUBSIDIARIES
The individual law of all states, including New Hampshireand Michigan, where Hanover Insurance and Citizens aredomiciled, respectively, restrict the payment of dividendsto stockholders by insurers. These laws affect the dividendpaying ability of Hanover Insurance and Citizens.Pursuant to New Hampshire’s statute, the maximum
dividends and other distributions that an insurer may payin any twelve month period, without prior approval of theNew Hampshire Insurance Commissioner, is limited to10% of such insurer’s statutory policyholder surplus as ofthe preceding December 31. No dividends were declaredby Hanover Insurance in 2013 or 2012. In 2011, HanoverInsurance declared dividends to its parent totaling $99.0million. During 2014, the maximum dividend payablewithout prior approval is $183.0 million.Pursuant to Michigan’s statute, the maximum dividends
and other distributions that an insurer may pay in anytwelve month period, without prior approval of theMichigan Insurance Commissioner, is limited to thegreater of 10% of policyholders’ surplus as of December 31of the immediately preceding year or the statutory netincome less net realized gains, for the immediately preced-ing calendar year. Citizens declared dividends to its parent,Hanover Insurance, totaling $68.0 million, $70.0 millionand $69.0 million in 2013, 2012 and 2011, respectively.Citizens cannot pay a further dividend to its parent with-out prior approval until December 2014, at which time themaximum dividend payable without prior approval wouldbe $66.2 million.The statutes in both New Hampshire and Michigan
require that prior notice to the respective InsuranceCommissioner of any proposed dividend be provided andsuch Commissioner may, in certain circumstances, prohib-it the payment of the proposed dividend.

THE HANOVER INSURANCE GROUP 2013 ANNUAL REPORT | 123
CHAUCER
Dividend payments from Chaucer to its parent are regulat-ed by U.K. law. Dividends from Chaucer are dependent ondividends from its subsidiaries. Annual dividend paymentsfrom Chaucer are limited to retained earnings that are notrestricted by capital and other requirements for business atLloyd’s. Also, Chaucer must provide advance notice to theU.K.’s Prudential Regulation Authority (“PRA”), one of thesuccessors to the Financial Services Authority, of certainproposed dividends or other payments from PRA regulatedentities. Dividend payments to THG from Chaucer entitiestotaled $13.9 million in 2013. No dividends were declaredby Chaucer in 2012 or 2011.
14. SEGMENT INFORMATION
The Company’s primary business operations include insur-ance products and services provided through four operat-ing segments. The domestic operating segments areCommercial Lines, Personal Lines and Other, and theCompany’s international operating segment is Chaucer.Commercial Lines includes commercial multiple peril,commercial automobile, workers’ compensation, and othercommercial coverages, such as specialty program business,inland marine, management and professional liability andsurety. Personal Lines includes personal automobile,homeowners and other personal coverages. Chaucerincludes marine and aviation, energy, property, U.K. motor,and casualty and other coverages (which includes interna-tional liability, specialist coverages, and syndicate partici-pations). Included in Other are Opus InvestmentManagement, Inc., which markets investment manage-ment services to institutions, pension funds and otherorganizations; earnings on holding company assets; and, avoluntary pools business which is in run-off. The separatefinancial information is presented consistent with the wayresults are regularly evaluated by the chief operating deci-sion maker in deciding how to allocate resources and inassessing performance.
The Company reports interest expense related to debtseparately from the earnings of its operating segments.This consists of interest on the Company’s senior deben-tures, subordinated debentures, collateralized borrowingswith the Federal Home Loan Bank of Boston, and letter ofcredit facility. Management evaluates the results of theaforementioned segments based on operating income(loss) before taxes (formerly referred to as segmentincome) which also excludes interest expense on debt.Operating income (loss) before taxes excludes certainitems which are included in net income (loss), such as netrealized investment gains and losses (including gains andlosses on certain derivative instruments). Such gains andlosses are excluded since they are determined by interestrates, financial markets and the timing of sales. Also, oper-ating income (loss) before taxes excludes net gains andlosses on disposals of businesses, gains and losses relatedto the repayment of debt, discontinued operations, costs toacquire businesses, restructuring costs, extraordinaryitems, the cumulative effect of accounting changes andcertain other items. Although the items excluded fromoperating income (loss) before taxes may be importantcomponents in understanding and assessing theCompany’s overall financial performance, managementbelieves that the presentation of operating income (loss)before taxes enhances an investor’s understanding of theCompany’s results of operations by highlighting netincome (loss) attributable to the core operations of thebusiness. However, operating income (loss) before taxesshould not be construed as a substitute for income (loss)before income taxes and operating income (loss) shouldnot be construed as a substitute for net income (loss).

| THE HANOVER INSURANCE GROUP 2013 ANNUAL REPORT124
Summarized below is financial information with respectto the Company’s business segments. Amounts reflectactivity of Chaucer since the July 1, 2011 acquisition date.
YEARS ENDED DECEMBER 31 2013 2012 2011
(in millions)
Operating revenues:Commercial Lines $2,109.5 $1,966.2 $1,798.9Personal Lines 1,542.5 1,560.0 1,555.9Chaucer 1,098.2 1,030.0 534.1Other 10.0 10.9 14.6
Total 4,760.2 4,567.1 3,903.5Net realized investment gains 33.5 23.6 28.1
Total revenues $4,793.7 $4,590.7 $3,931.6
Operating income (loss) before interest expense and income taxes:Commercial Lines:
GAAP underwriting loss $ (11.0) $ (224.2) $ (123.0)Net investment income 143.5 142.4 136.5Other income (expense) (0.1) 1.5 2.8
Commercial Lines operating income (loss) 132.4 (80.3) 16.3
Personal Lines:GAAP underwriting income (loss) 37.6 (67.3) (72.6)Net investment income 75.8 86.5 92.1Other income 5.2 6.3 3.6
Personal Lines operating income 118.6 25.5 23.1
Chaucer:GAAP underwriting income 107.7 93.5 11.9Net investment income 42.7 40.2 16.9Other income — 3.1 4.1
Chaucer operating income 150.4 136.8 32.9
Other:GAAP underwriting loss (3.4) (3.5) (0.3)Net investment income 7.0 7.2 12.7Other net expenses (11.6) (10.6) (12.9)
Other operating loss (8.0) (6.9) (0.5)
Operating income before interest expense and income taxes 393.4 75.1 71.8
Interest on debt (65.3) (61.9) (55.0)
Operating income before income taxes 328.1 13.2 16.8
Non-operating income items:Net realized investment gains 33.5 23.6 28.1Net loss from repayment of debt (27.7) (5.1) (2.3)Loss on real estate (4.7) — —Net costs related to acquired businesses (0.1) (2.6) (16.4)
Loss on derivative instruments — — (11.3)Net foreign exchange gains (losses) — (0.4) 6.7
Income before income taxes $ 329.1 $ 28.7 $ 21.6
The following table provides identifiable assets for theCompany’s business segments and discontinued operations:
DECEMBER 31 2013 2012
(in millions)Identifiable Assets
U.S. Companies $ 8,962.6 $ 8,909.6Chaucer 4,301.2 4,444.8Discontinued operations 114.9 130.5
Total $13,378.7 $13,484.9
The Company reviews the assets of its U.S. Companiescollectively and does not allocate them between theCommercial Lines, Personal Lines and Other segments.
GEOGRAPHIC CONCENTRATIONS
The following table presents the Company’s gross writtenpremium (“GWP”) based on the location of the risk:
YEAR ENDED DECEMBER 31 2013 2012 2011
% of Total GWP
United States 78% 76% 87%United Kingdom 6 6 4Worldwide and other 16 18 9
Total 100% 100% 100%
The worldwide and other category includes insured risksthat move across multiple geographic areas, including theU.S. and U.K., due to their mobile nature or insured risksthat are fixed in locations that span more than one geo-graphic area, and risks located in a single country outsidethe U.S. and U.K. These contracts include, for example,marine and aviation, hull, satellite, offshore energy explo-ration and production risks that can move across multiplegeographic areas and assumed risks where the cedantinsures risks in two or more geographic zones. These risksmay include U.S. and U.K. insured risks.Long-lived assets located outside the U.S. were not
material for the year ended December 31, 2013 or 2012.The Company does not have revenue from transactionswith a single agent or broker amounting to 10 percent ormore of its consolidated revenue.
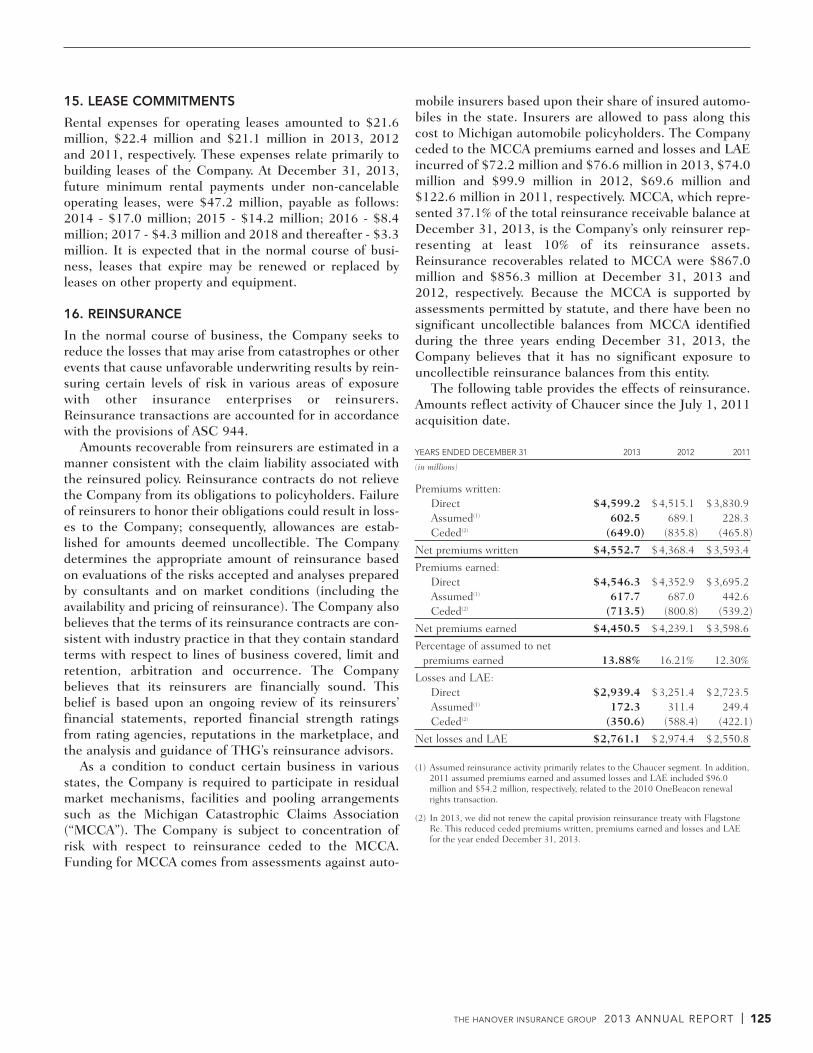
THE HANOVER INSURANCE GROUP 2013 ANNUAL REPORT | 125
15. LEASE COMMITMENTS
Rental expenses for operating leases amounted to $21.6million, $22.4 million and $21.1 million in 2013, 2012and 2011, respectively. These expenses relate primarily tobuilding leases of the Company. At December 31, 2013,future minimum rental payments under non-cancelableoperating leases, were $47.2 million, payable as follows:2014 - $17.0 million; 2015 - $14.2 million; 2016 - $8.4million; 2017 - $4.3 million and 2018 and thereafter - $3.3million. It is expected that in the normal course of busi-ness, leases that expire may be renewed or replaced byleases on other property and equipment.
16. REINSURANCE
In the normal course of business, the Company seeks toreduce the losses that may arise from catastrophes or otherevents that cause unfavorable underwriting results by rein-suring certain levels of risk in various areas of exposurewith other insurance enterprises or reinsurers.Reinsurance transactions are accounted for in accordancewith the provisions of ASC 944.Amounts recoverable from reinsurers are estimated in a
manner consistent with the claim liability associated withthe reinsured policy. Reinsurance contracts do not relievethe Company from its obligations to policyholders. Failureof reinsurers to honor their obligations could result in loss-es to the Company; consequently, allowances are estab-lished for amounts deemed uncollectible. The Companydetermines the appropriate amount of reinsurance basedon evaluations of the risks accepted and analyses preparedby consultants and on market conditions (including theavailability and pricing of reinsurance). The Company alsobelieves that the terms of its reinsurance contracts are con-sistent with industry practice in that they contain standardterms with respect to lines of business covered, limit andretention, arbitration and occurrence. The Companybelieves that its reinsurers are financially sound. Thisbelief is based upon an ongoing review of its reinsurers’financial statements, reported financial strength ratingsfrom rating agencies, reputations in the marketplace, andthe analysis and guidance of THG’s reinsurance advisors.As a condition to conduct certain business in various
states, the Company is required to participate in residualmarket mechanisms, facilities and pooling arrangementssuch as the Michigan Catastrophic Claims Association(“MCCA”). The Company is subject to concentration ofrisk with respect to reinsurance ceded to the MCCA.Funding for MCCA comes from assessments against auto-
mobile insurers based upon their share of insured automo-biles in the state. Insurers are allowed to pass along thiscost to Michigan automobile policyholders. The Companyceded to the MCCA premiums earned and losses and LAEincurred of $72.2 million and $76.6 million in 2013, $74.0million and $99.9 million in 2012, $69.6 million and$122.6 million in 2011, respectively. MCCA, which repre-sented 37.1% of the total reinsurance receivable balance atDecember 31, 2013, is the Company’s only reinsurer rep-resenting at least 10% of its reinsurance assets.Reinsurance recoverables related to MCCA were $867.0million and $856.3 million at December 31, 2013 and2012, respectively. Because the MCCA is supported byassessments permitted by statute, and there have been nosignificant uncollectible balances from MCCA identifiedduring the three years ending December 31, 2013, theCompany believes that it has no significant exposure touncollectible reinsurance balances from this entity.The following table provides the effects of reinsurance.
Amounts reflect activity of Chaucer since the July 1, 2011acquisition date.
YEARS ENDED DECEMBER 31 2013 2012 2011
(in millions)
Premiums written:Direct $4,599.2 $4,515.1 $3,830.9Assumed(1) 602.5 689.1 228.3Ceded(2) (649.0) (835.8) (465.8)
Net premiums written $4,552.7 $4,368.4 $3,593.4
Premiums earned:Direct $4,546.3 $4,352.9 $3,695.2Assumed(1) 617.7 687.0 442.6Ceded(2) (713.5) (800.8) (539.2)
Net premiums earned $4,450.5 $4,239.1 $3,598.6
Percentage of assumed to net premiums earned 13.88% 16.21% 12.30%
Losses and LAE:Direct $2,939.4 $3,251.4 $2,723.5Assumed(1) 172.3 311.4 249.4Ceded(2) (350.6) (588.4) (422.1)
Net losses and LAE $2,761.1 $2,974.4 $2,550.8
(1) Assumed reinsurance activity primarily relates to the Chaucer segment. In addition,2011 assumed premiums earned and assumed losses and LAE included $96.0million and $54.2 million, respectively, related to the 2010 OneBeacon renewalrights transaction.
(2) In 2013, we did not renew the capital provision reinsurance treaty with FlagstoneRe. This reduced ceded premiums written, premiums earned and losses and LAEfor the year ended December 31, 2013.

| THE HANOVER INSURANCE GROUP 2013 ANNUAL REPORT126
17. LIABILITIES FOR OUTSTANDING CLAIMS,LOSSES AND LOSS ADJUSTMENT EXPENSES
The Company regularly updates its reserve estimates asnew information becomes available and further eventsoccur which may impact the resolution of unsettledclaims. Reserve adjustments are reflected in results ofoperations as adjustments to losses and LAE. Often theseadjustments are recognized in periods subsequent to theperiod in which the underlying policy was written and lossevent occurred. These types of subsequent adjustments aredescribed as “prior years’ loss reserves”. Such developmentcan be either favorable or unfavorable to the Company’sfinancial results and may vary by line of business.The table below provides a reconciliation of the gross
beginning and ending reserve for unpaid losses and lossadjustment expenses (results for Chaucer for the yearended December 31, 2011 reflect the period from July 1,2011 to December 31, 2011).
YEARS ENDED DECEMBER 31 2013 2012 2011
(in millions)
Gross loss and LAE reserves, beginning of year $6,197.0 $5,760.3 $ 3,277.7
Reinsurance recoverable on unpaid losses 2,074.3 1,931.8 1,115.5
Net loss and LAE reserves, beginning of year 4,122.7 3,828.5 2,162.2
Net incurred losses and LAE in respect of losses occurring in:
Current year 2,837.4 2,990.2 2,654.1Prior years (76.3) (15.8) (103.3)
Total incurred losses and LAE 2,761.1 2,974.4 2,550.8
Net payments of losses and LAE in respect of losses occurring in:
Current year 1,213.5 1,317.6 1,482.4Prior years 1,469.8 1,396.5 1,010.3
Total payments 2,683.3 2,714.1 2,492.7
Purchase of Chaucer, net of reinsurance recoverable on unpaid losses of $669.6 — — 1,631.0
Effect of foreign exchange rate changes 0.6 33.9 (22.8)
Net reserve for losses and LAE, end of year 4,201.1 4,122.7 3,828.5
Reinsurance recoverable on unpaid losses 2,030.4 2,074.3 1,931.8
Gross reserve for losses and LAE, end of year $6,231.5 $6,197.0 $ 5,760.3
As part of an ongoing process, reserves have been re-estimated for all prior accident years and were decreasedby $76.3 million, $15.8 million and $103.3 million in2013, 2012 and 2011, respectively. For the years endedDecember 31, 2013, 2012 and the six months endedDecember 31, 2011, these amounts include favorable lossand LAE reserve development of $94.6 million, $72.6 mil-lion and $35.5 million, respectively for Chaucer. Chaucer’sfavorable development during 2013 was primarily theresult of lower than expected losses in the energy line, pri-marily in the 2009 through 2012 accident years, propertyline, primarily in the 2011 and 2012 accident years, with-in casualty and other lines, specialty liability lines, prima-rily in the 2008 accident year, and the marine and aviationline, primarily in the 2010 through 2012 accident years.For Commercial and Personal Lines, the unfavorable lossand LAE development during 2013 was primarily theresult of higher than expected losses within the personalautomobile line, due to severity in bodily injury coverage inthe 2010 through 2012 accident years, higher than expect-ed large losses in the commercial automobile line, primari-ly related to liability coverage in the 2009 through 2011accident years, and higher than expected losses withinother commercial lines, primarily in the 2010 through2012 accident years. Partially offsetting the unfavorabledevelopment was lower than expected losses within theworkers’ compensation line, primarily in the 2006 through2011 accident years and lower involuntary pool losses,including a $3.2 million benefit from the settlement of alegal proceeding, and lower than expected losses within thecommercial multi-peril line, primarily in the 2012 accidentyear.The $15.8 million favorable loss and LAE reserve devel-
opment during the year ended December 31, 2012includes favorable loss and LAE reserve development of$72.6 million for Chaucer. Chaucer’s favorable develop-ment during 2012 was primarily the result of lower thanexpected losses in the energy line, primarily in the 2008through 2011 accident years, marine and aviation lines,primarily in the 2007 through 2011 accident years, casual-ty lines, primarily in the 2010 and 2011 accident years,and the property lines, primarily in the 2009 through 2011accident years. For Commercial and Personal Lines, theunfavorable loss and LAE development during 2012 wasprimarily the result of higher than expected losses withinother commercial lines, primarily in the contract suretyline due to the challenging macroeconomic environmentfor contractors, and to a lesser extent, the AIX programbusiness, primarily related unexpected severity in commer-cial automobile liability, commercial multiple peril andgeneral liability in a limited number of programs, and from

THE HANOVER INSURANCE GROUP 2013 ANNUAL REPORT | 127
higher than expected large losses within the commercialautomobile line, primarily related to liability coverage inthe 2011 accident year. In addition, the Company experi-enced higher than expected losses within the personalautomobile line, primarily related to bodily injury severityin the 2010 and 2011 accident years, and higher thanexpected homeowners property losses from non-catastro-phe weather related activity in the 2011 accident year.Partially offsetting the unfavorable development was lowerthan expected losses within the commercial multiple perilline, related to the 2008 through 2011 accident years.The $103.3 million favorable loss and LAE reserve
development during 2011 includes favorable loss and LAEreserve development of $35.5 million for Chaucer.Chaucer’s favorable development was primarily the resultof lower than expected losses in the energy, property andU.K. motor lines, primarily related to the 2009 and 2010accident years. For Commercial and Personal Lines, thefavorable loss and LAE reserve development during 2011was primarily the result of lower than expected losses inthe personal automobile line, primarily related to bodilyinjury coverage in the 2008 through 2010 accident years,the commercial multiple peril line related to the 2007through 2010 accident years and lower than expected loss-es in the 2007 through 2010 accident years in the workers’compensation line. In addition, within other commerciallines, unfavorable development in the professional liabilityand surety lines were partially offset by favorable develop-ment in the healthcare and other commercial propertylines.Loss and LAE reserves related to asbestos and environ-
mental damage liability, primarily in other commerciallines, were $61.9 million, $60.5 million and $59.8 millionas of December 31, 2013, 2012 and 2011, respectively.Ending loss and LAE reserves for all direct business writ-ten by the Company related to asbestos and environmentaldamage liability, included in the reserve for losses andLAE, were $11.5 million, $9.8 million and $10.0 million,net of reinsurance of $20.6 million, $20.4 million and$18.7 million as of December 31, 2013, 2012 and 2011,respectively. As a result of the Company’s historical directunderwriting mix of Commercial Lines policies towardsmaller and middle market risks, past asbestos and envi-ronmental damage liability loss experience has remainedminimal in relation to the Company’s total loss and LAEincurred experience. In addition, the Company has estab-lished gross loss and LAE reserves for its run-off voluntaryassumed reinsurance pool business with asbestos and envi-ronmental damage liability of $29.8 million, $30.3 millionand $31.1 million at December 31, 2013, 2012 and 2011,respectively. These reserves relate to pools in which the
Company has terminated its participation; however, theCompany continues to be subject to claims related to yearsin which it was a participant. Because of the inherentuncertainty regarding the types of claims in these pools,the Company cannot provide assurance that its reserveswill be sufficient.The Company estimates its ultimate liability for
asbestos, environmental and toxic tort liability claims,whether resulting from direct business, assumed reinsur-ance and pool business, based upon currently known facts,reasonable assumptions where the facts are not known,current law and methodologies currently available.Although these outstanding claims are not significant,their existence gives rise to uncertainty and are discussedbecause of the possibility that they may become signifi-cant. The Company believes that, notwithstanding the evo-lution of case law expanding liability in asbestos andenvironmental claims, recorded reserves related to theseclaims are adequate. The asbestos, environmental andtoxic tort liability could be revised in the near term if theestimates used in determining the liability are revised, andany such revisions could have a material adverse effect onthe Company’s results of operations for a particular quar-terly or annual period or its financial position.
18. COMMITMENTS AND CONTINGENCIES
LEGAL PROCEEDINGS
Durand LitigationOn March 12, 2007, a putative class action suit captionedJennifer A. Durand v. The Hanover Insurance Group, Inc.,and The Allmerica Financial Cash Balance Pension Planwas filed in the United States District Court for theWestern District of Kentucky. The named plaintiff, a for-mer employee who received a lump sum distribution fromthe Company’s Cash Balance Plan (the “Plan”) at or aboutthe time of her termination, claims that she and otherssimilarly situated did not receive the appropriate lump sumdistribution because in computing the lump sum, theCompany and the Plan understated the accrued benefit inthe calculation. The plaintiff claims that the Plan under-paid her distributions and those of similarly situated par-ticipants by failing to pay an additional so-called “whipsaw”amount reflecting the present value of an estimate offuture interest credits from the date of the lump sum dis-tribution to each participant’s retirement age of 65.The plaintiff filed an Amended Complaint adding two
new named plaintiffs and additional claims on December11, 2009. In response, the Company filed a Motion toDismiss on January 30, 2010. In addition to the pending

| THE HANOVER INSURANCE GROUP 2013 ANNUAL REPORT128
claim challenging the calculation of lump sum distribu-tions, the Amended Complaint included: (a) a claim thatthe Plan failed to calculate participants’ account balancesand lump sum payments properly because interest creditswere based solely upon the performance of each partici-pant’s selection from among various hypothetical invest-ment options (as the Plan provided) rather than creditingthe greater of that performance or the 30 year Treasuryrate; (b) a claim that the 2004 Plan amendment, whichchanged interest crediting for all participants from the per-formance of participant’s investment selections to the 30year Treasury rate, reduced benefits in violation of theEmployee Retirement Income Security Act of 1974(“ERISA”) for participants who had account balances as ofthe amendment date by not continuing to provide themperformance-based interest crediting on those balances;and (c) claims against the Company for breach of fiduciaryduty and ERISA notice requirements arising from the var-ious interest crediting and lump sum distribution mattersof which plaintiffs complain. On March 31, 2011, theDistrict Court granted the Company and the Plan’s Motionto Dismiss on statute of limitations grounds the additionalclaims set forth in (a) and (b) above, however, in responseto a motion for reconsideration, the Court allowed the newbreach of fiduciary duty claim to stand, but only as toplaintiffs’ “whipsaw” claim that remained in the case. OnJune 22, 2012, the Company and the Plan filed a PartialMotion for Summary Judgment to dismiss the “whipsaw”claim of one of the named plaintiffs who received his lumpsum distribution after December 31, 2003. On October 2,2013, the Court granted the Company and the Plan’sPartial Motion for Summary Judgment and dismissed withprejudice the “whipsaw” claim of the named plaintiff whoreceived a lump sum distribution after December 31, 2003and the similar claims of the putative class members hesought to represent. On December 17, 2013, the Courtentered an order certifying a class to bring “whipsaw” andrelated breach of fiduciary duty claims consisting of allpersons who received a lump sum distribution betweenMarch 1, 1997 and December 31, 2003, and a subclass tobring such claims consisting of all persons who receivedlump sum distributions between March 1, 1997 andMarch 12, 2002. On December 17, 2013, the Court alsogranted plaintiffs’ motion for entry of a final order allowingan immediate appeal by the two named plaintiffs added inthe Amended Complaint of their dismissed claims that the2004 Plan amendment reduced benefits in violation of
ERISA, and for one of them, that his post-2003 lump sumdistribution should have been greater. On January 14,2014, the Company filed a Motion to Alter or Amend theCourt’s December 17, 2013 Order requesting that theCourt reverse its order making the dismissed claims finaland appealable or, in the alternative, stay merits discoveryon the claims remaining in the district court pending reso-lution of the dismissed plaintiffs’ appeal. The Court hasnot yet ruled on that motion.At this time, the Company is unable to provide a reason-
able estimate of the potential range of ultimate liability ifthe outcome of the suit is unfavorable. The extent to whichany of the plaintiffs’ multiple theories of liability, some ofwhich are overlapping and others of which are quite com-plex and novel, are accepted and upheld on appeal will sig-nificantly affect the Plan’s or the Company’s potentialliability. The statute of limitations applicable to the classhas not yet been finally determined and the extent ofpotential liability, if any, will depend on this final determi-nation. In addition, assuming for these purposes that theplaintiffs prevail with respect to claims that benefitsaccrued or payable under the Plan were understated, thenthere are numerous possible theories and other variablesupon which any revised calculation of benefits as request-ed under plaintiffs’ claims could be based. Any adversejudgment in this case against the Plan would be expectedto create a liability for the Plan, with resulting effects onthe Plan’s assets available to pay benefits. The Company’sfuture required funding of the Plan could also be impact-ed by such a liability.
OTHER MATTERS
The Company has been named a defendant in variousother legal proceedings arising in the normal course ofbusiness. In addition, the Company is involved, from timeto time, in examinations, investigations and proceedings bygovernmental and self-regulatory agencies. The potentialoutcome of any such action or regulatory proceedings inwhich the Company has been named a defendant or thesubject of an inquiry or investigation, and its ultimate lia-bility, if any, from such action or regulatory proceedings, isdifficult to predict at this time. The ultimate resolutions ofsuch proceedings are not expected to have a material effecton its financial position, although they could have a mate-rial effect on the results of operations for a particular quar-ter or annual period.

THE HANOVER INSURANCE GROUP 2013 ANNUAL REPORT | 129
RESIDUAL MARKETS
The Company is required to participate in residual marketsin various states, which generally pertain to high riskinsureds, disrupted markets or lines of business or geo-graphic areas where rates are regarded as excessive. Theresults of the residual markets are not subject to the pre-dictability associated with the Company’s own managedbusiness, and are significant to both the personal and com-mercial automobile lines of business, the workers’ compen-sation line of business, and the homeowners line ofbusiness.
19. STATUTORY FINANCIAL INFORMATION
The Company’s U.S. insurance subsidiaries are required tofile annual statements with state regulatory authoritiesprepared on an accounting basis prescribed or permittedby such authorities (statutory basis), as codified by theNational Association of Insurance Commissioners.Permitted statutory accounting practices encompass allaccounting practices that are not prescribed; such prac-tices differ from state to state, may differ from company tocompany within a state, and may change in the future. TheCompany’s U.S. insurance subsidiaries did not have anypermitted practices as of or for the years ended December31, 2013, 2012 and 2011.Statutory capital and surplus differs from shareholders’
equity reported in accordance with generally acceptedaccounting principles primarily because under the statuto-ry basis of accounting, deferred acquisition costs areexpensed when incurred, the recognition of deferred taxassets is based on different recoverability assumptions andprior to 2013, postretirement benefit costs were based ondifferent participant assumptions.The following table provides statutory net income for
the year ended December 31 and statutory capital and sur-plus as of December 31 for the periods indicated:
2013 2012 2011
(in millions)
Statutory Net Income (Loss)U.S. Insurance Subsidiaries $ 193.2 $ (47.3) $ (5.2)
Statutory Capital and SurplusU.S. Insurance Subsidiaries $1,834.3 $1,523.4 $1,582.8
The minimum statutory capital and surplus necessary tosatisfy the Company’s regulatory requirements was $354.5million, $329.0 million and $291.0 million, which equalsthe Authorized Control Level at December 31, 2013, 2012and 2011, respectively.
20. QUARTERLY RESULTS OF OPERATIONS(UNAUDITED)
The quarterly results of operations for 2013 and 2012 aresummarized below.
THREE MONTHS ENDED
(in millions, except per share data)
2013 March 31 June 30 Sept. 30 Dec. 31
Total revenues $1,180.3 $1,182.6 $1,201.8 $1,229.0Income from
continuing operations $ 66.4 $ 53.1 $ 61.3 $ 64.9Net income $ 66.2 $ 53.4 $ 61.3 $ 70.1Income from
continuing operations per share:
Basic $ 1.49 $ 1.21 $ 1.40 $ 1.48Diluted $ 1.47 $ 1.19 $ 1.37 $ 1.45
Net income per share:Basic $ 1.49 $ 1.21 $ 1.40 $ 1.60Diluted $ 1.46 $ 1.19 $ 1.37 $ 1.57
Dividends declared per share $ 0.33 $ 0.33 $ 0.33 $ 0.37
THREE MONTHS ENDED
(in millions, except per share data)
2012 March 31 June 30 Sept. 30 Dec. 31
Total revenues $ 1,121.8 $ 1,127.2 $ 1,157.7 $ 1,184.0Income (loss) from
continuing operations $ 50.7 $ 9.8 $ 40.9 $ (55.3)Net income (loss) $ 49.7 $ 20.8 $ 40.4 $ (55.0)Income (loss) from
continuing operations per share:
Basic $ 1.13 $ 0.22 $ 0.92 $ (1.24)Diluted(1) $ 1.11 $ 0.22 $ 0.90 $ (1.24)
Net income (loss) per share:
Basic $ 1.11 $ 0.46 $ 0.91 $ (1.24)Diluted(1) $ 1.09 $ 0.46 $ 0.89 $ (1.24)
Dividends declared per share $ 0.30 $ 0.30 $ 0.30 $ 0.33
(1) Per diluted share amounts in the fourth quarter of 2012 exclude common stockequivalents, since the impact of these instruments was antidilutive.
Due to the use of weighted average shares outstandingwhen calculating earnings per common share, the sum ofthe quarterly per common share data may not equal theper common share data for the year.
21. SUBSEQUENT EVENTS
There were no subsequent events requiring adjustment tothe financial statements and no additional disclosuresrequired in the notes to the consolidated financial statements.

| THE HANOVER INSURANCE GROUP 2013 ANNUAL REPORT130
Item 9 — Changes in and Disagreementswith Accountants on Accountingand Financial Disclosure
None.
Item 9A — Controls and ProceduresDISCLOSURE CONTROLS AND PROCEDURESEVALUATION
Under the supervision and with the participation of ourmanagement, including our Chief Executive Officer andChief Financial Officer, we conducted an evaluation of ourdisclosure controls and procedures, as such term is definedunder Rule 13a-15(e) promulgated under the SecuritiesExchange Act of 1934, as amended (the Exchange Act).
LIMITATIONS ON THE EFFECTIVENESS OF CONTROLS
Our management, including our Chief Executive Officerand Chief Financial Officer, does not expect that our dis-closure controls over financial reporting will prevent allerror and all fraud. A control system, no matter how welldesigned and operated, can provide only reasonable, notabsolute, assurance that the control system’s objectiveswill be met. Further, the design of a control system mustreflect the fact that there are resource constraints, and thebenefits of controls must be considered relative to theircosts. Because of the inherent limitations in all control sys-tems, no evaluation of controls can provide absolute assur-ance that all control issues and instances of fraud, if any,have been detected. These inherent limitations include therealities that judgments in decision-making can be faultyand that breakdowns can occur because of simple error ormistake. Controls can also be circumvented by the individ-ual acts of some persons, by collusion of two or more peo-ple, or by management override of the controls. The designof any system of controls is based in part on certainassumptions about the likelihood of future events, andthere can be no assurance that any design will succeed inachieving its stated goals under all potential future condi-tions. Over time, controls may become inadequate becauseof changes in conditions or deterioration in the degree ofcompliance with policies or procedures. Because of theinherent limitations in a cost-effective control system, mis-statements due to error or fraud may occur and not bedetected.
CONCLUSION REGARDING THE EFFECTIVENESS OFDISCLOSURE CONTROLS AND PROCEDURES
Based on our controls evaluation, our Chief ExecutiveOfficer and Chief Financial Officer concluded that as ofthe end of the period covered by this annual report, ourdisclosure controls and procedures were effective to pro-
vide reasonable assurance that (i) the information requiredto be disclosed by us in reports that we file or submit underthe Exchange Act is recorded, processed, summarized andreported within the time periods specified in the SEC’srules and forms and (ii) material information is accumulat-ed and communicated to our management, including ourChief Executive Officer and Chief Financial Officer, asappropriate to allow timely decisions regarding requireddisclosure.
MANAGEMENT’S REPORT ON INTERNAL CONTROL OVERFINANCIAL REPORTING
Our management is responsible for establishing and main-taining adequate internal control over financial reporting,as such term is defined in Exchange Act Rule 13a-15(f).Under the supervision and with the participation of ourmanagement, including our Chief Executive Officer andChief Financial Officer, we conducted an evaluation of theeffectiveness of our internal control over financial report-ing based on the original framework in Internal Control –Integrated Framework issued in 1992 by the Committee ofSponsoring Organizations of the Treadway Commission.Based on our evaluation under the framework in InternalControl – Integrated Framework, our management con-cluded that our internal control over financial reportingwas effective as of December 31, 2013.The effectiveness of our internal control over financial
reporting as of December 31, 2013 has been audited byPricewaterhouseCoopers LLP, an independent registeredpublic accounting firm, as stated in their report which isincluded herein.
CHANGES IN INTERNAL CONTROL
Our management, including the Chief Executive Officerand the Chief Financial Officer, conducted an evaluationof the internal control over financial reporting, as requiredby Rule 13a-15(d) of the Exchange Act, to determinewhether any changes occurred during the period coveredby this Annual Report on Form 10-K that have materiallyaffected, or are reasonably likely to materially affect, ourinternal control over financial reporting. Based on thatevaluation, the Chief Executive and Chief FinancialOfficer concluded that there was no such change duringthe last quarter of the fiscal year covered by this AnnualReport on Form 10-K that has materially affected, or is rea-sonably likely to materially affect, our internal control overfinancial reporting.
Item 9B — Other InformationNone.

Item 10 — Directors, Executive Officersand Corporate Governance
DIRECTORS OF THE REGISTRANT
Except for the portion about executive officers and ourCode of Conduct which is set forth below, this informationis incorporated herein by reference from the ProxyStatement for the Annual Meeting of Shareholders to beheld on May 20, 2014 to be filed pursuant to Regulation14A under the Securities Exchange Act of 1934.
EXECUTIVE OFFICERS OF THE REGISTRANT
Set forth below is biographical information concerning ourexecutive officers.
Mark R. Desrochers, 45Senior Vice PresidentPresident, Personal LinesMr. Desrochers has been President, Personal Lines
since 2009. From 2006 until 2009, Mr. Desrochers wasVice President, State Management. Prior to joining THG,from 2003 until 2006, Mr. Desrochers held several posi-tions with Liberty Mutual Insurance Company, last servingas Vice President and Product Manager. Previously, Mr.Desrochers worked at Electric Insurance Company and atApplied Insurance Research.
Frederick H. Eppinger, Jr., 55DirectorPresident and Chief Executive OfficerMr. Eppinger has been Director, President and Chief
Executive Officer of THG since joining the Company in2003. Before joining the Company, Mr. Eppinger wasExecutive Vice President of Property and Casualty Fieldand Service Operations for The Hartford FinancialServices Group, Inc. Prior to that, he was Senior VicePresident of Strategic Marketing from 2000 to 2001 forChannelPoint, Inc., a firm that provided business-to-busi-ness technology for insurance and financial service compa-nies, and was a senior partner at the internationalconsulting firm of McKinsey & Company. Mr. Eppinger ledthe insurance practice at McKinsey, where he workedclosely with chief executive officers of many leading insur-ers over a period of 15 years, beginning in 1985. Mr.Eppinger began his career as an accountant with the firmthen known as Coopers & Lybrand. He is a director ofCentene Corporation, a publicly traded, multi-line health-care company. Mr. Eppinger is an employee of THG, andtherefore is not an independent director. Mr. Eppinger’sterm of office as a director of THG expires in 2016.
David B. Greenfield, 51Executive Vice PresidentChief Financial Officer and Principal Accounting OfficerMr. Greenfield has served as Executive Vice President,
Chief Financial Officer and Principal Accounting Officersince March 2011. Prior to that, from December 2010 toMarch 2011, he served as Executive Vice President, SeniorFinance Officer. Prior to joining the Company, Mr.Greenfield served as the Chief Financial Officer of AxisCapital Holdings Limited from 2006 until 2010. From1984 to 2006, Mr. Greenfield worked for KPMG LLP,where he advanced to partnership serving as KPMG’sGlobal Sector Chair for Insurance and a member ofKPMG’s Global Financial Services Leadership Team.
J. Kendall Huber, 59Executive Vice PresidentGeneral Counsel and Assistant SecretaryMr. Huber has been General Counsel and Assistant
Secretary since joining THG in 2000. Prior to joiningTHG, Mr. Huber was Executive Vice President, GeneralCounsel and Secretary of Promus Hotel Corporation from1999 to 2000. Previously, Mr. Huber was Vice Presidentand Deputy General Counsel of Legg Mason, Inc. from1998 to 1999, and of USF&G Corporation, where he wasemployed from 1990 to 1998. Mr. Huber was previouslywith the law firm now known as DLA Piper and aLieutenant, U.S. Navy Judge Advocate General’s Corps.
Richard Lavey, 46Senior Vice President, Chief Marketing and Distribution OfficerMr. Lavey has been Chief Marketing and Distribution
Officer of THG since 2011. Mr. Lavey joined THG in 2004and during this time has also served in the following roles:Senior Vice President, Operations and Marketing;Regional President, Northeast; and Vice President, FieldOperations and Marketing & Distribution. Prior to joiningthe Company, Mr. Lavey worked for The HartfordFinancial Services Group, Inc. and The Travelers Corp.
Andrew S. Robinson, 48Executive Vice President, Corporate DevelopmentPresident, Specialty InsuranceMr. Robinson has been President, Specialty Insurance
since November 2011, Chief Risk Officer since 2010 andhas led THG’s Corporate Development Department sincejoining the Company in 2006. From 2009 to 2011, Mr.Robinson was President, Specialty Casualty. Prior to join-ing the Company, from 1996 until 2006, Mr. Robinsonheld a variety of positions at Diamond Consultants, lastserving as Managing Director, Global Insurance Practice.
PART III
THE HANOVER INSURANCE GROUP 2013 ANNUAL REPORT | 131

| THE HANOVER INSURANCE GROUP 2013 ANNUAL REPORT132
John C. Roche, 50Executive Vice PresidentPresident, Business InsuranceMr. Roche has been Executive Vice President, President
Business Insurance since May 2013. Prior to that heserved as Senior Vice President, President BusinessInsurance from 2009 to 2013. From 2007 to 2009, Mr.Roche served as Vice President, Field Operations and from2006 to 2007, Mr. Roche was Vice President,Underwriting and Product Management, CommercialLines. From 1994 to 2006, Mr. Roche served in a varietyof leadership positions at St. Paul Travelers Companies,Inc., last serving as Vice President, Commercial Accounts.Previously, Mr. Roche served in a variety of underwritingand management positions at Fireman’s Fund InsuranceCompany and Atlantic Mutual Insurance Company.
Robert Stuchbery, 57President of International OperationsChief Executive Officer, ChaucerMr. Stuchbery has been Chief Executive Officer of
Chaucer since January 2010. Prior to his appointment asCEO, Mr. Stuchbery served as Chaucer’s ChiefUnderwriting Officer from 2005 to 2009, and as GroupUnderwriting Director from 2000 to 2005. He was ActiveUnderwriter for Syndicate 1096 from 1996 to 2000 andprior to that was Deputy Underwriter of Syndicate 1096from 1988 to 1996. Before joining Chaucer in 1988, Mr.Stuchbery served in various positions with the U.K. sub-sidiary of CNA Reinsurance of London Limited from 1976to 1987. Mr. Stuchbery is a Fellow of the CharteredInsurance Institute and a member of the Lloyd’s MarketAssociation Board where he currently serves as DeputyChairman.
Gregory D. Tranter, 57Executive Vice PresidentChief Information Officer and Chief Operations OfficerMr. Tranter joined the Company in 1998, has been
Chief Information Officer since 2000 and ChiefOperations Officer since 2007. Prior to joining THG, Mr.Tranter was Vice President, Automation Strategy ofTravelers Property and Casualty Company from 1996 to1998. Mr. Tranter was employed by Aetna Life andCasualty Company from 1983 to 1996.
Mark Welzenbach, 54Senior Vice President, Chief Claims OfficerMr. Welzenbach has been Chief Claims Officer of THG
since joining the Company in 2005. Before joining theCompany, Mr. Welzenbach was Senior Vice President,Claims for The Hartford Financial Services Group, Inc.from 1995 to 2005. Prior to that, he was Director of Claimsfrom 1991 to 1995 for Travelers Insurance Company. Mr.Welzenbach began his career as a practicing attorney.
OTHER SENIOR CORPORATE OFFICERS OF THE REGISTRANT
Ann K. Tripp, 55Senior Vice President, Chief Investment OfficerPresident, Opus Investment Management, Inc.Ms. Tripp has been Chief Investment Officer and
President of Opus Investment Management, Inc. since2006. She joined the Company in 1987, and prior to becom-ing our Chief Investment Officer, served in a variety ofincreasingly senior roles within our investment department.
Pursuant to section 4.4 of the Company’s by-laws, eachofficer shall hold office until the first meeting of the Boardof Directors following the next annual meeting of theshareholders and until his or her respective successor ischosen and qualified unless a shorter period shall havebeen specified by the terms of his or her election orappointment, or in each case until such officer soonerdies, resigns, is removed or becomes disqualified.
ANNUAL MEETING OF SHAREHOLDERS
The Board of Directors of THG have scheduled the 2014Annual Meeting of Shareholders for May 20, 2014. Therecord date for determining the shareholders of theCompany entitled to notice of and to vote at such AnnualMeeting is March 25, 2014.
CODE OF CONDUCT
Our Code of Conduct is available, free of charge, on ourwebsite at www.hanover.com under “About Us - CorporateGovernance”. The Code of Conduct applies to our direc-tors, officers and employees, including our Chief ExecutiveOfficer, Chief Financial Officer and Controller. While wedo not expect to grant waivers to our Code of Conduct, anysuch waivers to our Chief Executive Officer, ChiefFinancial Officer or Controller will be posted on our web-site at www.hanover.com, as required by applicable law orNew York Stock Exchange requirements. A printed copy ofthe Code of Conduct will be provided free of charge bycontacting the Company’s Corporate Secretary at theCompany’s headquarters, 440 Lincoln Street, Worcester,MA 01653.
Item 11 — Executive CompensationIncorporated herein by reference from the ProxyStatement for the Annual Meeting of Shareholders to beheld May 20, 2014, to be filed pursuant to Regulation 14Aunder the Securities Exchange Act of 1934.

Item 12 — Security Ownership of CertainBeneficial Owners andManagement and RelatedStockholder Matters
Securities Authorized for Issuance Under Equity Compensation PlansThe following table sets forth information as of December31, 2013 with respect to compensation plans under whichequity securities of the Company are authorized forissuance.
Additional information related to Security Ownership ofCertain Beneficial Owners and Management is incorporat-ed herein by reference from the Proxy Statement for theAnnual Meeting of Shareholders to be held May 20, 2014,to be filed pursuant to Regulation 14A under theSecurities Exchange Act of 1934.
Item 13 — Certain Relationships andRelated Transactions, andDirector Independence
Incorporated herein by reference from the ProxyStatement for the Annual Meeting of Shareholders to beheld May 20, 2014, to be filed pursuant to Regulation 14Aunder the Securities Exchange Act of 1934.
Item 14 — Principal Accounting Fees and Services
Incorporated herein by reference from the ProxyStatement for the Annual Meeting of Shareholders to beheld May 20, 2014, to be filed pursuant to Regulation 14Aunder the Securities Exchange Act of 1934.
Number of securities Number of securities to be issued upon exercise Weighted-average exercise remaining available for
of outstanding options, price of outstanding future issuance underPlan Category warrants and rights(1) options, warrants and rights equity compensation plans(2)
Equity compensation plans approved by security holders 2,864,012 $ 41.18 1,033,786Equity compensation plans not approved by security holders — — —
Total 2,864,012 $ 41.18 1,033,786
(1) Includes 814,839 shares of Common Stock which may be issued upon vesting of outstanding restricted stock, restricted stock units, performance-based restricted stock units(assuming the maximum award amount), or market-based restricted stock units. The weighted-average exercise price does not take these awards into account.
(2) The Hanover Insurance Group, Inc. 2006 Long-Term Incentive Plan (the “Plan”), which was adopted on May 16, 2006, authorized the issuance of 3,000,000 new shares thatmay be used for awards. In addition, shares of stock underlying any award granted and outstanding under the Company’s Amended Long-Term Stock Incentive Plan (the “1996Plan”) as of the adoption date of the Plan that are forfeited, cancelled, expire or terminate after the adoption date without the issuance of stock, become available for futuregrants under the Plan.
THE HANOVER INSURANCE GROUP 2013 ANNUAL REPORT | 133

| THE HANOVER INSURANCE GROUP 2013 ANNUAL REPORT134
Item 15 — Exhibits, Financial Statement Schedules
(A)(1) FINANCIAL STATEMENTS
The consolidated financial statements and accompanying notes thereto are included on pages 84 to 129 of this Form10-K.
Page No. in this Report
Report of Independent Registered Public Accounting Firm . . . . . . . . . . . . . . . . . . . . . . . . . . . . . . . . . . . . . . . . . . . . 84
Consolidated Statements of Income for the years ended December 31, 2013, 2012 and 2011 . . . . . . . . . . . . . . . . . 85
Consolidated Statements of Comprehensive Income for the years ended December 31, 2013, 2012 and 2011. . . . . 86
Consolidated Balance Sheets as of December 31, 2013 and 2012 . . . . . . . . . . . . . . . . . . . . . . . . . . . . . . . . . . . . . . . 87
Consolidated Statements of Shareholders’ Equity for the years ended December 31, 2013, 2012 and 2011 . . . . . . . 88
Consolidated Statements of Cash Flows for the years ended December 31, 2013, 2012 and 2011 . . . . . . . . . . . . . . 89
Notes to Consolidated Financial Statements . . . . . . . . . . . . . . . . . . . . . . . . . . . . . . . . . . . . . . . . . . . . . . . . . . . . . . . 90
(A)(2) FINANCIAL STATEMENT SCHEDULES
Page No. in this Report
I Summary of Investments – Other than Investments in Related Parties . . . . . . . . . . . . . . . . . . . . . . . . . . . . . . . . 141
II Condensed Financial Information of Registrant . . . . . . . . . . . . . . . . . . . . . . . . . . . . . . . . . . . . . . . . . . . . . . . . . 142
III Supplementary Insurance Information . . . . . . . . . . . . . . . . . . . . . . . . . . . . . . . . . . . . . . . . . . . . . . . . . . . . . . . . 145
IV Reinsurance. . . . . . . . . . . . . . . . . . . . . . . . . . . . . . . . . . . . . . . . . . . . . . . . . . . . . . . . . . . . . . . . . . . . . . . . . . . . . 146
V Valuation and Qualifying Accounts . . . . . . . . . . . . . . . . . . . . . . . . . . . . . . . . . . . . . . . . . . . . . . . . . . . . . . . . . . . 147
VI Supplemental Information Concerning Property and Casualty Insurance Operations. . . . . . . . . . . . . . . . . . . . . 148
PART IV

(A)(3) EXHIBIT INDEX
2.1 Stock Purchase Agreement, dated as of August 22,2005, between The Goldman Sachs Group, Inc.,as Buyer, and Registrant, as Seller (the schedulesand exhibits have been omitted pursuant to Item601(b)(2) of Regulation S-K) previously filed asExhibit 2.1 to the Registrant’s Current Report onForm 8-K filed with the Commission on August24, 2005 and incorporated herein by reference.
2.2 Stock Purchase Agreement by and between theRegistrant and Commonwealth Annuity and LifeInsurance Company, dated July 30, 2008 (theschedules and exhibits have been omitted pur-suant to Item 601(b)(2) of Regulation S-K), previ-ously filed as Exhibit 2.1 to the Registrant’sCurrent Report on Form 8-K filed with theCommission on August 4, 2008 and incorporatedherein by reference.
3.1 Certificate of Incorporation of the Registrant pre-viously filed as Exhibit 3.1 to the Registrant’sAnnual Report on Form 10-K filed with theCommission on March 16, 2006 and incorporatedherein by reference.
3.2 Amended By-Laws of the Registrant, previouslyfiled as Exhibit 3.2 to the Registrant’s CurrentReport on Form 8-K filed with the Commission onNovember 21, 2006 and incorporated herein byreference.
4.1 Specimen Certificate of Common Stock previous-ly filed as Exhibit 4 to the Registrant’s AnnualReport on Form 10-K filed with the Commissionon March 16, 2006 and incorporated herein byreference.
4.2 Form of Indenture relating to the Debenturesbetween the Registrant and State Street Bank &Trust Company, as trustee, previously filed asExhibit 4.1 to the Registrant’s RegistrationStatement on Form S-1 (No. 33-96764) filed withthe Commission on September 11, 1995 andincorporated herein by reference.
4.3 Form of Global Debenture previously filed asExhibit 4.2 to the Registrant’s Annual Report onForm 10-K filed with the Commission on March16, 2006 and incorporated herein by reference.
4.4 Indenture dated February 3, 1997 relating to theJunior Subordinated Debentures of the Registrantpreviously filed as Exhibit 3 to the Registrant’sCurrent Report on Form 8-K filed with theCommission on February 5, 1997 and incorporat-ed herein by reference.
4.5 First Supplemental Indenture dated July 30, 2009amending the indenture dated February 3, 1997relating to the Junior Subordinated Debentures ofthe Registrant previously filed as Exhibit 4.5 to theRegistrant’s Annual Report on Form 10-K filedwith the Commission on March 1, 2010 andincorporated herein by reference.
4.6 Form of Global Security representing$300,000,000 principal amount of JuniorSubordinated Debentures of the Registrant previ-ously filed as Exhibit 4.6 to the Registrant’sAnnual Report on Form 10-K filed with theCommission on March 1, 2010 and incorporatedherein by reference.
4.7 Indenture dated January 21, 2010, between theRegistrant and U.S. Bank National Association, astrustee, previously filed as Exhibit 4.1 to theRegistrant’s Registration Statement on Form S-3ASR (No. 333-164446) filed with the Commissionon January 21, 2010 and incorporated herein byreference.
4.8 First Supplemental Indenture and Form of GlobalNote dated February 23, 2010, related to theNotes of the Registrant, between the Registrantand U.S. Bank National Association, as trustee,previously filed as Exhibit 4.1 to the Registrant’sCurrent Report on Form 8-K filed with theCommission on February 23, 2010 and incorpo-rated herein by reference.
4.9 Second Supplemental Indenture dated as of June17, 2011, between U.S. Bank National Associ -ation, as trustee, including the form of GlobalNote attached as Annex A thereto, supplementingthe Indenture dated as of January 21, 2010, previ-ously filed as Exhibit 4.1 to the Registrant’sCurrent Report on Form 8-K filed with theCommission on June 17, 2011 and incorporatedherein by reference.
4.10 Indenture, dated as of March 20, 2013, by andbetween the Registrant and U.S. Bank NationalAssociation previously filed as Exhibit 4.1 to theRegistrant’s Registration Statement No: 333-187373 on Form S-3 as filed with the Commissionon March 20, 2013 and incorporated herein byreference.
THE HANOVER INSURANCE GROUP 2013 ANNUAL REPORT | 135

| THE HANOVER INSURANCE GROUP 2013 ANNUAL REPORT136
+10.6 Form of Amended and Restated Non-QualifiedStock Option Agreement under The HanoverInsurance Group, Inc. Amended Long-Term StockIncentive Plan previously filed as Exhibit 10.7 tothe Registrant’s Current Report on Form 8-K filedwith the Commission on February 21, 2007 andincorporated herein by reference.
+10.7 Amendment to Outstanding Stock Options Issuedunder the Registrant’s 2006 Long-Term IncentivePlan and Amended Long-Term Stock IncentivePlan previously filed as Exhibit 10.3 to theRegistrant’s Quarterly Report on Form 10-Q filedwith the Commission on November 8, 2011 andincorporated herein by reference.
+10.8 The Hanover Insurance Group 2006 Long-TermIncentive Plan, as amended, previously filed asAnnex I to the Registrant’s Proxy Statement filedwith the Commission on March 29, 2012 andincorporated herein by reference.
+10.9 Form of Non-Qualified Stock Option Agreementunder The Hanover Insurance Group, Inc. 2006Long-Term Incentive Plan previously filed asExhibit 10.1 to the Registrant’s Current Report onForm 8-K filed with the Commission on February21, 2007 and incorporated herein by reference.
+10.10 Form of Non-Qualified Stock Option Agreementunder The Hanover Insurance Group, Inc. 2006Long-Term Incentive Plan previously filed asExhibit 10.33 to the Registrant’s Annual Report onForm 10-K filed with the Commission on February27, 2009 and incorporated herein by reference.
+10.11 Form of Non-Qualified Stock Option Agreementunder the 2006 Long-Term Incentive Plan previ-ously filed as Exhibit 10.2 to the Registrant’sQuarterly Report on Form 10-Q filed with theCommission on November 8, 2011 and incorpo-rated herein by reference.
+10.12 Form of Non-Qualified Stock Option Agreementunder The Hanover Insurance Group, Inc. 2006Long-Term Incentive Plan previously filed asExhibit 10.38 to the Registrant’s Annual Report onForm 10-K filed with the Commission on February26, 2013 and incorporated herein by reference.
+10.13 Form of Restricted Stock Unit Agreement underThe Hanover Insurance Group, Inc. 2006 Long-Term Incentive Plan previously filed as Exhibit10.31 to the Registrant’s Annual Report on Form10-K filed with the Commission on February 27,2009 and incorporated herein by reference.
4.11 First Supplemental Indenture dated as of March27, 2013, between U.S. Bank National Associa -tion, as trustee, supplementing the Indenturedated as of March 20, 2013 previously filed asExhibit 4.1 to the Registrant’s Current Report onForm 8-K filed with the Commission on March27, 2013 and incorporated herein by reference.
4.12 Form of Security Certificate representing the6.35% Subordinated Debentures due 2053 previ-ously filed as Exhibit 4.2 to the Registrant’sCurrent Report on Form 8-K filed with theCommission on March 27, 2013 and incorporatedherein by reference.
Management agrees to furnish the Securities andExchange Commission, upon request, a copy ofany other agreements or instruments of theRegistrant and its subsidiaries defining the rightsof holders of any non-registered debt whoseauthorized principal amount does not exceed 10%of Registrant’s total consolidated assets.
+10.1 State Mutual Life Assurance Company of AmericaExcess Benefit Retirement Plan previously filed asExhibit 10.5 to the Registrant’s RegistrationStatement on Form S-1 (No. 33-91766) filed withthe Commission on May 1, 1995 and incorporat-ed herein by reference.
+10.2 The Hanover Insurance Group Cash BalancePension Plan, as amended.
+10.3 The Hanover Insurance Group Retirement SavingsPlan, as amended, previously filed as Exhibit 10.2to the Registrant’s Quarterly Report on Form 10-Q filed with the Commission on August 1,2013 and incorporated herein by reference.
+10.4 The Hanover Insurance Group, Inc. Amended andRestated Non-Qualified Retirement Savings Plan,previously filed as Exhibit 10.30 to theRegistrant’s Annual Report on Form 10-K filedwith the Commission on February 24, 2011 andincorporated herein by reference.
+10.5 The Hanover Insurance Group, Inc. AmendedLong-Term Stock Incentive Plan previously filedas Exhibit 10.23 to the Registrant’s Annual Reporton Form 10-K filed with the Commission on April1, 2002 and incorporated herein by reference.

+10.14 Form of Restricted Stock Unit Agreement underThe Hanover Insurance Group, Inc. 2006 Long-Term Incentive Plan previously filed as Exhibit10.40 to the Registrant’s Annual Report on Form10-K filed with the Commission on February 26,2013 and incorporated herein by reference.
+10.15 Form of Performance-Based Restricted Stock UnitAgreement under The Hanover Insurance Group,Inc. 2006 Long-Term Incentive Plan previouslyfiled as Exhibit 10.32 to the Registrant’s AnnualReport on Form 10-K filed with the Commissionon February 27, 2009 and incorporated herein byreference.
+10.16 Form of Performance-Based Restricted Stock UnitAgreement under The Hanover Insurance Group,Inc. 2006 Long-Term Incentive Plan previouslyfiled as Exhibit 10.39 to the Registrant’s AnnualReport on Form 10-K filed with the Commissionon February 26, 2013 and incorporated herein byreference.
+10.17 Form of Restricted Stock Agreement under the2006 Long-Term Incentive Plan previously filed asExhibit 10.40 to the Registrant’s Annual Report onForm 10-K filed with the Commission on February29, 2012 and incorporated herein by reference.
+10.18 The Hanover Insurance Group, Inc. 2009 Short-Term Incentive Compensation Plan previously filedas Annex 2 to the Registrant’s Proxy Statement filedwith the Commission on March 27, 2009 andincorporated herein by reference.
+10.19 The Hanover Insurance Group Amended andRestated Employment Continuity Plan previouslyfiled as Exhibit 10.2 to the Registrant’s QuarterlyReport on Form 10-Q filed with the Commissionon August 11, 2008 and incorporated herein byreference.
+10.20 Letter Agreement between David Greenfield andthe Registrant dated January 20, 2011 regardinghis participation in The Hanover Insurance GroupAmended and Restated Employment ContinuityPlan previously filed as Exhibit 10.31 to theRegistrant’s Annual Report on Form 10-K filedwith the Commission on February 24, 2011 andincorporated herein by reference.
+10.21 Letter Agreement between Andrew Robinson andthe Registrant dated October 15, 2012 regardinghis participation in The Hanover Insurance GroupAmended and Restated Employment ContinuityPlan previously filed as Exhibit 10.1 to theRegistrant’s Current Report on Form 8-K filedwith the Commission on October 19, 2012 andincorporated herein by reference.
+10.22 Description of 2012 — 2013 Non-EmployeeDirector Compensation previously filed as Exhibit10.1 to the Registrant’s Quarterly Report on Form10-Q filed with the Commission on August 2,2012 and incorporated herein by reference.
+10.23 Description of 2013 — 2014 Non-EmployeeDirector Compensation previously filed as Exhibit10.1 to the Registrant’s Quarterly Report on Form10-Q filed with the Commission on August 1,2013 and incorporated herein by reference.
+10.24 The Hanover Insurance Group, Inc. Non-Employee Director Deferral Plan previously filedas Exhibit 10.28 to the Registrant’s Annual Reporton Form 10-K filed with the Commission onFebruary 27, 2009 and incorporated herein by reference.
+10.25 Offer Letter, dated August 14, 2003, between theRegistrant and Frederick H. Eppinger, Jr., asamended December 10, 2008 previously filed asExhibit 10.25 to the Registrant’s Annual Report onForm 10-K filed with the Commission on February27, 2009 and incorporated herein by reference.
+10.26 Offer Letter dated December 15, 2010 betweenDavid Greenfield and the Registrant previouslyfiled as Exhibit 10.1 to the Registrant’s CurrentReport on Form 8-K filed with the Commission onDecember 17, 2010 and incorporated herein byreference.
+10.27 Description of 2012 Named Executive OfficerShort-Term Incentive Compensation ProgramAwards, 2013 Named Executive Officer Short-Term Incentive Compensation Programs and 2013Named Executive Officer Long-Term IncentiveCompensation Programs previously filed as Item5.02 to the Registrant’s Current Report on Form8-K filed with the Commission on March 1, 2013and incorporated herein by reference.
THE HANOVER INSURANCE GROUP 2013 ANNUAL REPORT | 137
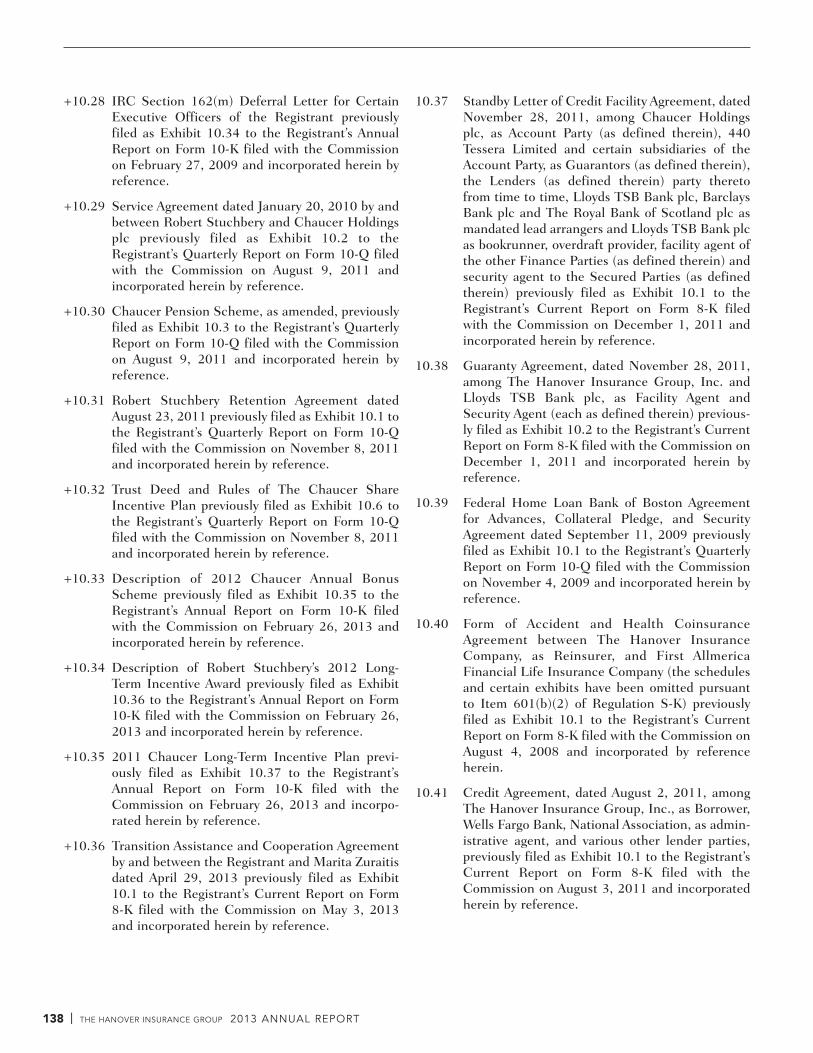
| THE HANOVER INSURANCE GROUP 2013 ANNUAL REPORT138
+10.28 IRC Section 162(m) Deferral Letter for CertainExecutive Officers of the Registrant previouslyfiled as Exhibit 10.34 to the Registrant’s AnnualReport on Form 10-K filed with the Commissionon February 27, 2009 and incorporated herein byreference.
+10.29 Service Agreement dated January 20, 2010 by andbetween Robert Stuchbery and Chaucer Holdingsplc previously filed as Exhibit 10.2 to theRegistrant’s Quarterly Report on Form 10-Q filedwith the Commission on August 9, 2011 andincorporated herein by reference.
+10.30 Chaucer Pension Scheme, as amended, previouslyfiled as Exhibit 10.3 to the Registrant’s QuarterlyReport on Form 10-Q filed with the Commissionon August 9, 2011 and incorporated herein by reference.
+10.31 Robert Stuchbery Retention Agreement datedAugust 23, 2011 previously filed as Exhibit 10.1 tothe Registrant’s Quarterly Report on Form 10-Qfiled with the Commission on November 8, 2011and incorporated herein by reference.
+10.32 Trust Deed and Rules of The Chaucer ShareIncentive Plan previously filed as Exhibit 10.6 tothe Registrant’s Quarterly Report on Form 10-Qfiled with the Commission on November 8, 2011and incorporated herein by reference.
+10.33 Description of 2012 Chaucer Annual BonusScheme previously filed as Exhibit 10.35 to theRegistrant’s Annual Report on Form 10-K filedwith the Commission on February 26, 2013 andincorporated herein by reference.
+10.34 Description of Robert Stuchbery’s 2012 Long-Term Incentive Award previously filed as Exhibit10.36 to the Registrant’s Annual Report on Form10-K filed with the Commission on February 26,2013 and incorporated herein by reference.
+10.35 2011 Chaucer Long-Term Incentive Plan previ-ously filed as Exhibit 10.37 to the Registrant’sAnnual Report on Form 10-K filed with theCommission on February 26, 2013 and incorpo-rated herein by reference.
+10.36 Transition Assistance and Cooperation Agreementby and between the Registrant and Marita Zuraitisdated April 29, 2013 previously filed as Exhibit10.1 to the Registrant’s Current Report on Form8-K filed with the Commission on May 3, 2013and incorporated herein by reference.
10.37 Standby Letter of Credit Facility Agreement, datedNovember 28, 2011, among Chaucer Holdingsplc, as Account Party (as defined therein), 440Tessera Limited and certain subsidiaries of theAccount Party, as Guarantors (as defined therein),the Lenders (as defined therein) party theretofrom time to time, Lloyds TSB Bank plc, BarclaysBank plc and The Royal Bank of Scotland plc asmandated lead arrangers and Lloyds TSB Bank plcas bookrunner, overdraft provider, facility agent ofthe other Finance Parties (as defined therein) andsecurity agent to the Secured Parties (as definedtherein) previously filed as Exhibit 10.1 to theRegistrant’s Current Report on Form 8-K filedwith the Commission on December 1, 2011 andincorporated herein by reference.
10.38 Guaranty Agreement, dated November 28, 2011,among The Hanover Insurance Group, Inc. andLloyds TSB Bank plc, as Facility Agent andSecurity Agent (each as defined therein) previous-ly filed as Exhibit 10.2 to the Registrant’s CurrentReport on Form 8-K filed with the Commission onDecember 1, 2011 and incorporated herein by reference.
10.39 Federal Home Loan Bank of Boston Agreementfor Advances, Collateral Pledge, and SecurityAgreement dated September 11, 2009 previouslyfiled as Exhibit 10.1 to the Registrant’s QuarterlyReport on Form 10-Q filed with the Commissionon November 4, 2009 and incorporated herein byreference.
10.40 Form of Accident and Health CoinsuranceAgreement between The Hanover InsuranceCompany, as Reinsurer, and First AllmericaFinancial Life Insurance Company (the schedulesand certain exhibits have been omitted pursuantto Item 601(b)(2) of Regulation S-K) previouslyfiled as Exhibit 10.1 to the Registrant’s CurrentReport on Form 8-K filed with the Commission onAugust 4, 2008 and incorporated by referenceherein.
10.41 Credit Agreement, dated August 2, 2011, amongThe Hanover Insurance Group, Inc., as Borrower,Wells Fargo Bank, National Association, as admin-istrative agent, and various other lender parties,previously filed as Exhibit 10.1 to the Registrant’sCurrent Report on Form 8-K filed with theCommission on August 3, 2011 and incorporatedherein by reference.

10.42 Credit Agreement, dated November 12, 2013,among The Hanover Insurance Group, Inc., asBorrower, JPMorgan Chase Bank, N.A., as admin-istrative agent, and various other lender partiespreviously filed as Exhibit 10.1 to the Registrant’sCurrent Report on Form 8-K filed with theCommission on November 18, 2013 and incorpo-rated herein by reference.
10.43 Amendment and Restatement Agreement withAmended and Restated Standby Letter of CreditFacility Agreement, dated November 15, 2013,among Chaucer Holdings plc and the lendersparty thereto from time to time, Lloyds Bank plc,Barclays Bank PLC and The Royal Bank ofScotland plc as mandated lead arrangers andLloyds Bank plc as bookrunner, overdraft provider,facility agent of the other Finance Parties (asdefined therein) and security agent to the SecuredParties (as defined therein) previously filed asExhibit 10.2 to the Registrant’s Current Report onForm 8-K filed with the Commission onNovember 18, 2013 and incorporated herein byreference.
10.44 Guaranty Agreement, dated November 15, 2013,among The Hanover Insurance Group, Inc. andLloyds Bank plc, as Facility Agent and SecurityAgent (each as defined therein) previously filed asExhibit 10.3 to the Registrant’s Current Report onForm 8-K filed with the Commission onNovember 18, 2013 and incorporated herein byreference.
+10.45 Description of 2013 Named Executive OfficerShort-Term Incentive Compensation ProgramAwards, 2014 Named Executive Officer Short-Term Incentive Compensation Programs and 2014Named Executive Officer Long-Term IncentiveCompensation Programs previously filed as Item5.02 to the Registrant’s Current Report on Form8-K filed with the Commission on February 21,2014 and incorporated herein by reference.
12.1 Computation of Ratio of Earnings to FixedCharges
21 Subsidiaries of THG
23 Consent of Independent Registered PublicAccounting Firm
24 Power of Attorney
31.1 Certification of the Chief Executive Officer, pursuant to 15 U.S.C. 78m, 78o(d), as adoptedpursuant to section 302 of the Sarbanes-Oxley Actof 2002.
31.2 Certification of the Chief Financial Officer, pursuant to 15 U.S.C. 78m, 78o(d), as adoptedpursuant to section 302 of the Sarbanes-Oxley Actof 2002.
32.1 Certification of the Chief Executive Officer, pursuant to 18 U.S.C. Section 1350, as adoptedpursuant to section 906 of the Sarbanes-Oxley Actof 2002.
32.2 Certification of the Chief Financial Officer, pursuant to 18 U.S.C. Section 1350, as adoptedpursuant to section 906 of the Sarbanes-Oxley Actof 2002.
99.1 Internal Revenue Service Ruling dated April 15,1995 previously filed as Exhibit 99.1 to theRegistrant’s Registration Statement on Form S-1(No. 33-91766) filed with the Commission onMay 1, 1995 and incorporated herein by reference.
101 The following materials from The HanoverInsurance Group, Inc.’s Annual Report on Form10-K for the year ended December 31, 2013 for-matted in eXtensible Business ReportingLanguage (“XBRL”): (i) Consolidated Statementsof Income for the years ended December 31,2013, 2012 and 2011; (ii) ConsolidatedStatements of Comprehensive Income for theyears ended December 31, 2013, 2012 and 2011;(iii) Consolidated Balance Sheets at December 31,2013 and 2012; (iv) Consolidated Statements ofShareholders’ Equity for the years endedDecember 31, 2013, 2012 and 2011; (v)Consolidated Statements of Cash Flows for theyears ended December 31, 2013, 2012 and 2011;(vi) related notes to these consolidated financialstatements; and (vii) Financial StatementSchedules.
+ Management contract or compensatory plan or arrangement.
THE HANOVER INSURANCE GROUP 2013 ANNUAL REPORT | 139

| THE HANOVER INSURANCE GROUP 2013 ANNUAL REPORT140
SIGNATURES
Pursuant to the requirements of Section 13 or 15(d) of the Securities Exchange Act of 1934, the registrant hasduly caused this report to be signed on its behalf by the undersigned, thereunto duly authorized.
THE HANOVER INSURANCE GROUP, INC.Registrant
Date: February 24, 2014 By: /S/ FREDERICK H. EPPINGER, JR.Frederick H. Eppinger, Jr.,
President, Chief Executive Officer and Director
Pursuant to the requirements of the Securities Exchange Act of 1934, this report has been signed below by thefollowing persons on behalf of the registrant and in the capacities and on the dates indicated.
Date: February 24, 2014 By: /S/ FREDERICK H. EPPINGER, JR.Frederick H. Eppinger, Jr.,
President, Chief Executive Officer and Director
Date: February 24, 2014 By: /S/ DAVID B. GREENFIELDDavid B. Greenfield,
Executive Vice President, Chief Financial Officer and Principal Accounting Officer
Date: February 24, 2014 By: *Michael P. Angelini,
Chairman of the Board
Date: February 24, 2014 By: *Richard H. Booth,
Director
Date: February 24, 2014 By: *P. Kevin Condron,
Director
Date: February 24, 2014 By: *Neal F. Finnegan,
Director
Date: February 24, 2014 By: *David J. Gallitano,
Director
Date: February 24, 2014 By: *Wendell J. Knox,
Director
Date: February 24, 2014 By: *Robert J. Murray,
Director
Date: February 24, 2014 By: *Joseph R. Ramrath,
Director
Date: February 24, 2014 By: *Harriet T. Taggart,
Director
Date: February 24, 2014 *By: /S/ DAVID B. GREENFIELDDavid B. Greenfield,Attorney-in-fact

Schedule I The Hanover Insurance Group, Inc.
SUMMARY OF INVESTMENTS – OTHER THAN INVESTMENTS IN RELATED PARTIES
DECEMBER 31, 2013
(in millions)Amountat which
shown in theType of investment Cost(1) Value balance sheet
Fixed maturities:Bonds:
United States Government and agencies and authorities $ 992.1 $ 979.8 $ 979.8States, municipalities and political subdivisions 1,106.7 1,125.0 1,125.0Foreign governments 299.9 300.4 300.4Public utilities 556.5 582.2 582.2All other corporate bonds 3,851.9 3,975.1 3,975.1
Total fixed maturities 6,807.1 6,962.5 6,962.5
Equity securities:Common stocks:
Public utilities 92.6 95.3 95.3Banks, trust and insurance companies 10.3 10.4 10.4Industrial, miscellaneous and all other 229.5 268.8 268.8
Nonredeemable preferred stocks 34.1 55.7 55.7
Total equity securities 366.5 430.2 430.2
Mortgage loans on real estate 2.5 XXXXX 2.5Real estate 9.1 XXXXX 9.1Other long-term investments(2) 177.7 XXXXX 180.9Short-term investments 8.1 XXXXX 8.1
Total investments $7,371.0 $ XXXXX $7,593.3
(1) For equity securities, represents original cost, and for fixed maturities, original cost reduced by repayments and adjusted for amortization of premiums and accretion ofdiscounts.
(2) The cost of other long-term investments differs from the carrying value due to market value changes in the Company’s equity ownership of limited partnership investments.
THE HANOVER INSURANCE GROUP 2013 ANNUAL REPORT | 141

| THE HANOVER INSURANCE GROUP 2013 ANNUAL REPORT142
Schedule IIThe Hanover Insurance Group, Inc.
CONDENSED FINANCIAL INFORMATION OF REGISTRANTPARENT COMPANY ONLYSTATEMENTS OF INCOME
YEARS ENDED DECEMBER 31 2013 2012 2011
(in millions)
RevenuesNet investment income $ 5.5 $ 6.6 $ 10.5Net realized gains from sales and other 0.8 2.5 8.7Interest income from loan to subsidiary 22.5 22.5 10.5Other income 0.1 0.1 —
Total revenues 28.9 31.7 29.7
ExpensesInterest expense 55.3 48.6 41.3Loss from retirement of debt 19.9 — 2.6Employee benefit related expenses 6.2 5.3 6.9Costs (benefit) related to acquired businesses (6.4) 2.6 16.4Loss on derivative instruments — — 11.3Other operating expenses 8.0 8.0 5.5
Total expenses 83.0 64.5 84.0
Net loss before income taxes and equity in income of unconsolidated subsidiaries (54.1) (32.8) (54.3)Income tax benefit 37.3 40.5 31.1Equity in income of unconsolidated subsidiaries 262.5 47.5 54.7
Income from continuing operations 245.7 55.2 31.5Income from discontinued operations (net of income tax expense (benefit) of
$4.1, $(0.1) and $2.8 in 2013, 2012 and 2011) 5.3 0.7 5.2
Net income $ 251.0 $ 55.9 $ 36.7
The condensed financial information should be read in conjunction with the consolidated financial statements and notesthereto.

Schedule II (continued)
The Hanover Insurance Group, Inc.
CONDENSED FINANCIAL INFORMATION OF REGISTRANTPARENT COMPANY ONLYBALANCE SHEETS
DECEMBER 31 2013 2012
(in millions, except per share data)
AssetsFixed maturities – at fair value (amortized cost of $98.5 and $131.1) $ 101.7 $ 139.3Equity securities – at fair value (cost of $1.0) 1.1 1.0Cash and cash equivalents 20.7 23.8Investments in unconsolidated subsidiaries 2,876.0 2,763.8Net receivable from subsidiaries 23.0 26.6Deferred income taxes 49.1 20.7Current income taxes 8.3 14.1Loan receivable from subsidiary 300.0 300.0Other assets 17.6 14.5
Total assets $3,397.5 $ 3,303.8
LiabilitiesExpenses and state taxes payable $ 16.0 $ 20.7Interest payable 8.1 9.6Debt 778.9 678.1
Total liabilities 803.0 708.4
Shareholders’ EquityPreferred stock, par value $0.01 per share, 20.0 million shares authorized, none issued — —Common stock, par value $0.01 per share, 300.0 million shares authorized, 60.5 million shares issued 0.6 0.6Additional paid-in capital 1,830.1 1,787.1Accumulated other comprehensive income 177.6 325.8Retained earnings 1,349.1 1,211.6Treasury stock at cost (16.8 and 16.2 million) (762.9) (729.7)
Total shareholders’ equity 2,594.5 2,595.4
Total liabilities and shareholders’ equity $3,397.5 $ 3,303.8
The condensed financial information should be read in conjunction with the consolidated financial statements and notesthereto.
THE HANOVER INSURANCE GROUP 2013 ANNUAL REPORT | 143

| THE HANOVER INSURANCE GROUP 2013 ANNUAL REPORT144
Schedule II (continued)
The Hanover Insurance Group, Inc.
CONDENSED FINANCIAL INFORMATION OF REGISTRANTPARENT COMPANY ONLYSTATEMENTS OF CASH FLOWS
YEARS ENDED DECEMBER 31 2013 2012 2011
(in millions)
Cash flows from operating activitiesNet income $ 251.0 $ 55.9 $ 36.7Adjustments to reconcile net income to net cash provided by (used in) operating activities:
Loss (gain) on discontinued operations 2.5 (0.7) (5.2)Loss from retirement of debt 19.9 0.1 2.6Equity in net income of unconsolidated subsidiaries (262.5) (47.5) (54.7)Net realized investment gains (0.8) (2.5) (8.7)Loss on derivative instruments — — 11.3Dividends received from unconsolidated subsidiaries 12.5 1.0 1.6Deferred income tax expense (benefit) (32.3) 3.9 (3.4)Change in expenses and taxes payable 0.1 6.2 (11.7)Change in net payable from subsidiaries 16.5 30.7 (0.5)Other, net 3.4 2.8 2.3
Net cash provided by (used in) operating activities 10.3 49.9 (29.7)
Cash flows from investing activitiesProceeds from disposals and maturities of fixed maturities 122.9 44.2 436.3Purchase of fixed maturities (90.8) (2.2) (148.7)Net cash used for business acquisitions (2.2) (3.4) (468.4)Other investing activities — — (1.9)
Net cash provided by (used in) investing activities 29.9 38.6 (182.7)
Cash flows from financing activitiesProceeds from debt borrowings 168.6 — 296.0Repurchases of debt (93.6) (0.7) (72.1)Dividends paid to shareholders (60.0) (55.1) (50.9)Repurchase of common stock (78.2) (20.0) (21.7)Proceeds from exercise of employee stock options 25.0 2.6 3.9Other financing activities (5.1) (0.4) (0.5)
Net cash provided by (used in) financing activities (43.3) (73.6) 154.7
Net change in cash and cash equivalents (3.1) 14.9 (57.7)Cash and cash equivalents, beginning of year 23.8 8.9 66.6
Cash and cash equivalents, end of year $ 20.7 $ 23.8 $ 8.9
Included in other operating cash flows were the cash portion of dividends received from unconsolidated subsidiaries.Cash payments of $12.5 million, $1.0 million and $1.6 million in 2013, 2012 and 2011, and investment assets of $17.9million and $97.8 million were transferred to the parent company in 2012 and 2011, respectively, to settle dividend andother intercompany balances. There were no assets transferred to the parent company from its subsidiaries in 2013 tosettle balances.The condensed financial information should be read in conjunction with the consolidated financial statements and
notes thereto.
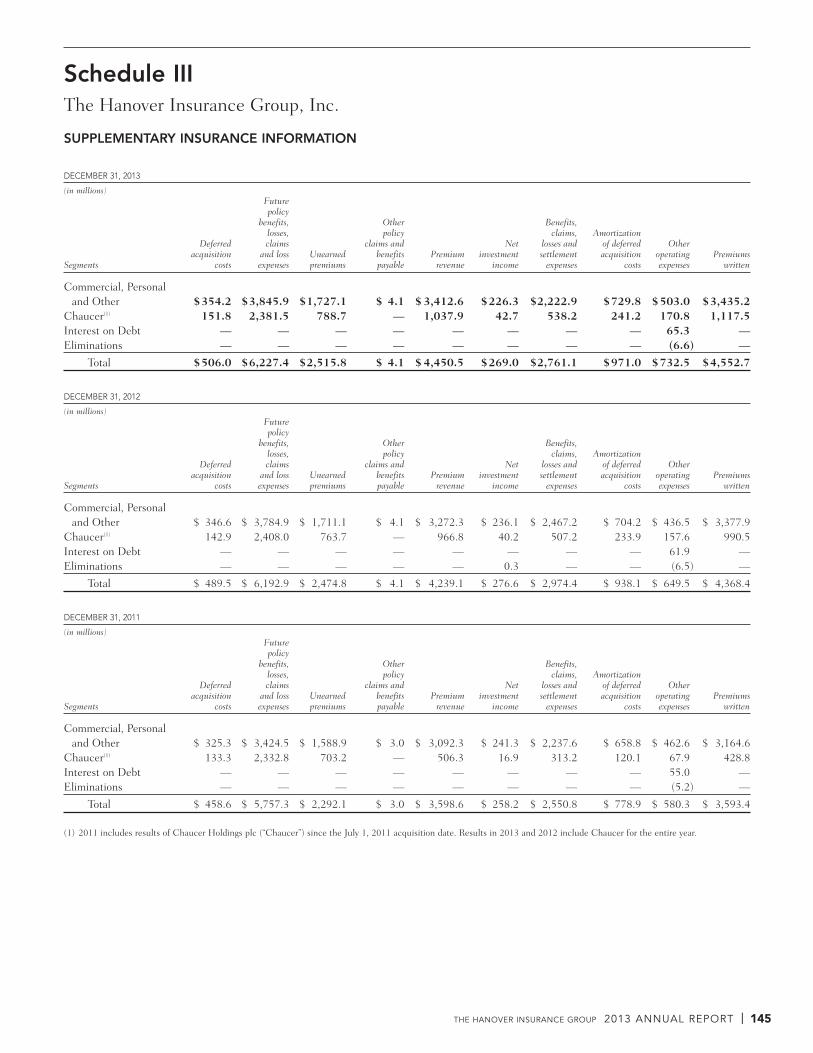
Schedule III The Hanover Insurance Group, Inc.
SUPPLEMENTARY INSURANCE INFORMATION
DECEMBER 31, 2013
(in millions)Futurepolicy
benefits, Other Benefits,losses, policy claims, Amortization
Deferred claims claims and Net losses and of deferred Otheracquisition and loss Unearned benefits Premium investment settlement acquisition operating Premiums
Segments costs expenses premiums payable revenue income expenses costs expenses written
Commercial, Personal and Other $354.2 $3,845.9 $1,727.1 $ 4.1 $3,412.6 $226.3 $2,222.9 $729.8 $503.0 $3,435.2
Chaucer(1) 151.8 2,381.5 788.7 — 1,037.9 42.7 538.2 241.2 170.8 1,117.5Interest on Debt — — — — — — — — 65.3 —Eliminations — — — — — — — — (6.6) —
Total $506.0 $6,227.4 $2,515.8 $ 4.1 $4,450.5 $269.0 $2,761.1 $971.0 $732.5 $4,552.7
DECEMBER 31, 2012
(in millions)Futurepolicy
benefits, Other Benefits,losses, policy claims, Amortization
Deferred claims claims and Net losses and of deferred Otheracquisition and loss Unearned benefits Premium investment settlement acquisition operating Premiums
Segments costs expenses premiums payable revenue income expenses costs expenses written
Commercial, Personal and Other $ 346.6 $ 3,784.9 $ 1,711.1 $ 4.1 $ 3,272.3 $ 236.1 $ 2,467.2 $ 704.2 $ 436.5 $ 3,377.9
Chaucer(1) 142.9 2,408.0 763.7 — 966.8 40.2 507.2 233.9 157.6 990.5Interest on Debt — — — — — — — — 61.9 —Eliminations — — — — — 0.3 — — (6.5) —
Total $ 489.5 $ 6,192.9 $ 2,474.8 $ 4.1 $ 4,239.1 $ 276.6 $ 2,974.4 $ 938.1 $ 649.5 $ 4,368.4
DECEMBER 31, 2011
(in millions)Futurepolicy
benefits, Other Benefits,losses, policy claims, Amortization
Deferred claims claims and Net losses and of deferred Otheracquisition and loss Unearned benefits Premium investment settlement acquisition operating Premiums
Segments costs expenses premiums payable revenue income expenses costs expenses written
Commercial, Personal and Other $ 325.3 $ 3,424.5 $ 1,588.9 $ 3.0 $ 3,092.3 $ 241.3 $ 2,237.6 $ 658.8 $ 462.6 $ 3,164.6
Chaucer(1) 133.3 2,332.8 703.2 — 506.3 16.9 313.2 120.1 67.9 428.8Interest on Debt — — — — — — — — 55.0 —Eliminations — — — — — — — — (5.2) —
Total $ 458.6 $ 5,757.3 $ 2,292.1 $ 3.0 $ 3,598.6 $ 258.2 $ 2,550.8 $ 778.9 $ 580.3 $ 3,593.4
(1) 2011 includes results of Chaucer Holdings plc (“Chaucer”) since the July 1, 2011 acquisition date. Results in 2013 and 2012 include Chaucer for the entire year.
THE HANOVER INSURANCE GROUP 2013 ANNUAL REPORT | 145

| THE HANOVER INSURANCE GROUP 2013 ANNUAL REPORT146
Schedule IV The Hanover Insurance Group, Inc.
REINSURANCE
Incorporated herein by reference to Note 16 – “Reinsurance” in the Notes of the Consolidated Financial Statementsincluded in Financial Statements and Supplemental Data of this Form 10-K.

Schedule V The Hanover Insurance Group, Inc.
VALUATION AND QUALIFYING ACCOUNTS
DECEMBER 31
(in millions)Additions
Description Balance at Charged to Charged Balancebeginning costs and to other at end
2013 of period expenses accounts(1) Deductions of period
Allowance for doubtful accounts $ 2.8 $ 8.1 $ — $ (7.8) $ 3.1Allowance for uncollectible reinsurance recoverables 16.9 3.6 0.5 (0.3) 20.7
$ 19.7 $11.7 $ 0.5 $ (8.1) $23.8
2012
Allowance for doubtful accounts $ 2.3 $ 8.1 $ — $ (7.6) $ 2.8Allowance for uncollectible reinsurance recoverables 16.4 0.4 0.9 (0.8) 16.9
$ 18.7 $ 8.5 $ 0.9 $ (8.4) $ 19.7
2011
Allowance for doubtful accounts $ 3.6 $ 10.1 $ — $ (11.4) $ 2.3Allowance for uncollectible reinsurance recoverables 2.3 2.2 11.9 — 16.4
$ 5.9 $ 12.3 $ 11.9 $ (11.4) $ 18.7
(1) Amount charged to other accounts includes foreign exchange gains and losses and in 2011 also includes the allowance for uncollectible reinsurance recoverables acquired fromChaucer Holdings plc on July 1, 2011.
THE HANOVER INSURANCE GROUP 2013 ANNUAL REPORT | 147

| THE HANOVER INSURANCE GROUP 2013 ANNUAL REPORT148
Schedule VI
The Hanover Insurance Group, Inc.
SUPPLEMENTAL INFORMATION CONCERNING PROPERTY AND CASUALTY INSURANCE OPERATIONS
YEARS ENDED DECEMBER 31
(in millions)Reserves for Discount, if
unpaid claims any, deductedDeferred and claim from Net
acquisition adjustment previous Unearned Earned investmentAffiliation with Registrant costs expenses(1) column(2) premiums(1) premiums income
Consolidated Property and Casualty Subsidiaries2013 $506.0 $6,231.5 $ — $2,515.8 $4,450.5 $269.0
2012 $ 489.5 $ 6,197.0 $ — $ 2,474.8 $ 4,239.1 $ 276.6
2011 $ 458.6 $ 5,760.3 $ — $ 2,292.1 $ 3,598.6 $ 258.2
Claims and claim Amortization Paid claimsadjustment expenses of deferred and claimincurred related to acquisition adjustment Premiums
Current year Prior years costs expenses written
2013 $2,837.4 $ (76.3) $971.0 $2,683.3 $4,552.7
2012 $ 2,990.2 $ (15.8) $ 938.1 $ 2,714.1 $ 4,368.4
2011 $ 2,654.1 $ (103.3) $ 778.9 $ 2,492.7 $ 3,593.4
(1) Reserves for unpaid claims and claim adjustment expenses are shown gross of $2,030.4 million, $2,074.3 million and $1,931.8 million of reinsurance recoverable on unpaidlosses in 2013, 2012 and 2011, respectively. Unearned premiums are shown gross of prepaid premiums of $219.0 million, $275.4 million and $234.9 million in 2013, 2012 and2011, respectively. Reserves for unpaid claims and claims adjustment expense also include policyholder dividends.
(2) The Company does not use discounting techniques.

Ratings and Shareholder Information

A.M. B
est
Stan
dard
& Poo
r’s
Moo
dy’s
A.M. B
est
Stan
dard
& Poo
r’s
Moo
dy’s
Company Ratings
Financial Strength Ratings
The Hanover Insurance Company A A- A3
Citizens Insurance Company of America A A- –
Debt RatingsTHE HANOVER INSURANCE GROUP
Senior Debt bbb BBB- Baa3
Subordinated Debentures bb+ BB Ba1
REGISTRAR AND STOCK TRANSFER AGENT
Computershare Investor Services PO Box 30170, College Station, TX 77842-3170 800-317-4454
INDEPENDENT ACCOUNTANTS
PricewaterhouseCoopers LLP 125 High Street, Boston, MA 02110
CORPORATE OFFICES & PRINCIPAL SUBSIDIARIES
The Hanover Insurance Group, Inc. 440 Lincoln Street, Worcester, MA 01653
The Hanover Insurance Company 440 Lincoln Street, Worcester, MA 01653
Citizens Insurance Company of America 808 North Highlander Way, Howell, MI 48843
Chaucer Holdings plc Plantation Place, 30 Fenchurch Street London, England EC3M3AD
INVESTOR INFORMATION
Call our toll-free investor information line, 800-407-5222, to receive additional printed information, including our Form 10-Ks and quarterly reports on Form 10-Q filed with the Securities and Exchange Commission, and for access to fax-on-demand services, shareholder services, pre-recorded messages and other services. In addition, the company’s filings with the Securities and Exchange Commission are available on our Web site at www.hanover.com, under “About Us – Investors.” Alternatively, investors may address questions to:
Ms. Oksana Lukasheva Vice President Investor Relations The Hanover Insurance Group, Inc. t. 508-855-2063 / f. 508-926-1541 [email protected]

About The Hanover
The Hanover Insurance Group, Inc.
(NYSE: THG), based in Worcester, Mass.,
is one of the top 25 property and casualty
insurers in the United States. For more
than 160 years, The Hanover has provided
a wide range of property and casualty
products and services to businesses,
individuals, and families. The Hanover
distributes its products through a select
group of agents and brokers. Through
its international member company,
Chaucer, The Hanover also underwrites
business at Lloyd’s of London in several
major insurance and reinsurance classes,
including marine, property and energy.
For more information, please visit
hanover.com.
Year Ended December 31 2013 2012($ in millions, except per share amounts)
Revenues $ 4,794 $ 4,591
Net Income 251 56
Income From Continuing Operations 246 46
Operating Income After Taxes1 227 15
Total Assets 13,379 13,485
Shareholders’ Equity 2,595 2,595
Per Share Data
Net Income Per Share — Diluted $ 5.59 $ 1.23
Income From Continuing Operations Per Share $ 5.47 $ 1.02
Book Value Per Share $ 59.43 $ 58.59
Financial Summary
1 Operating income after taxes is a non-GAAP measure. A definition and reconciliation to the closest GAAP measure, income from continuing operations, can be found on page 44 of the enclosed Annual Report on Form 10-K.
Comparison of Cumulative Total Return1
Among The Hanover Insurance Group, Inc., the S&P 500 Index and the S&P Property & Casualty Insurance Index
50
75
100
125
150
175
200
225
250
‘09 ‘10 ‘11 ‘12 ‘13
FIVE-YEAR TOTAL RETURN PERFORMANCE
‘08
The Hanover Insurance Group
S&P 500
S&P P&C Insurance Index
1 The graph above compares the performance of the company’s common stock since December 31, 2008 with the performance of the S&P 500 Index and the S&P Property & Casualty Insurance Index.
Assumes $100 invested on December 31, 2008 in The Hanover Insurance Group, Inc.’s common stock or applicable index — including reinvestment of dividends. Fiscal year ended December 31.
Copyright © 2014, SNL Financial LC, Charlottesville, VA. All rights reserved. www.snl.com.
COMMON STOCK
The common stock of The Hanover Insurance Group, Inc. is traded on the New York Stock Exchange under the symbol “THG.” As of the close of business on February 20, 2014, the company had 21,896 shareholders of record. On the same date, the closing price of the company’s common stock was $58.24 per share.
COMMON STOCK PRICES
2013 High Low
First Quarter $ 49.68 $ 39.19
Second Quarter $ 51.66 $ 46.73
Third Quarter $ 56.06 $ 48.67
Fourth Quarter $ 60.99 $ 54.83
2012 High Low
First Quarter $ 41.52 $ 34.27
Second Quarter $ 41.04 $ 37.17
Third Quarter $ 39.69 $ 33.99
Fourth Quarter $ 39.51 $ 34.58
ANNUAL MEETING OF SHAREHOLDERS
The management and Board of Directors of The Hanover Insurance Group, Inc. invite you to attend the company’s Annual Meeting of Shareholders. The meeting will be held on May 20, 2014, at 9:00 a.m. at The Hanover, 440 Lincoln Street, Worcester, Massachusetts.
CORPORATE GOVERNANCE
Our Corporate Governance Guidelines, Board Committee Charters, Code of Conduct, and other information are available on our Web site at www.hanover.com under “About Us.” For a printed copy of any of these documents, shareholders may contact the company’s secretary at our corporate offices.
The company has filed its CEO and CFO Section 302 certifications as exhibits to its Annual Report on Form 10-K for the year ended December 31, 2013. The company also has submitted its annual CEO certification to the New York Stock Exchange, a copy of which is available on the company’s Web site, www.hanover.com, under “About Us – Corporate Governance.”

A N N U A L R E P O R T
The Hanover Insurance Group
T
HE
HA
NO
VE
R IN
SU
RA
NC
E G
RO
UP
07148 (3/14)
20
13
AN
NU
AL
RE
PO
RT
The Hanover Insurance Company440 Lincoln Street, Worcester, MA 01653
h a n o v e r . c o m
©2014 The Hanover Insurance Group, Inc.