
The Future of Biomass in the Renewables Portfolio - Drax · 2.1 The wood pellet supply chain and...
111
THE FUTURE OF BIOMASS IN THE RENEWABLES PORTFOLIO A REPORT TO DRAX POWER 14 June 2017 THE FUTURE OF BIOMASS IN THE RENEWABLES PORTFOLIO
Transcript of The Future of Biomass in the Renewables Portfolio - Drax · 2.1 The wood pellet supply chain and...

THE FUTURE OF BIOMASS IN THE RENEWABLES PORTFOLIO
A REPORT TO DRAX POWER 14 June 2017
TH
E F
UT
UR
E O
F B
IOM
AS
S IN
TH
E R
EN
EW
AB
LES
PO
RT
FO
LIO

THE FUTURE OF BIOMASS IN THE RENEWABLES PORTFOLIO
14 June 2017
PÖYRY MANAGEMENT CONSULTING
Contact details
Name Email Telephone
Hannes Lechner [email protected] 020 7932 8239
Pöyry is an international consulting and engineering company. We serve clients globally across the energy and industrial sectors and provide local services in our core markets. We deliver management consulting and engineering services, underpinned by strong project implementation capability and expertise. Our focus sectors are power generation, transmission & distribution, forest industry, chemicals & biorefining, mining & metals, transportation and water. Pöyry has an extensive local office network employing about 5,500 experts. Pöyry’s net sales in 2016 were EUR 530 million and the company’s shares are quoted on Nasdaq Helsinki (Pöyry PLC: POY1V).
Pöyry Management Consulting provides leading-edge consulting and advisory services covering the whole value chain in energy, forest and other process industries. Our energy practice is the leading provider of strategic, commercial, regulatory and policy advice to Europe's energy markets. Our energy team of 200 specialists offer unparalleled expertise in the rapidly changing energy sector.
Copyright © 2017 Pöyry Management Consulting (UK) Ltd
All rights reserved
No part of this publication may be reproduced, stored in a retrieval system or transmitted in any form or by any means electronic, mechanical, photocopying, recording or otherwise without the prior written permission of Pöyry Management Consulting (UK) Ltd (“Pöyry”).
This report is provided to the legal entity identified on the front cover for its internal use only. This report may not be provided, in whole or in part, to any other party without the prior written permission of an authorised representative of Pöyry. In such circumstances additional fees may be applicable and the other party may be required to enter into either a Release and Non-Reliance Agreement or a Reliance Agreement with Pöyry.
Important
This document contains confidential and commercially sensitive information. Should any requests for disclosure of information contained in this document be received (whether pursuant to; the Freedom of Information Act 2000, the Freedom of Information Act 2003 (Ireland), the Freedom of Information Act 2000 (Northern Ireland), or otherwise), we request that we be notified in writing of the details of such request and that we be consulted and our comments taken into account before any action is taken.
Disclaimer
While Pöyry considers that the information and opinions given in this work are sound, all parties must rely upon their own skill and judgement when making use of it. Pöyry does not make any representation or warranty, expressed or implied, as to the accuracy or completeness of the information contained in this report and assumes no responsibility for the accuracy or completeness of such information. Pöyry will not assume any liability to anyone for any loss or damage arising out of the provision of this report.
The report contains projections that are based on assumptions that are subject to uncertainties and contingencies. Because of the subjective judgements and inherent uncertainties of projections, and because events frequently do not occur as expected, there can be no assurance that the projections contained herein will be realised and actual results may be different from projected results. Hence the projections supplied are not to be regarded as firm predictions of the future, but rather as illustrations of what might happen. Parties are advised to base their actions on an awareness of the range of such projections, and to note that the range necessarily broadens in the latter years of the projections.

THE FUTURE OF BIOMASS IN THE RENEWABLES PORTFOLIO
14 June 2017
PÖYRY MANAGEMENT CONSULTING
TABLE OF CONTENTS
EXECUTIVE SUMMARY 1
1. THE NEED FOR CONTROLLABLE, RELIABLE LOW-CARBON GENERATION 9
1.1 The future role of low carbon reliable capacity 9
1.2 Options for providing low carbon reliable capacity 12
1.3 How the options for reliable low carbon capacity fit with CCC and National Grid scenarios 20
1.4 The role biomass can play in providing low carbon reliable capacity 23
2. THE OUTLOOK FOR BIOMASS SUPPLY COSTS 25
2.1 The wood pellet supply chain and major cost drivers 25
2.2 Domestic biomass availability in GB 29
2.3 International biomass availability 33
2.4 Current biomass supply cost curve 56
2.5 Potential areas for supply chain cost reductions 59
3. THE OUTLOOK FOR GENERATION COSTS 78
3.1 Approach taken 78
3.2 Technical description of the conversions 79
3.3 Capital costs estimations 90
3.4 Operational costs 92
4. POTENTIAL COST REDUCTIONS IN BIOMASS POWER GENERATION 96
ANNEX A – SCENARIO DATA 102
ANNEX B – FX RATE SENSITIVITY ANALYSIS 103

THE FUTURE OF BIOMASS IN THE RENEWABLES PORTFOLIO
14 June 2017
PÖYRY MANAGEMENT CONSULTING
[This page is intentionally blank]
THE FUTURE OF BIOMASS IN THE RENEWABLES PORTFOLIO
14 June 2017
1
PÖYRY MANAGEMENT CONSULTING
EXECUTIVE SUMMARY
If the UK is committed to its carbon objectives, deployment of between 9 and 19 GW of low carbon reliable generation capacity will be required out to 2030.
Biomass conversions provide the most attractive, immediately available solution with a favourable balance between reliability, flexibility, certainty over technology cost and timing, and generation cost, for complementing existing and future intermittent low carbon technologies.
The option for biomass conversions is only available for the next few years and the UK Government will need to act promptly to enable biomass conversions to play a role as reliable and flexible sources of low carbon power generation in the UK energy mix.
Key biomass supply regions in mainland Europe and overseas offer a substantial surplus of suitable feedstock. Available volumes would be sufficient to support a significant expansion of the bioenergy industry in GB and the wider European market, without exceeding the sustainable forest growth potential or entering into severe competition with existing wood consumers in these regions.
Evidence suggests that biomass supply costs will remain stable for the US Southeast and other current supply regions, even if pellet demand increases considerably due to additional biomass conversions in the UK or other European countries.
There is some potential to reduce costs in the wood pellet supply chain through the utilisation of alternative feedstocks (e.g. increased utilisation of forest and industry residues or agricultural by-products) and access to better finance terms in a maturing and long-term stable market.
Reduced biomass fuel costs have a direct and strong impact on generation costs for biomass conversions, allowing such projects to maintain or even improve their competitive position amongst alternative reliable low carbon power generation options.
The UK has a clear need for controllable, flexible low carbon power generation
The UK Government has a legally binding target to achieve an 80% reduction in UK
greenhouse gas emissions by 2050, from 1990 levels. This is broken into a series of five
year ‘carbon budgets’, the carbon reduction targets for the first five of which (to 2032)
have also been set out in law. The Government has been advised by the Committee on
Climate Change (CCC) to reduce the carbon intensity of the power sector to 100g
CO2/kWh by 2030 from around 450g CO2/kWh in 2015. Low carbon electricity can come
from a wide range of sources which in the case of wind, solar, and wave is generated
intermittently. This means that to reach the emissions targets, there also needs to be
sufficient reliable low carbon generation, which can come from biomass, hydro, tidal,
nuclear, and carbon capture and storage (CCS).
As the contribution of intermittent generation will need to rise substantially to reach the
100g CO2/kWh recommendation by 2030, it is expected that the role of reliable capacity
will become even more important in ensuring that electricity supply and demand are
always balanced to avoid black-outs. However, there are several challenges which mean

THE FUTURE OF BIOMASS IN THE RENEWABLES PORTFOLIO
14 June 2017
2
PÖYRY MANAGEMENT CONSULTING
that a radical change is expected in the capacity mix of this reliable capacity between now
and 2030:
existing fossil fuel capacity will need to be at least partially replaced by reliable low carbon capacity;
Government is considering whether all coal plants should be retired by the end of 2025;
8GW of the 9GW of existing nuclear capacity is due to retire by 2030; and
biomass conversion support ends in 2027 affecting 2GW of existing capacity.
The CCC scenarios leave a gap of 11-16 GW to be fulfilled by new reliable low carbon capacity, while the National Grid scenarios expect a requirement for an additional 9-19 GW of low carbon reliable capacity to be deployed between now and 2030. Hence if the UK is committed to its carbon objectives, then significant deployment of new reliable low-carbon generation capacity will be required.
The UK Government needs to act quickly to benefit from the clear advantages offered by biomass conversions
Of the options available, nuclear and biomass conversion appear to be the most cost effective by 2030, followed by CCS and then tidal stream. Irrespective of the relative cost of intermittent and reliable generation, there will need to be a certain amount of reliable capacity on the system to enable balancing of supply and demand.
Biomass has a number of advantages as an option to provide low carbon reliable capacity:
it can be commissioned in a relatively short timescale (particularly biomass conversions);
the technology for biomass conversions has been demonstrated to work reliably;
there is a good level of certainty over the cost and timing of biomass projects;
established technologies can establish supply chains and expertise for more innovative bioenergy technologies e.g. biomass electricity with CCS; and
compared to other alternatives, biomass generation may have a greater potential to offer flexibility services to the grid – the requirement for flexibility services will increase with increasing levels of intermittent generation.
The CCC and National Grid scenarios both anticipate the need for growth in reliable low carbon capacity. In the case of the National Grid scenarios an additional 3-5GW of biomass electricity capacity is anticipated. In the case of the CCC scenarios an additional 1.5GW of biomass electricity capacity is anticipated and there is a capacity gap of around 2-4GW assumed to be filled by CCS, however the latter no longer looks viable. As the deployment of nuclear already appears close to the upper limit and the potential deployment from tidal is uncertain, biomass provides a dependable option to fill this gap, requiring a total of 3.5 - 5.5GW of new biomass capacity.
There is currently a 0.3GW dedicated biomass plant under construction with a CfD contract and there may be some minor additions under the Renewables Obligation before this closes. The remainder of the 3.5 - 5.5GW could come from a range of technologies if incentivised under the CfD. This includes biomass conversion which could add 4.2GW from extending the support for existing and CfD contracting biomass conversions beyond

THE FUTURE OF BIOMASS IN THE RENEWABLES PORTFOLIO
14 June 2017
3
PÖYRY MANAGEMENT CONSULTING
2027. In addition there is potential to convert further units of Drax and potentially other existing coal stations if appropriate support is provided by Government.
Biomass conversion provides reliable generation at a lower cost than other reliable alternatives such as nuclear, tidal or CCS, and furthermore it has been proven to work at these costs. This means that the risk that capital and operational costs are higher than expected is less as they are not reliant on learning rate assumptions to achieve these costs.
Biomass also provides a good risk management option. Of all the reliable low carbon options it is the one that can make the biggest contribution in 2025 – the point at which the system could be tight on reliable capacity. In 2030 it can fill the gap if there is an under supply in other reliable low carbon technologies, for example if nuclear does not deliver the capacity expected by 2030 or if there is higher demand due to greater electrification of heat and transport than expected. If there is too much low carbon capacity for biomass to run continually by 2030, it can run still run economically at lower load factors.
Whilst the lifetime of biomass conversions might be less than new purpose built plants, such projects can contribute to longer term goals through building up biomass supply chains and expertise. Conversion to biomass also offers an opportunity to continue to benefit from the flexibility services currently provided by coal units.
It is important to note that Government will need to act promptly to enable biomass conversions to play a role as providers of reliable and flexible sources for low carbon power generation in the UK energy mix. The option for biomass conversions is only available for the next few years, after which time plans to close the still operating coal plants will be advanced and it may be difficult to reverse this decision or reactivate already mothballed stations.
The international market offers sufficient biomass surplus to support a considerable expansion of the bioenergy industry
Currently Great Britain offers an unutilised wood biomass surplus of around 1.5 Modt/year. However, even though the underlying supply basis is expected to increase over time, this surplus is expected to be fully consumed within the coming few years due to an expected expansion of the biomass heat sector and the commissioning of several bio-power projects currently under construction or in very advanced development stages. The GB market clearly does not offer any viable fuel supply potential for large scale biomass conversion projects within the foreseeable future, without entering into severe competition with existing biomass consumers. Existing and potential future biomass conversion projects will have to continue sourcing their fuel from the international market.
We have assessed the current biomass surplus availability in a number of relevant key supply regions and also provide long-term scenarios for the likely development of these surplus volumes. These scenarios are based on an analysis of long-term sustainable forest harvesting potentials and the development pathways for biomass consuming industries. The selected supply regions include the US Southeast, Eastern Canada, Brazil, the Baltics, Northwest Russia, the Nordics, and Iberia. These regions have been selected because either GB biomass conversion projects are already sourcing from them or because they offer a good balance of biomass surplus availability, supply cost, and existing infrastructure. There are other potential international supply regions, however, these could not be considered within the scope of this study.
All regions combined offer a substantial currently unutilised biomass surplus of around 140 Modt/year (78 Modt/year of pulpwood, 34.5 Modt/year of harvesting residues and 27.4 Modt/year of sawmill residues). The US Southeast, Brazil, and Northwest Russia
THE FUTURE OF BIOMASS IN THE RENEWABLES PORTFOLIO
14 June 2017
4
PÖYRY MANAGEMENT CONSULTING
offer by far the largest surplus volumes. Going forward, taking all expected changes in the supply base and in demand from biomass consuming industry sectors (including increasing demand for wood pellets from Europe) into account, there is still expected to be a substantial surplus potential of 133 Modt by 2035 (62.9 Modt/year of pulpwood, 45.7 Modt/year of harvesting residues and 24.6 Modt/year of sawmill residues). Such volumes would be enough to support a significant expansion of pellet demand in GB and the wider European market, without exceeding the sustainable forest growth potential or entering into severe competition with existing wood consumers in these regions.
Accessing some of these volumes does come with specific challenges, such as mobilisation of privately owned forest resources, lack of infrastructure, or the dependence on a growing sawmilling sector as a driver for harvesting activities and source for sawmill residues. However, when putting these surplus volumes into context of raw material demand, to supply, for example, the conversion of three additional 645MW units at Drax (~8.5 million odt annual raw material demand), only around 6% of the total current supply surplus would need to be mobilised to meet this demand.
While there are substantial regional surplus volumes available, local supply & demand imbalances could occur, resulting in upwards price pressure on raw material supply. However, it is reasonable to assume that pellet mill developers will choose new mill sites prudently and select areas with favourable biomass supply & demand situations in order to avoid driving up raw material prices as a result of a tightening market situation. In our further analysis we have hence assumed that raw material prices will remain stable throughout the projection period out to 2035.
The cost of biomass raw material and financing are the single most important cost drivers for pellet production
We have analysed the typical cost breakdown of wood pellets delivered from select key supply regions to GB. The analysis shows that besides capital cost charges, the cost for the actual biomass raw material is by far the most important cost element. The cost for raw material within a specific region is outside of the control of a pellet producer as local wood prices depend on the level of competition from other wood consuming industries and general supply and demand dynamics. This is why pellet producers typically very carefully analyse the current and future raw material availability around potential sites and choose catchment areas with lower competitive pressure.
Pellet producers also have the possibility to use lower grade wood biomass as raw material, such as harvesting residues or in-wood chips. These assortments are available at lower price levels, show good surplus availability, and using them also removes competition with traditional forest industries, to a large extent, as they cannot use lower grade raw material.
Capital cost charges depend on the achievable WACC and the economic lifetime of pellet mill investments. Currently pellet mills are financed over 8 to 10 year periods due to an expected limited lifetime of demand from European power generators. Going forward these finance periods could be extended for new mill projects resulting in overall lower capital cost charges per tonne, if the long-term market outlook stabilises supported by longer-term incentive schemes.
The sensitivity of total delivered cost to individual cost drivers such as for power, labour, inland transport, ocean transport charter rates, and bunker fuel is comparatively low.
We have assessed current and future wood pellet supply cost curves for the European market based on a traditional raw material mix of 80% pulpwood and 20% harvesting residues, and for a case where all available surplus volumes of harvesting residues could

THE FUTURE OF BIOMASS IN THE RENEWABLES PORTFOLIO
14 June 2017
5
PÖYRY MANAGEMENT CONSULTING
be utilised for pellet production. Assuming there is no limit on the portion of harvesting residues that can be used in pellet production, and all surplus biomass can be accessed, there is the potential to produce an additional 121.7 million tonnes of pellets at present, and 117.3 million tonnes in 2030. To put these volumes into perspective, the annual pellet fuel demand for a 100 MW biomass conversion is around 400,000 tonnes.
The analysis also shows that pellet demand in the European market could increase considerably without strong price increases, as the cost curve has the ability to stretch substantially in the lower and mid cost ranges, if surplus volumes can be mobilised successfully.
There is good potential to reduce the cost of wood pellet production in the future
The production process of white wood pellets contains several processing steps (e.g. chipping, drying, and hammermilling) that have been in use in other wood processing industry sectors for decades. In general, pellet production can be considered a well-established and proven technology and process. To estimate the potential for further technological and cost improvements, we have conducted interviews with market leading equipment providers and there is a consensus that the capital investment cost per tonne of production capacity is not likely to come down as a result of larger production units, efficiency improvements or the introduction of radically different production processes. However, equipment providers also expressed no concerns that capital investment cost would increase if the industry saw strong growth over the coming decade, driven by an expanding biomass conversion sector in GB or other European countries.
The typical capital cost requirement for a standard 500,000 tonne white pellet mill, based on pulpwood as raw material, is around 120 million USD. Assuming a 10 year economic lifetime and a WACC of 8%, this translates into a capital cost charge of 41 USD per tonne of pellets produced.
A pellet mill of the same size, but based on in-wood chips or harvesting residues, which are typically delivered in the form of wood chips, would have lower capital cost requirements of around 107 million USD as the wood chipping line becomes redundant. The resulting capital cost charge per tonne would be 37 USD.
The operational cost per tonne of pellets produced (excluding cost for raw material) is mainly comprised of labour cost and electricity cost. There is no indication that the industry is on the brink of a technological breakthrough that would allow pellet mills to considerably reduce e.g. labour cost or electricity consumption, and the total operational cost are expected to remain flat in real terms.
However, we expect that the industry will be able to realise a certain level of production cost reductions as a result of achieving shorter commissioning periods for new mills (4 months instead of the current average of 8 months) and higher utilisation rates of nameplate capacities (currently 90%, improving to 95%) as a result of learning effects and reduced downtime.
In addition, we expect pellet producers to be able to access better finance terms in a maturing market characterised by longer-term demand stability. A prerequisite for this would be that the UK Government extends the support scheme for existing biomass conversions beyond March 2027 and grants any new support contracts under a 15 or 20 year term. This would allow project developers to secure a higher debt share (70% instead of currently assumed 40%) and work with longer finance periods (15 years instead of currently assumed 10 years). These effects would reduce the capital cost charge for a typical US mill from 41 USD per tonne currently to 25 USD per tonne.

THE FUTURE OF BIOMASS IN THE RENEWABLES PORTFOLIO
14 June 2017
6
PÖYRY MANAGEMENT CONSULTING
Under such an improved pellet production scenario (i.e. lower commissioning periods, better availability of pellet mills, and better financing conditions), the total delivered cost of white pellets produced in the US Southeast could be reduced from current levels if 173 USD/tonne (CIF) to 155 USD/tonne. This represents an effective cost reduction of around 10%.
As mentioned before, the most significant cost factor for wood pellet mills is the actual cost for the raw material, which represents around 42% on an FOB basis, and 36% on a CIF GB basis. Pellet producers have the opportunity to reduce total delivered cost to Europe by increasing the share of lower quality and lower cost biomass in the raw material mix in the currently most important supply region, the US Southeast. As an additional option, future production capacities could be established in regions that offer good surplus potentials at attractive cost levels, such as Brazil or Northwest Russia.
Currently pellet producers only use a limited share of harvesting residues (tree tops and branches) in their raw material mix as they would risk failing to meet existing quality specifications for biomass conversion projects. A complete shift to harvesting residues as raw material, however, would allow producers to lower their raw material cost by 12 % in the US Southeast, resulting in a reduction of delivered cost of between 7%.
Producing wood pellets in Brazil or NW-Russia while still focusing on pulpwood as the main raw material would result in a delivered cost (CIF GB) reduction of 5% for Brazil and 14% for NW-Russia respectively, compared to the base case of producing white wood pellets in the US Southeast. If producers not only shift production locations but also move to harvesting residues as raw material, the total delivered cost CIF GB could be reduced by 11% for Brazil and 26% for NW-Russia compared to the base case US Southeast.
Reduced biomass fuel costs have a strong impact on power generation cost
The capital investment costs required to convert a coal station to biomass can vary within a considerable range and are highly dependent on the existing plant infrastructure and technology. The conversion of the first three units at Drax incurred capital investment costs of around 160 GBP/kWe. We have undertaken a high level assessment of capital cost requirements to convert additional coal units in GB and identified a capital cost range of 81 to 347 GBP/kWe. The lower end of this range is defined by estimated capital cost to convert three additional units at Drax, taking into account that no additional investments in pellet rail unloading or on-site storage would be required, as operations at Drax have shown that the existing infrastructure could also support the additional volumes required for a full six unit conversion.
We estimate that using pellets produced from harvesting residues with a typically higher ash and alkali content would not result in significant increases to capital investment requirements. Using pellets produced from agri-residues (e.g. sugarcane bagasse), however, is estimated to result in an increased CAPEX requirement of about 10 to 20% for improved boiler operation and furnace cleaning systems.
We have undertaken an analysis of current and likely future total average net power generation cost for GB biomass conversion projects that source their fuel internationally. This analysis focuses on the US Southeast as the currently most relevant supply region, and on NW-Russia and Brazil as potential future options. A range of raw material sources and production technologies was considered for this analysis.
The analysis clearly shows that the capital cost element for biomass conversions is relatively small (ranging from 2% to 5% depending on the case), and that the cost for the actual biomass fuel represents the largest cost element at typically 81% to 88% of total generation cost.

THE FUTURE OF BIOMASS IN THE RENEWABLES PORTFOLIO
14 June 2017
7
PÖYRY MANAGEMENT CONSULTING
Taking power generation based on white wood pellets produced from mostly pulpwood and a share of 20% harvesting residues from the US Southeast as base case, current power production costs would range from 96 to 107 GBP/MWh, depending on the specific power station. Power generators could already achieve cost savings today by moving away from high quality clean white wood as raw material towards lower quality pellets based on using a higher proportion of branches and tree tops in the feedstock mix. Even though using such lower quality pellets is likely to result in higher operational cost at the power station (+15%) due to higher ash and alkali contents, the overall generation cost would still be lower by 5% compared to the base case.
Developing pellet production facilities in Brazil and NW-Russia using harvesting residues as raw material would result in a further reduction of 8% and 19% respectively compared to the base case in the short term, assuming a fully integrated business model where all cost savings are directly passed on to the pellet consumer. In the mid- to long-term, it is likely that generation cost could be reduced further down to 86 GBP/MWh sourcing from Brazil and 75 GBP/MWh from NW- Russia. This represents a reduction of 16% for Brazil and 27% for NW-Russia compared to the base case.
As biomass consumers need to maintain a diversified sourcing portfolio as a key element of their risk mitigation strategy, it is not likely that a station will source all of its fuel requirement from one specific region and average net power generation costs will depend on individual pellet sourcing strategies that offer the best balance between cost, fuel supply security and risk exposure from the consumer’s point of view.
The introduction of black pellets (in this case steam exploded pellets) is not expected to result in lower power generation costs when compared to the respective white pellet cases. The main reason for this is that the usage of black pellets has only a relatively minor impact on capital cost for a power station through the removal of the need for covered storage, and has no impact on operational cost. As already noted, the capital cost element for biomass conversion projects is a relatively small element of total generation cost and the overall impact on generation cost is dampened by the higher cost for steam exploded fuel.
The utilisation of pellets based on agricultural residues, such as a mix of sugarcane bagasse and trash could result in net biomass power generation costs of 75 to 83 GBP/MWh. These cost figures already take account of likely higher non-fuel related operating cost at the power station due to lower availability and increased maintenance as a result of the more challenging feedstock characteristics.
Wood pellets are typically traded in USD or EUR and the high share of fuel cost in total power generation cost exposes biomass conversion projects to a considerable exchange rate risk as all revenue streams are received in GBP. For our analysis we have assumed the current GBP/USD FX rate of 1.25 and we have not made any forward looking assumptions. Assuming the GBP/USD FX rate rebounds to 1.4, power generation costs would be around 9% lower than presented in this report. Should the GBP/USD FX rate improve further to 1.6, total power generation cost would reduce by an additional 10%.

THE FUTURE OF BIOMASS IN THE RENEWABLES PORTFOLIO
14 June 2017
8
PÖYRY MANAGEMENT CONSULTING
[This page is intentionally blank]
THE FUTURE OF BIOMASS IN THE RENEWABLES PORTFOLIO
14 June 2017
9
PÖYRY MANAGEMENT CONSULTING
1. THE NEED FOR CONTROLLABLE, RELIABLE LOW-CARBON GENERATION
In this Chapter we discuss why low carbon reliable capacity is required to meet the Government’s vision of the future electricity system, the options for providing it and the contribution from these options suggested by modelling of future energy scenarios. We conclude with the role that biomass can play in this future.
1.1 The future role of low carbon reliable capacity
The UK Government has a legally binding target to achieve an 80% reduction in UK greenhouse gas emissions by 2050 from 1990 levels. This is broken into a series of five year ‘carbon budgets’, the carbon reduction targets for the first five of which (to 2032) have also been set out in law. The Committee on Climate Change (CCC) is responsible for advising the Government on meeting its emissions targets. This includes carrying out modelling across the different sectors of the economy including the electricity sector. Its modelling is used to advise Government of the least cost route to achieving the carbon budgets taking account of the available technologies and Government policy at the time.
In its November 2015 advice to Government on meeting the fifth carbon budget the CCC has recommended that the Government’s policy approach is consistent with a reduction in the carbon intensity of the power sector to 100g CO2/kWh by 2030 from around 450g CO2/kWh in 20151. This was also the central carbon intensity used in the Government’s impact assessment of its 2013 Electricity Market Reform programme.
In National Grid’s role as system operator of the UK transmission system it is keen to understand how the electricity sector might evolve in the future. In particular it has an interest in ensuring that Government policy direction can provide sufficient reliable generation to enable it to balance supply and demand in the future. To inform its future strategy it undertakes its own modelling of future potential scenarios (the Future Energy Scenarios) in keeping with Government policy. It has three scenarios (Gone Green, Slow Progression and Consumer Power) which meet the 100g CO2/kWh recommended carbon intensity2.
Low carbon electricity generation can come from a wide range of sources: onshore and offshore wind, solar, biomass, hydro, wave and tidal, nuclear and fossil fuel plant fitted with carbon capture and storage (CCS). In the case of wind, solar and wave they are intermittent and so cannot be relied upon to generate at times of need3. This means that, to reach the emissions targets, there also needs to be sufficient reliable low carbon generation.
Figure 1 and Figure 2 show the amount of intermittent and reliable (low carbon and fossil fuel combined) capacity and generation in 2015 compared to that anticipated under the
1 The fifth carbon budget – the next step towards a low carbon economy, Committee on Climate Change, November
2015. 2 We consider that these sources – the CCC scenarios and National Grid’s 2016 Future Energy Scenarios – are the
two most relevant publically available future scenarios at the time of writing and so focus on these results in this report. Other modelling exercises are either over five years old or based on different objectives e.g. European Commission reference scenarios which do not consider how a 100g CO2/kWh limit might be met.
3 Tidal is also intermittent but is predictable so it is possible to rely on it generating at the times it is expected to
generate.

THE FUTURE OF BIOMASS IN THE RENEWABLES PORTFOLIO
14 June 2017
10
PÖYRY MANAGEMENT CONSULTING
range of CCC and National Grid scenarios for 2030. Figures for capacity are not shown for the CCC scenarios as no capacity figures are given for gas-fired capacity. A full breakdown by technology of the capacity and generation assumed under the National Grid and CCC scenarios is given in Annex A.
Figure 1 – Intermittent and reliable capacity in 2015 and 2030 scenarios
Note: only the National Grid scenarios are shown as no capacity figures are given by CCC for gas-fired capacity.
Figure 2 – Intermittent and reliable generation in 2015 and 2030 scenarios
It is clear the contribution of intermittent generation will need to rise substantially to reach the 100g CO2/kWh recommendation by 2030. For example to achieve this the CCC’s scenarios4 for the 5th carbon budget anticipate around 40GW of wind, up from 14GW in 20155, and around 20GW6 of solar, up from 9GW in 20157. This means the role of reliable capacity is expected to become even more important in the future to ensure that electricity supply and demand are always balanced to avoid black-outs.
4 Three CCC scenarios reach this ambition (high nuclear, high CCS and high renewables).
5 Digest UK Energy Statistics. DECC, 2016
6 These figures are greater for the ‘high renewables’ scenario.
7 Digest UK Energy Statistics. DECC, 2016
THE FUTURE OF BIOMASS IN THE RENEWABLES PORTFOLIO
14 June 2017
11
PÖYRY MANAGEMENT CONSULTING
The amount of reliable capacity in the NGC scenarios is expected to remain broadly the same with generation from this capacity expected to fall from now to 2030 across all scenarios. This implies lower load factors from reliable capacity, emphasising its greater role in maintaining security of supply.
On the face of it this may seem straightforward to maintain a similar level of reliable capacity to that which exists today. However, there are several challenges which mean that in fact a radical change is expected in the capacity mix of this reliable capacity between now and 2030:
more generation is required from low carbon capacity between now and 2030 to meet the 100g CO2/kWh, so existing fossil fuel capacity will need to be at least partially replaced by reliable low carbon capacity;
in keeping with this, the Government is considering whether all coal plant should be required to retire by the end of 2025;
8GW of the 9GW of existing nuclear capacity is due to retire by 20308; and
biomass conversion support ends in 2027 affecting 2GW of existing capacity.
The retirement of nuclear, and potential mothballing of biomass conversions, means that, of the 15GW of low carbon reliable power currently operational, under current Government policy only around 5GW of it may still be available in 2030.
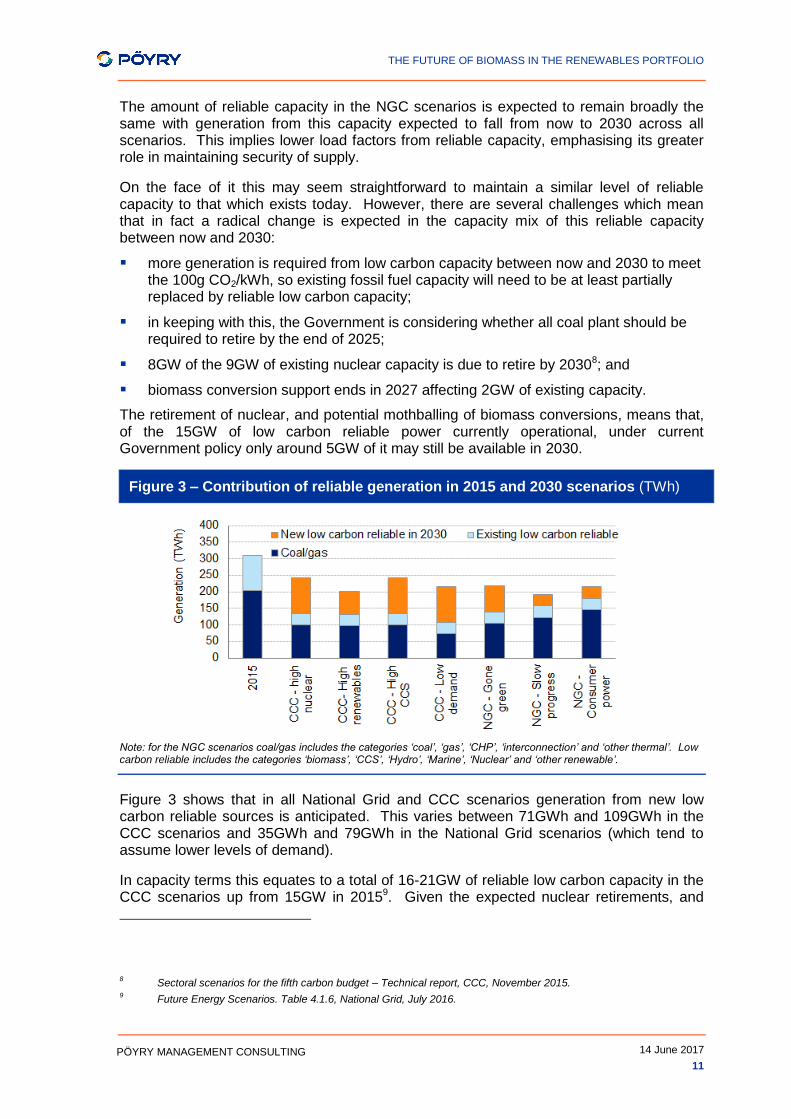
Figure 3 – Contribution of reliable generation in 2015 and 2030 scenarios (TWh)
Note: for the NGC scenarios coal/gas includes the categories ‘coal’, ‘gas’, ‘CHP’, ‘interconnection’ and ‘other thermal’. Low carbon reliable includes the categories ‘biomass’, ‘CCS’, ‘Hydro’, ‘Marine’, ‘Nuclear’ and ‘other renewable’.
Figure 3 shows that in all National Grid and CCC scenarios generation from new low carbon reliable sources is anticipated. This varies between 71GWh and 109GWh in the CCC scenarios and 35GWh and 79GWh in the National Grid scenarios (which tend to assume lower levels of demand).
In capacity terms this equates to a total of 16-21GW of reliable low carbon capacity in the CCC scenarios up from 15GW in 20159. Given the expected nuclear retirements, and
8 Sectoral scenarios for the fifth carbon budget – Technical report, CCC, November 2015.
9 Future Energy Scenarios. Table 4.1.6, National Grid, July 2016.
THE FUTURE OF BIOMASS IN THE RENEWABLES PORTFOLIO
14 June 2017
12
PÖYRY MANAGEMENT CONSULTING
potential fall in biomass conversion capacity this leaves a gap of 11-16GW in the CCC scenarios to be fulfilled by new reliable low carbon capacity. The National Grid scenarios anticipate between 14 and 24GW of reliable capacity from low carbon sources, that is an additional 9-19GW of low carbon reliable capacity between now and 203010.
If this new capacity does not come forward, then the alternatives are:
deploy more fossil fuel generation; or
build additional intermittent renewables and manage the exacerbated intermittency problem through very extensive deployment of batteries, demand side management, and/or interconnectors to other countries.
Deploying more fossil fuel generation (without CCS) fails to meet the 100g CO2/kWh aspiration. Battery or other storage capacity designed to store enough electricity for a sustained low-wind period is likely to be prohibitively expensive while there is a limit to which enhanced connection to neighbouring markets can mitigate intermittency effects. 10-20GW of voluntary demand reduction does not appear realistic compared to an average demand level of around 35-40GW. Hence if the UK is committed to its carbon objectives then significant deployment of new reliable low-carbon generation capacity will be required.
1.1.1 The need for reliable capacity in the mid-2020s
We have primarily focussed on the need for low carbon reliable capacity by 2030 in this Section as this is the date of the 100g CO2/kWh aspiration. However, the need for reliable capacity is likely to emerge earlier: all existing coal capacity is required to close by 2025 and over the course of the 2020s most of the 9GW of existing nuclear fleet is also expected to close. To put the UK on course to reach its 2030 low carbon ambition, earlier carbon budgets are more likely to be met if the anticipated capacity gap in the 2020s is filled with low carbon generating capacity rather than build more fossil fuel capacity only to replace it by 2030.
1.2 Options for providing low carbon reliable capacity
In this section we consider the options for providing low carbon reliable capacity in more detail including their key characteristics, certainty over deliverability and ability to provide flexible as well as reliable electricity supply.
10 The CCC scenarios assume annual load factors in the range 78-90% for the main reliable low carbon technologies
of biomass, nuclear, and CCS. The implied load factors from the NGC scenarios are lower – in the range 50-70%.

THE FUTURE OF BIOMASS IN THE RENEWABLES PORTFOLIO
14 June 2017
13
PÖYRY MANAGEMENT CONSULTING
Table 1 summarises the characteristics of the main low carbon reliable technology options11, including BEIS’s latest projections of the levelised cost of each technology12. Of the options available nuclear and biomass conversion appear to be the most cost effective by 2030, followed by CCS and then tidal stream. Costs for other bioenergy technologies span a wide range from standard ‘Advanced Conversion Technologies’ up to ‘Advanced Conversion Technology CHP’ reflecting the range of technologies and different maturities. Figures are not given for Tidal Barrage or Tidal Lagoon. The latter appears the more likely option at the moment given the development of the Swansea Bay project by Tidal Lagoon Power. In 2014 Pöyry estimated the costs13 of the tidal lagoons to be in the region of 150 GBP/MWh (real 2014 prices) for the first project falling to 90 GBP/MWh (real 2014 prices) for subsequent projects.
For comparison, the main intermittent technologies are expected to have costs in a similar ballpark to nuclear and biomass conversion, with onshore wind and solar at the cheaper end, 45 to 72 GBP/MWh for onshore wind and 52 to 73 GBP/MWh for solar and offshore wind at the more expensive end at 85 to 109 GBP/MWh14. This means that not only are biomass conversion and nuclear comparable in cost to some intermittent alternatives but they also meet the need for a proportion of reliable capacity on the system to balance supply and demand.
The projects with the shortest lead time are biomass conversions and then dedicated biomass plants with CCS and nuclear projects expected to take at least twice as long to come to fruition. No timescale is given for tidal barrage or tidal lagoon projects.
Nuclear has by far the longest lifetime of the figures shown although it is likely tidal lagoon and tidal barrage projects would also have very long lifetimes15. Biomass conversions have the shortest but it may also be possible to extend their life with additional investment. In any case, they provide a step towards more advanced bioenergy technologies including biomass CCS, the only option for achieving negative emissions.
1.2.1 Deployment potential
The deployment potential figures relate to the amount of capacity that could deploy but it does not take account of the cost of deploying that capacity. To achieve these figures would require an extension of Government support from that currently offered. The figures have been taken from different sources some of which are underpinned by more robust analysis than others but all are provided to give an indication of what each technology may be able to provide by 2030. All the technologies shown are theoretically capable of a significant contribution.
Biomass conversion: this figure assumes that only Drax and Lynemouth are capable of converting and running until 2030, however, this is not the upper limit to biomass conversion potential, it is possible that further coal stations could be converted but given their ages they are likely to require significant additional investment.
11 We have assumed that hydro is reliable, however, it is not shown given its relatively low future potential capacity.
12 Electricity Generation Costs, BEIS, November 2016.
13 Levelised costs of power from tidal lagoons: A report to Tidal Lagoon Power plc. Pöyry, March 2014.
14 Note this chapter was written before the 2016 CfD allocation round
15 For example Tidal Lagoon Power anticipates that these projects can last for 120years.
See www.tidallagoonpower.com

THE FUTURE OF BIOMASS IN THE RENEWABLES PORTFOLIO
14 June 2017
14
PÖYRY MANAGEMENT CONSULTING
CCS: these figures are from a recent Pöyry report to CCC, which revise down estimates in Pöyry’s previous study for the CCC following the closure of the CCS commercialisation programme.
Nuclear: this technology appears to have the greatest deployment potential by 2030, this figure is based on a 2013 Pöyry report to CCC but we have pushed back the potential three years to reflect the delays to Hinkley Point C seen since the report.
Other bioenergy: The deployment potential shown for other bioenergy needs to be treated with caution. It may be an underestimate as it only accounts for projects currently being developed and registered on BEIS’s Renewable Energy Planning Database (REPD) however, it is possible for new projects to be developed and operating by 2030. Having said this if all projects in the pipeline were developed this could increase the cost of the projects, and so support required, as the amount of available domestic biomass would mean more projects are likely to require imported biomass at a higher cost.
Tidal deployment: The tidal potential needs to be treated with caution. It is a DECC figure from 2011 when it is likely that there was greater optimism on the role tidal stream could play but less consideration of the potential contribution from tidal lagoons.

THE FUTURE OF BIOMASS IN THE RENEWABLES PORTFOLIO
14 June 2017
15
PÖYRY MANAGEMENT CONSULTING
Table 1 – Comparison of deployment potential and assumed deployment for baseload capacity options by 2030
Technology BEIS cost projection for
2030 (GBP/MWh, real 2014 money)
BEIS Project lead time: pre-
development and construction
period
BEIS Project lifetime
BEIS Capacity in the UK at the end
of 2015 (still expected to be in
operation in 2030)
Potential deployment by
2030
Biomass conversion
85 to 88 (in 2020) 4 years 15 years 1.9GW (0GW) 4.3GW5
CCS 105 to120 8 to10 years 25 years 0GW 2-3GW6
Nuclear 69 to99 13 years 60 years 9GW (1.2GW) 11GW7
Other bioenergy1 85 to1902 3 to 5 years 20 to 35 years 2.33GW
(1.9GW4) 6.0GW8
Tidal Stream 171 to 365 6 years 22 years 0.01GW (all
marine) 4GW9 (all tidal)
1. Other Bioenergy includes dedicated biomass, sewage sludge digestion, energy from waste, biomass used in advanced conversion technologies (gasification and pyrolysis) and anaerobic digestion. It excludes landfill gas.
2. This uses central BEIS figures across a range of technologies, rather than the low to high ranges given for specific technologies shown in the other rows.
3. DUKES table 6.4 excluding landfill gas and the figure quoted for biomass conversion
4. Assumes that capacity over 30 years old will have decommissioned.
5. Assumes six units of Drax and Lynemouth. It may also be feasible to convert additional coal units.
6. A strategic approach for developing CCS in the UK. Pöyry, May 2016.6
7. This uses the 2027 potential in ‘Technology supply curves for low carbon generation, a report to the Committee on Climate Change, .June 2013. The 2027 figure is used rather than the 2030 figure as the Hinkley Point C project is now assumed to commission in 2025 rather than reach full operation in 2022 as assumed in the report. New projects are assumed to follow in regular intervals from the first.
8. Includes operational capacity plus 3GW of pipeline from BEIS’s Renewable Energy Planning Database. This will tend to be an underestimate as the visibility of the pipeline does not extend all the way to 2030.
9. UK renewable energy roadmap. DECC, July 2011.
THE FUTURE OF BIOMASS IN THE RENEWABLES PORTFOLIO
14 June 2017
16
PÖYRY MANAGEMENT CONSULTING
1.2.2 Certainty over deliverability
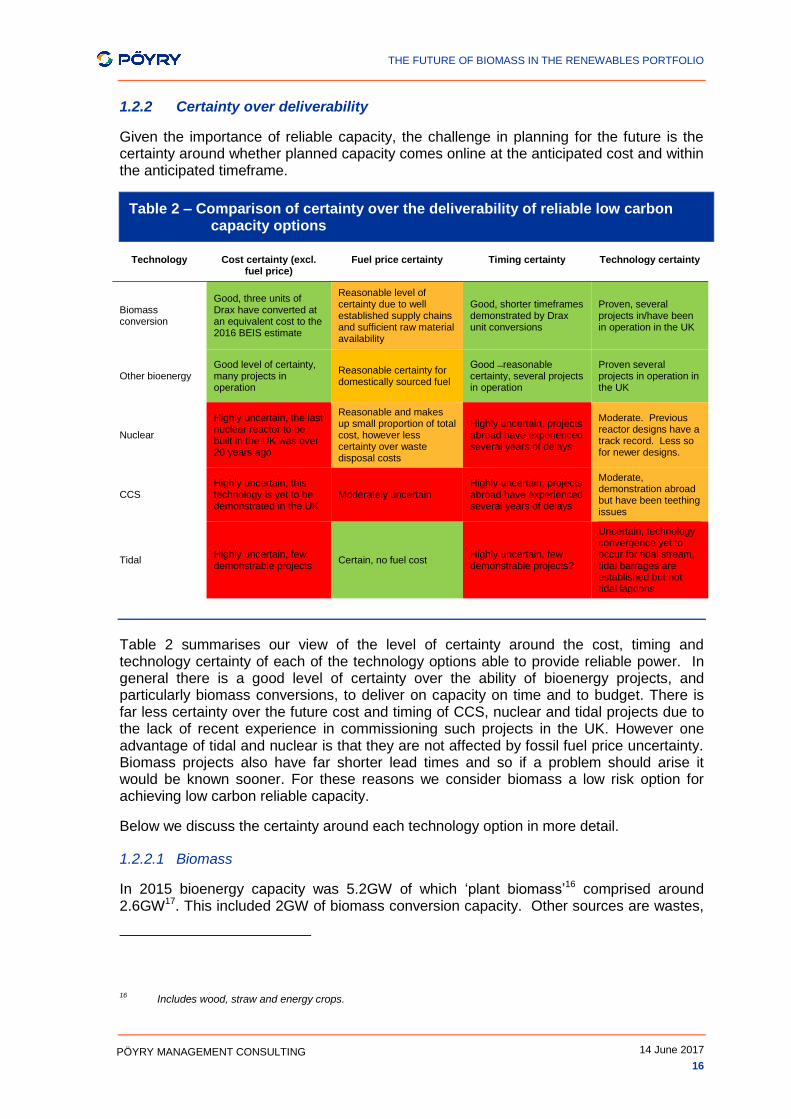
Given the importance of reliable capacity, the challenge in planning for the future is the certainty around whether planned capacity comes online at the anticipated cost and within the anticipated timeframe.
Table 2 – Comparison of certainty over the deliverability of reliable low carbon capacity options
Technology Cost certainty (excl. fuel price)
Fuel price certainty Timing certainty Technology certainty
Biomass conversion
Good, three units of Drax have converted at an equivalent cost to the 2016 BEIS estimate
Reasonable level of certainty due to well established supply chains and sufficient raw material availability
Good, shorter timeframes demonstrated by Drax unit conversions
Proven, several projects in/have been in operation in the UK
Other bioenergy Good level of certainty, many projects in operation
Reasonable certainty for domestically sourced fuel
Good ̶reasonable certainty, several projects in operation
Proven several projects in operation in the UK
Nuclear
Highly uncertain, the last nuclear reactor to be built in the UK was over 20 years ago
Reasonable and makes up small proportion of total cost, however less certainty over waste disposal costs
Highly uncertain, projects abroad have experienced several years of delays
Moderate. Previous reactor designs have a track record. Less so for newer designs.
CCS Highly uncertain, this technology is yet to be demonstrated in the UK
Moderately uncertain Highly uncertain, projects abroad have experienced several years of delays
Moderate, demonstration abroad but have been teething issues
Tidal Highly uncertain, few demonstrable projects
Certain, no fuel cost Highly uncertain, few demonstrable projects?
Uncertain, technology convergence yet to occur for tidal stream, tidal barrages are established but not tidal lagoons
Table 2 summarises our view of the level of certainty around the cost, timing and technology certainty of each of the technology options able to provide reliable power. In general there is a good level of certainty over the ability of bioenergy projects, and particularly biomass conversions, to deliver on capacity on time and to budget. There is far less certainty over the future cost and timing of CCS, nuclear and tidal projects due to the lack of recent experience in commissioning such projects in the UK. However one advantage of tidal and nuclear is that they are not affected by fossil fuel price uncertainty. Biomass projects also have far shorter lead times and so if a problem should arise it would be known sooner. For these reasons we consider biomass a low risk option for achieving low carbon reliable capacity.
Below we discuss the certainty around each technology option in more detail.
1.2.2.1 Biomass
In 2015 bioenergy capacity was 5.2GW of which ‘plant biomass’16 comprised around 2.6GW17. This included 2GW of biomass conversion capacity. Other sources are wastes,
16 Includes wood, straw and energy crops.

THE FUTURE OF BIOMASS IN THE RENEWABLES PORTFOLIO
14 June 2017
17
PÖYRY MANAGEMENT CONSULTING
AD and animal biomass18. The future potential of biomass could be over 10GWs by 2030 including 4.3GW of biomass conversion.
Both dedicated biomass and conversion of coal to biomass have been demonstrated in the UK and Europe. Tilbury, Ironbridge and units at Drax in the UK have all been converted from coal to biomass within 1.5 to 2years. There are also many examples across Europe, particularly in Denmark of other biomass conversions completing in similar timescales. So any new biomass conversions could start providing reliable capacity in the early 2020s rather than waiting until the late 2020s.
Other biomass projects such as biomass CHP have also been demonstrated to complete within the 3 to 5 year timescale estimated by BEIS.
Dedicated biomass plants have lifetimes similar to CCS and tidal. However, biomass conversions potentially have a relatively shorter lifetime, although this will depend on the age and condition of the relevant coal plant and so will be plant specific. This means the plants themselves will not be able to directly contribute to later emissions reduction targets. However, they are still of benefit as in addition to providing reliable low carbon capacity through the 2020s they also provide learning on the operation of biomass and can build up biomass supply chains. This could be important for the expansion of innovative technologies such as biomass with CCS – the only technology to offer negative emissions.
Biomass conversion is the cheapest of the biomass technologies with future potential19 projected to be around 85 to 88 GBP/MWh in 2020 by BEIS. Biomass conversion has been shown to operate within this kind of cost range as the two fully converted Drax units supported by ROCs currently earn a total electricity plus ROC revenue of around 90 GBP/MWh20 at the time of writing. This means the risks of any overrun in costs is low particularly if further biomass conversions were additional Drax units.
A wide range of costs are given for other bioenergy technologies reflecting the range of technologies from dedicated biomass to gasification. However, in most cases costs are expected to be broadly the same as 2016 costs and this provides some comfort that assumed costs can be met as there is no risk that assumed cost reductions don’t materialise.
1.2.2.2 CCS
A CCS project is yet to be built in the UK but the technology has been proven to work in other countries e.g. Sleipner and Snøhvit CO2 Storage Projects in Norway and the Air Products Steam Methane Reformer EOR Project in Texas. A number of UK CCS projects are in the pipeline e.g. the Caledonian Clean Energy Project and Don Valley Power Project. However, CCS in the UK suffered a severe blow in 2015 when the UK Government withdrew funding from its CCS commercialisation programme. This has led to uncertainty over when the first project will be built, with knock-on impacts for further
17 Digest UK Energy Statistics. DECC, 2016
18 We have not included landfill gas in the figures presented.
19 Landfill gas and sewage gas may be considered cheaper but have very little potential future capacity.
20 For the third unit the CfD strike price agreed is currently around GBP106/MWh. However this will only be for a
period of 10 years and so support for the capital costs is spread over a shorter period.

THE FUTURE OF BIOMASS IN THE RENEWABLES PORTFOLIO
14 June 2017
18
PÖYRY MANAGEMENT CONSULTING
projects in the future. In a study for the CCC21, Pöyry considered 2-3GW of CCS viable by 2030 provided that the Government puts in place a CCS strategy in 2017.
BEIS’s anticipated cost of CCS in 2030 is around 105 to 120 GBP/MWh. CCS is still in a cost discovery phase as no projects have been built in the UK to provide evidence that these costs will be achieved. This means there remains considerable risk, particularly for earlier projects, that unanticipated glitches arise leading to costs exceeding expectations. For example, the Kemper County Coal CCS project in the US was originally intended to cost USD 2.2billion in 2004, but is now projected to cost ~ USD 6.7billion, and is 2 to 3 years behind schedule22. As CCS will be attached to coal, gas or biomass power stations there will also be some fuel price uncertainty.
The lead time of CCS is expected to be around 8 to 10 years and so it is likely any capacity would be built in the late 2020s at the earliest.
There is also a risk over whether early projects achieve the 8 to10 year timescale. BEIS assumes 4 to 6 years for pre-development and 4 to 5 years for construction. In contrast the ROAD CCS project in the Netherlands has taken 7 years from pre-development to construction and is now “essentially mothballed” while the project team wait for financing. The Kemper county coal CCS project in the US took 8 years from beginning construction to first operation.
1.2.2.3 Nuclear
By 2030 it is expected around 1.2GW of existing nuclear capacity will remain online in the UK23. A new nuclear project has not been built in the UK for over 20 years. New capacity is expected in the next decade with the first project being Hinkley Point C (3.2GW) which has secured a CfD contract and reached financial close24 in September 2016.
The lead time for nuclear projects is considered to be around 13 years. The start date of Hinkley Point C has successively been put back as the initial expectation was that it would commission in 201825, EDF’s anticipated commissioning date is now 202526. Other European projects have also suffered delays e.g. Flamanville 3 in France was originally intended to commission in 2012, but is now delayed until 201827. Similarly the Olkiluoto plant in Finland began construction in 2005, but is now not expected to be completed until December 201828. However, once built nuclear plants should provide low carbon generation for many years, and could certainly contribute to the 2050 emissions reduction target.
BEIS’s projected costs of nuclear are around 69 to 99 GBP/MWh for projects commissioning in 2030. The cost of Hinckley Point C is expected to be within this bracket
21 Potential CCS cost reduction mechanisms. Pöyry and Element Energy, April 2015.
22 Carbon Capture & Sequestration Technologies website. MIT, accessed 1 December 2016.
23 Sectoral scenarios for the Fifth Carbon Budget (Technical Report, Chapter 2). CCC, November 2015.
24 Letter to all EDF Energy employees regarding the Hinkley Point C financial investment decision. published on the
EDF energy website, dated 30 July 2016. 25
Speech by Hergen Heye (Office for Nuclear Development) at the European Nuclear Supply Chain conference in London, 2010.
26 https://www.edfenergy.com/energy/nuclear-new-build-projects/hinkley-point-c/news-views/agreements-in-place
27https://www.edf.fr/en/groupe-edf/producteur-industriel/carte-des-implantations/centrale-nucleaire-de-flamanville-
3/presentation 28
‘ TVO: Olkiluoto 3 to be completed in 2018 despite concerns’, Helsinki Times, September 2016.

THE FUTURE OF BIOMASS IN THE RENEWABLES PORTFOLIO
14 June 2017
19
PÖYRY MANAGEMENT CONSULTING
with a strike price of 96 GBP/MWh (real 2014 money), though it should be noted this an overstatement of the anticipated cost as it only available for 35 years where the lifetime of the project is 60 years. However, the actual cost of new nuclear is uncertain as experiences of French and Finnish plants are they can overrun. If Capex costs overrun then under the CfD that risk falls to EDF. However, the cost of nuclear waste disposal is capped by the Government, and so although EDF is required to pay the anticipated cost, if the cap is exceeded the Government will pick up the bill29.
1.2.2.4 Tidal
Tidal covers tidal barrage, tidal stream and tidal lagoon technologies. Tidal barrage and tidal lagoon projects tend to be relatively large i.e. 100s or even 1000s of MWs. At present tidal stream projects are at the demonstration stage and tend to be relatively small (a few MWs at most) but there is potential for these to be scaled up in future. The potential capacity by 2030 is unclear, but it is possible it could make a notable contribution. As discussed in Section 1.2.1 the 4GW figure quoted in Table 2 needs to be treated with some caution.
Of the three technologies, tidal lagoon has recently received the most publicity as the proposed 320MW Swansea Bay project is vying to secure a CfD contract. The developers currently anticipate construction on this site taking no longer than five years from a start date of 201730 i.e. completed by 2022. Future projects could in theory be delivered at lower cost through economies of scale and learning.
The Severn Barrage project which would have provided between 1 to 8GW was considered by Government in 2008. However the concept was shelved after a feasibility report found it would be difficult to attract private investment and the project represented "high risk"31. Given the scale of these projects this now makes it unlikely there will be any tidal barrage projects in the UK by 2030.
Tidal stream technology is still in its infancy. The largest tidal stream project at an advanced stage is the 6MW MeyGen Phase 1A project currently under construction in North Scotland. In general projects have taken longer than expected and currently rely on a relatively high level of support; the strike price for new tidal projects is currently capped at 312 GBP/MWh (real 2014 money). BEIS expects the LCOE from tidal stream to fall to 267 GBP/MWh by 2030.
1.2.3 Reliability and flexibility
Balancing the demand and supply within an electricity system requires both:
reliability – that a generating plant will produce electricity when it’s expected to; and
flexibility – that a generating plant can increase or reduce electricity production either in response to an immediate need, or may be to run at a lower load factor i.e. by regularly switching off when not needed or stay off for a prolonged period of time.
29 Waste Transfer Pricing Methodology for the disposal of higher activity waste from Nuclear Power Stations, DECC,
December 2011. 30
http://www.tidallagoonpower.com/projects/swansea-bay/ 31
Severn Tidal Power, Feasibility Study Conclusions and Summary Report, HM Government/South West RDA/Welsh assembly Government. October 2010.

THE FUTURE OF BIOMASS IN THE RENEWABLES PORTFOLIO
14 June 2017
20
PÖYRY MANAGEMENT CONSULTING
As discussed in Section 1.1 biomass, nuclear, plant fitted with CCS, and tidal are all reliable. However, biomass and potentially CCS are likely to offer the greatest flexibility in responding to demand. Below we summarise the flexibility of each technology in turn:
Biomass: technically biomass has the ability to ramp up in under an hour from minimum stable generation (MSG) and within around 3 to 9 hours from zero generation to full load depending on how warm it is. Economically it may also still be viable to run at lower load factors throughout the year. This is because biomass is a significant proportion of the overall cost of the plant.
Gas or biomass plant with CCS: technically CCS can be designed to ramp up and down as if the underlying technology was being operated without CCS. However, this has yet to be proven in practice. Economically it may also still be viable to run at lower load factors throughout the year. This is because the fuel cost is a significant proportion of the overall cost of the plant.
Nuclear: existing nuclear plants require around 3 hours’ notice to ramp up and down from MSG levels to full load; and require ~24 hours to ramp up and down from zero generation to full load, so plants are reliable but not very flexible. New nuclear reactors are expected to be more flexible and operate similarly to existing thermal plant. However, given its low fuel cost it may only be economic to run at high load factors to recover its Capex cost.
Tidal: is predictable but still intermittent so will not necessarily generate at the times it is required. If there are several projects located in different areas of the country this could help.
1.3 How the options for reliable low carbon capacity fit with CCC and National Grid scenarios
Figure 4 and Table 13 show the range of additional capacity anticipated for each reliable low carbon technology under the CCC and National Grid scenarios32. In its scenarios CCC sees most of its new reliable capacity coming from nuclear with a significant contribution from CCS. The amount of biomass is limited to 3.4GW due to sustainability concerns on CCC’s part, implying 1.5GW from new biomass or extension of biomass conversions. The National Grid scenarios show similar expansions of nuclear capacity, are far more cautious about CCS, but anticipate greater expansion of bioenergy.
Below we discuss each of the technology options in more detail in the context of the ambitions under the CCC and National Grid scenarios including the certainty around deliverability. The National Grid scenarios capture quite different demand assumptions (and so need for overall capacity). The implications of this are discussed below the technology specific sections.
32 Sectoral scenarios for the fifth carbon budget – Technical report, CCC, November 2015 and
Future Energy Scenarios., National Grid, July 2016

THE FUTURE OF BIOMASS IN THE RENEWABLES PORTFOLIO
14 June 2017
21
PÖYRY MANAGEMENT CONSULTING
Figure 4 – CCC and National Grid scenarios against capacity potential in 2030(GW)
Table 3 – Reliable low carbon deployment under CCC and National Grid scenarios
Technology Potential new deployment by 2030
CCC assumed new deployment by 2030 (or
extension of existing capacity)
National Grid assumed new deployment by 2030
Bioenergy 8 GW 1.5 GW 3-5 GW
CCS 2-3 GW 4-7GW 0-2 GW
Nuclear 10 GW 4.5-9.5 GW 4.5-9 GW
Tidal 4 GW 1 GW 0.5-2.5GW (all marine)
1.3.1 Biomass
The anticipated bioenergy capacity by 2030 in the CCC scenarios is 3.5GW. By 2015 bioenergy capacity had reached 4GW, however, around 1.9GW of this is from biomass conversion which could close in 2027. This leaves a gap of around 1.5GW of biomass to reach 3.5GW of biomass in the CCC scenarios by 2030. This gap could easily be plugged by new capacity and/or an extension of biomass conversion plant beyond 2027.
The 2030 bioenergy ambition in the CCC scenarios is well within the overall deployment potential. The relatively low ambition is due to an external constraint imposed on the scenarios because of concerns about the availability of sustainable feedstock in the face of competition from other sectors such as low-carbon heat or transport, rather than any perception that it would be stretching to go beyond this level of deployment.
The National Grid scenarios go further, anticipating bioenergy capacity of 5-7GW. With 1.9GW of existing biomass expected to still be running in 2030, this means under the National Grid scenarios 3-5GW would need to come from new bioenergy capacity or extension of support for existing biomass conversions. This seems feasible given the

THE FUTURE OF BIOMASS IN THE RENEWABLES PORTFOLIO
14 June 2017
22
PÖYRY MANAGEMENT CONSULTING
potential for future capacity and could include new bioenergy projects including further biomass conversions as well as the extension of existing biomass conversions beyond 2027.
1.3.2 CCS
The CCC scenarios were put together before the cancellation of the CCS commercialisation project and therefore the level of CCS build in these scenarios appears over-ambitious. If 2-3GW of CCS capacity is feasible by 2030 this leaves a capacity gap of around 2 to 4GW to be filled by other low carbon reliable technologies. NGCs scenarios were put together after the decision and so attribute a much smaller role to CCS.
1.3.3 Nuclear
The lower end of the CCC and NGC scenarios is 4.5GW. This could be fulfilled by Hinkley Point C plus the 1.2GW of nuclear capacity still assumed to be online. To achieve a capacity of 9GW or more would require two further projects, or one further project and life extension of Heysham or Torness. This capacity is feasible, particularly at the lower end, but given the uncertainty over timescales for new nuclear projects (see Section 1.2.1) is not without risk.
1.3.4 Tidal
The CCC includes 1GW of tidal capacity by 2030 in its scenarios. National Grid projects 0.5 to 2.5GW (for all marine technologies) by 2030. Whilst more capacity may be feasible, there is no certainty around the amount of feasible capacity at this stage and so like nuclear and CCS there are risks around deliverability if relying on a further expansion beyond that anticipated under the CCC and National Grid scenarios.
1.3.5 The implications of electricity demand assumptions
CCC total annual demand assumptions (before losses) are 355TWh by 2030, this is an increase of 8% from today’s levels largely as a result of electrification of heat and transport. National Grid total annual demand assumptions are more conservative and vary according to the scenario: 322TWh for slow progression, 331 for consumer power and 346TWh for gone green.
In National Grid’s scenarios high capacity tends to be coupled with high demand and vice versa. This is because electricity demand is expected to relate to the general health of the economy. However:
demand level is not just about health of the economy but is also dependent on other trends e.g. the level of heat and transport electrification;
technology progression is also not just related to a healthy economy - it is also dependent on other issues e.g. policy incentives, technical challenges.
This means it is possible to have slow technology progression but moderate-high demand leaving a capacity gap if the lower end of ambition ranges is achieved in National Grid scenarios.

THE FUTURE OF BIOMASS IN THE RENEWABLES PORTFOLIO
14 June 2017
23
PÖYRY MANAGEMENT CONSULTING
Some of the capacity gap is also plugged in higher demand scenarios with 23GW of interconnection, which whilst feasible, may be considered at the higher end of what could occur33. The CCC scenarios assume no net flows across interconnectors.
1.4 The role biomass can play in providing low carbon reliable capacity
As discussed in Sections 1.1 to 1.3, biomass has a number of advantages as an option to provide low carbon reliable capacity:
it can be commissioned in a relatively short timescale (particularly biomass conversion);
the technology for biomass has been demonstrated to work;
there is good level of certainty over the cost and timing of biomass projects;
established technologies can establish supply chains and expertise for more innovative bioenergy technologies e.g. biomass electricity with CCS;
it is reliable and provides flexibility to increase or reduce electricity generating capacity in response to demand as well as to reduce generation for prolonged periods.
Irrespective of the relative cost of intermittent and reliable generation costs, there will need to be a certain amount of reliable capacity on the system to enable balancing of supply and demand.
The CCC and National Grid scenarios both anticipate the need for growth in reliable low carbon capacity. In the case of the National Grid scenarios an additional 3 to 5GW of biomass electricity capacity is anticipated. In the case of the CCC scenarios an additional 1.5GW of biomass electricity capacity is anticipated and there is a capacity gap of around 2 to 4GW assumed to be filled by CCS which no longer looks viable. As the deployment of nuclear already appears close to the upper limit and the potential deployment from tidal is uncertain, biomass provides a dependable option to fill this gap. If so, this would then require a total of 3.5 to 5.5GW of new biomass.
There is currently a 0.3GW dedicated biomass plant under construction with a CfD contract and there may be some minor additions under the Renewables Obligation before it closes. The remainder of the 3.5 to 5.5GW could come from a range of technologies if incentivised under the CfD. This includes biomass conversion which could add 4.2GW from extending the support for existing and CfD contracting biomass conversions beyond 2027. In addition there is potential to convert further units of Drax and potentially other existing coal stations.
Biomass conversion provides reliable generation at a lower cost than other reliable alternatives such as nuclear, tidal or CCS, and furthermore it has been proven to work at these costs. This means that the risk that Capex and Opex are higher than expected is low as they are not reliant on learning rate assumptions to achieve these costs.
33 Costs and benefits of GB interconnection, a Pöyry report to the National Infrastructure Commission, Pöyry.
February 2016.

THE FUTURE OF BIOMASS IN THE RENEWABLES PORTFOLIO
14 June 2017
24
PÖYRY MANAGEMENT CONSULTING
Biomass also provides a good risk management option. Of all the reliable low carbon options it is the one that can make the biggest contribution in 2025 – the point at which the system could be tight on reliable capacity. In 2030 it can fill the gap if there is an under supply in other reliable low carbon technologies, for example if nuclear does not deliver the capacity expected by 2030 or if there is higher demand due to greater electrification of heat and transport than expected. If there is too much low carbon capacity for biomass to run all the time by 2030, it can run still run economically at lower load factors. Whilst the lifetime of biomass conversions is less than new purpose built plant, it can contribute to longer term goals through building up biomass supply chains and expertise.
However, if biomass conversion is to be used the Government will need to act promptly. The option for biomass conversion is only available for the next few years, after which time plans to close the coal plants will be advanced and it may be more difficult to reverse this decision.

THE FUTURE OF BIOMASS IN THE RENEWABLES PORTFOLIO
14 June 2017
25
PÖYRY MANAGEMENT CONSULTING
2. THE OUTLOOK FOR BIOMASS SUPPLY COSTS
2.1 The wood pellet supply chain and major cost drivers
The wood pellet supply chain follows the same basic steps across all regions analysed, with differences in delivered costs for pellets coming from variances in individual cost components, such as wood price, power price, and labour costs, as well inland transport and shipping distances. We have calculated the supply cost for pellets produced in each potential supply region (US Southeast, Eastern Canada, Nordics, Baltics, Portugal, NW Russia, and Brazil) and delivered to a port in the UK.
This has been conducted using our Virtual Pellet Mill tool, a bottom up cost calculation model that allows us to calculate pellet production costs at any given location globally by adjusting elements such as mill size, input cost levels, and mill set up. The supply chain itself can be broken down into five key steps, each with their own specific cost drivers, as follows:
Biomass sourcing and transport to mill – on average this step represents the largest cost element of the entire supply chain, accounting for between 29% and 51% of the total supply chain cost across the analysed regions (see Figure 7). Biomass prices themselves are driven by local market dynamics; where there is higher local demand pressure and biomass supply becomes constrained, this can lead to higher delivered biomass prices. The largest driver behind the cost of transport from forest to pellet mill is the distance, with pellet mills in regions such as the US Southeast typically sourcing within a 70 to 100 mile radius from their mill site.
Wood yard and chipping – Biomass feedstock is first delivered and stored in a wood yard prior to chipping, with a stockpile of material allowing for continued operation in times where biomass deliveries cannot be made, e.g. adverse weather. With regards to chipping, biomass can either be chipped directly in the forest using a mobile chipper, or can be chipped at the pellet mill site. Chipping at the pellet mill is lower cost and also allows for better control of bark flows, as bark can be more easily removed and collected before chipping if premium pellets are to be produced, and can then be used as dryer fuel in place of additional biomass feedstock. In our pellet production cost analysis, chipping is assumed to be conducted at the pellet mill. It should be noted that some mills may be able to save costs by operating a small chipping line or foregoing one entirely if they can secure sawmill residues as part or all of their feedstock mix, as this material comes in an already chipped form. This is common in British Columbia, where sawmill residues are the main feedstock available to the market and pellet mill operators often form strong relationships with sawmill operators.
Drying – Following chipping all biomass feedstock must be dried to a moisture content of ~10% to ~15% before being further processed into pellets. This is a common process used elsewhere within the forest industry, and there a number of different drying methods available, such as drum drying and belt drying. While there are differences in the cost of these technologies, the main cost driver for this step of the supply chain is the starting moisture content of the biomass feedstock and the intended final moisture content, as these directly impact upon the drying time required. An additional cost for larger-scale mills (above 250,000 tonnes in capacity) is propane, which is used in emissions control systems, a necessity for meeting environmental regulation in regions such as the US Southeast. In our calculations it has been assumed that biomass is used as a fuel for the dryers, with the price of this fuel also then having an impact on the pellet production cost. This can be seen in Figure 7.

THE FUTURE OF BIOMASS IN THE RENEWABLES PORTFOLIO
14 June 2017
26
PÖYRY MANAGEMENT CONSULTING
Hammermilling and pelleting – Once dried chipped biomass is further processed into finer particles using hammermills, and is then extruded at high pressure through dyes in a pellet press, creating the actual pellets. At high pressure the lignin in the wood is heated and binds the biomass together acting as natural glue. Hammermills and pellet presses are modular, with an increase in the number of hammermills and pellet presses being a factor in increasing the capacity of a pellet mill, rather than the installation of increasingly larger presses or dyes. Cost drivers for these steps include electricity, labour, and maintenance costs, all of which also impact on the chipping and drying steps.
Storage – As an interim step before transport to an export port, if pellets cannot be loaded directly onto trucks or rail cars for transport to the export port, they will be stored in buffer storage. This allows for continued operation of the plant around transport scheduling, but there would not typically be long-term storage at the pellet mill site.
Transport to export port – The method of transport used varies for each pellet mill based on distance but also specific contract arrangements. Truck transport has lower fixed costs and is more appropriate for short distances while train transport is more appropriate for longer distances. Fuel cost is an important consideration and cost driver in both of transport methods, accounting for ~38% of the overall transport cost per mile for truck transport and ~20% of the per mile transport costs for rail transport. Two sets of inland transport costs have been calculated and shown in in Figure 7, firstly assuming 70 miles of truck transport to a suitable export port, and secondly assuming 350 miles of rail transport to a suitable export port.
Shipping to consumer – This final step of the supply chain accounts for between 9% and 19% of the total delivered cost, and is driven by three main factors; vessel size, fuel cost, and shipping distance. We have assumed that the charter rate for vessels remains the same irrespective of size (7,500 USD per day), with larger vessels therefore providing some economies of scale. Fuel cost is linked to oil prices but also to transport distance, with the amount (and hence cost) of both LSMGO and hSFO required being calculated. Following the introduction of Emission Control Areas (ECAs) for shipping within certain sea areas around ports in Europe and North America we have calculated the amount of time spent in these areas and in open waters. We have then assumed that LSMGO is used while in port and in the ECAs, allowing vessels to meet the 0.1% sulphur content limits, with hSFO being used while in open waters. Also included within these shipping costs are the port storage, handling, and loading costs at the export port, which are assumed to be 10 USD per tonne of pellets. Unloading costs at the receiving port are not included but would amount to approximately 5.1 USD per tonne of pellets.
There is an additional cost shown within Figure 7 that is not part of the pellet supply chain but must still be accounted for, the Capex cost. This is an important part of the total delivered cost accounting for between 11% (Portugal) and 32% (Brazil) of the total production cost in each region. These Capex costs have been calculated based on the assumption that all capital investments are repaid within 10 years of the mill being commissioned.
A key input in the Capex cost is the assumed Weighted Average Cost of Capital (WACC) which covers the expected return for the initial project investment. It can also be used as a proxy for the business environment in different regions, being higher where the business environment is considered to be more difficult. The WACCs for all regions covered can be found in Table 4 but this is highlighted in the difference between the WACC for the US Southeast (8%) and the WACC for NW Russia (10%).
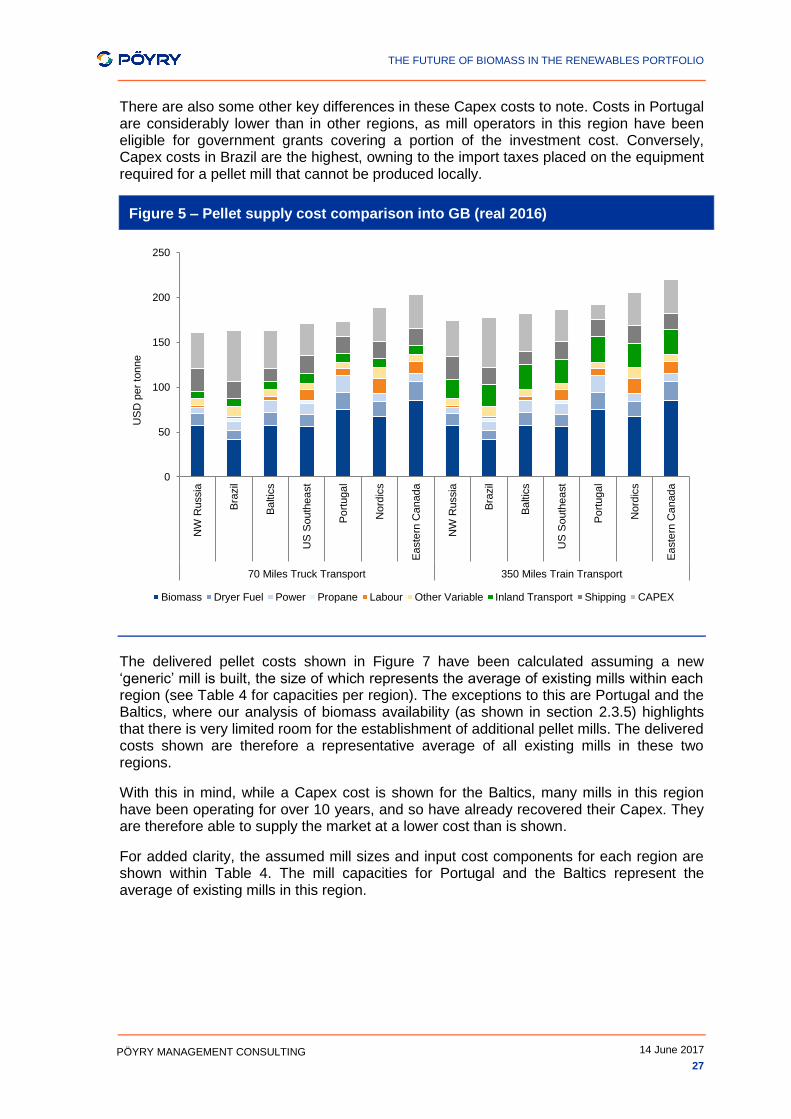
THE FUTURE OF BIOMASS IN THE RENEWABLES PORTFOLIO
14 June 2017
27
PÖYRY MANAGEMENT CONSULTING
There are also some other key differences in these Capex costs to note. Costs in Portugal are considerably lower than in other regions, as mill operators in this region have been eligible for government grants covering a portion of the investment cost. Conversely, Capex costs in Brazil are the highest, owning to the import taxes placed on the equipment required for a pellet mill that cannot be produced locally.
Figure 5 – Pellet supply cost comparison into GB (real 2016)
The delivered pellet costs shown in Figure 7 have been calculated assuming a new ‘generic’ mill is built, the size of which represents the average of existing mills within each region (see Table 4 for capacities per region). The exceptions to this are Portugal and the Baltics, where our analysis of biomass availability (as shown in section 2.3.5) highlights that there is very limited room for the establishment of additional pellet mills. The delivered costs shown are therefore a representative average of all existing mills in these two regions.
With this in mind, while a Capex cost is shown for the Baltics, many mills in this region have been operating for over 10 years, and so have already recovered their Capex. They are therefore able to supply the market at a lower cost than is shown.
For added clarity, the assumed mill sizes and input cost components for each region are shown within Table 4. The mill capacities for Portugal and the Baltics represent the average of existing mills in this region.
0
50
100
150
200
250
NW
Russia
Bra
zil
Ba
ltic
s
US
South
ea
st
Po
rtuga
l
Nord
ics
Ea
ste
rn C
anada
NW
Russia
Bra
zil
Ba
ltic
s
US
South
ea
st
Po
rtuga
l
Nord
ics
Ea
ste
rn C
anada
70 Miles Truck Transport 350 Miles Train Transport
US
D p
er
tonne
Biomass Dryer Fuel Power Propane Labour Other Variable Inland Transport Shipping CAPEX

THE FUTURE OF BIOMASS IN THE RENEWABLES PORTFOLIO
14 June 2017
28
PÖYRY MANAGEMENT CONSULTING
Table 4 – Pellet mill input costs and assumptions
Variable Unit US
Southeast Eastern Canada
Nordics Baltics Portugal NW
Russia Brazil
Mill capacity 1,000 tonnes 400 200 200 ~150 ~110 200 400
Currency n/a USD CAD EUR EUR EUR RUB BRL
Exchange Rate USD/cur 1 1.34 0.95 0.95 0.95 61.10 3.27
WACC % 8% 8% 8% 10% 10% 10% 10%
Wood Price USD/odt 60.9 92.5 73.4 62.2 81.9 61.9 45.2
Electricity Price USD/MWh 59.3 45.9 42.3 67.6 95.7 31.9 59.6
Labour Price USD/unit 81,014 56,795 72,703 12,982 18,420 14,861 21,641
Variable Truck Cost
USD/t/mile 0.10 0.10 0.09 0.09 0.09 0.08 0.14
Fixed Truck Cost
USD/t 5.76 5.42 4.88 5.12 5.28 4.21 2.49
Variable Rail Cost
USD/t/mile 0.041 0.042 0.042 0.043 0.045 0.040 0.043
Fixed Rail Cost USD/t 16.40 16.59 14.45 17.34 17.73 11.22 14.94
Shipping Distance
nm 4,360 2,861 994 1,077 1,086 1,299 4,108
Charter Rate USD/day 5,500 5,500 5,500 5,500 5,500 5,500 5,500
LSMGO Fuel Cost
USD/t 650 650 650 650 650 650 650
hSFO Fuel Cost
USD/t 330 330 330 330 330 330 330
Along with analysing the cost of supplying pellets from different regions we have also assessed the sensitivity of supply chains to changes in each cost element. This sensitivity analysis has been based on the supply cost for the US Southeast, as shown in Figure 7. The effects of changes in capacity, WACC, shipping charter rates, and the costs of biomass, electricity, labour, inland transport, and shipping fuel (LSMGO and hSFO combined) have all been assessed. Each cost element has been adjusted by +/- 20% to gauge supply chain sensitivity, with the exception of the WACC which has been adjusted in percentage point increments (e.g. +5% equates to a 1 percentage point increase and +10% a 2 percentage point increase etc.).
The results of this analysis can be seen in Figure 6, where it is clear that changes in biomass cost and WACC have the most significant impact on the overall supply chain cost. This is somewhat to be expected given that the biomass costs (both for pellet feedstock and dryer fuel) and Capex account for around 60% or more of the total supply chain cost combined in all regions (when comparing mills 70 miles from an export port). Changes in inland transport cost can also have a noticeable impact on the overall supply chain cost, with a total difference of 7 USD/t across the range analysed.
The impact of changes in shipping charter rate and the costs for shipping fuel, electricity, and labour are substantially smaller. For the electricity and labour costs, this is to be expected as these two cost components already only contribute a small portion of the

THE FUTURE OF BIOMASS IN THE RENEWABLES PORTFOLIO
14 June 2017
29
PÖYRY MANAGEMENT CONSULTING
overall supply chain costs. For the shipping cost elements, while shipping can account for between 9% and 19% of the overall supply chain cost, a large portion of this cost (over 60% in some regions) is actually associated with port fees, storage, and handling, rather than fuel costs and charter rates.
Figure 6 – Pellet supply chain cost sensitivity
*WACC has been assessed in 1 percentage point increments, rather than percentage change.
2.2 Domestic biomass availability in GB
This section describes the current and future availability of wood based biomass in GB that could be utilised by an expanding bioenergy sector. Whilst currently there is a wood biomass surplus of around 1.5 Modt in the GB market, this surplus is expected to be fully consumed within the coming few years due to the expanding biomass heat sector and biopower projects currently under construction or in very advanced development stages.
It becomes clear that the GB market does not offer any viable potential to supply large scale biomass conversion projects with fuel in the near to mid-term future, without entering into severe competition with existing biomass consumers. Biomass conversion projects will have to continue to rely on the international market which offers good surplus potentials (see Section 2.3).
2.2.1 GB biomass supply
There is currently a total annual supply potential of around 7.6 Modt of biomass in GB, of which 64% (4.8 Modt) comes from virgin sources in the form of pulpwood, sawmill residues, harvesting residues, and arboricultural arisings. The remaining 2.7 Modt is post-consumer wood waste, generated largely by the construction, demolition, and packaging industries.
The availability of biomass is expected to increase by ~20% between now and 2030, as more wood waste is recycled and recovered and more forest lands reach maturity. Not all forest stands in GB are currently harvested, and potential remains within ‘overdue’
155
160
165
170
175
180
185
-20% -15% -10% -5% Base +5% +10% +15% +20%
US
D p
er
tonne (
real 2016)
Capacity Biomass PowerLabour Inland Transport Shipping FuelCharter Rate WACC*

THE FUTURE OF BIOMASS IN THE RENEWABLES PORTFOLIO
14 June 2017
30
PÖYRY MANAGEMENT CONSULTING
volumes that were previously too costly to access but may come to the market if biomass prices increase due to increasing demand.
Higher demand will also lead to more active management of existing forest areas, especially hardwood areas, with more of this material being harvested and feeding into the market. Harvested commercial hardwood stands currently only account for ~5% (0.3 Modt) of the supply volume in GB (including sawlogs), but this could increase to almost 10% (0.8 Modt) by 2020.
The availability of post-consumer wood waste is also expected to increase. Increased recovery and recycling rates could lead to a 45% rise in the availability of this feedstock. This post-consumer wood waste can be further categorised into high and low quality material, representing ~38% and ~62% respectively.
High quality material is already widely utilised, being an important feedstock for the wood based panels sector for the production of particleboard and MDF, but low quality wood waste has seen limited use in the past although it will become an important feedstock for the bioenergy sector going forward.
Figure 7 – Biomass supply development in GB
2.2.2 GB biomass demand
The traditional forest industry (pulp and wood based panels producers) only accounts for 38% (2.3 Modt) of biomass demand, and only a small amount of demand growth is expected in the wood based panels sector (9%) due to the expansion of an OSB mill.
The bioenergy sector is already the second largest biomass consumer in the market, accounting for 1.6 Modt (20%) of all market demand in 2015 across 527 MW of capacity. This sector is also expected to see considerable growth following the ongoing development of a number of projects that are either already under construction or have just recently been financed. In total 460 MW of new capacity is expected to enter the market before 2020, increasing demand from this sector up to 3.5 Modt per year.
0
2,000
4,000
6,000
8,000
10,000
12,000
2015 2020 2025 2030 2035
1,0
00 o
dt
Pulpwood Sawmill Residues Harvesting Residues Arboricultural Arisings Wood Waste

THE FUTURE OF BIOMASS IN THE RENEWABLES PORTFOLIO
14 June 2017
31
PÖYRY MANAGEMENT CONSULTING
Demand from the wood pellet sector currently totals 0.4 Modt. There is currently 500 ktpa of pellet production capacity in GB, with an additional 90 ktpa of announced planned capacity. The existing capacity is not yet operating at full capacity, and we would expect capacity utilisation rates at these mills to increase before any further capacity is developed.
The biomass heating sector has the potential for significant growth, depending on the future development of new capacity under the Renewable Heat Incentive (RHI). The RHI scheme has just been closely reviewed by the government, with changes to the way biomass tariffs work coming into effect as of 1st April 2017. There will now be only one biomass tariff under the non-domestic RHI, which in most cases is lower than the previously offered tariffs. This allows for more capacity to be supported for the same amount of money, however, our analysis shows that it also makes small-scale non-domestic biomass boilers (below 200 kW in size) uneconomical, which is where the majority of past growth in this sector has been seen.
Given that up-take of the biomass RHI by large-scale non-domestic boilers (above 1 MW in size) has historically been low, with in our analysis we have assumed that not all of the money budgeted for biomass technologies will be spent by 2021. Instead we have assumed only 75% of the available funds will be committed and spent, with 50% accounted for by new large-scale boilers and the remaining 25% accounted for by new medium-scale boilers (between 200 kW and 1 MW in size). As a result demand from this sector is expected to increase by 2 Modt by 2020, and up to a total of 2.9 Modt over the long-term.
Demand from the animal bedding sector accounts for just 9% (0.5 Modt) of the total biomass demand in GB currently, and is not expected to see any significant developments going forward. Demand for biomass for export is also small, totalling 0.4 Modt of mostly wood waste, and is expected to cease in the next few years as domestic demand increases.
Demand from large-scale biomass conversion and greenfield projects is not included within this analysis as these consumers, namely Drax, Lynemouth, and MGT Power, are currently either importing all of their required feedstock or are expected to do so once they become operational. These consumers require significantly more feedstock than the GB market can offer unless they were to out-compete all other consumers in the market, which is not in their interest. We therefore do not expect any of these consumers to source feedstock from the GB market at any point.

THE FUTURE OF BIOMASS IN THE RENEWABLES PORTFOLIO
14 June 2017
32
PÖYRY MANAGEMENT CONSULTING
Figure 8 – Biomass demand development in GB
2.2.3 GB Market balance and uncertainties
There is a current biomass surplus in the GB market of ~1.5 Modt consisting of mostly virgin biomass, however, as the bioenergy and renewable heating industries grow this surplus will be quickly utilised leading to a domestic biomass demand deficit and a need for imports from overseas. Going forward as the biomass supply in GB gradually increases it could be expected that the market will almost balance out, with limited imports (~29,000 odt) required by 2030.
It is important to note that there are market uncertainties that could potentially alter this picture going forward. The most notable of these is the renewable heating sector, demand growth from which is dictated by the RHI. As previously noted, this scheme has now been fully, but our analysis shows that small scale boilers and some medium scale biomass boilers may no longer be economically attractive. As a result companies may be even less willing to install these boilers than we have already assumed, and there is the potential that this lower tariff could prevent further investment in small and medium scale boilers entirely, leading to an almost stagnation of demand from this sector.
Adversely, if wood waste material cannot be mobilised as expected, or yields from newly maturing GB forests are not realised as expected there could continue to be a lack of domestic biomass requiring further imports of feedstock.
0
2,000
4,000
6,000
8,000
10,000
12,000
2015 2020 2025 2030 2035
1,0
00 o
dt
Pulp Wood Based Panels Bioenergy Pellets Renewable Heating Animal Bedding Export

THE FUTURE OF BIOMASS IN THE RENEWABLES PORTFOLIO
14 June 2017
33
PÖYRY MANAGEMENT CONSULTING
Figure 9 – Expected balance of biomass in GB
2.3 International biomass availability
The following sections assess the current and future availability of wood biomass from a number of select supply regions, including the US Southeast, Canada East, Brazil, the Baltics, Northwest Russia, the Nordics, and Iberia. These regions have been selected as GB biomass conversion projects are either already souring from there or because these regions offer a good balance of biomass surplus availability, supply cost and available infrastructure. There are other potential international supply regions, however, these could not be considered within the scope of this study.
Pöyry has analysed the current and likely future biomass supply and demand situation of these select regions, based on an assessment of the development of biomass consuming industry sectors and the overall availability of material. Publically available statistics, covering both supply and demand, have been used where available. Uncertainties within these projections, which could have an impact on the development of either supply or demand and which cannot be foreseen by Pöyry, are noted in the following country chapters.
All analysed regions show a positive current and future biomass surplus which can be utilised by an expanding bioenergy sector in GB. The surplus volumes are expected to increase in US Southeast, Canada East and the Nordic States. The surplus availability in Brazil, Northwest Russia, the Baltics and Iberia is expected to decrease, however all these regions will still offer a remaining positive surplus availability (see Table 5). The total current theoretical biomass surplus potential consists of 78 Modt of pulpwood, 34.5 Modt of harvesting residues and 27.4 Modt of sawmill residues in the selected regions. This surplus potential will change by 2035 to 62.9 Modt of pulpwood, 45.7 Modt of harvesting residues and 24.6 Modt of sawmill residues.
It should be noted that the accessibility of the biomass surplus largely depends on a successful mobilisation of the currently un-mobilised sustainable yield in forests. Final fellings and mid- to later stage thinning operations produce larger dimension sawlogs and
0
2,000
4,000
6,000
8,000
10,000
12,000
Supply Demand Supply Demand Supply Demand Supply Demand Supply Demand
2015 2020 2025 2030 2035
1,0
00 o
dt
Supply Demand Surplus Deficit

THE FUTURE OF BIOMASS IN THE RENEWABLES PORTFOLIO
14 June 2017
34
PÖYRY MANAGEMENT CONSULTING
a successful mobilisation of additional forest resources will to some extend also depend on an expanding sawmilling industry as offtake market for these sawlogs.
However, forest owners may also decide to bring some of their assets to market without strong demand for sawlogs as long as the harvesting operation overall still results in a net profit. What share of the identified surplus potential could eventually be mobilised is difficult to judge at this stage and depends on a number of factors.
Table 5 – Surplus development between 2015 and 2035 in all assessed regions
Surplus 2015 (M odt) Surplus 2035 (M odt) Total Surplus Development
Pulplogs Harvesting Residues
Sawmill Residues
Pulplogs Harvesting Residues
Sawmill Residues
US
Southeast 10.5 7.8 9.9 18.7 15.5 13.8
Canada East
6.2 1.6 4.3 7.4 4.3 2.3
Brazil
36.1 4.0 2.5 19.2 2.7 0.7
Baltics
0.7 2.7 0.3 0.2 1.5 0.1
Northwest
Russia 15.9 13.7 6.6 10.4 14.6 6.2
Nordics
5.6 2.7 2.8 5.3 5.7 0.9
Iberia
3.0 2.0 1.0 1.7 1.4 0.6
Pöyry’s in-house demand outlooks for established wood consuming industries (pulp & paper, wood based panels, sawmilling, etc.) in these regions are connected to a good level of certainty. The outlook for biomass trade flows and bioenergy support schemes on the other hand presents the projections with a higher level of uncertainties as both are highly dependent on political decisions.
Biomass trade flows have been assumed as stable throughout the projection period from 2015 to 2035. Export and import of roundwood can have an impact on domestic price level and therefore also on demand from consuming industry sectors.
New policies regarding support schemes for bioenergy and cellulosic biofuels generation in the selected supply regions, but also in importing countries and regions like the European Union, may unfold a profound impact on the demand for wood based fuel products, which could in turn decrease biomass availability for the industry or for export. .

THE FUTURE OF BIOMASS IN THE RENEWABLES PORTFOLIO
14 June 2017
35
PÖYRY MANAGEMENT CONSULTING
2.3.1 General assumptions and Sankey flow charts
Sankey flow-charts have been used to show the current and future supply and demand situation of biomass feedstocks across the forest industry in each region that has been analysed (Figure 10).
Figure 10 – Example of Sankey Flow Chart
For this analysis we have assessed the total biomass supply potential, which is defined as the sustainably harvestable increment on timberland which is suited for harvesting. Nature conservation areas or public forests with alternative primary uses have not been taken into account. The biomass supply potential is divided into different key assortments, demand from different industries consuming this material, and the resulting surplus volumes that could be available as fuel for an expanding bioenergy sector.
All arrows symbolize the flow of a specific assortment and its volume, with the arrows being proportional in size. Green arrows represent biomass supply, of which the arrows in dark green colours symbolize the harvested volume and the arrows in light green colours the un-mobilised sustainable yield. The un-mobilised sustainable yield represents volume which is not currently harvested but could be without the harvesting levels exceeding the annual increment within the same period. The blue arrows represent the industry sectors and their demand. The orange arrows indicate the surplus of biomass. Imports are presented in light blue, and only shown if they are considered to be significant (>0.1 million odt).
The assessment of the supply potential only takes into account wood biomass from managed forest land and plantations. It should be noted that for Brazil, only biomass supply from commercially managed forest plantations has been considered, not biomass from natural forests.
The supply potential for the starting year (2015) has been sourced from official statistics. Some countries (USA, Canada, and Baltic States) provide future projections for biomass supply as calculated by their forestry research institutions. In these cases such projections

THE FUTURE OF BIOMASS IN THE RENEWABLES PORTFOLIO
14 June 2017
36
PÖYRY MANAGEMENT CONSULTING
have been used, while for the other countries or regions, in-house Pöyry models have been used to estimate the future supply potential up to 2035.
The biomass assortments covered include; sawlogs, pulplogs, harvesting residues and sawmill residues. All figures are calculated on an ’under bark’ basis with bark excluded. This means that industries, which are able to use bark (e.g. energy generation facilities), can add 12% additional volume, which is used as an average bark content of the overall biomass volume, for bark on the pulplogs shown as surplus. Sawlogs are assumed to only be used by sawmills or the plywood industry. The availability of sawmill residues has been calculated based on the sawlog intake of this industry sector and by applying specific sawnwood conversion factors (53% sawnwood, 35% residues as wood chips and 12% residues as sawdust). The same approach has been taken for the mill residues from plywood production, albeit with different conversion factors (48.5% plywood, 48.5% residues as wood chips and 3% residues as sawdust). The sawnwood and plywood residues are aggregated in the Sankey flow-charts under ‘sawmill residues’.
Pulplogs include all smaller roundwood assortments not declared as sawlogs. Harvesting residues are calculated as an uplift based on the sawlog and pulplog harvest using a region specific factor based on a review of literature sources, historic harvesting figures and considering technical and environmental limits. The uplift factor used for the US Southeast, Nordic States, and Northwest Russia is 16%, for Iberia 15%, for Canada East 11%, for the Baltic States 10%, and for Brazil 5%.
The projections for future demand from the sawmilling and panel board industries have been calculated using in-house Pöyry data. It is assumed that these industry sectors are strongly linked to the construction sector. Where appropriate, the increase or decrease in the construction sector leads to a growth or decline in demand for sawnwood and panel board products respectively.
Demand projections for the pulp industry are also based on in-house Pöyry data, specifically our outlooks for the demand for the different pulp grades produced in each analysed region. Pulp grade specific wood consumption factors were then applied to assess the total current and future wood demand from this industry.
Future demand developments in the industrial pellet sector have been calculated using the central scenario of Pöyry’s Global Pellet Market Model.
Trade data, which includes imports and exports of wood raw material, were extracted from national statistics or Eurostat Comext. Export and import volumes were assumed to remain flat across the projection period, due to the high uncertainty of market developments within each regions’ trading partners, unless biomass demand became tight in which case exports were assumed to decrease as required. The trade data for the US Southeast and Canada East has been derived by assessing exports and imports from specific harbours situated within the included US states and Canadian provinces. Since there is also trade from further inland to these harbours, an overestimation of the imported and exported volumes may have been included, although the impact of such is expected to be negligible. The export of pellets is not included in the export figures presented in the region specific results because the demand from the pellet industry accounts for all the biomass used for pellet production and it would result in a double counting if also stated in the export figures.
The total biomass surplus in each region has been calculated by combining the un-mobilised sustainable potential and the surplus harvested volume. It should be noted that individual assortments within the un-mobilised yield cannot be accessed without harvesting the entire tree. The exceptions are thinning operations which typically yield insignificant volumes of sawlogs, if any at all. Forests assets which are due for final felling

THE FUTURE OF BIOMASS IN THE RENEWABLES PORTFOLIO
14 June 2017
37
PÖYRY MANAGEMENT CONSULTING
are usually only harvested if there is a demand for sawlogs (with the exception of thinning operations), as these are the highest value portion of the tree and just harvesting a tree for pulplogs or harvesting residues is not an economically feasible option. Therefore, there will need to be an increase in demand for sawlogs or sawn timber (e.g. through increased housing starts) in order for the entire un-mobilised yield to become accessible in the market. Eucalyptus plantations in Brazil are an exception to this rule as they are mainly managed on shorter rotations and do not yield sawlog assortments.
2.3.2 US Southeast
For this assessment, the US Southeast has been defined as the following nine coastal states: Texas, Louisiana, Mississippi, Alabama, Florida, Georgia, South Carolina, North Carolina, and Virginia. These are the most relevant US states for pellet production targeting the European market. The following two figures (Figure 11, Figure 12) present the biomass supply and the industry demand in 2015 and 2035 as well as the un-mobilised sustainable yield and surplus volumes.
Figure 11 – US Southeast 2015: Supply & Demand

THE FUTURE OF BIOMASS IN THE RENEWABLES PORTFOLIO
14 June 2017
38
PÖYRY MANAGEMENT CONSULTING
Figure 12 – US Southeast 2035: Supply & Demand
The overall biomass supply potential, based on data from the USDA34, is expected to grow from 160 million odt (Figure 11) to 183 million odt (Figure 12). The USDA35 is expecting that total sustainable fibre availability will increase, as softwood yields are predicted to rise due to improved forest management, and a rebound effect after the recession leading to a larger area of planted forests. Pöyry expects an increase in the surplus of potentially available forest biomass from 28.2 million odt in 2015 (Figure 11) to 48 million odt in 2035 (Figure 13). The 48 million odt of surplus in 2035 consists of 18.7 million odt of pulplogs, 15.5 million odt of harvesting residues, and 13.8 million odt of sawmill residues. It should be noted that a large portion of this surplus will be contained within the un-mobilised yield, with an increase in demand for sawlogs required before it is likely that this material will actually come to market.
34 Developing Inventory Projection Models Using Empirical Net Forest Growth and Growing-Stock Density
Relationships
Across U.S. Regions and Species Groups, P. Nepal et al., July 2012 35
Developing Inventory Projection Models Using Empirical Net Forest Growth and Growing-Stock Density Relationships
Across U.S. Regions and Species Groups, P. Nepal et al., July 2012

THE FUTURE OF BIOMASS IN THE RENEWABLES PORTFOLIO
14 June 2017
39
PÖYRY MANAGEMENT CONSULTING
Figure 13 – US Southeast: Supply & Demand Development 2015 to 2035
The US Southeast is projected to see an increase in the construction sector out to 2020, as the US continues to recover from the downturn in 2008/2009. After 2020 there will be a slow decrease in the construction sector since a sufficient housing stock is likely to have been built by this time. It is then assumed to plateau from 2030 onwards. The construction sector influences the sawmilling, plywood, and panel board industries, and its demand for biomass from these sectors is assumed to develop in line with the construction sector. With a decline in the construction sector after 2020 the volume of sawlogs harvested is estimated to also decrease, which will result in less sawmill residues and pulpwood being available in the market. Decreases in demand along with increases in sustainable supply will lead to a larger surplus in the long term; however, this surplus is only expected to be available if further growth in the sawmilling sector is seen.
The pulp industry in the US Southeast is anticipated to have an overall stable demand over the projection period, with biomass demand hardly changing from 66.2 million odt in 2016 to 66.7 million odt by 2035 (Figure 11, Figure 12). Some speciality grades, such as those used to produce packaging and hygiene papers are forecasted to see a demand increase, while demand for pulp grades used to produce printing and writing papers are estimated to decrease due to increases in the use of technology to portray media. This development might have stronger effects locally while the overall regional balance will remain unchanged.
The projection for the industrial, commercial, and residential energy generation sectors is based on an EIA report36 covering these markets up to 2040. Whereas industrial energy generation is projected to increase, commercial energy generation is expected to remain stable and residential energy generation, considering marketable volumes of biomass in the EIA report, is projected to decrease from 2.9 million odt in 2015 to 2.5 million odt in 2035. The future of the Clean Power Plan, which could have a significant impact on
36 U.S. Energy Information Administration (EIA), August 2016. Annual Energy Outlook 2016 with projections to 2040.
http://www.eia.gov/outlooks/aeo/pdf/0383(2016).pdf
0
20
40
60
80
100
120
140
160
M o
dt
Supply Demand Surplus: Pulplogs Sawmill residues Harvesting residues

THE FUTURE OF BIOMASS IN THE RENEWABLES PORTFOLIO
14 June 2017
40
PÖYRY MANAGEMENT CONSULTING
biomass demand from energy generation, is still uncertain and so has not been included for the time being.
The pellet industry, which currently consumes approximately 9.3 million odt of biomass, is expected to see an increase in demand out to 2020, followed by a decline down to around 6.3 million odt by 2028. This is due to some incentive schemes in Europe coming to an end, specifically in the UK in 2027 and in the Netherlands between 2026 and 2028. This could change if European governments decide to continue supporting pellet consuming power stations, or if pellet suppliers manage to successfully enter the emerging Asia Pacific market. Alternatively, if the Clean Power Plan is implemented and results in a substantial domestic biomass co-firing industry in the US Southeast, this could also prevent the decline in the pellet industry.
Trade data for the imports and exports of wood were sourced from the US International Trade Commission. Since the forestry market in the US Southeast has a good existing biomass surplus, imports to this region are marginal and are not shown in the figures above. Exports consist of around 60% roundwood and 40% wood chips.
2.3.3 Canada East
Canada East includes the four provinces of Ontario, Quebec, New Brunswick, and Nova Scotia. The biomass flows as well as the biomass supply and demand in Canada East are displayed in Figure 14 and Figure 15.
Figure 14 – Canada East 2015: Supply & Demand

THE FUTURE OF BIOMASS IN THE RENEWABLES PORTFOLIO
14 June 2017
41
PÖYRY MANAGEMENT CONSULTING
Figure 15 – Canada East 2035: Supply & Demand
Data covering the supply potential for forest biomass in this region has been sourced from the Canadian National Forestry Database37. Their forecast covering the period up to 2050 has been used to assess the supply potential by 2035 (Figure 15), with supply assumed to follow a linear development.
The sustainable biomass supply potential is expected to decrease from 47.6 million odt in 2015 to 44.3 million odt in 2035 (Figure 14, Figure 15). This is due to changes in management approach (larger focus on sustainable forestry, biodiversity, old growth etc.) and changes in permitted land use.38 Since demand from large industry sectors such as pulp and paper will also decline, the overall surplus is projected to actually see a slight increase. Since we expect an increase in the sawmilling industry and a decrease in the pulp industry, volumes of pulplogs will be harvested but have no off-take from 2025 onwards. This material, which has a volume of almost 4 million odt in 2035, is included within the surplus (Figure 15).
37 Canadian National Forestry Database. Wood Supply – National Tables: http://nfdp.ccfm.org/supply/national_e.php
38 Canadian National Forestry Database. Wood Supply, Estimates and Summary of Factors in Determination, by
Species Group: http://nfdp.ccfm.org/data/tables/tab21_f_e.php

THE FUTURE OF BIOMASS IN THE RENEWABLES PORTFOLIO
14 June 2017
42
PÖYRY MANAGEMENT CONSULTING
Figure 16 – Canada East: Supply & Demand Development 2015 to 2035
Canada is expected to see overall growth in its construction sector of approximately 20% by 2035.This leads to an increase in demand from the sawmilling industry from 16.9 million odt in 2015 to 20 million odt by 2035. Additionally, with the sawmilling industry growing, the volume of sawmill residues will available at the market will increase from 8.0 million odt in 2015 to 9.4 million odt in 2035.
The pulp industry in Canada East is not as cost competitive as the pulp industry in other regions, specifically in Brazil and Asia. Production output and raw material demand are therefore predicted to decrease further from 14.7 million odt to 10.7 million odt between 2015 and 2035.
This region is projected to see a drop in pellet production capacity, due to the end of incentive schemes in some European countries for industrial pellets by 2028. The domestic market will be supplied with premium pellets to which some pellet mills can divert their supply flows. Biomass demand from this sector is estimated to decrease significantly from 2.1 million odt in 2015 to 1.0 million odt by 2035.
Biomass demand for energy generation is anticipated to remain stable, since it is currently too early to indicate developments of the provinces’ initiatives like ‘Ontario’s Five Year Climate Change Action Plan 2016 - 2020’39. Pellets play a vital role in residential heating (e.g. in Quebec40), but are not included in the biomass demand for energy generation as they are already accounted for in the demand from the pellet industry. Canada’s’ provinces have already a carbon tax in place or are in the process of establishing a carbon tax scheme. The price for a ton of carbon dioxide is supposed to be increased
39 Ministry of the Environment and Climate Change / Public Information Centre, 2016. Ontario’s Five Year Climate
Change Action Plan 2016 - 2020. http://www.applications.ene.gov.on.ca/ccap/products/CCAP_ENGLISH.pdf 40
Gouvernement du Quebec, 2016. Energy in Québec: a Source of Growth. The 2030 Energy Policy. http://politiqueenergetique.gouv.qc.ca/wp-content/uploads/Energy-Policy-2030.pdf
0
5
10
15
20
25
30
35
40
M o
dt
Supply Demand Surplus: Pulplogs Sawmill residues Harvesting residues

THE FUTURE OF BIOMASS IN THE RENEWABLES PORTFOLIO
14 June 2017
43
PÖYRY MANAGEMENT CONSULTING
every year up to 50 CAD in 2022.41 The implementation and further development of that tax scheme could influence the use of bioenergy and therefor demand volumes of biomass for the energy generation.
Trade data was sourced from the Statistics Canada database, and trade is assumed to remain stable. Imported and processed sawlogs currently provide 2.0 million odt of sawmill residues for other industry sectors including energy generation.
2.3.4 Brazil
Forest management, and hence feedstock availability, is considerably different in Brazil compared to the other regions covered in this report. Pulp mills in this region are often very large, and due to an initial lack of existing commercial forest resources it is not uncommon for pulp and wood based panel producers to manage their own forest plantation resource base. Nevertheless, there are independent plantation owners who sell biomass, typically about 20% of the overall marketable volume from plantations, through the open market in Brazil. The following figures (Figure 17, Figure 18) show the biomass supply from the commercially managed forest plantations, the biomass flow to the end-user and the potential surplus.
Figure 17 – Brazil 2015: Supply & Demand
41 Kroft, J., Drance, J., Sinclair, L. 2016. Pan-Canadian Carbon Plan. Published October 6
th, 2016
http://www.canadianenergylaw.com/tags/carbon-tax/

THE FUTURE OF BIOMASS IN THE RENEWABLES PORTFOLIO
14 June 2017
44
PÖYRY MANAGEMENT CONSULTING
Figure 18 – Brazil 2035: Supply & Demand
Based on Pöyry’s own assessment of commercial forest plantations there is expected to be an increase in the sustainable biomass supply potential from 140.1 million odt in 2015 to 165.0 million odt by 2035. In addition to an increased planted area, current plantations are anticipated to increase in productivity due to the use of better genetic material. This increase is assumed to largely come from Eucalyptus plantations, while the use of pine is not going to increase significantly.
The overall surplus of wood biomass in Brazil is projected to decrease from 42.6 million odt in 2015 to 22.6 million odt by 2035 following strong increases in demand. In 2035 the surplus is projected to consist of 19.2 million odt of pulplogs, 2.7 million odt of harvesting residues, and 0.7 million odt of sawmill residues.
The reason for the small volume of sawmill residues is due to the management practices of forest owners in this region and a strong focus on the production of pulplogs over sawlogs. In comparison to 2015, pulplogs are expected to comprise a smaller portion of the surplus volume, as they are assumed to be used by the growing pulp and paper industry.
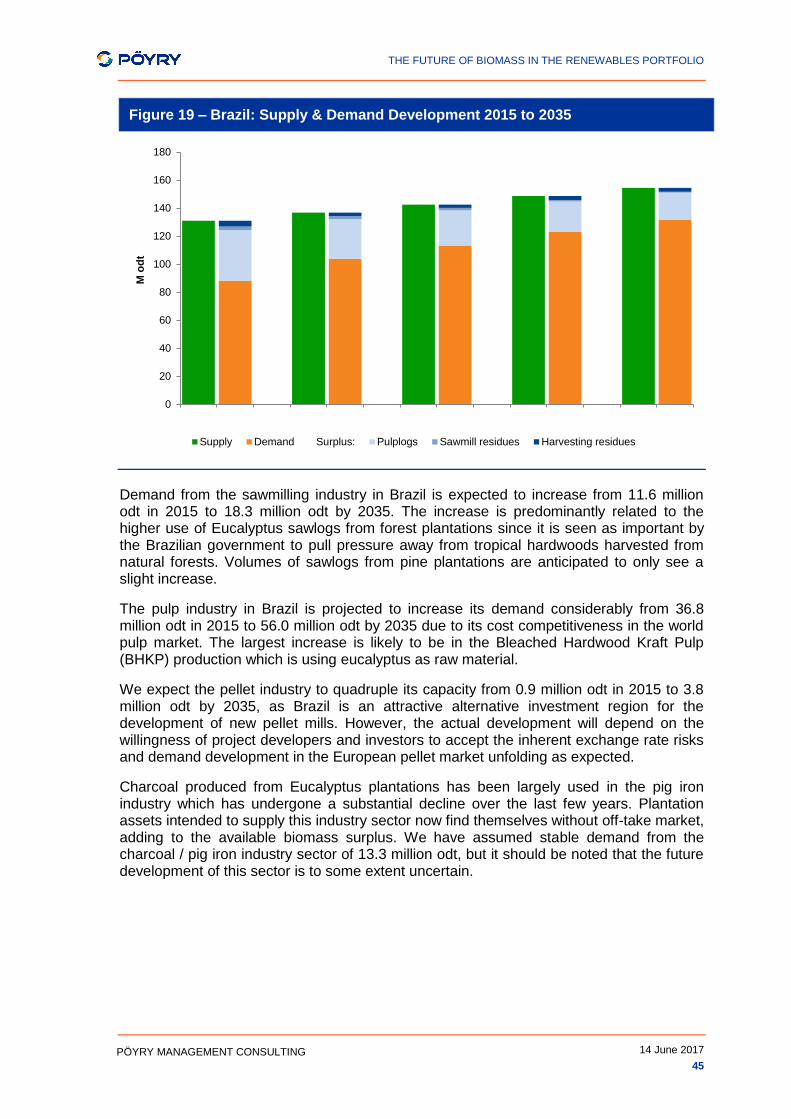
THE FUTURE OF BIOMASS IN THE RENEWABLES PORTFOLIO
14 June 2017
45
PÖYRY MANAGEMENT CONSULTING
Figure 19 – Brazil: Supply & Demand Development 2015 to 2035
Demand from the sawmilling industry in Brazil is expected to increase from 11.6 million odt in 2015 to 18.3 million odt by 2035. The increase is predominantly related to the higher use of Eucalyptus sawlogs from forest plantations since it is seen as important by the Brazilian government to pull pressure away from tropical hardwoods harvested from natural forests. Volumes of sawlogs from pine plantations are anticipated to only see a slight increase.
The pulp industry in Brazil is projected to increase its demand considerably from 36.8 million odt in 2015 to 56.0 million odt by 2035 due to its cost competitiveness in the world pulp market. The largest increase is likely to be in the Bleached Hardwood Kraft Pulp (BHKP) production which is using eucalyptus as raw material.
We expect the pellet industry to quadruple its capacity from 0.9 million odt in 2015 to 3.8 million odt by 2035, as Brazil is an attractive alternative investment region for the development of new pellet mills. However, the actual development will depend on the willingness of project developers and investors to accept the inherent exchange rate risks and demand development in the European pellet market unfolding as expected.
Charcoal produced from Eucalyptus plantations has been largely used in the pig iron industry which has undergone a substantial decline over the last few years. Plantation assets intended to supply this industry sector now find themselves without off-take market, adding to the available biomass surplus. We have assumed stable demand from the charcoal / pig iron industry sector of 13.3 million odt, but it should be noted that the future development of this sector is to some extent uncertain.
0
20
40
60
80
100
120
140
160
180
M o
dt
Supply Demand Surplus: Pulplogs Sawmill residues Harvesting residues

THE FUTURE OF BIOMASS IN THE RENEWABLES PORTFOLIO
14 June 2017
46
PÖYRY MANAGEMENT CONSULTING
It is likely that industrial energy generation will further increase as part of Brazil’s national plan to increase the share of renewable energy and to diversify its energy mix42. In Brazil, bioenergy is seen as an important base load energy resource complementing large hydropower generation. Biomass is therefore forecasted to play an important role in the future43 and demand from this sector is expected to increase from 26.9 million odt in 2015 to 45.2 million odt in 2035.
Trade data has been sourced from the Brazilian Ministério da Indústria, Comércio Exterior e Serviços. Due to Brazil’s vast forest plantation resources, imports of wood biomass from other countries do not play a relevant role in the forest and wood industry, and this is not likely to change. Brazil exports around 1.6 million odt of biomass of which over 90% is in the form of wood chips.
2.3.5 Baltics
The Baltic States are Estonia, Latvia, and Lithuania. Latvia is the main supplier of forest biomass accounting for almost 50% of the overall Baltic biomass supply potential. Lithuania and Estonia account for a share of approximately 25% of the biomass supply potential each. Figure 20 and Figure 21 present the supply and demand of the biomass in the Baltic States in 2015 and 2035.
Figure 20 – Baltics 2015: Supply & Demand
42 Ministerio de Minas e Energia 2015: Plano Decenal de Expansao de Energia 2024.
http://www.epe.gov.br/pdee/forms/epeestudo.aspx 43
Ministerio de Minas e Energia 2007: Plano Nacional de Energia 2030. http://www.epe.gov.br/PNE/20080512_8.pdf

THE FUTURE OF BIOMASS IN THE RENEWABLES PORTFOLIO
14 June 2017
47
PÖYRY MANAGEMENT CONSULTING
Figure 21 – Baltics 2035: Supply & Demand
The biomass supply potential in the Baltic States is expected to remain stable over the next 20 years, with data from the European Forest Information Scenario Model (EFISCEN)44 confirming this. In 2015 the Baltic States held a sustainable biomass supply potential of 23.0 million odt. The overall surplus is estimated to decline from 3.7 million odt in 2015 to 1.8 million odt by 2035 (Figure 22). Only minimal additional volumes would be available, if the un-mobilised sustainable yield were to be completely harvested. With supply and demand being so tight there is only little room left for further expansion of any industry, but they are still one of the existing key supply regions for wood pellets.
44 European Forest Institute (2016). EFISCEN: European Forest Information SCENario model, version 4.1. European
Forest Institute, Joensuu, Finland. http://efiscen.efi.int

THE FUTURE OF BIOMASS IN THE RENEWABLES PORTFOLIO
14 June 2017
48
PÖYRY MANAGEMENT CONSULTING
Figure 22 – Baltics: Supply & Demand Development 2015 to 2035
The pellet industry is expected to see further growth in the Baltic States, following the development of another mill to be operated by Graanul Invest. Biomass demand in the pellet industry could see growth from 2.8 million odt in 2015 to 3.6 million odt by 2035, since it has a good trading position to the rest of Europe (Figure 20, Figure 21).
Wood based panel producers are assumed to slightly increase their production leading to an increase in demand from 1.9 million odt in 2015 to 2.1 million odt by 2035. The pulp industry does not play a relevant role as consumer in the Baltic States and is assumed to remain stable with a demand of just 0.4 million odt.
Out to 2020 eight new CHP plants are projected to start operating, increasing the demand from this sector by 0.9 million odt from 0.6 million odt in 2015 to 1.5 million odt by 2035. The increase in number of CHP plants is driven by the aim to reach the 2020 targets for reduced GHG-emissions in the Baltic States.
The supply of sawmill residues is not projected to increase significantly as sawnwood and plywood production are only forecasted to increase marginally. In total, supply of this material will increase from 3.4 million odt in 2015 to 3.6 million odt by 2035 (Figure 20, Figure 21).
Biomass trade has been assumed to remain stable; however, Nordic countries have a keen interest in pulplogs from the Baltic States as this material is lower cost than domestic supply. If pulp production in the Nordics increases, demand for material from the Baltic States could be expected to increase as well, at the expense of existing industries in this region.
2.3.6 Northwest Russia
Northwest Russia is assumed to consist of the eight oblasts Murmansk, Archangelsk, Komi, Karelia, Leningrad, Novgorod, Pskov, and Vologda. These eight oblasts cover almost 100 million hectares of forest land. The Northwest Russian biomass supply and demand is shown in Figure 23 for year 2015 and in Figure 24 for year 2035.
0
5
10
15
20
25M
od
t
Supply Demand Surplus: Pulplogs Sawmill residues Harvesting residues

THE FUTURE OF BIOMASS IN THE RENEWABLES PORTFOLIO
14 June 2017
49
PÖYRY MANAGEMENT CONSULTING
Figure 23 – Northwest Russia 2015: Supply & Demand
Figure 24 – Northwest Russia 2035: Supply & Demand
Data about the supply potential from the forests and harvesting statistics have been sourced from the Roslesinforg, a division of the Federal Forestry Agency of Russia, the Finnish Forest Research Institute, and Rosstat. Overall the long-term biomass supply potential in Northwest Russia is expected to remain stable at 67.6 million odt over the next 20 years. There is estimated to be a larger harvest of sawlogs and pulplogs, lowering the un-mobilised sustainable yield. The total biomass surplus is anticipated to decrease by 5 million odt from 36.2 million odt in 2015 to 31.2 million odt by 2035. 14.6 million odt of the

THE FUTURE OF BIOMASS IN THE RENEWABLES PORTFOLIO
14 June 2017
50
PÖYRY MANAGEMENT CONSULTING
surplus seen in 2035 is comprised of un-mobilised material. 7 million odt of harvesting residues from harvesting operations remain on site and are also included within the surplus.
Figure 25 – Northwest Russia: Supply & Demand Development 2015 to 2035
Demand from the pulp industry is projected to increase considerably in this region, from 11.2 million odt in 2015 to 15.7 million odt by 2035.
The panel board and pellet industry are only expected to see a marginal increase in wood biomass demand from 2015 to 2035, growing from with 1.7 to 1.9 million odt and from 0.8 to 1.2 million odt, respectively.
Demand from the sawmilling industry, which is linked to the construction sector, is also likely to increase modestly from 10.2 million odt in 2015 to 11.0 million odt in 2035. The increasing demand of the sawmilling industry will result in a higher availability of sawmill residues which was at a level of almost 5 million odt in 2015.
Wood biomass demand from residential heat sector has been estimated based on analysis by METLA and the Finnish Forest Research Institute45. 2.1 million odt of fuelwood is currently used in residential boilers within the assessed oblasts in Northwest Russia. This demand figure is projected to remain stable across the projection period.
Demand for biomass for industrial energy generation is also predicted to remain stable since there are no incentive schemes for further biomass based generation in place. The Russian Federation has signed the Paris Agreement, but at this stage it cannot be foreseen what effect this will have on the development of biomass based energy generation.
45 METLA, Finnish Forest Research Institute, 2011. Karvinen, S., Valkky, E., Gerasimov, Y., Dobrovolsky, A.:
Northwest Russian Forest Sector in a Nutshell.
0
10
20
30
40
50
60
M o
dt
Supply Demand Surplus: Pulplogs Sawmill residues Harvesting residues

THE FUTURE OF BIOMASS IN THE RENEWABLES PORTFOLIO
14 June 2017
51
PÖYRY MANAGEMENT CONSULTING
Imports and exports were calculated based on data from the Russian Forestry Information Service and the Finnish Forest Research Institute46. Finland is a large importer of biomass from Northwest Russia and imports often come from surrounding Russian oblasts to the region.
2.3.7 Nordics
The Nordic States consist of Norway, Sweden, and Finland. All countries have large forest areas and a long standing sawmilling and pulp & paper industry. The following two Sankey-charts present the biomass supply and demand in the Nordic states in 2015 (Figure 26) and in 2035 (Figure 27).
Figure 26 – Nordics 2015: Supply & Demand
46 LUKE, National Resource Institute Finland. https://www.luke.fi/en/

THE FUTURE OF BIOMASS IN THE RENEWABLES PORTFOLIO
14 June 2017
52
PÖYRY MANAGEMENT CONSULTING
Figure 27 – Nordics 2035: Supply & Demand
The overall sustainable biomass supply potential in the Nordics is anticipated to grow from 87.0 million odt in 2015 to 93.6 million odt by 2035. The supply in Norway is projected to remain stable, whereas the supply potential in Sweden and Finland is forecasted to increase.4748 This is mainly due to a lower fertilization rate and a higher deforestation rate in Sweden compared to the other two countries.49
The un-mobilised sustainable yield is projected to decrease from 13.4 million odt in 2015 to 8.9 million odt by 2035. The volumes of pulplogs and sawmill residues, which could potentially be available if additional sawlogs are harvested and processed in sawmills, are expected to decrease to 5.3 million odt and 0.9 million odt by 2035, respectively. Increases in harvesting also lead to an increase in the surplus of harvesting residues of 3.0 million odt. The surplus of biomass available in the forests consists mainly of small diameter roundwood and harvesting residues.
47 Claesson, S., Dvemo, K., Lundstrom, A., Wikberg, P.E., 2015. Skogloga konsekvensanaluser 2015 – SKA 15. Rapport 10, 2015. http://shop.skogsstyrelsen.se/shop/9098/art17/31291417-90daf1-Skogliga_konsekvensanalyser_webb.pdf
48 Natural Resources Institute Finland (LUKE): Forest wood supply outlook requested by Pöyry. The outlook is modelled by LUKE.
49 Skog&Landskap, 2014. An outlook for the forest carbon sink. Rasmus Astrup, As, 17.09.2014. http://skogeier.no/userfiles/files/An%20Outlook%20for%20the%20Forest%20Carbon%20Sink%20-%20Dr_%20Rasmus%20Astrup.pdf

THE FUTURE OF BIOMASS IN THE RENEWABLES PORTFOLIO
14 June 2017
53
PÖYRY MANAGEMENT CONSULTING
Figure 28 – Nordics: Supply & Demand Development 2015 to 2035
Biomass demand from the pulp industry is expected to increase by 5 million odt from 42.0 million odt in 2015 to 47.3 million odt by 2035. The driver of this growth is mainly the higher demand for specialty pulp and packaging grades in emerging countries in Asia.
Demand from the sawmilling industry is anticipated to increase from 30.7 million odt in 2015 to 35.6 million odt by 2035. The sawmill industry provided 14.5 million odt of sawmill residues in 2015 which is likely to increase to 16.9 million odt by 2035. Demand from the panel industry is likely to remain stable between 2015 and 2035.
The pellet and energy industries are only anticipated to grow marginally. Biomass demand for energy generation is already well established in the Nordics, and with these countries already having strong low carbon economies further growth is not projected. Renewable heat generation in residential boilers is forecasted to see a decline due to more efficient boilers or even other renewable technologies being installed.
Imports and exports have been assumed to remain flat for the assessed period from 2015 to 2035. The Nordics imported a total of 11.9 million odt (12% of the overall supply) in 2015, of which a large volume was imported from the Baltics and Northwest Russia.
2.3.8 Iberia
Within this assessment, Iberia is defined as the region including Spain and Portugal. The biomass supply and demand volumes as well as the flow of the different key assortments are displayed in the following two figures (Figure 29 and Figure 30).
0
10
20
30
40
50
60
70
80
90M
od
t
Supply Demand Surplus: Pulplogs Sawmill residues Harvesting residues

THE FUTURE OF BIOMASS IN THE RENEWABLES PORTFOLIO
14 June 2017
54
PÖYRY MANAGEMENT CONSULTING
Figure 29 – Iberia 2015: Supply & Demand
Figure 30 – Iberia 2035: Supply & Demand
Going forward, the supply potential is expected to remain stable, providing a sustainable fibre potential of 27.0 million odt per year. The net surplus currently totals 6.8 million odt, which is anticipated to decrease down to 4.1 million odt in 2035. A growing sawmilling industry is a key enabling factor for making the un-mobilised pulpwood, harvesting residues and sawmill residues accessible.

THE FUTURE OF BIOMASS IN THE RENEWABLES PORTFOLIO
14 June 2017
55
PÖYRY MANAGEMENT CONSULTING
Figure 31 – Iberia: Supply & Demand Development 2015 to 2035
The construction industry in Portugal and Spain declined dramatically during the economic downturn in 2008/2009 and the furniture industry saw a similar decline, both of which had a big impact on the panel board and sawmilling industries. Both sectors are expected to see further recovery over the coming years. It is estimated that demand from the sawmilling industry will reach 4.2 million odt in 2035, representing an increase of 0.9 million odt from 2015 levels. Demand from the panel board industry is anticipated to increase from 2.8 million odt in 2015 to 3.8 million odt by 2035.
The Iberian pulp industry has a competitive position compared to other countries in Europe, due not only to continued increases in bleached kraft pulp demand within Europe, but also due to the Portuguese integration of pulp with paper production. It is anticipated that the pulp industry will increase its production and therefore increase its demand of biomass from 7.3 million odt in 2015 to 8.1 million odt by 2035.
The outlook for the pellet industry in Iberia has been assessed using Pöyry’s Global Pellet Market Model. Demand from this industry is projected to decrease from 1.3 million odt in 2015 to 0.8 million odt by 2035, mainly due to the likely decrease in industrial pellet demand in Europe after incentive schemes in the UK and the Netherlands come to an end.
Demand from the industrial energy and residential heat generation sectors is likely to increase from 1.8 million odt to 2.7 million odt and from 5.0 million odt to 5.3 million odt by 2035, respectively. There are 17 planned bioenergy plants in Iberia calculated within the central scenario of Pöyry’s in-house model with a combined capacity of almost 270 MW and a biomass demand of 0.9 million odt. 8 of those 17 planned bioenergy plants in Iberia are consuming more than 50% waste wood as fuel. Only the biomass demand from commercially managed forests has been taken into account for these plants.
Trade data for Iberia is assumed to remain stable across the assessed period from 2015 to 2035. More than 70% of all imports to Iberia are imported by Portugal. Wood chips are predominantly imported to Iberia from South America.
0
5
10
15
20
25M
od
t
Supply Demand Surplus: Pulplogs Sawmill residues Harvesting residues

THE FUTURE OF BIOMASS IN THE RENEWABLES PORTFOLIO
14 June 2017
56
PÖYRY MANAGEMENT CONSULTING
2.4 Current biomass supply cost curve
Following the calculation of surplus biomass availability (see section 2.3) and the cost of supplying pellets from different key supply regions in the UK, it is possible to develop indicative supply cost curves showing the potential volume of pellets that could be supplied into the European market, assuming all suitable surplus biomass is used to produce pellets and existing pellet mills in these regions also continue to supply.
To bring this into context, Figure 32 shows the existing pellet supply cost curve for all pellet mills that are supplying into the European industrial pellet market. In total there is 12.8 Mtpa of capacity targeting this market, with a fairly wide range of supply costs. Mills in the Baltics, NW Russia, and Iberia, especially those that have already recovered their CAPEX costs are afforded relatively low supply costs, although this does not necessarily translate into easy market access, as seen with some Portuguese mills that have struggled to secure off-take recently.
The mid-range largely consists of mills in the US Southeast, which also represents the largest supply region currently. Most mills in the US Southeast present supply cost within a narrow range of around 170 to 180 USD/t, with only a few smaller mills having higher supply costs due to less advantageous economies of scale.
It should be noted that Figure 32 does not show any mills in the Nordics as mills from this region currently only supply their respective domestic markets but not the industrial pellet market in Europe. Mills in Western Canada on the other hand are shown in Figure 32, but have not been included within the supply cost curves in the remainder of this report, as Western Canada has not been included as supply region.
Figure 32 – Pellet supply cost curve based on existing capacity in 2016
In addition to the existing supply cost curve, we have produced potential supply cost curves for two scenarios based on the total biomass surplus availability in each region. In the first scenario we have assumed that harvesting residues can only account for a maximum of 20% of the feedstock mix for pellet production (34% of the entire process feedstock mix including dryer fuel), in order to retain pellet quality at levels currently traded in the market. For the second scenario we have assumed that all surplus biomass can be used, including all surplus harvesting residues.
For both of these scenarios it has been assumed that surplus biomass is spread evenly across each analysed region, with pellet mills built 70, 130, 200, and 350 miles from a
100
125
150
175
200
225
250
0 5 10 15
US
D p
er
ton
ne (
real
2016)
Million Tonnes
US Southeast
Eastern Canada
Western Canada
Baltics
Iberia
NW Russia
Brazil

THE FUTURE OF BIOMASS IN THE RENEWABLES PORTFOLIO
14 June 2017
57
PÖYRY MANAGEMENT CONSULTING
suitable export port in order to utilise this material. Inland transport costs for produced pellets increase appropriately and surplus biomass is being consumed in regions closest to the export port first.
As identified in section 2.3, there is currently approximately 140 million odt of surplus biomass across the US Southeast, Eastern Canada, Nordics, Baltics, Iberia, NW Russia, and Brazil regions (see Table 5). Assuming that a maximum of 20% harvesting residues can be used in the pellet feedstock mix, and all surplus pulpwood and sawmilling residues (which could be generated from the harvesting and processing of all surplus sawlogs) are used in pellet production, this would allow for the production of 119 million tonnes of industrial pellets, in addition to the 11.8 million tonnes that can be produced at existing industrial pellet mills in these regions (including 1.3 Mtpa of capacity in the Nordics which is not currently targeting the European industrial pellet market but is assumed to be capable of doing so).
Looking forward to 2030, the total biomass surplus in the selected regions is expected to decrease slightly following growth in other wood biomass consuming industries within these regions. The volume of industrial pellets that could be produced from suitable surplus biomass would consequently fall slightly to 112 million tonnes. However, included within the forest industry growth in the analysed regions is the development of already planned pellet mill capacity, with total industrial pellet production capacity already expected to increase from currently 11.8 to 18.9 million tonnes by 2030, based on current demand development expectations in Europe.
Overall, there is therefore no actual decline in maximum total industrial pellet production potential across all regions combined, which stands at 130.7 million tonnes in 2016 and 130.5 million tonnes in 2030. It becomes clear that such volumes would be enough to support a significant expansion of pellet demand in GB and the wider European market, without exceeding the sustainable forest growth potential or enter into severe competition with existing wood consumers in these regions.
The supply cost curves in Figure 33 show that provided surplus biomass can be mobilised, there is the potential for considerable pellet supply totalling over 40 million tonnes to be developed within Europe, in NW Russia, the Baltics, and Iberia.
The US Southeast offers enough surplus biomass to support upwards of 25 million tonnes of premium pellet production capacity currently, and 38 million tonnes going forward, all the while retaining an attractive supply cost around current market levels of between 175 USD per tonne and 200 USD per tonne.
The lesser attractive regions are the Nordics and Eastern Canada, owing largely to the higher cost of biomass in these region, as shown in section 2.3.

THE FUTURE OF BIOMASS IN THE RENEWABLES PORTFOLIO
14 June 2017
58
PÖYRY MANAGEMENT CONSULTING
Figure 33 – Pellet supply cost curves for the European market (limited use of harvesting residues)
Note: Supply costs increase in the Nordics, Baltics, Iberia, NW Russia, and Brazil following an assumed strengthening of currencies in those regions from current levels.
Assuming there is no limit on the portion of harvesting residues that can be used in pellet production, and all surplus biomass can be accessed, there is the potential to produce an additional 121.7 million tonnes of pellets currently, and 117.3 million tonnes in 2030, again owing to a slight decrease in surplus biomass availability in some regions.
As with Figure 33 for the first scenario, Figure 34 shows the pellet supply cost curves based on this assumption, where supply of pulpwood & sawmill residues and harvesting residues have been split, with new mills assumed to consume exclusively either pulpwood & sawmill residues or exclusively harvesting residues. This has been done due to the difference in cost of these feedstocks, allowing for even lower cost mills provided they can take full advantage of harvesting residues, which are lower cost.
The position of different regions along the supply cost curve remains much the same, with NW Russia, Iberia, and to a lesser extent the Baltics offering considerable supply potential at some of the lowest costs. Mills in the US Southeast and Brazil then have similar supply cost of between 175 USD per tonne and 200 USD per tonne, with the Nordics and Eastern Canada having the highest supply costs, again owing to their higher feedstock costs.
100125150175200225250
0 20 40 60 80 100 120 140US Southeast Eastern Canada Nordics Baltics Iberia NW Russia Brazil
100
120
140
160
180
200
220
240
260
280
0 20 40 60 80 100 120 140
US
D p
er
ton
ne (
real
2016)
Million tonnes
100
120
140
160
180
200
220
240
260
280
0 20 40 60 80 100 120 140
US
D p
er
ton
ne (
real
2016)
Million tonnes
2016 2030

THE FUTURE OF BIOMASS IN THE RENEWABLES PORTFOLIO
14 June 2017
59
PÖYRY MANAGEMENT CONSULTING
Figure 34 – Pellet supply cost curves for the European market (no limit on use of harvesting residues)
Note: Supply costs increase in the Nordics, Baltics, Iberia, NW Russia, and Brazil following an assumed strengthening of currencies in those regions from current levels.
It is important to note however, that only 10% of the 140 million odt biomass surplus that currently exists within these regions can actually be considered ‘mobilised’ material, consisting entirely of harvesting residues that are not currently collected following harvesting operations. Parts of the remaining 90% will come to market as a result of thinning operations which are an essential part of good forest management practice, while the rest of the identified volumes are to be found within forests, which are not currently harvested due to insufficient market demand for sawlog material. As the most valuable section of most forest stands is the sawlog, with the exception of some managed hardwood plantations such as Eucalyptus in Brazil, sufficient demand for sawlogs from the sawmilling industry will need to develop before much of this surplus material can be expected to make it to market.
While increased mobilisation of biomass is expected between now and 2030, with the share of ‘mobilised’ surplus increasing to approximately 20% by this time, this means that the previously mentioned pellet production potentials and the pellet supply cost curves are to some extent theoretical.
2.5 Potential areas for supply chain cost reductions In order to access potential cost reductions for future biomass power generation, Pöyry analysed different areas of the biomass supply chain that could lead to potential cost savings (
100125150175200225250
0 10 20 30 40 50 60 70 80US Southeast Eastern Canada Nordics Baltics Iberia NW Russia Brazil
100
120
140
160
180
200
220
240
260
280
0 20 40 60 80 100 120 140 160
US
D p
er
ton
ne (
real
2016)
Million tonnes
100
120
140
160
180
200
220
240
260
280
0 20 40 60 80 100 120 140 160
US
D p
er
ton
ne (
real
2016)
Million tonnes
2016 2030

THE FUTURE OF BIOMASS IN THE RENEWABLES PORTFOLIO
14 June 2017
60
PÖYRY MANAGEMENT CONSULTING
Table 6). Some of these supply chain cost savings could potentially be realised with just with a higher market deployment (e.g., financing structure of new pellet mills) or with a more significant change on the existing supply chain (e.g., use of other feedstocks such as harvesting residues or sugarcane bagasse instead of pulpwood.).

THE FUTURE OF BIOMASS IN THE RENEWABLES PORTFOLIO
14 June 2017
61
PÖYRY MANAGEMENT CONSULTING
Table 6 – Potential areas for supply chain cost savings
Supply Chain Area Potential improvements
Raw material supply
Increasing tree yields and improving forest management practices, potentially resulting in lower feedstock costs;
Higher share of harvesting residues and in-wood chips utilised for pellet production;
Utilisation of alternative feedstocks such as sugarcane bagasse;
Development of dedicated fast growing forestry plantations for pellet production;
Improved supply chain models customised for requirements of wood pellet producers;
Shift of production to regions with generally lower raw material cost (i.e., Brazil and NW Russia);
Pellet production
Increased capacity utilisation rate of pellet mills;
Reduction of over-engineering and redundancies in the system;
Off-siting of raw material handling, chipping and debarking when using in-wood chips;
Increasing efficiency of pellet presses and hammermills
More competitive EPC offerings due to learning effects or complete move away from sometimes costly EPC arrangements
General economies of scale (need to be offset against increasing raw material transport cost)
Port/Storage/Shipping
Optimised logistics and storage strategy;
Collaborative approach of producers/buyers for utilisation of port facilities;
Utilisation of larger vessels where possible to reduce shipping cost;
Optimisation of loading and unloading infrastructure;
Increased throughput volumes in dedicated UK import ports resulting in lower port cost;
Transport from import port to power plant
Shared storage capacity at the ports;
Shared transport infrastructure resulting in reduced need for redundancies;
Financing
Increased confidence in the industry could reduce of financing costs, both by increasing the debt share and decreasing debt and equity interest;
In a scenario of a significant pellet demand deployment, financing periods could potentially be increased, resulting in a lower Capex repayment per tonne of pellet;
2.5.1 Raw material supply
Forest plantations have been established all around the world and research how to improve the yield and to decrease costs in biomass supply has been conducted. Besides forest plantations, alternative feedstocks from energy crop plantations like energy cane, Bamboo, Miscanthus and others are being assessed as biomaterials for different purposes.
2.5.1.1 Yield improvements
Latest improvements of productivity were due to clonal forestry, breeding and applications of remote-sensing technologies (Figure 35). There is also research on DNA-modification of trees, which is considered by companies to achieve higher yields on forest plantations, but has not been yet, with the exception of China, been planted outside of trial areas.50 Increase in yield has also been achieved through improved forest management and the
50 Porth, I., El-Kassaby, Y.A., 2014. Current status of the development of genetically modified (GM) forest trees world-wide. In: CAB reviews 9 (9). DOI: 10.1079/PAVSNNR20149008

THE FUTURE OF BIOMASS IN THE RENEWABLES PORTFOLIO
14 June 2017
62
PÖYRY MANAGEMENT CONSULTING
outlook for the upcoming years presents genetically engineered trees as the next big development leap for yield improvements (Figure 35).
Figure 35 – Major drivers for yield improvements over time51
Different species are used worldwide for forest plantations. Eucalyptus, pine and acacia plantations are a major source of wood biomass from plantations worldwide. Acacia is predominantly planted in Asia, which has not been assessed in this project and is therefore not covered at this point. Figure 36 shows the yield development of Eucalyptus and pine in the US Southeast and Brazil on plantations. Data from public sources has been used. If data for a specific time was not available, a linear progression to the next data point has been assumed.
Yield on Eucalyptus pulpwood plantations in Brazil has almost tripled in the last four decades from about 9 odt/ha/year52 to about 24 odt/ha/year53. Short rotation forest plantations with a rotation between 2 to 6 years with Eucalyptus can reach 24 to 48 odt/ha/year in Brazil54. Yields of over 40 odt/ha/year have been achieved in trials, which have the potential to be planted on a large commercial scale.55 The yield development of Eucalyptus in Brazil presented in Figure 36 shows the average yield on
51 Vance, D.E., Douglas, A.M., Zalesny, R.S., 2010. Research Strategies for Increasing Productivity of Intensively Managed Forest Plantations. In: Journal of Forestry, 108 (4): 183-192.
52 tape, J., Binkley, D., Ryan, M., and more, 2010. The Brazil Eucalyptus Potential Productivity Project: Influence of water, nutrients and stand uniformity on wood production. In: Forest Ecology and Management, 259: 1684-1694.
53 Industria Brasileira de Avores (IBA), 2015. Iba 2015. 80pp.
54 Couto, L., Nicholas, I., Wright, L., 2011. Short Rotation Eucalypt Plantations for Energy in Brazil. IEA Bioenergy Task 43:2011:02.
55 Stanturf, J., Vance, E., Fox, T., Kirst, M., 2013. Eucalyptus beyond its native range: Environmental issues in exotic bioenergy plantations. In: International Journal of Forestry Research, 2013: 1-5. DOI: 10.1155/2013/463030

THE FUTURE OF BIOMASS IN THE RENEWABLES PORTFOLIO
14 June 2017
63
PÖYRY MANAGEMENT CONSULTING
plantations of the IBA56-network. The highest yields reached on plantations and in trials would follow a more linear development, but low data availability leads us to use the actual yields reported from plantations.
Pine plantations in Brazil have seen a growth in productivity from around 6 odt/ha/year in the 1970s to 13 odt/ha/year today.57 A further increase of increment is expected up to 22 odt/ha/year, which has been achieved in New Zealand already.58
Southern pine yield on plantations in the US Southeast improved between the 1950s and the 2000s by the factor 4. Today, pine plantations yield up to 12 odt/ha/year.59 Since research is still conducted, further yield, site and management improvements are very likely. Projections show that an increase of productivity exceeding 15 odt/ha/year on pine timberland in the South of the US due to better planting material and management practices (e.g. site preparation) on new plantations is possible.60
Some trials of Eucalyptus short rotation plantations with rotations between 5-10 years for bioenergy purposes in the US Southeast were planted at the beginning of the 2000s and reach a productivity of 20 odt/ha/year.61 It is assumed that the yield could be doubled by using newer planting material.62
56 Industria Brasileira de Avores (IBA), 2015. Iba 2015. 80pp. / Nambiar, S., 1999. Productivity and sustainability of plantation forests. In: Bosque, 20 (1): 9-21.
57 Industria Brasileira de Avores (IBA), 2015. Iba 2015. 80pp. / Nambiar, S., 1999. Productivity and sustainability of plantation forests. In: Bosque, 20 (1): 9-21.
58 Mead, D.J., 2013. Sustainable management of Pinus radiata plantations. FAO Forestry Paper No. 170. Rome, FAO.
59 Roberts, S.D. et al., 2015: 104-109. In: Holley, A. Gordon; Connor, Kristina F.; Haywood, James D., eds. 2015. Proceedings of the 17th biennial southern silvicultural research conference. E-Gen. Tech. Rep. SRS–203. Asheville, NC: U.S. Department of Agriculture, Forest Service, Southern Research Station. 551 p.
60 U.S. Department of Energy, 2016. 2016 Billion-Ton Report: Advancing Domestic Resources for a Thriving Bioeconomy, Volume 1: Economic Availability of Feedstocks. M. H. Langholtz, B. J. Stokes, and L. M. Eaton (Leads), ORNL/TM-2016/160. Oak Ridge National Laboratory, Oak Ridge, TN. 448p. / Fox, T.R., Jokela, E.J., Allen, H.L., 2007. The Development of Pine Plantation Silviculture in the Southern United States. In: Journal of Forestry, October/November 2007: 337-347.
61 Schuler, J., Pelkki, M., Stuhlinger, C., 2009. Biological and Economic Considerations in Establishing a Short-Rotation Bioenergy Plantation. In: Journal of The Arkansas Academy of Science, 63: 153-157.
62 Stanturf, J., Vance, E., Fox, T., Kirst, M., 2013. Eucalyptus beyond its native range: Environmental issues in exotic bioenergy plantations. In: International Journal of Forestry Research, 2013: 1-5. DOI: 10.1155/2013/463030

THE FUTURE OF BIOMASS IN THE RENEWABLES PORTFOLIO
14 June 2017
64
PÖYRY MANAGEMENT CONSULTING
Figure 36 – Growth rate development of Eucalyptus and Pine in Brazil and the US Southeast
Increase in productivity on plantations will also have an impact on the overall sustainable harvest levels from forest plantations in the assessed regions. If higher growth rates are achieved on commercial level, more biomass supply from these plantation areas should be available accordingly.
2.5.1.2 Cost reductions in biomass supply
In general, planted forests are expected to achieve higher yields in shorter rotations than natural forests.63 The key drivers are the biomass productivity, rotation length and plantation establishment even though initial establishment cost can potentially be higher. “Site productivity greatly affects delivered cost, which is why a highly productive crop/plantation will reduce delivered costs.”64
A Pöyry in-house calculation tool for Eucalyptus and pine plantations was used to assess the delivered cost comparing present and future yields (Figure 37). The future possible yield on plantations has been received from different publicly available sources and is shown in Table 7 (compare also Figure 36). The yield increase of Eucalyptus is higher than on pine plantations due to more research and better growing characteristics in the specific assessed regions.
63 Cubbage, F., Donagh, P., Sawinski, J., Rubilar, R., Donoso, P., Ferreira, A., Hoeflich, V., Olmos, V., Ferreira, G., Balmelli, G., Siry, J., Baez, M., Alvarez, J., 2007. Timber investment returns for selected plantations and native forests in South America and the Southern United States. In: New Forests, 33 (3): 237-255. DOI: 10.1007/s11056-006-9025-4
64 Gonzalez, R., Wright, J., Saloni, D., 2010. The Business of Growing Eucalyptus for Biomass. In: Biomasse Magazine, 4: 52-55. http://biomassmagazine.com/articles/3620/the-business-of-growing-eucalyptus-for-biomass
0
5
10
15
20
25
30
35
40
45
1970 1980 1990 2000 2010 2020 2030 2040 2050
od
t/h
a/ye
ar
Eucalyptus (Brazil) Eucalyptus (USSE) Pine (USSE) Pine (Brazil)
Projections

THE FUTURE OF BIOMASS IN THE RENEWABLES PORTFOLIO
14 June 2017
65
PÖYRY MANAGEMENT CONSULTING
Table 7 – Current and projected yield of Eucalyptus and Pine on plantations in Brazil and the US Southeast used in calculation tool
Brazil US Southeast
Yield (odt/ha/year) 2015 2050 2015 2050
Eucalyptus 23.4 42.0 19.8 40.2
Pine 13.3 21.5 12.0 14.6
The delivered costs for biomass from Eucalyptus plantations are calculated based on a 14 year rotation with 4 rotation cycles, which means a harvesting every 3.5 years. For Eucalyptus a re-sprouting from the cut roots is assumed within a short-rotation harvesting approach. For biomass from pine plantations the delivered costs are set on a basis of a rotation of 14 years. The planting density has been assumed to be 2,500 stems per hectare on pine plantations and 3,400 stems per hectare on Eucalyptus plantations. The calculation includes land costs, plantation establishment, management and harvesting (Table 8). The calculation determines the delivered cost of biomass through a goal seek function, which presents the breakeven costs of growing and management of the plantations. The results present the discounted cash flow over the rotation period.
Table 8 – Input data for calculation of cost of biomass delivered to roadside
Description Units Pine Plantations Eucalyptus Plantations
Rotation Age years 14 14
Max Rotations number 1 4
Planting Density stem/ha 2,500 3,400
Seedling cost USD/stem 0.1 0.1
Land Preparation USD/ha 240 240
Planting USD/stem 0.13 0.08
Plant protection (Weeding, etc.) USD/ha 150 87
Fertiliser USD/ha 279
Harvest Cost USD/odt 29.30 15.00
Specific density odt/m3sob 0.43 0.6
No thinning operations have been considered. The only parameter adapted in the calculation is the yield for 2015 and for 2050, which has been assumed to be linear between 2015 and 2050. The development of the yield between 2015 and 2050 is shown in Figure 37; the development of the cost as a function of the yield between 2015 and 2050 is presented in Figure 38.

THE FUTURE OF BIOMASS IN THE RENEWABLES PORTFOLIO
14 June 2017
66
PÖYRY MANAGEMENT CONSULTING
Figure 37 – Projected development of yield between 2015 and 2050
Figure 38 – Development of cost delivered to roadside as a function of the yield between 2015 and 2050
It can be clearly stated that a higher productivity leads to lower delivered costs of wood and as mentioned above, higher yield is expected due to improvements in cultural techniques, especially fertilization and weed control, but also improvements of the planting material. But, while higher yields on forest and agricultural plantations promise reduced costs and higher revenues, “site preparation treatments and costs can vary widely
0
5
10
15
20
25
30
35
40
45
2015 2050
Yie
ld in
odt/
ha/y
ear
Eucalyptus Brazil Eucalyptus USSE Pine Brazil Pine USSE
0
5
10
15
20
25
30
35
40
45
2015 2050
Co
st in
USD
/od
t
Eucalyptus Brazil Eucalyptus USSE Pine Brazil Pine USSE

THE FUTURE OF BIOMASS IN THE RENEWABLES PORTFOLIO
14 June 2017
67
PÖYRY MANAGEMENT CONSULTING
depending on site conditions”65 and it has to be noted that the same establishment and management costs for 2015 and 2050 have been assumed, which could also change over time in the different regions.
2.5.1.3 Alternative feedstocks
In addition to wood biomass, alternative feedstock (e.g. Bamboo, Miscanthus, sugar cane) is suitable as a biofuel or feedstock for further processing to advanced products (like pellets).66
Miscanthus is one of the most productive agricultural renewable resources which can be used for bioenergy and pellet production.67 Miscanthus has a good growth rate (up to 12-15 odt/ha/year in England and Ireland68, and on average up to 18 to 30 odt/ha/year in the USA69). The delivered cost at farm-gate for Miscanthus with an average yield of almost 36 odt/ha/year in the USA is in a range between 41 USD/odt and 58 USD/odt.70 In Ireland studies present delivered costs between 49 USD/odt and 59 USD/odt at a yield of 14 odt/ha/year.71 The cost ranges depend on different scenarios with variable land rent, transport distances and machinery.
Specified sugar cane with higher fibre content and less sucrose is also known as energy cane.72 Besides the ethanol production, bagasse and trash (residues in the field) are used for direct energy generation or pellet production.73,74 Sugar cane has an average commercial yield of biomass of 39 odt/ha/year, which makes it very suitable for biomass production for biofuels. Breeding programs and different management systems (irrigation, fertilization, etc.) lead to an average yield growth of around 1% per year. This is expected to go forward in the future, especially with improved breeding tools. On large commercial sugar cane plantations yields of 70 odt/ha/year have been reached. Experimental trials on small areas have achieved productivity rates of around 100 odt/ha/year.75
65 Moorhead, D., Dangerfield, C., Beckwith J., 1998. Opportunities for Intensive Pine Plantation Management. School of Forest Resources, The University of Georgia. Bugwood 98-002. 8pp.
66 Nunes, L.J.R., Matias, J.C.O., Catalao, J.P.S., 2014. Mixed biomass pellets for thermal energy production: A review of combustion models. In: Applied Energy, 127: 135-140. DOI: 10.1016/j.apenergy.2014.04.042
67 Wenghoefer, V.C., 2014. Entwicklung einer optimierten Produktion von Miscanthus-Mischpellets für Kleinfeuerungsanlagen. Doctoral Thesis at the Rheinischen Friedrich-Wilhelms-Universität Bonn, Germany. 210pp. http://hss.ulb.uni-bonn.de/2014/3475/3475.pdf
68 Sustainable Energy Authority of Ireland. no year. Fact Sheet Miscanthus. http://www.seai.ie/Publications/Renewables_Publications_/Bioenergy/Miscanthis_Factsheet.pdf
69 If a 20% moisture content is applied (10-15 st/acre) Pyter, R. (Aloterra Energy), 2012. Presentation at Pennsylvania State University. http://bioenergy.psu.edu/shortcourses/2012Grass_Energy/MiscanthusForBiomassPyter2012.pdf
70 Khanna, M., Dhungana, B., Clifton-Brown, J., 2008. Costs of producing miscanthus and switchgrass for bioenergy in Illinois. In: Biomass and Bioenergy, 32: 482-493.
71 Styles, D., Thorne, F., Jones, M.B., 2007. Energy crops in Ireland: An economic comparison of willow and Miscanthus production with conventional farming systems. In: Biomass and Bioenergy, 32: 407-421.
72 Matsuoka, S., Kennedy, A., Santos, E., Tomazela, A., Rubio, L., 2014. Energy Cane: Its Concept, Development, Characteristics, and Prospects. In: Advances in Botany 14: 13pp. DOI: 10.1155/2014/597275
73 Erlich, C., Bjoernbom, E., Bolado, D., Giner, M., Fransson, T.H., 2006. Pyrolysis and gasification of pellets from sugar cane bagasse and wood. In: Fuel, 85 (10/11): 1535-1540. DOI: 10.1016/j.fuel.2005.12.005
74 Missagia, B., Narra, S., Guerrero, C., Krautz, H.J., Ay, P., 2010. Physical Characterization of Brazilian Agricultural and Forestry Residues Aiming the Production of Energy Pellets. Proceedings of the 18th European Biomass Conference and Exhibition, 03.-07.05.2010 in Lyon, France: 1570-1574.
75 Waclawovsky, A., Sato, P., Lembke, C., Moore, P., Souza, G., 2010. Sugarcane for bioenergy production: an assessment of yield and regulation of sucrose content. In: Plant Biotechnology Journal, 8 (3): 263-276. DOI: 10.1111/j.1467-7652.2009.00491.x

THE FUTURE OF BIOMASS IN THE RENEWABLES PORTFOLIO
14 June 2017
68
PÖYRY MANAGEMENT CONSULTING
For pellet production, trash left in the field or at the mills as well as bagasse, the by-product of the ethanol and/or sugar production, is of interest. Around 14% of the stalk is trash (leaves etc.) and around 32% of the material delivered to the mill remains as bagasse.76 Other sources show 22-36% of the cane is bagasse, depending on the fibre content of the cane.77 The production cost of the bagasse depends on the ethanol output, since this is the main product made from sugar cane and from energy cane. Higher fibre content is achieved at the expense of a lower sugar content, which leads to a lower ethanol output and has an effect on the overall delivery cost. This aspect has not yet been economically investigated. The trash recovery cost from the field has been assumed through several project studies to between 16 and 32 USD/odt.78 It is to note that this recovery of the trash, above certain removal rates, could lead to a loss of productivity due to nutrition loss.
Bamboo has an average annual above-ground biomass production of around 45 odt/ha/year over a 6 year period.79 Bamboo planted as a high yield plantation in China for pulp and paper with a yield of 32 odt/ha/year has establishment and management costs of around 22 USD/odt.80 A trial in Ireland with a yield of 26 odt/ha/year was calculated to have site preparation, management and harvesting costs of 40 USD/odt. 81 This is due to a smaller plantation size, lower yield, higher field preparation and harvesting costs in comparison to the site in China mentioned above. Although bamboo is tenacious and fibrous, which makes it “difficult and expensive to grind”82, bamboo is an alternative feedstock for pellets and other biofuels because of its high productivity but needs further research.
With improvement in planting material, machinery and management, costs for biomass fuel for energy generation and production of pellets can be decreased. The reduction in costs is dependent on the implementation of the different, above mentioned, possibilities for improvement and the location of the plantation site with its natural characteristics and growing conditions.
76 Hassuani, S.J., Regis, L.M., Verde, L., Carvalho, M., 2005. Biomass power generation: sugar cane bagasse and trash. Piracicaba: PNUD-CTC, 2005. Série Caminhos para Sustentabilidade.
77 Zafar, S., 2015. Energy Potential of Bagasse. Published: 30. May 2015, BioEnergy Consult, Powering Clean Energy Future. http://www.bioenergyconsult.com/energy-potential-bagasse/
78 Hassuani, S.J., Regis, L.M., Verde, L., Carvalho, M., 2005. Biomass power generation: sugar cane bagasse and trash. Piracicaba: PNUD-CTC, 2005. Série Caminhos para Sustentabilidade.
79 Shanmughavel, P., Peddappaiah, R.S., Muthukumar, T., 2001. Biomass production in an age series of Bambusa bambos plantations. In: Biomass and Bioenergy, 20 (2): 113-117.
80 Zhang, W., Ma, N., 2003. High-Yielding bamboo Plantations for Paper and Pulp Production. In: Transfer of Technology Model, International network for Bamboo and Rattan (INBAR): 20. An exchange rate of 1 CNY = 0.15 USD was used (14/02/2017). http://www.inbar.int/sites/default/files/bamboo%20plantation%20-%20highyield%20stands.pdf
81 Potters, G., Brems, A., Valcke, R., Dewil, R., D’Haese, L., Samson, R., Gielis, J., 2009. Energy Corps in Western Europa: Is Bamboo an Acceptable Alternative? In: Proceedings of the 8th World Bamboo Congress Proceedings ‘Bamboo and the Environment’. Vol. 3: 22-34. An exchange rate of 1 EUR = 1.06 USD was used (14/02/2017). http://www.bambusc.org.br/wp-content/gallery/WBC2009/WBCVIII-Vol_03.pdf#page=23
82 Montano, C.D., Pels, J., Fryda, L., Zwart, R., 2012. Evaluation of Torrefied Bamboo for Sustainable Bioenergy Production. Proceedings of the 9th World Bamboo Congress, 10-15.04.2012 in Antwerp, Belgium. Session 2: 809-818.

THE FUTURE OF BIOMASS IN THE RENEWABLES PORTFOLIO
14 June 2017
69
PÖYRY MANAGEMENT CONSULTING
2.5.2 Pellet production
In order to understand the potential cost savings in the pellet production process, Pöyry approached several experienced white pellet equipment suppliers, wood pellet mill operators, and black pellet technology developers, namely:
Arbaflame
Astec Inc
CPM
Drax Biomass
Prodesa
Stela
TSI
Valmet
The objective of this was to challenge Pöyry’s in-house assumptions regarding current design criteria, investment costs, and production costs for a greenfield white pellet mill with a capacity of 500,000 tonnes per annum. With this in mind, potential cost savings from four key areas have been assessed:
When situating new white or black pellet production capacity in NW Russia or Brazil, as opposed to the US Southeast where most current capacity is located.
Through improvements in financing conditions and the debt/equity share and interest payments on capital expenditures.
When increasing the share of harvesting residues (in-wood chips) used in white and black pellet production, in the place of pulpwood.
When producing agri-pellets from sugar cane bagasse and straw in Brazil.
It was extensively reported by several equipment suppliers that technology improvements that could lead to a reduction in white pellet production cost were limited, as the performance of most equipment is already optimal. Although minor improvements could still be expected due better integration with the drying islands or by improving the performance of pellet presses, these are not expected to lead to significant cost savings. However, it was commonly agreed that savings could still be made by improving operations, leading to higher mill availabilities, and by reducing commissioning timelines. It is also expected that, in a scenario of increasing pellet demand and additional capacity roll-out, project finance costs could be reduced as the debt/equity share increases and interest rates are reduced.
Switching between supply regions is expected to allow for some investment cost reductions, however, this could be balanced by higher capital interest requirements, in order to cover the risk of investing in such regions. With biomass and other variable costs representing a higher share of the total pellet production cost, regions providing lower biomass prices, as well as lower labour and power costs, could lead to significant pellet production cost savings.
If pulpwood is replaced with harvesting residues (in-wood chips) as the main feedstock in pellets, not only would production costs be expected to fall due lower raw material prices, but also due to lower investment and operational costs in the raw material storage and wood room (i.e., debarking, chipping and screening).
Despite a significant effort made by black pellet technology developers to bring this technology to a commercial viable state, it is still by no means comparable to white pellet production. Currently, both investment and operational costs for a black pellet mill are still higher and expected to remain higher when compared with a white pellet mill. However, a higher bulk density and energy content, allow some comparable savings in supply chain logistics. Other quality characteristics reported by black pellet technology developers, such as better milling properties and water resistance, can potentially provide investment

THE FUTURE OF BIOMASS IN THE RENEWABLES PORTFOLIO
14 June 2017
70
PÖYRY MANAGEMENT CONSULTING
and operational cost savings at the power station, resulting in power generation cost gains compared to white pellets.
Agri-residue pellets are already being produced at smaller scale pellet mills, using a variety of raw materials (e.g., sunflower husks, straw and sugarcane bagasse). Recently, larger scale projects have been announced and full process optimization can still be expected. In terms of investment and operational costs, a considerable reduction can be expected in raw material storage, raw material size reduction and screening, and even potentially on the drying island due to a typically lower moisture content of the raw material. However, depending on the silica content of the raw material, and soil contamination, higher maintenance costs are likely to occur.
2.5.3 Current and improved supply chains
Based on the potential cost reductions that have been identified across the biomass supply chains (as detailed in sections 2.5.1 and 0), Pöyry has analysed 26 different supply chains (Table 9), covering current production costs and improved production costs for white and black pellets produced using pulpwood or harvesting residues (in-wood chips). These supply chain costs were calculated for different supply regions, including the US Southeast, NW Russia, and Brazil. Additionally Pöyry has also analysed two supply chains for agri-residue pellets, assuming 100% sugarcane bagasse (50% moisture content), based on both current production practices and assuming an improved scenario with a feedstock mix of 50% bagasse and 50% sugarcane straw, which would reduce the average moisture content to 33%.
All of the assessed supply chains are based on a 500,000 tonne greenfield pellet mill investment. Despite the potential feedstock cost reductions identified in section 2.5.1, Pöyry believe that without full vertical integration (including land acquisition), it is unlikely that such cost savings would be captured, instead resulting in margin improvements for feedstock producers. As a result, if feedstock supply and demand balances, as described in sections 2.3.2 to 2.3.8, do not become tight and a feedstock surplus remains, there would be no reason to expect increases in delivered feedstock prices, in real terms.
The analysis of the different supply chains still assumes a certain level of vertical integration, meaning that debt and equity payments have been considered; however the assessment was done on a cost basis, which removes the impact of any market dynamics on potential supply chain price volatility.

THE FUTURE OF BIOMASS IN THE RENEWABLES PORTFOLIO
14 June 2017
71
PÖYRY MANAGEMENT CONSULTING
Table 9 – Pellet mill input costs and assumptions
Product Deployment Feedstock Supply region Supply chain
White pellets Current
Pulpwood
US Southeast WP 1.0.P US
NW Russia WP 1.0.P RU
Brazil WP 1.0.P BR
Harvesting residues
US Southeast WP 1.0.HR US
NW Russia WP 1.0.HR RU
Brazil WP 1.0.HR BR
Black pellets
Current
Pulpwood
US Southeast BP 1.0.P US
NW Russia BP 1.0.P RU
Brazil BP 1.0.P BR
Harvesting residues
US Southeast BP 1.0.HR US
NW Russia BP 1.0.HR RU
Brazil BP 1.0.HR BR
White pellets
Improved
Pulpwood
US Southeast WP 2.0.P US
NW Russia WP 2.0.P RU
Brazil WP 2.0.P BR
Harvesting residues
US Southeast WP 2.0.HR US
NW Russia WP 2.0.HR RU
Brazil WP 2.0.HR BR
Black pellets
Improved
Pulpwood
US Southeast BP 2.0.P US
NW Russia BP 2.0.P RU
Brazil BP 2.0.P BR
Harvesting residues
US Southeast BP 2.0.HR US
NW Russia BP 2.0.HR RU
Brazil BP 2.0.HR BR
Agri pellets Current Sugarcane bagasse Brazil AP 1.0.SB BR
Agri pellets Improved Sugarcane bagasse Brazil AP 2.0.SB BR
The main assumptions considered for each supply chain are aligned with the assumptions described in section 2.1 (Table 4), however, additional assumptions such as alternative raw material prices, raw material characteristics, inland transportation costs, are current and future financing conditions are described in Table 10, Table 11, and Table 12.

THE FUTURE OF BIOMASS IN THE RENEWABLES PORTFOLIO
14 June 2017
72
PÖYRY MANAGEMENT CONSULTING
Table 10 – Main assumptions for the different supply chains (1/3)
Variable Unit US Southeast NW Russia Brazil
Labour cost USD/person 81,014 14,861 21,641
Power cost USD/MWh 59.0 32.0 60.0
Natural gas cost USD/tonne 155 65 253
Raw Material cost
Pulpwood USD/odt 60.9 61.9 45.2
Harvesting residues USD/odt 53.6 42.7 38.7
Sugarcane bagasse USD/odt 32.0 *
Inland transportation distance km 200 200 350
Transport method Truck Truck Truck
Fixed costs USD/tonne 5.8 4.3 2.5
Variable costs USD/tonne/Km 0.05 0.04 0.07
Note: Pöyry assume that sugarcane bagasse could be delivered to a pellet mill at 32 USD/odt. Going forward, Pöyry expects that agri-residue pellets produced in Brazil would use 50% bagasse and 50% sugarcane straw, which could lead to a combined feedstock delivered price of 24 USD/odt.
As can be seen in Table 10, harvesting residues have a significantly lower delivered cost when compared to pulpwood across all regions. Brazil stands out as the supply region with the lowest delivered prices, followed by NW Russia and the US Southeast. Despite labour and power cost differences across the three regions, the impact of these costs is considerably less significant than the impact of raw material prices.
Raw materials and final products are assumed to have different characteristics, such as moisture and energy contents, and bulk densities, which not only impacts the raw material demand for the drying islands, but also the logistics cost and, at a later stage, the pellet requirement at each power station (Table 11).
From the 26 supply chains assessed, half of them reflect a ‘current’ deployment potential and the remaining ones represent ‘improved’ scenarios. Under the improved scenarios, the financing structure of the projects is assumed to be more favourable, with higher debt/equity ratios, lower interest rates, and with economic lifetimes increasing from 10 years to 15 years (Table 11).

THE FUTURE OF BIOMASS IN THE RENEWABLES PORTFOLIO
14 June 2017
73
PÖYRY MANAGEMENT CONSULTING
Table 11 – Main assumptions for the different supply chain options (2/3)
Units White pellets 1.0 Black pellets 1.0 Agri pellets 1.0 White pellets 2.0 Black pellets 2.0 Agri pellets 2.0
Capacity tonnes 500,000 500,000 500,000 500,000 500,000 500,000
Target availability % 90% 90% 90% 95% 95% 95%
Production tonnes per year 475,000 475,000 475,000 475,000 475,000 475,000
Production odt/year 437,000 451,250 437,000 437,000 451,250 437,000
Commissioning months 8 10 10 4 4 4
Pellet moisture % 8% 5% 8% 8% 5% 8%
Pellet LHV GJ/tonne 17.3 19.5 16.9 17.3 19.5 16.9
Pellet HHV GJ/tonne 18.7 20.8 18.3 18.7 20.8 18.3
Pellet bulk density Kg/m3 650 750 650 650 750 650
Pulpwood moisture % 50% 50% 50% 50% 50% 50%
Pulpwwod LHV GJ/tonne 8.3 8.3 8.3 8.3 8.3 8.3
Pulpwood HHV GJ/tonne 10.2 10.2 10.2 10.2 10.2 10.2
Harvesting residues moisture % 50% 50% 50% 50% 50% 50%
Harvesting residues LHV GJ/tonne 8.3 8.3 8.3 8.3 8.3 8.3
Harvesting residues HHV GJ/tonne 10.2 10.2 10.2 10.2 10.2 10.2
Sugarcane bagasse moisture % 50% 50% 50% 33% 33% 33%
Sugarcane bagasse LHV GJ/tonne 7.3 7.3 7.3 10.6 12.1 12.1
Sugarcane bagasse HHV GJ/tonne 9.2 9.2 9.2 12.3 12.3 12.3
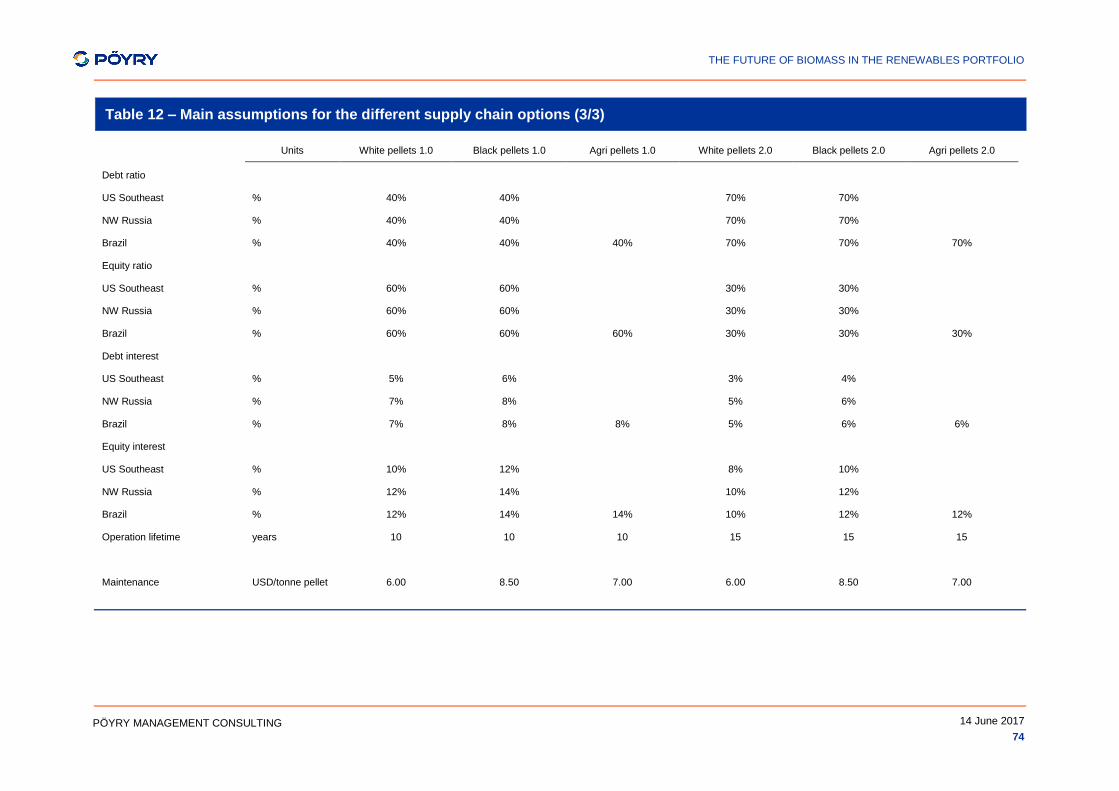
THE FUTURE OF BIOMASS IN THE RENEWABLES PORTFOLIO
14 June 2017
74
PÖYRY MANAGEMENT CONSULTING
Table 12 – Main assumptions for the different supply chain options (3/3)
Units White pellets 1.0 Black pellets 1.0 Agri pellets 1.0 White pellets 2.0 Black pellets 2.0 Agri pellets 2.0
Debt ratio
US Southeast % 40% 40% 70% 70%
NW Russia % 40% 40% 70% 70%
Brazil % 40% 40% 40% 70% 70% 70%
Equity ratio
US Southeast % 60% 60% 30% 30%
NW Russia % 60% 60% 30% 30%
Brazil % 60% 60% 60% 30% 30% 30%
Debt interest
US Southeast % 5% 6% 3% 4%
NW Russia % 7% 8% 5% 6%
Brazil % 7% 8% 8% 5% 6% 6%
Equity interest
US Southeast % 10% 12% 8% 10%
NW Russia % 12% 14% 10% 12%
Brazil % 12% 14% 14% 10% 12% 12%
Operation lifetime years 10 10 10 15 15 15
Maintenance USD/tonne pellet 6.00 8.50 7.00 6.00 8.50 7.00

THE FUTURE OF BIOMASS IN THE RENEWABLES PORTFOLIO
14 June 2017
75
PÖYRY MANAGEMENT CONSULTING
The supply chain analysis shows that white pellets produced under current market assumptions in the US Southeast, and using pulpwood as the main raw material (WP 1.0.P US) could be delivered into GB at 173 USD/tonne (CIF). When using the same assumptions but shifting supply regions, white pellets produced in Brazil (WP 1.0.P BR) could be delivered at 165 USD/tonne while those produced in NW Russia (WP 1.0.P RU) could be delivered at 148 USD/tonne (see Figure 39).
Assuming an improved pellet production scenario (i.e. lower commissioning periods, better availability of the pellet mills and better financing conditions), then white pellets produced in the US Southeast (WP 2.0.P US) could be delivered into GB at 155 USD/tonne. Under the same assumptions, white pellets produced in Brazil (WP 2.0.P BR) and NW Russia (WP 2.0.P BR) could be delivered at 148 USD/tonne and 132 USD/tonne, respectively (see Figure 39).
When assuming harvesting residues are used as the main feedstock for white pellet production, with current market assumptions for all other parameters, white pellets produced in the US Southeast (WP 1.0.HR US) can be expected to be delivered into GB at 161 USD/tonne, representing a reduction of 12 USD/tonne when compared with pellets produced with pulpwood. Assuming the same supply chain but with production being set in Brazil (WP 1.0.HR BR) or NW Russia (WP 1.0.HR RU), then delivered costs into GB can be expected to decrease to 154 USD/tonne and 127 USD/tonne, respectively (see Figure 39).
Under an improved pellet production scenario, further cost reductions are expected to be achieved. White pellets produced with harvesting residues in the US Southeast (WP 2.0.HR US) could then be delivered into GB at 144 USD/tonne, while when produced in Brazil (WP 2.0.HR BR) or NW Russia (WP 2.0.HR RU), they could be delivered at 139 USD/tonne and 113 USD/tonne, respectively (see Figure 39).
Despite black pellets having a higher bulk density (providing an advantage in terms of supply chain logistics) and a higher energy content, when compared to white pellet supply chains even on an energy basis, delivered prices are always higher (see Figure 40). With current market assumptions, black pellets produced from pulpwood could be delivered from the US Southeast (BP 1.0.P US) into GB at 224 USD/tonne (11.5 USD/GJ). If production is shifted towards Brazil (BP 1.0.P BR) or NW Russia (BP 1.0.P RU), delivered prices can be expected to fall to 209 USD/tonne (10.7 USD/GJ) and 198 USD/tonne (10.2 USD/GJ), respectively.
When assuming an improved pellet production scenario and considering harvesting residues as the main feedstock for black pellet production, then prices for black pellets delivered to GB and produced in the US Southeast (BP 2.0.HR US) could reach 181 USD/tonne (9.3 USD/GJ). Assuming Brazil (BP 2.0.HR BR) or NW Russia (BP 2.0.HR RU) are the production regions, then pellets would be delivered at 170 USD/tonne (8.7 USD/GJ) and 148 USD/tonne (7.6 USD/GJ), respectively.
Even though agri-residue pellets could be produced from different feedstocks and in different supply regions, Pöyry has limited the analysis to pellets produced from sugarcane residues (bagasse and straw) in Brazil. The reason behind this is the fact that agri-residues are often sparse and the logistics to gather large amounts can be challenging. In Brazil, however, the sugarcane industry is well established and significant volumes of sugarcane bagasse and sugarcane trash could potentially be made available for pellet production. Despite a lower energy content, sugarcane bagasse pellets could be delivered into GB at 8.8 USD/GJ (148 USD/tonne) under current market assumptions. Under an improved pellet production scenario delivered prices could be lowered to 7.0 USD/GJ (118 USD/tonne) (see Figure 39 and Figure 40).

THE FUTURE OF BIOMASS IN THE RENEWABLES PORTFOLIO
14 June 2017
76
PÖYRY MANAGEMENT CONSULTING
Figure 39 – Comparison between different supply chain options (CIF, UK, USD/tonne)
0
25
50
75
100
125
150
175
200
225
250W
P 1
.0.P
US
WP
1.0
.P R
U
WP
1.0
.P B
R
WP
1.0
.HR
US
WP
1.0
.HR
RU
WP
1.0
.HR
BR
BP
1.0
.P U
S
BP
1.0
.P R
U
BP
1.0
.P B
R
BP
1.0
.HR
US
BP
1.0
.HR
RU
BP
1.0
.HR
BR
WP
2.0
.P U
S
WP
2.0
.P R
U
WP
2.0
.P B
R
WP
2.0
.HR
US
WP
2.0
.HR
RU
WP
2.0
.HR
BR
BP
2.0
.P U
S
BP
2.0
.P R
U
BP
2.0
.P B
R
BP
2.0
.HR
US
BP
2.0
.HR
RU
BP
2.0
.HR
BR
AP
1.0
.SB
BR
AP
2.0
.SB
BR
US
D/t
on
ne
Biomass Power Natural gas Labour Maintenance Capex Inland transportation cost Shipping cost

THE FUTURE OF BIOMASS IN THE RENEWABLES PORTFOLIO
14 June 2017
77
PÖYRY MANAGEMENT CONSULTING
Figure 40 – Comparison between different supply chain options (CIF, UK, USD/GJ)
0
2
4
6
8
10
12
14W
P 1
.0.P
US
WP
1.0
.P R
U
WP
1.0
.P B
R
WP
1.0
.HR
US
WP
1.0
.HR
RU
WP
1.0
.HR
BR
BP
1.0
.P U
S
BP
1.0
.P R
U
BP
1.0
.P B
R
BP
1.0
.HR
US
BP
1.0
.HR
RU
BP
1.0
.HR
BR
WP
2.0
.P U
S
WP
2.0
.P R
U
WP
2.0
.P B
R
WP
2.0
.HR
US
WP
2.0
.HR
RU
WP
2.0
.HR
BR
BP
2.0
.P U
S
BP
2.0
.P R
U
BP
2.0
.P B
R
BP
2.0
.HR
US
BP
2.0
.HR
RU
BP
2.0
.HR
BR
AP
1.0
.SB
BR
AP
2.0
.SB
BR
US
D/G
J (
LH
V)
Biomass Power Natural gas Labour Maintenance Capex Inland transportation cost Shipping cost

THE FUTURE OF BIOMASS IN THE RENEWABLES PORTFOLIO
14 June 2017
78
PÖYRY MANAGEMENT CONSULTING
3. THE OUTLOOK FOR GENERATION COSTS
This section of the report considers the technical aspects and costs associated with the potential conversion of a range of UK coal fired stations to use 100% biomass as fuel. Cost data was collected from Drax during a visit to the power station on 21st November 2016 which was subsequently clarified in a series of emails. This cost data has been compared with other data that has been collected from previous design studies and from published information.
3.1 Approach taken
The approach taken has been to consider the technicalities and costs associated with the conversion of Units 1-3 at Drax such that site specific issues could be identified to facilitate:
consideration of the scope and costs needed for conversion of Units 4-6; and
comparison with other UK sites where circumstances vary.
The conversion of Units 4 to 6 has considered the alternatives of maintaining the present 13 to 15 days of pellet storage capacity and also of reducing this to 7 days thereby avoiding the need to build further storage. Consideration of the conversion of the other stations has assumed that 13 to 15 days pellet storage would be needed but similar cost savings would be possible at these stations if the security of the supply chain could enable 7 days of storage.
Drax is the largest coal fired station in the UK with a capacity of approximately 4GWe. Most of the other stations are around half of this output with some considerably smaller (e.g. Lynemouth and Uskmouth). This study has needed to encompass a wide range of station capacity and also technology variations, particularly with respect to the boiler islands. Pöyry has done this by assuming three ‘typical’ stations which are compared below with Units 4 to 6 at Drax:
Table 13 – Main characteristics of the assessed power stations
Drax Units 4-6 Station A Station B Station C
Size Large
(645MW Units) Large
(400-600MW Units) Small
(100-250MW Units) Large
(400-600MW Units)
Fuel delivery Rail Rail Rail Rail
Fuel storage Coal, open storage Coal, open storage Coal, open storage Coal, open storage
Coal Mill Type / # Vertical Spindle / 10 Tube ball /
6 Vertical Spindle / 4 Vertical Spindle / 6
Combustion System Low-NOx with BOFA,
opposed wall fired Low NOx burners with BOFA, front wall fired
Low NOx burners, front wall fired
Tangentially-fired with OFA
PM Control ESPs ESPs ESPs ESPs
Availability of dry coal PFA
Yes No No No
It is considered that this range of typical stations is reasonably representative of UK coal fired stations in general and is sufficient for the purposes of this ‘high level’ study of conversion costs. It is stressed that more accurate cost estimates for station conversions

THE FUTURE OF BIOMASS IN THE RENEWABLES PORTFOLIO
14 June 2017
79
PÖYRY MANAGEMENT CONSULTING
will need to consider the details of existing designs (NB design varies according to the original coal analysis), operating schedule and particulars, fuel supply logistics, site and rail delivery layout and equipment layout.
Consequently, the actual costs at any particular station will need to be evaluated from specific design details which lie outside of the scope of this report. Pöyry’s analysis has been at a relative high level and no design work has been carried out for any of the stations considered. Reliance has been placed on the information received from Drax and upon Pöyry’s own cost data from other studies. It is to be expected that costs determined from more specific design development may vary from the ‘order of cost’ preliminary estimates presented in this report.
Pöyry’s analysis has been based on the conversion of the stations to burn white wood pellets within the IWPB I2 specification as the biomass fuel. The possibility of burning black pellets and lower quality biomass fuels has also been considered but this has been against a background where such large scale conversions have not yet been made in the UK and data is scarce or simply not available. The approach taken has been to consider the potential technical issues and to offer a largely qualitative opinion about how this could be expected to affect the conversion costs for white pellets.
Black pellets (i.e. torrefied or steam exploded wood pellets) have a range of physical properties and the development of these projects is at a relatively early stage compared to white wood pellets, production and consumption not yet having reached commercial maturity. Some caution is therefore needed due to the variability of available data which would require a much more detailed design study to establish real conversion costs. However, one of the principal claimed advantages for black pellets is that this fuel can be stored and handled in the same way as coal, thus offering substantial savings in the conversion costs. For the purposes of this study, it has been assumed that these savings could be realised.
3.2 Technical description of the conversions
The conversion from coal to white wood pellets is described below in dedicated sections for the fuel reception and storage and for the boiler island. The conversion to burn lower quality biomass fuels is discussed in a separate section towards the end of this chapter.
3.2.1 Fuel delivery, unloading, storage and transfer
3.2.1.1 Fuel yard rail layout
Due to the lower bulk density of white wood pellets and lower heating value compared to coal, additional rail loads will need to be unloaded / transported in the same rail cars compared to running coal in order to regain the missing 1/3 energy. All other typical stations evaluated here presently use a loop rail system (or merry-go-round) inside the station boundary and so cars are never uncoupled and reversed in the unloading process which would otherwise cause an unloading inefficiency.
Drax modified the track routing and improved the rail quality to their existing loop rail cars unloading system to allow longer trains and faster speeds, leading to increased unloading efficiency during Units 1 to 3 Boiler Conversions. No additional rail yard cost factor has been added for Units 4 to 6 Boiler Conversions as it is believed this existing modified system will handle the unloading needs for the complete six boiler units, although the longer trains and increased number compared to coal deliveries may require longer delivery periods.

THE FUTURE OF BIOMASS IN THE RENEWABLES PORTFOLIO
14 June 2017
80
PÖYRY MANAGEMENT CONSULTING
Based on Pöyry analysis, the other typical stations should have sufficient rail line length to accommodate the increased number of fuel cars in their fuel trains if converted to biomass pellets.
3.2.1.2 Rail unloading
The existing rail car unloading system at Drax will be sufficient to unload pellet trains for Units 4 to 6. It is a batch type system that presently enables delivery of biomass to Units 1 to 3. The other typical stations will most likely require the following improvements in their existing rail car unloading system building:
installation of a dust collection system inside the rail car unloading building;
dust deflection vertical shield walls alongside the rail car unloading locations;
modification of any building horizontal surfaces for prevention of dust collecting (layer);
fire / smouldering detection sensors;
air sampling system beside the rail car unloading positions;
plant worker air lance cleanup / vacuum hose cleanup systems; and
and, possibly, water wash down hose stations.
The other typical stations will require existing rail car receiving fuel transfer conveyors (typically dual flighted drag chain conveyors below the car unloading location(s)). The following yard transfer belt conveyors and the fuel transfer inclined belt conveyors up to the power plant (NB side by side enclosed gallery concept) will need to be enclosed, upgraded or replaced in order to transport 50% more fuel in a safe manner to make up for the energy deficiency when delivering pellets compared to coal. They will also need to be fully enclosed (if not already so), connected to a negative pressure dust / fines collecting system, equipped with thermal sensors and a spark detection system with water suppression.
The existing fuel delivery system belt conveyors from the rail unloading will need a built-in continuous revenue grade product scales, automatic programmable for interval / quantity (15 kg for every 5,000 kg of pellets) fuel pellet automatic samplers with each sample placed into an enclosed sample container, plus ferrous metal magnet scanning on pellet flow and material screening to remove tramp metal.
The existing fuel feed systems at the other typical power stations may be able to be incorporated with needed modifications if the required new biomass pellets storage silos can be located close to the existing fuel feed systems, or may need to be a newly constructed transport system based on the constraints at a particular site (e.g. available ground area).
The pellet fuel feed system constructed for Units 1 to 3 appears to have sufficient capacity as it currently runs in batches up to the constructed enclosed pellet fuel storage Domes such that the Units 4 to 6 Boiler Conversions would not require additional expenditures for storage if the 7 day storage capacity is deemed an acceptable risk.
3.2.1.3 Enclosed pellet storage
In the initial conversion of Units 1 to 3, Drax were very cautious with their decisions about the volume of pellet storage that was needed on site. Concerns were held regarding disruptions and timing of fuel pellets leaving the production plants, delays in ocean pellet shipments (Typ. 45,000+ ton Panamax Vessels), disruptions at the port on arrival in

THE FUTURE OF BIOMASS IN THE RENEWABLES PORTFOLIO
14 June 2017
81
PÖYRY MANAGEMENT CONSULTING
unloading to the local 25-car (75 ton loads) rail trains and finally delivery of the filled rail cars on site. Thus Drax made the decision to design for 13 to 15 days fuel pellet storage in 4 identical enclosed Dome Silos (112,000 m3 capacity each for 75,000 to 80,000 fuel pellet tonnes), which their operational experience now suggests to be a very conservative design point.
Since the initial conversion of Units 1 to 3, Drax’s availability has been 96% with none of the fuel pellet supply issues that were envisioned from the production plants, shipping port terminals, ocean transport, UK receiving ports or rail train deliveries to the station. Drax consider that this amount of fuel pellet storage is too conservative and could now be reduced, maintaining the station production reliability but reducing the needed conversion cost for the remaining Units 4 to 6.
In the plant current design, the ideal operation has been shown to be with three fuel pellet Domes full (up to 240,000 tons) and one fuel pellet dome empty or run all four fuel pellet Domes partially full (up to 240,000 tons). Thus for Drax's conversion of Units 4 to 6, no further fuel pellet storage needs to added thus saving capital funds for additional domes construction (base case assumed in this study), feed fuel pellet conveyors to storage, additional main dust/fines collection system, pellet sampler system, pellet screening, increased pellet fire suppression systems (N2 & CO2 padding) and other duplications.
Drax's experience with the Dome Storage Units equipped with Vibra-Floor fuel pellet reclaim system has been good and this solution has been found to be very cost effective compared to other options. The Dome solution normally requires no extensive foundations / piling for each dome as the base is designed to the actual soil capabilities. The actual installation schedule is very fast relative to other storage options for such large capacities. This storage structure can also support all needed top head house(s) for fuel conveyor(s) and allows installation of the necessary explosion relief / venting panels.
3.2.1.4 Pellet storage safety systems
The fuel pellet belt conveyors that feed the fuel pellet storage system, and the discharge system from storage to the power boilers, need to be equipped with a spark detection system that controls a water suppression spray extinguishing system. The detection system will also trip the related conveyor belt (and feed). Where airslide conveyors are installed the water suppression spray extinguishing system will cause extreme swelling of the fuel pellets that will damage the conveyor belting and conveyor hoods due to expansion forces / increased weight. The conveyor hoods should be attached with shearing bolts so the covers can be opened relieving any potentially damaging expansion forces.
The fuel storage Domes need to be equipped with Nitrogen Gas (N2) blanket padding (generated on site) injected into the bottom of the domes and Carbon Dioxide (CO2) blanket padding into the top free space of the domes, which is effective on a localised pocket fire. The final resort is water or foam deluge flow into the top of the Dome but this will ruin all fuel pellets stored and, depending on how full, also risks damaging the dome itself due to added weight and internal pressure from pellet expansion.
The Drax domes are equipped with essential top internal advance warning of combustion gas, heat detectors and inside 3D pellet surface mapping to predict what might be happening. The domes also have internal, ceiling hanging, temperature sensor cables installed on a grid that can monitor for overheating pellet pockets at various pellet depths inside the dome. The N2 padding is injected into the dome underside and is capable of reducing bottom oxygen content to 5-7%. If further Oxygen reduction is desired down to 1%, then liquid N2 can be quickly brought into the plant for injection. Nitrogen injection cannot lower a spiking storage fuel pellet temperature but will hold it at the reading.

THE FUTURE OF BIOMASS IN THE RENEWABLES PORTFOLIO
14 June 2017
82
PÖYRY MANAGEMENT CONSULTING
Second stage smouldering / fire suppression is suppressed by activating the dome top CO2 blanketing system. The last resort is activating the Dome top water / foam deluge which will ruin the stored fuel in the dome.
Further cost reductions in the specification and equipment installed with the domes is considered unlikely as such changes would most likely increase availability risks.
3.2.1.5 Dust / fines collection system
The installed fuel pellet dust / fines collection system from the conversion of Units 1 to 3 is one single overall type of system. This system serves the collection needs from the common fuel pellet delivery rail car unloading through subsequent conveying delivery to the four Dome storage silos and then reclaiming from the four Dome storage silos.
Again, when Drax started on the staged boiler conversion process they took a very conservative design approach to ensure plant operations safety as very little historical experience of such conversions was available. The approach taken of having one large system for all input flows but maintained as one separate isolated system was thought the safest approach.
Drax also took the approach of specifying an allowable liberal dust/fines content in all their fuel pellet purchases. The system was designed to work with this content and much more if need be. Although Drax has the right to reject out of specification pellets, in reality, if a purchased ship load of fuel pellets (45,000 tonnes) arrives in the UK port with high dust content, then for practical reasons it cannot simply be refused. Drax needs to accept the substandard load and thus not lose that entire fuel load.
The system collects dust/fines from the rail car unloading shed and all the conveyors up through the fuel pellet screening to loading the four Dome storage units and from the operating Dome discharge system delivering the fuel pellets to the three converted biomass boiler burner fuel systems. The biomass dust/fines collected in the storage Silos is up to 30 hours of dust/fines.
The other very conservative risk avoidance design choice made was to pneumatically convey all biomass dust / fines by routing the conveyor piping outside of the buildings until it just enters at the power boiler fuel day silos. This was done as it is known that the abrasiveness of pneumatically conveyed biomass dust / fines can wear holes in the line (especially at elbows) and this was deemed potentially a great fire safety potential issue inside an operating high temperature power boiler building. This decision increased costs a significant amount as complete separate line support structures were required and the routing was not direct, thus using much more pipe.
The pneumatic conveying system is high in absorbed power due to the larger air blowers needed for the long and many pipe runs. The type of pipe/elbows selected was guaranteed low wear and ceramic lined. This pipe has lived up to its guarantee but is very expensive and all wear so far has been due to mechanical internal object damage (e.g. bolt). Drax will now use ceramic lined low wear blow line pipe and resistant elbows. Also due to experience gathered, Drax will allow the pipe to be routed into and through the power boiler buildings, lowering the needed compressor pump absorbed power. In conclusion, the present arrangement is significantly over-sized in capacity and costly dust/fines collection system could be reduced in cost for any future conversions without.
3.2.1.6 Pellet fuel delivery to the mills
Experience from several trials indicates that the drag-link coal feeders (as installed at Drax and indeed most UK coal stations) are not suitable for re-use in a biomass pellet

THE FUTURE OF BIOMASS IN THE RENEWABLES PORTFOLIO
14 June 2017
83
PÖYRY MANAGEMENT CONSULTING
conversion because of pellet degradation, therefore replacement is required. It is prudent not to consider the mill feeders in isolation of the upstream system (namely the fuel transfer system and coal bunkers) as options of the upstream plant may impact directly on the best options for the mills feeders.
Coal bunkers are not suitable for use with dry biomass due to the numerous hazards associated with their reuse, most significantly control of dust and fire & explosion risk which is extremely difficult to mitigate cost effectively. The degree to which the existing infrastructure can be safely and cost effectively reused is very dependent on the layout and original design of a particular power station.
In many cases, addressing these issues creates additional issues that are costly to resolve or result in unacceptable risk. For example, closing-in/covering bunkers to control dust results in additional challenges including the creation of a large vessel which generally cannot be reconstructed structurally to survive explosions and therefore the requirement for explosion venting (vents will be large and possibly not feasible with a given layout), ventilation with filter packs (fire and explosions risk) and difficulty of effective fire detection and suppression within large bunker volumes. Some installations have used inert padding (steam) in the existing bunkers as a solution.
The approach used by Drax for the existing biomass units addresses these issues by effectively replacing the transfer and short term bunker storage with a purpose designed pneumatic system. Although novel when installed, this approach has proven safe and reliable in operation. Therefore it may be considered best practice for all power stations considered in this study (i.e. of the design typical of potential UK conversion projects) on consideration of cost, operability and risk.
It should be noted that the suitability of this approach is not universal for all coal to biomass conversions and is dependent on the configuration of the plant under consideration. For smaller units or newer coal plant (e.g. as found in Continental Europe), the existing bunker arrangements may be more suited to adaptation to biomass and therefore the existing infrastructure could possibly be reused to a greater degree – with potential for significantly lower capital cost. However, this may only be determined through more detailed engineering study and safety analysis.
For the cases considered, the Capex estimate allows for a direct pneumatic feed system. The costs are largely driven by the number of conveying streams (i.e. number of mills per unit).
3.2.2 Boiler island conversion
The scope considered for the boiler island includes:
Mills from the entry point of fuel to the mills
All draught plant
PF Pipework
PF Burners
Furnace equipment
Post-combustion gas cleaning (and ash handling)
Bottom ash handling
This report provides a summary of these costs as they relate to the conversion of the remaining coal units at Drax to biomass. It also benchmarks these against the three other

THE FUTURE OF BIOMASS IN THE RENEWABLES PORTFOLIO
14 June 2017
84
PÖYRY MANAGEMENT CONSULTING
typical stations in order to illustrate where a different approach would apply and how this could affect the project costs.
3.2.2.1 Mill modifications
The mill modifications required are dependent on several factors:
the type of coal mills installed and their suitability (or otherwise) for conversion to process wood pellets;
the combustion system requirements; and
available milling capacity.
The Drax combustion system, being opposed wall-fired and with BOFA (Boosted Over-Fire Air) is tolerant of coarse mill fuel. Further, the availability of coal PFA (Pulverized Fuel Ash), used as an additive to dilute the negative characteristics of biomass ash, relaxes the need for a fine mill product quality. Therefore, Drax may operate with relatively basic, low-cost modifications to achieve de-agglomeration of the pellets and still have acceptable performance in terms of burnout and ash quality. The other typical stations considered do not have this advantage; therefore the milling plant solutions for the remaining cases would need to provide a finer product quality.
As the mills operate in a “once-through” configuration, it is possible to achieve 100% Unit output without additional milling capacity.
Typical Station A – Tube Ball Mills
Station A has tube ball mills installed for coal milling. The experience from attempts to trial these mills using biomass has shown them to be unsuitable and therefore new milling capacity would need to be installed.
Some pioneering biomass conversion projects have employed hammer mills as replacement milling capacity where the existing milling plant was not suitable for modification. However, this experience has shown that operation of hammer mills at this scale can be problematic for the following reasons:
Hammer mills require frequent maintenance, therefore spare capacity is required. The maintenance – mainly screen changes – translates to high O&M costs.
As hammer mills have high speed rotating components which pose a significant risk of mechanical damage of screens, or fire/explosion.
One station operating a large hammer mill farm reported that hammer mill explosion incidents due to tramp material in the fuel led to the rule that maintenance activities on the mills could only take place when all mills in the building were out of service. This has major implications on availability.
Similarly mill screen breaches were found to result in emissions exceedances and problems in the ash handling plant. Again, these problems resulted in plant downtime.
Therefore, on the basis of high O&M cost, availability problems and inherent safety risk – hammer mills are not considered acceptable for a new conversion.
Many biomass conversions have re-used existing vertical spindle mills (VSMs) both with and without classification as dictated by the requirements of the combustion system. Building on from the experience of these projects, certain mill suppliers will supply new VSMs with performance guarantees for biomass milling. Although of higher Capex than the hammer mill alternative, VSMs offer significantly lower O&M costs along with

THE FUTURE OF BIOMASS IN THE RENEWABLES PORTFOLIO
14 June 2017
85
PÖYRY MANAGEMENT CONSULTING
significantly improved availability and safety and therefore are considered the preferred option for the typical conversion for Station A.
Due to the lack of dry coal PFA available at the site for ash dilution, it is important to ensure high combustion efficiency in order to avoid ash handling difficulties.
Typical Station B – Vertical Spindle Mills
For coal operation, Station B has vertical spindle mills installed with generous capacity available. Given the small size of the boiler and the sensitivity of front-wall firing to coarse mill product, it is critical to ensure good control of mill product quality. As it is important to achieve both maximum mill throughput and product quality, the use of dynamic classifiers have been assumed as the required technical solution for this case.
Typical Station C – Vertical Spindle Mills
For coal operation, Station C has vertical spindle mills installed with limited spare capacity available. It is also assumed that no coal PFA would be available for firing for ash dilution, therefore it would be important to achieve good mill product quality to ensure good burnout and avoid problems with ash handling.
This requirement for a fine mill product may result in a restriction in Unit output. Experience from front-wall fired plant with VSMs and dynamic classifiers suggest a significant derating would be required. However, the tangential firing configuration of the furnace is more tolerant of coarser mill product quality. In this situation, the required output derating is estimated to be in the range 0% to 10%. For the purposes of analysis, a 5% Unit derating has been applied.
3.2.2.2 Combustion and furnace
The burners for any coal fired station will require replacement due to the reduced stoichiometric air/fuel requirement of biomass fuel. The Capex required for any station will be dependent on the type of combustion system installed and therefore the nature of the modifications required.
For the case of Drax, where BOFA (Boosted Over Fire Air) for NOx control and CO control has been installed previously, the modifications required for Units 4 to 6 will be new low-NOx burners and new flame detection equipment.
Station A will require replacement of the existing burners with a new design for biomass.
Station B will require replacement of the existing burners with a new design for biomass and the addition of a BOFA to allow effective NOx and CO control.
The tangential firing arrangement at Station C has many benefits in terms of suitability for biomass and reduced complexity in the scope of modifications required, which translates to lower relative Capex when compared to the wall fired stations.
3.2.2.3 Furnace cleaning and managing deposition
The furnace deposition control strategy employed by Drax, and assumed as the base case for future converted Units, is based on injection of coal PFA, primarily to dilute the negative characteristics of biomass ash. This requires an injection system for dry PFA through existing boiler ports.
The future availability of dry PFA is uncertain. If no dry PFA is available, wet PFA stockpiled on site may be utilised but this will require investment in a drying plant.

THE FUTURE OF BIOMASS IN THE RENEWABLES PORTFOLIO
14 June 2017
86
PÖYRY MANAGEMENT CONSULTING
However, future sourcing of PFA is beyond the scope of this study. If PFA injection is not employed in future, this will require further investment in milling plant, furnace cleaning and ash handling.
For all remaining typical stations, the assumption that no dry coal PFA will be available has been made in all cases. Therefore, the negative deposition characteristics of the ash must be dealt with by retrofitting suitable furnace cleaning equipment at Stations A & C. Station B is already equipped with furnace cleaning equipment that has been demonstrated to be suitable for deposits experienced with clean wood pellets. Additional investment would be needed to manage deposition with poorer quality fuels.
3.2.2.4 Additional heat transfer surface
Due to the changes in gas volume and emissivity of the flame, the balance of heat transfer shifts towards greater convective over radiant heat transfer. In broad terms, this results in reduced efficiency, elevated boiler outlet gas temperatures, poor performance of ESPs and fan capacity restrictions. These issues are exacerbated by the reduced hot air demand for mills operating with biomass.
These issues can be resolved by retrofit of additional heat transfer surface to increase the convective heat transfer. Units 1 to 3 at Drax employ PA Coolers to address these issues successfully. The PA Coolers allow the duty of the mill air heaters to be maximised and the heat used effectively in the boiler feed system. Largely based on this experience, installation of PA coolers may be considered best practice for biomass conversions and has been included for the other stations considered in this analysis.
3.2.2.5 Draught plant
In general, the draught plant for UK stations should have sufficient operating margin in the Induced Draught (ID) fans for operation with biomass, albeit with reduced capacity margin (on the proviso that the boiler exit gas temperature is maintained within suitable limits as described above and combustion excess air is minimised).
Therefore, in general, it is not expected that new ID fans will be required. For Station B, the fan margin is known to be insufficient and therefore new fans are required.
For Station C, the 5% Unit derating essentially provides additional fan margin.
3.2.3 Ash handling
3.2.3.1 Fly ash (PFA)
Biomass PFA can be highly problematic in coal PFA handling systems for two main reasons:
The “fibrous” nature of the ash particles causes flow problems in coal PFA handling systems.
Due to the significantly lower ash content within wood pellets, the resultant proportion of carbon-in-ash for the same combustion efficiency is much higher. This presents a major fire (smouldering) risk if combustion efficiency is not well controlled and exacerbates the handling difficulties.
The problematic nature of biomass ash can be largely negated by dilution with coal PFA as employed at Drax, significantly reducing the scope of modifications required.

THE FUTURE OF BIOMASS IN THE RENEWABLES PORTFOLIO
14 June 2017
87
PÖYRY MANAGEMENT CONSULTING
However, if coal PFA injection is not practicable, as assumed for Stations A, B and C, then significant investment is required to safely handle the ash. In this case, it is imperative to ensure optimal combustion in order to minimise the issues associated with the high unburnt content.
3.2.3.2 Furnace bottom ash (FBA)
Biomass FBA is a combination of fallen boiler deposits and unburnt fuel. The unburnt fuel can be particularly problematic, particularly in wet handling systems. The amount of unburnt fuel that falls into the bottom ash is a function of the mill product quality and the combustion system.
The opposed wall firing arrangement at Drax is particularly advantageous to ensuring good combustion of larger biomass particles that would otherwise be more likely to fall to the furnace bottom in a front wall fired configuration. Therefore, it is envisaged that modification of the existing system would be suitable to ensure safe handling.
Stations A & B are both front wall fired and therefore are particularly prone to dropout of coarse particles from the burners to the furnace bottom. Although allowance has been included for modifications to the milling plant in both cases to ensure a fine mill product and therefore optimal combustion, there is not yet sufficient experience from operation of this combustion system to provide confidence to reduce the scope of bottom ash handling modifications. Therefore, the Capex estimates allow for retrofit of dry bottom ash systems.
Station C has an advantageous firing system and there is operating experience to support that coarse particle dropout is unlikely to be an issue – particularly with good mill product fineness. Therefore, only minor modifications to the bottom ash system have been included.
3.2.4 Considerations for other biomass fuels
3.2.4.1 Black pellets
Fuel handling system
The providers of "Black Pellets" market them stating that one of the greatest cost benefits over white wood / biomass fuel pellets is that these do not need enclosed storage and thus can be stored on site in the open throughout the year using the same coal pile stacker conveyors, reclaim and conveying equipment back into the power plant, albeit slightly modified. This approach has not been proven with the test of time at multiple locations but has been the assumed basis for this cost study. However, if the power plant coal pile stacking is achieved using tracked dozers pushing up the fuel and or reclaiming only with mobile equipment, then it is suggested a gentler outdoor conveying system would be needed for black pellets.
The handling characteristics within the conveying feed and fuel pellet reclaim systems should be broadly similar to those of white pellets, with any throughput restriction due to potentially slightly higher bulk density being offset by the higher fuel CV. The handling characteristics of the black pellet particles within the biomass dust / fines systems should be broadly similar to those of white pellets, although the black pellet dust is more volatile than white pellet dust and may require additional measures.
The uniqueness of the black pellet dust can be significantly different to that from white pellets and additional measures and capacity in dust removal may be required in the feed
THE FUTURE OF BIOMASS IN THE RENEWABLES PORTFOLIO
14 June 2017
88
PÖYRY MANAGEMENT CONSULTING
system for safe handling of certain black pellets (NB characteristics can vary from one black pellet supplier to another where different manufacturing processes are used).
This removal of the need for covered storage in the system would return a large capital cost savings (GBP100 million+) in the elimination of Domes, feed conveyors, discharge conveyors, inert gas padding and other equipment. Conveyor sizing may also be reduced resulting in some further capital cost savings.
Boiler island
The handling characteristics within the pneumatic feed system should be broadly similar to those of white pellets, again with any throughput restriction due to potentially higher bulk density being offset by the higher fuel CV.
The explosivity of the black pellet dust can be significantly different and additional measures and capacity in dust removal may be required in the feed system for safe handling of certain black pellets.
The milling characteristics of “black pellets” vary greatly by producer. In general, good mill performance can be achieved in a VSM but with the following considerations:
without size control, the product from a once-through system may be too coarse resulting in poor combustion performance;
mill power consumption may be significantly lower than for white wood pellets; and
if the pellets are stored in the open, the potential of fuel moisture uptake may adversely affect mill temperatures and boiler operation due to the increased heat demand;
In general, “black pellets” do not present significant combustion issues provided the fuel can be milled to a suitable fineness and the moisture content in the fuel is not excessive.
If the mill product is coarse, as would likely be the case for a once-through mill without classification, combustion would be significantly compromised.
Black pellets tend to have a similar ash content compared to white wood pellets produced from the same feedstock, thus no increase on the ash loading at the furnace or deposition rate increase could be expected.
Overall, the deposition behaviour within the boiler is expected to be broadly similar to operation with clean white wood pellets.
No significant issues would be expected with respect to the boiler draught plant.
Ash handling in general is not expected to be substantially different to that for the reference white pellet fuel.
3.2.4.2 Other low quality biomass fuels
Fuel handling system
The most obvious impact of “low quality” fuels on the feed system will be an increase in abrasive wear due to the higher mineral content of these fuels. The abrasive wear may also impact storage silos, instrumentation and safety reaction systems and pneumatic conveying pipework. This may be exacerbated by lower fuel calorific value (CV) / energy density which will require an increased feed rate for the fuel.

THE FUTURE OF BIOMASS IN THE RENEWABLES PORTFOLIO
14 June 2017
89
PÖYRY MANAGEMENT CONSULTING
The performance of the feed system will be dependent on the mechanical properties of the fuels (pellet durability and size distribution) and is difficult to predict without detail of the exact pellets to be handled – in theory these pellets could be produced to a similar quality as the white wood pellet fuels, if specified as such.
However, if these low quality fuels are of a lower calorific value (CV) or energy density, then the conveying system may run into a capacity constraint that could limit the unit output on reuse of existing conveyors, or require new larger capacity conveyors with larger drives at increased capital cost and operating cost. Dust/fines content would likely also be problematic if significantly higher than the “design” fuel.
Boiler island
For a once-through mill system as employed for Drax, where the mills only provide for de-agglomeration of the pellets, it is expected that the poor quality pellets will not result in significant throughput restrictions. Mill product quality will be dependent on the size distribution of the material used to make the pellets. Significantly higher wear of the mill components is expected due to the higher ash content.
For the case of mills with classification, the mills will be much more sensitive to the size distribution make-up of the pellets. For non-woody pellets based on grassy/herbaceous material, throughput restrictions are likely due to the conflicting challenges presented by:
the difficulty in achieving size reduction of these materials in a VSM; and
the difficulty in producing a pellet with sufficiently fine constituents and acceptable handling characteristics.
The classifiers may be adjusted to suit these fuels (i.e. produce a coarser mill product), however, this would likely cause problems downstream.
The milling characteristics of high-bark wood pellets is not expected to be significantly different, apart from the wear considerations.
Due to differences in structure and make-up, the combustion of non-woody biomass may be very problematic due to slower burnout. This amplifies the importance of achieving a good mill product quality. Poor combustion will also negatively impact NOx emissions. These effects would be exacerbated for fuels with higher moisture content.
Other potential impacts of “low-quality” fuels are highly dependent on their chemical makeup, for example:
the sulphur content of the fuels may become important as this will result in higher SOx emissions – particularly problematic for a station without de-SOx capability;
the corrosion potential of the fuels will vary – some “low-quality” fuels may be fairly aggressive in terms of fireside corrosion;
erosion rates for certain fuels may be very high depending on the mineralogy of the fuel ash.
The “low-quality” fuels are generally characterised by having significantly higher ash content with high proportions of problematic elements. Firing these fuels will result in significantly increased deposition rates in the boiler. This may be manageable with the existing furnace cleaning equipment, may require additional investment in furnace cleaning or may not be viable. This can only be determined by detailed study of specific sites.
Deposition problems will be exacerbated by poor combustion.

THE FUTURE OF BIOMASS IN THE RENEWABLES PORTFOLIO
14 June 2017
90
PÖYRY MANAGEMENT CONSULTING
Ash dilution by coal PFA would likely have a positive effect, but injection rates would need to be increased compared to the white wood pellet fuel. Mineral additives have been demonstrated to successfully mitigate against the characteristics of these fuels (albeit at significantly smaller scale) – however, these additives are costly.
One of the key considerations for these fuels relates to the increased deposition propensity and the resultant impairment of heat transfer (reduced efficiency, excessive boiler outlet temperature) and increased pressure drop due to fouling (ID fan capacity). These issues may be managed by reduced Unit output and increased furnace cleaning.
Ash handling system
Given the likely poorer combustion, and the potentially “fibrous” nature of ash from grassy biomass, fly ash handling is likely to be more difficult and potentially hazardous. This could be alleviated by high levels of ash dilution with coal PFA.
The impact on the bottom ash handling systems is highly dependent on the combustion performance – suffice to say that large quantities of unburnt material in the bottom ash would be very hazardous. This would not be a problem for stations where a dry handling system has been fitted.
3.3 Capital costs estimations
3.3.1 Conversion to white wood pellets
Pöyry’s preliminary capital cost estimates are presented in the table below. The technical description above in Section 4 explains the assumptions behind these estimates.
Table 14 – Conversion cost estimations for white pellets (1.0.)
DRAX Units
1 to 3 DRAX Units
4 to 6 Station A Station B Station C
Units GBP per KWe of Gross Capacity
Fuel System
Rail Unloading
Rail Track Layout 6.2 - - - -
Dust Collection 0.3 0.3 0.6 0.6 0.5
Conveyor Mods 0.5 0.5 0.6 1.2 0.5
Sub-total 7.0 0.8 1.1 1.8 1.0
Storage
Concrete Domes & Reclaimers (13 to15 days of storage)
72.4 - 74.5 133.3 71.4
Fire Protection / Inert Gas 5.2 5.2 5.3 9.5 5.1
Dust Collection 9.3 9.3 9.6 17.1 9.2
Conveyors / Boiler Feed Blow-line 41.3 41.3 42.6 76.2 40.8
Sub-total 128.2 55.8 131.9 236.1 126.5
Total Fuel System 135.1 56.6 133.0 237.9 127.5
Boiler Island and Ash System
Mills

THE FUTURE OF BIOMASS IN THE RENEWABLES PORTFOLIO
14 June 2017
91
PÖYRY MANAGEMENT CONSULTING
Fuel Feed to Mill 11.5 11.5 7.0 18.6 7.5
Mill Modifications 0.7 0.7 24.8 12.9 3.6
PF Pipework 0.3 0.3 - 0.5 0.2
Mill Rejects - - - 0.3 -
Sub-total 12.4 12.4 31.8 32.3 11.3
Furnace
Burners and NOx 2.5 2.5 2.2 26.9 1.3
Coal PFA/Mineral Additive Injection 4.1 4.1 - - -
Furnace Cleaning - - 2.2 - 2.0
Sub-total 6.6 6.6 4.4 26.9 3.3
Boiler
PA System 3.4 3.4 4.9 10.7 4.4
Draught Plant - - - 7.1 -
Sub-total 3.4 3.4 4.9 17.9 4.4
Ash Handling
PFA Handling 0.4 0.4 9.2 21.1 8.3
Bottom Ash Handling 1.2 1.2 4.4 10.7 1.0
Sub-total 1.6 1.6 13.7 31.8 9.3
Total Boiler Island and Ash System 24.0 24.0 54.7 108.8 28.3
Total Biomass Conversion 159.2 80.6 187.8 346.7 155.8
Notes: For the conversion of Drax units 4 to 6 it has been assumed that storage capacity could be reduced from 14 days to 7 days, meaning that no additional storage capacity will be required. For the stations A, B and C it has been assumed a 14 day storage (1.0. current deployment), which could potentially be reduced to 7 days (2.0. improvement deployment).
From the above table, it can be seen that the most significant element of the biomass conversion costs is for the fuel storage system, related conveyors, dust handling and fire/explosion protection systems. By comparison, the costs associated with modifying the boiler island and ash system are small. Consequently, assumptions about the extent of storage capacity needed to mitigate supply chain risks (i.e. c. 14 days storage vs. 7 days) can be significant as this not only affects the storage itself but also the other related conveyor and fire protection plant. At Drax this would reduce the cost of conversion of Units 4 to 6 from 160GBP/kW to about 81GBP/kW.
It is also significant that the storage cost estimates above have been based upon the use of storage domes, as at Drax, which are less expensive than silos for large storage volumes. Other schemes presently being implemented have used more conventional storage silos but these are individually unable to store as much as domes and so more silos are required. This then complicates the conveying arrangements and adds to the dust extraction and fire protection systems resulting in a much more expensive solution overall.

THE FUTURE OF BIOMASS IN THE RENEWABLES PORTFOLIO
14 June 2017
92
PÖYRY MANAGEMENT CONSULTING
3.3.2 Conversion to black pellets
On the basis that one of the main marketing advantages for black pellets is that these can be stored outside and manipulated using the same stacker and reclaim machinery as coal, then the external storage capital costs should be minimal. This would be true provided that the existing station did not rely upon mechanical loading shovels, which would need to be replaced with a stacker/reclaimer in order to avoid greater pellet degradation.
Once the black pellets have been recovered from the stockpile, then the greater dust content would necessitate a similar approach to transferring to the mills, as would be used for white pellets in order to mitigate the fire and explosion risks. On this basis we would expect the conversion costs at Drax for black pellets to be around 81 GBP/kW.
Although, stations currently using black pellets for power generation were also able to reduce additional costs at the boiler island, they operate as peak instead of baseload power producers, which allowed some efficiency sacrifices. In order to be able to assess if those additional savings could be considered for baseload generators, Pöyry would need to perform a detailed trade-off analysis on a station by station level.
3.3.3 Conversion to agri-residue pellets
Although pellets produced from agri-residues (e.g., sugarcane bagasse) could be expected to reach a similar bulk density of white pellets, energy contents are expected to be slightly lower due the feedstock composition. Additionally, a higher ash and alkali content is also expected, which will impact the not only the operation but also the potential cost of conversion.
Pöyry considers that an additional Capex may be required for improved boiler operation and furnace cleaning, particularly in the cases where no specific improvements are already required for firing of white pellets. This would especially apply to cases where coal PFA is used to mitigate against the characteristics of white pellet ash. Although Pöyry would need to perform a detail assessment on a station by station basis, in order to evaluate the additional investments required, a 10% to 20% investment increase at the boiler island and ash system would probably enable to cover the required adjustments to fire pellets lower quality characteristics.
3.3.4 Conversion to wood pellets with a higher content of harvesting residues
Wood pellets produced with higher contents of harvesting residues, are expected to reach a quality specification (i.e., bulk density, energy, ash and alkali content) closer to white pellets produced from pulpwood than from agri-pellets produced from sugarcane bagasse.
These pellets can be expected to require very similar storage and handling equipment to that needed for ‘normal’ white wood pellets. It is possible that the pellet degradation and dust content could be higher and that slightly larger dust control plant may be needed but, within the context of this cost study, no significant changes would be expected to the cost estimates. In this sense Pöyry assumes that conversion costs for these pellets would have a similar cost to the ones considered for white pellets produced mainly from pulpwood.
3.4 Operational costs
3.4.1 Conversion to white wood pellets
The main components of the Opex are operating labour, maintenance costs and absorbed power for the additional drives. From discussions with Drax, the operating labour has not

THE FUTURE OF BIOMASS IN THE RENEWABLES PORTFOLIO
14 June 2017
93
PÖYRY MANAGEMENT CONSULTING
changed significantly in the conversion of Units 1 to 3 from coal to white wood pellets. This would be expected to be the case at the other ‘typical’ stations considered by this study and is explained further below.
The maintenance costs are generally proportional to the extent of plant installed and, with the exception of black pellets, since additional plant is required for white pellets and most other alternative biomass pellets, it might be expected that maintenance costs would rise proportionally with the capital costs. However, experience from Drax has shown that these costs have been offset by no longer needing to use the Flue Gas Desulphurisation (FGD) plant which has reduced related maintenance costs, chemical consumption costs and absorbed power costs. Overall, these changes, together with the negated revenue from no longer producing gypsum, have meant that costs have changed very little from the time when only coal was being burned. At this time, maintenance costs were previously around 8,000 GBP/MW per annum.
At the typical 2000MWe stations where no FGD is fitted and the maintenance costs of the new plant needed for conversion will not be offset, then the increased maintenance costs could be anticipated to be around 2,000 GBP/MW per annum.
In general, the maintenance costs are expected to be slightly higher on lower quality fuels due to the possible greater abrasive particles, PH of the fuel, addition of alkalis and complexity of the system and potential for internal wear. Excessive wear in PF pipework has been reported in cases where excessive transport velocities have been used. However, this would not expected to have a significant impact on the present O&M costs at Drax, or on any other stations that may be converted in future.
Experience with the operation of modified coal VSMs with wood pellets (UK and Europe) has shown slightly reduced mill maintenance costs due to the lower wear rate of mill grinding elements. Mill rejects are generally much reduced (negligible in many cases) which also simplifies the rejects
Hammer mills have been tried on some installations but the O&M costs have been an order of magnitude greater than those for VRMs both due to the additional staff costs and material cost of screen replacements. The work power consumption is also significantly higher. However, for the cost and safety reasons already described, this type of mill would not be preferred.
Within the boiler, the steam demand of any additional soot blowing requirements must be taken into account. Increased furnace cleaning may also result in accelerated tube wear/reduced life.
Mainly driven by the significantly reduced ash volumes for biomass firing, ash handling O&M should be reduced. However, the difficulties associated with handling the ash inevitably require some modifications to the ash plant. As the nature of modifications will vary, and limited operating experience exists, it is difficult to estimate a general impact on O&M costs.
Overall, experience from Drax indicates that very little change in O&M costs are to be expected with respect to plant labour, maintenance, consumables and revenues. At other typical stations where FGD has not been installed, then the maintenance costs associated new plant needed for the conversion would increase the overall O&M costs.
For the stations evaluated under the current analysis, Pöyry expects that annual fixed costs to remain between 53,000 and 59,000 GBP/MW of gross capacity and non-fuel variable costs between 2.4 and 3.7 GBP/MWh of gross generation.

THE FUTURE OF BIOMASS IN THE RENEWABLES PORTFOLIO
14 June 2017
94
PÖYRY MANAGEMENT CONSULTING
3.4.2 Conversion to black pellets
There are currently no stations operating continuously with black pellets and certainly no long term operational experience. In principle, it is expected that the O&M costs would be similar to that for white pellets but without the maintenance costs associated with the storage silos and related conveyors. The cost savings gained from not needing the FGD plant might, therefore, be realised thus gaining an overall O&M saving. This could be of the order of 500 GBP/MW saving at Drax and would be expected to be similar at other 2000MWe stations (NB where FGD has been installed). At the other stations where no FGD has been fitted then it is expected that O&M costs would remain the same overall as when burning coal. In this sense Pöyry would assume similar fixed and non-fuel variable cost ranges as described for white pellet conversion using pulpwood as the main feedstock.
3.4.3 Conversion to agri-residue pellets
The design concept for the fuel storage and handling would be very similar to that for white pellets and so O&M costs can be expected to be similar too. It is likely that the higher abrasion from the lower quality pellets would result in higher maintenance costs and reduced lifetime until more significant replacements became due.
The Opex impact for firing lower quality fuels in the boiler plant will be dependent on the make-up of the particular fuels under consideration. However, it is likely that the resultant ash will cause an increase in erosion and potentially also corrosion – both of which would increase maintenance costs and reduce plant availability. Greater use of soot blowing to manage the increased deposition rate of these fuels will also result in a loss of efficiency.
Despite a detail assessment on a station by station basis would be required to estimate the potential increase on the non-fuel variable costs when using agri-pellets, Pöyry expects that an 20% to 30% would be able to cover the additional costs required to fire pellets with lower quality characteristics.
3.4.4 Conversion to wood pellets with a higher content of harvesting residues
Assuming that white pellet produced mainly from harvesting residues would still have quality characteristics similar to white pellets produced from Pulpwwod, Pöyry would expect lower additional non-fuel variable costs (15% above when firing with pulpwood pellets) when compared to firing agri-residue pellets.

THE FUTURE OF BIOMASS IN THE RENEWABLES PORTFOLIO
14 June 2017
95
PÖYRY MANAGEMENT CONSULTING
[This page is intentionally blank]

THE FUTURE OF BIOMASS IN THE RENEWABLES PORTFOLIO
14 June 2017
96
PÖYRY MANAGEMENT CONSULTING
4. POTENTIAL COST REDUCTIONS IN BIOMASS POWER GENERATION
Based on the supply chain assessment described in section 2.5.3, and combined with the assessment performed on conversion and operational costs for five different power stations, as described in sections 3.3 and 3.4, Pöyry has assessed the expected net power biomass generation cost in order to identify the most attractive supply chain models.
As can be seen in Figure 41, pellet delivered prices into the power stations represent between 81% and 88% of total net power generation costs, while non-fuel operating costs represent between 10% to 16% and conversion capital costs only 2% to 5%. This shows that cost reductions in the biomass supply chain, despite the positive or negative impact this might have on initial capital cost for the conversion or the operating costs in the power station, is likely to provide the largest impact on net power generation costs.
As different power stations have different conversion and operating costs, as well as different efficiencies, a range of net power cost generation costs can be expected, as can be seen in Figure 42. The cost data are based on an assumed 85% availability of the power stations.
Assuming that white wood pellets based on pulpwood as main raw material and produced in the US Southeast under the current pellet deployment scenario (WP 1.0P US83) are being used as fuel, a net power generation cost in the range of 96 to 107 GBP/MWh can be expected. Assuming the improved pellet deployment scenario (WP 2.0P US), the range of net power generation cost is expected to be reduced to 88 to 97 GBP/MWh.
Under the same improved pellet deployment scenario, and still assuming pulpwood as the main raw material for white pellet production, if instead of the US Southeast pellet capacity would be deployed in Brazil (WP 2.0.P BR) or in NW Russia (WP 2.0.P RU), then net generation costs could be lowered to a range of 85 to 94 GBP/MWh and 79 to 87 GBP/MWh, respectively (see Figure 42).
As described in section 2.5.3, raw material prices have a significant impact on the different biomass supply chains. When instead of pulpwood, harvesting residues are being used as the main raw material for white pellet production, further reductions of net power generation costs can be expected. When considering an improved pellet deployment scenario and producing white pellets in the US Southeast (WP 2.0.HR US), net power generation costs could be lowered to levels between 84 GBP/MWh and 93 GBP/MWh. When the same supply chain is shifted towards Brazil (WP 2.0.HR BR) or NW Russia (WP 2.0.HR RU), net generation costs could be expected to reach between 82 GBP/MWh and 90 GBP/MWh, and between 71 GBP/MWh and 78 GBP/MWh, respectively (see Figure 42).
Despite a more detail assessment of the advantages that black pellets could potentially provide in terms on conversion capital cost and non-fuel variable costs across the different stations, the result of the current analysis shows that net power generation costs using black pellets still have a disadvantage to white pellets when other input assumptions are
83 The various scenarios are labelled to provide a concise description, using the following abbreviations: WP - White
Pellets; BP - Black Pellets; AP - Agri-Pellets; 1.0 - Current deployment scenario; 2.0 - Future improved deployment scenario; US - US Southeast; RU - Northwest-Russia; BR - Brazil
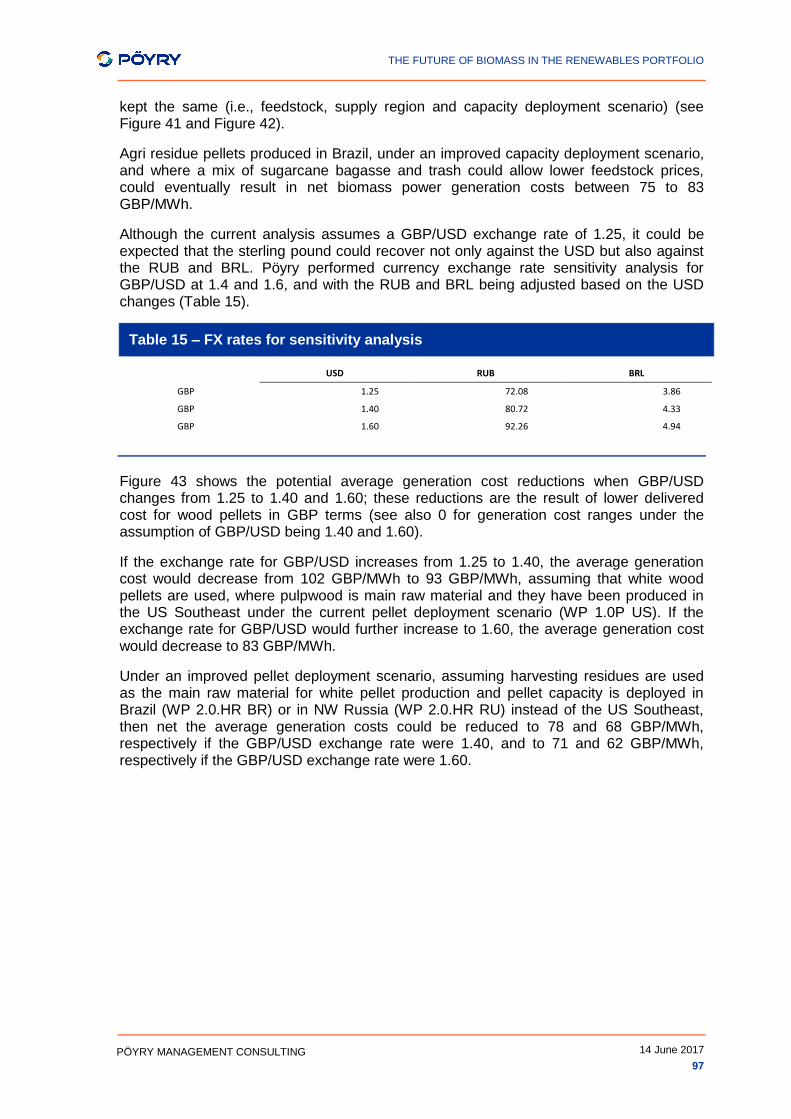
THE FUTURE OF BIOMASS IN THE RENEWABLES PORTFOLIO
14 June 2017
97
PÖYRY MANAGEMENT CONSULTING
kept the same (i.e., feedstock, supply region and capacity deployment scenario) (see Figure 41 and Figure 42).
Agri residue pellets produced in Brazil, under an improved capacity deployment scenario, and where a mix of sugarcane bagasse and trash could allow lower feedstock prices, could eventually result in net biomass power generation costs between 75 to 83 GBP/MWh.
Although the current analysis assumes a GBP/USD exchange rate of 1.25, it could be expected that the sterling pound could recover not only against the USD but also against the RUB and BRL. Pöyry performed currency exchange rate sensitivity analysis for GBP/USD at 1.4 and 1.6, and with the RUB and BRL being adjusted based on the USD changes (Table 15).
Table 15 – FX rates for sensitivity analysis
USD RUB BRL
GBP 1.25 72.08 3.86
GBP 1.40 80.72 4.33
GBP 1.60 92.26 4.94
Figure 43 shows the potential average generation cost reductions when GBP/USD changes from 1.25 to 1.40 and 1.60; these reductions are the result of lower delivered cost for wood pellets in GBP terms (see also 0 for generation cost ranges under the assumption of GBP/USD being 1.40 and 1.60).
If the exchange rate for GBP/USD increases from 1.25 to 1.40, the average generation cost would decrease from 102 GBP/MWh to 93 GBP/MWh, assuming that white wood pellets are used, where pulpwood is main raw material and they have been produced in the US Southeast under the current pellet deployment scenario (WP 1.0P US). If the exchange rate for GBP/USD would further increase to 1.60, the average generation cost would decrease to 83 GBP/MWh.
Under an improved pellet deployment scenario, assuming harvesting residues are used as the main raw material for white pellet production and pellet capacity is deployed in Brazil (WP 2.0.HR BR) or in NW Russia (WP 2.0.HR RU) instead of the US Southeast, then net the average generation costs could be reduced to 78 and 68 GBP/MWh, respectively if the GBP/USD exchange rate were 1.40, and to 71 and 62 GBP/MWh, respectively if the GBP/USD exchange rate were 1.60.

THE FUTURE OF BIOMASS IN THE RENEWABLES PORTFOLIO
14 June 2017
98
PÖYRY MANAGEMENT CONSULTING
Figure 41 – Average net power generation cost for conversion projects using biomass from different supply chains
0
10
20
30
40
50
60
70
80
90
100
110
120W
P 1
.0.P
US
WP
1.0
.P R
U
WP
1.0
.P B
R
WP
1.0
.HR
US
WP
1.0
.HR
RU
WP
1.0
.HR
BR
BP
1.0
.P U
S
BP
1.0
.P R
U
BP
1.0
.P B
R
BP
1.0
.HR
US
BP
1.0
.HR
RU
BP
1.0
.HR
BR
WP
2.0
.P U
S
WP
2.0
.P R
U
WP
2.0
.P B
R
WP
2.0
.HR
US
WP
2.0
.HR
RU
WP
2.0
.HR
BR
BP
2.0
.P U
S
BP
2.0
.P R
U
BP
2.0
.P B
R
BP
2.0
.HR
US
BP
2.0
.HR
RU
BP
2.0
.HR
BR
AP
1.0
.SB
BR
AP
2.0
.SB
BR
GB
P/M
Wh o
f N
et G
enera
tio
n
Conversion costs Non-fuel operating costs Pellet delivered costs

THE FUTURE OF BIOMASS IN THE RENEWABLES PORTFOLIO
14 June 2017
99
PÖYRY MANAGEMENT CONSULTING
Figure 42 – Expected range of net power generation cost for conversion projects using biomass from different supply chains
60
65
70
75
80
85
90
95
100
105
110
115
120
125
WP
1.0
.P U
S
WP
1.0
.P R
U
WP
1.0
.P B
R
WP
1.0
.HR
US
WP
1.0
.HR
RU
WP
1.0
.HR
BR
BP
1.0
.P U
S
BP
1.0
.P R
U
BP
1.0
.P B
R
BP
1.0
.HR
US
BP
1.0
.HR
RU
BP
1.0
.HR
BR
WP
2.0
.P U
S
WP
2.0
.P R
U
WP
2.0
.P B
R
WP
2.0
.HR
US
WP
2.0
.HR
RU
WP
2.0
.HR
BR
BP
2.0
.P U
S
BP
2.0
.P R
U
BP
2.0
.P B
R
BP
2.0
.HR
US
BP
2.0
.HR
RU
BP
2.0
.HR
BR
AP
1.0
.SB
BR
AP
2.0
.SB
BR
GB
P/M
Wh o
n N
et G
enera
tio
n
Generation cost range

THE FUTURE OF BIOMASS IN THE RENEWABLES PORTFOLIO
14 June 2017
100
PÖYRY MANAGEMENT CONSULTING
Figure 43 – Impact of GBP/USD FX rate on expected range of net power generation cost for conversion projects
0
20
40
60
80
100
120W
P 1
.0.P
US
WP
1.0
.P R
U
WP
1.0
.P B
R
WP
1.0
.HR
US
WP
1.0
.HR
RU
WP
1.0
.HR
BR
BP
1.0
.P U
S
BP
1.0
.P R
U
BP
1.0
.P B
R
BP
1.0
.HR
US
BP
1.0
.HR
RU
BP
1.0
.HR
BR
WP
2.0
.P U
S
WP
2.0
.P R
U
WP
2.0
.P B
R
WP
2.0
.HR
US
WP
2.0
.HR
RU
WP
2.0
.HR
BR
BP
2.0
.P U
S
BP
2.0
.P R
U
BP
2.0
.P B
R
BP
2.0
.HR
US
BP
2.0
.HR
RU
BP
2.0
.HR
BR
AP
1.0
.SB
BR
AP
2.0
.SB
BR
GB
P/M
Wh
1.25 GBP/USD 1.40 GBP/USD 1.60 GBP/USD

THE FUTURE OF BIOMASS IN THE RENEWABLES PORTFOLIO
14 June 2017
101
PÖYRY MANAGEMENT CONSULTING
[This page is intentionally blank]

THE FUTURE OF BIOMASS IN THE RENEWABLES PORTFOLIO
14 June 2017
102
PÖYRY MANAGEMENT CONSULTING
ANNEX A – SCENARIO DATA
Table 16 – National Grid 2030 future energy scenarios: capacity, generation and our assumptions on reliability and whether low carbon
Source: National Grid
Table 17 – CCC 5th Carbon Budget scenarios: capacity, generation and our assumptions on reliability and whether low carbon
Source: CCC
Assumed to
be reliable
Assumed to
be low
carbon Gone green
Slow
progression
Consumer
power Gone green
Slow
progression
Consumer
power
Biomass Yes Yes 4 3 1 12 13 4
CCS Yes Yes 2 - - 9 0 0
CHP Yes No 5 5 7 26 24 34
Gas Yes No 24 28 28 27 32 22
Coal Yes No - - - 0 0 0
Hydro Yes Yes 2 2 2 6 5 6
Interconnectors Yes No 23 15 23 52 67 90
Marine Yes Yes 3 1 1 5 2 1
Nuclear Yes Yes 10 6 7 61 34 35
Offshore wind No Yes 29 22 22 111 83 74
Onshore wind No Yes 18 16 15 34 33 24
Solar No Yes 31 24 34 31 26 35
Other thermal Yes No 2 3 3 0 0 0
Other renewable Yes Yes 3 3 4 20 15 23
Total assumed reliable 79 65 76 218 192 216
Total 157 127 147 394 334 349
Capacity (GW) Generation (GW)
Assumed
to be
reliable
Assumed
to be low
carbon
High
nuclear
High
renewables
High
CCS
Low
demand
High
nuclear
High
renewables
High
CCS
Low
demand
Nuclear Yes Yes 11 6 8 8 84 47 63 63
Onshore wind No Yes 20 22 20 17 47 52 47 40
Offshore wind No Yes 20 25 20 20 72 91 72 72
Carbon capture & Storage Yes Yes 4 4 7 7 27 27 48 48
Solar No Yes 20 40 20 15 17 34 17 13
Tidal Yes Yes 1 1 1 1 2 2 2 2
Biomass Yes Yes 3 3 3 3 24 24 24 24
Hydro Yes Yes 2 2 2 2 5 5 5 5
Gas CCGT Yes No Not given Not given Not given Not given 99 97 100 73
Gas OCGT Yes No Not given Not given Not given Not given 1 1 1 1
Total assumed reliable 242 203 242 216
Total 379 379 379 341
Capacity (GW) Generation (TWh)

THE FUTURE OF BIOMASS IN THE RENEWABLES PORTFOLIO
14 June 2017
103
PÖYRY MANAGEMENT CONSULTING
[This page is intentionally blank]

THE FUTURE OF BIOMASS IN THE RENEWABLES PORTFOLIO
14 June 2017
104
PÖYRY MANAGEMENT CONSULTING
ANNEX B – FX RATE SENSITIVITY ANALYSIS
[Table on next page]

THE FUTURE OF BIOMASS IN THE RENEWABLES PORTFOLIO
14 June 2017
105
PÖYRY MANAGEMENT CONSULTING
Figure 44 – Expected range of net power generation cost when GBP/USD increases from 1.25 to 1.40
Note: the orange bar represents the generation cos range, assuming wood pellets being imported from US Southeast, and a FX rate of 1.25 GBP/USD.
50
55
60
65
70
75
80
85
90
95
100
105
110
115
120
125W
P 1
.0.P
US
WP
1.0
.P R
U
WP
1.0
.P B
R
WP
1.0
.HR
US
WP
1.0
.HR
RU
WP
1.0
.HR
BR
BP
1.0
.P U
S
BP
1.0
.P R
U
BP
1.0
.P B
R
BP
1.0
.HR
US
BP
1.0
.HR
RU
BP
1.0
.HR
BR
WP
2.0
.P U
S
WP
2.0
.P R
U
WP
2.0
.P B
R
WP
2.0
.HR
US
WP
2.0
.HR
RU
WP
2.0
.HR
BR
BP
2.0
.P U
S
BP
2.0
.P R
U
BP
2.0
.P B
R
BP
2.0
.HR
US
BP
2.0
.HR
RU
BP
2.0
.HR
BR
AP
1.0
.SB
BR
AP
2.0
.SB
BR
GB
P/M
Wh
Generation cost range

THE FUTURE OF BIOMASS IN THE RENEWABLES PORTFOLIO
14 June 2017
106
PÖYRY MANAGEMENT CONSULTING
Figure 45 – Expected range of net power generation cost when GBP/USD increases from 1.25 to 1.60
Note: the orange bar represents the generation cos range, assuming wood pellets being imported from US Southeast, and a FX rate of 1.25 GBP/USD.
50
55
60
65
70
75
80
85
90
95
100
105
110
115
120
125W
P 1
.0.P
US
WP
1.0
.P R
U
WP
1.0
.P B
R
WP
1.0
.HR
US
WP
1.0
.HR
RU
WP
1.0
.HR
BR
BP
1.0
.P U
S
BP
1.0
.P R
U
BP
1.0
.P B
R
BP
1.0
.HR
US
BP
1.0
.HR
RU
BP
1.0
.HR
BR
WP
2.0
.P U
S
WP
2.0
.P R
U
WP
2.0
.P B
R
WP
2.0
.HR
US
WP
2.0
.HR
RU
WP
2.0
.HR
BR
BP
2.0
.P U
S
BP
2.0
.P R
U
BP
2.0
.P B
R
BP
2.0
.HR
US
BP
2.0
.HR
RU
BP
2.0
.HR
BR
AP
1.0
.SB
BR
AP
2.0
.SB
BR
GB
P/M
Wh
Generation cost range

Pöyry is an international consulting and engineering company.
We deliver smart solutions across power generation, transmission & distribution, forest industry, chemicals & biorefining, mining & metals, transportation and water.
Pöyry's net sales in 2016 were EUR 530 million. The company's shares are quoted on Nasdaq Helsinki (POY1V). Approximately 5,500 experts. 40 countries. 130 offices.
Pöyry Management Consulting provides leading-edge consulting and advisory services covering the whole value chain in energy, forest and other process industries. Our energy practice is the leading provider of strategic, commercial, regulatory and policy advice to Europe's energy markets. Our energy team of 200 specialists, located across 12 European offices in 10 countries, offers unparalleled expertise in the rapidly changing energy sector.
Pöyry Management Consulting Portland House Tel: +44 (0) 20 7932 8200 Bressenden Place Fax: +44 (0) 20 7932 8270 London, SW1E 5BH www.poyry.co.uk
UK
ww
w.p
oy
ry.c
om