The FTSe 100 and Their penSion diScloSureS JLT EB FTSE 100... · greater than their equity ... A...
12
THE FTSE 100 AND THEIR PENSION DISCLOSURES A quarterly report from JLT Employee Benefits as at 30 June 2014 In association with
Transcript of The FTSe 100 and Their penSion diScloSureS JLT EB FTSE 100... · greater than their equity ... A...

The FTSe 100 and Their penSion diScloSureSa quarterly report from JlT employee Benefits as at 30 June 2014
In association with

2
execuTive Summary• The total deficit in FTSE 100
pension schemes at 30 June 2014 is estimated to be £60 billion. This is an improvement of £20 billion from the position 12 months ago.
• Only 58 FTSE 100 companies are still providing more than a handful of current employees with DB benefits (i.e. ignoring companies who are incurring ongoing DB service costs of less than 1% of total payroll). Of these, only 23 companies (i.e. less than a quarter of the FTSE 100) are still providing DB benefits to a significant number of employees (defined as incurring ongoing DB service cost of more than 5% of total payroll).
• The average pension scheme asset allocation to bonds has very slightly decreased from 56% to 55%. Six years ago, the average bond allocation was only 40%.
• There continues to be significant funding of pension deficits – and this at a time when most companies have precious little spare cash. Last year saw total deficit funding of £7.7 billion, down from £8.8 billion the previous year. HSBC led the way with a deficit contribution of £0.5 billion (net of ongoing costs), but 61 other FTSE 100 companies also reported significant deficit funding contributions in their most recent annual report and accounts.
• The decline in ongoing DB pensions continues. We estimate that after allowing for the impact of changes in assumptions and market conditions, the underlying reduction in ongoing DB pension provision is approximately 7% in the last 12 months.
• There are a number of companies reporting very significant individual changes to investment strategies. Seven FTSE 100 companies changed their bond allocations by more than 10%.
• There are a significant number of FTSE 100 companies where the pension scheme represents a material risk to the business. Seven FTSE 100 companies have total disclosed pension liabilities greater than their equity market value. For International Airlines Group, total disclosed pension liabilities are almost three times their equity market value, and BAE Systems, BT and Royal Bank of Scotland have disclosed pension liabilities that are approximately double their equity market value.
• Only 19 companies disclosed a pension surplus in their most recent annual report and accounts; 67 companies disclosed pension deficits.
• In the last 12 months, the total disclosed pension liabilities of the FTSE 100 companies have risen from £533 billion to £577 billion. A total of 15 companies have disclosed pension liabilities of more than £10 billion, the largest of which is Royal Dutch Shell with disclosed pension liabilities of £54 billion. A total of 19 companies have disclosed pension liabilities of less than £100 million, of which 13 companies have no defined benefit pension liabilities.
• If pension liabilities were measured on a “risk-free” basis rather than using a AA bond discount rate, the total disclosed pension liabilities of the FTSE 100 would increase from £577 billion to £645 billion, and the total deficit at 30 June 2014 would be around £135 billion.
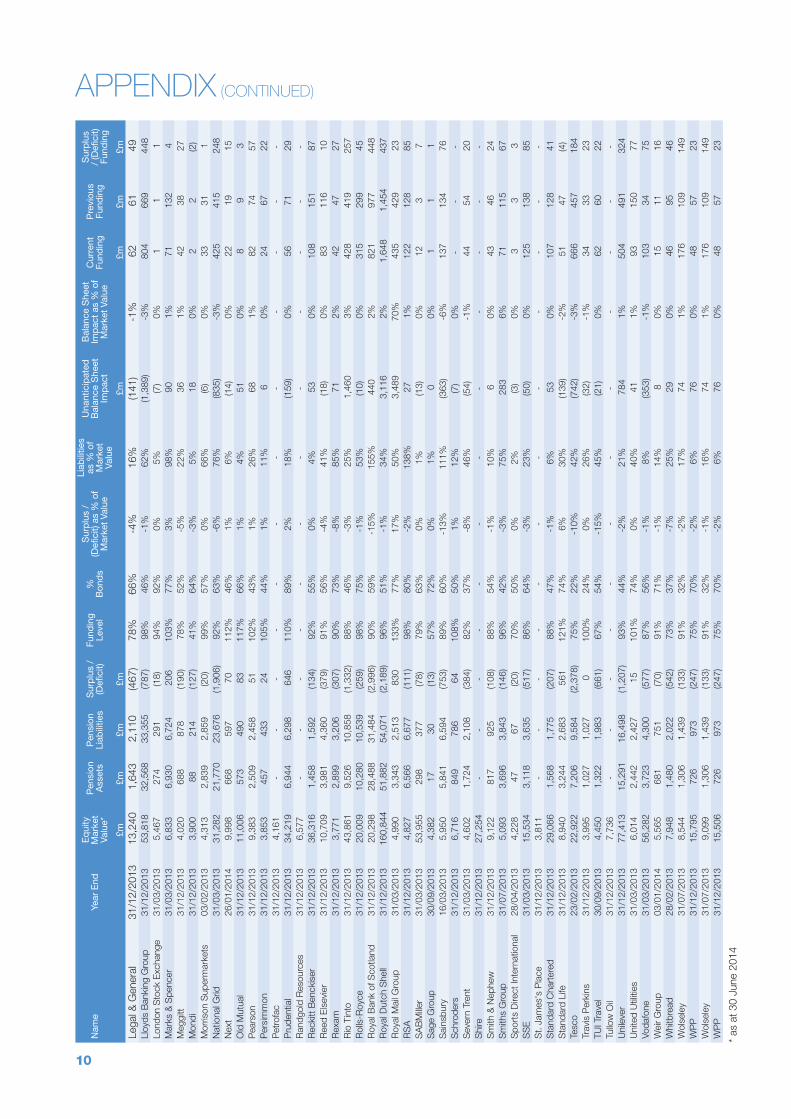
The appendix at the end of this report contains a full list of all the FTSE 100 companies analysed and their relevant pension disclosures.
J.P.Morgan Cazenove is a marketing name for the UK investment banking businesses [and EMEA cash equities and equity research businesses] of J.P.Morgan Chase & Co. and its subsidiaries. J.P.Morgan provides corporate and institutional clients with a wide range of services from sales and research to corporate broking and fi nancial advice.
In the UK, J.P.Morgan Cazenove is corporate broker to more companies in the FTSE 100 and FTSE 250 than any other bank.
J.P.Morgan Cazenove equity research covers approximately 950 stocks across 40 sectors in Europe. Our stock coverage is complemented by a diverse set of strategy teams, including equity, derivatives, small and mid-caps, quant, accounting and valuation, investment companies, and pensions. J.P.Morgan Cazenove’s European research team holds top-fi ve positions across all industry sectors in Institutional Investor’s 2013 surveys.
www.jpmorgancazenove.com
Published in association with
Charles CowlingJLT Employee Benefi ts+44 (0) 161 242 [email protected]
Murray WrightJLT Employee Benefi ts+44 (0) 131 456 6868 [email protected]
3
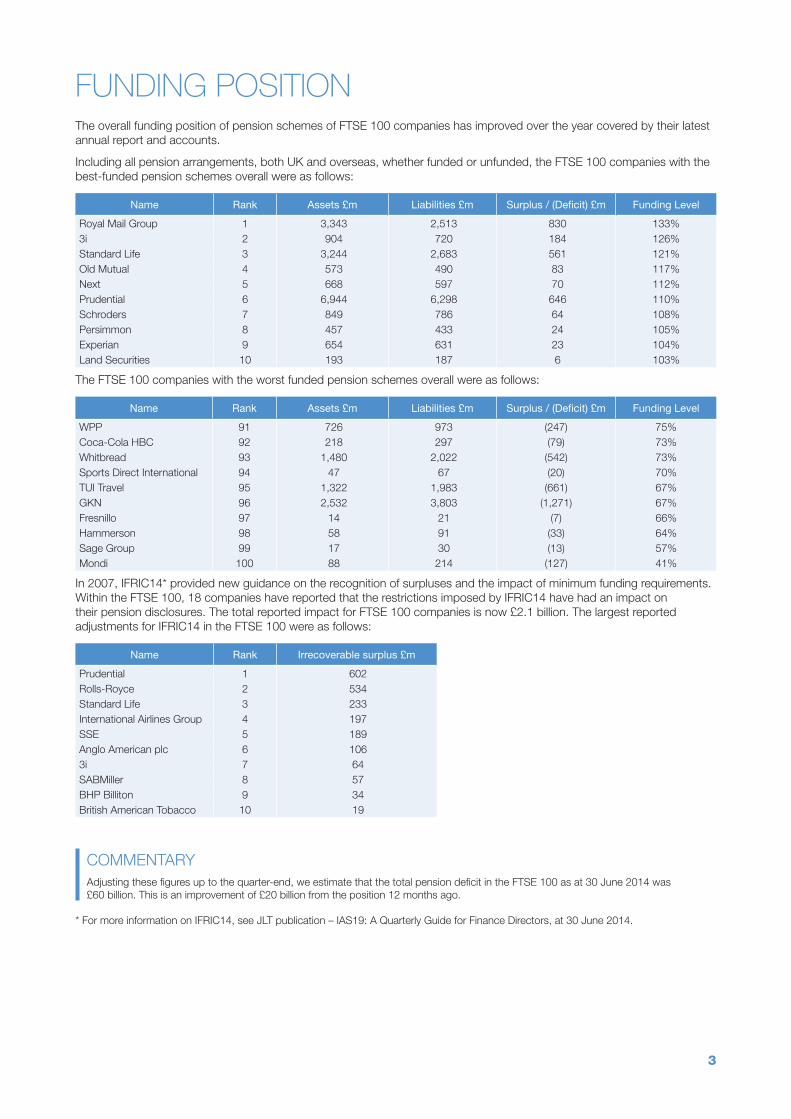
Funding poSiTionThe overall funding position of pension schemes of FTSE 100 companies has improved over the year covered by their latest annual report and accounts.
Including all pension arrangements, both UK and overseas, whether funded or unfunded, the FTSE 100 companies with the best-funded pension schemes overall were as follows:
Name Rank Assets £m Liabilities £m Surplus / (Deficit) £m Funding Level
Royal Mail Group 1 3,343 2,513 830 133%3i 2 904 720 184 126%Standard Life 3 3,244 2,683 561 121%Old Mutual 4 573 490 83 117%Next 5 668 597 70 112%Prudential 6 6,944 6,298 646 110%Schroders 7 849 786 64 108%Persimmon 8 457 433 24 105%Experian 9 654 631 23 104%Land Securities 10 193 187 6 103%
The FTSE 100 companies with the worst funded pension schemes overall were as follows:
Name Rank Assets £m Liabilities £m Surplus / (Deficit) £m Funding Level
WPP 91 726 973 (247) 75%Coca-Cola HBC 92 218 297 (79) 73%Whitbread 93 1,480 2,022 (542) 73%Sports Direct International 94 47 67 (20) 70%TUI Travel 95 1,322 1,983 (661) 67%GKN 96 2,532 3,803 (1,271) 67%Fresnillo 97 14 21 (7) 66%Hammerson 98 58 91 (33) 64%Sage Group 99 17 30 (13) 57%Mondi 100 88 214 (127) 41%
In 2007, IFRIC14* provided new guidance on the recognition of surpluses and the impact of minimum funding requirements. Within the FTSE 100, 18 companies have reported that the restrictions imposed by IFRIC14 have had an impact on their pension disclosures. The total reported impact for FTSE 100 companies is now £2.1 billion. The largest reported adjustments for IFRIC14 in the FTSE 100 were as follows:
Name Rank Irrecoverable surplus £m
Prudential 1 602 Rolls-Royce 2 534 Standard Life 3 233 International Airlines Group 4 197 SSE 5 189 Anglo American plc 6 106 3i 7 64 SABMiller 8 57 BHP Billiton 9 34 British American Tobacco 10 19
COMMENTARyAdjusting these figures up to the quarter-end, we estimate that the total pension deficit in the FTSE 100 as at 30 June 2014 was £60 billion. This is an improvement of £20 billion from the position 12 months ago.
* For more information on IFRIC14, see JLT publication – IAS19: A Quarterly Guide for Finance Directors, at 30 June 2014.

4
inveSTmenT miSmaTchingLegislation over a number of years has clarified that pension liabilities are a form of corporate debt. Despite the fact that there is an increasing weight of opinion from academics and analysts that mismatched investment strategies in pension schemes reduce shareholder value, many companies are still running very large mismatched equity positions in their pension schemes. This has the impact of creating balance sheet volatility which some academic evidence might suggest flows through to share price volatility. Inevitably, analysis of mismatching is limited to the information disclosed in the annual report and accounts. Given the bond-like nature of pension liabilities, the allocation of pension assets to bonds gives an indication of the level of investment mismatching that exists. This report refers to investment mismatching in terms of the IAS19 accounting position, where liabilities are being valued using AA corporate bonds; therefore assets other than these bonds will lead to a mismatch. The FTSE 100 companies with the highest allocation to bonds were:
Name Rank Assets £m % of Assets in Bonds
InterContinental Hotels 1 449 95%London Stock Exchange 2 274 92%Prudential 3 6,944 89%Friends Life Group Limited 4 1,410 85%BHP Billiton 5 1,248 85%Aviva plc 6 12,398 83%RSA 7 6,566 80%HSBC 8 24,637 78%Marks & Spencer 9 6,930 77%Royal Mail Group 10 3,343 77%
The FTSE 100 companies with the lowest allocation to bonds were:
Name Rank Assets £m % of Assets in Bonds
Severn Trent 91 1,724 37%Capita 92 848 37%Whitbread 93 1,480 37%Ashtead 94 78 33%Wolseley 95 1,306 32%BP 96 26,159 28%Travis Perkins 97 1,027 24%Tesco 98 7,206 22%British Land 99 120 2%Hammerson 100 58 0%
The FTSE 100 companies with the greatest change in bond allocation were:
Name Rank Current Bond Allocation Previous Bond Allocation Switch to Bonds
BG 1 39% 17% +22%Babcock International 2 74% 53% +21%Capita 3 37% 20% +17%Vodafone 4 56% 40% +16%London Stock Exchange 5 92% 76% +16%InterContinental Hotels 6 95% 81% +14%Bunzl 7 56% 45% +12%Fresnillo 8 77% 86% -10%Glencore 9 54% 64% -9%G4S 10 73% 82% -9%
COMMENTARy
Several companies and trustees are continuing to switch pension assets out of equities into bonds. BG is the latest company to report a big switch, with bond allocations increasing by 22%. A total of 59 FTSE 100 companies have more than 50% of pension scheme assets in bonds. Moreover, company disclosures reveal little of the extensive activity there has been by a number of companies to use LDI (liability-driven investment) strategies, which frequently make use of derivatives and other financial instruments. Recent changes to IAS19 require companies to disclose more detailed information on pension assets which will help investors to understand the risks which employers are exposed to. Overall though, the average pension scheme asset allocation to bonds is now 55%, which has reduced from 56% the year before. This compares to 40% six years ago.
We can also expect IFRIC14 to impact on pension scheme investment strategies. If shareholders see none of the upside of pension scheme investment in equities and all of the downside, there will inevitably be further pressure on company management to encourage moves towards lower volatility investments in pension schemes. In addition, a further cause of movement towards bond-based assets could be the recent change to IAS19. In the P&L the expected return on assets will be replaced by the discount rate applied to the assets, so there will be no P&L benefit from holding outperforming assets.

5
Size oF penSion SchemeIn recent years, pension schemes have grown significantly. Attempts by many companies to stem the growth of their pension liabilities by closing defined benefit pension schemes to new entrants have had little impact. Changes in economic conditions and increasing life expectancy have contributed to the spiralling growth in pension liabilities.
The FTSE 100 companies with the largest pension scheme liabilities (all those over £10 billion) are as follows:
Name Rank Total Pension Liabilities £m Equity Market Value* £m
Royal Dutch Shell 1 54,071 160,844 BT 2 47,422 29,562 Lloyds Banking Group 3 33,355 53,818 Royal Bank of Scotland 4 31,484 20,298 BP 5 31,255 95,436 Barclays 6 27,568 26,119 BAE Systems 7 25,943 13,628 HSBC 8 24,561 111,810 National Grid 9 23,676 31,282 International Airlines Group 10 18,775 6,824 Unilever 11 16,498 77,413 GlaxoSmithKline 12 15,838 74,220 Aviva plc 13 12,159 14,896 Rio Tinto 14 10,858 43,861 Rolls-Royce 15 10,539 20,009
* as at 30 June 2014
The FTSE 100 companies with the smallest pension liabilities (all those under £100 million) are as follows:
Name Rank Total Pension Liabilities £m Equity Market Value* £m
Hammerson 82 91 4,134 Aggreko 83 84 4,226 Ashtead 84 77 4,404 Sports Direct International 85 67 4,228 Sage Group 86 30 4,382 Fresnillo 87 21 6,598 Coca-Cola HBC 89 4 6,458
* as at 30 June 2014
In addition, Admiral, Antofagasta, ARM Holdings, BSkyB, Burberry, Easyjet, Hargreaves Lansdown, Intu Properties, Petrofac, Randgold Resources, Shire, St. James’s Palace and Tullow Oil all reported no defined benefit pension liabilities.
COMMENTARy
In the last 12 months, the total disclosed pension liabilities of the FTSE 100 companies have risen from £533 billion to £577 billion. A total of 15 companies have disclosed pension liabilities of more than £10 billion, whilst 19 companies have disclosed pension liabilities of less than £100 million.
The possibility of measuring pension liabilities on a “risk-free” basis (i.e. using gilt-based discount rates rather than AA bond discount rates) has been debated at length, including in a detailed discussion paper from the Accounting Standards Board. In the UK, a company can no longer default on its promises to pension scheme members unless it goes into liquidation; however, last year the government changed the index linkage for many inflation-linked benefits which has had the effect of reducing the expected benefit outgo. If pension liabilities were to be measured on a “risk-free” basis, with no allowance for default or further reduction in benefits, we estimate that it would add approximately 18% to the total pension liabilities, increasing the total disclosed pension liabilities from £577 billion to £645 billion. The total deficit at 30 June 2014 on a “risk-free” basis would be around £135 billion.
6
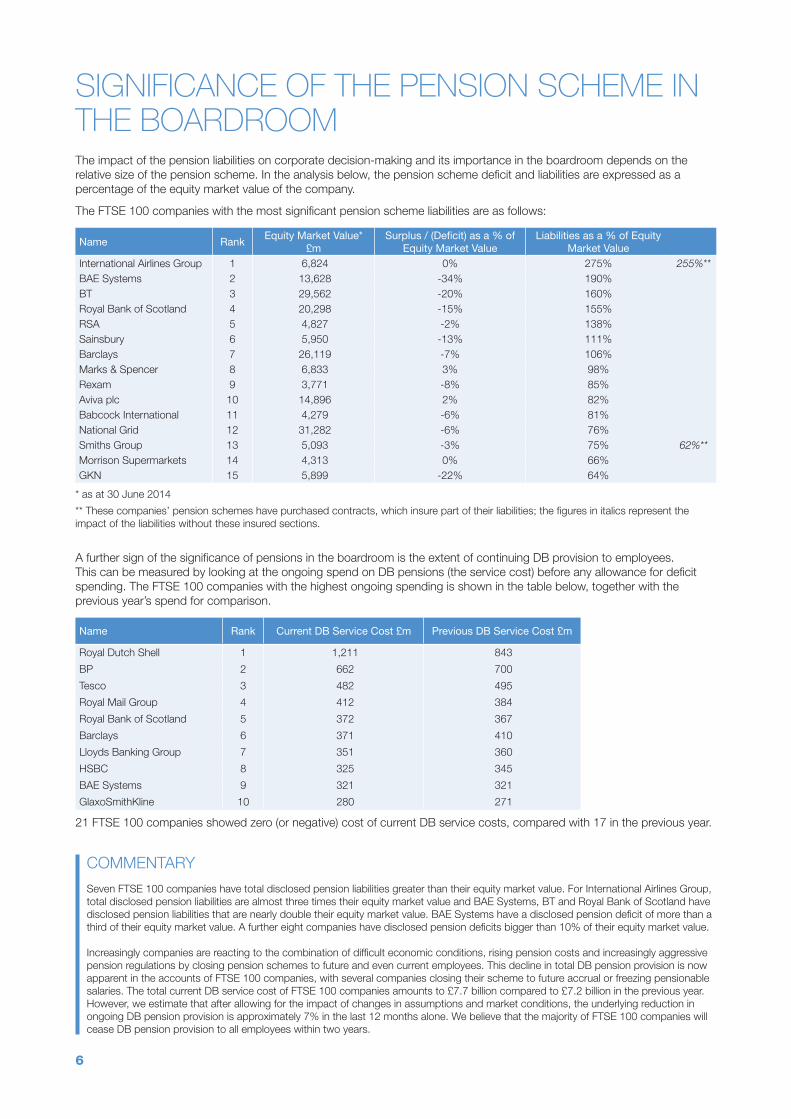
SigniFicance oF The penSion Scheme in The Boardroom The impact of the pension liabilities on corporate decision-making and its importance in the boardroom depends on the relative size of the pension scheme. In the analysis below, the pension scheme deficit and liabilities are expressed as a percentage of the equity market value of the company.
The FTSE 100 companies with the most significant pension scheme liabilities are as follows:
Name RankEquity Market Value*
£mSurplus / (Deficit) as a % of
Equity Market ValueLiabilities as a % of Equity
Market Value
International Airlines Group 1 6,824 0% 275% 255%**BAE Systems 2 13,628 -34% 190% BT 3 29,562 -20% 160% Royal Bank of Scotland 4 20,298 -15% 155% RSA 5 4,827 -2% 138% Sainsbury 6 5,950 -13% 111% Barclays 7 26,119 -7% 106% Marks & Spencer 8 6,833 3% 98% Rexam 9 3,771 -8% 85% Aviva plc 10 14,896 2% 82% Babcock International 11 4,279 -6% 81% National Grid 12 31,282 -6% 76% Smiths Group 13 5,093 -3% 75% 62%**Morrison Supermarkets 14 4,313 0% 66% GKN 15 5,899 -22% 64%
* as at 30 June 2014
** These companies’ pension schemes have purchased contracts, which insure part of their liabilities; the figures in italics represent the impact of the liabilities without these insured sections.
A further sign of the significance of pensions in the boardroom is the extent of continuing DB provision to employees. This can be measured by looking at the ongoing spend on DB pensions (the service cost) before any allowance for deficit spending. The FTSE 100 companies with the highest ongoing spending is shown in the table below, together with the previous year’s spend for comparison.
Name Rank Current DB Service Cost £m Previous DB Service Cost £m
Royal Dutch Shell 1 1,211 843
BP 2 662 700
Tesco 3 482 495
Royal Mail Group 4 412 384
Royal Bank of Scotland 5 372 367
Barclays 6 371 410
Lloyds Banking Group 7 351 360
HSBC 8 325 345
BAE Systems 9 321 321
GlaxoSmithKline 10 280 271
21 FTSE 100 companies showed zero (or negative) cost of current DB service costs, compared with 17 in the previous year.
COMMENTARy
Seven FTSE 100 companies have total disclosed pension liabilities greater than their equity market value. For International Airlines Group, total disclosed pension liabilities are almost three times their equity market value and BAE Systems, BT and Royal Bank of Scotland have disclosed pension liabilities that are nearly double their equity market value. BAE Systems have a disclosed pension deficit of more than a third of their equity market value. A further eight companies have disclosed pension deficits bigger than 10% of their equity market value.
Increasingly companies are reacting to the combination of difficult economic conditions, rising pension costs and increasingly aggressive pension regulations by closing pension schemes to future and even current employees. This decline in total DB pension provision is now apparent in the accounts of FTSE 100 companies, with several companies closing their scheme to future accrual or freezing pensionable salaries. The total current DB service cost of FTSE 100 companies amounts to £7.7 billion compared to £7.2 billion in the previous year. However, we estimate that after allowing for the impact of changes in assumptions and market conditions, the underlying reduction in ongoing DB pension provision is approximately 7% in the last 12 months alone. We believe that the majority of FTSE 100 companies will cease DB pension provision to all employees within two years.

7
impacT oF The penSion Scheme on The company’S Share priceAs already mentioned, there is some evidence that balance sheet volatility caused by pension schemes flows through to share price volatility. Changes in the balance sheet position resulting from pensions can be separated into expected changes and unexpected changes. Expected balance sheet changes arise largely from the contributions paid by the company and the costs shown in the company’s income statement. Unexpected balance sheet changes arise largely from actuarial gains and losses (due to stock market volatility) and changes to actuarial assumptions.
In the analysis below, the unexpected change in balance sheet position (net of change in adjustment for IFRC 14) is expressed as a percentage of the equity market value of the company. We are not suggesting that the balance sheet impact will translate into a £ for £ impact on a company’s share price (not least because of the impact of deferred tax), but this analysis gives a good indication of those companies most positively (and negatively) affected by their pension schemes in their last financial year.
The FTSE 100 companies most positively affected by their pension schemes were:
Name Rank Equity Market Value* £mUnanticipated Balance
Sheet Gain £mImpact as a % of Equity
Market Value
Royal Mail Group 1 4,990 3,489 70%BAE Systems 2 13,628 945 7%Smiths Group 3 5,093 283 6%BP 4 95,436 3,489 4%Rio Tinto 5 43,861 1,460 3%Royal Bank of Scotland 6 20,298 440 2%Royal Dutch Shell 7 160,844 3,116 2%Rexam 8 3,771 71 2%Marks & Spencer 9 6,833 90 1%Unilever 10 77,413 784 1%
* as at 30 June 2014
The FTSE 100 companies most negatively affected by their pension schemes were:
Name Rank Equity Market Value* £mUnanticipated Balance
Sheet Gain £mImpact as a % of Equity
Market Value
G4S 91 3,960 (78) -2%Barclays 92 26,119 (530) -2%InterContinental Hotels 93 5,630 (122) -2%Lloyds Banking Group 94 53,818 (1,389) -3%National Grid 95 31,282 (835) -3%Tesco 96 22,922 (742) -3%GKN 97 5,899 (252) -4%Aviva plc 98 14,896 (696) -5%Sainsbury 99 5,950 (363) -6%BT 100 29,562 (3,756) -13%
* as at 30 June 2014
COMMENTARy
Over the year covered by their latest report and accounts, 41 companies felt the benefit of an unexpected gain to their balance sheet as a result of their pension schemes, whilst 46 companies suffered an unexpected loss to their balance sheet as a result of their pension schemes.
The impact of the transfer of the majority of the Royal Mail Pension Plan’s assets and liabilities to the Government provided the Royal Mail Group with an unanticipated balance sheet gain of over £3bn.
8
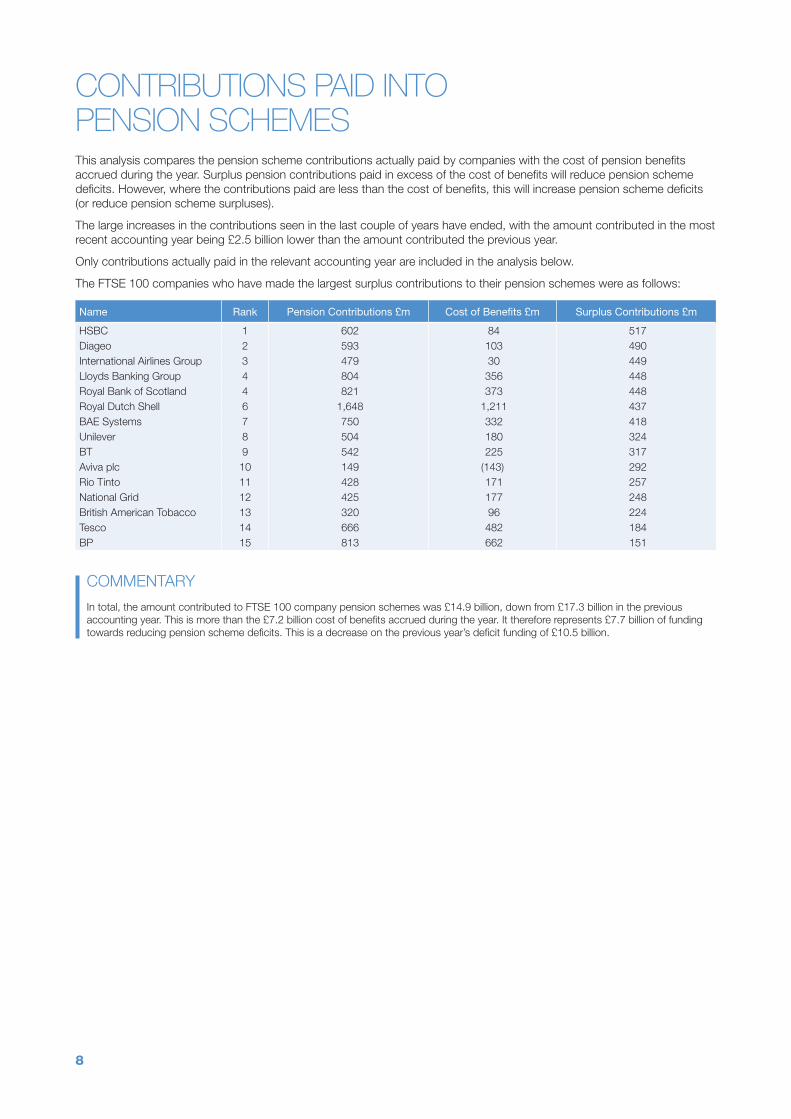
conTriBuTionS paid inTo penSion SchemeSThis analysis compares the pension scheme contributions actually paid by companies with the cost of pension benefits accrued during the year. Surplus pension contributions paid in excess of the cost of benefits will reduce pension scheme deficits. However, where the contributions paid are less than the cost of benefits, this will increase pension scheme deficits (or reduce pension scheme surpluses).
The large increases in the contributions seen in the last couple of years have ended, with the amount contributed in the most recent accounting year being £2.5 billion lower than the amount contributed the previous year.
Only contributions actually paid in the relevant accounting year are included in the analysis below.
The FTSE 100 companies who have made the largest surplus contributions to their pension schemes were as follows:
Name Rank Pension Contributions £m Cost of Benefits £m Surplus Contributions £m
HSBC 1 602 84 517 Diageo 2 593 103 490 International Airlines Group 3 479 30 449 Lloyds Banking Group 4 804 356 448 Royal Bank of Scotland 4 821 373 448 Royal Dutch Shell 6 1,648 1,211 437 BAE Systems 7 750 332 418 Unilever 8 504 180 324 BT 9 542 225 317 Aviva plc 10 149 (143) 292 Rio Tinto 11 428 171 257 National Grid 12 425 177 248 British American Tobacco 13 320 96 224 Tesco 14 666 482 184 BP 15 813 662 151
COMMENTARy
In total, the amount contributed to FTSE 100 company pension schemes was £14.9 billion, down from £17.3 billion in the previous accounting year. This is more than the £7.2 billion cost of benefits accrued during the year. It therefore represents £7.7 billion of funding towards reducing pension scheme deficits. This is a decrease on the previous year’s deficit funding of £10.5 billion.

9
Nam
eYe
ar E
ndE
qui
ty
Mar
ket
Valu
e*
Pen
sion
A
sset
sP
ensi
on
Liab
ilitie
sS
urp
lus
/ (D
efici
t)Fu
ndin
g Le
vel
% B
ond
sS
urp
lus
/ (D
efici
t) as
% o
f Mar
ket
Valu
e
Liab
ilitie
s as
%
of M
arke
t Va
lue
Una
ntic
ipat
ed
Bal
ance
She
et
Imp
act
Bal
ance
She
et
Imp
act
as %
of
Mar
ket
Valu
e
Cur
rent
Fu
ndin
gP
revi
ous
Fund
ing
Sur
plu
s /
(Defi
cit)
Fund
ing
£m£m
£m£m
£m£m
£m£m
3i31
/03/
2013
3,9
03
904
7
20
184
12
6%65
%5%
18%
20
1% 3
7 7
2 3
7 A
berd
een
Ass
et M
anag
emen
t30
/09/
2013
5,8
41
176
1
78
(2)
99%
64%
0%3%
(12)
0% 2
2 1
0 2
2 A
dmira
l31
/12/
2013
4,2
03
- -
- -
--
--
--
- -
Agg
reko
31/1
2/20
13 4
,226
7
8 8
4 (6
)93
%54
%0%
2%(5
)0%
5
6
3
Ang
lo A
mer
ican
plc
31/1
2/20
13 2
0,09
8 3
,189
3
,404
(2
15)
94%
67%
-1%
17%
(77)
0% 9
7 5
7 8
2 A
ntof
agas
ta p
lc31
/12/
2013
7,5
22
- -
- -
--
--
--
- -
AR
M H
oldi
ngs
31/1
2/20
13 1
2,12
2 -
- -
--
--
- -
- -
- A
shte
ad30
/04/
2013
4,4
04
78
77
0
101%
33%
0%2%
(5)
0% 2
3
1
A
ssoc
iate
d B
ritis
h Fo
ods
14/0
9/20
13 2
4,14
8 3
,233
3
,265
(3
2)99
%56
%0%
14%
23
0% 6
9 7
1 2
7 A
stra
Zene
ca31
/12/
2013
53,
291
6,0
33
7,3
92
(1,3
60)
82%
63%
-3%
14%
(49)
0% 2
36
534
1
06
Avi
va p
lc31
/12/
2013
14,
896
12,
398
12,
159
239
10
2%83
%2%
82%
(696
)-5
% 1
49
250
2
92
Bab
cock
Inte
rnat
iona
l31
/03/
2013
4,2
79
3,2
05
3,4
66
(261
)92
%74
%-6
%81
%(6
8)-2
% 7
8 8
4 3
3 B
AE
Sys
tem
s31
/12/
2013
13,
628
21,
374
25,
943
(4,5
69)
82%
45%
-34%
190%
945
7%
750
1
,256
4
18
Bar
clay
s31
/12/
2013
26,
119
25,
743
27,
568
(1,8
25)
93%
71%
-7%
106%
(530
)-2
% 3
64
898
(1
1)B
arra
tt D
evel
opm
ents
30/0
6/20
13 3
,645
2
95
308
(1
3)96
%53
%0%
8%(5
)0%
13
13
13
BG
31/1
2/20
13 4
1,95
1 1
,169
1
,271
(1
02)
92%
39%
0%3%
62
0% 6
1 6
5 2
1 B
HP
Billi
ton
30/0
6/20
13 3
9,90
8 1
,248
1
,288
(4
0)97
%85
%0%
3% 5
5 0%
122
1
08
81
BP
31/1
2/20
13 9
5,43
6 2
6,15
9 3
1,25
5 (5
,096
)84
%28
%-5
%33
% 3
,489
4%
813
8
05
151
B
ritis
h A
mer
ican
Tob
acco
31/1
2/20
13 6
4,91
6 5
,767
6
,144
(3
77)
94%
49%
-1%
9% 2
93
0% 3
20
270
2
24
Brit
ish
Land
31/0
3/20
13 8
,960
1
20
119
1
10
1%2%
0%1%
(4)
0% 4
3
2
B
Sky
B30
/06/
2013
14,
271
- -
- -
--
--
--
- -
BT
31/0
3/20
13 2
9,56
2 4
1,56
6 4
7,42
2 (5
,856
)88
%43
%-2
0%16
0%(3
,756
)-1
3% 5
42
2,1
79
317
B
unzl
31/1
2/20
13 5
,373
3
36
381
(4
5)88
%56
%-1
%7%
39
1% 1
4 1
3 8
B
urbe
rry
31/0
3/20
13 6
,516
-
- -
--
--
- -
- -
- C
apita
31/1
2/20
13 7
,492
8
48
967
(1
18)
88%
37%
-2%
13%
(6)
0% 2
6 2
4 0
C
arni
val
30/1
1/20
13 4
,779
3
30
336
(6
)98
%50
%0%
7%(2
)0%
10
5
5
Cen
tric
a31
/12/
2013
15,
602
5,6
83
5,6
43
40
101%
64%
0%36
%(1
84)
-1%
251
1
87
129
C
oca-
Col
a H
BC
31/1
2/20
13 4
,918
2
18
297
(7
9)73
%54
%-2
%6%
32
1% 1
0 8
4
C
ompa
ss30
/09/
2013
18,
054
2,1
49
2,3
58
(209
)91
%59
%-1
%13
% 3
9 0%
146
7
2 1
25
CR
H31
/12/
2013
10,
965
1,9
32
2,2
75
(342
)85
%48
%-3
%21
% 4
1 0%
105
1
35
82
Dia
geo
30/0
6/20
13 4
6,39
9 7
,120
7
,436
(3
16)
96%
55%
-1%
16%
56
0% 5
93
190
4
90
Eas
yjet
30/0
9/20
13 5
,398
-
- -
--
--
- -
- -
- E
xper
ian
31/0
3/20
13 9
,832
6
54
631
2
3 10
4%45
%0%
6%(4
0)0%
7
7
2
Fres
nillo
31/1
2/20
13 6
,598
1
4 2
1 (7
)66
%77
%0%
0%(1
)0%
2
- 1
Fr
iend
s Li
fe G
roup
Lim
ited
31/1
2/20
13 4
,471
1
,410
1
,414
(4
)10
0%85
%0%
32%
(68)
-2%
28
27
28
G4S
31/1
2/20
13 3
,960
1
,650
2
,132
(4
82)
77%
73%
-12%
54%
(78)
-2%
49
47
41
GK
N31
/12/
2013
5,8
99
2,5
32
3,8
03
(1,2
71)
67%
53%
-22%
64%
(252
)-4
% 5
5 9
7 4
G
laxo
Sm
ithK
line
31/1
2/20
13 7
4,22
0 1
5,22
5 1
5,83
8 (6
13)
96%
44%
-1%
21%
655
1%
343
6
35
90
Gle
ncor
e31
/12/
2013
43,
228
2,2
22
2,8
16
(594
)79
%54
%-1
%7%
32
0% 1
13
119
6
8 H
amm
erso
n31
/12/
2013
4,1
34
58
91
(33)
64%
0%-1
%2%
(2)
0% 2
2
0
H
argr
eave
s La
nsdo
wn
30/0
6/20
13 5
,872
-
- -
--
--
- -
- -
- H
SB
C31
/12/
2013
111
,810
2
4,63
7 2
4,56
1 7
6 10
0%78
%0%
22%
(506
)0%
602
4
50
517
IM
I31
/12/
2013
4,2
78
1,2
93
1,4
50
(158
)89
%64
%-4
%34
% 3
5 1%
41
22
34
Impe
rial T
obac
co30
/09/
2013
25,
068
3,3
49
4,4
03
(1,0
54)
76%
46%
-4%
18%
(53)
0% 9
8 1
01
45
Inte
rCon
tinen
tal H
otel
s31
/12/
2013
5,6
30
449
5
41
(92)
83%
95%
-2%
10%
(122
)-2
% 1
9 6
8 1
3 In
tern
atio
nal A
irlin
es G
roup
31/1
2/20
13 6
,824
1
8,77
2 1
8,77
5 (3
)10
0%52
%0%
275%
(77)
-1%
479
4
49
449
In
tert
ek31
/12/
2013
4,4
20
113
1
26
(13)
90%
44%
0%3%
5
0% 2
3
(1
)In
tu P
rope
rtie
s31
/12/
2013
3,8
65
- -
- -
--
--
--
- -
ITV
31/1
2/20
13 6
,970
2
,870
3
,315
(4
45)
87%
64%
-6%
48%
43
1% 9
1 8
2 8
3 Jo
hnso
n M
atth
ey31
/03/
2013
6,5
57
1,4
13
1,6
08
(195
)88
%57
%-3
%25
%(9
4)-1
% 6
6 5
5 2
7 K
ingfi
sher
02/0
2/20
13 8
,482
2
,087
2
,087
-
100%
70%
0%25
%(6
)0%
41
49
24
Land
Sec
uriti
es31
/03/
2013
8,2
26
193
1
87
6
103%
66%
0%2%
4
0% 5
5
4
appendix
10
Nam
eYe
ar E
ndE
qui
ty
Mar
ket
Valu
e*
Pen
sion
A
sset
sP
ensi
on
Liab
ilitie
sS
urp
lus
/ (D
efici
t)Fu
ndin
g Le
vel
%
Bon
ds
Sur
plu
s /
(Defi
cit)
as %
of
Mar
ket
Valu
e
Liab
ilitie
s as
% o
f M
arke
t Va
lue
Una
ntic
ipat
ed
Bal
ance
She
et
Imp
act
Bal
ance
She
et
Imp
act
as %
of
Mar
ket
Valu
e
Cur
rent
Fu
ndin
gP
revi
ous
Fund
ing
Sur
plu
s /
(Defi
cit)
Fund
ing
£m£m
£m£m
£m£m
£m£m
Lega
l & G
ener
al31
/12/
2013
13,
240
1,6
43
2,1
10
(467
)78
%66
%-4
%16
%(1
41)
-1%
62
61
49
Lloy
ds B
anki
ng G
roup
31/1
2/20
13 5
3,81
8 3
2,56
8 3
3,35
5 (7
87)
98%
46%
-1%
62%
(1,3
89)
-3%
804
6
69
448
Lo
ndon
Sto
ck E
xcha
nge
31/0
3/20
13 5
,467
2
74
291
(1
8)94
%92
%0%
5%(7
)0%
1
1
1
Mar
ks &
Spe
ncer
31/0
3/20
13 6
,833
6
,930
6
,724
2
06
103%
77%
3%98
% 9
0 1%
71
132
4
M
eggi
tt31
/12/
2013
4,0
20
688
8
78
(190
)78
%52
%-5
%22
% 3
6 1%
42
38
27
Mon
di31
/12/
2013
3,9
00
88
214
(1
27)
41%
64%
-3%
5% 1
8 0%
2
2
(2)
Mor
rison
Sup
erm
arke
ts03
/02/
2013
4,3
13
2,8
39
2,8
59
(20)
99%
57%
0%66
%(6
)0%
33
31
1
Nat
iona
l Grid
31/0
3/20
13 3
1,28
2 2
1,77
0 2
3,67
6 (1
,906
)92
%63
%-6
%76
%(8
35)
-3%
425
4
15
248
N
ext
26/0
1/20
14 9
,998
6
68
597
7
0 11
2%46
%1%
6%(1
4)0%
22
19
15
Old
Mut
ual
31/1
2/20
13 1
1,00
6 5
73
490
8
3 11
7%66
%1%
4% 5
1 0%
8
9
3
Pea
rson
31/1
2/20
13 9
,383
2
,509
2
,458
5
1 10
2%43
%1%
26%
68
1% 8
2 7
4 5
7 P
ersi
mm
on31
/12/
2013
3,8
53
457
4
33
24
105%
44%
1%11
% 6
0%
24
67
22
Pet
rofa
c31
/12/
2013
4,1
61
- -
- -
--
--
--
- -
Pru
dent
ial
31/1
2/20
13 3
4,21
9 6
,944
6
,298
6
46
110%
89%
2%18
%(1
59)
0% 5
6 7
1 2
9 R
andg
old
Res
ourc
es31
/12/
2013
6,5
77
- -
- -
--
--
--
- -
Rec
kitt
Ben
ckis
er31
/12/
2013
36,
316
1,4
58
1,5
92
(134
)92
%55
%0%
4% 5
3 0%
108
1
51
87
Ree
d E
lsev
ier
31/1
2/20
13 1
0,70
9 3
,981
4
,360
(3
79)
91%
56%
-4%
41%
(18)
0% 8
3 1
16
10
Rex
am31
/12/
2013
3,7
71
2,8
99
3,2
06
(307
)90
%73
%-8
%85
% 7
1 2%
42
47
27
Rio
Tin
to31
/12/
2013
43,
861
9,5
26
10,
858
(1,3
32)
88%
46%
-3%
25%
1,4
60
3% 4
28
419
2
57
Rol
ls-R
oyce
31/1
2/20
13 2
0,00
9 1
0,28
0 1
0,53
9 (2
59)
98%
75%
-1%
53%
(10)
0% 3
15
299
4
5 R
oyal
Ban
k of
Sco
tland
31/1
2/20
13 2
0,29
8 2
8,48
8 3
1,48
4 (2
,996
)90
%59
%-1
5%15
5% 4
40
2% 8
21
977
4
48
Roy
al D
utch
She
ll31
/12/
2013
160
,844
5
1,88
2 5
4,07
1 (2
,189
)96
%51
%-1
%34
% 3
,116
2%
1,6
48
1,4
54
437
R
oyal
Mai
l Gro
up31
/03/
2013
4,9
90
3,3
43
2,5
13
830
13
3%77
%17
%50
% 3
,489
70
% 4
35
429
2
3 R
SA
31/1
2/20
13 4
,827
6
,566
6
,677
(1
11)
98%
80%
-2%
138%
27
1% 1
22
128
8
5 S
AB
Mille
r31
/03/
2013
53,
955
298
3
77
(78)
79%
63%
0%1%
(13)
0% 1
2 3
7
S
age
Gro
up30
/09/
2013
4,3
82
17
30
(13)
57%
72%
0%1%
0
0% 1
1
1
S
ains
bury
16/0
3/20
13 5
,950
5
,841
6
,594
(7
53)
89%
60%
-13%
111%
(363
)-6
% 1
37
134
7
6 S
chro
ders
31/1
2/20
13 6
,716
8
49
786
6
4 10
8%50
%1%
12%
(7)
0%-
- -
Sev
ern
Tren
t31
/03/
2013
4,6
02
1,7
24
2,1
08
(384
)82
%37
%-8
%46
%(5
4)-1
% 4
4 5
4 2
0 S
hire
31/1
2/20
13 2
7,25
4 -
- -
--
--
- -
- -
- S
mith
& N
ephe
w31
/12/
2013
9,1
22
817
9
25
(108
)88
%54
%-1
%10
% 6
0%
43
46
24
Sm
iths
Gro
up31
/07/
2013
5,0
93
3,6
96
3,8
43
(146
)96
%42
%-3
%75
% 2
83
6% 7
1 1
15
67
Spo
rts
Dire
ct In
tern
atio
nal
28/0
4/20
13 4
,228
4
7 6
7 (2
0)70
%50
%0%
2%(3
)0%
3
3
3
SS
E31
/03/
2013
15,
534
3,1
18
3,6
35
(517
)86
%64
%-3
%23
%(5
0)0%
125
1
38
85
St.
Jam
es's
Pla
ce31
/12/
2013
3,8
11
- -
- -
--
--
--
- -
Sta
ndar
d C
hart
ered
31/1
2/20
13 2
9,06
6 1
,568
1
,775
(2
07)
88%
47%
-1%
6% 5
3 0%
107
1
28
41
Sta
ndar
d Li
fe31
/12/
2013
8,9
40
3,2
44
2,6
83
561
12
1%74
%6%
30%
(139
)-2
% 5
1 4
7 (4
)Te
sco
23/0
2/20
13 2
2,92
2 7
,206
9
,584
(2
,378
)75
%22
%-1
0%42
%(7
42)
-3%
666
4
57
184
Tr
avis
Per
kins
31/1
2/20
13 3
,995
1
,027
1
,027
0
10
0%24
%0%
26%
(32)
-1%
34
33
23
TUI T
rave
l30
/09/
2013
4,4
50
1,3
22
1,9
83
(661
)67
%54
%-1
5%45
%(2
1)0%
62
60
22
Tullo
w O
il31
/12/
2013
7,7
36
- -
- -
--
--
--
- -
Uni
leve
r31
/12/
2013
77,
413
15,
291
16,
498
(1,2
07)
93%
44%
-2%
21%
784
1%
504
4
91
324
U
nite
d U
tiliti
es31
/03/
2013
6,0
14
2,4
42
2,4
27
15
101%
74%
0%40
% 4
1 1%
93
150
7
7 Vo
dafo
ne31
/03/
2013
56,
282
3,7
23
4,3
00
(577
)87
%56
%-1
%8%
(353
)-1
% 1
03
34
75
Wei
r G
roup
03/0
1/20
14 5
,565
6
81
751
(7
0)91
%71
%-1
%14
% 8
0%
15
11
16
Whi
tbre
ad28
/02/
2013
7,9
48
1,4
80
2,0
22
(542
)73
%37
%-7
%25
% 2
9 0%
46
95
46
Wol
sele
y31
/07/
2013
8,5
44
1,3
06
1,4
39
(133
)91
%32
%-2
%17
% 7
4 1%
176
1
09
149
W
PP
31/1
2/20
13 1
5,79
5 7
26
973
(2
47)
75%
70%
-2%
6% 7
6 0%
48
57
23
Wol
sele
y31
/07/
2013
9,0
99
1,3
06
1,4
39
(133
)91
%32
%-1
%16
% 7
4 1%
176
1
09
149
W
PP
31/1
2/20
13 1
5,50
6 7
26
973
(2
47)
75%
70%
-2%
6% 7
6 0%
48
57
23
* as
at 3
0 Ju
ne 2
014
appendix (conTinued)

11
Whilst all reasonable care has been taken in the preparation of this publication, no liability is accepted under any circumstances by Jardine Lloyd Thompson for any loss or damage occurring as a result of reliance on any statement, opinion, or any error or omission contained herein. Any statement or opinion reflects our understanding of current or proposed legislation and regulation, which may change without notice. The content of this document should not be regarded as specific advice in relation to the matters addressed.
J.P.Morgan Cazenove is a marketing name for the UK investment banking businesses [and EMEA cash equities and equity research businesses] of J.P.Morgan Chase & Co. and its subsidiaries (collectively J.P.Morgan). This publication has been prepared for information purposes only and is not a solicitation, or an offer, to buy or sell any security or to participate in any trading strategy, and should not be regarded as specific or investment advice in relation to the matters addressed. It has been prepared without regard to the individual financial objectives and circumstances of the recipients. It does not purport to be a complete description of the securities, markets or developments referred to in it. The information on which this publication is based has been obtained from sources which we believe to be reliable, but we have not independently verified such information and we do not warrant that it is accurate or complete. All expressions of opinion are subject to change without notice. Third party data providers make no warranty relating to the accuracy, completeness or timeliness of their data and shall have no liability whatsoever for losses that may arise from reliance upon such data. Jardine Lloyd Thompson and J.P.Morgan shall have no responsibility or liability whatsoever for loss or damage that may arise from reliance upon any statement or opinion in, or any error or omission from, this publication (including, without limitation, such third party data). Each of Jardine Lloyd Thompson, J.P.Morgan, and their respective connected companies, and the directors, officers and employees of each of them, may from time to time have a long or short position, or other interest, in the securities of the companies referred to and may sell or buy such securities and interests and may trade them in ways that may be inconsistent with any discussion in this publication.
noTeS• All of the analysis contained in this report is based on the IAS19 numbers
disclosed in a company’s most recently published annual report and accounts.
• No adjustment is made for the fact that companies have applied different interpretations of IAS19 and have used different actuarial assumptions (for example, different mortality assumptions can make a significant difference to a company’s pension liabilities).
• No adjustment is made in the individual analysis for the fact that companies have different year-ends. Inevitably, different market conditions applying at different year-ends will affect the comparisons.
• The assets and liabilities shown are the total global pension assets and liabilities, not just the UK figures.
• The figures shown in this report are before adjustment for IFRIC14 (and before adjustment for any other unrecognised pension surpluses), except for Unanticipated Balance Sheet Impact, which is shown net of the change in irrecoverable surplus.

ABoUT US
JLT Employee Benefits is one
of the UK’s leading employee
benefit providers offering a wide
range of benefit and pension
services, including administration,
actuarial and pension consultancy,
investment, Self Invested Personal
Pensions (SIPPs) and Small Self
Administered Schemes (SSASs)
administration, flexible benefits,
healthcare, benefit communication
and financial education.
JLT Employee Benefits The St Botolph Building 138 Houndsditch London EC3A 7AW
www.jltgroup.com/eb
JLT Employee Benefits. A trading name of JLT Benefit Solutions Limited. Authorised and regulated by the Financial Conduct Authority. A member of the Jardine Lloyd Thompson Group. Registered Office: The St Botolph Building, 138 Houndsditch, London EC3A 7AW. Registered in England No. 02240496. VAT No. 244 2321 96.
© October 2014 9149
conTacTS
Charles Cowling
JLT Employee Benefits
+44 (0) 161 242 5388
Murray Wright
JLT Employee Benefits
+44 (0) 131 456 6868
JLT EMPLoYEE BENEFITS | FTSE 100 AS AT JUNE 2014 | OCTOBER 2014