Certificate for Introduction to Securities & Investment (Cert.ISI) Unit 1 London Stock Exchange...
14
Certificate for Introduction to Securities & Investment (Cert.ISI) Unit 1 London Stock Exchange indices o FTSE 100 o FTSE 250 o FTSE 350 o FTSE All Share 29ci s Lesson 29: The types and uses of a stock exchange index
-
Upload
molly-marjory-simmons -
Category
Documents
-
view
229 -
download
0
Transcript of Certificate for Introduction to Securities & Investment (Cert.ISI) Unit 1 London Stock Exchange...

Certificate for Introduction to Securities & Investment (Cert.ISI)Unit 1
London Stock Exchange indiceso FTSE 100o FTSE 250o FTSE 350o FTSE All Share
29cis
Lesson 29: The types and uses of a stock exchange index

Stock indices
Stock indices provide a snapshot of how share prices are performing in a particular market, or across several markets
Stock indices can measure price movements across: A selection of shares from several different stock markets around the world All shares listed on a single stock market A selection of shares from a single stock market
Shares classified according to market capitalisationo Large-capo Mid-capo Small-cap
Shares classified according to business typeo Industrialso Utilitieso Pharmaceuticals, etc
Shares classified according to business philosophyo “Green” stocks (sustainability, etc)o “Sin-free” stocks (no earnings from alcohol, tobacco, gambling, etc)
A stock index calculates the aggregate price movement of its targeted stocks on a daily basis, providing a single figure for ease of comparison

Why are stock indices useful?
By the end of a normal trading day: Some share prices may have moved up sharply on very low volume
This might be due to one maverick trade that does not represent the market’s view of the stock
Some share prices may have moved down sharply because the dividend has just been paidSome sector-specific news might have pushed up the share prices of some important stocks, while the rest of the market drifted lower
For instance, the government Regulator might have announced a higher-than-expected tariff increase for the electricity supply companies
It is very difficult an investor to gauge the overall performance of the market from looking individual share price movements
A stock index aims to smooth out these anomalies and provide a consistent picture of the mood of the market. They “track” the market through its ups and down over a period of time.

Why are stock indices useful?Vodafone
Barclays
BP
This chart shows the movement of the FTSE 100 index over the course of the same day
FTSE 100
These charts show the movement of three, key, large-cap stocks on the London Stock Exchange over the course of a single trading day:
How to sum up the performance of the stock market as a whole that day?
This shows investors how the whole market performed
Stock indices for performance comparison
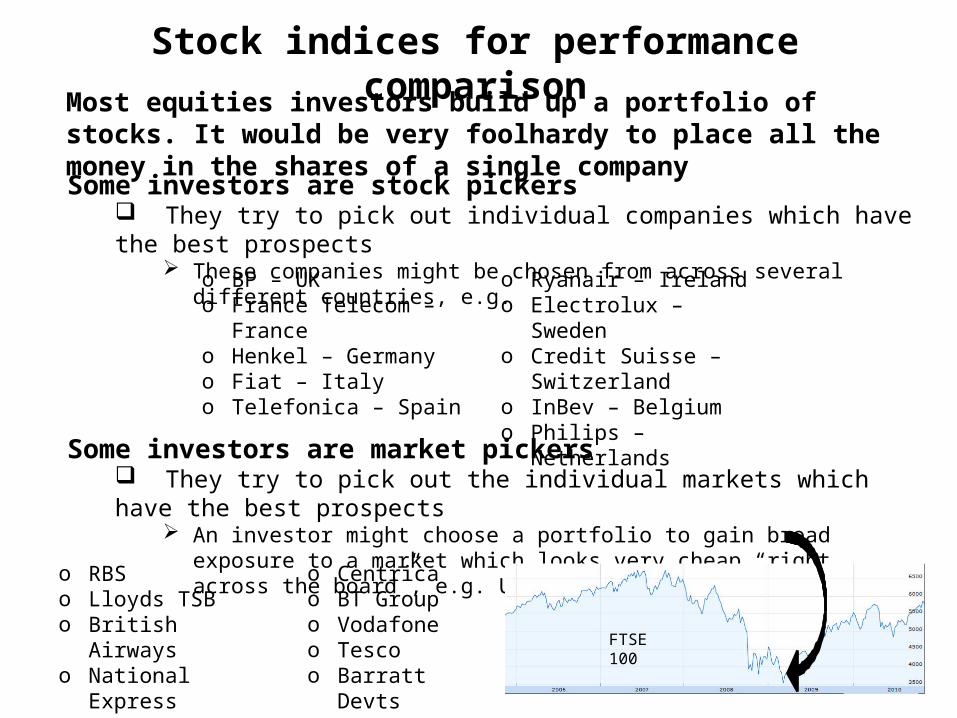
Most equities investors build up a portfolio of stocks. It would be very foolhardy to place all the money in the shares of a single company
Some investors are stock pickers They try to pick out individual companies which have the best prospects
These companies might be chosen from across several different countries, e.g.
o BP – UKo France Telecom – Franceo Henkel – Germanyo Fiat – Italyo Telefonica – Spain
o Ryanair – Irelando Electrolux – Swedeno Credit Suisse –Switzerlando InBev – Belgiumo Philips – Netherlands
Some investors are market pickers They try to pick out the individual markets which have the best prospects
An investor might choose a portfolio to gain broad exposure to a market which looks very cheap “right across the board”, e.g. UK at the end of 2008
o RBSo Lloyds TSBo British Airwayso National Expresso Severn Trent
o Centricao BT Groupo Vodafoneo Tescoo Barratt Devts
FTSE 100
Stock indices for performance comparison (cont.)
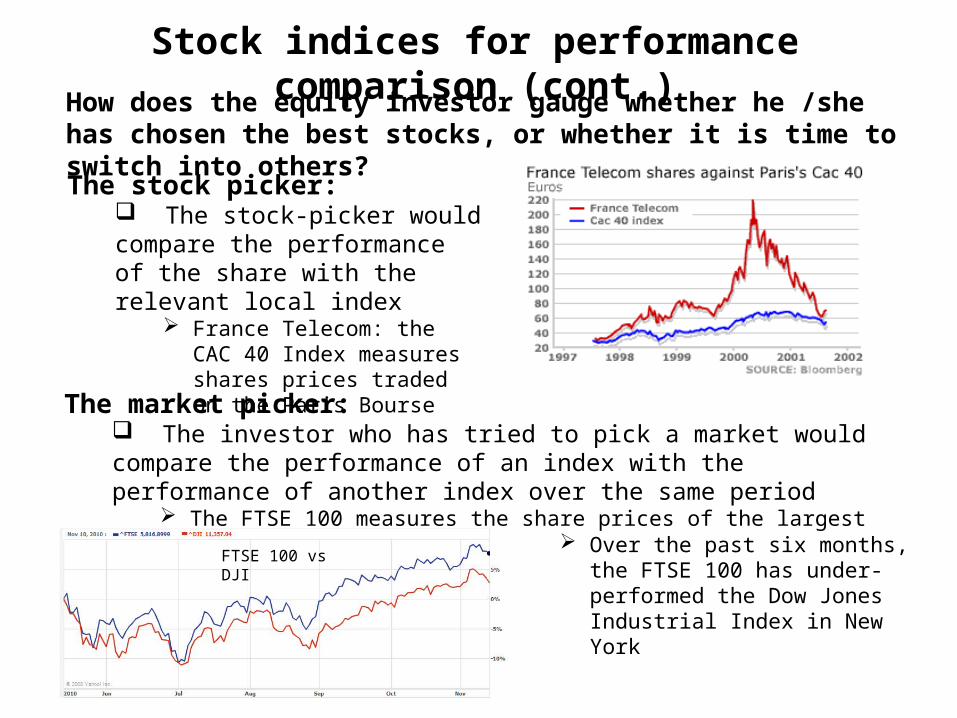
How does the equity investor gauge whether he /she has chosen the best stocks, or whether it is time to switch into others?
The stock picker: The stock-picker would compare the performance of the share with the relevant local index
France Telecom: the CAC 40 Index measures shares prices traded on the Paris Bourse
The market picker: The investor who has tried to pick a market would compare the performance of an index with the performance of another index over the same period
The FTSE 100 measures the share prices of the largest 100 UK companies
Over the past six months, the FTSE 100 has under-performed the Dow Jones Industrial Index in New York
FTSE 100 vs DJI

UK stock indices
In the UK, stock indices are calculated and published by FTSE International, originally a joint venture between The Financial Times and the London Stock Exchange. The main FTSE indices are:
FTSE 100 An index of the largest 100 UK companies, representing about 70% of the whole UK stock market by value
This index is commonly referred to as the “Footsie”
FTSE 250 An index of the next 250 medium- or middle-sized companies below the 100
The FTSE 250 is the main mid-cap index
FTSE 350 A combination of the 100 and 250 indices
The FTSE 350 is broken down into industry sectors, such as Retailing and Transport
FTSE All Share Covers over 600 companies, including the 350
The FTSE All Share accounts for about 98% of the UK market by value It is often used as the benchmark against which diversified share portfolios are
measured
Keeping UK stock indices up-to-date
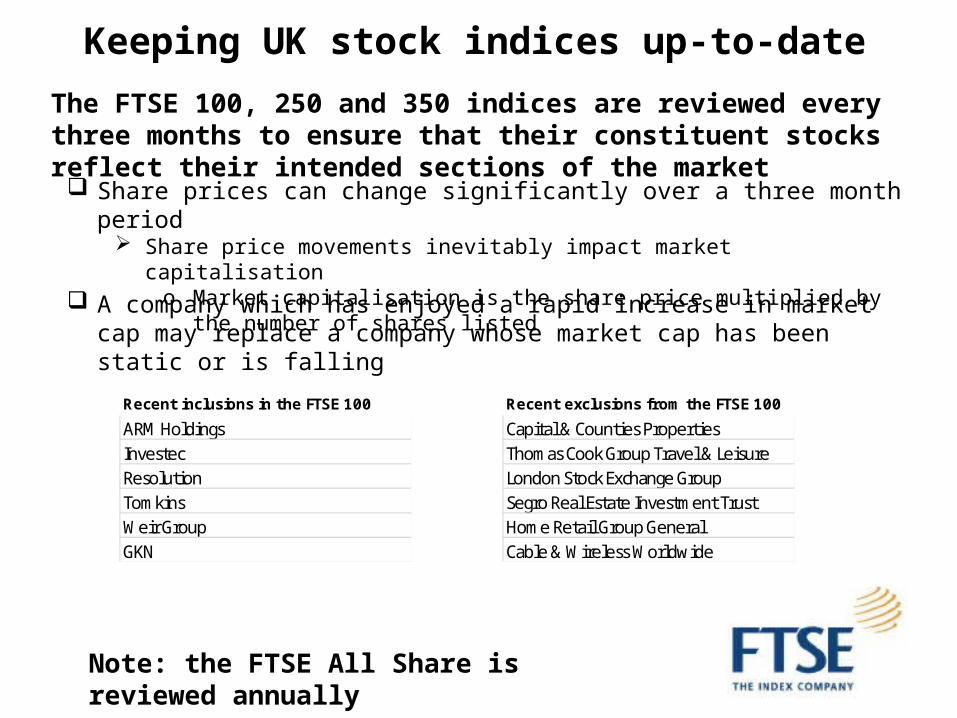
The FTSE 100, 250 and 350 indices are reviewed every three months to ensure that their constituent stocks reflect their intended sections of the market
Share prices can change significantly over a three month period Share price movements inevitably impact market capitalisation
o Market capitalisation is the share price multiplied by the number of shares listed
A company which has enjoyed a rapid increase in market cap may replace a company whose market cap has been static or is falling
Note: the FTSE All Share is reviewed annually
Recent inclusions in the FTSE 100
ARM HoldingsInvestecResolutionTomkinsWeir GroupGKN
Recent exclusions from the FTSE 100
Capital & Counties PropertiesThomas Cook Group Travel & LeisureLondon Stock Exchange GroupSegro Real Estate Investment TrustHome Retail Group GeneralCable & Wireless Worldwide

Tracker funds
Surprisingly few stock-pickers manage to “outperform the index”. The prices of the shares they have chosen perform less well in aggregate than the market(s) as a whole (as measured by the relevant index)
Many investors take the view that if so many professional fund managers fail to beat the index, there is no point in paying them fees to pick stocks in the first place
Performance of balanced managed pension funds vs the stock-market
Tracker funds try to build portfolios of stocks that move in line with the market as a whole
A FTSE All Share tracker fund might hold 150 of the index’s 630 constituent stocks and aim to match the movements of the index with 95% accuracy
They might as well invest in the market as a whole – buy a “tracker” fund

Tracker funds and index constituents
About 35% of all UK pensions funds (by value) track indices. Therefore the quarterly review of the constituent stocks of an index can have a major impact on individual share prices.
When a stock is dropped from the FTSE 100 index, tracker funds benchmarked against the FTSE 100 no longer have any need to own it
With so many tracker funds selling the stock, the share price is likely to fall
When a stock is elevated to the FTSE 100 index, tracker funds benchmarked against the FTSE 100 will probably have to include it in their portfolios for the first time
With so many tracker funds buy the stock, the share price is likely to rise
A recent academic study in the US found that the prices of stocks added to the S&P 500 index between 1990 and 2005 rose by almost 9% around the time of their inclusion in the index. Stocks deleted from the index have tumbled by even more.

The importance of index inclusion
Investors understand very well the importance of index inclusion, and will keep close watch on the market caps of stocks
They may buy the shares of likely candidates for inclusion in an index
They may sell the shares of companies likely to be dropped from an index
Companies try very hard to keep they shares prices high enough to remain constituents of key stock indices
This is not only for the prestige: borrowing costs can be lower for FTSE 100 companies
Stock indices as a measure of economic sentiment
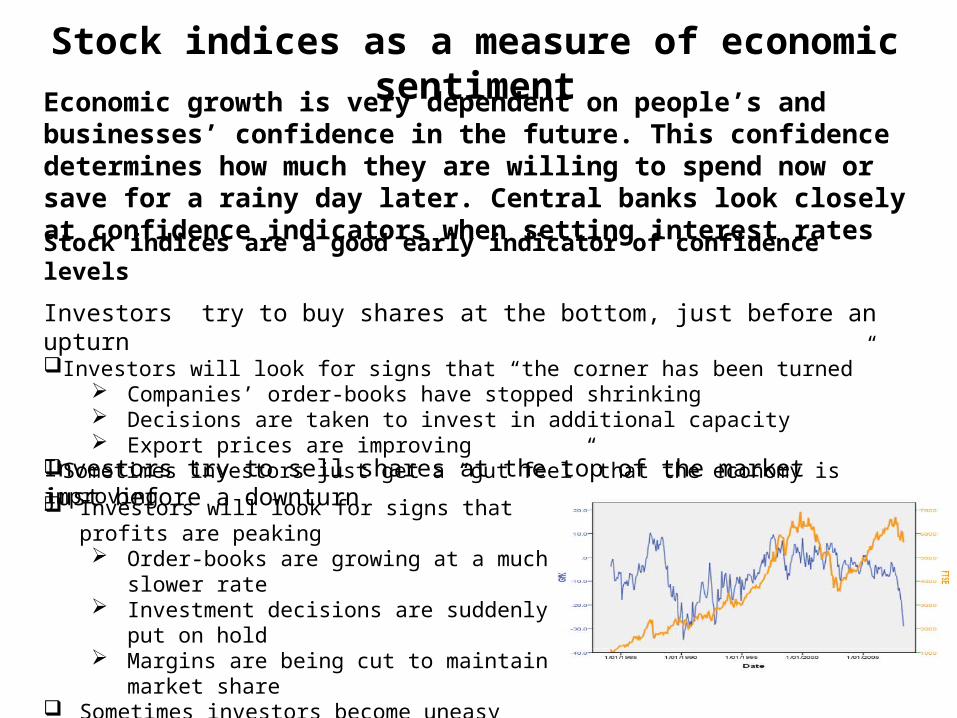
Economic growth is very dependent on people’s and businesses’ confidence in the future. This confidence determines how much they are willing to spend now or save for a rainy day later. Central banks look closely at confidence indicators when setting interest rates
Stock indices are a good early indicator of confidence levels
Investors try to buy shares at the bottom, just before an upturn Investors will look for signs that “the corner has been turned”
Companies’ order-books have stopped shrinking Decisions are taken to invest in additional capacity Export prices are improving
Sometimes investors just get a “gut feel” that the economy is improving
Investors try to sell shares at the top of the market just before a downturn Investors will look for signs that profits are peaking
Order-books are growing at a much slower rate Investment decisions are suddenly put on hold Margins are being cut to maintain market share
Sometimes investors become uneasy that prices have moved up too far, too fast and sell in order to lock in their profit

Stock indices as a leading indicator
The stock market will often anticipate the movement in the economy by several months.
Investors start selling their shares long before the peak in economic growth
Investors start buying shares long before the bottom of the trough in economic activity
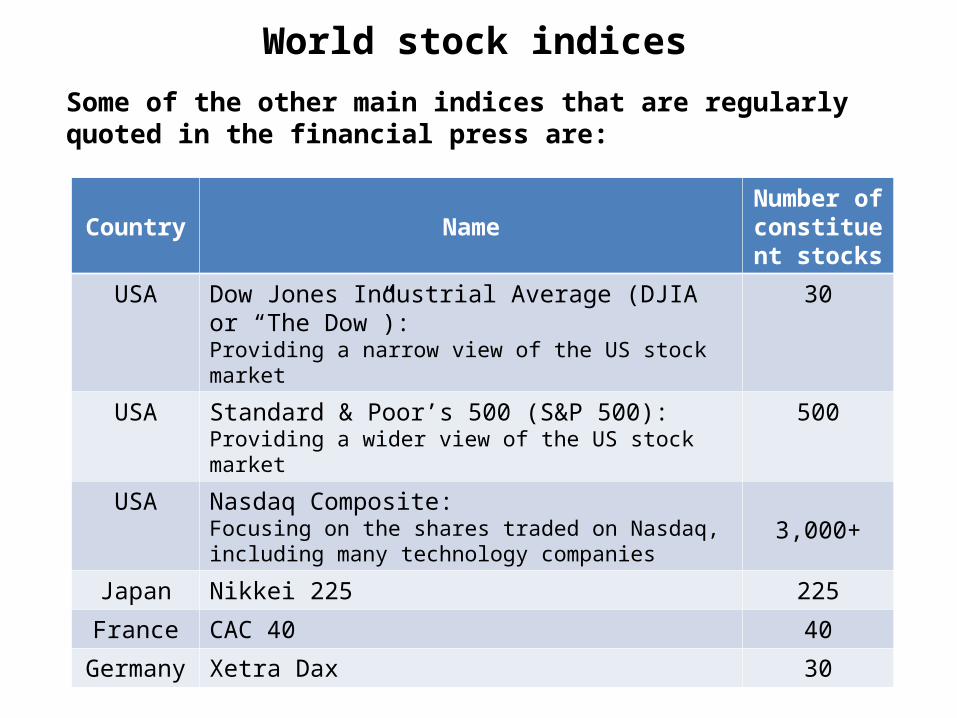
World stock indices
Some of the other main indices that are regularly quoted in the financial press are:
Country NameNumber of constituent
stocks
USA Dow Jones Industrial Average (DJIA or “The Dow”):Providing a narrow view of the US stock market
30
USA Standard & Poor’s 500 (S&P 500):Providing a wider view of the US stock market
500
USA Nasdaq Composite:Focusing on the shares traded on Nasdaq, including many technology companies
3,000+
Japan Nikkei 225 225
France CAC 40 40
Germany Xetra Dax 30