The Flexibility of the Oligopoly Game By Mike Reynolds Email: [email protected] DEE 2011 -...
27
-
Upload
susanna-wheeler -
Category
Documents
-
view
214 -
download
0
Transcript of The Flexibility of the Oligopoly Game By Mike Reynolds Email: [email protected] DEE 2011 -...

Session Outline
• Introduction• Example Game• A Closer Look• Extending the Game
DEE 2011 - Slide 2

Introduction
• Meister (1999)– Describes an oligopoly game
• Students split into teams/firms– Make decisions on quantity– Complicated set up
• Simpler version of game
DEE 2011 - Slide 3

Game Set-Up
• Class Room arranged• Each team/firm is given an envelope
containing instructions– See PDF
DEE 2011 - Slide 4

Example Game
• Sixth-form visit– Year 12
• 8 teams• 50 minute session• Outcomes will not necessarily look like the
theory– This is fine
DEE 2011 - Slide 5

Round 1 - Monopoly
• Teams hand in output decisions– Team 1: 2000 olives– Team 2: 2500 olives – Team 3: 3000 olives– Team 4: 900 olives– Team 5: 3000 olives– Team 6: 3500 olives– Team 7: 4000 olives– Team 8: 3125 olives
DEE 2011 - Slide 6
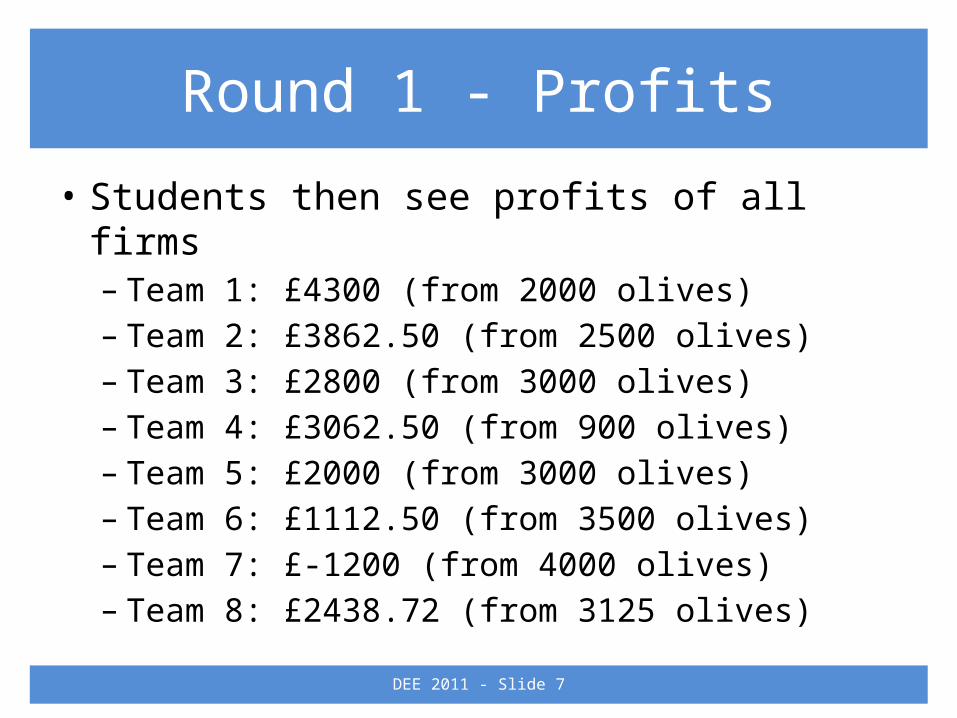
Round 1 - Profits
• Students then see profits of all firms– Team 1: £4300 (from 2000 olives)– Team 2: £3862.50 (from 2500 olives) – Team 3: £2800 (from 3000 olives)– Team 4: £3062.50 (from 900 olives)– Team 5: £2000 (from 3000 olives)– Team 6: £1112.50 (from 3500 olives)– Team 7: £-1200 (from 4000 olives)– Team 8: £2438.72 (from 3125 olives)
DEE 2011 - Slide 7

Round 2 – (Cournot) Competition
• All teams in same market Team 1 Team 2 Team 3 Team 4 Team 5 Team 6 Team 7 Team 8 Q P
Round 1
Monopoly
2000
4300
2500
3862.50
3000
2800
900
3062.50
3000
2000.00
3500
1112.50
4000
-1200
3125
2438.72- -
Round 2
Cournot
2000
-700
320
-280
200
-250
300
-275
750
-387.50
400
-300
300
-275
750
-587.505020 0
Round 3
CournotRound 4
Cournot MC*2
Round 5
Cournot Collusion
Total Profit3600.00 3582.50 2550.00 2787.50 2412.50 812.50 -1475.00 2049.22

Round 3 – (Cournot) Competition
• Repeat of Round 2
DEE 2011 - Slide 9
Team 1 Team 2 Team 3 Team 4 Team 5 Team 6 Team 7 Team 8 Q PRound 1
Monopoly
2000
4300
2500
3862.50
3000
2800
900
3062.50
3000
2000.00
3500
1112.50
4000
-1200
3125
2438.72- -
Round 2
Cournot
2000
-700
320
-280
200
-250
300
-275
750
-387.50
400
-300
300
-275
750
-587.505020 0
Round 3
Cournot
1000
-450
300
-275
700
-375
500
-325
500
-325
500
-325
800
-400.00
777
-394.255077 0
Round 4
Cournot MC*2
Round 5
Cournot Collusion
Total Profit
3150.00 3307.50 2175.00 2462.50 2087.50 487.50 -1875.00 1654.97

Round 4 – (Cournot) Competition
• Marginal costs double
DEE 2011 - Slide 10
Team 1 Team 2 Team 3 Team 4 Team 5 Team 6 Team 7 Team 8 Q PRound 1
Monopoly
2000
4300
2500
3862.50
3000
2800
900
3062.50
3000
2000.00
3500
1112.50
4000
-1200
3125
2438.72- -
Round 2
Cournot
2000
-700
320
-280
200
-250
300
-275
750
-387.50
400
-300
300
-275
750
-587.505020 0
Round 3
Cournot
1000
-450
300
-275
700
-375
500
-325
500
-325
500
-325
800
-400.00
777
-394.255077 0
Round 4
Cournot MC*2
50
-87.06
210
274.34
100
25.88
600
1155.25
200
251.75
50
-87.06
150
138.81
433
778.04 1793 2.76
Round 5
Cournot Collusion
Total Profit
3062.94 3581.84 2200.88 3617.75 2339.25 400.44 -1736.19 2433.01
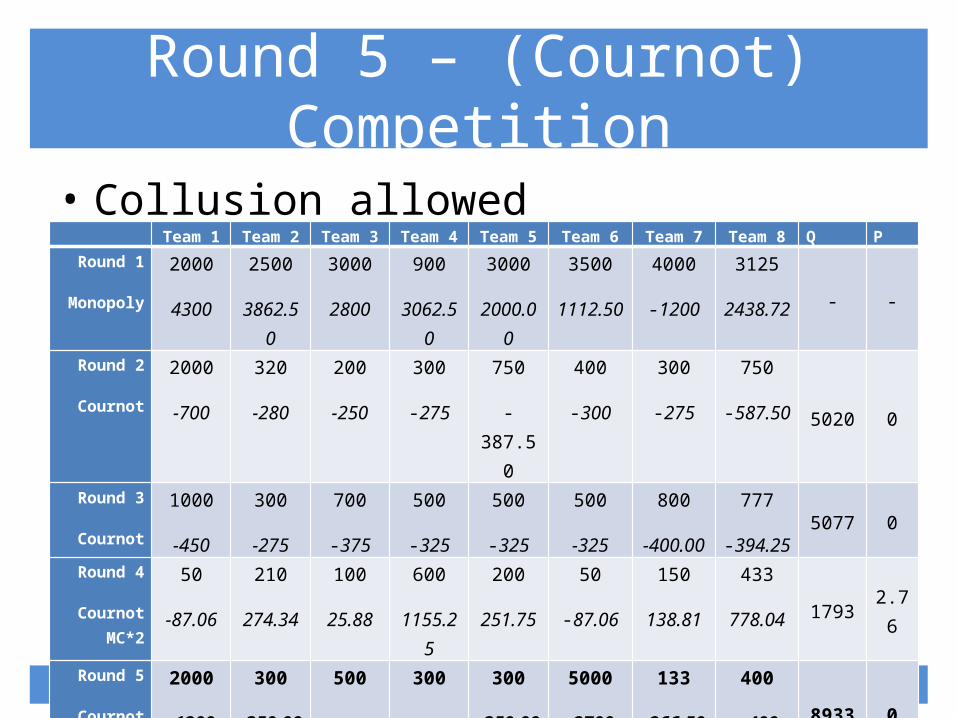
Round 5 – (Cournot) Competition
• Collusion allowed
DEE 2011 - Slide 11
Team 1 Team 2 Team 3 Team 4 Team 5 Team 6 Team 7 Team 8 Q PRound 1
Monopoly
2000
4300
2500
3862.50
3000
2800
900
3062.50
3000
2000.00
3500
1112.50
4000
-1200
3125
2438.72- -
Round 2
Cournot
2000
-700
320
-280
200
-250
300
-275
750
-387.50
400
-300
300
-275
750
-587.505020 0
Round 3
Cournot
1000
-450
300
-275
700
-375
500
-325
500
-325
500
-325
800
-400.00
777
-394.255077 0
Round 4
Cournot MC*2
50
-87.06
210
274.34
100
25.88
600
1155.25
200
251.75
50
-87.06
150
138.81
433
778.04 1793 2.76
Round 5
Cournot Collusion
2000
-1200
300
-350.00
500
-450.00
300
-350.00
300
-350.00
5000
-2700
133
-266.50
400
-400 8933 0
Total Profit
1862.94 3231.84 1750.88 3267.75 1989.25 -2299.56 -2002.69 2033.01

Final Results
• Team 4 win
DEE 2011 - Slide 12
Team 1 Team 2 Team 3 Team 4 Team 5 Team 6 Team 7 Team 8 Q PRound 1
Monopoly
2000
4300
2500
3862.50
3000
2800
900
3062.50
3000
2000.00
3500
1112.50
4000
-1200
3125
2438.72- -
Round 2
Cournot
2000
-700
320
-280
200
-250
300
-275
750
-387.50
400
-300
300
-275
750
-587.505020 0
Round 3
Cournot
1000
-450
300
-275
700
-375
500
-325
500
-325
500
-325
800
-400.00
777
-394.255077 0
Round 4
Cournot MC*2
50
-87.06
210
274.34
100
25.88
600
1155.25
200
251.75
50
-87.06
150
138.81
433
778.04 1793 2.76
Round 5
Cournot Collusion
2000
-1200
300
-350.00
500
-450.00
300
-350.00
300
-350.00
5000
-2700
133
-266.50
400
-400 8933 0
Total Profit 1862.94 3231.84 1750.88 3267.75 1989.25 -2299.56 -2002.69 2033.01

Debrief
• Need to give students a quick overview– In other groups you could go further
• Depends on ability of students– In this case, I underlined the contrast between
monopoly and competition• Monopolists made profits (and had high prices)• Whilst competition drove prices very low
– Lots of other elements that could be teased out• Collusion
DEE 2011 - Slide 13
A Closer Look
• Have an idea how the game goes• But why is the game set up this way?– Ensures the game is to be successful– Can alter elements to fit the students
DEE 2011 - Slide 14

Workings of the Game (1)
• Recall– “It is believed that in the relatively small market in
which you operate that the total demand for olives even at very low prices is unlikely to be higher than 4000 units, and that even the biggest olive lover in the market is only willing to pay a maximum of around £5 per unit.”
DEE 2011 - Slide 15
Workings of the Game (2)
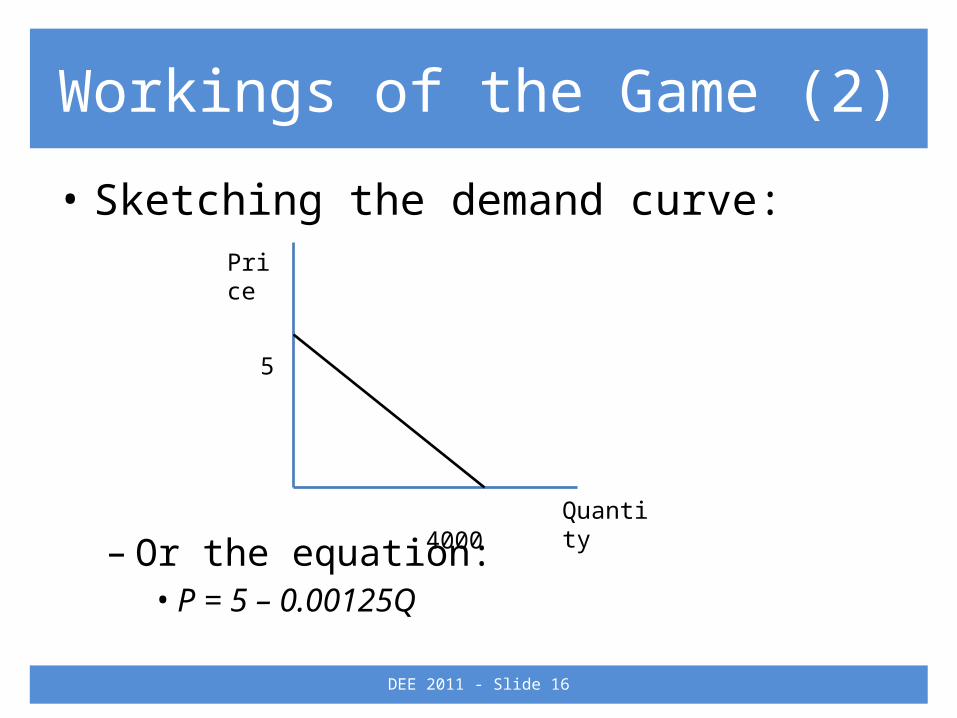
• Sketching the demand curve:
– Or the equation:• P = 5 – 0.00125Q
DEE 2011 - Slide 16
Price
Quantity
5
4000

Workings of the Game (3)
• Only simple details given– Emphasise the intuitive aspect• Can appeal to all levels of student
• Possible to make it more complicated for more advanced students
• Profit maximisation– Could become welfare maximisation
DEE 2011 - Slide 17
Organisation
• Set up in advance– Need to have an estimate of the number of teams
and the abilities of the players– Spreadsheet is set up in advance• Only requires a demand structure
DEE 2011 - Slide 18
Emphasise
• Non-collusion– Only allow collusion at the end of the game• Costs for firms are the same
– Could change to non-symmetric
DEE 2011 - Slide 19

Decision Framework
• Can vary the types of competition– Start with a (relatively) simple round– Could repeat
• Pre-announced game length– Final round can bring odd results (as we saw)– Good idea to change the game at this point
• Feedback of results– Profits or…– Can provide hints to class
DEE 2011 - Slide 20

Refereeing the Game
• Set times that decisions need to be made by– Initially a longer period
• Be reactive to behaviour– Warn and then punish teams• Collusion• Late decisions
– Plan alterations to the game
DEE 2011 - Slide 21

Linking The Game
• Sixth-form conference– 5-10 minute debrief– Or an extra session talking about the results
DEE 2011 - Slide 22
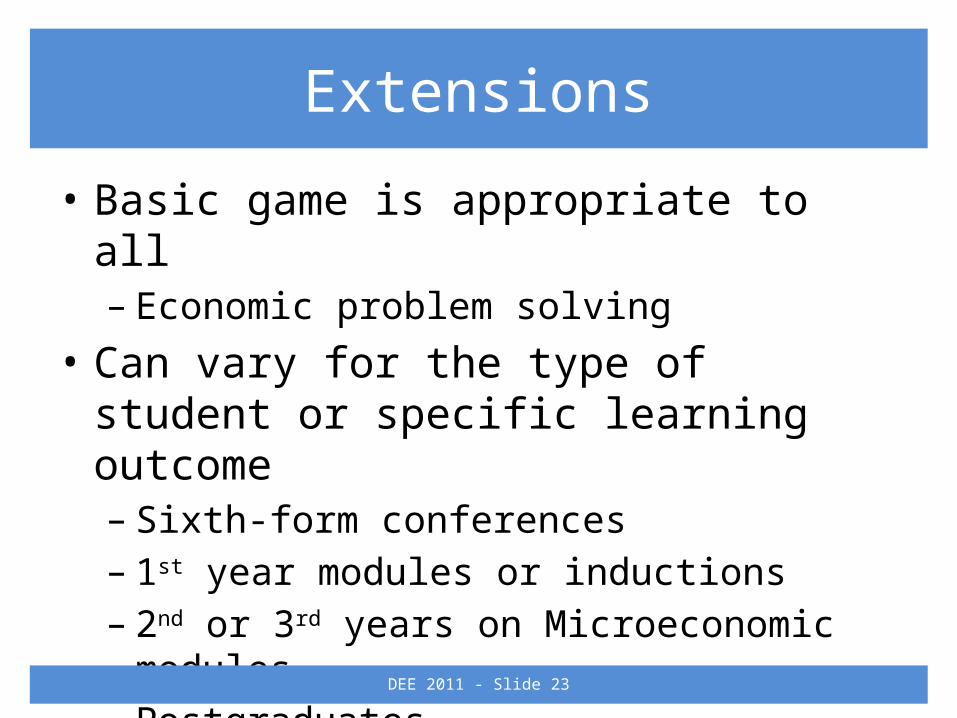
Extensions
• Basic game is appropriate to all– Economic problem solving
• Can vary for the type of student or specific learning outcome– Sixth-form conferences– 1st year modules or inductions– 2nd or 3rd years on Microeconomic modules– Postgraduates
DEE 2011 - Slide 23

Extensions: Level of Information
• Details of demand– More detailed information• Students calculate solutions
– Could even start with a utility function
DEE 2011 - Slide 24
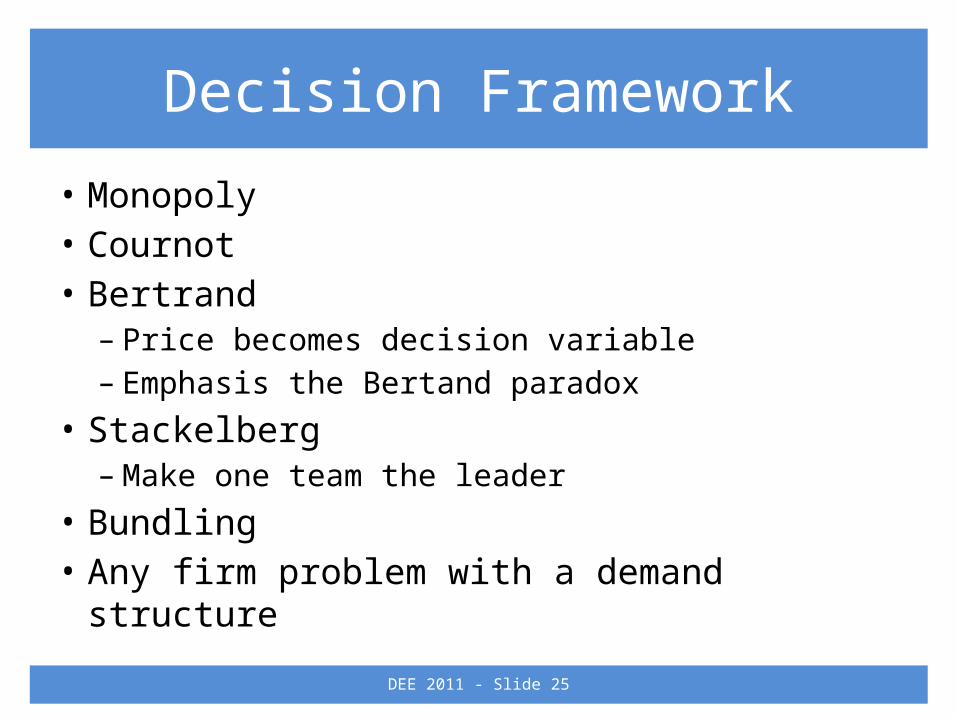
Decision Framework
• Monopoly• Cournot• Bertrand– Price becomes decision variable– Emphasis the Bertand paradox
• Stackelberg– Make one team the leader
• Bundling• Any firm problem with a demand structure
DEE 2011 - Slide 25
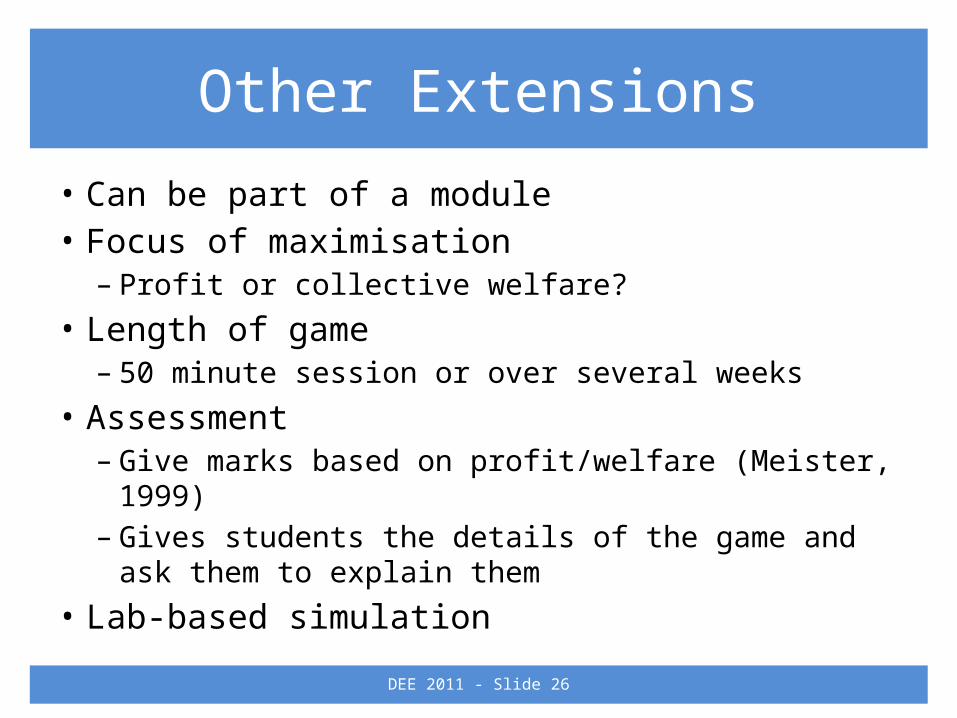
Other Extensions
• Can be part of a module• Focus of maximisation– Profit or collective welfare?
• Length of game– 50 minute session or over several weeks
• Assessment– Give marks based on profit/welfare (Meister, 1999)– Gives students the details of the game and ask them to
explain them• Lab-based simulation
DEE 2011 - Slide 26

References
• S. R. Beckham. 2003. “Cournot and Bertrand Games”, Journal of Economic Education 2003 34(1), pp. 27-35.
• J. Brauer. 1994. “Games Economists Play: Non-Computerised Classroom-Games in College Economics”
• S. Gächter, C. Thoni., and J-R. Tyran. 2006. “Cournot Competition and Hit-and-Run Entry and Exit in a Teaching Experiment”, Journal of Economic Education 37(4), pp. 418-430.
• J. Meister. 1999. “An In-Class Economic Game”, Journal of Economic Education 30(4): pp. 383-391.
• A. Ortmann. 2003. “Bertrand Price Undercutting: A Brief Classroom Demonstration”, Journal of Economic Education 34(1): pp. 21-26
DEE 2011 - Slide 27