
The Fiscal Outlook in Austria – An Evaluation with ... · The Fiscal Outlook in Austria – An...
28
The Fiscal Outlook in Austria – An Evaluation with Generational Accounts * Veronika Deeg Freiburg University (Germany) Christian Hagist Research Center for Generational Contracts, Freiburg University (Germany) and Stefan Moog Research Center for Generational Contracts, Freiburg University (Germany) Original Version: February 2008 First Revision: December 2008 Second Revision: March 2009 Abstract During the next few decades the populations of most developed countries will grow older and older as a result of the low fertility rates since the 1970s and/or the continuously increasing life expectancy. Generational Accounting which was introduced in the early nineties, can illustrate the effects of this ageing process on a country’s fiscal situation. We quantify for Austria how unsustainable its public finances are due to the demographic development. We show that despite recent reforms of the pension and health systems the demographic development produces a major problem for Austria’s coffers. Furthermore we compare our results to similar calculations for Germany and Switzerland. JEL Classification: H50, J10, H30 * Forschungszentrum Generationenverträge (Research Center for Generational Contracts), Albert-Ludwigs- Universität Freiburg (Freiburg University), D-79085 Freiburg, Germany (Fax +49-761-203-2290, [email protected]). We would like to thank Tobias Hackmann, Johannes Vatter and two anonymous referees for valuable comments. All errors remain our own.
Transcript of The Fiscal Outlook in Austria – An Evaluation with ... · The Fiscal Outlook in Austria – An...
The Fiscal Outlook in Austria – An Evaluation with
Generational Accounts *
Veronika Deeg Freiburg University (Germany)
Christian Hagist Research Center for Generational Contracts, Freiburg University (Germany)
and
Stefan Moog Research Center for Generational Contracts, Freiburg University (Germany)
Original Version: February 2008
First Revision: December 2008
Second Revision: March 2009
Abstract During the next few decades the populations of most developed countries will grow older and older as a result of the low fertility rates since the 1970s and/or the continuously increasing life expectancy. Generational Accounting which was introduced in the early nineties, can illustrate the effects of this ageing process on a country’s fiscal situation. We quantify for Austria how unsustainable its public finances are due to the demographic development. We show that despite recent reforms of the pension and health systems the demographic development produces a major problem for Austria’s coffers. Furthermore we compare our results to similar calculations for Germany and Switzerland. JEL Classification: H50, J10, H30
* Forschungszentrum Generationenverträge (Research Center for Generational Contracts), Albert-Ludwigs-Universität Freiburg (Freiburg University), D-79085 Freiburg, Germany (Fax +49-761-203-2290, [email protected]). We would like to thank Tobias Hackmann, Johannes Vatter and two anonymous referees for valuable comments. All errors remain our own.

1. Introduction
Austria was one of the flagships of the European Union until the current financial crisis. Blessed
with a sound economy, a relatively high growth rate and a formidable low unemployment rate,
it was long-term praised as an example, especially for its bigger brother – the former sick man of
Europe – Germany. However, as in the majority of OECD countries, Austria’s population is ageing
and its pay-as-you-go pension scheme as well as its generous social health insurance will get
under pressure.
Although the discussion in Austria is as controversial as in any country, its government is
already taken measures against these future financial problems of its social security system. In
the last five years Austria’s parliament passed two pension reform proposals, one in 2003 and
one in 2004. The latter one caused an outcry by several groups and policy makers and led to the
first national strike since the Second World War. Furthermore, the increasing public health
expenditure caused the government to adopt also a reform act in the health sector in 2005. The
question is now if all these reform acts are enough to get the Austrian fiscal system in balance.
This study wants to quantify the prior outlined problems and compare our results between the
three neighbor and German-speaking countries Austria, Germany and Switzerland. All three
countries share similar traditions but their social nets differ in quite a few ways. A comparison
can be useful to evaluate different approaches coping with the problems of ageing societies.
The paper is structured as follows: Section 2 describes briefly the method of Generational
Accounting and the calculation of the sustainability indicators used. Section 3 then reports the
sources of our data for the analysis of Austria’s fiscal system. To estimate the implicit debt of
public coffers in the long-run Generational Accounting needs four kinds of data, a population
projection, age- and sex-specific profiles, a general government budget of a certain base year
and global parameters (i.e. growth and discount rates). In section 4 we describe Austria’s
pension and health care system briefly and report the first findings of the sustainability of its
fiscal policy. We show the Generational Accounts of the system and discuss them in detail
together with our sustainability indicators introduced in section 2. In section 5 we compare our
results with findings from Germany and Switzerland taken from Hagist et al. (2008). Furthermore
we give possible explanations for the differences of the countries’ sustainability. Section 6
summarizes and concludes the paper.
1

2. The Methodology of Generational Accounting
To measure the sustainability of a country’s public sector we use the method of Generational
Accounting developed by Auerbach, Gokhale and Kotlikoff (1991, 1992 and 1994).1 In contrast to
traditional budget indicators which are based on annual cash flow budgets, Generational
Accounting is founded on the intertemporal budget constraint and therefore the long-term
implications of a current policy can be computed.
2.1 Methodology
The intertemporal budget constraint of the public sector, expressed in present value terms of a
base-year is: b
(1) , ,1
b D
b b kk b k b
b kB N N− ∞
= = +
= +∑ ∑ .
Let denote agents' maximum age and the present value of year b ’s net tax payments,
i.e., taxes paid net of transfers received, made by all members of a generation born in year
over the remaining lifecycle. Then, the first right-hand term of equation (1) represents the
aggregate net taxes of all generations alive in the base-year . The second term aggregates the
net tax payments made by future generations born in year
D ,b kN
k
b
1b+ or later. Together this is equal to
the left-hand side of equation (1), bB , which stands for the net debt in year b . That means if the
sum of all living generations’ net taxes, , is negative (i.e. if they receive a net transfer)
and the net debt,
,
b D
b kk b
N−
=∑
bB , positive, the sum of future generations’ net taxes has to be positive to
balance the government’s intertemporal budget i.e. in a long-term perspective net transfers
received by living generations plus the net debt of the base-year have to be financed by net
taxes paid by future generations.
To calculate generations' aggregated lifecycle net tax payments, the net payment terms in
equation (1) are decomposed into:
(2) . ( )}{
, , ,max ,
1k D
b sb k s k s k
s b k
N T P+
−
=
= +∑ r
1 The further description of the methodology of Generational Accounting is mainly based on Raffelhüschen (1999) and Bonin (2001). For an analytical derivation of the intertemporal budget constraint see Benz and Fetzer (2006) or Fetzer (2006). Hagist (2008) gives an overview about the empirical studies with generational accounting along with a discussion concerning critical points in theoretical as well as empirical terms.
2

In equation (2), denotes the average net tax paid in year by a representative member of
the generation born in year , whereas stands for the number of members of a generation
born in year who survive until year . To compute the remaining lifetime net payments of
living generations, the future demographic structure is specified conducting long-term
population forecasts.
ksT , s
k ksP ,
sk
Typically, Generational Accountants disaggregate equation (2) even further. To incorporate
gender-specific differences in average tax payments and transfer receipts by age, separate
aggregation of the average net taxes paid by male and female cohort members is required. The
products aggregated in equation (2) represent the net taxes paid by all members of generation
in year . For generations born prior to the base-year the summation starts from year b, while
for future born cohorts, the summation starts in year . Irrespective of the year of birth, all
payments are discounted back to the base-year b by application of a real interest rate .
k s
k b>
r
The age-specific net tax payment in year of agents born in year can be decomposed as s k
(3) , ,s k s k ii
T h= ,∑ .
iksh ,, stands for the average tax or transfer of type i paid or received in year by agents born in
year , thus of age .
s
k s k− 2 In equation (3), indicates a tax payment, whereas defines
a transfer.
0h > 0h <
Applying the method of Generational Accounting it is conventionally assumed that initial fiscal
policy and economic behavior are constant over time. Under this condition it is possible to
project future average tax payments and transfer receipts per capita from the base-year age
profile of payments according to
(4) ( ) ( ), , , ,1 s b
s k i b b s k ih h g −
− −= + .
where g represents the annual rate of productivity growth. Equation (4) assigns to each agent of
age in year the tax and transfer payment observed for agents of the same age in base-
year , uprated for gains in productivity. The base-year cross section of age-specific tax and
transfer payments per capita is generally determined in two steps. First, the relative position of
age cohorts between themselves in the tax and transfer system is estimated from micro-data
s k−
b
s
2 In case of an isolated analysis of public subsystems like health care or public pension as conducted in the following chapters, i is just chosen so that all relevant payment streams are included in the analysis.
3
profiles. In a second step the relative age profiles are re-evaluated proportionally to fit the
expenditure and tax revenues of the base-year.
For living and future generations, division of the aggregate remaining lifetime net tax payments
by the number of cohort members alive in year defines the cohort’s Generational Account in
year :
ss
(5) ,,
,
s ks k
s k
NGA
P= .
Generational Accounts are constructed in a purely forward-looking manner, only the taxes paid
and the transfers received in or after the base-year are considered. As a consequence,
Generational Accounts cannot be compared across living generations because they incorporate
effects of differential lifetime. One may compare, however, the Generational Accounts of base-
year and future born agents, who are observed over their entire lifecycle.
2.2 Fiscal Gap
To illustrate the fiscal burden of current fiscal policy we use seven sustainability indicators:3 The
starting point for the first indicators are the intertemporal public liabilities which can be
computed by the assumption that the intertemporal budget constraint of the public sector (1) is
violated:
(6) ,b bk b D
b kIPL B N∞
= −
= − ∑ .
The amount of intertemporal public liabilities measures aggregate unfunded claims on future
budgets, assuming that the present policy will hold for the future. The first sustainability
indicator, the fiscal gap ( bFG
GDP
), can be derived if the intertemporal public liabilities are set in
relation to base-year’s GDP ( ). This indicator is akin to the debt quota well known since the
Maastricht treaty but it addresses the debt which will occur in the future and in the past:
b
(7) bb
b
IPLFGGDP
= .
3 For a discussion of measuring fiscal sustainability and the development of sustainability indicators, see Raffelhüschen (1999) and Benz and Fetzer (2006).
4

2.3 Future Generations’ Burden
How the policy adjustment required to redeem intertemporal public liabilities will affect
generations' fiscal burdens is upon the policies addressing this burden. For illustrative purposes,
Generational Accounting typically assigns the entire adjustment to future generations which is
equivalent to . All tax payments made by members of future born cohorts are adjusted
proportionally with the help of a uniform scaling factor
k b>
θ . The factor θ is set to ensure balance
of the intertemporal public budget defined in equation (1):
(8) ( ) ( ), , , ,1 s b
s k i b b s k ih hθ g −
− −= × +
for and instead of equation (4). Computing the average age-specific net taxes paid by
representative future born agents, the burden for future generations can be illustrated as an
absolute difference between the Generational Account of the base-year agent and the
Generational Account of the one year after base-year born agent. This is our second
sustainability indicator, the future generations’ burden:
(9) , ,b b b bFGB GA GAθ
+= − 1
2.4 Revenue and Transfer Gap
The third indicator that illustrates the burden of current fiscal policy is the revenue gap. In this
case the scaling factor revθ θ= reflects the enhancement of age-specific revenues in per cent
for all generations which is necessary to close the intertemporal public budget constraint. It can
also be interpreted as the ratio of the intertemporal public liabilities to the present value of all
age-specific revenues of the fiscal system :
(10)
( )1Re
(1 )
brev
s s bs b
IPL
vr
θ ∝
−=
=⋅
+∑
with Re sv referring to the sum of revenues in year by all living generations in year .
Analogous to the revenue gap, we compute also the so-called transfer gap. In this case the
scaling factor
s s
trfθ θ= reflects the necessary decrement of age-specific public transfers (Trf)
like health benefits in per cent for all generations that is necessary to close the intertemporal
public budget constraint. Constructing the revenue and transfer gap, we implicitly assume that
the government is able to enforce an immediate adjustment of all taxes and contributions or
transfers respectively.
5

As Benz and Fetzer (2006) have shown all the used indicators are computed with an infinite time
horizon. In the practical calculation all relevant variables like population or cohorts’ tax
payments are projected for 300 years from the base-year on. Afterwards a geometrical serial is
used to determine the remaining net tax payments. The choice of 300 periods is nearly
completely arbitrary and just reflects a good approximation point for our analysis.
3. Data and Assumptions
To compute Generational Accounts and to calculate the stated indicators, we require a
population projection, the expenditures and revenues of the public sector like stated in Austria’s
national accounts in the base year 2004, age-sex-profiles for the different expenditure and
revenue types and a growth rate of the productivity as well as a discount rate. Due to the delay
of internationally comparable statistics, we choose the year 2004 as our base year. Therefore all
numbers and values are in present value terms of the year 2004 if not stated otherwise. The
population projection is calculated with a demographic program developed by Bonin (2001).
3.1 Population Projection
Generational Accounting requires detailed population projections. We distinguish in the
forthcoming between four possible scenarios titled Eurostat, medium variant, high variant and
low variant. Based on different assumptions about the three parameters life expectancy, fertility
and migration it is possible to derive a population projection for each of the demographic
scenarios. Own calculations are necessary for the reason of Generational Accounting’s assumed
infinite time horizon: The official projections end in 2050 (in 2060 in the case of the projection of
Eurostat) while we need a 300 years projection period.4 In these calculations we use the
parameters of the year 2004 reported by Statistik Austria. The projected parameters until year
2050 (2060) in the different scenarios originate from the assumptions made by Statistik Austria
(2007, 2008) and the website of Eurostat. Table 1 shows those central assumptions of the four
scenarios:
4 The choice of 300 periods is in certain boundaries arbitrary and just reflects a good approximation point for our analysis.
6

Table 1: Central Assumptions of Population Projections for Austria
Parameter Year Scenario
Eurostat5 Medium Variant High Variant Low Variant
Total Fertility Rate 2004 1.41 1.41 1.41 1.41
2050 1.57 1.50 1.90 1.10
Life Expectancy at birth for females/males in
years
2004 82.1/76.4 82.1/76.4 82.1/76.4 82.1/76.4
2050 89.2/84.9 90.0/86.0 92.5/89.0 87.0/82.4
Net migration 2004 33,081 33,081 33,081 33,081
2050 22,347 18,381 42,745 -6,634
Source: Statistik Austria (2007,2008), Website of Eurostat
Using these demographic assumptions the future size and structure of the Austrian population
can be anticipated for all four different demographic scenarios. The outcomes of these
projections are shown in table 2. Compared to the official calculations of the Eurostat projection
we underestimate the Austrian population by about 0.4 million in 2060, thus between the two
calculations the maximal deviation is 4.4 per cent. In the Eurostat variant, the Austrian
population increases until 2037 and then decreases at an approximately constant rate over the
projected horizon. In 2082 the base-year’s population of 8.1 million is almost reached and by
2100 the Austrian population has been reduced by approximately 0.4 million inhabitants.
Contrarily in case of the high variant the population increases constantly. After this scenario
Austria has 13.4 million inhabitants in 2100. Although the low variant is the one with the lowest
assumptions regarding the central parameters, the population still slightly grows over the next
two years due to the increasing life expectancy of both men and women. From 2021 onwards
the Austrian population declines steadily losing nearly 70 per cent compared to the number of
inhabitants in the base-year. For the following analysis we take the Eurostat projection as our
standard scenario if not stated differently. Outcomes for the three other scenarios can be found
in the appendix.
Table 2: Different projections of the Austrian population until 2100
Eurostat Medium variant High Variant Low Variant
Popul in Mio
Old-Age in %
Popul in Mio
Old-Agein %
Popul in Mio
Old-Agein %
Popul in Mio
Old-Agein %
2004 8.14 25.0 8.14 25.0 8.14 25.0 8.14 25.0
2025 8.80 36.7 8.79 37.9 9.17 38.0 8.44 37.3
2050 8.86 56.3 8.93 60.6 10.87 55.6 7.27 64.7
2075 8.32 61.0 8.08 65.8 12.04 54.5 4.90 90.7
2100 7.76 58.9 7.22 64.8 13.44 51.4 2.75 116.2
Source: Own calculations
5 For the Eurostat scenario the parameters are stated until 2060 not 2050.
7

3.2 Public Budget
According to Eurostat’s website, the public debt of Austria in 2004 was 146.7 billion Euros or 62.8
per cent of the GDP of 2004 which was 232.8 billion Euros. Aggregates for revenues and
expenditure are taken from OECD (2007a, 2008) and are based on detailed statistics about tax
and social contribution receipts as well as the government expenditure by function according to
the classification of the functions of government (COFOG), the harmonized classification on the
international level. Intergovernmental grants and transfers have been cancelled out. Revenues
include taxes on labor and capital incomes, value added tax (VAT), property taxes and social
insurance contributions.
Table 3: Budget of the Austrian General Government in 2004
Public Expenses (billion Euros) Public Revenues (billion Euros)
Government Consumption 9.7 Interest and Tenure 8.0
Defense 2.1 Income Tax 24.3
Public Order and Safety 3.4 Social Security Contributions 37.9
Economic Affairs 12.2 Payroll Tax 7.0
Environment Protection 0.8 Capital Income Tax 6.0
Housing/Communities Amenities 1.1 Value Added Tax 27.3
Recreation, culture and religion 2.3 Other Taxes 5.0
Education 13.4
Health Administration 2.0
Inpatient medical services 6.9
Outpatient medical services 4.2
Pharmaceutical services 2.5
Other health-related expenses 1.3
Long-term care expenses 4.3
Old Age Public Pension 30.4
Other Public Pension 0.9
Incapacity Benefits 1.7
Sickness Benefits 0.4
Family Policy 6.9
Active Labor Policy 0.0
Unemployment Benefits 3.4
Social Housing 0.2 Deficit 3.00
Other Social Expenses 1.5
Interest payments 7.0
Total 118.6 Total 118.6
Source: Own calculations based on OECD (2007a, 2007b, 2008)
Expenditure encompass in expenses for general public services, defense, public order and safety,
economic affairs and environmental protection, education, housing and cultural activities. The
8

entry “Social Protection” which is as such reported in OECD (2008) is divided into nine
subcategories such as old age pension or family policy after OECD (2007b). Health expenditure
on which this paper focuses are divided into five subcategories, namely the in- and outpatient
sector, drug expenses, long-term care and miscellaneous expenditure. Altogether 31 entries of
revenues and expenditure are distinguished. Our resulting budget is shown in table 3. In total,
revenues were 115.6 billion Euros while public expenditure altogether made 118.6 billion Euros.
This results in a deficit of 3.00 billion Euros. This deficit minus interest payments on the Austrian
gross financial liabilities which lay around 7.0 billion Euros led to a primary deficit (surplus) equal
to 3.9 billion Euros.
3.3 Micro-Profiles
Entries like defense or homeland security which are not paid or consumed in an age-specific way
are distributed with a flat per capita profile. Age- and (where applicable) sex-specific micro-
profiles stem from various sources: Health expenditure profiles are taken from Hofmarcher,
Riedel and Röhrling (2002). Income and capital income tax profiles as well as the age-specific
structure of social security contributions are calculated using data from Statistik Austria (2005a).
Data to calculate the VAT profile is available upon request from Statistik Austria’s (2002)
consumer survey. Profiles related to public pension payments and incapacity benefits stem from
Pensionsversicherungsanstalt (2005). Furthermore , unemployment benefits (AMS (2005)), social
housing (Synthesis (2005)) and education (Statistik Austria (2005b)) are also distributed in an
age-specific way. All profiles are plotted in the appendix in table A-1. For the budget item
“Family Policy” due to missing data we assume that the incidence of the payments depends on
the children which we define equal from an age of 0 to 20 years. We know that this is a crucial
assumption as often younger children get higher benefits and the incidence could also depend
on the parents (e.g. maternity leave). However, we think that it is a reasonable and transparent
assumptions and should bias our results only slightly as family policy accounts only for about six
percent of the budget.
3.4 Growth and discount rate
According to own calculations based on OECD (2006a, 2006b) average growth of GDP per capita
over the last 15 years was around 1.9 per cent while the average long-term interest rate
(measured by the ten-year Austrian government bond) lay around 4.3 per cent. For reasons of
comparison with the other countries discussed later we opt in our standard setting for a growth
rate of 1.5 per cent ( ) and a discount rate of 3.0 per cent ( ). To cover the differences between
the actual development and our standard scenario, a sensitivity analysis is undertaken in the
appendix and discussed in one of the later sections. Differing growth paths and interest rates
g r
9

between the countries are generally not considered but can be examined as well via a sensitivity
analysis.
3.5 Fiscal Policy and Business Cycle
Our analysis reflects the fiscal policy which is represent in the public budget shown in table 3.
Except for the three public pension reform measures of 2002, 2003 and 2004 as well as the
health reform of 2005 we do not include any long-term effects of recent reforms (as for example
the tax reform of 2004 and 2005) or changes of the Austrian fiscal policy. Furthermore we do not
account for business cycle effects in the public budget which surely bias our outcomes.
However, as Benz and Hagist (2008) have shown at least for Germany business cycle effects are
negligible. As Austria has similar automatic stabilizers as Germany we think that also in the
Austrian case business cycle effects should be only small. A simple accounting of business cycle
effects as in Ministry of Finance Norway (2008) is not leading to the desired results as we want to
show which are the major drivers of the fiscal gap and how much is the primary surplus
responsible.
4. The sustainability of Austria’s fiscal system
4.1 Current Reforms of the Social Insurance System
Austria’s social system was founded already during the times of the K&K-monarchy at the end of
the 19th century. Then as today it shows similarities to the Bismarckian system of Germany. One
cornerstone of the system is the principle of corporatism that leads to complex systems of
control and supervision in the selected branches of the social system.
4.1.1 Austria’s Public Pension System
The Austrian public pay as you go-pension system is mandatory for every worker except for a
small group of self-employed and persons with no or a very low income. Revenues are financed
by three sources: Firstly, contributions by the insured which are wage-based, secondly transfers
by other social security branches (for example unemployment insurance) and thirdly an
allowance by the central government out of its general budget to cover the gap between
revenues and expenditure.6 In 2005, pension related expenditure relative to GDP lay around 10.1
per cent. Without reform this ratio is expected to rise to 12.5 per cent until 2050.7 This is why the
Austrian government introduced pension reform measures in three acts between 2000 and
2005. These laws included some highly controversial discussed measures as reductions for early
retirement and the stepwise equalization of the statutory retirement age for men and women.
6 For a general overview of Austria’s public pension system, see Buczolich et. al (2003) and OECD (2007c). 7 See Stefanits and Königsreiter (2005).
10

Although Austria still has a relatively high pension level, the last reform proposal caused the first
national strike since World War II. In our analysis with Generational Accounts in the forthcoming
sections we include the following measures in our scenarios: Firstly, we assume actuarially fair
discounts for early retirement as in the reform of 2000, secondly we model the change of the
assessment period from the best 15 years to the best 40 years which was included in the 2003
reform and thirdly we model the cuts in the accrual rates as in the reform of 2004. Furthermore
we take into account the two-step harmonization of the retirement age for men and women and
the new indexation of pension benefits according to the consumer inflation rate. To do that we
manipulate the profiles according to the reform-measures. For example the change of the
assessment period is modeled via an income profile which was the base for the income tax
profile. For the indexation of benefits to inflation, we manipulated the growth rate g
accordingly. The retirement age is also modeled via a manipulation of profiles. Knell et al. (2006)
and Knell (2005) give good overviews over the detailed measures taken in the pension reforms
of 2000, 2003 and 2004.
4.1.2 Austria’s Social Health Insurance System
Austria’s social health insurance system covers over 99 percent of its population and thus can be
classified as one with universal coverage. Like in most continental European systems, providers
of treatment are accredited by the authorities but can operate as private entities especially in
the case of outpatient care. Prices are regulated or negotiated with the corresponding
governmental bodies. The system is financed by contributions and taxes. Two thirds of the 14.9
billion Euro expenditure in 2004 are accommodated by the social health insurance, the
remaining third by the states and the central government.
As in the case of its public pension system, Austria’s government introduced a health reform
proposal that already became law in 2005. The health care reform 2005 increased revenues and
tried to lower expenditure by certain measures that are illustrated in table 3.8 We implemented
the certain instruments directly in the budget of the year 2005 and the forthcoming years in
purchasing power of our base year. In sum the reform has a yearly net effect of about one billion
Euro. Table 4 also shows the different categories/entries that are affected by the reform. As we
have no information how for example the rise of co-payments for pharmaceuticals will affect the
age- and sex-specific consumption of pharmaceuticals we assume that they will do so in an
average way i.e. we just lower the scaled micro-profiles in relatively equal amounts (by the same
percentage). This assumes that the rationing will affect every cohort male and female in the
relative same amount. Furthermore we hold the modeled effects constant over the years. This
may seem as rather strong assumptions however with no more detailed information at hand the
8 A good overview about the certain measures of the health care reform can be found in Hofmarcher (2005).
11

first one seems hardly to handle otherwise while the latter could be seen as a policy scenario as
the estimations of the overall effects in table 4 are. One could also argue that the effects
diminish after a certain amount of time, however, our assumption seems plausible in almost the
same manner.
Table 4: Austria’s Health Care Reform 2005
Revenues Enhancement/Expenditure Cut
Amount in Mio. Euros Budget Position Source
Rise of wage-based contribution rate
120 Social Security Contributions
Hofmarcher (2005)
Rise of assessment threshold 30 Social Security
Contributions Hofmarcher (2005)
Rise of tobacco tax 90 Value Added Tax Hofmarcher (2005)
Rise of co-payments for pharmaceuticals 18 Pharmaceutical
services Own calculations
based on Hofmarcher (2005) and Hofmarcher,
Riedel and Röhrling (2005)
Rise of co-payments for inpatient treatment 7 Inpatient medical
services
Cutting payments for eyeglasses 35 Other health-related expenses Hofmarcher (2005)
Rise of contributions for elderly 125 Social Security Contributions Hofmarcher (2005)
Cutting general expenditure 300
Outpatient, inpatient and pharmaceutical medical
services; other health-related&long-term
expenses
Nationalrat (2005)
Cutting spending for pharmaceuticals 262 Pharmaceutical
services Rauch-Kallat (2005)
Source: See column four
4.2 Sustainability Analysis
In this section we want to present the intergenerational redistribution through the Austrian
fiscal policy per se and the changes due to the presented reform measures. Furthermore we
want to discuss how the reforms will affect Austria’s fiscal sustainability along our presented
sustainability indicators i.e. the fiscal gap, the revenue and transfer gaps and the future
generations’ burden.
4.2.1 Generational Accounts pre- and after reforms
Figure 1 shows the Austrian Generational Accounts for three different scenarios. First, we
present the pre-reform accounts, than the accounts including the pension reforms described
above and finally the accounts with both reform measures i.e. health and pension reforms. All
12

three scenarios plotted in figure 1 look like the usual sinus-shaped pattern.9 Young generations
except the ones very close to their birth have to pay a relatively high amount of net taxes over
their remaining lifecycle.
Figure 1: Generational Accounts of Austria’s Public Sector (Population Scenario Medium Variant, g=1.5%, r=3%)
Source: Own calculations
-400
-300
-200
-100
0
100
200
0 5 10 15 20 25 30 35 40 45 50 55 60 65 70 75 80 85 90 95 100
Th
ou
san
d E
uro
s
Age in 2004
Pre-Reform Pension Reform Health and Pension Reform
It is the cohort of 28-year-olds who has to remit the maximum net payment in every scenario.
The main beneficiary generation is the 65-year-old. As one can see, every representative
newborn receives over at least 74,000 Euros more over his/her lifecycle than he/she has to
contribute to the public budgets. Alone from this fact it can be stated that a higher fertility rate
per se will not cure Austria’s coffers but rather will hurt it. However, the pension and health
reform have reduced the net transfers of all living generations significantly. The question now is
if all generations are affected in the same way or which generations are mostly affected by the
reform measures. As one cannot compare generational accounts between living generations as
only the remaining life-cycle is considered we have computed annuities out of the differences
between pre- and post-reform generational accounts to derive which generations are affected in
which way by both pension and health reform (figure 2).
The annuities in figure 2 show a very interesting pattern. The black columns are the surplus load
of generations induced by the pension reform while the shaded columns stand for the surplus
9 The sinus-shaped characteristics of the Generational Accounts can be explained by the age-specific economic activity and by the discounting of payments/benefits. The discounting is also responsible for the decreasing benefits after 65 years. P.a. older generations receive more but not over the remaining lifecycle.
13

loads induced by the health reform. While the surplus loads increase in the case of the health
reform from the present newborn until the generation of 90 years olds and decreases due to the
rapidly falling life expectancy afterwards, the pension reform obviously has no clear pattern
which generations are hurt more than others. Indeed the generations less hurt are the ones very
close to retirement while the generations/cohorts which have just filed for retirement are the
ones with the largest surplus load. This is due to the change of indexation from productivity to
price inflation and that the generations around 65 and 70 years receive the absolute highest
pensions. Also relatively highly hurt are the cohorts from 45 years and less, however, the same
clear pattern as for the health reform can be observed. As retirement is closer, the discounting of
benefits and so reform outcome is less large than for younger cohorts. The cohorts between 55
and 59 years are the least hurt ones. This is because most reform measures i.e. the increase in the
statutory retirement age will take effect after these cohorts claimed pension benefits and
because most parts of the 2004 reform are only designed for cohorts born 1955 and later. In total
one could say that the surplus load for all cohorts are severe especially the ones induced by the
pension reform. But are they enough to make Austria’s fiscal policy sustainable?
Figure 2: Reform-induced burden as annuities (Population Scenario Medium Variant, g=1.5%, r=3%)
Source: Own calculations
0
500
1000
1500
2000
2500
3000
3500
0 5 10 15 20 25 30 35 40 45 50 55 60 65 70 75 80 85 90 95 100
Eu
ros
Age in 2004
Pension Reform Health Reform
4.2.2 Fiscal Gaps and Sustainability Indicators
Weighting the generational accounts of living and future generations with the expected cohort
size and summing all up given the growth and discount rate leads us to our first sustainability
indicator, the fiscal gap plotted in figure 3.
14

Figure 3: Sustainability of Subsystems in Austria (Population Scenario Medium Variant, g=1.5%, r=3%)
634.4
508.9
237.8
62.8
‐100.2‐74.9
248.8
172.2188.9
62.8
-100.2-74.9
-200
-100
0
100
200
300
400
500
600
700
Public Sector Penions Health Public Debt Primary Surplus Residual
Per cen
t of GDP 20
04
Pre-Reform Post-Reform
Source: Own calculations
The value of the fiscal gap for the whole public sector pre-reform is 634.4 per cent of base year’s
GDP which can be divided into the following: explicit debt of 62.8 per cent of GDP, health-
associated10 debt with 237.8 per cent of GDP and 508.9 per cent of GDP associated with the
public pension scheme. Adding the intertemporal assets of 100.2 per cent of GDP which are
caused by the primary surplus (see table 2) leaves necessary intertemporal assets of 74.9 to
balance our calculations. This is a remarkable result. Evidently Austria’s public finances excluding
health and public pensions are overfunded. If one includes both reform measures (the current
status quo) the implicit debt of the heath sector shrinks to 188.9 per cent of GDP and the implicit
debt of the public pension scheme to 172.2 per cent. As the intertemporal assets stay the same,
the overall fiscal gap is post reform at 248.8 per cent.
Our second indicator is the future generation’s burden. To calculate this indicator, the
intertemporal public liabilities and the number of people in future generations are set in
proportion to each other (equation 9). This indicator implies that the entire adjustment assigns
to future generations. The burden for future generations can be illustrated as an absolute
difference between the generational account of the base-year and the generational account of
the one year after base-year born agent (both not including the public debt). The future born
10 The public health sector contains in our definition health related administration expenditure, in- and outpatient services, pharmaceuticals, sickness benefits and other health related expenditures. To isolate the health and public pension schemes on the revenue side, we assume that expenditures in the base year are met by revenues. Furthermore revenues are distributed as equal shares of the overall budget, i.e. as the income tax pays 21 per cent of the public activities it also pays 21 per cent of public health expenditure in our assumed scenario.
15

generation in Austria pay in the post-reform scenario 22,100 Euros per person more in taxes over
their entire life-cycle than they will receive in transfers. On the other hand, the base-year born
agent gets a net-transfer over his/hers remaining life cycle of about 74,000 Euros. Therefore, the
future born agent has to carry a quite large burden compared to the corresponding living
generation. This is also reflected in our last two sustainability indicators, the revenue and transfer
gap. Austria’s government would have to raise all taxes and duties by 7.3 per cent or could
decrease all transfers by 6.9 per cent. Table 5 gives an overview about the sustainability
indicators pre- and post-reform.
Table 5: Overview of sustainability indicators (Population Scenario Eurostat, g=1.5%, r=3%)
Sustainability Indicator Pre-Reform Post-Reform
Fiscal Gap (in % of GDP of 2004) 634.4 248.8
Future Generations’ Burden (in Euros) 239,900 74,000
Revenue Gap (in %) 19.5 7.3
Transfer Gap (in %) 15.9 6.9
Source: Own calculations
Former studies of the sustainability of the Austrian fiscal policy conclude the same qualitative
results as our analysis. The quantitative results between our study and the work of Keuschnigg et
al. (2000, 2001) and Mayr (2005) however differ quite substantially. The discrepancy can be
explained by different base years and different assumptions on the growth and discount rate
spreads and the development of the Austrian population as well as the missing reform
measures. Mayr (2005) reports a fiscal gap of 167.5 per cent of GDP in 1998 given a discount rate
of 5 per cent and a growth rate of 1.5 per cent. If we set our parameters equally we derive a fiscal
gap of 92.8 per cent (given a different base year). As Mayr (2005) does not include the
mentioned reforms we can state that the results are fairly close (as our outcome without reform
is a fiscal gap of 217.4 per cent). Keuschnigg et al. (2000, 2001) report with a discount rate of 4.5
per cent and a growth rate of 2 percent a fiscal gap of 276.9 percent of the 1995 GDP.
4.2.2 Sensitivity Analysis
To analyze the sensitivity of our results relating to our exogenous parameters interest and
growth rate, and , and to our different population projections we calculate 15 different
cases. Except our standard scenario in the post-reform version, we test four more different
settings around this combination:
r g
g = 1.5 vs. =2.5 per cent, r g = 1.5 vs. = 3.5 per cent, r g = 2.0
vs. = 3.0 per cent and r g = 2.0 vs. = 4.0 per cent. Furthermore, we distinguish, how discussed
above, between four possible population scenarios namely Eurostat, medium, high and low
r
16

variant. Table 6 shows the fiscal gap for all possible population scenarios combined with the
described growth and interest rate settings. How can be easily seen, the extent of the fiscal gap
and in the case of Austria depends on the difference between the growth and interest rate. As
the spread widens the fiscal gap decrease, i.e. is better, in all of the four scenarios. Due to the
pension reform and the indexing of pension benefits to prices, also the absolute value of the
growth rate is relevant. Therefore a higher growth rate induces a lower fiscal gap.11
Table 6: Sensitivity Analysis of the Fiscal Gap (in % of GDP of 2004)
Eurostat Medium Variant High Variant Low Variant
g=1.5% r=2.5% 386.0 434.7 888.2 264.3
g=1.5% r=3.5%
178.7 208.7 316.5 147.1
g=1.5% r=3.0% 248.8 287.6 485.9 193.2
g=2.0% r=3.0% 296.7 346.0 737.5 210.3
g=2.0% r=4.0%
135.7 164.5 259.6 112.5
Source: Own calculations
Regarding our four population projections there is no clear picture. Regarding the fiscal gap it
can be stated that the low variant is in all cases superior to the other three, however, this is not
very meaningful as with different demographic developments the numerator of the fiscal gap is
affected but not the denominator (see also section 5).12 That is why the other indicators show
different pictures but it is not clear cut. However, the scenarios with Eurostat are always superior
given every indicator apart from the fiscal gap. This is very interesting as the Eurostat projection
is a middle ground between the high and low projection and relatively close to the medium
variant. A sensitivity analysis given all indicators can be found in the appendix table A-2.
5. A comparison with Germany and Switzerland
Austria’s problems concerning ageing and fiscal sustainability are quite similar to the ones of
other countries. The relevant research question is if there are quantitative differences between
countries, and if how large they are and why they occur. We try to answer the first two questions
and want to discuss the latter. Our choice for comparison, Germany and Switzerland, is based on
the fact that all three countries have similar cultural and economical backgrounds and
11 In our framework an indexing of pension benefits to prices is equal with a pension-specific growth rate of zero. As the overall growth rate g is higher in absolute terms, the growth spread between revenues and pensions is widened which causes smaller fiscal gaps. 12 As the absolute value of GDP in the future is dependent on the size of the population, a comparison with a constant value as GDP in the base year would bias the conclusions.
17

comparable welfare and income levels. Outcomes for Germany and Switzerland are taken by
Hagist et al. (2008). This study is also based on the public budgets of the year 2004 and only
includes pension as well as health reforms.
5.1 Indicators and Analysis
Figure 4 shows the fiscal gaps for the three countries. According to the comparison of this
indicator, Austria lies between Germany and Switzerland. Austria is clearly better off than
Germany with a fiscal gap of about three times their GDP. Switzerland’s however has even a
long-term surplus with nearly 100 per cent of GDP.
However, there are flaws in this analysis, especially if you compare between the countries which
is our stated goal. For an international comparison the fiscal gap might not be appropriate for
several reasons. Firstly, it is an indicator that reacts wildly for changes of the parameters growth
and discount rate or more precisely to the growth and discount spread.13 Secondly, all of the
three countries have different demographic developments which will determine their future
economic power and so their ability to pay their debts. With a stagnating population, the
economic power of Austria will differ in the future compared to Germany’s where the population
will shrink not only in size but even more in its workforce which co-determines GDP. An
appropriate indicator for an international comparison should take these facts into account.
Figure 4: Sustainable gaps in comparison (Medium Population Scenarios, g=1.5%, r=3%)
Source: Own calculations
62.8 62.5 55.2
186
252.6
-155
248.8
315.1
-99.8
-300
-200
-100
0
100
200
300
400
Austria Germany Switzerland
Perc
ent
of G
DP
in
2004
Implicit Liabilities Fiscal Gap
13 One could solve this problem by a thorough sensitivity analysis but it still would be nice to have a robust indicator for comparison. We think that the fiscal gap for one country alone and for political work is a valuable indicator since it is easy to understand and related to other fiscal indicators like the debt quota.
18
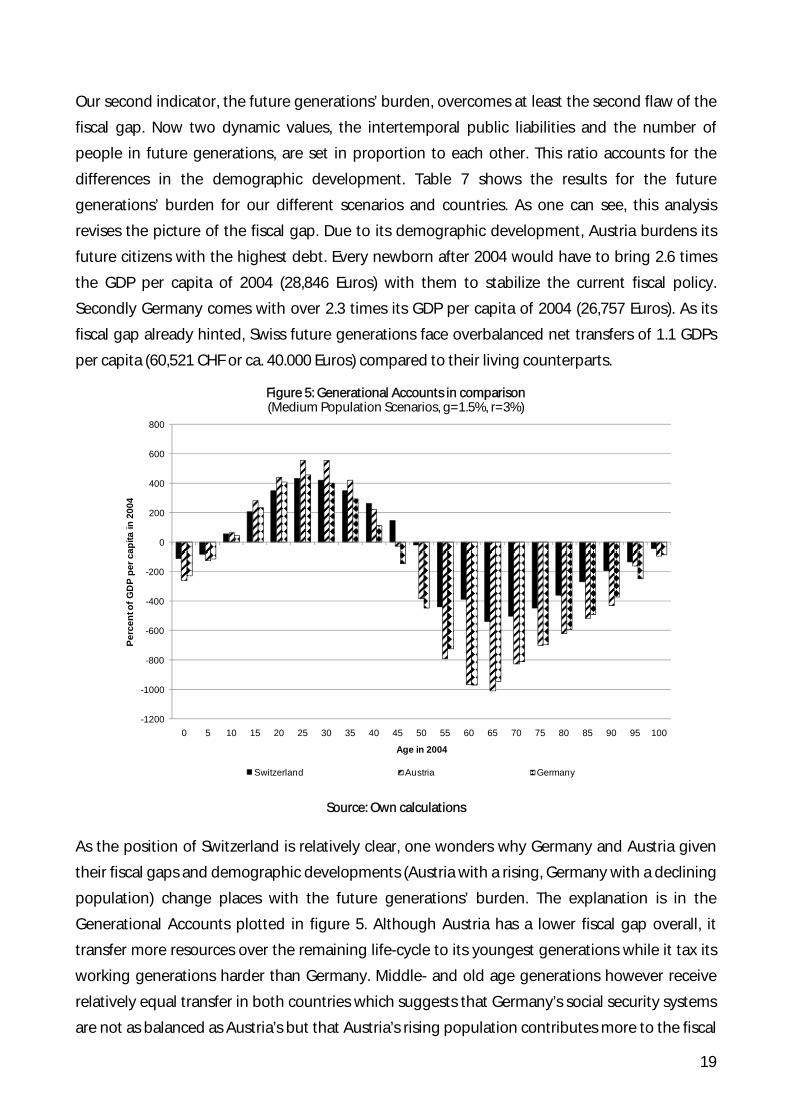
Our second indicator, the future generations’ burden, overcomes at least the second flaw of the
fiscal gap. Now two dynamic values, the intertemporal public liabilities and the number of
people in future generations, are set in proportion to each other. This ratio accounts for the
differences in the demographic development. Table 7 shows the results for the future
generations’ burden for our different scenarios and countries. As one can see, this analysis
revises the picture of the fiscal gap. Due to its demographic development, Austria burdens its
future citizens with the highest debt. Every newborn after 2004 would have to bring 2.6 times
the GDP per capita of 2004 (28,846 Euros) with them to stabilize the current fiscal policy.
Secondly Germany comes with over 2.3 times its GDP per capita of 2004 (26,757 Euros). As its
fiscal gap already hinted, Swiss future generations face overbalanced net transfers of 1.1 GDPs
per capita (60,521 CHF or ca. 40.000 Euros) compared to their living counterparts.
Figure 5: Generational Accounts in comparison (Medium Population Scenarios, g=1.5%, r=3%)
-1200
-1000
-800
-600
-400
-200
0
200
400
600
800
0 5 10 15 20 25 30 35 40 45 50 55 60 65 70 75 80 85 90 95 100
Perc
ent o
f GD
P pe
r cap
ita in
200
4
Age in 2004
Switzerland Austria Germany
Source: Own calculations
As the position of Switzerland is relatively clear, one wonders why Germany and Austria given
their fiscal gaps and demographic developments (Austria with a rising, Germany with a declining
population) change places with the future generations’ burden. The explanation is in the
Generational Accounts plotted in figure 5. Although Austria has a lower fiscal gap overall, it
transfer more resources over the remaining life-cycle to its youngest generations while it tax its
working generations harder than Germany. Middle- and old age generations however receive
relatively equal transfer in both countries which suggests that Germany’s social security systems
are not as balanced as Austria’s but that Austria’s rising population contributes more to the fiscal
19

sustainability problem than it resolves. That is also why the future generations’ burden is higher
in Austria than in Germany as future generations would have to give up already larger transfers
in the first country. Switzerland is in every respect far more balanced than both its neighbors
with relatively low net transfers to newborns (and so future generations) and relatively high net
taxes of working generations, however all quite low on an absolute level given its economic
strength (i.e. its GDP per capita).
Again the problem with the indicator future generations’ burden is that it is, like the fiscal gap,
very volatile to changes of the growth-discount-spread. That is why we report two more
indicators, the so called revenue and transfer gap, which are both very well comparable between
the countries because they are sensitive to the different demographic developments and so on
the differences in future economic power and because they are not sensitive to changes of the
growth and discount rate. The revenue gap states how taxes and duties would have to rise
immediately for living and future generations to bring the current fiscal policy right on a
sustainable track. Analogous, the transfer gap reports the proportion of which benefits and
statutory transfers would have to be cut back immediately to reach a sustainable level. Results
for all indicators are shown in table 7 together with the initial tax and transfer quotas:14
Table 7: Sustainability indicators of six OECD countries (Eurostat Population Projections, g=1.5%, r=3%) Indicator Switzerland Austria Germany
Future generations’ burden (in GDP per capita 2004) -1.1 2.6 2.3
Tax quota in 2004 (in per cent of GDP) 34.8 49.6 43.4
Revenue Gap (necessary enhancement in per cent) -3.6 7.3 14.6
New resulting tax quota 2004 (in per cent of GDP) 33.5 53.3 49.7
Transfer quota in 2004 (in per cent of GDP) 35.9 51.0 47.1
Transfer Gap (necessary reduction in per cent) -3.9 6.9 12.4
New resulting transfer quota 2004 (in per cent of GDP) 37.3 47.4 41.3
Source: Own calculations
All indicators show that relatively spoken Germany faces the biggest demographic challenge,
not only because of its demographic development but rather due to the design of its social
security system. Revenues must rise about 14.6 per cent from their current level which would
lead to a new tax quota of 49.7 per cent of GDP (compared to 43.4 without this uprating).15
14 Note that the initial transfer quota is calculated excluding interest payments. 15 This demonstrates also why the results of the revenue and transfer gap have to be seen in a relative way because Austria already has a tax quota of 49.7 per cent of GDP without any augmentation of the tax level. For large and middle-sized economic powers like Germany such rises in the level of taxation would also probably result in changes in relative factor prices (depending on which taxes would be increased). Generational Accounting cannot catch these effects. For small open economies like Austria and Switzerland, factor prices would probably not change and so our results could be taken as given. For an analysis of Generational Accounting in General Equilibrium, see Fehr and Kotlikoff (1996), Raffelhüschen and Risa (1997) and Börstinghaus and Hirte (2001).
20

Transfer cuts turn out not to be as large as revenue increases because of their demographic
profile. While taxes and duties are mostly paid by the working generations, the transfers are
mainly received by the elderly to whom the so called baby boomer generations will also belong
in a few years. Due to this demographic leverage effect, transfer cuts do not have to be as large
as revenue increases. Austria comes in second with revenue increases of 7.3 per cent. The tax
quota would then be around 53.3 per cent of GDP and so even higher than in Germany. Again,
transfer cuts would not have to be as large as the tax changes but the difference between
revenue increases and transfer cuts is not as large as in case of Germany. Switzerland remains in
its relative sustainable position and could even cut taxes about 3.6 per cent or increase its
spending of about 3.9 per cent.
5.2 Discussion
As one can see the sustainability parameters differ quite substantially between the three
analyzed countries. One cause for this which cannot be seen in the above analysis is that in the
case of Switzerland, only investment in the health infrastructure and subsidies for health
premiums of low-income households are considered as public health expenditure in the
international statistics we use. As Hagist (2008) shows, if one considers the mandatory health
sector as part of the Swiss public system, the fiscal gap increases from intertemporal assets to
nearly zero. However, as it is not clear how one should handle the Swiss health sector, we
decided to go with the measurement presented in the OECD statistics.
Another difference between the countries which lead to differences in the sustainability is
clearly the different demographic developments. Switzerland may be the oldest economy of the
three in 2004, however with a relative high net migration in Switzerland and a rather low one in
Germany, the latter will take over. Austria is in the middle with also a relatively high net
migration. Furthermore it seems that both Switzerland and Austria tax younger generations
between 20 and 40 years relative more that it is the case in Germany. This is very interesting and
probably the main cause for lower fiscal gaps, at least in the comparison of Germany and Austria.
Switzerland is so sustainable due to its pension benefits which are indexed only to the half of
productivity growth which is in contrast to both other countries where beneficiaries nearly get
the full productivity growth rate.
The most missing part in Generational Accounting and especially in an international comparison
is the aspect of quality. Austria may look more sustainable than Germany but it has also already a
higher expenditure and tax ratio than the bigger neighbor. The relevant question would be if
Austrians given their higher taxes are getting better services and living standards than their
German counterparts. This is especially relevant if one compares the sustainable levels of taxes
21

or public expenditure. Unfortunately this question remains unsolved and one could only state
that Austria is more sustainable than Germany, however, for already higher prices.
6. Summary and Conclusion
The Austrian population will pass through an ageing process during the next decades which
causes that the old-age-dependency ratio rises from currently 27 per cent up to 58 per cent in
2060. This ageing population induces increasing expenditures on old-age and disability
pensions together with health and long-term care benefits while the public revenues from wage
taxes and social contributions will decrease. At the moment Austria’s budget is in (primary)
surplus but given the developments described above one wonders if such budget surplus could
still be seen in the future? One tool to answer such questions is Generational Accounting which
was set up in the early 1990s to evaluate if a country’s fiscal policy is sustainable over the long-
run. To be fair, Austria’s politicians have already addressed the problems of ageing with three
reform measures for the public pension system in 2001, 2003 and 2004 and one health reform in
2005. However, even while these reform measures reduce the burden on future generations
significantly, Austria finds itself still with a fiscal gap of nearly 2.6 times its GDP of 2004. This is
mainly due to two factors: Firstly, despite its pension and health reforms Austrian baby-boomers
will still get high net transfers over their remaining life-cycle and secondly present and future
newborns burden the fiscal system with quite significant net transfers over their life. These
outcomes may differ in quantity given different set of parameters but are not challenged
qualitatively.
In comparison with its two German-speaking neighbors, Germany and Switzerland, Austria gets
the silver medal when it comes to sustainability. Switzerland is far ahead facing intertemporal
assets rather than accumulating debt. This is due to the accounting of public health expenditure
and the Swiss pension system, which only gives half the productivity growth to its beneficiaries.
However, Austria is still slightly better off than Germany given the reform measures described
above but for the price of higher tax rates. As Generational Accounting does not cover any
growth effects of higher taxes or net spending on education (one cause for the only minor
difference between Austria and Germany with Austria outspending the bigger neighbor by
nearly 1.5 times), it remains for future research if really Austria or Germany are better off in the
long-run given their current fiscal policy.
22
References
AMS (2005), Jahresdaten und Zeitreihen, Vienna.
Benz, U. and C. Hagist (2008), Konjunktur und Generationenbilanz - Eine Analyse anhand des HP-Filters, Jahrbücher für Nationalökonomie und Statistik, 228(4), 299-316.
Benz, U. and S. Fetzer (2006), Indicators for Measuring Fiscal sustainability: A Comparison of the OECD Method and Generational Accounting, FinanzArchiv, 62 (3), 367-391.
Bonin, H. (2001), Generational Accounting: Theory and Application, Berlin.
Börstinghaus, V. and G. Hirte (2001), Generational Accounting versus Computable General Equilibrium, FinanzArchiv, 58 (3), 227-243.
Buczolich G., B. Felderer, R. Koman and U. Schuh (2003), Pension Reform in Austria, in: Tausch A. (ed.): The pillars of Wisdom – A Reader on Globalization, New York.
Fehr, H. and L. Kotlikoff (1996), “Generational Accounting in General Equilibrium,” FinanzArchiv, 53 (4), 1-27.
Fetzer, S. (2006), Zur nachhaltigen Finanzierung des gesetzlichen Gesundheitssystems, Frankfurt.
Hagist, C., S. Moog, B. Raffelhüschen and J. Vatter (2008), Ehrbare Staaten? Die Ergebnisse der Generationenbilanzierung im internationalen Vergleich, Discussion Paper Series Forschungszentrum Generationenverträge, No. 34.
Hagist, C. (2008), Demography and Social Health Insurance: An International Comparison Using Generational Accounting, Baden-Baden: Nomos.
Hofmarcher M. and H. Rack (2006), Health Systems in Transition: Austria, Copenhagen.
Hofmarcher, M. (2005), Austrian Health Reform 2005: Agreement reached, Health Policy Monitor, 4.
Hofmarcher M., M. Riedel and G. Röhrling (2005), Ressourcenverbrauch in der EU: Sollte Österreich westlicher werden?, Health System Watch, 2.
Hofmarcher M., M. Riedel and G. Röhrling (2002), Nachfragemodell Gesundheitswesen Teil I, Die Schätzung der Gesundheitsausgaben aufgrund der demografischen Entwicklung, Vienna.
Keuschnigg, C., M. Keuschnigg, R. Koman, E. Lüth and B. Raffelhüschen (2001), Intergenerative Inzidenz der österreichischen Finanzpolitik, in: Theurl, E., H. Winner and R. Sausgruber (eds.), Kompendium der österreichischen Finanzpolitik, Vienna, 263-295.
Keuschnigg, C., M. Keuschnigg, R. Koman, E. Lüth, and B. Raffelhüschen (2000), Public Debt and Generational Balance in Austria, Empirica, 225-252.Knell, M., W. Köhler-Töglhofer and D. Prammer (2006), The Austrian Pension System – How Recent Reforms Have Changed Fiscal Sustainability and Pension Benefits, Monetary Policy & the Economy, Q2/06, 69-93.
Knell, M. (2005), Demographic Fluctuations, Sustainability Factors and Intergenerational Fairness – An Assessment of Austria’s New Pension System, Monetary Policy & the Economy, Q1/05, 23-42.
Mayr, K. (2005), The fiscal impact of immigrants in Austria - a generational accounting analysis, Empirica, 181-216.
Ministry of Finance Norway (2008), Storting .melding nr. 1 (2006-2007) Nasjonalbudsjettet 2007, Oslo.
Nationalrat (2005), Bundesgesetzblatt für die Republik Österreich, 73. Vereinbarung gemäß Art. 15a B-VG über die Organisation und Finanzierung des Gesundheitswesens, Vienna.
OECD (2008), General Government Accounts, Paris.
23

OECD (2007a), Revenue Statistics, Paris.
OECD (2007b), OECD Social Expenditure Statistics, Paris.
OECD (2007c), Economic Survey of Austria 2007, Paris.
OECD (2006a), OECD Health Data 2006, Paris.
OECD (2006b), OECD Economic Outlook 79, Paris.
Pensionsversicherungsanstalt (2005), Jahresbericht 2004, Vienna.
Raffelhüschen, B. (1999), Generational Accounting: Method, Data, and Limitations, European Economy, Reports and Studies, 6, 17-28.
Raffelhüschen, B. and A. Risa (1997), Generational Accounting and Intergenerational Welfare, Public Choice, 93 (1), 149-163.
Rauch-Kallat, M. (2005), Redeunterlage von Frau Bundesministerin Maria Rauch-Kallat, Pressekonferenz „Aktuelle gesundheitspolitische Fragen“, Vienna.
Statistik Austria (2008), Standard-Dokumentation Metainformationen (Definitionen, Erläuterungen, Methoden, Qualität) zu Bevölkerungsprognosen, Vienna.
Statistik Austria (2007), Demographisches Jahrbuch 2006, Vienna.
Statistik Austria (2005a), Statistik der Einkommensteuer 2002, Vienna.
Statistik Austria (2005b), Öffentliche Bildungsausgaben nach Sektoren 2002, Vienna.
Statistik Austria (2002), Verbrauchsausgaben, Ergebnisse der Konsumerhebung 1999/00, Vienna.
Stefanits H. and K. Königsreiter (2005), Finanzielle Auswirkungen der Pensionsreform 2004 – auf dem Weg zu einem nachhaltigen Pensionssystem?, Soziale Sicherheit, 233-250.
Synthesis (2005), Notstandshilfebezieher im Jahr 2003, Vienna.
24

Appendix
Table A-1: Austrian micro-profiles
Income Tax
0 10 20 30 40 50 60 70 80 90 100
Men Women
Social Security Contributions
0 10 20 30 40 50 60 70 80 90 100
Men Women
Wage Tax
0 10 20 30 40 50 60 70 80 90 100
Men Women
Capital Income Tax
0 10 20 30 40 50 60 70 80 90 100
Men Women
0 10 20 30 40 50 60 70 80 90 100
Value Added Tax
Men Women
Government Consumption
0 10 20 30 40 50 60 70 80 90 100
Men Women
Outpatient medical services
0 10 20 30 40 50 60 70 80 90 100
Men Women
Inpatient medical services
0 10 20 30 40 50 60 70 80 90 100
Men Women
Source: See section 3.3
25

Continuation Table A-1
Pharmaceutical services
0 10 20 30 40 50 60 70 80 90 100
Men Women
Long-term care
0 10 20 30 40 50 60 70 80 90 100
Men Women
Education
0 10 20 30 40 50 60 70 80 90 100
Men Women
Public Pension
0 10 20 30 40 50 60 70 80 90 100
Men Women
Unemployment Benefits
0 10 20 30 40 50 60 70 80 90 100
Men Women
Family Policy
0 10 20 30 40 50 60 70 80 90 100
Men Women
Source: See section 3.3
26

27
Table A-2: Sensitivity Analysis – Austrian Public Sector Sustainability Indicators
Spread Indicators Population Projection Eurostat Medium High Low
g=1.5% r=2.5%
Fiscal Gap (in % of GDP) 386.0 434.7 888.2 264.3
Future Generations’ Burden (in % of GDP per capita) 102,210 129,890 117.780 254,920
Revenue Gap (in %) 8.3 9.9 11.8 9.9
Transfer Gap (in %) 7.4 8.7 10.2 8.8
g=1.5% r=3.5%
Fiscal Gap (in % of GDP) 178.7 208.7 316.5 147.1
Future Generations’ Burden (in % of GDP per capita) 90,328 113,490 98,101 163,110
Revenue Gap (in %) 7.1 8.5 10.0 7.5
Transfer Gap (in %) 6.5 7.7 8.5 6.9
g=1.5% r=3.0%
Fiscal Gap (in % of GDP) 248.8 287.6 485.9 193.2
Future Generations’ Burden (in % of GDP per capita) 96,053 121,690 105,890 196,600
Revenue Gap (in %) 7.6 9.1 10.8 8.4
Transfer Gap (in %) 6.9 8.2 9.4 7.6
g=2.0% r=3.0%
Fiscal Gap (in % of GDP) 296.7 346.0 737.5 210.3
Future Generations’ Burden (in % of GDP per capita) 78,469 103,130 97,338 203,000
Revenue Gap (in %) 6.3 7.8 9.7 7.9
Transfer Gap (in %) 5.8 7.1 8.6 7.2
g=2.0% r=4.0%
Fiscal Gap (in % of GDP) 135.7 164.5 259.6 112.5
Future Generations’ Burden (in % of GDP per capita) 68,525 89,253 80,132 124,750
Revenue Gap (in %) 5.4 6.7 8.1 5.7
Transfer Gap (in %) 5.0 6.1 7.3 5.3
Source: Own calculations