THE FERRARA ARC THRUST EARTHQUAKES OF MAY · PDF fileSTRONG-MOTION AND GEOLOGICAL OBSERVATIONS...
11
1 THE FERRARA ARC THRUST EARTHQUAKES OF MAY-JUNE 2012 (NORTHERN ITALY): STRONG-MOTION AND GEOLOGICAL OBSERVATIONS -Report II- NATIONAL CIVIL PROTECTION DEPARTMENT (DPC): RAN Staff: M. Dolce, M. Nicoletti, A. Ammirati, R. Bianconi, L. Filippi, A. Gorini, S. Marcucci, F. Palma, E. Zambonelli GEOSIS-LAB UNI CHIETI: G. Lavecchia, R. de Nardis, F. Brozzetti, P.Boncio, D. Cirillo, A. Romano UNIVERSITY OF TRIESTE: G. Costa, A. Gallo, L. Tiberi, G. Zoppé, P. Suhadolc REGIONE UMBRIA - REGIONAL CIVIL PROTECTION: F. Ponziani, A. Formica INTRODUCTION On 29 May 2012, at 07:00:03 (UTC), Northern Italy was struck by an earthquake of magnitude Ml5.8 (lat 44.851 long 11.086), located nearly 12 km WSW-ward of the 20 May Ml5.9 event. The 29 May event was followed by three relevant aftershocks with Ml≥5.0: two events with Ml 5.3 and Ml 5.2 occurred on 29 May 2012 at 10:55:57 (UTC) and at 11:00:25 (UTC), respectively, and another one on 3 May 2012 at 19:20:43 (UTC). Ten events with magnitude 4.0 ≤ Ml ≤ 5.0, plus several other minor earthquakes, were released few kilometers westward of the epicentral area of the 20 May event. The aftershocks distribution of the 29 May event covers an area extending in the E-W direction for a length of nearly 20 km, between the localities of Novi di Modena and San Felice sul Panaro, close to the buried front of the northward-verging active Ferrara thrust. Twenty stations of the Italian strong motion network (RAN), inclusive of temporary stations (see Mirandola Earthquake Working Group - Report 1), owned and managed by the National Civil Protection Department (DPC), triggered within 50 km from the 29 May event epicentral area (Figs. 1A, 1B, 1D). Taking into account the spatial and temporal evolution of the local seismicity, DPC continued to install temporary stations deploying other 3 strong motion instruments. This second report is aimed at: 1- providing the waveforms of the 29 May 2012 event to engineers, geophysicists geologists and scientists in general, for professional, technical works and scientific purposes; 2- showing the final configuration of the temporary accelerometric network, consisting of 17 stations installed within the epicentral area. Such temporary network represents an extension of the permanent Italian strong motion one and is aimed at supporting the emergency response by the civil protection authorities by improving the network coverage. Two of the new stations (Cento and Carpi) must be considered as permanent. THE FERRARA ARC 2012 SEISMIC SEQUENCE At to-day (8 June 2012), the Ferrara arc seismic sequence is characterized by about 1626 events occurred since 19 May 2012 with magnitude that ranges between ~1 and 5.9. Two relevant events of Ml 5.9 and 5.8 occurred on 20 and 29 May, respectively. Both were located close to the buried front of Ferrara northward-verging active thrust belt (Fig. 1A and Fig. 1B). These two earthquakes were followed by five Ml ≥5.0 events with the amount of cumulative seismic energy released of ~ER= 1.E+14 Joule comparable to the one associated to the main event (06/04/2009 M w 6.3) of the 2009 L’Aquila seismic sequence (ER=2.E+14). The aftershocks distribution covers an area of 800 km 2 extending in the E-W direction for a length of nearly 55 km, between the localities of Fabbrico and Ferrara (Fig. 1D). Specifically, the first relevant event (20 May) occurred in between the small cities of San Felice sul Panaro and Finale Emilia, involving the central part of the Ferrara arc. The second relevant event (29 May) is located west-southwestward with respect to the 20 May event, close to the San Felice sul Panaro locality and the related aftershocks cover the western-central part of the thrust front.
Transcript of THE FERRARA ARC THRUST EARTHQUAKES OF MAY · PDF fileSTRONG-MOTION AND GEOLOGICAL OBSERVATIONS...

1
THE FERRARA ARC THRUST EARTHQUAKES OF MAY-JUNE 2012 (NORTHERN ITALY): STRONG-MOTION AND GEOLOGICAL OBSERVATIONS
-Report II-
NATIONAL CIVIL PROTECTION DEPARTMENT (DPC): RAN Staff: M. Dolce, M. Nicoletti, A. Ammirati, R. Bianconi, L. Filippi, A. Gorini, S. Marcucci, F. Palma, E. Zambonelli
GEOSIS-LAB UNICHIETI: G. Lavecchia, R. de Nardis, F. Brozzetti, P.Boncio, D. Cirillo, A. Romano
UNIVERSITY OF TRIESTE: G. Costa, A. Gallo, L. Tiberi, G. Zoppé, P. Suhadolc
REGIONE UMBRIA - REGIONAL CIVIL PROTECTION: F. Ponziani, A. Formica INTRODUCTION On 29 May 2012, at 07:00:03 (UTC), Northern Italy was struck by an earthquake of magnitude Ml5.8 (lat 44.851 long 11.086), located nearly 12 km WSW-ward of the 20 May Ml5.9 event. The 29 May event was followed by three relevant aftershocks with Ml≥5.0: two events with Ml 5.3 and Ml 5.2 occurred on 29 May 2012 at 10:55:57 (UTC) and at 11:00:25 (UTC), respectively, and another one on 3 May 2012 at 19:20:43 (UTC). Ten events with magnitude 4.0 ≤ Ml ≤ 5.0, plus several other minor earthquakes, were released few kilometers westward of the epicentral area of the 20 May event. The aftershocks distribution of the 29 May event covers an area extending in the E-W direction for a length of nearly 20 km, between the localities of Novi di Modena and San Felice sul Panaro, close to the buried front of the northward-verging active Ferrara thrust. Twenty stations of the Italian strong motion network (RAN), inclusive of temporary stations (see Mirandola Earthquake Working Group - Report 1), owned and managed by the National Civil Protection Department (DPC), triggered within 50 km from the 29 May event epicentral area (Figs. 1A, 1B, 1D). Taking into account the spatial and temporal evolution of the local seismicity, DPC continued to install temporary stations deploying other 3 strong motion instruments. This second report is aimed at: 1- providing the waveforms of the 29 May 2012 event to engineers, geophysicists geologists and scientists in general, for professional, technical works and scientific purposes; 2- showing the final configuration of the temporary accelerometric network, consisting of 17 stations installed within the epicentral area. Such temporary network represents an extension of the permanent Italian strong motion one and is aimed at supporting the emergency response by the civil protection authorities by improving the network coverage. Two of the new stations (Cento and Carpi) must be considered as permanent. THE FERRARA ARC 2012 SEISMIC SEQUENCE At to-day (8 June 2012), the Ferrara arc seismic sequence is characterized by about 1626 events occurred since 19 May 2012 with magnitude that ranges between ~1 and 5.9. Two relevant events of Ml 5.9 and 5.8 occurred on 20 and 29 May, respectively. Both were located close to the buried front of Ferrara northward-verging active thrust belt (Fig. 1A and Fig. 1B). These two earthquakes were followed by five Ml ≥5.0 events with the amount of cumulative seismic energy released of ~ER= 1.E+14 Joule comparable to the one associated to the main event (06/04/2009 Mw 6.3) of the 2009 L’Aquila seismic sequence (ER=2.E+14). The aftershocks distribution covers an area of 800 km2 extending in the E-W direction for a length of nearly 55 km, between the localities of Fabbrico and Ferrara (Fig. 1D). Specifically, the first relevant event (20 May) occurred in between the small cities of San Felice sul Panaro and Finale Emilia, involving the central part of the Ferrara arc. The second relevant event (29 May) is located west-southwestward with respect to the 20 May event, close to the San Felice sul Panaro locality and the related aftershocks cover the western-central part of the thrust front.

2
Figure 1: Seismotectonic framework of the Emilia 2012 earthquake. (A) Schematic map of the Padan-Adriatic Thrust Belt of northern Italy with boundary of the study area (yellow rectangle). (B) Major epicentres of the Emilia 2012 seismic sequence from 19 May to 8 June, with the RAN configuration in the epicentral area. (C) Major historical earthquakes within the study area and macroseismic field of the 1570 earthquake. (C) Seismicity distribution related to the 20 and 29 May main events represented with two different colour scale. Key: pink-scale = time interval 19-29 May 2012; light blue-scale = time interval 29 May (07:00:03 -UTC)- 8 June 2012. FERRARA ARC 29 May EVENT: STRONG MOTION DATA
The main event (Ml 5.8) of the Ferrara arc seismic sequence (29 May 2012, 07:00 UTC) was recorded by 145 RAN, RAF and ISNet stations located at epicentral distance ranging from 2 km up to more than 800 km (Fig. 2).
The closest station was Mirandola (MRN), located at epicentral distance of 2 km (Fig. 1B). The MRN, classified as C site (EC8, Comité Européen de Normalisation 2004), recorded a maximum PGA of 900 cm/s2 on the vertical component*. The waveforms recorded by the stations triggered by the 29 May event, were extracted from the DPC archive. The extracted waveforms have a length which depends on the station – epicenter distance (i.e. two and a half minutes are used for the closest stations and a wider time windows for larger distance).
The waveforms for all the stations that recorded the event are made available in the present report. Specifically, there are three files, both in SAC and ASCII format, for each station referring to each recording channel. In the header of files the polarity of the signal is indicated.
(*) Specific controls were performed in order to check the status of measurement station. For this purpose DPC added a temporary instrument (see section temporary network) that confirmed the reliability of the MRN recordings.

3
Figure 2 Distribution of the 145 triggered stations during the Ferrara arc earthquake (Ml 5.8). Digital strong motion stations of the Italian Civil Protection Department are represented by triangular symbols, Irpinia Seismic Network ISNet (Weber et al., 2006; http://isnet.na.infn.it/) by diamond symbols and the Friuli Venezia Giulia Accelerometric Network RAF (Costa et al., 2010; http://rtweb.units.it/), by square symbols.

4
The acceleration data are given in nm/sec2, the standard unit for the acceleration waveforms in SAC and ASCII format. Data provided are corrected: mean value of the signal was calculated and removed, as well as any trend. Moreover, only for retrieving strong motion parameters and the response spectra, a Butterworth filter with a typical frequency range between 0.2-50 Hz was applied.
At the DPC ftp site, the following auxiliary material given with this report, is available: 1. the strong motion dataset of the 29 May, 2012 event in SAC and ASCII format. Please note that
the data set is made available without making any selection on the quality of the signal. Moreover, the vertical component of the waveform of the Mirandola station (MRN) presents signal components at very high frequencies.
2. the list of stations that recorded the second main event, along the station code, the coordinates, the toponyms and the model of instrumentation. A "netcode" parameter identifies the integrated network the single station belongs to. IT code identifies the national accelerometric network RAN, RF refers to the RAF stations and IS refers to the ISNet stations;
3. a table summarizing a variety of strong motion parameters, calculated from the recorded waveforms for the stations from 2 to 232 km;
4. the response spectrum in acceleration (at 5% damping) between 0.05 and 3.5 seconds for the twenty stations sited within 50 km epicentral distance. The data related to the response spectra are in ASCII format and are expressed in cm/s2.
5. the strong motion dataset of the 20 May mainshock in ASCII format, as requested by many users.
Figure 3: The recording at Mirandola-MRN station (E, N, Z channels) triggered by the 29 May 2012 07:03:00 (UTC time) event .
5
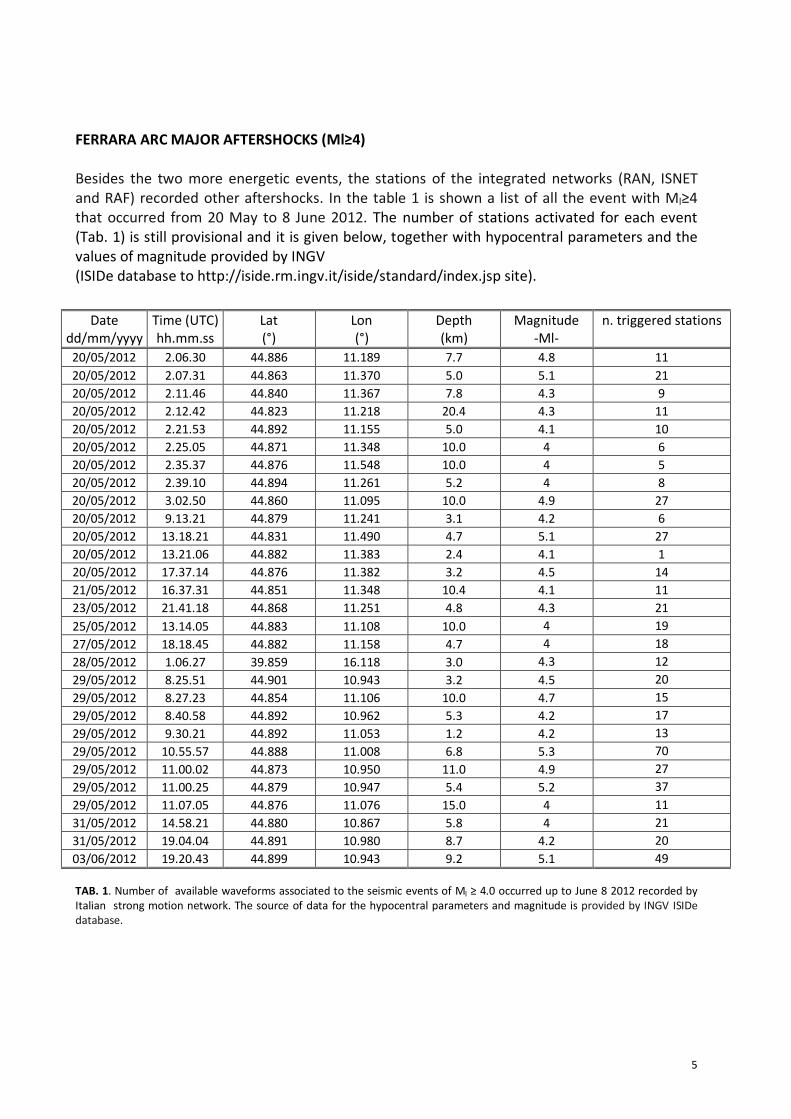
FERRARA ARC MAJOR AFTERSHOCKS (Ml≥4) Besides the two more energetic events, the stations of the integrated networks (RAN, ISNET and RAF) recorded other aftershocks. In the table 1 is shown a list of all the event with Ml≥4 that occurred from 20 May to 8 June 2012. The number of stations activated for each event (Tab. 1) is still provisional and it is given below, together with hypocentral parameters and the values of magnitude provided by INGV (ISIDe database to http://iside.rm.ingv.it/iside/standard/index.jsp site).
TAB. 1. Number of available waveforms associated to the seismic events of Ml ≥ 4.0 occurred up to June 8 2012 recorded by Italian strong motion network. The source of data for the hypocentral parameters and magnitude is provided by INGV ISIDe database.
Date dd/mm/yyyy
Time (UTC) hh.mm.ss
Lat (°)
Lon (°)
Depth (km)
Magnitude -Ml-
n. triggered stations
20/05/2012 2.06.30 44.886 11.189 7.7 4.8 11 20/05/2012 2.07.31 44.863 11.370 5.0 5.1 21 20/05/2012 2.11.46 44.840 11.367 7.8 4.3 9 20/05/2012 2.12.42 44.823 11.218 20.4 4.3 11 20/05/2012 2.21.53 44.892 11.155 5.0 4.1 10 20/05/2012 2.25.05 44.871 11.348 10.0 4 6 20/05/2012 2.35.37 44.876 11.548 10.0 4 5 20/05/2012 2.39.10 44.894 11.261 5.2 4 8 20/05/2012 3.02.50 44.860 11.095 10.0 4.9 27 20/05/2012 9.13.21 44.879 11.241 3.1 4.2 6 20/05/2012 13.18.21 44.831 11.490 4.7 5.1 27 20/05/2012 13.21.06 44.882 11.383 2.4 4.1 1
20/05/2012 17.37.14 44.876 11.382 3.2 4.5 14 21/05/2012 16.37.31 44.851 11.348 10.4 4.1 11 23/05/2012 21.41.18 44.868 11.251 4.8 4.3 21 25/05/2012 13.14.05 44.883 11.108 10.0 4 19 27/05/2012 18.18.45 44.882 11.158 4.7 4 18 28/05/2012 1.06.27 39.859 16.118 3.0 4.3 12 29/05/2012 8.25.51 44.901 10.943 3.2 4.5 20 29/05/2012 8.27.23 44.854 11.106 10.0 4.7 15 29/05/2012 8.40.58 44.892 10.962 5.3 4.2 17 29/05/2012 9.30.21 44.892 11.053 1.2 4.2 13 29/05/2012 10.55.57 44.888 11.008 6.8 5.3 70 29/05/2012 11.00.02 44.873 10.950 11.0 4.9 27 29/05/2012 11.00.25 44.879 10.947 5.4 5.2 37 29/05/2012 11.07.05 44.876 11.076 15.0 4 11 31/05/2012 14.58.21 44.880 10.867 5.8 4 21 31/05/2012 19.04.04 44.891 10.980 8.7 4.2 20 03/06/2012 19.20.43 44.899 10.943 9.2 5.1 49

6
TEMPORARY NETWORK
In case of seismic sequences, DPC deploys temporary strong motion stations in the field to increase the density of recording instruments in the epicentral area. In the present case DPC installed 17 digital stations from 20 May to 7 June. Two of these stations, Carpi and Cento, will be permanent and integrated to RAN (Fig. 4, Tab.2). Moreover, in order to verify the correct functioning of the MRN permanent station, soon after the 29 May event, DPC installed a temporary station (MRN0) equipped with a three-component strong motion instrument different from the one installed in the Mirandola station. Both permanent and temporary stations are equipped with GPRS modem and sent data to the data acquisition center in Rome. Data recorded are automatically integrated to the RAN database. Noise measurements have been performed at each station site.
Figure 4: – Geological map and the temporary network distribution (from Carta Geologica di Pianura dell’Emilia Romagna, 1: 250.000). Key: 1-2) ALLUVIAL FAN AND TERRACED DEPOSITS- channellised gravels and sands alternating with thin-bedded sands and silts; 5-10) ALLUVIAL PLAIN DEPOSITS (5. thin-bedded medium to fine grained sands, silty sands, and minor clayey silts, 6. thin bedded fine and very fine sands with small amounts of silty-clays, 7. medium and fine-grained sands, silts and silty clays alternating to some decimeters-thick ribbons of medium and coarse sands, 8. thin to medium thick-bedded sandy silts, fine and very fine sands, 9. silty clays and laminated clays with minor coarse sands in lenses and ribbon-shape bodies, 10. medium and coarse sands with minor sandy gravels and silt lenses; 11-12) DELTAIC AND LITTORAL DEPOSITS (medium to fine sands laterally passing to fine and very fine sands and silts and to ribbon shaped bodies of medium-coarse sands; silt intervals locally bear centimeter-thick, partially decomposed organic layers. N.B. Soils of various degree of evolution, close upward all the aforesaid units (2-9). RAN T = temporary stations; RAN P = permanent RAN station.

7
Date of Date of Municipality Code Lat Lon Elevation Type of installation installation replacement (°) (°) (m)
21/05/2012 Cento CNT 44.7234 11.2867 68 new station
20/05/2012 Carpi CRP 44.7834 10.8704 78 new station
21/05/2012 Bondeno BON0 44.8854 11.4183 63 temporary
21/05/2012 Castelmassa CAS0 45.0252 11.3114 62 temporary
20/05/2012 Ferrara FER0 44.8408 11.6216 59 temporary
23/05/2012 Ficarolo FIC0 44.9521 11.4337 59 temporary
20/05/2012 Finale Emila FIN0 44.8297 11.2867 60 temporary
21/05/2012 30/05/2012 Malalbergo MBG0 44.7189 11.5337 67 temporary
30/05/2012 Malalbergo MAL0 44.7190 11.5340 63 temporary
21/05/2012 Moglia MOG0 44.9318 10.9115 85 temporary
20/05/2012 Ravarino RAV0 44.7238 11.1002 172 temporary
07/06/2012 Rolo ROL0 44.8870 10.8560 68 temporary
21/05/2012 S. Felice sul Panaro SAN0 44.8376 11.1427 87 temporary
20/05/2012 S. Agostino SAG0 44.7911 11.3858 70 temporary
21/05/2012 S. Martino Spino SMS0 44.9336 11.2352 61 temporary
30/05/2012 Cavezzo CAV0 44.8344 11.0276 69 temporary
31/052012 Poggio Rusco POG0 44.9779 11.1181 - temporary
29/05/2012 Mirandola MRN0 44.8782 11.0617 64 temporary
TAB. 2. List of the temporary stations in the epicentral area installed after 20 May, 2012.

8
Figure 5. Examples of surface geological effects following the 20 and 29 May 2012 earthquakes.

9
NOISE MEASUREMENTS
Further efforts were made in order to characterize the temporary station sites. On all the station sites in epicentral area (Fig.4) noise measurements were completed (see Tab. 2). The noise measurements were performed close to the accelerometric station site, using 20-24 bit digital datalogger equipped with 5sec F0 velocimeters and a recording length of more than 60 minutes at each site. Very preliminary results, show a common pattern of the H/V ratio, with fundamental frequency in the 0.6 – 0.9 Hz range. Moreover, for comparison purpose, other measurements were carried out on several sites not comprising strong motions instruments. An example of H/V spectral ratio applied to ambient noise is shown in Fig. 6.
Figure 6: H/V spectral ratio applied to ambient noise (A and B). The outside and the inside (C and D) of the Enel electrical transfer cabin, in which the MRN strong motion station is installed. The MIR0 noise measurements (A) were performed out of the Enel cabin while the MIR1 measurements (B) were carried out close to the RAN permanent instrument that is visible in photo D on the right near the door.
10
ELECTRONIC SUPPLEMENTARY MATERIAL
This report contains supplementary material which is available on line at the DPC ftp site ftp://ftp.protezionecivile.it and which will be published in a forecoming paper. It can be used upon quotation of the present report. The correct citation is : Mirandola Earthquake Working Group (DPC, UniChieti, Uni Trieste, Regione Umbria) - Report 2 - (http://www.protezionecivile.gov.it/jcms/it/ran.wp) TO DOWLOAD DATA, PLEASE REQUEST LOGIN AND PASSWORD TO THE FOLLOWING EMAIL ADDRESS: [email protected]
ACKNOWLEDGEMENTS We thank our colleagues of the Service of the DPC for seismic monitoring of the territory and the colleagues of the Services for IT and for telecommunications of the DPC. We also thank all the local administrations and the civil protection volunteers that collaborated for siting of permanent and temporary stations. CITED PAPERS BONCIO, P. & BRACONE, V. (2009) - Active stress from earthquake focal mechanisms along the Padan–
Adriatic side of the Northern Apennines (Italy), with considerations on stress magnitudes and pore-fluid pressures. Tectonophysics, 476, 180–194.
CARMINATI E., SCROCCA D. & DOGLIONI C. (2010) – Compactation induced stress variations with depth in an active anticline: Northern Apennines, Italy. J. Geoph. Res., 115,1. 17.
CIACCIO M.G. & CHIARABBA C. (2002) -Tomographic models and seismotectonics of the Reggio Emilia region, Italy. Tectonophysic, 344, 261– 276.
LAVECCHIA, G., BROZZETTI, F., BARCHI, M., MENICHETTI M. & KELLER, J.V.A., (1994) - Seismotectonic zoning in east-central Italy deduced from an analysis of the Neogene to present deformations and related stress fields. Geological Society of America Bulletin, 106, 1107-1120.
LAVECCHIA, G., BONCIO, P. & CREATI, N. (2003) - A lithospheric-scale seismogenic thrust in Central Italy. Journal of Geodynamics, 36, 79-94.
MIRANDOLA EARTHQUAKE WORKING GROUP (DPC, UNICHIETI, UNI TRIESTE, REGIONE UMBRIA) - REPORT 1 - (http://www.protezionecivile.gov.it/jcms/it/ran.wp)
TOSCANI G., P. BURRATO P., DI BUCCI D., SENO S. & VALENSISE G. (2009) - Plio-Quaternary tectonic evolution of the Northern Apennines thrust fronts (Bologna-Ferrara section, Italy): seismotectonic implications. Ital.J. Geosci, 128, 605-613.
GORINI A, NICOLETTI M, MARSAN P, BIANCONI R, DE NARDIS R, FILIPPI L, MARCUCCI S, PALMA F, ZAMBONELLI E (2010) The Italian Strong Motion Network Bull Earthq Eng, 8: 1075-1090.
COSTA G, MORATTO L, SUHADOLC P (2009) The Friuli Venezia Giulia Accelerometric Network: RAF. Bull Earthquake Eng, DOI 10.1007/s10518-009-9157-y.
MONTONE, P., MARIUCCI, M.T. & PIERDOMINICI, S (2012) - The Italian present-day stress map. Geophysical Journal International 189 (2), 705-716.
WEBER E., IANNACCONE G., ZOLLO A., BOBBIO A., CANTORE L., CORCIULO M., CONVERTITO V., DI CROSTA M., ELIA L., EMOLO A., MARTINO C., ROMEO A., SATRIANO C (2006)., Development and testing of an advanced monitoring infrastructure (ISNet) for seismic early-warning applications in the Campania region of southern Italy. In P. Gasparini et al. editors, Seismic Early Warning. Springer-Verlag

11
ZAMBONELLI E, DE NARDIS R, FILIPPI L, NICOLETTI M. AND DOLCE M. (2011). Performance of the Italian strong motion network during the 2009, L’Aquila seismic sequence (central Italy). Bulletin of Earthquake Engineering, 2011, Volume 9, Number 1,Pages 39-65
ITALIAN INSTRUMENTAL AND PARAMETRIC DATA-BASE (ISIDe) available at http://iside.rm.ingv.it/iside/standard/index.jsp.
WORKING GROUP CPTI11 (2011) available at http://emidius.mi.ingv.it/CPTI/