The feasibility of Atmospheric Water Generators on small ...
70
MSc Program Environmental Technology & International Affairs The feasibility of Atmospheric Water Generators on small tropical islands - A case study on Koh Rong Sanloem, Cambodia A Master's Thesis submitted for the degree of “Master of Science” supervised by Dipl.-Ing. Dr. Mario Ortner Tiziano Alessandri, BA BA 01304845 Vienna, 17.06.2021
Transcript of The feasibility of Atmospheric Water Generators on small ...
MSc ProgramEnvironmental Technology & International Affairs
The feasibility of Atmospheric Water Generators on smalltropical islands - A case study on Koh Rong Sanloem,
Cambodia
A Master's Thesis submitted for the degree of“Master of Science”
supervised byDipl.-Ing. Dr. Mario Ortner
Tiziano Alessandri, BA BA
01304845
Vienna, 17.06.2021
Affidavit
I, TIZIANO ALESSANDRI, BA BA, hereby declare
1. that I am the sole author of the present Master’s Thesis, "THE FEASIBILITY OFATMOSPHERIC WATER GENERATORS ON SMALL TROPICAL ISLANDS - ACASE STUDY ON KOH RONG SANLOEM, CAMBODIA", 70 pages, bound, andthat I have not used any source or tool other than those referenced or any otherillicit aid or tool, and
2. that I have not prior to this date submitted the topic of this Master’s Thesis or partsof it in any form for assessment as an examination paper, either in Austria orabroad.
Vienna, 17.06.2021 _______________________Signature
Powered by TCPDF (www.tcpdf.org)

I
Abstract
Water scarcity is an increasing global issue and the need for clean drinking water
is set to increase with a growing global population and the effects of climate
change. Small tropical islands, when not having a natural spring, cannot rely on
groundwater since the freshwater lenses are merely a very thin layer, floating
above the underlying seawater. Due to changes in in sea level as an effect of
climate change, these lenses are predicted to further decrease. Often the only
source of drinking water on small islands is importing it in bottled form. This is not
only inefficient in terms of energy footprint and price, but also creates a waste
problem that these islands usually fail to adequately address.
Instead of relying on groundwater, one could harvest the water needed straight
from the air: Atmospheric Water Generation seems to be a viable solution when
considering atmospheric conditions and spatial constraints on small tropical
islands. This however requires quite some energy and when thinking of the fragile
ecosystems small islands are, a clean energy source would be favourable –
avoiding the environmental burdens diesel generators bring as well as being
independent from the volatile oil market.
Finally, when thinking of tourism, a way of providing water in hygienic and
acceptable manner is also an aspect that must be considered.
Therefore, this thesis combines these thoughts and showcases four different
models of Atmospheric Water Generation: first as a standalone project, second
including the option of a sustainable bottling system, third including a Photovoltaic
plant to power the water generation in a sustainable manner and lastly including
the bottling system and the photovoltaic plant, for a holistic approach.
Throughout a Profit and Loss Analysis it is shown that all four models would not
only improve the water situation, but also offer high returns for possible investors.
The aim of this thesis is essentially to create an incentive not only for
governments to reduce water scarcity and improve the waste situation in such an
island setting, but also show that the private sector can make a profit here and in
doing so help small tropical islands become more sustainable.

II
Table of Contents
Abstract ................................................................................................................ I
Table of Contents ................................................................................................ II
List of abbreviations .......................................................................................... IV
1. Introduction .................................................................................................. 1
1.1 Objective ................................................................................................ 3
1.2 Hypothesis ............................................................................................. 3
1.3 Part I: Background ................................................................................. 4
1.4 Part II: Case Study ................................................................................. 4
Part I
2. The importance of water .............................................................................. 5
3. Water Scarcity .............................................................................................. 6
3.1 Water scarcity on tropical islands ........................................................... 7
3.2 Scarcity of drinking water (even with an abundance of water) ............... 8
4. Drinking water quality ................................................................................... 9
5. Microplastic in bottled water ....................................................................... 10
6. Plastic Waste ............................................................................................. 11
7. UN SDGs ................................................................................................... 11
8. Alternatives to importing bottled water ....................................................... 12
8.1 Desalination ......................................................................................... 13
8.1.1 Thermal process ............................................................................ 13
8.1.2 Membrane process ........................................................................ 13
8.2 Fog harvesting ..................................................................................... 14
8.3 Atmospheric Water Generation (AWG) ................................................ 16
9. Advantages of AWG .................................................................................. 18
III
Part II
10. The Nexus of Tourism, Pollution, Water and Sustainable Development . 19
11. Koh Rong Sanloem ................................................................................. 21
11.1 Island setting ..................................................................................... 21
11.2 Calculating drinking water needs for Koh Rong Sanloem ................. 23
11.3 Atmospheric Water Generation ......................................................... 24
11.4 Plastic waste from water bottles that could be avoided .................... 25
11.5 Electricity on the island ..................................................................... 27
12. Transportation of an AWG to the island .................................................. 29
13. Location on the island ............................................................................. 29
14. Bottling of produced water ....................................................................... 30
15. Maintenance ............................................................................................ 32
16. Staff ......................................................................................................... 33
17. Earnings .................................................................................................. 34
18. Expenses ................................................................................................ 34
19. Financing ................................................................................................. 37
20. Profit and Loss Analysis .......................................................................... 37
21. Performance indicators ........................................................................... 38
21.1 Model 1: Standalone AWG ............................................................... 39
21.2 Model 2: AWG + Filling Station ......................................................... 41
21.3 Model 3: AWG + PV .......................................................................... 43
21.4 Model 4: AWG + PV + Filling Station ................................................ 45
22. Conclusion .............................................................................................. 47
Bibliography ...................................................................................................... 49
List of Figures .................................................................................................... 55
List of Tables ..................................................................................................... 55
ANNEX ............................................................................................................. A1
IV
List of abbreviations
AWG Atmospheric Water Generator
BaSO4 Barium Sulphate
BPA Bisphenol A
CAPEX Capital Expenditures
CH2O Formaldehyde
CO Carbon Monoxide
CO2 Carbon Dioxide
DSCR Debt Service Coverage Ratio
EAT Earnings After Taxes
EBT Earnings Before Taxes
EBIT Earnings Before Interest and Taxes
EBITDA Earnings Before Interest, Taxes, Depreciation and
Amortization
GHG Greenhouse Gas
KHR Cambodian Riel
kW Kilowatt
kWh Kilowatt hours
kWp Kilowattpeak
LHC Large Holding Company
MW Megawatt
MWh Megawatt hours
MWp Megawattpeak
NOX Nitrogen Oxides
O & M Operations and Maintenance

V
PAHs Polycyclic Aromatic Hydrocarbons
PET Polyethylenterephthalat
PM Particle Matter
PV Photovoltaic
TiO2 Titanium Dioxide
USD US Dollar
UV Ultraviolet
1
1. Introduction It has been thoroughly established in the last couple of years that in order to
survive and thrive on this planet, we must not only reduce emissions of pollutants,
but rethink society and its processes as a whole. Development must be achieved
in such a manner, that makes progress sustainable in the long term. There are of
course a plethora of approaches to this end, and one must concentrate on a small
niche which to change and/or describe.
In the thesis beforehand, I will thus focus on the key sector of sustainable water
production on small tropical islands, accompanied by a transition to 100%
renewable energy for its production (Pröstler, 2014; Lim, 2017; Mathiesen et al.,
2011; Meza et al., 2019; Ngjeqari, 2018; Pölzl, 2019).
The setting I will focus on in the course of this thesis is that of tropical islands,
with a focus on Koh Rong in Cambodia as an example for the thousands of similar
islands worldwide. One of the major problems on many such small islands is the
unavailability of clean drinking water, which must therefore be shipped to the
island – which in turn is costly and creates an additional waste problem. Often
this dilemma is created by the reliance on tourism as main source of income.
When thinking about drinking water in tourism, one must take into account that
especially in countries like Cambodia, where there is a realistic threat of
contracting diseases like Hepatitis through drinking water (Sreng et al., 2016),
most tourists prefer tightly sealed bottles of water. So when wanting to supply
drinking water one must be able to provide it in sealed containments. Another
problem that is posed by local water generation is the relatively high energy
demand that this entails.
Human societies are strongly dependent on energy and practically every region
of the world needs an individually tailored approach towards its energy
generation. It has by now become clear, that fossil fuels are not the answer. But
also when it comes to renewable energy sources, not every type is well suited for
every location.
The situation on the island of Koh Rong Sanloem has been deteriorating over the
past several years. Tourism being the island’s main source of income, energy
demand has soared with the rising number of resorts and lodges. However, since

2
no direct connection to the energy grid exists, this has been provided via a
growing number of Diesel generators. This does not only annoy locals and
tourists alike, but also has detrimental effects on human health and the
environment in terms of leaking gasoline, air pollution and noise pollution.
Luckily on this specific island there is already a project underway concerning a
photovoltaic plant for clean energy generation (“New Solar Power Station on Koh
Rong Samloem,” 2021). The installation of this plant is supervised by Total Solar
Distributed Generation (DG) and will presumably be a 1.25 MW Photovoltaic
plant. If completed, this project would ensure a significant amount of clean energy
for the island.
A viable solution to one of the other main problems, which many secluded rural
areas and islands face – that of available drinking water – thus could be pulled
from thin air: “The Atmospheric Water Generator (AWG) is one of the alternative
solution[s] for fresh water recovery from [the] atmosphere“ (Suryaningsih and
Nurhilal, 2016). In this procedure, the local humidity is directly condensed and
further refined to drinkable water. In optimal cases, large mobile Atmospheric
Water Generators can generate around 10.000 litres of drinking water daily
(“PHANTOR-Technical-datasheet,” 2020). In the case of Koh Rong Sanloem,
where there are more than 100 resorts, this water would be highly appreciated.
This Thesis will therefore calculate roughly how much water is needed, show
what the price of a litre of water currently is on the island and compare this to a
possible price water produced via an AWG could be sold at. Would it be feasible?
And how long would it take to cover the expenses? How much waste could be
avoided? These questions will hopefully be answered within this thesis.
The scope of this Master‘s Thesis will be a case study of the situation on Koh
Rong Sanloem, focusing on analysing the costs and benefits of generating
drinking water locally via an AWG (instead of importing it). Further it will analyse
the impact of an installed Photovoltaic plant and a bottling line and the benefits
the implementation of these facilities could have.
Also, awareness for the growing need and demand for clean water and the laws
that must accompany this process are growing (“Ministry floats new law for clean
water management,” 2020). This could mean that eventual government support,
3
such as would be needed for the transportation part addressed later in this thesis,
or simply for financing, can be seen as likely.
Since tourism is so important on many tropical islands, preservation of nature,
both terrestrial and aquatic, is a cornerstone of these destination’s future. If
development can be achieved in a sustainable manner, minimizing the negative
impact on the environment, while enabling and empowering the local population
through autarky (resource-wise), tropical islands can, according to the
assumption of this Thesis, thrive both economically and as ecosystems. On the
other hand, if such a project would be implemented not from a communal side
but from private investors, a profit can be made, as this thesis will show.
1.1 Objective The objective of this thesis will be to find out how much the installation of an AWG
would cost on the island of Koh Rong Sanloem as an example for a tropical island
setting, how much a litre of water could be sold at (and thus how much cheaper
it would be than importing it in bottled form) and what the ecological benefits
would be. If the outcome of this project proves to be positive, one could implement
similar facilities on other tropical islands worldwide. The thesis should serve as
guide for potential investors or communities worldwide in similar settings to
implement such projects, thus reducing the burden of plastic waste and
decreasing water scarcity.
1.2 Hypothesis Installing an AWG will in the long run reduce the economic costs of the population
on the island concerning water consumption, as well as drastically lower the
ecological burden on the environment which occurs in terms of emissions and
plastic waste, since on many of these islands there is no waste disposal system
in place, which only leaves inhabitants to burn their waste in the open. With the
installation of an AWG one could provide a cheaper alternative and even make a
profit as supplier. Essentially, this could be a business model.

4
1.3 Part I: Background The first part of this thesis will briefly cover all relevant topics and pave the way
for the case study in the second part. From more general issues such as water
scarcity, waste or the SDGs to more specific fields like the different kinds of water
generation and their advantages and disadvantages will be thematised.
1.4 Part II: Case Study The case study in the second part of this thesis will be based on reference values
from literature as well as data provided by the AWG producer Imhotep.Industries
GmbH, concerning average local temperature and humidity (the closest available
dataset is from a weather station 90km from the island, but should be fairly
consistent with actual values on the island) based on the year 2020. Due to the
Covid Pandemic, an in-depth field research (including interviews with locals
concerning willingness to buy locally produced drinking water, actual tourist
numbers in high and low season to determine the maximum and minimum
demand of drinking water needed, as well as to exactly determine the waste
situation created by plastic bottles) was not possible, these values had to be
roughly estimated and based on similar research. Also, since not being able to
directly research prices of bottled water on the mainland and on the island as well
as the price of electricity, this information was kindly provided by my supervisor
Dipl. Ing. Dr. Mario Ortner, who runs a PV plant on the neighbouring Island of
Koh Rong and has staff on site which could supply some basic information. All
the estimations due to unavailability of exact information were done based on
similar islands (such as the neighbouring island), relevant literature and expert
opinions. The aim of this case study will be to provide an example of atmospheric
water generation on small tropical islands and showcase the profit that could be
made within four different models of implementation as well as indicate some of
the difficulties that could occur. Optimally, this could be used as guide when
planning a similar project and thus increase water security in remote places,
reduce waste and even provide an opportunity for investors.

5
PART I: BACKGROUND
2. The importance of water To put it simply, water is the most basic resource needed for human (or any form
of) life on our planet. On a chemical level, water is essential to carbon-based life
due to the physical and chemical properties that makes it, in combination with
carbon molecules, an optimal compound-solvent pair. Not only is this
combination optimal for life on earth, but would probably be the most common
basis for life in the universe (Westall and Brack, 2018). Coming back to earth
though, we humans are reliant on water not only for the most basic consumption
to keep hydrated, but also to cook, wash our clothing, remove waste from our
households (be it washing dishes or flushing the toilet) and production of all sorts
of consumer goods. Basically, without water, neither human societies nor
humans themselves would exist.
Historically, the idea that water is a scarce resource is relatively young. Just as
the oceans had been seemingly endless and waste could be dumped into them,
fishes could be fished endlessly from them, so have rivers and lakes been
polluted continuously. With an increasing global population however, there arise
more and more problems from heavy water use by the industry as well as from
urban pollution. This has resulted in increasing complications concerning
availability of clean drinking water. According to the World Health Organization,
in 2017 roughly 2.2 billion people had no access to safely managed drinking water
services (World Health Organization, 2019a). This means that these people are
either exposed to health risks arising from unsafe drinking water, or that they are
reliant on bottled water, whereas these (usually plastic) bottles will probably end
up in the environment – assuming that the places with unsafe drinking water also
lack the infrastructure for proper waste disposal or recycling. From this one can
gather that there is a huge need (and therefore also a huge market, if one
chooses to think economically) for clean drinking water.
The health risks of contaminated drinking water include diseases like cholera,
diarrhoea, dysentery, hepatitis, typhoid, and polio (ibid). Further, when supplying
clean drinking water from a safe and stable source, people spend less time on
water collection and less money on health issues, increasing overall economic
6
capabilities. And while the economic aspect is certainly not the most pressing
here, it can be viewed as incentive (also for the private sector) to improve water
quality from a purely monetary perspective, considering lack of a thriving
economy in many of these countries. Therefore, one could generalize that having
clean drinking water available to a population brings multisectoral advantages
and should be prioritized when developing an area.
3. Water Scarcity Since the setting of this thesis is on tropical islands, one must consider that these,
due to their size and elevation, tend not to have surface water “in exploitable
form” (Máñez et al., 2012, p. 74) and are thus usually rather short on freshwater.
Therefore, one must also thematize the problem of water scarcity. But what
exactly is scarcity in relation to water? A scientific approach commenced nearly
fifty years ago, when Falkenmark and Lindh (1974) started linking water
resources to population and pollution to estimate future needs for clean water.
Closely thereafter, the so-called Water Stress Index (WSI) was developed to link
food security to freshwater availability (Falkenmark, 1986). This index defines
water scarcity by how many people share the same water source, competing for
a flow unit of water (106 m3 of water per year). These measures, among other
developments, started a global consciousness concerning drinking water
availability (Damkjaer and Taylor, 2017). The context at the time were African
famines, but the awareness of the urgency of the problem have remained.
Over the last couple of years there has even been an increase in awareness
concerning global water scarcity in many (usually developed) countries.
Especially when considering an ever-increasing world population and the fact that
places were population numbers are strongly rising tend to be the ones with less
available freshwater per capita (Sophocleous, 2004). Therefore, it will be
paramount to manage these sources effectively and find new ways of generating
water in order to sustain agricultural and basic needs. Especially on small tropical
islands the limitations are severe as will be shown in the next section.
However, as Máñez points out, water scarcity can not only be defined as physical
unavailability of water but can also include socio-economic factors. Therefore,

7
while the physical restrictions are quite straightforward, economic water scarcity
can mean that the cost of providing an adequate water supply are prohibitively
high, which can be a result of a mismanagement of water resources (ibid.). And
this in turn is affected by the social perception of local water scarcity, historically
formed norms and standards towards water use, etc. Insofar, one could also
argue that to reduce water scarcity in an area (in our case the constrained space
of an island), a simple way to improve the availability of water would be to change
the inhabitants´ perception concerning how and for what water is used (e.g. not
wasted unnecessarily). This form of education should therefore also be prioritized
(especially considering the far lower cost compared to technologically
sophisticated water generation systems) when developing a regional plan to
combat water scarcity.
A study on water scarcity in Asia and the Pacific (Stocker, 2009) also found that
in Cambodia the general water consumption was extremely low and that average
per capita GDP would not suffice for effective management of water resources.
Although no data is available for the island of Koh Rong Sanloem, where the case
study of this thesis will be situated, these facts are assumed to hold nevertheless.
Since the capital and know-how for water management is often unavailable in
such places, projects such as the one discussed in this thesis could prove helpful.
3.1 Water scarcity on tropical islands In this section I will now focus on the main reasons for water scarcity on tropical
islands and what environmental and societal effects can influence this.
While water availability can pose a problem in all kinds of locations, tropical
islands face many major challenges, which are even assumed to increase in the
future (Suroso et al., 2009, cited in Máñez et al., 2012, p. 75). But first, what is
the usual situation on small islands? According to Máñez et al. (2012, pp. 74–
75):
“Groundwater appears as a thin lens of freshwater floating over sea water in
coral sand and limestone aquifers […] on islands above a size of approximately
1.5 ha […]. There is no sharp boundary between the lens and the underlying
8
seawater. The lower boundary is a wide transition or mixing zone where
groundwater salinity increases with depth from freshwater to seawater […].”
The less dense freshwater (usually from rain) floats on top of the denser saline
ocean water “that permeates the porous geological substructure of the island,
resulting in stratification, and the development of freshwater lenses” (Gössling,
2001, p. 181). Considering the usually low elevation of these islands, these
circumstances contribute to a relative (physical) scarcity of freshwater. While the
already relatively bad conditions for the formation of sufficient amounts of
freshwater lenses (when considering increasing use of freshwater from the
increasing population and – especially – the increasing tourism sector on tropical
islands), climate change and the threats it poses lead to a worsening situation on
islands. The predicted increases in rainfall combined with a decrease in rainy
days are expected to create a situation in which droughts as well as flash-floods
are favoured. This in turn will put even more stress on freshwater reservoirs.
Further, “Accelerated coastal erosion, storm surges and sea level rise are
supposed to cause saline intrusion into freshwater lenses […]“ (ibid.), impacting
the quality and useability of the water.
3.2 Scarcity of drinking water (even with an abundance of water) A different problem can be posed by the quality of water. In some instances, there
is plenty of water around to think that water scarcity should not be an issue.
However, the quality of this water can have deteriorated so far (be it by
environmental or anthropogenic influences), that the water present is essentially
unfit for consumption and water scarcity arises in the middle of an abundance of
water. For example, Zeng et al. (2013) investigate water scarcity and criticize that
this assessment is mostly based on quantity and does not include quality. This is
clearly valid for vulnerable ecosystems (in terms of water) such as small tropical
islands. The thin freshwater lenses that are often the only source of drinking water
except for collected rainwater are increasingly contaminated by anthropogenic
pollution or rising sea levels due to climate change.
9
4. Drinking water quality The WHO provides a 631-page guideline concerning the recommendation for
“managing the risk from hazards that may compromise the safety of drinking-
water” (World Health Organization, 2017, p. 1). Essentially (but not officially) a
standard is set for a minimum quality drinking water must have, while
acknowledging that a higher quality might be needed for certain uses. But in
general, “the Guidelines describe reasonable minimum requirements of safe
practice to protect the health of consumers and derive numerical ‘guideline
values’ for constituents of water or indicators of water quality” (ibid., p. 2). While
the WHO guidelines focus on what is not (or only up to a certain level) allowed to
be in drinking water, a study different study shows the detrimental effects of low
mineral intake on health caused by mineral-poor water generated by reverse-
osmosis (Huang et al., 2018). When generating water by desalination or using
other procedures from the atmosphere, essentially what one ends up with is a
kind of distilled water. Now one might be tempted to think that the purer the water
one consumes, the better. But relying on pure H2O is far from optimal.
Kozisek (2005, p. 148) investigates the adverse health effects of demineralised
water, which can range from:
• Direct effects on the intestinal mucous membrane, metabolism and
mineral homeostasis or other body functions.
• Little or no intake of calcium and magnesium from low-mineral water.
• Low intake of other essential elements and microelements.
• Loss of calcium, magnesium and other essential elements in prepared
food.
• Possible increased dietary intake of toxic metals.
(Kozisek, 2005)
The study further concludes that the ingestion of distilled water forces the body
to add electrolytes, which are in the process depleted from the body’s reserves
of dissolved salts in the body water. This may result in compromised organs and
symptoms such as tiredness, weakness and headache (ibid, p. 152).
10
Therefore, when generating water, be it by desalination, fog harvesting or
atmospheric water generation, it is crucial that when intended for human (or even
animal) consumption the water is first mineralised. Some of the recommended
thresholds thus include a minimum of 10 mg/L magnesium, 20 mg/L calcium and
“for total water hardness, the sum of calcium and magnesium should be 2 to 4
mmol/L” (ibid, p. 156-157).
5. Microplastic in bottled water Despite plastic being increasingly present in everyday life, from food and
beverage packaging to medicinal devices, there is increasing awareness of
microplastic and the health risks associated to it. There are two dimensions of
possible health risks the WHO associates with microplastics: particles and
chemicals on the one hand and biofilms on the other. While biofilms that can form
around microplastic are more relevant for particles in pipes etc, these usually do
not occur in bottled water since it is sterilised before filling. Also, although biofilms
can act as vectors for “harmful organisms including enteric viruses and protozoa”
(World Health Organization, 2019b, p. 45), “most microorganisms found in
biofilms are believed to be primarily non-pathogenic” (ibid., p. 44).
A more significant health risk however is posed by particles and chemicals related
to microplastics. Humans ingest a large variety of particles which consist of a
plethora of different substances. The toxicity however depends on shape, size,
surface or chemical composition of the particles. There is unfortunately a lack in
research concerning ingested particles, including microplastics. “To date, most
toxicological tests of microplastics have focused on aquatic organisms or
ecotoxicology. No epidemiological or human studies on ingested microplastics
have been identified” (ibid., p. 27). Therefore, when following the WHO
information, it is not sure to which extent microplastics will cause harm to the
human body and more research is definitely needed.
Recent studies, on the other hand, have shown that there is the possibility of
Bisphenol A (BPA) leaching from plastic containers into beverages, and BPA has
been shown to cause liver function alteration, changes in insulin resistance or
other health issues (Karbalaei et al., 2018). In addition, several studies highlight

11
the occurrence of microplastic particles in bottled water, with up to nearly 5000
particles counted per litre in some samples (Mason et al., 2018; Oßmann et al.,
2018; Schymanski et al., 2018).
6. Plastic Waste Plastic pollution, which seriously compromises various ecosystems on and
around small islands, is an increasing problem worldwide (Zambrano-
Monserrate, 2020). Poor waste management and a lack in awareness of this
problem result in millions of tons of waste that ends up in the environment.
Especially oceanic islands are hit hard by this, since ocean currents wash up tons
of plastic waste on beaches, often from far away countries.
Now apart from this being an immense ecological problem, especially small
islands who rely on tourists in search of pristine beaches face increasing pressure
to clean up waste caused by others. Plastic “that ends up in the oceans can
persist for decades” (ibid.) and will eventually harm marine and terrestrial life
alike. Since simply collecting plastic from beaches to make them look nicer is not
a sustainable solution, especially when there is no sufficient waste management
as is often the case on small tropical islands, resulting in the widespread practice
of burning it, the best bet for these destinations is to at least reduce or avoid the
plastic waste they are generating themselves.
7. UN SDGs Sustainable development has been an increasing issue for several decades now.
Starting in 1992 at the Earth Summit in Rio de Janeiro, Brazil, most countries
adopted the Agenda 21 to further sustainable development globally. Following
this, the Member States unanimously adopted the Millennium Declaration in 2000
which led to the formulation of 8 Millennium Development Goals to be reached
by 2015. Now while these goals have brought tremendous change and radically
improved the lives of many, still a lot of work had to be done. Therefore, these
were later rephrased and expanded in 2015 to the 17 Sustainable development
Goals (SDGs) we have now and which are intended to be reached by 2030. In
12
these, the connection between humans and their environment is recognised. The
SDGs essentially aim at addressing most societal problems we face today,
including the effects humans have on the planet we live on. Starting with reducing
poverty, eliminating hunger, increasing health, eliminating inequalities and
generally improving life for humans, the SDGs further aim at creating societies in
which we can sustainably live on this planet in symbiosis with nature, and not
destroying everything. The SDG related to this thesis is SDG 6, “ensure
availability and sustainable management of water and sanitation for all” (“SDG
6”, n.d.). According to the relevant UN homepage, there are currently more than
2.2 billion people worldwide who lack access to safe drinking water (“Water and
sanitation”, n.d.). Severe water stress, often caused by overexploitation or climate
change, is of course also an issue on small tropical islands. The local population,
which traditionally relied on fishing for a living, has in many places switched to
the tourism sector, but has done so without realising the dire consequences of
the side-effects mismanaging this sector brings. The heavy water usage of
tourists and their needs places immense stress on local aquifers. Due to this, a
lot of progress in the management of local water resources as well as a new way
of thinking concerning wasteful water use are needed, especially on the
constrained spaces small tropical islands consist of, where natural water sources
are often scarce.
8. Alternatives to importing bottled water When not having a natural local source of water like sufficient groundwater for a
well or a natural spring, until quite recently the only method of procuring drinking
water was either via rainwater collection or importing bottled water from
elsewhere. However, since the first commercial desalination plant using reverse
osmosis was constructed in 1965 in California, USA, a lot of progress has been
made and different techniques for water generation invented. The most
widespread and commercially viable of these will be shortly analysed in the
following section.

13
8.1 Desalination Of the different techniques of generating water, desalination is probably the most
established and well known. Here, the feedwater (the water which is fed into the
machine to eventually produce drinkable water) is usually processed in one of
the two following ways:
8.1.1 Thermal process
During the thermal process (phase change), the feedwater containing salt
(usually seawater or brackish water) is evaporated and then condensed. While
the water evaporates at optimal temperatures and pressures, the salt is left
behind. The evaporate is then condensed to obtain the sought for freshwater. The
thermal process includes several methods, such as solar distillation (active or
passive), multi-effect evaporation/distillation, multi-stage flash distillation, thermal
vapor compression and mechanical vapor compression (Gude, 2016).
8.1.2 Membrane process
The second common method is the membrane process (non-phase change).
Here a physical barrier, the membrane, is used to “separate the dissolved salts
from the feed water by mechanical or chemical/electrical means using a
membrane separator between feed (seawater or brackish water) and product
(potable water)” (ibid.) The membrane process technologies are mainly
electrodialysis and reverse osmosis.
One of the major problems however is that often the energy which is used for the
desalination process is derived from fossil fuel sources, resulting in an
environmentally unsustainable water production, an exchange of “oil for water”
(ibid, p. 88). While the energy required for the production has drastically
decreased since the advent of the desalination technology, fossil fuel emissions
for energy production still pose a significant impact on air pollution, and often
desalination plants are in regions that are oil-rich like Kuwait, which relies
primarily on desalination for its freshwater (“Desalination by country,” n.d.),
making the cost of fossil fuel derived energy very low (and thus desalination

14
economically viable), one of the main environmental concerns remains: when
extracting H2O from a salty solution like seawater, what remains is essentially
brine - highly concentrated saltwater (Sadhwani et al., 2005). Additionally,
“Desalination plants also utilize significant amounts of chemicals for pretreatment
of saline water and posttreatment of desalinated water. Discharge of large
amounts of chemicals into the coastal waters results in ecological imbalances
and major impacts are usually observed in confined water bodies” (Gude, 2016,
p. 93). According to Gude’s findings, about 2 units of concentrate are generated
for every unit of desalinated water that is produced. And the problem is that this
concentrate is usually simply discharged back into the ocean. The high salinity
and the additional chemicals can cause severe damage to local marine life. Also,
this can affect the quality of the feedwater in the long run. So while the energy
costs (kWh/m³) for desalination, especially the reverse osmosis process, are
rather low compared to e.g. atmospheric water generation, the side effects can
be dire. And this poses a significant threat to the local environment especially on
small tropical islands due to their lack in financing and thus lack in possibility to
treat the discharge water from such facilities. Since small tropical islands often
rely on tourism as their main source of income, degrading the local marine life
(keep in mind that these are often diving destinations) will not only prove to be
environmentally, but also economically unfeasible in the long run.
8.2 Fog harvesting Now while most methods for water generation require a (often not insignificant)
energy input, fog harvesting stands out as a clean and energy free alternative.
There are currently three widespread uses for harvesting water from fog,
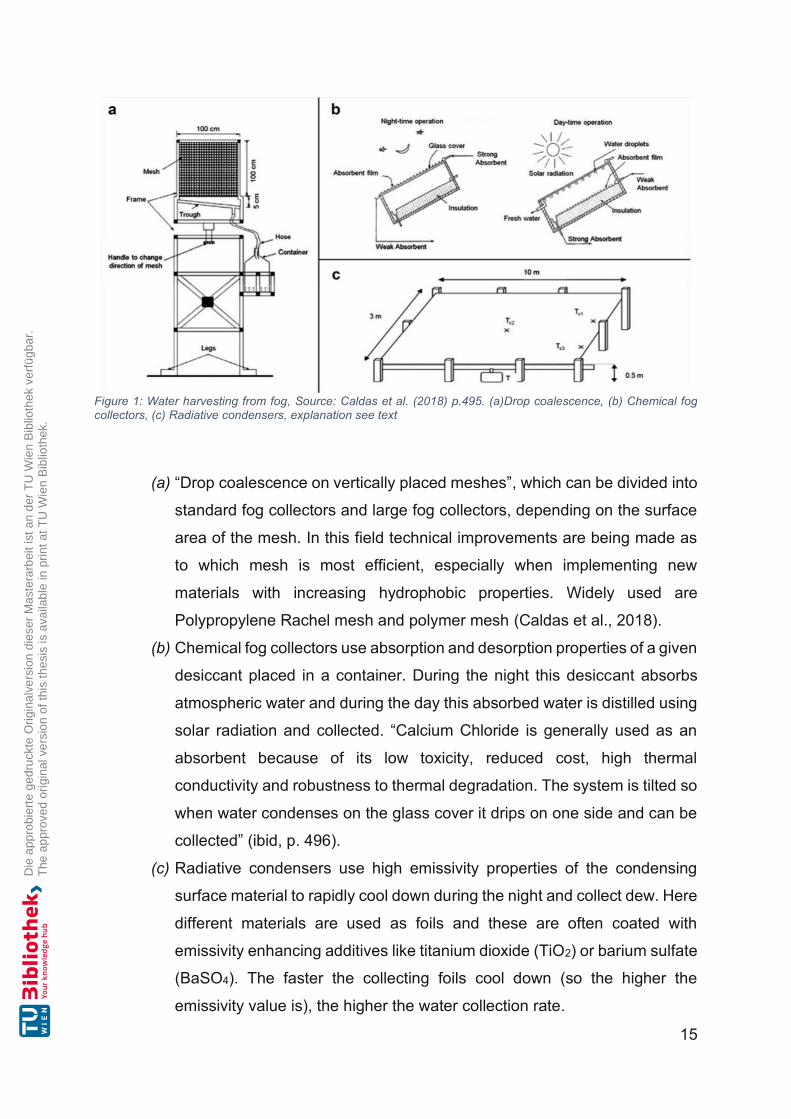
presented in Figure 1 in Caldas et al. (2018):
15
(a) “Drop coalescence on vertically placed meshes”, which can be divided into
standard fog collectors and large fog collectors, depending on the surface
area of the mesh. In this field technical improvements are being made as
to which mesh is most efficient, especially when implementing new
materials with increasing hydrophobic properties. Widely used are
Polypropylene Rachel mesh and polymer mesh (Caldas et al., 2018).
(b) Chemical fog collectors use absorption and desorption properties of a given
desiccant placed in a container. During the night this desiccant absorbs
atmospheric water and during the day this absorbed water is distilled using
solar radiation and collected. “Calcium Chloride is generally used as an
absorbent because of its low toxicity, reduced cost, high thermal
conductivity and robustness to thermal degradation. The system is tilted so
when water condenses on the glass cover it drips on one side and can be
collected” (ibid, p. 496).
(c) Radiative condensers use high emissivity properties of the condensing
surface material to rapidly cool down during the night and collect dew. Here
different materials are used as foils and these are often coated with
emissivity enhancing additives like titanium dioxide (TiO2) or barium sulfate
(BaSO4). The faster the collecting foils cool down (so the higher the
emissivity value is), the higher the water collection rate.
Figure 1: Water harvesting from fog, Source: Caldas et al. (2018) p.495. (a)Drop coalescence, (b) Chemical fog collectors, (c) Radiative condensers, explanation see text

16
Now according to Caldas et al.’s (2018) findings, fog harvesting methods can
yield between 0,38 – 6 litres of water per m² per day, depending on method and
relative humidity. (p. 497). While having a relatively low cost of installation and
negligible detrimental environmental effects (mainly things like mesh or foil
replacements after a few years of use), fog harvesting systems thus provide a
relatively low yield of drinking water and rely heavily on optimal conditions and
relative humidity to work effectively. Further, to produce enough water to supply
more than a handful of people, large areas are needed to set up the systems,
which on small tropical islands is usually not given. Caldas et al. also investigated
the use of mesh for fog harvesting on building façades: these could prove viable
(though there are maintenance issues), but when investigating the use on small
islands, which usually have smaller buildings, this use seems insufficient for water
supply. And when considering that these islands are often touristic, one can
probably assume that most resorts won’t want their bungalows covered in mesh
anyway.
8.3 Atmospheric Water Generation (AWG) The Techniques of harvesting water from thin air is still relatively new. There are,
however, multiple ways and technical variations for capturing the humidity in the
air and converting it to drinkable water (Li et al., 2018; Salek et al., 2018) and
atmospheric water generation is definitely one of the more promising ones for
commercial use.
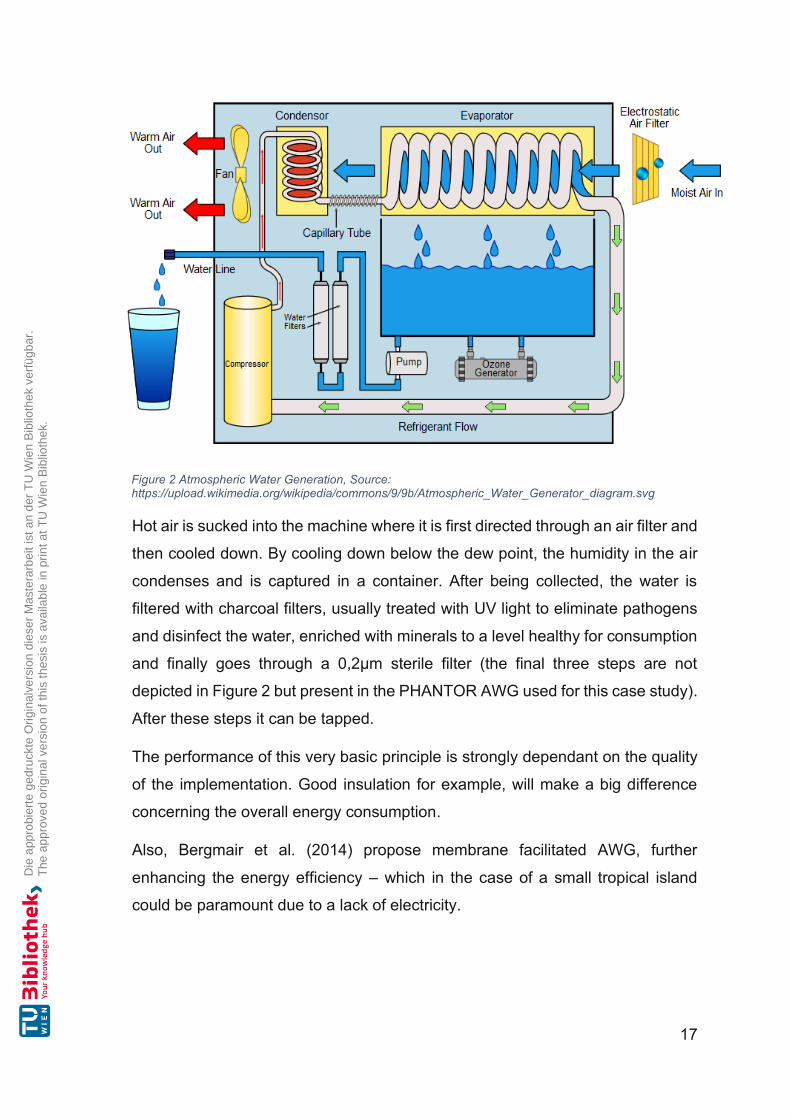
The general principle depicted in Figure 2 is quite simple:
17
Hot air is sucked into the machine where it is first directed through an air filter and
then cooled down. By cooling down below the dew point, the humidity in the air
condenses and is captured in a container. After being collected, the water is
filtered with charcoal filters, usually treated with UV light to eliminate pathogens
and disinfect the water, enriched with minerals to a level healthy for consumption
and finally goes through a 0,2µm sterile filter (the final three steps are not
depicted in Figure 2 but present in the PHANTOR AWG used for this case study).
After these steps it can be tapped.
The performance of this very basic principle is strongly dependant on the quality
of the implementation. Good insulation for example, will make a big difference
concerning the overall energy consumption.
Also, Bergmair et al. (2014) propose membrane facilitated AWG, further
enhancing the energy efficiency – which in the case of a small tropical island
could be paramount due to a lack of electricity.
Figure 2 Atmospheric Water Generation, Source: https://upload.wikimedia.org/wikipedia/commons/9/9b/Atmospheric_Water_Generator_diagram.svg
18
9. Advantages of AWG Since the setting of this thesis is clearly defined, what would be the best technique
of water generation on small tropical islands in terms of efficiency on the one
hand but also considering other constraints like available space or fragile
ecosystems.
When considering desalination plants, these are the most effective in terms of
energy required per produced litre of water. However, the highly concentrated
saltwater that is reintroduced into the ocean clearly disqualifies this method in a
setting that relies on fishing and diving tourism for its subsistence and income.
Fog harvesting, while being environmentally friendly and not influencing the
ecosystem around it, is disqualified for needing a lot of space and essentially not
yielding enough drinking water to supply an island.
This leaves us with atmospheric water generation. Bagheri (2018) investigates
the performances, functionalities and limitations of AWGs. Such decentralized
atmospheric water harvesting solutions, when powered by a clean and
sustainable energy source like solar or wind power, can be viewed as completely
renewable and sustainable, since the atmospheric humidity that is harvested is
“renewed naturally through evaporation from the ocean” (Bagheri, 2018, p. 24)
and does not have any environmentally harmful side-effects. So when optimally
being able to supply the AWG with clean energy, this technique is the perfect
solution for such a setting.
Concerning water quality, this is regularly monitored. For example, when
checking for mineral content, the conductivity of the water can be measured and
when it is not conducive enough, the mineralising compartment of the AWG must
be exchanged, which is part of the normal maintenance procedure. For the AWG
used in the case study, a water analysis is done once the AWG has been set up,
but CTO of the manufacturing company Imhotep.Industries GmbH, Manfred
Ledermüller has assured that water quality exceeds WHO standards.
19
PART II: CASE STUDY
10. The Nexus of Tourism, Pollution, Water and Sustainable Development
The tourism industry, especially in Cambodia, is increasing strongly every year
and thus also gaining in economic importance. With tourist numbers almost
tripling from 2008 – 2018 from 2.1 million to over 6.2 million arrivals, also hotel
occupancy has increased to over 72%, generating receipts valued at around 4.3
billion US$ (Ministry of Tourism, 2018). This is a development that can be
observed in many emerging economies and as Gössling (2001) finds, many of
these “have focused on tourism to generate additional jobs and income, raise
foreign exchange earnings, and to diversify the economy” (p. 180). Especially on
coastal and island settings there has often emerged a dependency on foreign
exchange earnings from the growing tourist sector (Gössling, 2000). Therefore,
there is reason to assume that the tourism industry is something that should not
only be exploited, but also nourished so that it will generate income consistently
in the future. Now obviously one cannot plan for everything, and the current Covid
pandemic is a good example for this. However, when developing infrastructure
and especially tourism-relevant infrastructure, it should be paramount to develop
in a sustainable manner. While bringing certain economic advantages, these
growing numbers of visitors bring with them significant environmental problems
(ibid.).
When wanting to be attractive for tourists as a destination that advertises itself
with paradise-like beaches, as many coastal regions do, one must first analyse
what the tourists would expect to find there. And this brings us to two key aspects
that tourist destinations of this kind are reliant on and that have to do with this
thesis.
The first of these is that often the regions I am focusing on do not have any kind
of or not sufficiently developed waste management. With growing tourist
numbers, the amounts of waste one can find on the beaches increases, thus
degrading the unique selling points of these destinations. Admittedly, the waste
washed up on shores is not always generated on the islands themselves but is
often part of a regional or even global (growing) problem. However, since the

20
tourist numbers can be assumed to directly correlate with the state of the local
environment in terms of waste occurrence, this should be seen as a priority on
the local agenda. The waste problem and the simultaneous need to conserve an
image of paradise has led to spatial fragmentation “into clean places for tourists
and dirty places for residents” (Kerber and Kramm, 2021) in some tropical islands.
Therefore, this thesis will also thematise the plastic waste occurring from the
drinking water supply as it is now and roughly calculate how much could be
avoided using a locally generated alternative.
The second key aspect that will be mentioned here is the availability of clean
drinking water. “Small limestone island nations […] are low-lying with aquifers
composed of single or multiple freshwater lenses […]. Freshwater in these islands
is entirely derived from rainfall and stored in less efficient aquifers, consisting of
freshwater lenses floating on the underlying seawater […]. These limestone
aquifers are generally fragile systems, because shallow depths make them
susceptible to evaporation, transpiration and stresses such as groundwater
pumping, sea tides and climatic events […]. In many limestone islands,
renewable water resources are now over-exploited or approach crisis […]”
(Gössling, 2001, p. 180 and citations therein). The drinking water served on these
islands, if not bottled and sealed tightly, is thus usually derived from rainwater.
This poses significant dangers in the form of water borne diseases and can serve
as breeding grounds for disease carrying mosquitoes. This being quite common
knowledge nowadays, it affects the acceptability of locally generated water by
tourists. As Cambodia is one of the highest Hepatitis endemic countries in the
world, drinking water from insecure sources can pose a significant danger.
Therefore, it is understandable that water that comes in unsealed containers
would probably not be accepted by tourists who are aware of the danger. This
problem will be addressed at a later stage of this thesis.
Finally, when developing a region of any size, in this case an island, in order to
remain competitive in the long term one must develop sustainably. This clearly
entails the aspect of waste, but more generally also that of economic costs.
Therefore, it is in the interest of each island in such a setting and with a core focus
on the tourism sector to carefully gauge if the import of water from the mainland
and the ensuing waste problem is a worthwhile solution. While the plastic bottles
21
for drinking water mentioned in this thesis represent only a fraction of the total
wasted produced on such islands, reducing the overall burden can nevertheless
be characterised in terms of a sustainable development.
Therefore tourism, the pollution it brings, the water it needs and the sustainable
development needed to prevent environmental and long-term economic losses
and resulting poverty must be seen as linked and part of a single plan of action
for small tropical islands.
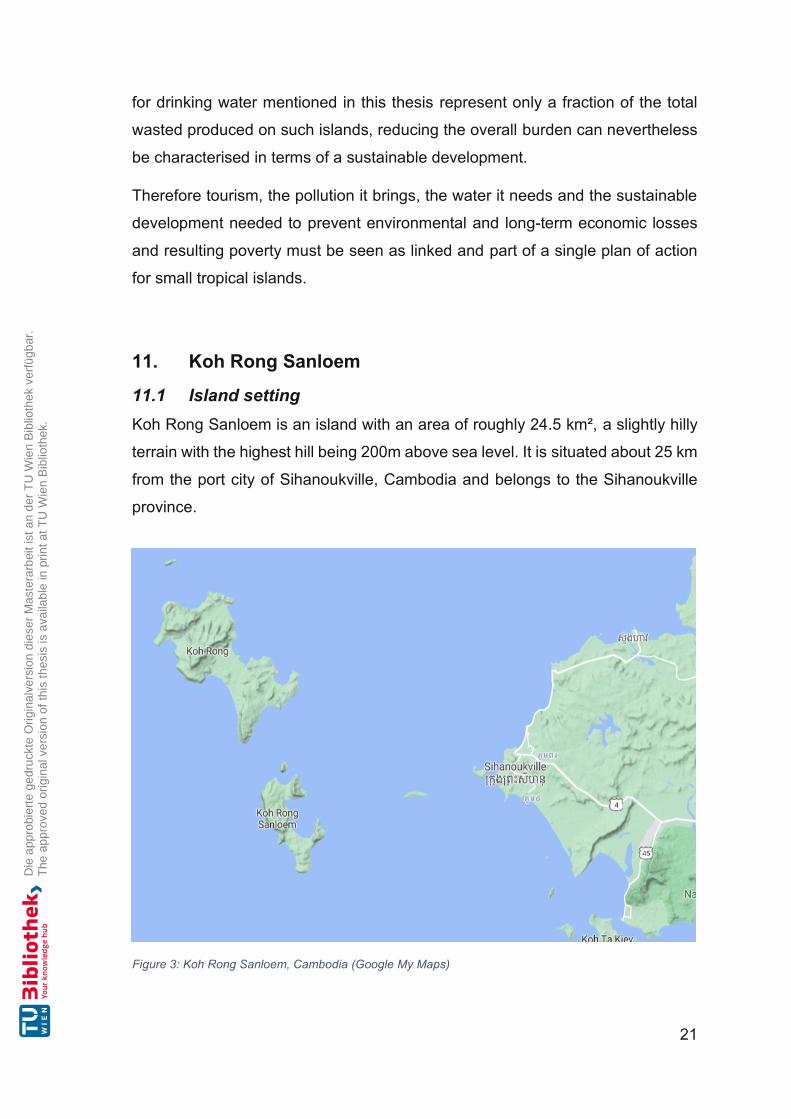
11. Koh Rong Sanloem
11.1 Island setting Koh Rong Sanloem is an island with an area of roughly 24.5 km², a slightly hilly
terrain with the highest hill being 200m above sea level. It is situated about 25 km
from the port city of Sihanoukville, Cambodia and belongs to the Sihanoukville
province.
Figure 3: Koh Rong Sanloem, Cambodia (Google My Maps)

22
The last accessible cencus in 2019 counted 558 local residents on the island.
The number of tourists at any given time was however a much more difficult
number to estimate. Neither the Cambodian Tourism Ministry, nor the “official”
Koh Rong Tourism guide were reachable. Since a precise determination of the
number of resorts on site is currently not possible, I must therefore rely on vague
numbers such as provided by google and the like. Here, 106 “hotels” are currently
listed (“Resorts on Koh Rong Sanloem,” 2021), however these are all either small
shacks, dorms and guesthouses or small to medium sized bungalows. Estimating
based on current room offers, the simpler resorts have around 5 bungalows while
the larger ones have up to 35 bungalows usually accommodating two people.
Due to the complications encountered when gathering such information from
abroad, the estimations here as well as the estimations the case study will be
based on rely on a Thesis on the neighbouring island (Huber, 2020) as well as
expert opinions. However, since the aim of this Thesis is essentially to see if the
implementation of an atmospheric water generation system is feasible on a small
tropical island, I will simply assume a population (including tourists). To this end
the average number of rooms per resort was estimated (an average was
calculated by checking total rooms offered by 20 random resorts on the island,
giving an average of 18.13 rooms per resort) and multiplied by the 106 resorts
listed for the island, totalling 1922 rooms. When calculating that each of the rooms
has two people staying there, this would mean 3844 tourists on the island at full
occupancy. Assuming an occupancy of 72% as indicated in the official statistics
by the Cambodian Ministry of Tourism (2018), this would mean there are on
average 2767 tourists plus 550 locals on the island, totalling about 3300 people.
One must of course keep in mind the strong variations between high season and
low season. But for the sake of simplicity and due to lack of actual data, I will
assume a water-consuming population on the island of 2.000 during low season
and 4.000 during high season, based on average rooms, average hotel
occupancy of 72% and numbers from the neighbouring island provided by Huber
(2020). Huber’s research found that for the roughly 100 resorts on the
neighbouring island of Koh Rong, there were “an average of 1.800 – 2.000
tourists present daily during low season and 3.000 – 4.000 during high season”
(p. 15). When taking into account that tourism has been steadily increasing on

23
the islands and in Cambodia in general, I think the assumptions made for this
islands population to calculate water consumption are fairly safe. And when then
checking for the feasibility on a similar island one can compare that islands water
need based on that island’s population, no matter if the number for Koh Rong
Sanloem was 100% exact or not.
Currently, the water consumed on Koh Rong Sanloem is imported by ferry from
the mainland, usually bought in the port city of Sihanoukville. According to
information provided by local sources, the current water price is 2.000 KHR per
litre on the mainland and 4.000 KHR per litre on the island, which translates to
0,4€ and 0,8€, respectively. The higher price on the island is due to transport
costs such as the transport from the individual shops to the ferry and the ferry
ticket (once the water reaches the island it is transported on foot since there are
no roads). Now since we are aiming to supply water on the island, the 4000 KHR
i.e. 0,8€ are the value we are aiming to undercut, since neither the resorts nor
the locals would buy the AWG water if it were more expensive. True, there would
always be the benefit of reducing harmful microplastic ingestion, but (and this is
probably very unscientific) a lack of education in such rural areas or knowledge
concerning microplastic in general would not suffice as argument to buy the
produced water, while the economic argument would.
11.2 Calculating drinking water needs for Koh Rong Sanloem Since this thesis aims at producing (and eventually selling) drinking water, one
must know how much water is actually needed on the island since production at
an optimum level is most energy and cost efficient. So to maximise revenue and
have lowest costs per litre of produced water, one would be aiming at constant
full production and selling all of the produced water.
Now assuming the 2.000 people in low season and 4.000 people in high season
as calculated above, how much drinking water would be needed? On the one
hand one could simply look at how much water humans should drink per day.
This varies, depending on age and sex, but also on factors such as climate and
physical activity. The adequate intake of water (in a normal climate with average
activity), would thus lie between 2 and 4 litres a day (Grandjean, 2005). On the

24
other hand, this calculation would not take into account different beverages like
beer, juice, etc. consumed by tourists, water used to make ice (used in
beverages), water used for cooking purposes, etc. So assuming some water is
also wasted, For the sake of simplicity in this thesis I will calculate with 3 litres of
water from an AWG would be consumed per person per day. This would mean
that, sticking to our calculation, there would be a daily need of roughly 6.000 litres
of water in low season and 12.000 litres of water in high season. These are the
numbers I will thus base the case study on and that would be used as reference
consumption values when using the data gathered in this thesis for similar
islands. It is however common practice on such islands that water for cooking or
guest showers is processed water (not from plastic bottles, but not from rainwater
either, since there would simply not be enough), possibly ground water (though
not processed enough for drinking purposes). As an example, one of the resorts
on the island purifies groundwater for their sanitary installations. Of course, it is
hard to calculate how much water would be eventually bought from a local AWG,
but it might be good to keep in mind that the demand for water in general is there
and could be exploited economically in the case that not all would be bought as
bottled drinking water. For the final calculation I will nevertheless assume that all
generated water can be sold. According to the expert opinion of Dipl. Ing. Dr.
Mario Ortner, it is safe to assume that tourists on the island will consume roughly
10l per capita daily – far more than our AWG could produce.
11.3 Atmospheric Water Generation Now the question is, how much could the AWG produce? To produce water from
the atmosphere, the most relevant parameters are temperature and relative
humidity. The closest data available to this end is from Kampot, roughly 90km
away from Koh Rong Sanloem. Figure 4 below shows data from 2020 concerning
average monthly temperature, relative humidity, power consumtion and the
hereon based monthly water yield in m3.
25
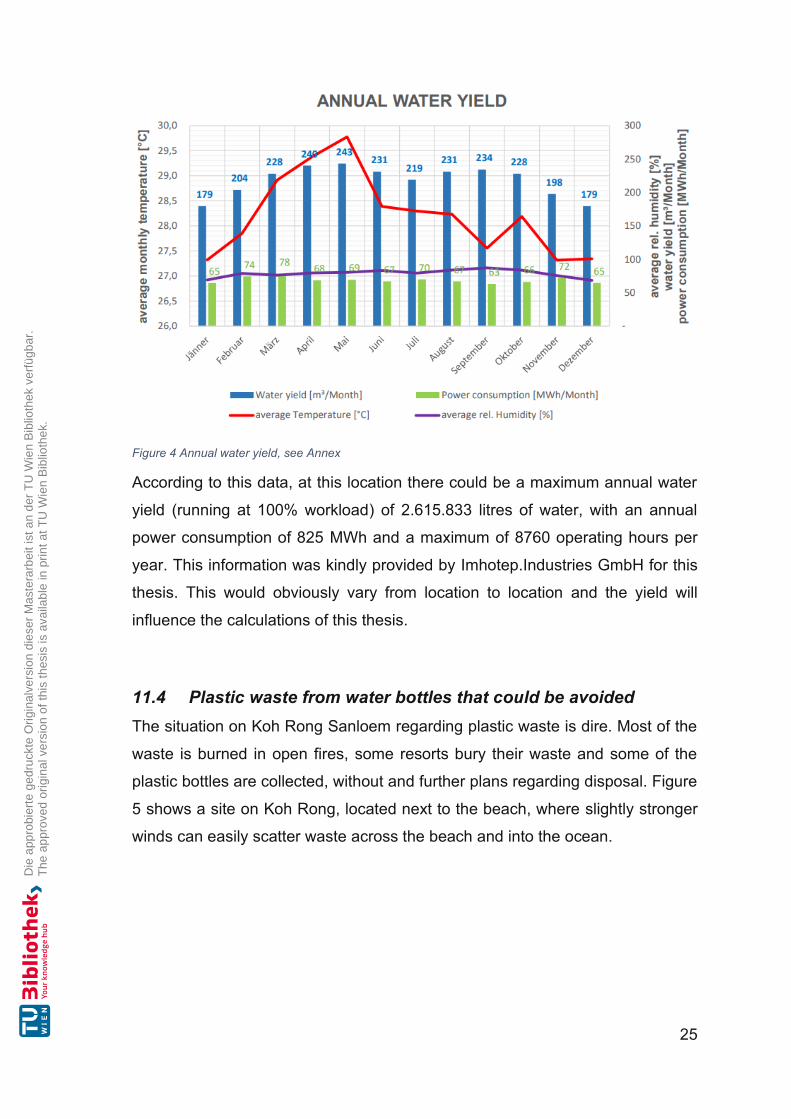
Figure 4 Annual water yield, see Annex
According to this data, at this location there could be a maximum annual water
yield (running at 100% workload) of 2.615.833 litres of water, with an annual
power consumption of 825 MWh and a maximum of 8760 operating hours per
year. This information was kindly provided by Imhotep.Industries GmbH for this
thesis. This would obviously vary from location to location and the yield will
influence the calculations of this thesis.
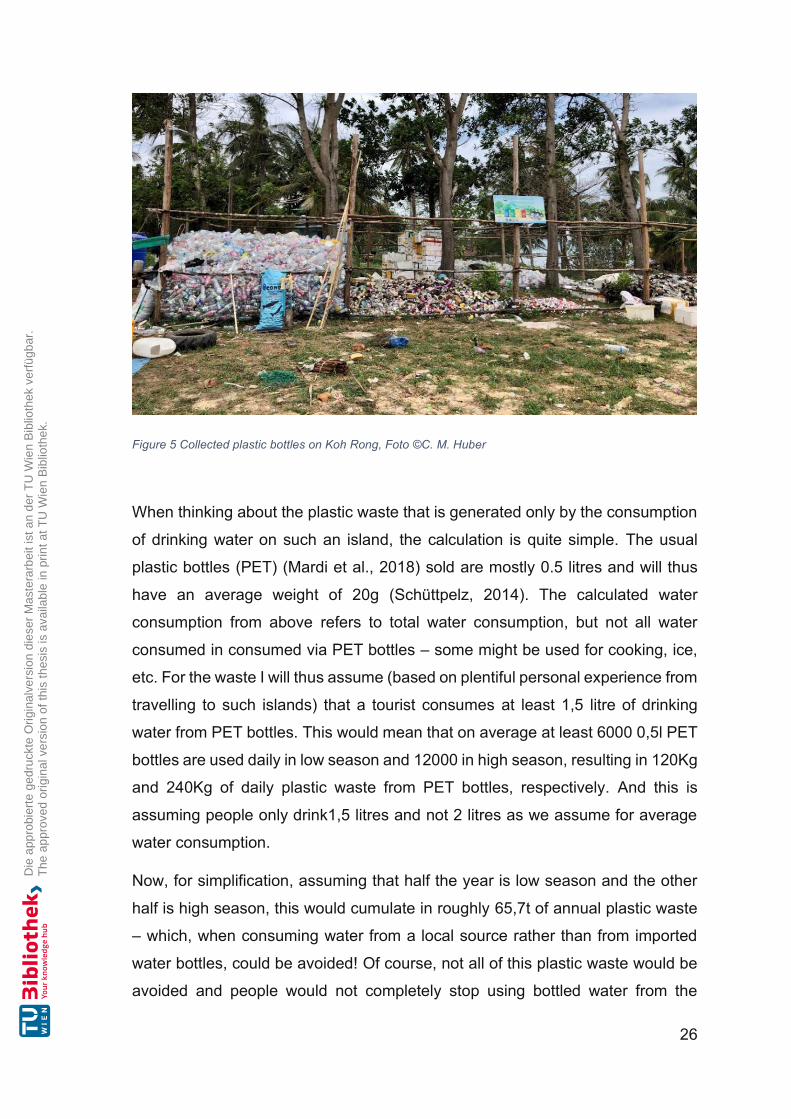
11.4 Plastic waste from water bottles that could be avoided The situation on Koh Rong Sanloem regarding plastic waste is dire. Most of the
waste is burned in open fires, some resorts bury their waste and some of the
plastic bottles are collected, without and further plans regarding disposal. Figure
5 shows a site on Koh Rong, located next to the beach, where slightly stronger
winds can easily scatter waste across the beach and into the ocean.
26
Figure 5 Collected plastic bottles on Koh Rong, Foto ©C. M. Huber
When thinking about the plastic waste that is generated only by the consumption
of drinking water on such an island, the calculation is quite simple. The usual
plastic bottles (PET) (Mardi et al., 2018) sold are mostly 0.5 litres and will thus
have an average weight of 20g (Schüttpelz, 2014). The calculated water
consumption from above refers to total water consumption, but not all water
consumed in consumed via PET bottles – some might be used for cooking, ice,
etc. For the waste I will thus assume (based on plentiful personal experience from
travelling to such islands) that a tourist consumes at least 1,5 litre of drinking
water from PET bottles. This would mean that on average at least 6000 0,5l PET
bottles are used daily in low season and 12000 in high season, resulting in 120Kg
and 240Kg of daily plastic waste from PET bottles, respectively. And this is
assuming people only drink1,5 litres and not 2 litres as we assume for average
water consumption.
Now, for simplification, assuming that half the year is low season and the other
half is high season, this would cumulate in roughly 65,7t of annual plastic waste
– which, when consuming water from a local source rather than from imported
water bottles, could be avoided! Of course, not all of this plastic waste would be
avoided and people would not completely stop using bottled water from the
27
mainland, but even reducing this figure by say 70% (based on a good acceptance
of our produced water) would have a huge impact.
11.5 Electricity on the island Although there is often a huge potential for the implementation of renewable
energy in the form of PV or wind farms, most “islands in both developing and
developed countries are heavily reliant on fossil-fuel based electricity generation”
(Huber, 2020). Even though this would sometimes be possible due to their
relative proximity to the mainland, the investment costs for underwater cables to
connect a given island to the mainland’s power grid mean that islands are
essentially cut off from power supply and must rely on local electricity generation
(Curto et al., 2019). Momentarily the island population and all the resorts there
generate their entire electricity using small diesel generators. Diesel generators
are the most common source of electrical power in off-grid locations such as small
islands, since their acquisition costs are comparatively low and the fossil fuels
needed for power generation are widely available. The widespread use of these
generators causes several problems and disturbances. First of all, such diesel
generators have quite significant emissions. These include greenhouse gases
(GHG) such as carbon monoxide (CO), carbon dioxide (CO2), and the different
nitrogen oxides (NOX), but also particle matter (PM), which consists largely of
“elemental and organic carbon soot, coated by gaseous organic substances such
as formaldehyde [CH2O] and polycyclic aromatic hydrocarbons (PAHs) which are
highly toxic” (Jakhrani et al., 2012). While the fuel consumption of different
models of generators may vary, as would the carbon content in different fuels, it
is generally assumed (for sake of simplicity) that a litre of diesel will produce
around 2.7 Kg of CO2 when burned (ibid). So on an island like Koh Rong
Sanloem, where there are around 100 resorts, each with their own generator, in
addition to the local population, this adds up to a significant impact. This can also
include increased mortality linked to diesel soot exposure (ibid).
Another disadvantage are the sound disturbances caused by such generators.
While the exact amount of decibel emitted will vary between models, diesel

28
generators are sure to disturb local fauna and (to not forget the economic side)
tourists.
On the upside, many tropical islands have optimal preconditions for clean energy
production such as Photovoltaic (PV) plants. The proximity to the equator means
an optimal angle of the sun, which essentially results in improved solar energy
conversion.
As a perfect example for this suitability, on the island of Koh Rong (the
neighbouring one) a PV plant was constructed in the course of 2020 and is now
in operation, supplying the island with clean and renewable energy, essentially
eliminating a major source of emissions. One problem that remains however, is
that while these plants might generate enough electricity during the day, low
battery storage capacities resulting from high costs result in generators still being
needed for night-time power supply. Nevertheless, a huge part of carbon
emissions is offset with such installations.
In regard to Koh Rong Sanloem and the case study beforehand, there is not
currently any form of PV installed. However, there are plans by the company Total
Solar Distributed Generation to build a 1.25 kWp PV plant to cater for the island’s
electrical power needs (“Total Solar DG to build one of Southeast Asia’s largest
renewable energy microgrids in Cambodia,” 2021). According to this article, the
plant is to reduce the islands diesel consumption by 600.000 litres per year. Now
while this is from an environmental perspective a great improvement, there is little
change from an economic perspective. According to the supervisor of this thesis
Dipl. Ing. Dr. Mario Ortner, who runs the PV plant on the neighbouring island of
Koh Rong and is an expert in this field, one can calculate with energy costs of
0.5USD (0,42€) per kWh for both forms of electricity – diesel and PV – on the
island. Since the company Total Solar Distributed Generation was not reachable
for a quote on energy costs once the PV plant is completed, this is the value I will
use for the calculation in the case study.
One of the offers made by Imhotep.Industries GmbH includes a 508 kWp PV
system which includes 1.275 kWh Battery Capacity and could supply the energy
needed to produce water and even generate a surplus of 98 MWh per year (these
numbers were supplied by the company), which could be sold.

29
12. Transportation of an AWG to the island While Imhotep.Industries GmbH, the AWG company chosen for this thesis,
arranges transport of an AWG to the closest large harbour (which in our case is
Sihanoukville, roughly 25km from the island) for 30.000€ for a standalone AWG
and 70.000€ when including a PV system, a much larger problem is posed by the
actual transport to the final location on the island. Many small tropical islands do
not have a proper harbour, with cranes and infrastructure to offload a 14t
container, place it on a truck and transport it to the final location. Often such
islands do not even have asphalted roads. Now how could one gat such a
massive cargo onto an island? One option only briefly mentioned here would be
to use a heavy lifting helicopter. Not many helicopters can lift cargo of slightly
more than 14t. There are only a handful of models, mostly used by the military,
such as the Sikorsky CH-53 and its several variants, the MIL MI-6, MIL MI-10 and
Mil MI-26. However, since they are mostly used by military, a calculation of costs
would surpass the scope of this thesis, such helicopters might even be supplied
by governments when considering that such a project would secure the water
supply for an island’s population. This route would also be proposed to be taken
for the current project and thus the costs of transportation from the harbour of
Sihanoukville to the final location on Koh Rong Sanloem will be valued at 0€.
13. Location on the island Another significant risk when setting up a project in most Asian countries as a
foreigner (and in this case I am a foreigner – this would not hold for communal
implementation of such a project or by a national company) comes when
considering a location for the AWG. Often, buying actual land as a foreign
company (or even privately) is not possible. In Cambodia there are certain
workarounds though, which each have their own advantages and disadvantages.
One option would be to create a Land Holding Company (LHC). While the
majority (51%) of the company must be held by a Khmer national, the remaining
49% together with all the decision-making and voting rights can be contractually
30
controlled by the foreigner. This practice is often offered by local law firms who
charge an annual fee for providing the local shareholder. The setup costs for such
a LHC vary between $4.000 - $12.000, depending on the law firm. In the
calculation I will thus assume a mean value of 8.000€ for the setup of a LHC.
Another, significantly cheaper and faster option for property purchase in
Cambodia is what is known as the “nominee structure”. Usually a Khmer partner
of a given project is put forward as nominee who will hold the property. Now while
this could definitely carry some risk, there are several options to mitigate the risk
of losing the property. For example, a mortgage agreement is registered at the
government and prevents any transfer of the land title without permission. A
significant benefit of this structure is that no profit taxes are to be paid and no
monthly/quarterly tax statements to be submitted. Due to lack of information, a
set up cost for this simpler structure is assumed to lie at 1.000€. According to
information obtained from the neighbouring island (provided by Dipl. Ing. Dr.
Mario Ortner), the lease for one hectare of land costs $3.000 per month, which is
about 2.500€. It will be assumed for all four models that one hectare of land is
leased.
The law firm that provided this information suggests using the nominee structure
for investments under and LHC for investments above $1.000.000 (“IPS
Cambodia,” 2021).
14. Bottling of produced water Now one of the main aims of such a project would be avoiding waste in the form
of plastic bottles. The drinking water consumed on Koh Rong Sanloem is at the
moment imported in single-use plastic bottles which are either burnt after use or
stored indefinitely. This is standard practice on many islands of this size.
However, the problem of tourist-acceptability remains. (Usually western) Tourists
often do not trust water in unsealed containers.
Now to manage the problems of waste and acceptability, a solution would be the
direct filling on site into glass bottles. There are quite a few standalone machines
that can wash, fill and seal glass bottles which can then be reused. These come
31
in all sizes and prices, from small craft-beer filling stations for private use to large
scale food-Industry filling arrays.
For the calculation in the case study I will use a machine supplied by Jiangsu
Mesure Machinery Co., Ltd., which is suited for washing, filling and capping of
glass bottles (hereafter referred to as “Filling Station”). After correspondence, the
company has proposed model BCGN 12-12-6 (“Automatic 3-in-1 CSD Beverage
Filling Bottling Machine,” 2021). This specific machine costs around 80.000€ and
is just one of many options. There are cheaper variants with less bottles filled per
hour, but they often are only fitted to fill single-use PET bottles, and we are trying
to eliminate those from the island. I will use the 80.000€ mentioned above for
calculation, but this figure would obviously have to be adapted (or even left out if
not needed) when implementing a similar project somewhere else. While the
model proposed can fill up to 3000 bottles per hour, the washing process requires
500 litres of water per hour, resulting in a total water usage of 7.000 litres in an
2h operation period and 6.000 bottles of water. This must be kept in mind when
calculating, since the output of water is essentially cut by 1.000 litres. There are
models that would produce slower and cost less, but they would consume more
water in total for washing, so this is the ideal option when no external water is
available for washing. The numbers regarding price, bottles filled per hour and
water usage for washing were obtained directly from the company via private
communication.
One must keep in mind that the issue of bottling would probably not arise on small
tropical islands with low tourism numbers, that could simply distribute their locally
produced water through pipage or fill it directly from the AWG into large
containers, without the need of a separate Filling Station.
The next thing one must address when choosing to provide a filling service for
the produced water is the actual bottles. Since we will be producing up to 7.000
litres of water daily, there will be a need of at least 15.000 1l bottles in circulation,
also accounting for backup since eventually some of them will break. The costs
per glass bottle lie between 0,1€ and 0,6€ when purchasing in bulk (“Glass Bottle
Prices,” 2021) and I will calculate with an average price of 0,25€ for simplicity,
always keeping in mind that this is just a rough calculation that would be
32
customized according to need. This would mean a total cost of 3.750€. In
addition, one would need a structure for filling and storage of the bottles, situated
next to the AWG, since the filling machine should be kept indoors – and for
sanitary reasons. Construction on such islands is relatively cheap (but not easy,
since everything must be done by hand!) and will be valued at 5.000€. Transport
of this specific filling machine poses a similar problem as the AWG, as it comes
in a 40HQ container and might also have to be airlifted from the harbour of
Sihanoukville. The used Model requires 3,5 kW to run, but this will not be
incorporated into the calculation (just as the 1,5 kW on the AWG roof is not
incorporated into the calculation – this would eventually even out).
15. Maintenance Maintenance of AWGs is fairly simple in general. It can be assumed that the
handful of serious AWG producing companies will produce similar machines and
thus the maintenance will be rather comparable throughout the range of products.
Since this thesis will be using the specifications provided by the company
Imhotep.Industries GmbH for their PHANTOR AWG, I will use these to showcase
the maintenance needed for these machines in general. The PHANTOR will notify
the operator once any of the following steps need to be done, usually with a few
weeks prior notice to give the operator time to procure eventual spare parts like
filters if necessary. The components that require maintenance are the following:
• The air filters need a replacement every few months, depending on local
air pollution.
• There are charcoal filters that have to be exchanged roughly every 4
months, depending on location (the air pollution of the environment directly
influences this). This is easily done by opening a hatch, taking out the old
filter and replacing it with the new filter.
• The UV- radiator might have to be swapped up to 4 times per year. This is
a relatively simple swapping of a UV-lamp.
• The minerals that provide the generate water with the necessary
mineralization must be exchanged approximately 4 times per year. For this
the container containing the old minerals is taken out, these are discarded
33
(this is essentially salt-like granulate that does not need special disposal)
and the new minerals are poured into the container.
• Also the sterile filter might need a quarterly replacement.
All the replacement intervals are approximated and might vary according to
location and usage but are very simple in general and the operator will receive a
thorough training as to how to carry out maintenance.
Apart from these simple exchanges, the Inspection of the chiller must be carried
out by a trained technician sent by Imhotep.Industries GmbH. Further, every
approximately 5-6 years the air fan will have to be replaced, which will also be
carried out by the producing company. The costs for the former five replacement
parts were estimated for the calculation by Imhotep.Industries CTO Ledermüller.
The costs for the chiller inspection as well as spare parts such as the fan are
included in the annual reserves for repairs (see the calculation later).
Further, the costs for the first 3 years of filters and other exchangeable parts are
included in the buying price. Therefore, in the calculation the price for
maintenance is not 5.000€ per year but lower and will be rounded up to 4.000€
and 4.500€ for standalone AWG and including PV, respectively.
16. Staff To carry out needed maintenance, eventually guard the site and machinery as
well as carry out the filling in case of this option, local staff is needed. This staff
would receive the training from Imhotep.Industries GmbH regarding any
necessary maintenance, be instructed on how to operate the filling machine and
optimally live on site or close by to prevent theft, vandalism, etc. It is estimated
that for these operations two full-time personnel will be required, operating and
monitoring the site (also to prevent theft or vandalism). Their monthly salary is
estimated to amount to 700€ each and could eventually include living space on
property as well as other living costs, depending on the project. While this would
definitely have positive implications such as creating two high paying jobs for
locals, finding and training trustworthy people to safely and efficiently operate the
facility might prove difficult. The salary is based on a similar operational position
34
Huber (2020) proposes in her pilot project on the neighbouring island and would
probably be comparable to this case.
17. Earnings The main earning of a project as described come from selling the generated
water. At the location chosen, a maximum of 2.615.833 litres of water can be
generated, based on temperature and relative humidity. This would mean an
average daily production of 7167 litres of water, which I will round to 7000l
generated per day for the calculations. When looking at the monthly production
(see Figure 4 or Annex), one could remark that for example only 5774 litres could
be produced (179m³ / 31 days) and thus sold on a daily average in January, but
since this is low season, and since in the months where more could be produced
also more tourists would be on the island (high season), this discrepancy is
expected to even out, thus the average of 7000 litres for the calculation. Since
the current price of 1 litre of water on the island is 4000 KHR, so 0,8€, we could
sell the produced water at a price of 3000 KHR, which would translate to 0,6€/l.
This will be the main form of revenues.
In addition, when installing a PV plant, one could sell the surplus electricity
generated during the day, which, as provided by Imhotep.Industries GmbH, could
amount to 98 MWh per year. This could be sold at the local price of 0,42€ per
kWh.
18. Expenses First of all, all calculations and numbers in this thesis, as far as possible and when
not referring to other scientific papers as source, will be done in Euro (€). Since I
will be calculating for different scenarios, there are several expenses one must
mention beforehand. The PHANTOR AWG by Imhotep.Industries GmbH used for
this thesis costs 503.058€. When choosing the option including a sufficient PV
plant, the total system costs are valued at 1.750.377€. Transportation to the
closest harbour is estimated to be 30.000€ and 70.000€, respectively. While there
is no material needed to produce water via an AWG, there are the above-

35
mentioned maintenance costs of 3.854€ for the AWG or 3.651€ per year when
including a PV plant to cover energy needs (this value is lower because with PV
we would be running at 90% capacity, essentially prolonging the lifetime of the
spare parts). However, for the calculation I will use a value of 4.000€ per year to
be on the safe side (and for simplicity) – this would be location specific anyway
since it is capacity-dependent. Additionally, there will be reserves for repairs of
3.773€ or 8.752€ annually (based on CAPEX), for the standalone setup and when
including PV, respectively – rounded to 4.000€ and 9.000€ in the calculation. In
addition to this, there will be cloudservice costs of roughly 6.000€ per year. This
feature would eventually be calculated per litre and includes all monitoring and
informing of the customer when maintenance is needed and supplies any other
needed operational information. All these numbers were kindly provided by
Imhotep.Industries GmbH for this calculation (see Annex).
Then there are the two local staff with a monthly wage of 700€ each. Insurance
of the project will be valued at 1% of total investment costs. For a Filling Station
I will use a placeholder value of 80.000€ based on an offer made by Jiangsu
Mesure Machinery Co., Ltd. in personal communication, since there are various
different machines and manufacturers specialising on different needs. For the
Figure 6 The PHANTOR AWG, www.imhotep.industries
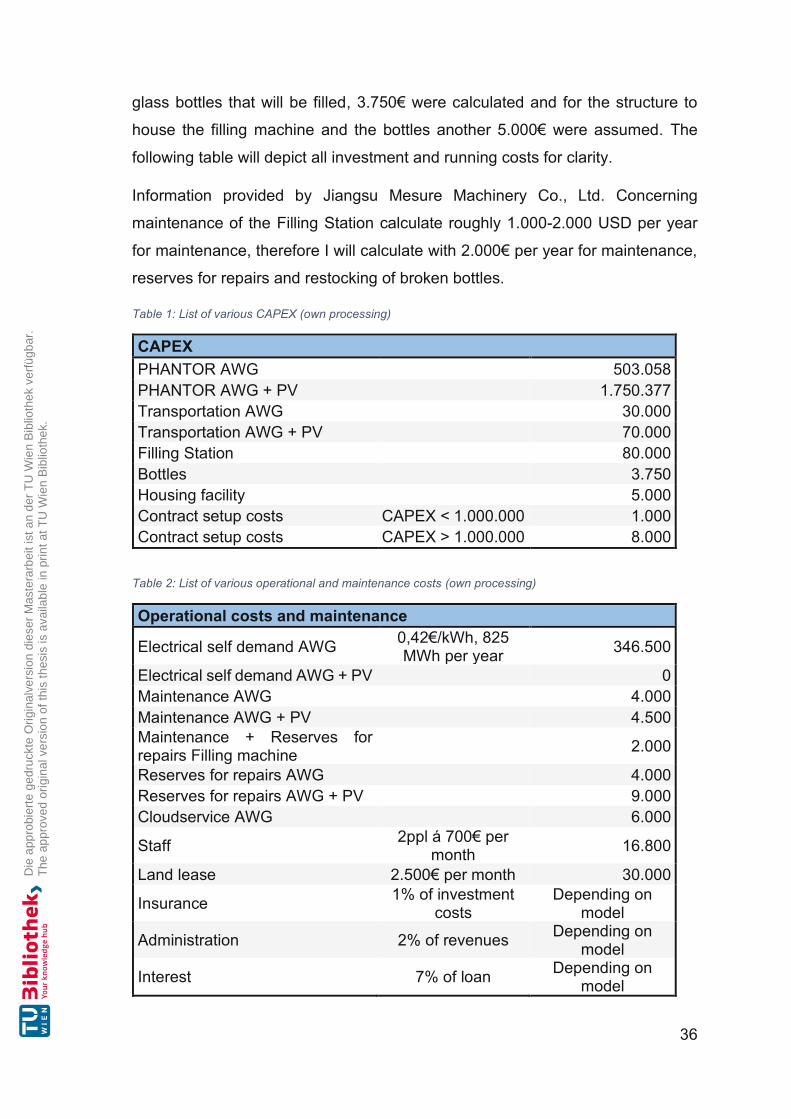
36
glass bottles that will be filled, 3.750€ were calculated and for the structure to
house the filling machine and the bottles another 5.000€ were assumed. The
following table will depict all investment and running costs for clarity.
Information provided by Jiangsu Mesure Machinery Co., Ltd. Concerning
maintenance of the Filling Station calculate roughly 1.000-2.000 USD per year
for maintenance, therefore I will calculate with 2.000€ per year for maintenance,
reserves for repairs and restocking of broken bottles.
Table 1: List of various CAPEX (own processing)
CAPEX PHANTOR AWG 503.058 PHANTOR AWG + PV 1.750.377 Transportation AWG 30.000 Transportation AWG + PV 70.000 Filling Station 80.000 Bottles 3.750 Housing facility 5.000 Contract setup costs CAPEX < 1.000.000 1.000 Contract setup costs CAPEX > 1.000.000 8.000
Table 2: List of various operational and maintenance costs (own processing)
Operational costs and maintenance
Electrical self demand AWG 0,42€/kWh, 825 MWh per year 346.500
Electrical self demand AWG + PV 0 Maintenance AWG 4.000 Maintenance AWG + PV 4.500 Maintenance + Reserves for repairs Filling machine
2.000
Reserves for repairs AWG 4.000 Reserves for repairs AWG + PV 9.000 Cloudservice AWG 6.000
Staff 2ppl á 700€ per month 16.800
Land lease 2.500€ per month 30.000
Insurance 1% of investment costs
Depending on model
Administration 2% of revenues Depending on model
Interest 7% of loan Depending on model

37
19. Financing In order to reduce the risk, a widely used financing strategy is to provide 30%
equity capital and take out a loan on the remaining 70% of capital expenditures
(CAPEX). This way investors are faced with a lower risk and can result in a better
performance of equity capital. As will be shown later, due to a very high revenue
if selling all the produced water, the amortization period will be very short. The
loan used for the calculations will be taken out for a 6-year period and the interest
will be 7%, values which would have to be adapted to any given scenario and
available conditions. In addition, there could be the possibility of co-financing by
development bank or governments, since essentially such a project could
eliminate water scarcity on small islands.
20. Profit and Loss Analysis When calculating a possible profit from selling a product one must of course
consider demand for said product. In this case there are some uncertainties which
must be addressed. First of all, sales of the produced water are obviously reliant
on the rate of acceptance. This is a value that is hard to calculate and will differ
according to setting of such a project. I must therefore assume that all water that
can be produced will also be sold. Currently water in 0,5l PET bottles costs 2000
KHR on Koh Rong Sanloem, which is around 0,4€, so 0,8€ per litre. This is the
price one would have to undercut to increase acceptability by the local population
(who would also be supplying it to the tourists). This thesis will therefore explore
if a profit can be made when selling the water at 0,6€ per litre.
A second uncertainty lies in the mode of distribution: is there an existing pipe
system for distribution? Must the water be filled first? Since an aim of this thesis
is also to reduce the burden of plastic waste, the calculations that include filling
will be based on costs for the Filling Station mentioned above, supplied by
Jiangsu Mesure Machinery Co., Ltd., to showcase how much such an option
would cost.
Finally, a sustainable production of water is to be achieved. This includes the
energy used for production. So when there is a local source of energy (and this
is optimally a source of clean energy), this can be used. For the calculation I will

38
use a price of 0,42€/kWh, since this is the price on the neighbouring island and a
similar price can be assumed here. There will be cases, however, of tropical
islands that do not have sufficient electrical energy available. To not have to rely
on yet another diesel generator, an option will be included for a project that has
a PV plant.
This leaves us with four Profit and Loss calculations:
• A standalone AWG using locally produced electricity.
• An AWG using locally produced electricity with an adjacent Filling Station.
• An AWG with a PV plant to produce sufficient electricity for production.
• An AWG, with a PV plant and a Filling Station.
These four models will give possible communities or investors contemplating
such a project different options for implementation, depending on need.
21. Performance indicators Following each model, I will analyse how the performance would be, based on
three values. The Debt Service Coverage Ratio (DSCR) is an indicator which
shows how easily (if at all!) an investment will generate earnings to repay any
liabilities such as a loan taken and the interest payments thereof. A good DSCR
value should lie above 130% to assure a feasible investment, able to pay off the
loan and generate profit. The calculation is EBITDA minus the tax and this then
divided by the annual redemption and the interest. The second indicator I will use
is the Return On Equity (ROE), which indicates how well the invested equity
capital performs. This could be comparable to the interest rate one receives when
depositing capital in a bank but is usually much higher (the downside is that one
cannot simply withdraw the capital as from a bank, since it is invested). Since the
risk in developing countries is often higher due to political instability, corruption,
etc., one should aim at a ROE of at least 20% to offset the risks. The final indicator
is the Return On Assets (ROA), which instead of using only the equity capital
calculates the “interest” earned from the entire invested capital, including loans.

39
21.1 Model 1: Standalone AWG This calculation will focus on the setup of an AWG and the sales of the produced
water. The calculated water generation is based on the island of Koh Rong
Sanloem and rounded to 7.000 litres per day. The electricity needed to produce
water is bought locally for 0,42€.
Table 3: Model 1 – Profit and Loss Analysis AWG (own processing)
Profit and Loss Analysis
Reference Sum €
Revenues
Water sold at 0,6€/l 7.000l generated per day,
365 days
1.533.000
Gross margin 1.533.000
O & M
Electrical self-demand 0,42€/kWh, 825 MWh per
year
-346.500
Maintenance AWG -4.000
Reserves for repairs AWG -4.000
Cloudservice AWG -6.000
Staff 2ppl á 700€ per month -16.800
Insurance 1% of investment cost -5.341
Administration 2% of revenues -30.660
Land lease 2.500€ per month -30.000
Total O&M cost -443.301
EBITDA 1.089.699
Depreciation 15 years -35.604
EBIT 1.054.096
Interest 7% of loan, 6 years payback
period
-13.084
EBT 1.041.011
Tax 20% -208.202
EAT 832.809
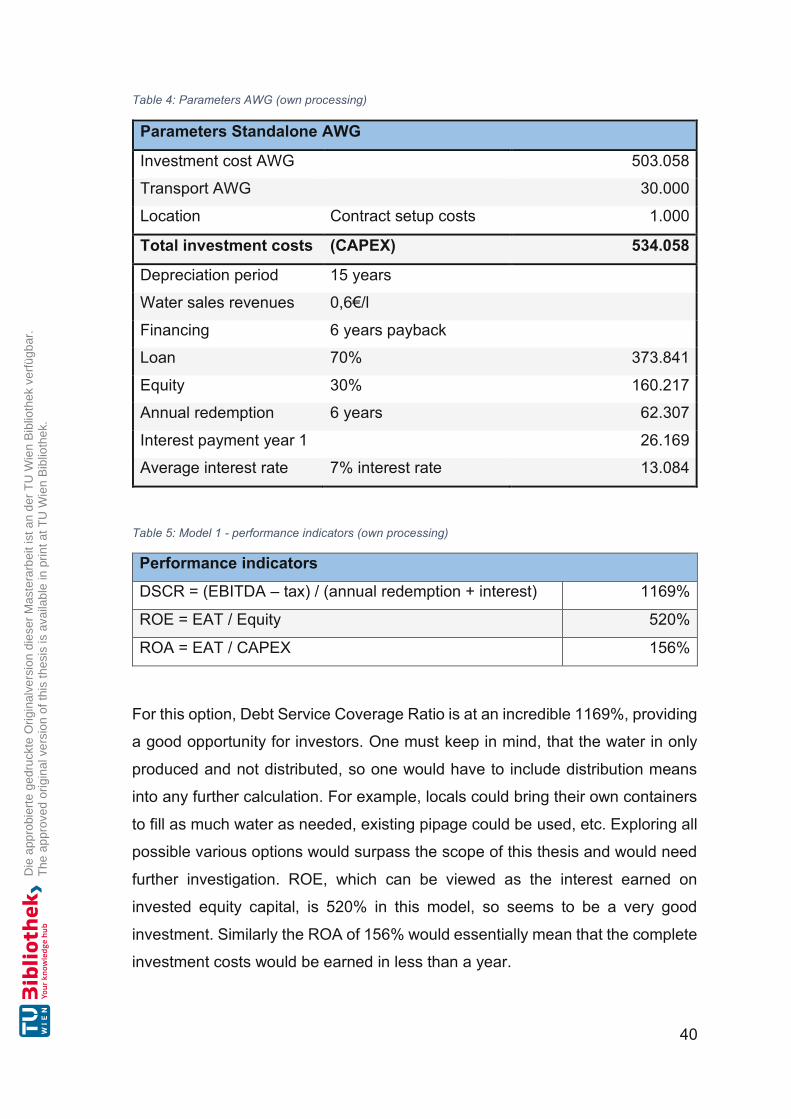
40
Table 4: Parameters AWG (own processing)
Parameters Standalone AWG
Investment cost AWG 503.058
Transport AWG 30.000
Location Contract setup costs 1.000
Total investment costs (CAPEX) 534.058
Depreciation period 15 years
Water sales revenues 0,6€/l
Financing 6 years payback
Loan 70% 373.841
Equity 30% 160.217
Annual redemption 6 years 62.307
Interest payment year 1 26.169
Average interest rate 7% interest rate 13.084
Table 5: Model 1 - performance indicators (own processing)
Performance indicators
DSCR = (EBITDA – tax) / (annual redemption + interest) 1169%
ROE = EAT / Equity 520%
ROA = EAT / CAPEX 156%
For this option, Debt Service Coverage Ratio is at an incredible 1169%, providing
a good opportunity for investors. One must keep in mind, that the water in only
produced and not distributed, so one would have to include distribution means
into any further calculation. For example, locals could bring their own containers
to fill as much water as needed, existing pipage could be used, etc. Exploring all
possible various options would surpass the scope of this thesis and would need
further investigation. ROE, which can be viewed as the interest earned on
invested equity capital, is 520% in this model, so seems to be a very good
investment. Similarly the ROA of 156% would essentially mean that the complete
investment costs would be earned in less than a year.
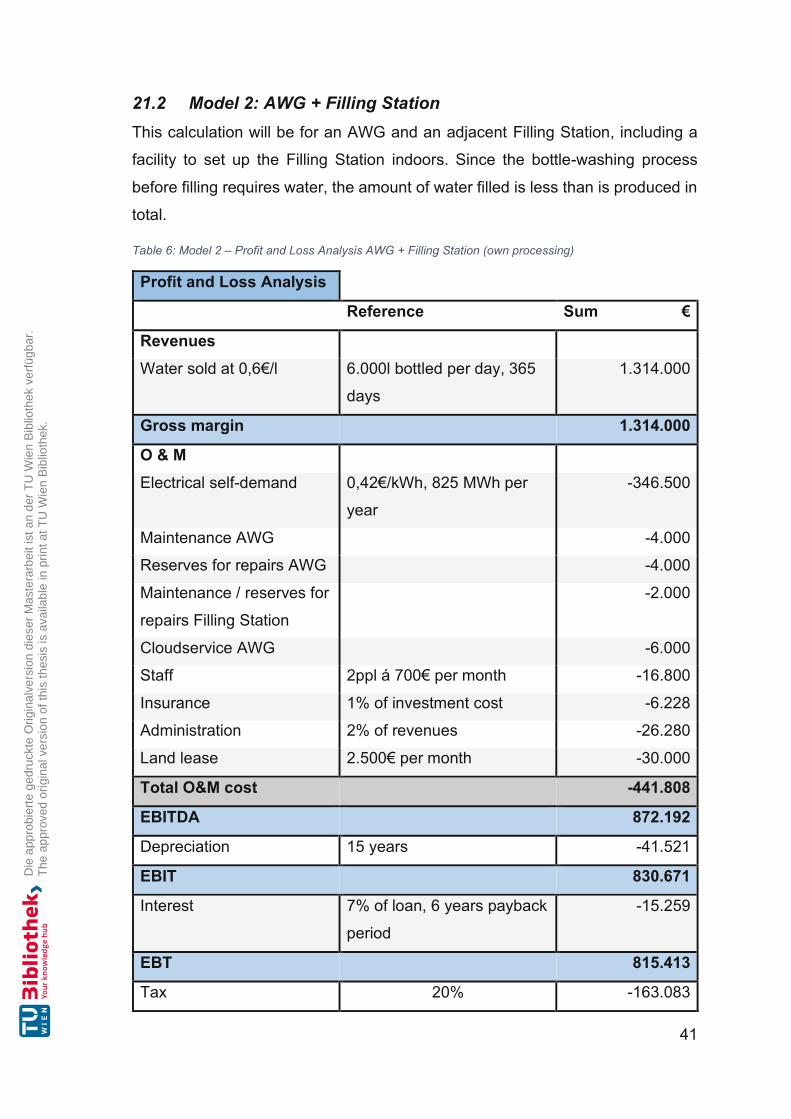
41
21.2 Model 2: AWG + Filling Station This calculation will be for an AWG and an adjacent Filling Station, including a
facility to set up the Filling Station indoors. Since the bottle-washing process
before filling requires water, the amount of water filled is less than is produced in
total.
Table 6: Model 2 – Profit and Loss Analysis AWG + Filling Station (own processing)
Profit and Loss Analysis
Reference Sum €
Revenues
Water sold at 0,6€/l 6.000l bottled per day, 365
days
1.314.000
Gross margin 1.314.000
O & M
Electrical self-demand 0,42€/kWh, 825 MWh per
year
-346.500
Maintenance AWG -4.000
Reserves for repairs AWG -4.000
Maintenance / reserves for
repairs Filling Station
-2.000
Cloudservice AWG -6.000
Staff 2ppl á 700€ per month -16.800
Insurance 1% of investment cost -6.228
Administration 2% of revenues -26.280
Land lease 2.500€ per month -30.000
Total O&M cost -441.808
EBITDA 872.192
Depreciation 15 years -41.521
EBIT 830.671
Interest 7% of loan, 6 years payback
period
-15.259
EBT 815.413
Tax 20% -163.083
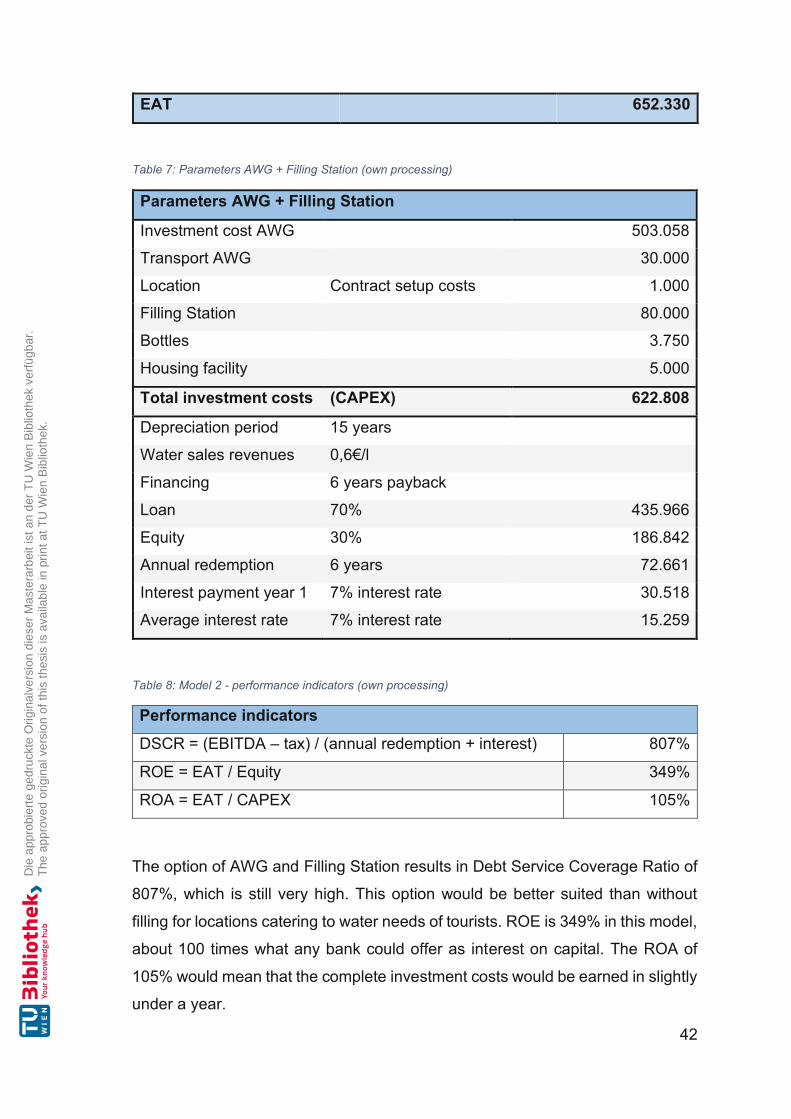
42
EAT 652.330
Table 7: Parameters AWG + Filling Station (own processing)
Parameters AWG + Filling Station
Investment cost AWG 503.058
Transport AWG 30.000
Location Contract setup costs 1.000
Filling Station 80.000
Bottles 3.750
Housing facility 5.000
Total investment costs (CAPEX) 622.808
Depreciation period 15 years
Water sales revenues 0,6€/l
Financing 6 years payback
Loan 70% 435.966
Equity 30% 186.842
Annual redemption 6 years 72.661
Interest payment year 1 7% interest rate 30.518
Average interest rate 7% interest rate 15.259
Table 8: Model 2 - performance indicators (own processing)
Performance indicators
DSCR = (EBITDA – tax) / (annual redemption + interest) 807%
ROE = EAT / Equity 349%
ROA = EAT / CAPEX 105%
The option of AWG and Filling Station results in Debt Service Coverage Ratio of
807%, which is still very high. This option would be better suited than without
filling for locations catering to water needs of tourists. ROE is 349% in this model,
about 100 times what any bank could offer as interest on capital. The ROA of
105% would mean that the complete investment costs would be earned in slightly
under a year.
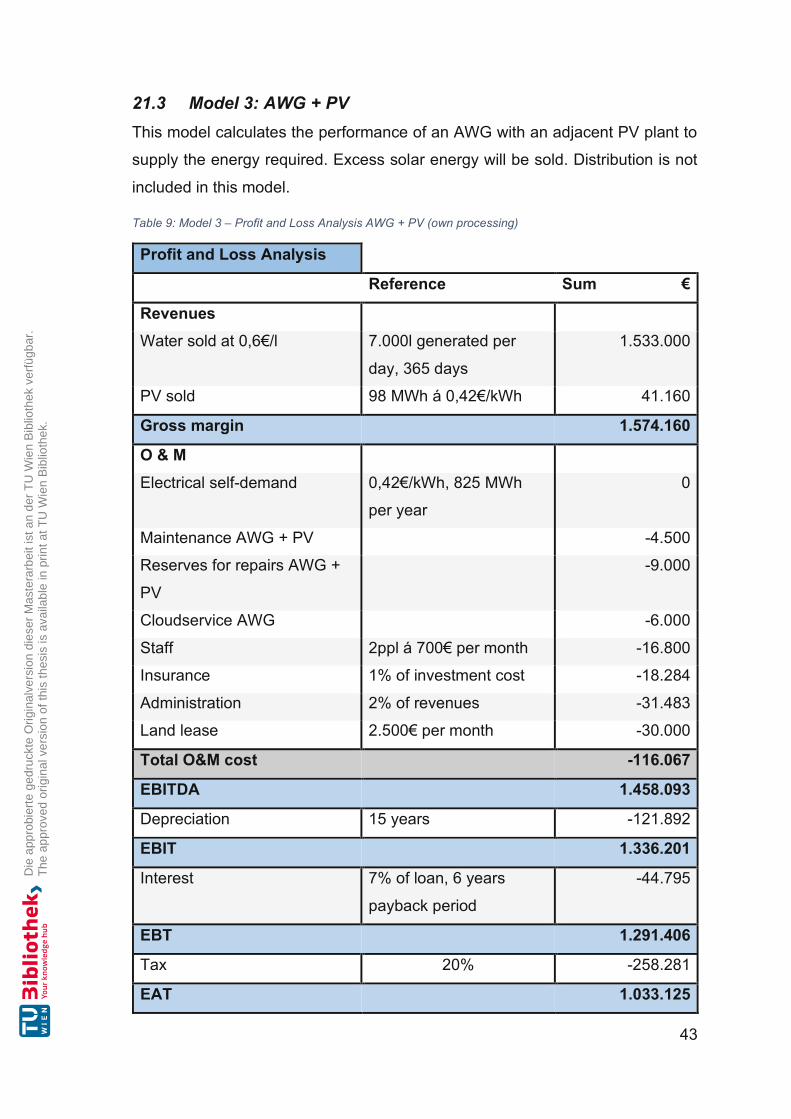
43
21.3 Model 3: AWG + PV This model calculates the performance of an AWG with an adjacent PV plant to
supply the energy required. Excess solar energy will be sold. Distribution is not
included in this model.
Table 9: Model 3 – Profit and Loss Analysis AWG + PV (own processing)
Profit and Loss Analysis
Reference Sum €
Revenues
Water sold at 0,6€/l 7.000l generated per
day, 365 days
1.533.000
PV sold 98 MWh á 0,42€/kWh 41.160
Gross margin 1.574.160
O & M
Electrical self-demand 0,42€/kWh, 825 MWh
per year
0
Maintenance AWG + PV -4.500
Reserves for repairs AWG +
PV
-9.000
Cloudservice AWG -6.000
Staff 2ppl á 700€ per month -16.800
Insurance 1% of investment cost -18.284
Administration 2% of revenues -31.483
Land lease 2.500€ per month -30.000
Total O&M cost -116.067
EBITDA 1.458.093
Depreciation 15 years -121.892
EBIT 1.336.201
Interest 7% of loan, 6 years
payback period
-44.795
EBT 1.291.406
Tax 20% -258.281
EAT 1.033.125
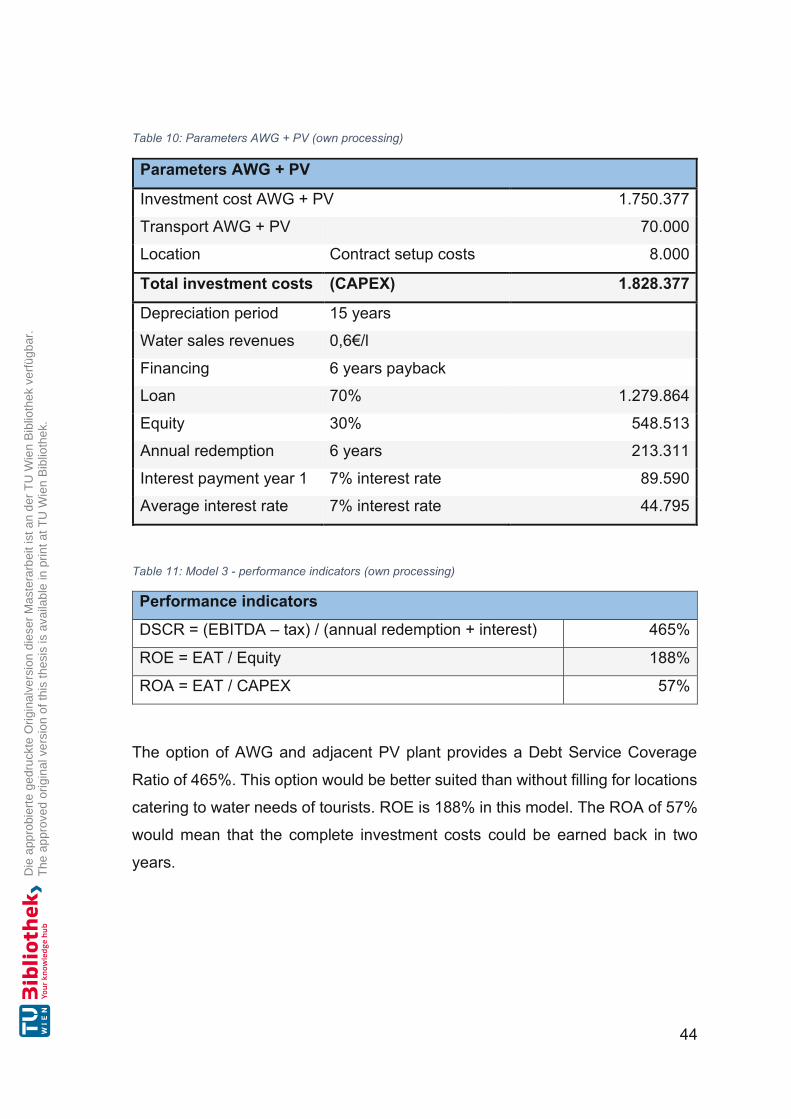
44
Table 10: Parameters AWG + PV (own processing)
Parameters AWG + PV
Investment cost AWG + PV 1.750.377
Transport AWG + PV 70.000
Location Contract setup costs 8.000
Total investment costs (CAPEX) 1.828.377
Depreciation period 15 years
Water sales revenues 0,6€/l
Financing 6 years payback
Loan 70% 1.279.864
Equity 30% 548.513
Annual redemption 6 years 213.311
Interest payment year 1 7% interest rate 89.590
Average interest rate 7% interest rate 44.795
Table 11: Model 3 - performance indicators (own processing)
Performance indicators
DSCR = (EBITDA – tax) / (annual redemption + interest) 465%
ROE = EAT / Equity 188%
ROA = EAT / CAPEX 57%
The option of AWG and adjacent PV plant provides a Debt Service Coverage
Ratio of 465%. This option would be better suited than without filling for locations
catering to water needs of tourists. ROE is 188% in this model. The ROA of 57%
would mean that the complete investment costs could be earned back in two
years.

45
21.4 Model 4: AWG + PV + Filling Station This final model calculates the performance of an AWG, with a Filling Station
(including housing) and a PV plant. The PV could be (partially) mounted on the
roof of the facility to save space. Less water is bottled than is generated since
some is needed for the washing process. Excess solar energy can be sold.
Table 12: Model 4 – Profit and Loss Analysis AWG + PV + Filling Station (own processing)
Profit and Loss Analysis
Reference Sum €
Revenues
Water sold at 0,6€/l 6.000l generated per
day, 365 days
1.314.000
PV sold 98 MWh á 0,42€/kWh 41.160
Gross margin 1.355.160
O & M
Electrical self-demand 0,42€/kWh, 825 MWh
per year
0
Maintenance AWG + PV -4.500
Reserves for repairs AWG +
PV
-9.000
Maintenance / reserves for
repairs Filling Station
-2.000
Cloudservice AWG -6.000
Staff 2ppl á 700€ per month -16.800
Insurance 1% of investment cost -19.171
Administration 2% of revenues -27.103
Land lease 2.500€ per month -30.000
Total O&M cost -114.574
EBITDA 1.240.586
Depreciation 15 years -127.808
EBIT 1.112.777
Interest 7% of loan, 6 years
payback period
-46.970

46
EBT 1.065.807
Tax 20% -213.161
EAT 852.646
Table 13: Parameters AWG + PV + Filling Station (own processing)
Parameters AWG + PV + Filling Station
Investment cost AWG + PV 1.750.377
Transport AWG 70.000
Location Contract setup costs 8.000
Filling Station 80.000
Bottles 3.750
Housing facility 5.000
Total investment costs (CAPEX) 1.917.127
Depreciation period 15 years
Water sales revenues 0,6€/l
Financing 6 years payback
Loan 70% 1.341.989
Equity 30% 573.138
Annual redemption 6 years 223.665
Interest payment year 1 7% interest rate 93.939
Average interest rate 7% interest rate 46.970
Table 14: Model 4 - performance indicators (own processing)
Performance indicators
DSCR = (EBITDA – tax) / (annual redemption + interest) 380%
ROE = EAT / Equity 148%
ROA = EAT / CAPEX 44%
This final option would provide the highest amount of autarky – no external
electricity is needed and one could provide a means of distribution easily. This
sustainable model is well suited for small remote islands reliant on the tourism
industry, especially as a long-term solution. Debt is sufficiently covered with
47
380%, ROE is also 148% and the total investment costs are earned in less than
three years.
22. Conclusion The research done for this thesis has shown that implementing atmospheric
water generation on small tropical islands has manyfold benefits, especially when
comparing to other modes of water generation. One does not have the negative
effects of desalination and when running via clean energy there are no emissions
at all! Also, the yield one obtains is significantly higher than from the various
modes of fog harvesting. Regarding waste, there are potentially tons of plastic
waste from PET bottles that can be avoided.
Further, when looking at such a project from a business perspective, all four
models calculated in this thesis offer very high returns. The most profitable model
would be model 1, which could be implemented for communal use when
acceptability could potentially be the highest and the distribution could be
managed individually (as in people coming to the AWG to fill their own containers,
etc.) or locally – these costs would have to be incorporated into the calculation
but should not change the economic outlook drastically. Also, the communal or
non-touristic use would be more efficient, since the water used for washing in the
filling process could be consumed instead. However, one must keep in mind that
the electrical energy consumption of producing all that water is not insignificant
and a clean approach here would be preferrable and more sustainable in the long
run. Also, one would contribute to a clean environment (especially when
considering that on small islands it will be hard to look away from pollution – think
of residual petrol films on the ocean) and not be reliant on volatile oil-prices.
Especially the proposed models including PV would be sustainable and above all
still highly lucrative.
One very big problem that could be faced is the issue of transport of the AWG
and the Filling Station to an island. While taking the easy way and assuming that
governments could facilitate and possibly provide an airlift of heavy containers to
and island via military helicopters, this would need further research and possibly
involve requests on ministerial level, even diplomacy in case a government in

48
question has no such machinery in its military stock. It could also be, however,
that there is a sufficient port on the island and infrastructure to transport heavy
containers to their final destination. In such a case transportation should pose no
problem.
Concluding, all models proposed in part II of this thesis are beneficial in an island
setting and highly lucrative. While this thesis just serves as a broad approach to
the feasibility of such an installation and in-depth research would have to be done
on a case-by-case basis, the overall findings are very positive.

49
Bibliography
“Automatic 3-in-1 CSD Beverage Filling Bottling Machine", 2021. Jiangsu
MESURE machinery Co., Ltd. Accessed on 23.04.2021. Available at:
http://www.mesuremachinery.com/Automatic-3-in-1-CSD-Beverage-
Filling-Bottling-Machine-pd43523227.html
Bagheri, F. (2018). Performance investigation of atmospheric water harvesting
systems. Water resources and industry, 20, 23-28.
https://doi.org/10.1016/j.wri.2018.08.001
Bergmair, D., Metz, S. J., De Lange, H. C., & Van Steenhoven, A. (2014).
System analysis of membrane facilitated water generation from air
humidity. Desalination, 339, 26-33.
https://doi.org/10.1016/j.desal.2014.02.007
Caldas, L., Andaloro, A., Calafiore, G., Munechika, K., & Cabrini, S. (2018).
Water harvesting from fog using building envelopes: part I. Water and
Environment Journal, 32(4), 493-499. https://doi.org/10.1111/wej.12335
Curto, D., Franzitta, V., Viola, A., Cirrincione, M., Mohammadi, A., & Kumar, A.
(2019). A renewable energy mix to supply small islands. A comparative
study applied to Balearic Islands and Fiji. Journal of Cleaner
Production, 241, 118356. https://doi.org/10.1016/j.jclepro.2019.118356
Damkjaer, S., & Taylor, R. (2017). The measurement of water scarcity: Defining
a meaningful indicator. Ambio, 46(5), 513-531.
Desalination by country, Wikipedia. Accessed on 20.04.2021. Available at:
https://en.wikipedia.org/wiki/Desalination_by_country#cite_note-58
Falkenmark, M. (1986). Fresh water: Time for a modified approach. Ambio,
15(4), 192-200.
Falkenmark, M., & Lindh, G. (1974). How can we cope with the water resources
situation by the year 2015?. Ambio, 3(3/4), 114-122.
“Glass Bottle Prices”, 2021. Alibaba.com. Accessed on 15.04.2021. Available
at:
https://www.alibaba.com/trade/search?fsb=y&IndexArea=product_en&C
atId=&SearchText=1l+glass+bottle+for+filling&viewtype=&tab=
50
Gössling, S. (2000). Sustainable tourism development in developing countries:
Some aspects of energy use. Journal of sustainable tourism, 8(5), 410-
425. https://doi.org/10.1080/09669580008667376
Gössling, S. (2001). The consequences of tourism for sustainable water use on
a tropical island: Zanzibar, Tanzania. Journal of environmental
management, 61(2), 179-191. https://doi.org/10.1006/jema.2000.0403
Grandjean, A.C., (2005). Water Requirements, Impairing Factors, and
Recommended Intakes. In: World Health Organization. Nutrients in
drinking water: water, sanitation and health protection and the human
environment. WHO, Geneva.
http://dx.doi.org/10.1016/j.watres.2015.11.012
Gude, V. G. (2016). Desalination and sustainability–an appraisal and current
perspective. Water research, 89, 87-106.
Huang, Y., Wang, J., Tan, Y., Wang, L., Lin, H., Lan, L., ... & Shu, W. (2018).
Low-mineral direct drinking water in school may retard height growth
and increase dental caries in schoolchildren in China. Environment
international, 115, 104-109. https://doi.org/10.1016/j.envint.2018.02.021
Huber, C.M. (2020). Sustainable Islands - identifying and addressing
environmental pollution issues on small islands - A biogas project on
Koh Rong Cambodia. (Master’s Thesis, Technical University Vienna).
“IPS Cambodia”, 2021. Accessed on 13.04.2021. Available at: https://ips-
cambodia.com/cambodia-foreign-property-ownership/
Jakhrani, A. Q., Rigit, A. R. H., Othman, A. K., Samo, S. R., & Kamboh, S. A.
(2012, July). Estimation of carbon footprints from diesel generator
emissions. In 2012 International Conference on Green and Ubiquitous
Technology (pp. 78-81). IEEE.
https://doi.org/10.1109/GUT.2012.6344193
Karbalaei, S., Hanachi, P., Walker, T. R., & Cole, M. (2018). Occurrence,
sources, human health impacts and mitigation of microplastic pollution.
Environmental science and pollution research, 25(36), 36046-36063.
https://doi.org/10.1007/s11356-018-3508-7
Pröstler, K. (2014). Zero fossil fuels for the Galápagos archipelago:
sustainability assessment of the island strategy towards a 100%
51
renewable energy system (Master’s Thesis, Technical University
Vienna).
Kerber, H., & Kramm, J. (2021). On‐and offstage: Encountering entangled
waste–tourism relations on the Vietnamese Island of Phu Quoc. The
Geographical Journal. https://doi.org/10.1111/geoj.12376
Kozisek, F., 2005. Health risks from drinking demineralised water. In: World
Health Organization. Nutrients in drinking water: water, sanitation and
health protection and the human environment. WHO, Geneva.
http://dx.doi.org/10.1016/j.watres.2015.11.012
Li, R., Shi, Y., Alsaedi, M., Wu, M., Shi, L., & Wang, P. (2018). Hybrid hydrogel
with high water vapor harvesting capacity for deployable solar-driven
atmospheric water generator. Environmental science & technology,
52(19), 11367-11377. https://doi.org/10.1021/acs.est.8b02852
Lim, J. (2017). Renewable energy policy and investment for nationally
determined contributions: the case of Pacific small Island developing
states (Master’s Thesis, Technical University Vienna).
Máñez, K. S., Husain, S., Ferse, S. C., & Costa, M. M. (2012). Water scarcity in
the Spermonde Archipelago, Sulawesi, Indonesia: past, present and
future. Environmental Science & Policy, 23, 74-84.
https://doi.org/10.1016/j.envsci.2012.07.004
Mardi, M. K., Sam, N., Thida, K. V., Channarith, K., Yagasa, R.,
Akhmedkhodjaeva, N., ... & Totoki, Y. (2018). Phnom Penh Waste
Management Strategy and Action Plan 2018-2035.
Mason, S. A., Welch, V. G., & Neratko, J. (2018). Synthetic polymer
contamination in bottled water. Frontiers in chemistry, 6, 407.
https://doi.org/10.3389/fchem.2018.00407
Mathiesen, B. V., Lund, H., & Karlsson, K. (2011). 100% Renewable energy
systems, climate mitigation and economic growth. Applied energy,
88(2), 488-501. https://doi.org/10.1016/j.apenergy.2010.03.001
Meza, C. G., Rodríguez, C. Z., D'Aquino, C. A., Amado, N. B., Rodrigues, A., &
Sauer, I. L. (2019). Toward a 100% renewable island: A case study of
Ometepe's energy mix. Renewable Energy, 132, 628-648.
https://doi.org/10.1016/j.renene.2018.07.124

52
"Ministry floats new law for clean water management", 2020. Accessed on
07.02.2021. Availabe at:
https://www.phnompenhpost.com/national/ministry-floats-new-law-
clean-water-management
Ministry of Tourism (2018). Tourism Statistics Report 2018. Phnom Penh,
Cambodia. Accessed on 11.04.2021. Available at:
http://www.tourismcambodia.com/img/resources/cambodia_tourism_sta
tistics_2018.pdf
"New Solar Power Station on Koh Rong Samloem" (2021). Accessed on
07.04.2021. Available at: https://www.visitkohrong.com/new-solar-
power-station-on-koh-rong-samloem/
Ngjeqari, V. (2018). Developing Sazan Island with renewable energy. case
study of vitalizing and urbanising the first uninhabited Albanian Island
into a self-sufficient, smart, zero waste, touristic and free economic
zone (Master’s Thesis, Technical University Vienna).
Oßmann, B. E., Sarau, G., Holtmannspötter, H., Pischetsrieder, M.,
Christiansen, S. H., & Dicke, W. (2018). Small-sized microplastics and
pigmented particles in bottled mineral water. Water research, 141, 307-
316. https://doi.org/10.1016/j.watres.2018.05.027
PHANTOR-Technical-datasheet, 2020. see Annex
Pölzl, A. M. (2019). Energy independence through renewable energies-Hawaii's
challenge to become a clean energy leader (Master’s Thesis, Technical
University Vienna).
“Resorts on Koh Rong Sanloem” (2021). Google. Accessed on 04.01.2021.
Available at:
https://www.google.at/travel/hotels/Koh%20Rong%20Sanloem?g2lb=25
02548%2C2503781%2C4258168%2C4270442%2C4306835%2C4317
915%2C4328159%2C4371335%2C4401769%2C4419364%2C448243
8%2C4486153%2C4491350%2C4515404%2C4517258%2C4523593%
2C4270859%2C4284970%2C4291517&hl=de-
AT&gl=at&ssta=1&ap=SAEwAGgA&rp=QABIAg&ictx=1&utm_campaign
=sharing&utm_medium=link&utm_source=htls&ts=CAESABpbCj0SOTIl
MHgzMTA3ZWVkZTM3MDZiMjQ5OjB4ZjRiYzdiZTVkZjBmNmU3NDoQ
S29oIFJvbmcgU2FubG9lbRoAEhoSFAoHCOUPEAQYCBIHCOUPEAQ
53
YCRgBMgIQACoLCgcoAToDRVVSGgA&ved=0CAAQ5JsGahgKEwjQ8
pLPi93vAhUAAAAAHQAAAAAQ3wU
Sadhwani, J. J., Veza, J. M., & Santana, C. (2005). Case studies on
environmental impact of seawater desalination. Desalination, 185(1-3),
1-8. https://doi.org/10.1016/j.desal.2005.02.072
Salek, F., Moghaddam, A. N., & Naserian, M. M. (2018). Thermodynamic
analysis and improvement of a novel solar driven atmospheric water
generator. Energy Conversion and Management, 161, 104-111.
https://doi.org/10.1016/j.enconman.2018.01.066
Schüttpelz, N. (2014). Measuring Marine Litter Density, Mass and Composition :
Including a Case Study on Land-based Litter along the Danube.
(Master’s Thesis, Universität für Bodenkultur, Vienna).
Sreng, B., Sophal, C., Srun, S., Samnang, C., & Huot, E. (2016). Viral hepatitis
in Cambodia: past, present, and future. Euroasian journal of hepato-
gastroenterology, 6(1), 45. https://doi.org/10.5005/jp-journals-10018-
1165
Schymanski, D., Goldbeck, C., Humpf, H. U., & Fürst, P. (2018). Analysis of
microplastics in water by micro-Raman spectroscopy: release of plastic
particles from different packaging into mineral water. Water research,
129, 154-162. https://doi.org/10.1016/j.watres.2017.11.011
"SDG 6”, (n.d.). United Nations, Accessed on 21.04.2021. Available at:
https://sdgs.un.org/goals/goal6
Sophocleous, M. (2004). Global and regional water availability and demand:
prospects for the future. Natural Resources Research, 13(2), 61-75.
https://doi.org/10.1023/B:NARR.0000032644.16734.f5
Stocker, C. H. (2009). An index for water availability per capita in Asia and the
Pacific; with case studies (Master’s Thesis, Technical University
Vienna).
Suryaningsih, S., & Nurhilal, O. (2016). Optimal design of an atmospheric water
generator (AWG) based on thermo-electric cooler (TEC) for drought in
rural area. In AIP Conference Proceedings (Vol. 1712, No. 1, p.
030009). AIP Publishing LLC. https://doi.org/10.1063/1.4941874
"Total Solar DG to build one of Southeast Asia’s largest renewable energy
microgrids in Cambodia", 2021. Solar Business Hub. Accessed on
54
13.04.2021. Available at:
https://solarbusinesshub.com/2020/11/30/total-solar-dg-to-build-one-of-
southeast-asias-largest-renewable-energy-microgrids-in-cambodia/
"Water and sanitation", (n.d.). United Nations. Accessed on 16.04.2021.
Available at: https://sdgs.un.org/topics/water-and-
sanitation#:~:text=Sustainable%20Development%20Goal%206%20%2
8SDG%206%29%20on%20water,sustainable%20management%20of%
20water%20and%20sanitation%20for%20all
Westall, F., & Brack, A. (2018). The importance of water for life. Space Science
Reviews, 214(2), 1-23. https://doi.org/10.1007/s11214-018-0476-7
World Health Organization. (2019a). Drinking-water Accessed on 12.04.2021.
Available at: https://www.who.int/news-room/fact-sheets/detail/drinking-
water
World Health Organization. (2019b). Microplastics in drinking-water. Geneva.
Licence: CC BY-NC-SA 3.0 IGO.
World Health Organization. (2017). Guidelines for drinking-water quality: fourth
edition incorporating the first addendum. Geneva. Licence: CC BY-NC-
SA 3.0 IGO.
Zambrano-Monserrate, M. A., & Ruano, M. A. (2020). Estimating the damage
cost of plastic waste in Galapagos Islands: A contingent valuation
approach. Marine Policy, 117, 103933.
Zeng, Z., Liu, J., & Savenije, H. H. (2013). A simple approach to assess water
scarcity integrating water quantity and quality. Ecological indicators, 34,
441-449. https://doi.org/10.1016/j.ecolind.2013.06.012

55
List of Figures Figure 1:Water harvesting from fog using building envelopes: part I,
Source: (Caldas et al., 2018)............................................................................. 15
Figure 2 Atmospheric Water Generation, Source:
https://upload.wikimedia.org/wikipedia/commons/9/9b/Atmospheric_Water_Gen
erator_diagram.svg ........................................................................................... 17
Figure 3: Koh Rong Sanloem, Cambodia (Google My Maps) ........................... 21
Figure 4 Annual water yield, see Annex ............................................................ 25
Figure 5 Collected plastic bottles on Koh Rong, Foto ©C. M. Huber................. 26
Figure 6 The PHANTOR AWG, www.imhotep.industries .................................. 35
List of Tables Table 1: List of various CAPEX (own processing) ............................................. 36
Table 2: List of various operational and maintenance costs (own processing) . 36
Table 3: Model 1 – Profit and Loss Analysis AWG (own processing) ................ 39
Table 4: Parameters AWG (own processing) .................................................... 40
Table 5: Model 1 - performance indicators (own processing) ............................ 40
Table 6: Model 2 – Profit and Loss Analysis
AWG + Filling Station (own processing) ............................................................ 41
Table 7: Parameters AWG + Filling Station (own processing) .......................... 42
Table 8: Model 2 - performance indicators (own processing) ............................ 42
Table 9: Model 3 – Profit and Loss Analysis AWG + PV (own processing) ....... 43
Table 10: Parameters AWG + PV (own processing) ......................................... 44
Table 11: Model 3 - performance indicators (own processing) .......................... 44
Table 12: Model 4 – Profit and Loss Analysis
AWG + PV + Filling Station (own processing) ................................................... 45
Table 13: Parameters AWG + PV + Filling Station (own processing) ................ 46
Table 14: Model 4 - performance indicators (own processing) .......................... 46

A1
ANNEX 1. PHANTOR -Technical-datasheet
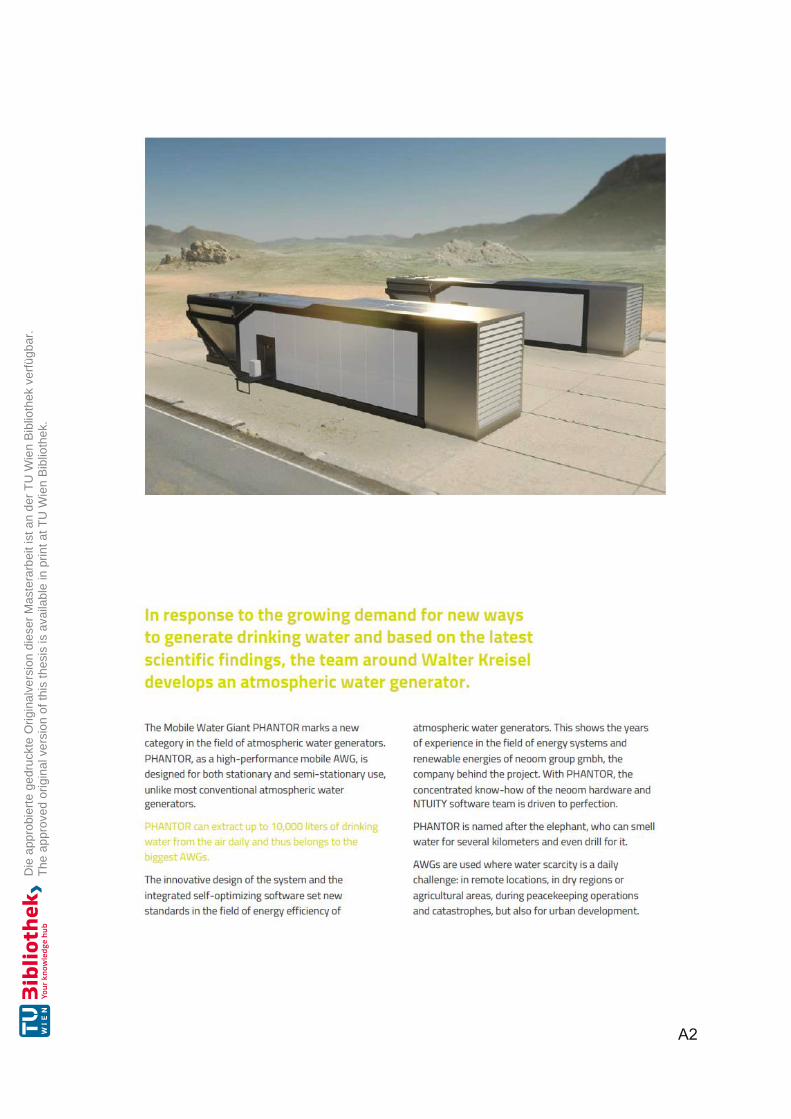
A2
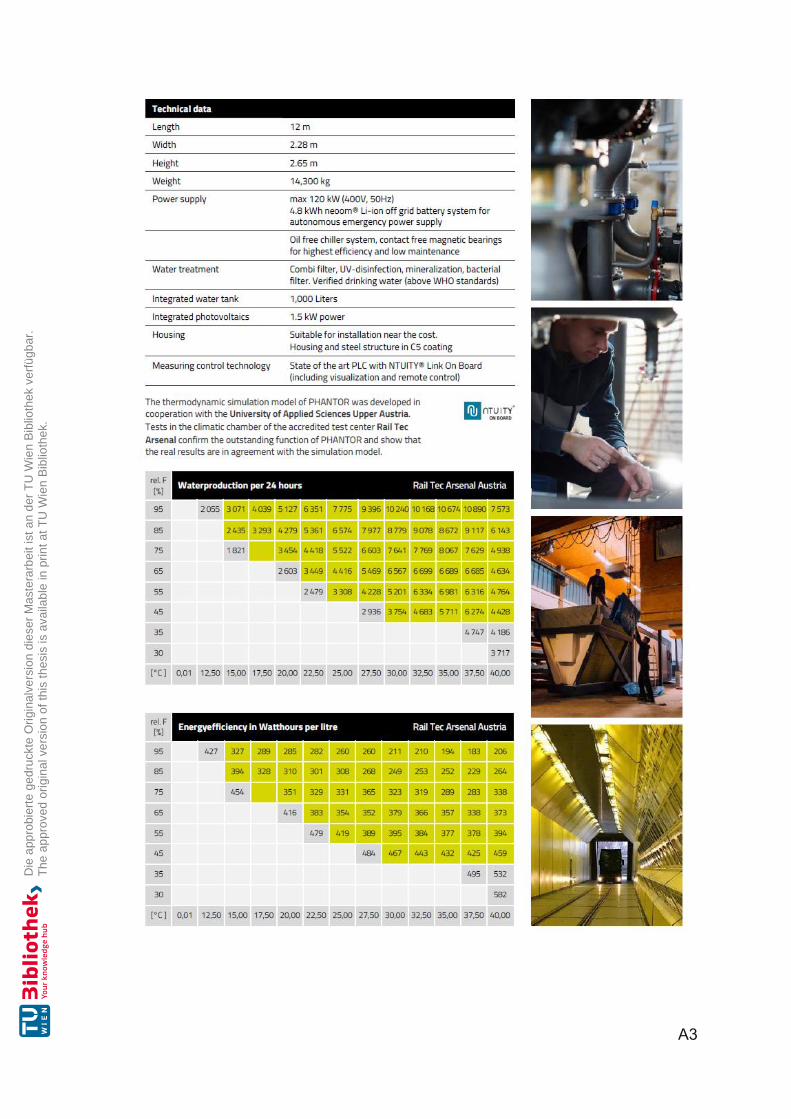
A3

A4

A5
2. Calculations provided by Imhotep.Industries GmbH
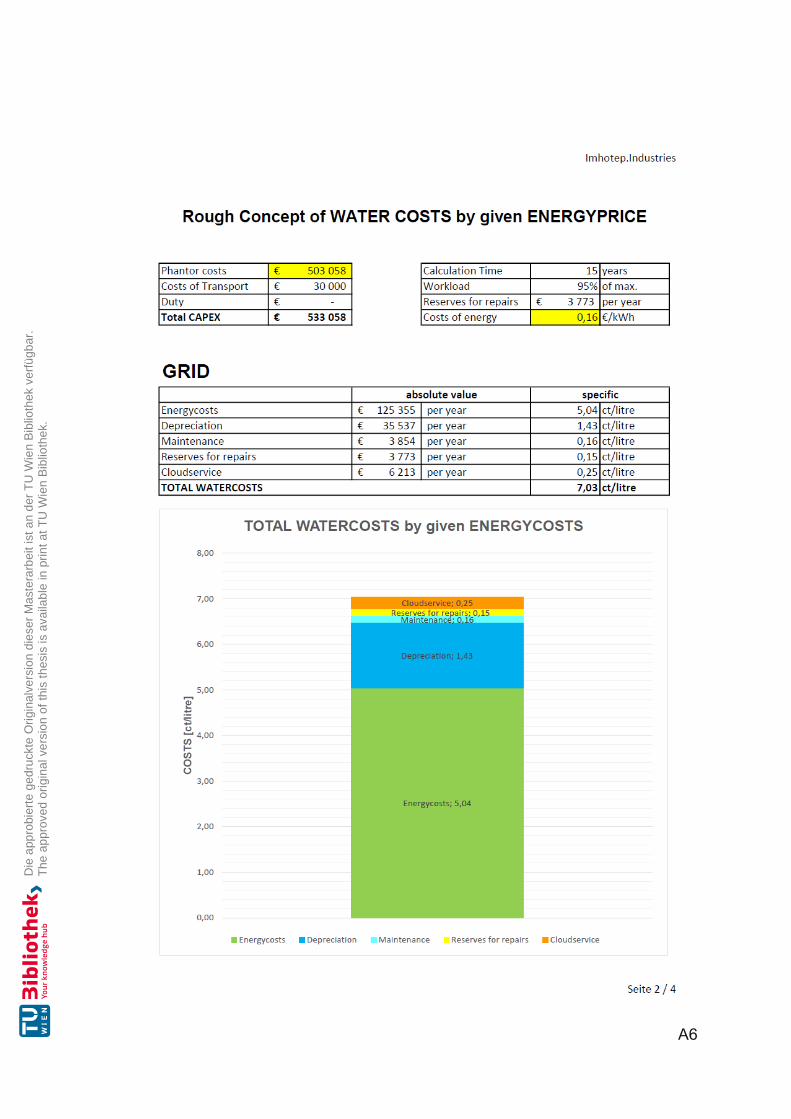
A6

A7
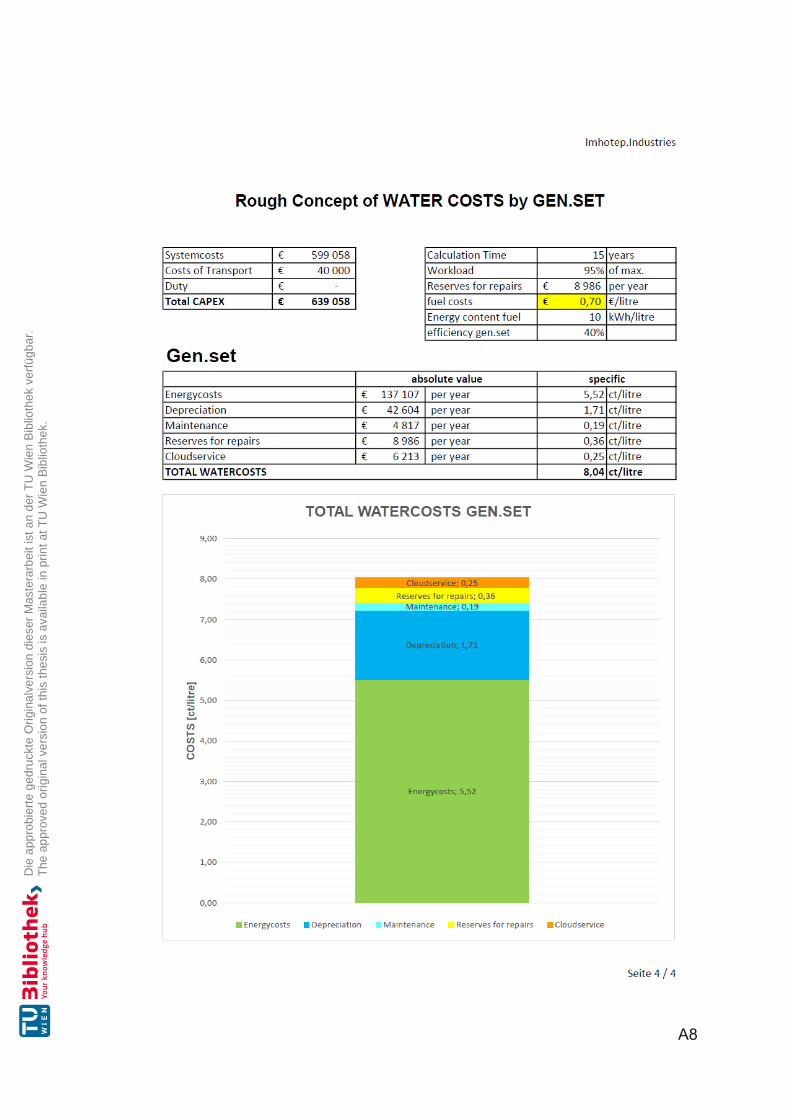
A8


![Book, The Electric Generators Handbook Synchronous Generators[1]](https://static.fdocuments.us/doc/165x107/552a938b55034689428b46a1/book-the-electric-generators-handbook-synchronous-generators1.jpg)