The evolution of tropical adaptation: Comparing …evachan.org/Chan_AnimGenetics2010.pdfThe...
30
1 The evolution of tropical adaptation: Comparing Taurine and Zebu cattle Eva KF Chan 1 , Shivashankar H Nagaraj 2 and Antonio Reverter 2 Cooperative Research Centre for Beef Genetic Technologies CSIRO Livestock Industries, Queensland Bioscience Precinct 306 Carmody Rd., St. Lucia, Brisbane, Queensland 4067, Australia 1 Current Address: Monsanto Vegetable Seeds Division 37437 State Highway 16 Woodland, CA 95695, USA [email protected] 2 Corresponding author and reprint requests: Dr. Antonio Reverter [email protected] Ph.: +61 7 3214 2392 Fx.: +61 7 3214 2900
Transcript of The evolution of tropical adaptation: Comparing …evachan.org/Chan_AnimGenetics2010.pdfThe...

1
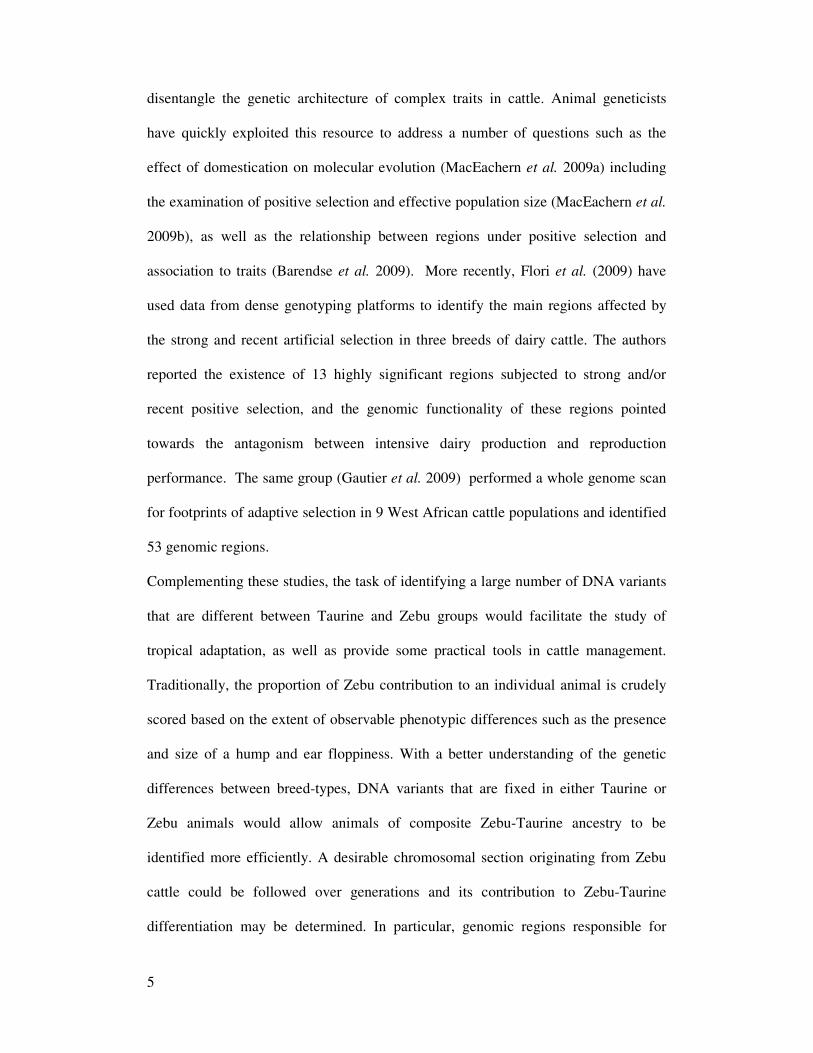
The evolution of tropical adaptation: Comparing Taurine and Zebu cattle
Eva KF Chan1, Shivashankar H Nagaraj
2 and Antonio Reverter
2
Cooperative Research Centre for Beef Genetic Technologies
CSIRO Livestock Industries, Queensland Bioscience Precinct
306 Carmody Rd., St. Lucia, Brisbane, Queensland 4067, Australia
1Current Address:
Monsanto Vegetable Seeds Division
37437 State Highway 16
Woodland, CA 95695, USA
2Corresponding author and reprint requests:
Dr. Antonio Reverter
Ph.: +61 7 3214 2392
Fx.: +61 7 3214 2900

2
Summary
Beef cattle breeds consist of three major genetic subdivisions, the Taurine group
adapted to temperate environments and the Zebu and Sanga groups both adapted to
tropical environments. So far, the genetic bases for the differences in tropical
adaptation have not been explored on a genome-wide scale. In this study,
approximately 9,000 single nucleotide polymorphism markers were genotyped on 317
animals of a selection of Taurine, Zebu, and composite breeds to characterise any
systematic differences between these groups. We identified 91 intra-breed-class
markers: 78 were polymorphic only within the Zebu animals, while 13 were
polymorphic only in the Taurine animals. We found 14 regions with radically
different allele frequencies between Zebu and Taurine animals when at least 20
adjacent markers were analysed together. There were no fixed differences (fixed for
alternate alleles between the two breed types) between Zebu and Taurine animals. A
preliminary functional genomics analysis of these regions pointed towards signatures
of tropical attributes including keratins, heat-shock proteins and heat resistance genes.
The selection of one marker each from these 14 regions was efficient in classifying
animals as Zebu or Taurine in a cluster analysis. We anticipate this procedure to be an
optimal mechanism to develop a simple yet robust gene-based diagnostic tool for
discriminating temperate from tropically adapted cattle.

3
Introduction
Modern cattle (Bos taurus L.) were probably domesticated several times in Southwest
Asia from the aurochs, which had already diverged phenotypically into two major
geographic land races: temperate and tropical (Fries and Ruvinsky 1999). Originally,
this phenotypic difference was thought of as representing a species difference, hence
the use of the species name Bos indicus for tropically-adapted cattle, but as all cattle
are fully fertile, indeed, there is heterosis between cattle from the two geographic
races, they are members of one species. In animal genetics literatures, however, the
term Bos indicus is universally accepted despite the absence of a species difference.
Lenstra and Bradley (1999) and Bradley et al. (1996) provide a review of the
phylogenetic analyses that have been performed on wild and domestic cattle species.
In broad, there are three generally recognised cattle breed classes: Taurine, Zebu, and
Sanga. Taurines represent those descended from European and Southwest-Asian
ancestors, and have short ears and no hump. Zebu breeds represent those descended
from South Asian ancestors and have long floppy ears and a prominent hump. Zebu
animals were introduced to Africa by the Arab traders more than a thousand years
ago, so the geographic influence of Zebu includes East Africa. The origins of the
Sanga breeds are less clear, but they are found in West and South Africa, they may
represent a separate domestication of Southwest Asian cattle, and appear to have been
in Africa longer than the Zebu breeds. In East Africa, there has been a long history of
crossing between Zebu and Sanga breeds, originally through the use of Zebu bulls. In
general, purebred Sanga cattle do not have a hump.
Due to the origins and breeding practices, both natural and artificial, that occurred in
different regions of the world, cattle of the different types are broadly divided into
temperate (Taurine) and tropical (Zebu and Sanga) due to the common adaptation

4
characteristics that they possess. Temperate cattle have thicker coats, several breeds
develop a winter coat, some are susceptible to sunburn, and they have stocky bodies.
Tropical cattle have lower rectal temperatures in hot weather, carry lower burdens of
the cattle tick Boophilus microplus, and show greater ability to tolerate poor feed and
inconsistent climate, a mark of tropical environments compared to more temperate,
consistent environments. Zebu cattle show different foraging behaviour, and they
have a different capacity for reproduction (Lunstra & Cundiff 2003 and Chase et al.
2004; also see reviews by Turner (1980) and Mukasa-Mugerwa (1989)).
Evidences also exist at the genetic level demonstrating differences between these two
land races. Kieffer & Cartwright (1968) showed that the Y chromosome of Bos
taurus bulls is submetacentric (i.e., its centromere is somewhat displaced from the
middle point), while in Bos indicus bulls the Y chromosome is acrocentric (ie.e., its
centromere is very near one end). Differences between Zebu and Taurine/Sanga
cattle have been observed at the level of mitochondrial DNA (Loftus et al. 1994;
Bradley et al. 1996). And at the level of autosomal DNA, there are evidences of
differentiation between all three cattle groups as demonstrated using microsatellite
markers (MacHugh et al. 1997; Ibeagha-Awemu et al. 2004). Microsatellites do not
generally show fixed differences between groups because of the large number of
alleles that they usually possess. There has been little effort so far to identify DNA
polymorphisms on a genome-wide scale that would allow identification of all three
groups, although there have been a few cases where DNA variants have been
described that are polymorphic in one group, say Taurine, but monomorphic in
another group (Kemenes et al. 1999; Nijman et al. 2003).
The recent efforts from The Bovine Genome Sequence Analysis Consortium (2009)
and The Bovine HapMap Consortium (2009) represent an unprecedented resource to
5
disentangle the genetic architecture of complex traits in cattle. Animal geneticists
have quickly exploited this resource to address a number of questions such as the
effect of domestication on molecular evolution (MacEachern et al. 2009a) including
the examination of positive selection and effective population size (MacEachern et al.
2009b), as well as the relationship between regions under positive selection and
association to traits (Barendse et al. 2009). More recently, Flori et al. (2009) have
used data from dense genotyping platforms to identify the main regions affected by
the strong and recent artificial selection in three breeds of dairy cattle. The authors
reported the existence of 13 highly significant regions subjected to strong and/or
recent positive selection, and the genomic functionality of these regions pointed
towards the antagonism between intensive dairy production and reproduction
performance. The same group (Gautier et al. 2009) performed a whole genome scan
for footprints of adaptive selection in 9 West African cattle populations and identified
53 genomic regions.
Complementing these studies, the task of identifying a large number of DNA variants
that are different between Taurine and Zebu groups would facilitate the study of
tropical adaptation, as well as provide some practical tools in cattle management.
Traditionally, the proportion of Zebu contribution to an individual animal is crudely
scored based on the extent of observable phenotypic differences such as the presence
and size of a hump and ear floppiness. With a better understanding of the genetic
differences between breed-types, DNA variants that are fixed in either Taurine or
Zebu animals would allow animals of composite Zebu-Taurine ancestry to be
identified more efficiently. A desirable chromosomal section originating from Zebu
cattle could be followed over generations and its contribution to Zebu-Taurine
differentiation may be determined. In particular, genomic regions responsible for
6
major differences between Taurine and Zebu that show little variation within the
individual breed-type could be studied using a larger set of these polymorphisms.
Therefore, the objective of this study is to examine the genotype of cattle of a variety
of breeds including both Taurine and Zebu types of cattle using more than 9,000
autosomal and X-linked single nucleotide polymorphisms (SNP). We put particular
emphasis in identifying fixed differences between Taurine and Zebu animals as well
as identifying regions of the bovine genome that show large allele frequency
differences between Zebu and Taurine animals.
Materials and methods
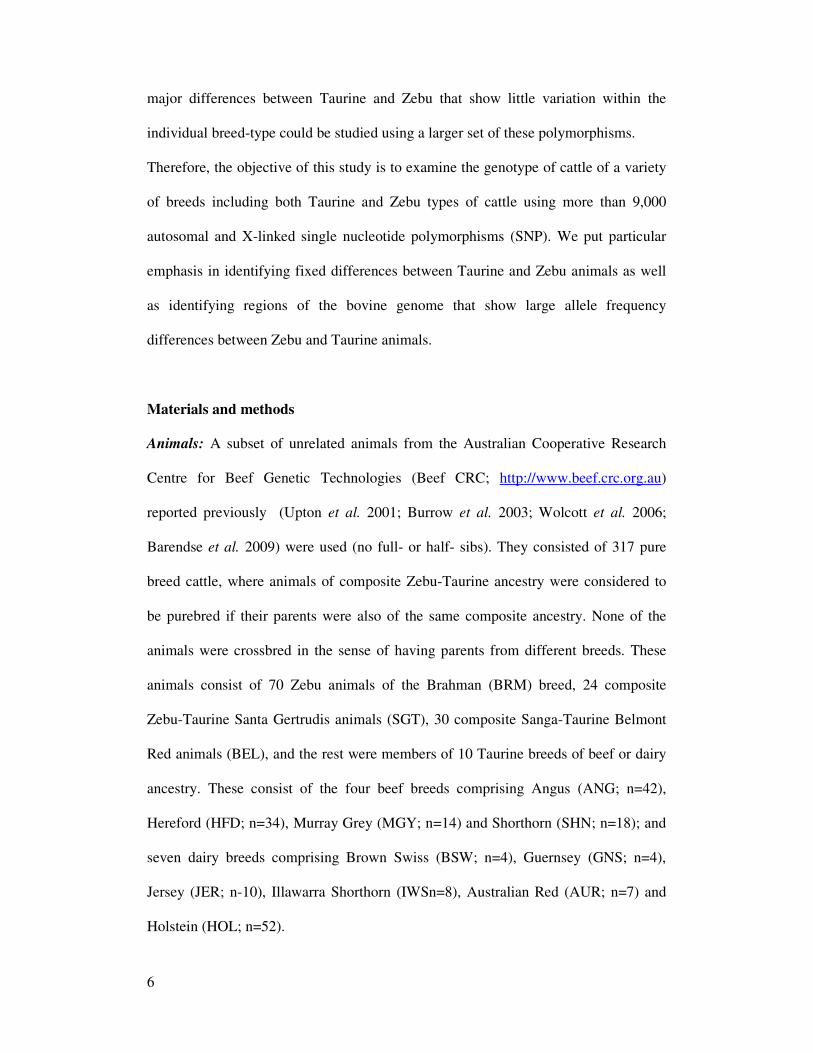
Animals: A subset of unrelated animals from the Australian Cooperative Research
Centre for Beef Genetic Technologies (Beef CRC; http://www.beef.crc.org.au)
reported previously (Upton et al. 2001; Burrow et al. 2003; Wolcott et al. 2006;
Barendse et al. 2009) were used (no full- or half- sibs). They consisted of 317 pure
breed cattle, where animals of composite Zebu-Taurine ancestry were considered to
be purebred if their parents were also of the same composite ancestry. None of the
animals were crossbred in the sense of having parents from different breeds. These
animals consist of 70 Zebu animals of the Brahman (BRM) breed, 24 composite
Zebu-Taurine Santa Gertrudis animals (SGT), 30 composite Sanga-Taurine Belmont
Red animals (BEL), and the rest were members of 10 Taurine breeds of beef or dairy
ancestry. These consist of the four beef breeds comprising Angus (ANG; n=42),
Hereford (HFD; n=34), Murray Grey (MGY; n=14) and Shorthorn (SHN; n=18); and
seven dairy breeds comprising Brown Swiss (BSW; n=4), Guernsey (GNS; n=4),
Jersey (JER; n-10), Illawarra Shorthorn (IWSn=8), Australian Red (AUR; n=7) and
Holstein (HOL; n=52).

7
SNP genotypes: The animals were genotyped using the MegAllele 10k SNP Panel
(Hardenbol et al. 2005) by ParAllele Inc. and its parent company Affymetrix. This
SNP panel consists of 9,919 SNP that are randomly (and roughly uniformly)
distributed across the genome with an average spacing of approximately 325 kb per
SNP. Further details of the SNP can be found at the link
ftp://ftp.hgsc.bcm.tmc.edu/pub/data/Btaurus/snp/Btau20050310/. The bulk of the SNP
on the array were obtained by comparing the genome sequence of a Hereford animal
to the partial sequence of a Holstein (72.4%), an Angus (15%), a Limousin (3.1%),
and a Brahman (2%) animal, with an additional 7.5% cSNP (coding SNP) obtained
from the Interactive Bovine in silico SNP database (Hawken et al. 2004). Thus, in this
study, the origin of a SNP is designated by the non-Hereford breed used in its
discovery, and consequently, all Holstein, Angus, and Limousin SNP are Taurine
SNP while Brahman SNP are also referred to as Zebu SNP. In summary, the majority
of these SNP are common differences between a Taurine beef and dairy animal, with
a small percentage of SNP being polymorphic between a Taurine and a Zebu beef
animal. Of the genotyped SNP, those with more than 10% of missing data were
excluded, leaving a total of 8,427 SNP. Of these, 7,956 were mappable onto the
Btau4.0 assembly (Liu et al. 2009), allowing their location to be identified.
Allelic variations: Zebu and Taurine fixed differences were determined by comparing
the allele distribution in the Brahman breed with the combined purebred Taurine
animals. A SNP is defined as private in Taurine animals if it is polymorphic in each of
the ten Taurine breeds with a minor allele frequency (MAF) ≥ 5% and monomorphic
in the Brahman breed. Similarly, a SNP is private in Brahman if it is polymorphic
with MAF ≥ 0.05 and monomorphic in all Taurine animals. A rarefaction approach
through the ADZE software (Szpiech, Jakobsson, and Rosenberg 2008) was used for

8
estimating the number of private alleles per locus while accounting for sample size
differences across breeds and breed-types. For each group of SNP (described in the
previous section), the average numbers of alleles per SNP were estimated for each
breed-type for an assumed sample size of 2 to 20.
Fixation indices (FST) were estimated using the method of Weir and Cockerham (Weir
& Cockerham 1984) for 1) between breeds, 2) between Taurine breeds and 3)
between Taurine and Zebu breeds where all Taurine animals were grouped into a
single population. Estimates were similar irrespective of using all SNP, only
autosomal SNP or specific SNP types (Supplementary Table 1). Results were used as
a symmetrical distance matrix for the unrooted Neighbor-Joining Tree estimation
using R/ape (Paradis et al. 2004).
Compound diplotype: We used the SNP density to identify chromosomal regions that
are shared identical-by-state by searching for long identical diplotypes shared within
Taurine or Zebu animals but differing between these types. Because allelic phase is
unknown for our SNP, we define a compound diplotype as one containing at least 20
consecutive SNP all of which must have significantly differential allele frequencies
between the two breed types. The test for difference in allelic frequencies was
performed using the two-proportion Z-test; for each locus,
SE = z taurusindicus pp −
and
−
taurusindicus n+
np)p(=
111 SE
where p is the total allele frequency and n is the sample size. The Ho: z = 0 was
assessed with P-values obtained from a normal distribution. A compound diplotype is
defined if at least 20 consecutive SNP have point-wise P < 0.05, and a representative
SNP per compound diplotype is chosen as the one with the largest |z|.

9
Extended Haplotype Homozygosity (EHH): The counting algorithm of Tang et al.
(2007) was implemented for identifying differential extended haplotype
homozygosity regions between the two breed types. For each breed type, the
proportion of homozygous individuals, EHHSi,j, at the ith
and jth
SNP were calculated
in two steps. First, for each SNPi, EHHSi,j between SNPi and incrementally distant
flanking SNPj were calculated until EHHSi,k<0; this is performed for both j>i and j<i.
Second, the extended haplotype homozygosity of SNPi was calculated: iESi =
Σ(EHHSi,j) for i≤j≤k for the region 3’ of i (or i≥j≥k for the region 5’ of i). Differential
regions of extended haplotype homozygosity between the two breed types were based
on the standardised log-ratio of iESi between the two breed types (Tang et al. 2007):
ln(Rsbi) = ln(iESi,T / iESi,Z) where T=taurine & Z=zebu . To identify significant
regions of positive selection, we estimated 1) the null distribution of ln(Rsbi), and 2)
distribution of noise: SD(ln(Rsbi))/ln(Rsbi). SNP i is significantly under different
selection pressure between the two breed types when it satisfied two criteria. First,
ln(Rsbi) has to have bootstrap P≤0.01: i.e. if ln(Rsbi) is more extreme than 1% of 200
bootstrap estimates where each bootstrap estimate was determined from a repeat
analysis with individuals re-sampled from the total population (combining the two
breed types) Second, ln(Rsbi) has to be within the mid-50 percentile of its noise
distribution where such a distribution was based on 50 bootstrap analyses with
individuals re-sampled within their own breed group. .Finally, a genomic region is
declared as significant if ≥ 50% of the SNP within the region were significant.
STRUCTURE: The Bayesian clustering program STRUCTURE (Pritchard et al.
2000) was run assuming admixture model and correlated allele frequencies (Evanno
et al. 2005) with the degree of admixture inferred from the data. From preliminary
STRUCTURE runs we determined 6,000 burn-ins followed by 1,000 MCMC
10
iterations were sufficient to ensure convergence of parameter estimates (data not
shown). For each K (assumed number of ancestral populations), five replicate runs
were performed. The ∆K method of Evanno et al. (2005) was employed to determine
the K that best represent our data from K=1 to K=13; all five replicate runs revealed a
clear peak at K=2 (Supplementary Figure 6). We used the modified version of
Symmetric Similarity Coefficient (Nordborg et al. 2005) initially proposed by
Rosenberg et al. (2002) to quantify the consistency between replicate runs. The
average and standard deviations of the estimated proportions of the two ancestral
proportions were estimated for each breed: i.e. estimated across all individuals of a
breed.
Results
Allelic privacy: first indication of genetic difference between breed types
The first bovine SNP genotyping array platform (MegAllele 10K SNP panel;
(Hardenbol et al. 2005) provided an excellent resource for identifying breed-type
specific polymorphisms due to the approach adopted for SNP discovery, namely the
identification of SNP between two breeds. We used this SNP panel to study the
genetic differences between 10 Taurine breeds, a Zebu breed (Brahman), a Zebu-
Taurine composite breed (Santa Gertrudis), and a Sanga-Taurine composite breed
(Belmont Red). Of the 8,238 informative SNP (polymorphic with minor allele
frequency (MAF) exceeding 5% in at least one breed) 13 were private in the Taurine
breed-type (i.e. polymorphic in taurines but not in Brahmans; Supplementary Table
2). Based on the method of SNP discovery (Hardenbol et al. 2005), ten of these were
known to be polymorphic between at least two taurine breeds (Hereford vs. Holstein
or Angus or Limousin). Our data further showed that these markers are also

11
polymorphic within each of the taurine breeds but monomorphic within Brahmans. In
contrast, 78 SNP were private in Brahmans (Supplementary Table 2). The majority of
these (~70%) were known to be polymorphic between Brahmans and Herefords
(Hardenbol et al. 2005). Here, we showed that these markers are polymorphic within
Brahmans and fixed in all ten taurine breeds for the same allele. Of these total 91
private SNP, 67 and 56 were polymorphic in the Santa Gertrudis and Belmont Red
samples, respectively; more than 53% were polymorphic in both and 18% were
polymorphic in only one of the two composite breeds (Supplementary Table 2). We
found no polymorphisms with alternate segregating alleles between the two breed
types; i.e. no DNA variants were fixed (i.e. monomorphic) in the Brahman for one
allele and fixed for the alternate allele in the combined Taurine sample or vice versa.
Two major limitations were recognised in this study, namely imbalanced sampling
(many of the smaller breed samples had higher proportions of observed
monomorphism; Figure 1) and SNP discovery bias (there was a lower percentage of
monomorphism in a breed for SNP obtained by comparing the Hereford reference
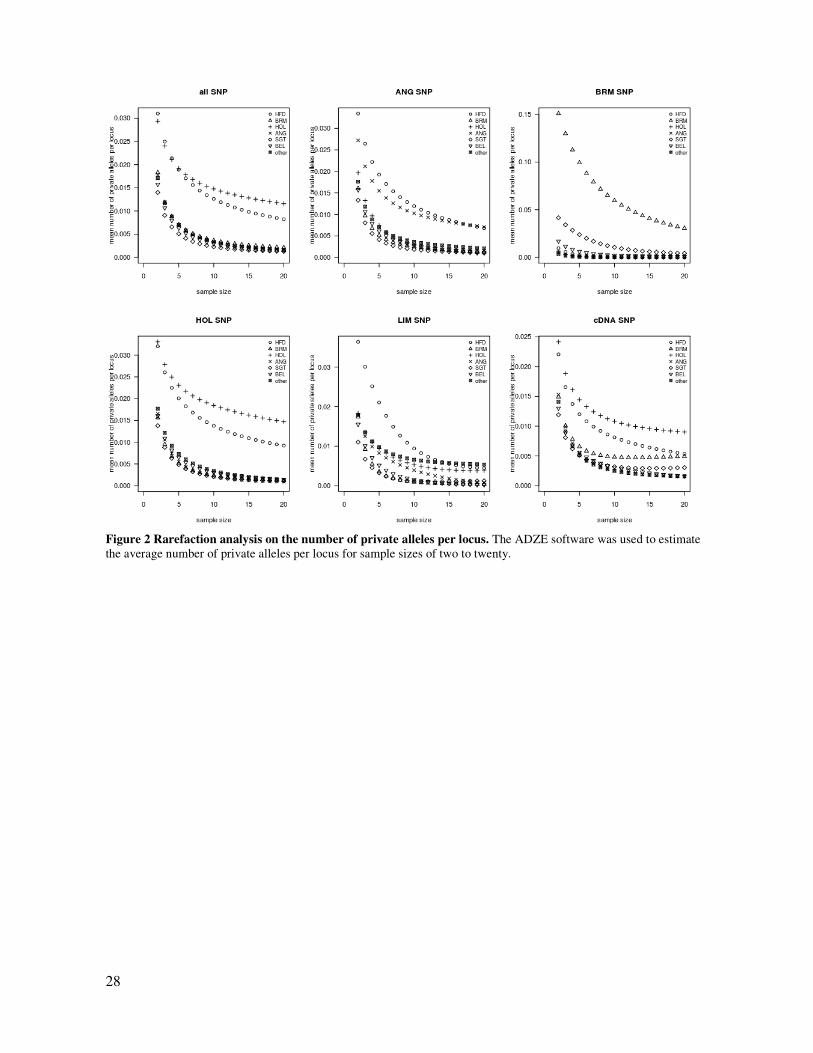
sequence to an animal from that breed; Figures 1-2). Despite these limitations, our
results showed that Brahman is intrinsically more variable than taurine breeds. All
Taurine breeds showed high levels of monomorphism for DNA variants for Brahman
SNP (Figure 2). Even the Hereford, in its role as the reference breed for SNP
discovery, was monomorphic for 15% - 30% of the Brahman SNP. In contrast, while
Brahman animals showed similar levels of monomorphism as Taurine animnals for
Taurine SNP not used in the SNP discover, many of the Brahman SNP have higher
proportion of polymorphism specific to Brahman.

12
The composite breeds, Santa Gertrudis and Belmon Red, also showed similar patterns
of lower monomorphism for both the Taurine and Zebu SNP, but this was
unsurprising given their composite origins.
Genetic variations and breed relationships
Although there are few Brahman SNP in this dataset, they had a disproportionate
effect on the estimates of genetic diversity (as per the FST index) between breeds and
breed types due to differences in the extent of polymorphism between breeds. Using
Taurine-derived SNP alone, the estimated FST between Taurine breeds was 12.2% and
between Taurine and Zebu breeds was 22.1%. Using the Brahman SNP alone, the FST
between Taurine breeds was 9.5% and between Taurine and Zebu breeds was 50.6%.
Using all the SNP, FST between Taurine breeds was 12.1% and between Taurine and
Zebu breeds was 22.8%. These inter-Taurine breed FST estimates were consistent with
previous reports (Kantanen et al. 2000; Wiener et al. 2004), thus providing
confidence towards the clear difference between inter-Taurine FST and Taurine-Zebu
FST estimates, despite the notable SNP ascertainment bias (Supplementary Table 1).
Relationships between breeds were determined by constructing an unrooted
Neighbour-Joining tree using breed-pair FST estimates. These results (Figure 3) were
highly consistent with the known genealogy/history of the breeds. Most notably,
Brahman is most distinct from the other 12 breeds; the two composite breeds were
clustered together on the same branch as Brahman, all of which were distinct from the
Taurine breeds. This global picture of breed-relationship were also obtained with
breed-specific SNP, the subset of autosomal SNP, or a subset of equal numbers of
Brahman and Holtein SNP (Supplemental Figures 4-5), suggesting the differentiation
of Brahman from composite breeds from Taurine breeds surpasses any inherent SNP
discovery biases. However, despite this clear pattern of breed-type divergence, the

13
current SNP panel does not allow accurate quantification of divergence time between
cattle breeds.
Genomic differences between breed types
Because there are only a few (~1% total SNP) fixed differences between the Zebu and
Taurine breeds, we examined whether there were regions of the genetic material that
showed many SNP with consistently different allele frequencies. We identified 14
compound diplotypes encompassing 326 SNP, ranging from 21 to 30 SNP per
compound diplotype (Table 1 & Supplementary Table 3 for full listing of SNP). We
tested the null hypotheses that the 326 SNP within the 14 compound diplotypes were
sampled randomly from the total SNP set without bias for any of the SNP-discovery
breeds using the χ2 test with P-values estimated from 5,000 permutations. There was
evidence that the 326 SNP were over-represented by Limousin- and Brahman-
derived SNP and under-represented by Holstein-discovered SNP (χ2 = 23.1, P <
0.001. These 14 compound diplotypes represent genomic regions that have undergone
(or are undergoing) independent genetic selection and therefore independent
adaptation.
To identify positive selections that have led to complete or near complete fixation we
searched for regions of differential extended haplotype homozygosity (EHH) between
the two breed types (Tang et al. 2007). A total of 142 SNP were identified as having
significantly differential extendend haplotype homosygozity values between the two
breed types. Of these, we deduced twelve regions, encompassing a subset of 124 SNP
(6 – 47 SNP per region), with significant signals of strong recent positive selection
(Table 2). In general, much stronger evidence of selection was observed in Taurines
when compared to Zebus (extent of extended haplotype homozygosity was higher in
Taurines compared to Brahman; Supplementary Figure 6), and this was true for eight

14
of the twelve significant regions (Supplementary Table 4), thus supporting the
common theory that Zebus are more ancestral than Taurines.
Interestingly, these twelve regions did not correspond to our compound diplotypes. In
fact, aside from the sex chromosome, the distributions of these two sets of genomic
regions appear independent of each other (Figure 4). These results suggest the regions
of positive selection (EHH regions), likely in Taurine breeds, are different to those
where both the Taurine and Zebu are under independent selection (compound
diplotypes). Despite the distinction between these two classes of genomic regions,
both are able to distinguish and reconstruct the inter-breed relationships as manifested
by unrooted Neighbour-Joining trees from using FST estimates (Figure 3).
Estimating cattle ancestry
Finally, we used the program STRUCTURE (Pritchard et al. 2000) to estimate the
proportion of common ancestry between the 13 breeds. Based on 7,821 autosomal
SNP, STRUCTURE clearly indicated two ancestral populations corresponding to the
13 breeds (Supplementary Figure 7), confirming previously observed results (The
Bovine HapMap Consortium 2009). Note that identical results were obtained using all
SNP, inclusive of X-linked and unmapped SNP, either because X-linked SNP have
minimal effect on estimating cattle ancestry or because there are relatively few X-
linked SNP; only results from autosomal SNP are presented. These two clusters
corresponded clearly to the two breed types (Figure 4 top): on average, Brahman
individuals have 0.92 (±0.05 SD) probability of belonging to one of the two clusters
(Zebu ancestry) and on average individuals of the 10 Taurine breeds have > 0.92 (<
0.02 SD) probability of belonging to the second cluster (Taurine ancestry). This result
is consistent across five replicate runs with symmetric similarity coefficient
(Rosenberg et al. 2002), SSC, of 0.99. The composite Belmont Red and Santa

15
Gertrudis individuals were found to have mixed Taurine and Zebu ancestry, with
respective probabilities of 0.34 (±0.08 SD; 0.21 – 0.49) and 0.37 (±0.05 SD; 0.28 –
0.47) Zebu ancestry.
Functional genomic analysis of candidate regions
The performance attributes for tropical adaptation in cattle are broadly classified as
fertility, growth, carcass composition, heat resistance, parasite resistance and disease
resistance. In a bid to identify regions (genes) associated with any of the above
characteristics, we combined literature mining, bioinformatics approaches and
functional annotation of the cattle genome and carefully studied the 14 compound
diplotype (Table 1) and 12 EHH (Table 2) regions. The length of each block of
genome varied between 5Mb and 20Mb spanning 12 to 153 genes including a
significant number of genes with unknown function (See Supplementary Tables 3 & 4
for full list).
In an effort to obtain a broad functional insight for these set of genes, we used Gene
Ontologies to find any over-representation in all or a subset of genes. Although, we
did not observe any over-representation implying heterogeneous nature of genes, we
found a number of genes/family of genes that have been reported to be associated
with one or more performance attributes for tropical-adaptation (O'Gorman et al.
2006; O'Gorman et al. 2009; Piper et al. 2009; Wang Y. H., 2007). First, we found a
number of keratins on chromosome 19 (42.2 – 44.2 Mb; Table 2) and where the
signature of selection is in the direction of Zebu. Second, we found two heat shock
proteins: HSPA14 (Table 1) and HSPB9 (Table 2). Third, a number of immune system
activation genes in response to environmental stress such as interleukins: IL33, IL16,
IL17RB, IL17RA; and CD antigens: CD9, CD38, CD44, CD59, CD274 and IL2RG.
Fourth, we found a total of 25 genes from the solute carrier family. Finally, we found

16
a number of genes implicated in tick resistance including NADH dehydrogenases:
NDUFA12, NDUFA9, NDUFAF1 and NDUFV2 (Piper et al. 2009).
We then systematically compared the regions from our findings with animal QTL
database for any overlapping region that contains functionally relevant QTL. A
careful observation of AnimalQTLdb (Hu et al. 2007) revealed a specific region in
chromosome 4 that reported the presence of QTLs for marbling score in cattle from
four independent studies that overlaps with the region we have reported in
chromosome 4 (47.4 to 59.9 kb) and spanning 30 SNPs.
Discussion
In this study, we examined several techniques to classify the proportion of an animal
that could be traced to either a Taurine or a Zebu origin. Although a breed of
composite Sanga-Taurine animals was included, none of the SNP is of Sanga origin,
so conclusions for such breeds cannot be categorical because of the inherent
ascertainment bias in the SNP discovery.
Differences between Zebu and Taurine cattle, using this sample of animals and SNP,
appear to be more of degree than kind. Given the number of SNP, it was surprising
that only 1% was private, i.e. polymorphic in only Taurine or Zebu animals. Most of
these private alleles were in Brahman SNP and private in Brahman animals, rather
than for the Taurine SNP or Taurine animals. These results suggest that the ancestral
populations of cattle were large, so that large numbers of polymorphisms have been
maintained and that most polymorphisms may be ancient and predate the split
between the ancestors of cattle that led to the Zebu breeds compared to the Taurine
breeds (The Bovine HapMap Consortium 2009; The Bovine Genome Sequencing and
Analysis Consortium et al. 2009).
17
The Brahman originated in the United States of America as a composite of at least
four breeds from India and Brazil, as well as the inclusion of Taurine cows to increase
numbers (Briggs and Briggs, 1980). Breeders have subsequently tried to increase the
amount of Zebu ancestry by using semen from purebred Zebu animals, but there
would still be a residue of Taurine ancestry. The range of Zebu breeds used, plus the
original use of Taurine dams, help to explain the greater variability of the Brahman.
Analysis of population substructure shows that some Brahman animals have a residue
of Taurine alleles. It also shows that some Taurine animals show either an
introgression of Zebu alleles, or alleles that are now primarily found in Zebu animals
but that may stem from the common ancestor of the Zebu and Taurine animals. This is
supported by the New South Wales Department of Primary Industries, who claimed
that Brahman was developed from the progeny of four Indian Zebu breeds with some
infusion of local British breeds (Bos taurus) in the early 1800s in USA (Agfact
A2.3.11;
http://www.dpi.nsw.gov.au/agriculture/livestock/beef/breeding/breeds/brahman).
The current set of SNP classifies the composite animals into proportions of Zebu and
Taurine that agrees with the known ancestry of the Santa Gertrudis, which is a
nominally 5/8 Shorthorn and 3/8 Brahman. The interesting comparison of ancestry is
the Belmont Red, which shows a similar proportion of Zebu and Brahman ancestry.
The Belmont Red is nominally ½ Africander and ¼ each of Hereford and Shorthorn.
In the Beef CRC cattle, commercial Belmont Red cattle were used, and while those
are generally without Brahman ancestry, and there is certainly Brahman ancestry in
some research herds of the Belmont Red, the level of Zebu ancestry found here (34%)
is greater than what would be expected for these animals to be registered as Belmont
Red. Since 1985, the Belmont Red Association has allowed up to 25% Bos indicus in

18
their registered animals (http://www.belmontred.com.au/). This suggests that these
SNP are a signal of Sanga ancestry, but because Sanga were not used in the SNP
discovery, this ancestry is not recognised as a third group. It may represent some
ancient Zebu ancestry, but because the Africander cattle are derived from the southern
most part of Africa, and the Bantu tribes had not reached that part of southern Africa,
the amount of ancient Zebu ancestry would be minimal.
Genomic regions of differential extended haplotype homozygosity between two
populations are indicative of recent selection or rapid fixation of the alternate allele
within a short period of time whereby preventing recombination at nearby regions in
one of the two populations. This is different to compound diplotypes which are
extended regions with differential allele frequencies between two populations
therefore are indicative of variable selection pressure or genetic drift. The EHH
approach is useful when we consider the Zebu as an ancestral breed to the Taurine:
recent selection in the Taurine from the Zebu will be reflected in the analysis.
Conversely, if environmental (climatic) adaptation occurred independently in the two
populations (breed types), then one would expect the corresponding genetic regions
controlling adaptation to be in drift in both populations with different allele
frequencies.
Some compound diplotypes may be more than large differences due to drift between
Zebu and Taurine ancestries. Further analyses of these SNP, particularly in animals
such as the Nelore or the Gir breeds, which have essentially no known Taurine
ancestry, might help resolve whether some of the allele distributions represent Zebu
specific effects compared to effects that might be due to the multibreed Zebu as well
as original Taurine cow composition of the Brahman breed. These regions may
represent those parts of the genome that contribute to the temperate and tropical

19
adaptations of Zebu and Taurine animals. Specific association tests between these
SNP and traits values for parasite resistance, rectal temperatures and drought
tolerance may confirm that these are signatures of adaptive evolution.
From a functional genomics viewpoint, we argue that we have indeed found a number
of genes that are either directly or indirectly associated with one or more performance
attributes for tropical adaptation. For instance, a number of keratins (heteropolymeric
structural proteins) form the basis for structural constituent of epidermis/epidermis
development which in turn plays a role in adaptations to different climatic conditions
including tick resistance (Wang et al. 2007; Piper et al. 2008). In addition, heat shock
proteins are heavily differentially expressed in a number of gene expression studies
(for a recent review, see Collier et al (2008) and references therein) and independently
shown to be associated with tropical adaptation. Finally, the overlapping region in
QTL database also demonstrate with additional evidence of the significance of these
genomic regions and requires detailed and directed experiments to obtain a thorough
insight into molecular basis of tropical adaptation in cattle.
In conclusion, we anticipate the study presented here to be an effective approach to
identifying genomic regions specific to the two cattle land races and subsequently
assisting in the discrimination between temperate and tropically adapted cattle. The
application of our procedure using larger samples and denser SNP chip is warranted.
Acknowledgements
The authors would like to thank Dr. Warren Snelling for providing the mappings of
composite markers on the Btau4.0 assembly, and Dr. Gavin Huttley for useful
discussions. Dr. William Barendse provided useful recommendations about data
analysis and insights from the Bovine HapMap Consortium. Sigrid Lehnert and Brian
20
Dalrymple provided helpful reviews. Shivashankar Nagaraj is thankful to the CSIRO
OCE Post-Doctoral Fellowship Program. We thank the owners of the Beef CRC
database, the Commonwealth Scientific and Industrial Research Organisation, the
Queensland Department of Primary Industries and Fisheries, the New South Wales
Department of Primary Industries and the University of New England.

21
References
Barendse W., Harrison B.E., Bunch R.J., Thomas M.B. & Turner L.B. (2009)
Genome wide signatures of positive selection: the comparison of independent
samples and the identification of regions associated to traits. BMC Genomics
10, 178.
The Bovine Genome Sequencing and Analysis Consortium, Elsik C., Tellman, R., &
Worley K. (2009) The genome sequence of Taurine cattle: A window to
ruminant biology and evolution. Science 324, 522-528.
The Bovine HapMap Consortium (2009) Genome-wide survey of SNP variation
uncovers the genetic structure of cattle breeds. Science 324, 528-532.
Bradley D.G., MacHugh D.E., Cunningham P. & Loftus R.T. (1996) Mitochondrial
diversity and the origins of African and European cattle. Proceedings of the
National Academy of Sciences of the United States of America 93, 5131-5.
Briggs H.M. & Briggs D.M. (1980) Modern Breeds of Livestock. Fourth Edition.
Macmillan Publishing Co.
Burrow H.M. & Corbet N.J. (2000) Genetic and environmental factors affecting
temperament of zebu and zebu-derived beef cattle grazed at pasture in the
tropics. Australian Journal of Agricultural Research 51, 155-62.
Burrow H.M., Johnston D.J., Barwick S.A., Holroyd R.G., Barendse W., Thompson
J.M., Griffith G.R. & Sullivan M. (2003) Relationships between carcass and
beef quality and components of herd profitability in Northern Australia. In:
Association for the Advancement of Animal Breeding and Genetics, pp. 359-
62. Association for the Advancement of Animal Breeding and Genetics,
Melbourne, Australia.
Chase Jr. C.C., Riley D.G., Olson T.A., Coleman S.W. & Hammond A.C. (2004)
Maternal and reproductive performance of Brahman × Angus, Senepol ×
Angus, and Tuli × Angus cows in the subtropics. Journal of Animal Science
82, 2764-72.
Collier R.J., Collier J.L., Rhoads R.P. & Baumgard L.H. (2008) Invited review: genes
involved in the bovine heat stress response. Journal of Dairy Science 91, 445-
54.
Evanno G., Regnaut G. & Goudet J. (2005) Detecting the number of clusters of
individuals using the software structure: a simulation study. Molecular
Ecology 14, 2611-20.
Flori L., Fritz S., Jaffrezic F., Boussaha M., Gut I., Heath S., Foulley J.L. & Gautier
M. (2009) The genome response to artificial selection: a case study in dairy
cattle. PLoS ONE 4, e6595.
Gautier M., Flori L., Riebler A., Jaffrézic F., Laloé D., Gut I., Moazami-Goudarzi K.
& Foulley J.L. (2009) A whole genome Bayesian scan for adaptive genetic
divergence in West African cattle. BMC Genomics 10, 550.

22
Hardenbol P., Yu F., Belmont J., Mackenzie J., Bruckner C., Brundage T., Boudreau
A., Chow S., Eberle J., Erbilgin A., Falkowski M., Fitzgerald R., Ghose S.,
Iartchouk O., Jain M., Karlin-Neumann G., Lu X., Miao X., Moore B.,
Moorhead M., Namsaraev E., Pasternak S., Prakash E., Tran K., Wang Z.,
Jones H.B., Davis R.W., Willis T.D. & Gibbs R.A. (2005) Highly multiplexed
molecular inversion probe genotyping: over 10,000 targeted SNPs genotyped
in a single tube assay. Genome Research 15, 269-75.
Hawken R.J., Barris W.C., McWilliam S.M. & Dalrymple B.P. (2004) An interactive
bovine in silico SNP database (IBISS). Mammalian Genome 15, 819-27.
Hu Z.L., Fritz E.R. & Reecy J.M. (2007) AnimalQTLdb: a livestock QTL database
tool set for positional QTL information mining and beyond. Nucleic Acids
Research 35, D604-9.
Ibeagha-Awemu E.M., Jann O.C., Weimann C. & Erhardt G. (2004) Genetic
diversity, introgression and relationships among West/Central African cattle
breeds. Genetic Selection Evolution 36, 673-90.
Kantanen J., Olsaker I., Holm L.E., Lien S., Vilkki J., Brusgaard K., Eythorsdottir E.,
Danell B. & Adalsteinsson S. (2000) Genetic diversity and population
structure of 20 North European cattle breeds. Journal of Heredity 91, 446-57.
Kemenes P.A., Regitano L.C.d.A., Rosa A.J.d.M., Packer I.U., Razook A.G.,
Figueiredo L.A.d., Silva N.A., Etchegaray M.A.L. & Coutinho L.L. (1999) k-
Casein, b-lactoglobulin and growth hormone allele frequencies and genetic
distances in Nelore, Gyr, Guzerá, Caracu, Charolais, Canchim and Santa
Gertrudis cattle. Genetics and Molecular Biology 22, 539-41.
Kieffer N.M. & Carwright T.C. (1968) Sex chromosome polymorphism in domestic
cattle. Journal of Heredity 59, 35-7.
Lenstra J.A. & Bradley D.G. (1999) Systematics and Phylogeny of Cattle. In: The
Genetics of Cattle (ed. by R. Fries & A. Ruvinsky), pp. 1-14. CABI
Publishing.
Liu Y., Qin X., Song X.Z., Jiang H., Shen Y., Durbin K.J., Lien S., Kent M.P.,
Sodeland M., Ren Y., Zhang L., Sodergren E., Havlak P., Worley K.C.,
Weinstock G.M. & Gibbs R.A. (2009) Bos taurus genome assembly. BMC
Genomics 10, 180.
Loftus R.T., MacHugh D.E., Bradley D.G., Sharp P.M. & Cunningham P. (1994)
Evidence for two independent domestications of cattle. Proceedings of the
National Academy of Sciences of the United States of America 91, 2757-61.
Lunstra D.D. & Cundiff L.V. (2003) Growth and pubertal development in Brahman-,
Boran-, Tuli-, Belgian Blue-, Hereford- and Angus-sired F1 bulls. Journal of
Animal Science 81, 1414-23.

23
MacEachern S., McEwan J., McCulloch A., Mather A., Savin K. & Goddard M.
(2009a) Molecular evolution of the Bovini tribe (Bovidae, Bovinae): is there
evidence of rapid evolution or reduced selective constraint in Domestic cattle?
BMC Genomics 10, 179.
MacEachern S., Hayes B., McEwan J. & Goddard M. (2009b) An examination of
positive selection and changing effective population size in Angus and
Holstein cattle populations (Bos taurus) using a high density SNP genotyping
platform and the contribution of ancient polymorphism to genomic diversity in
Domestic cattle. BMC Genomics 10, 181.
MacHugh D.E., Shriver M.D., Loftus R.T., Cunningham P. & Bradley D.G. (1997)
Microsatellite DNA variation and the evolution, domestication and
phylogeography of taurine and zebu cattle (Bos taurus and Bos indicus).
Genetics 146, 1071-86.
Mukasa-Mugerwa E. (1989) A review of reproductive performance of female Bos
indicus (zebu) cattle. ILCA Monograph 6. ILCA, Addis Ababa, Ethiopia.
Nijman I.J., Otsen M., Verkaar E.L., de Ruijter C., Hanekamp E., Ochieng J.W.,
Shamshad S., Rege J.E., Hanotte O., Barwegen M.W., Sulawati T. & Lenstra
J.A. (2003) Hybridization of banteng (Bos javanicus) and zebu (Bos indicus)
revealed by mitochondrial DNA, satellite DNA, AFLP and microsatellites.
Heredity 90, 10-6.
Nordborg M., Hu T.T., Ishino Y., Jhaveri J., Toomajian C., Zheng H., Bakker E.,
Calabrese P., Gladstone J., Goyal R., Jakobsson M., Kim S., Morozov Y.,
Padhukasahasram B., Plagnol V., Rosenberg N.A., Shah C., Wall J.D., Wang
J., Zhao K., Kalbfleisch T., Schulz V., Kreitman M. & Bergelson J. (2005)
The pattern of polymorphism in Arabidopsis thaliana. PLoS Biology 3, e196.
O'Gorman G.M., Park S.D., Hill E.W., Meade K.G., Coussens P.M., Agaba M.,
Naessens J., Kemp S.J. & MacHugh D.E. (2009) Transcriptional profiling of
cattle infected with Trypanosoma congolense highlights gene expression
signatures underlying trypanotolerance and trypanosusceptibility. BMC
Genomics 10, 207.
O'Gorman G.M., Park S.D., Hill E.W., Meade K.G., Mitchell L.C., Agaba M., Gibson
J.P., Hanotte O., Naessens J., Kemp S.J. & MacHugh D.E. (2006) Cytokine
mRNA profiling of peripheral blood mononuclear cells from trypanotolerant
and trypanosusceptible cattle infected with Trypanosoma congolense. Physiol
Genomics 28, 53-61.
Paradis E., Claude J. & Strimmer K. (2004) APE: Analyses of Phylogenetics and
Evolution in R language. Bioinformatics 20, 289-90.
Piper E.K., Jackson L.A., Bagnall N.H., Kongsuwan K.K., Lew A.E. & Jonsson N.N.
(2008) Gene expression in the skin of Bos taurus and Bos indicus cattle
infested with the cattle tick, Rhipicephalus (Boophilus) microplus. Veterinary
Immunology and Immunopathology 126, 110-9.
24
Piper E.K., Jonsson N.N., Gondro C., Lew-Tabor A.E., Moolhuijzen P., Vance M.E.
& Jackson L.A. (2009) Immunological profiles of Bos taurus and Bos indicus
cattle infested with the cattle tick, Rhipicephalus (Boophilus) microplus. Clin
Vaccine Immunol 16, 1074-86.
Pritchard J.K., Stephens M. & Donnelly P. (2000) Inference of population structure
using multilocus genotype data. Genetics 155, 945-59.
Rosenberg N.A., Pritchard J.K., Weber J.L., Cann H.M., Kidd K.K., Zhivotovsky
L.A. & Feldman M.W. (2002) Genetic structure of human populations.
Science 298, 2381-5.
Fries R. & Ruvinsky A. (1999) The Genetics of cattle. CAB International,
Wallingford, UK.
Szpiech Z.A., Jakobsson M., & Rosenberg N.A. (2008) ADZE: A rarefaction
approach for counting alleles private to combinations of populations.
Bioinformatics 24, 2498-2504.
Tang K., Thornton K.R. & Stoneking M. (2007) A New Approach for Using Genome
Scans to Detect Recent Positive Selection in the Human Genome. PLoS
Biology 5, e171.
Tukey J.W. (1977) Exploratory Data Analysis. Addison-Wesley, Reading.
Turner J.W. (1980) Genetic and biological aspects of Zebu adaptability. Journal of
Animal Science 50, 1201-5.
Upton W., Burrow H.M., Dundon A., Robinson D.L. & Farrell E.B. (2001) CRC
breeding program design, measurements and database: methods that underpin
CRC research results. Australian Journal of Experimental Agriculture 41,
943-52.
Wang Y. H. R.A., Kemp D, McWilliam S. M., Ingham A., Davis C. A, Moore R.
J., Lehnert S. A. (2007) Gene expression profiling of Hereford Shorthorn
cattle following challenge with Boophilus microplus tick larvae. Australian
Journal of Experimental Agriculture 47, 1397-407.
Weir B.S. & Cockerham C.C. (1984) Estimating F-Statistics for the Analysis of
Population Structure. Evolution 38, 1358-70.
Wiener P., Burton D. & Williams J.L. (2004) Breed relationships and definition in
British cattle: a genetic analysis. Heredity 93, 597-602.
Wolcott M.L., Johnston D.J., Barwick S.A. & Burrow H.M. (2006) Genetic
correlations of steer growth, fatness and Igf-i with feed intake and efficiency
in two Tropically adapted genotypes In: 8th World Congress on Genetics
Applied to Livestock Production, Belo Horizonte, MG, Brasil.

25
Table 1 Compound diplotypes: Genomic regions with significant evidence for differential allele frequencies
between Taurine and Zebu cattle.
Number
of SNP
Chromosome:
Interval (Mb) Genes
22 1: 89.7 – 95.5
24 3: 98.8 – 104.6
Solute carrier SLC1A7
Tick-resistant gene NDUFA12
30 4: 47.4 – 59.9
Solute carrier SLC26A3 & SLC26A4
Overlaps QTL for marbling score in cattle from four independent studies
29 5: 64.5 – 72.9
CD antigen CD38[hp1]
Solute carriers SLC17A8, SLC25A3, & SLC5A8.
21 5: 110.8 – 118.7
Interleukin IL17RA
CD antigen CD9
Solute carriers: SLC16A8, SLC6A12, SLC6A13
Tick-resistant gene NDUFA9
21 6: 34.0 – 37.6
30 6: 107.9 – 116.1 CD antigen CD38.
28 8: 40.5 – 47.3
Interleukin IL33 & CD274
Solute carrier SLC1A1
24 10: 28.3 – 37.4 Tick-resistant gene NDUFAF1
25 13: 24.9 – 30.3 Heat shock protein HSPA14
24 15: 61.6 – 67.6
CD antigen CD44 & CD59
Solute carrier SLC1A2
24 16: 35.2 – 45.2 Solute carriers SLC25A33, SLC2A5, & SLC45A1
24 22: 5.8 – 10.7
22 X: 48.7 – 67.1
Interleukin receptor IL2RG
Solute carriers SLC35A2 & SLC7A3
26
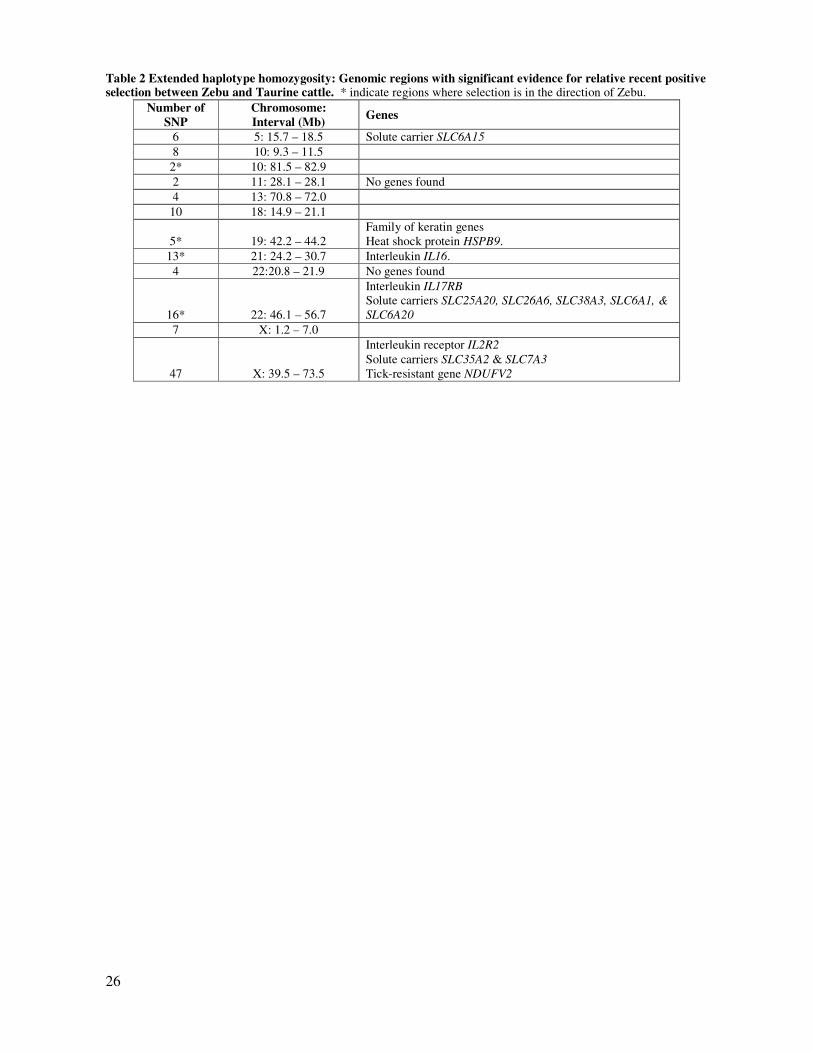
Table 2 Extended haplotype homozygosity: Genomic regions with significant evidence for relative recent positive selection between Zebu and Taurine cattle. * indicate regions where selection is in the direction of Zebu.
Number of
SNP
Chromosome:
Interval (Mb) Genes
6 5: 15.7 – 18.5 Solute carrier SLC6A15
8 10: 9.3 – 11.5
2* 10: 81.5 – 82.9
2 11: 28.1 – 28.1 No genes found
4 13: 70.8 – 72.0
10 18: 14.9 – 21.1
5* 19: 42.2 – 44.2
Family of keratin genes
Heat shock protein HSPB9.
13* 21: 24.2 – 30.7 Interleukin IL16.
4 22:20.8 – 21.9 No genes found
16* 22: 46.1 – 56.7
Interleukin IL17RB
Solute carriers SLC25A20, SLC26A6, SLC38A3, SLC6A1, &
SLC6A20
7 X: 1.2 – 7.0
47 X: 39.5 – 73.5
Interleukin receptor IL2R2
Solute carriers SLC35A2 & SLC7A3
Tick-resistant gene NDUFV2

27
Figure 1 Relationship between proportion of monomorphism and sample size. The proportions of monormophism
are shown for all or breed-specific (BRM, HOL, ANG, LMS) SNP. The breed with the corresponding sample sizes are
shown at the bottom of the plot (see Methods and Materials for breed code).
28
Figure 2 Rarefaction analysis on the number of private alleles per locus. The ADZE software was used to estimate
the average number of private alleles per locus for sample sizes of two to twenty.

29
Figure 3 Neighbouring-Joining Tree of all 13 breeds constructed using FST values estimated for each breed-pair. The same analysis was performed using all 8,427 SNP, 326 SNP within the 14 compound diplotype regions, or 124
SNP within the 12 extended haplotype homozygosity regions. Breed acronyms are as follows: BRM = Brahman; SGT =
Santa Gertrudis; BEL = Belmont Red; HFD = Hereford; BSW = Brown Swiss; HOL = Holstein; AUR = Australian
Red; GNS = Guernsey; JER = Jersey; IWS = Illawarra Shorthorn; SHN = Shorthorn; ANG = Angus; and MGY =
Murray Grey.

30
Figure 4 Distribution of SNP. Each SNP is represented as a horizontal dash on the 30 vertical lines corresponding to
the 29 autosomes and the X chromosome. Pink and blue dashes indicate SNP within the 14 compound diplotypes and
12 extended haplotype homozygosity regions respectively.
Figure 5 STRUCTURE prediction of the proportion of two ancestral populations (K=2) corresponding to 317 individuals belonging to 13 breeds using 7,821 autosomal SNP. The result is the averages of five Markov chain
Monte Carlo replicate runs. Individuals (on the x-axis) have been ordered based on the proportion of Taurine (yellow)
ancestry within each breed. See MM for breed code.