The Evolution of the 2007 Mid-Atlantic Cold Pool W. S. Brown University of Massachusetts at...
42
The Evolution of the 2007 The Evolution of the 2007 Mid-Atlantic Mid-Atlantic Cold Pool Cold Pool W. S. Brown University of Massachusetts at Dartmouth O. Schofield, S. Glenn, & J. Kohut Rutgers University W. Boicourt University of Maryland at Horn Point AGU/ASLO/TOS 2014 Ocean Sciences Meeting 26 February 2014
-
Upload
erica-merris -
Category
Documents
-
view
223 -
download
3
Transcript of The Evolution of the 2007 Mid-Atlantic Cold Pool W. S. Brown University of Massachusetts at...
The Evolution of the The Evolution of the 2007 Mid-Atlantic 2007 Mid-Atlantic
Cold Pool Cold Pool
W. S. Brown University of Massachusetts at Dartmouth
O. Schofield, S. Glenn, & J. KohutRutgers University
W. Boicourt University of Maryland at Horn Point
AGU/ASLO/TOS 2014 Ocean Sciences Meeting
26 February 2014
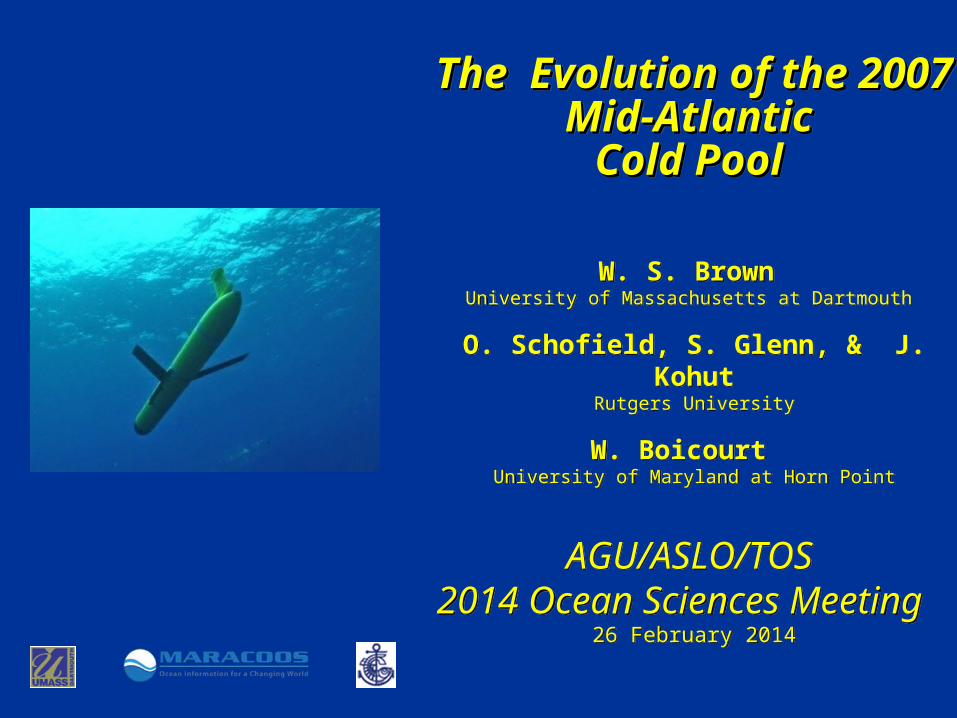
Mid Atlantic Bight (MAB) COLD POOL
Ou & Houghton, 1982NOAA/NMFS 1979 Survey Bottom Temperatures
Remnant winter water …isolated by springtime surface warming/freshening===> Cold Pool

Mid Atlantic Bight (MAB) COLD POOL
Ou & Houghton, 1982NOAA/NMFS 1979 Survey Bottom Temperatures
Remnant winter water …isolated by springtime surface warming/freshening===> Cold Pool
HISTORICAL EVIDENCE Cold Pool evolves in TIME-SPACE
“cradle (May) to grave (October)”

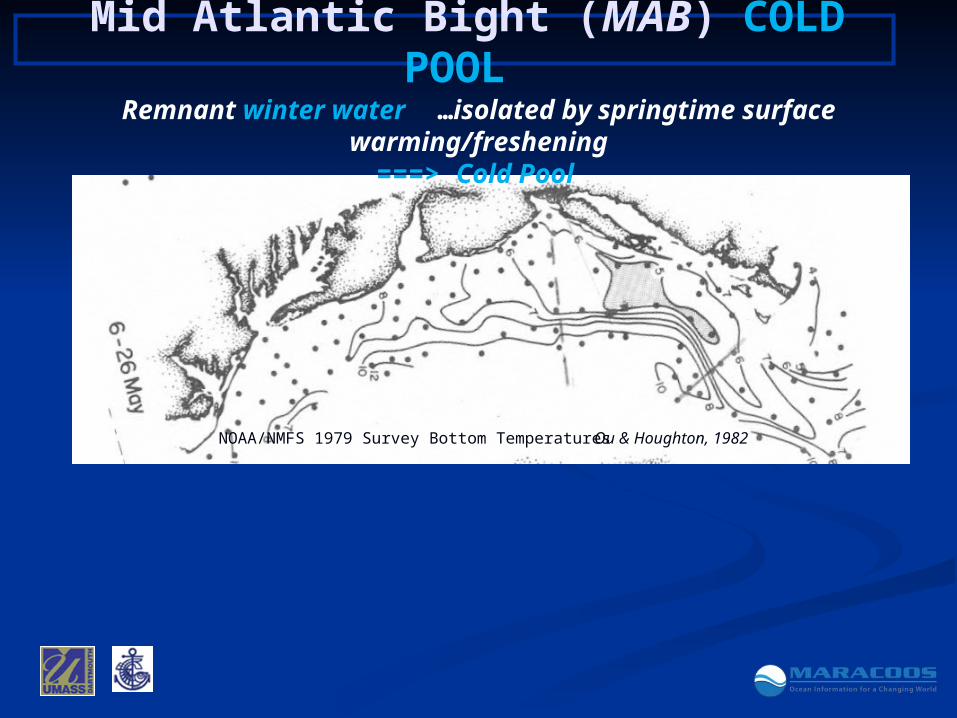
Mid Atlantic Bight (MAB) COLD POOL
Ou & Houghton, 1982NOAA/NMFS 1979 Survey Bottom Temperatures
Remnant winter water …isolated by springtime surface warming/freshening===> Cold Pool
HISTORICAL EVIDENCE
.. fed by cold water early summer
“coldest patch”
Mid Atlantic Bight (MAB) COLD POOL
Ou & Houghton, 1982NOAA/NMFS 1979 Survey Bottom Temperatures
Remnant winter water …isolated by springtime surface warming/freshening===> Cold Pool
HISTORICAL EVIDENCE
.. fed by cold water early summer
.. warmed during summer

Mid Atlantic Bight (MAB) COLD POOL
Ou & Houghton, 1982NOAA/NMFS 1979 Survey Bottom Temperatures
Remnant winter water …isolated by springtime surface warming/freshening===> Cold Pool
HISTORICAL EVIDENCE Cold Pool evolves in TIME-SPACE
.. fed by cold water early summer
..warmed during summer
..destroyed by autumn storms

During summer COLD POOL Water
warms as it “moves down the shelf” (~ 5 km/day )
August 1979 bottom temperatures in the Mid-Atlantic Bight (MAB) (based on NMFS data by Ou & Houghton, 1982)
COLD POOL minimum
bottom temperature
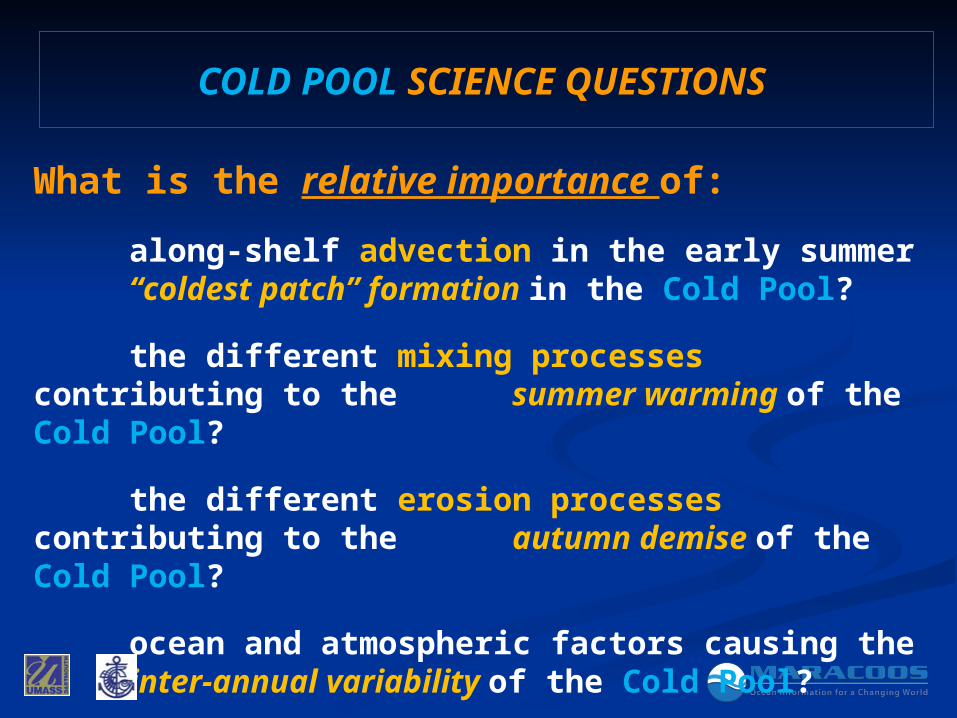
COLD POOL SCIENCE QUESTIONS
What is the relative importance of:
along-shelf advection in the early summer “coldest patch” formation in the Cold Pool?
the different mixing processes contributing to the summer warming of the Cold Pool?
the different erosion processes contributing to the autumn demise of the Cold Pool?
ocean and atmospheric factors causing the inter-annual variability of the Cold Pool?

THE DATA SET
Rutgers U 2003 – presentGlider Trajectory Composite
transits •repeat weekly cross-shelf•zig-zag monthly along-shelf•zig-zag monthly along-beach
Glider Operations…cost-effective survey technology ...virtually independent of weather
..can be maintained at sea indefinitely
Satellites can not “see” the COLD POOLalternative
Opportunistic “slices “ with gliders
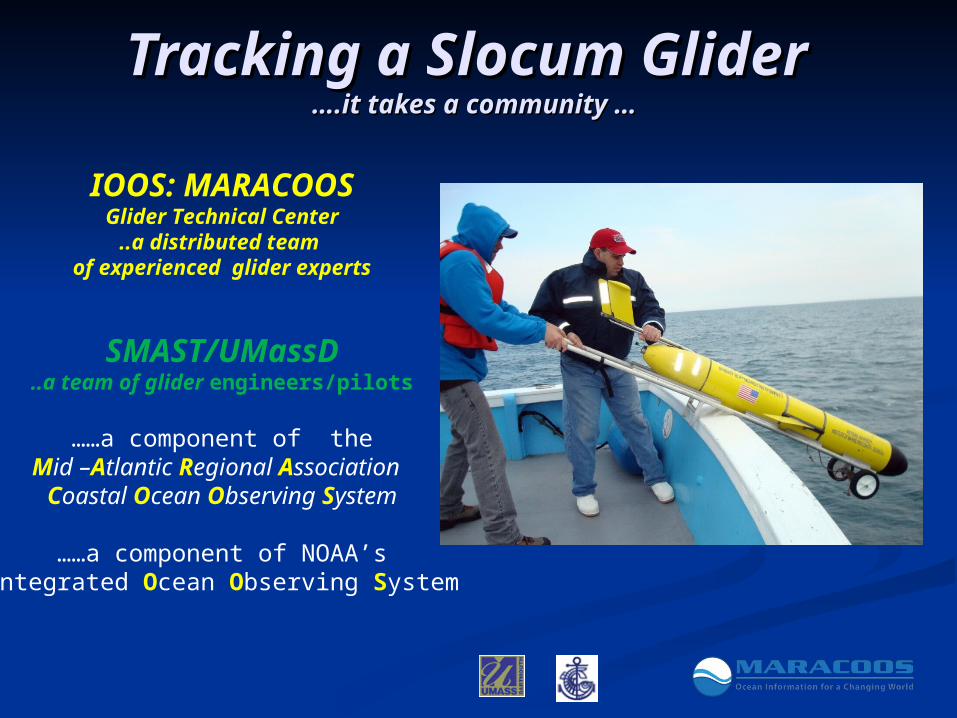
Tracking a Slocum Glider Tracking a Slocum Glider ….it takes a community …….it takes a community …
IOOS: MARACOOSGlider Technical Center
..a distributed team of experienced glider experts
SMAST/UMassD..a team of glider engineers/pilots
……a component of the
Mid –Atlantic Regional Association Coastal Ocean Observing System
……a component of NOAA’sIntegrated Ocean Observing System
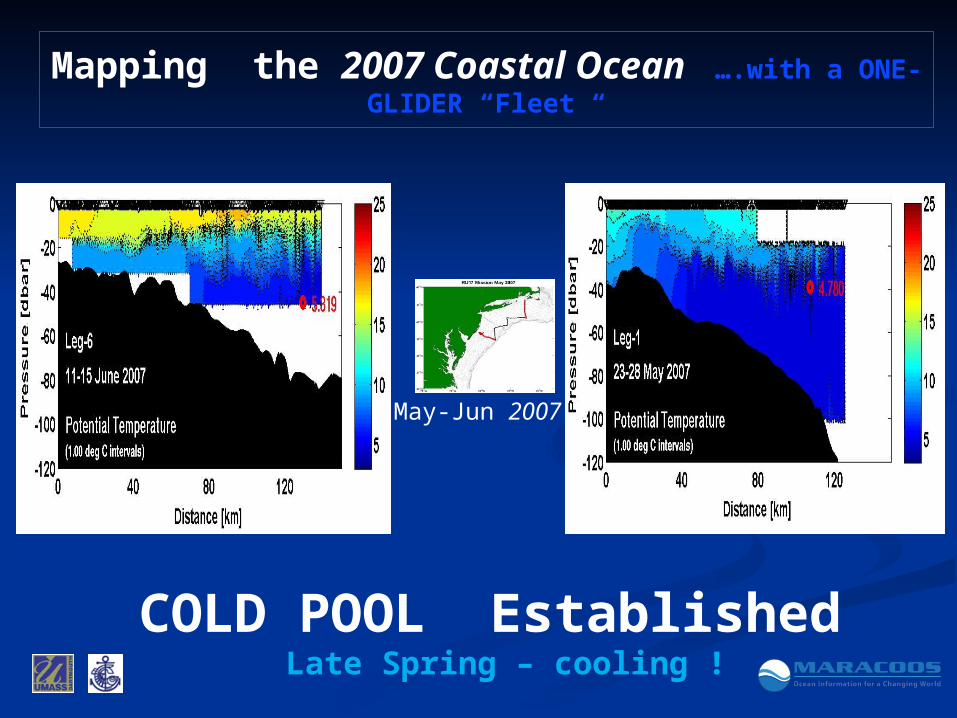
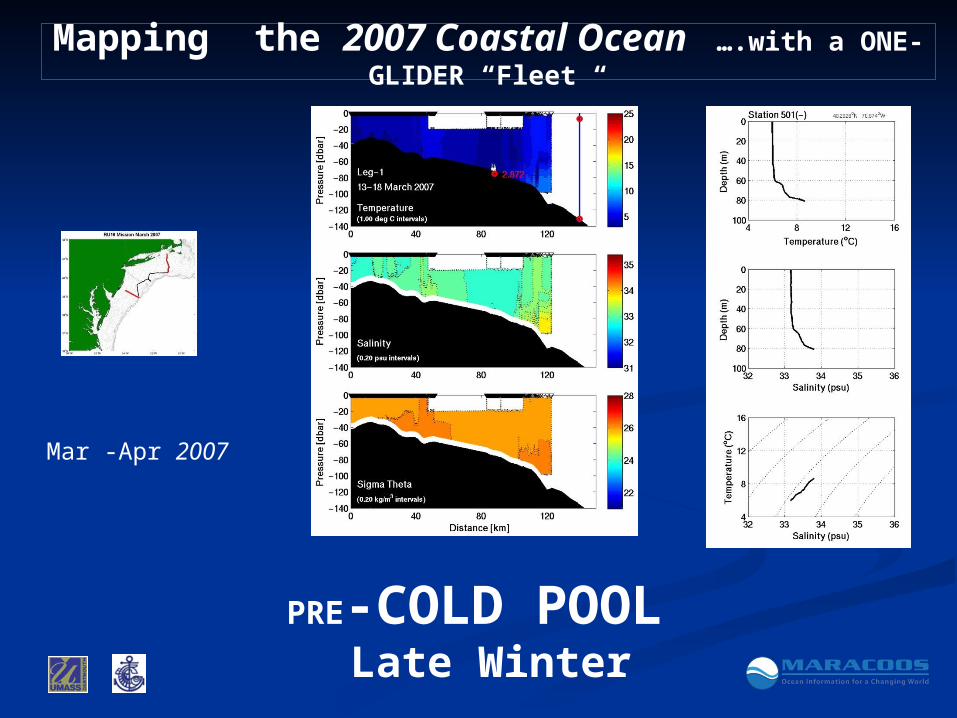
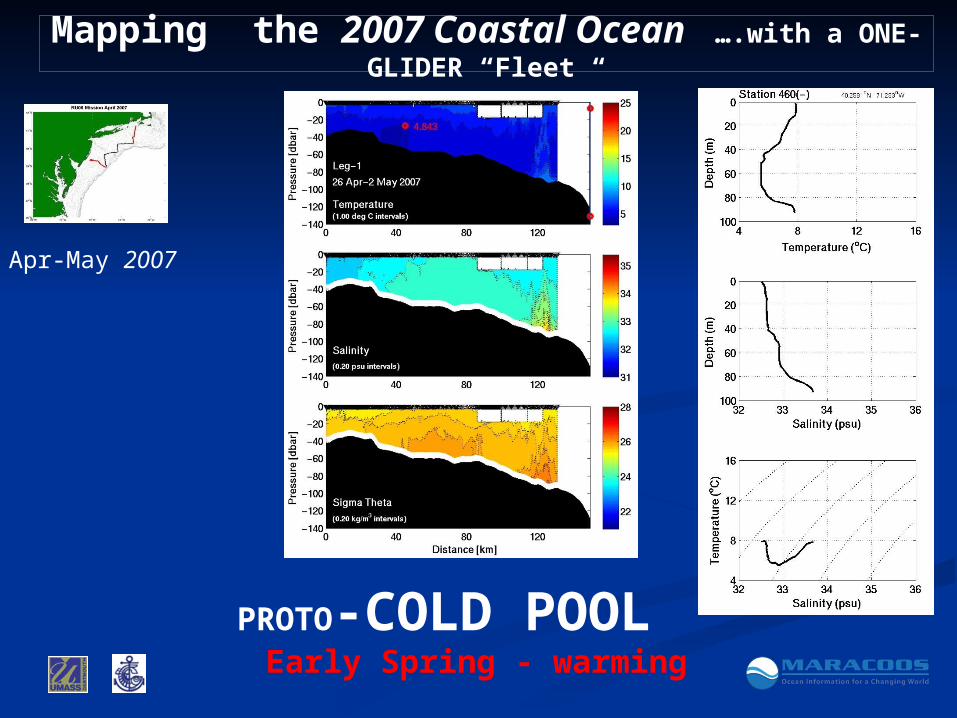
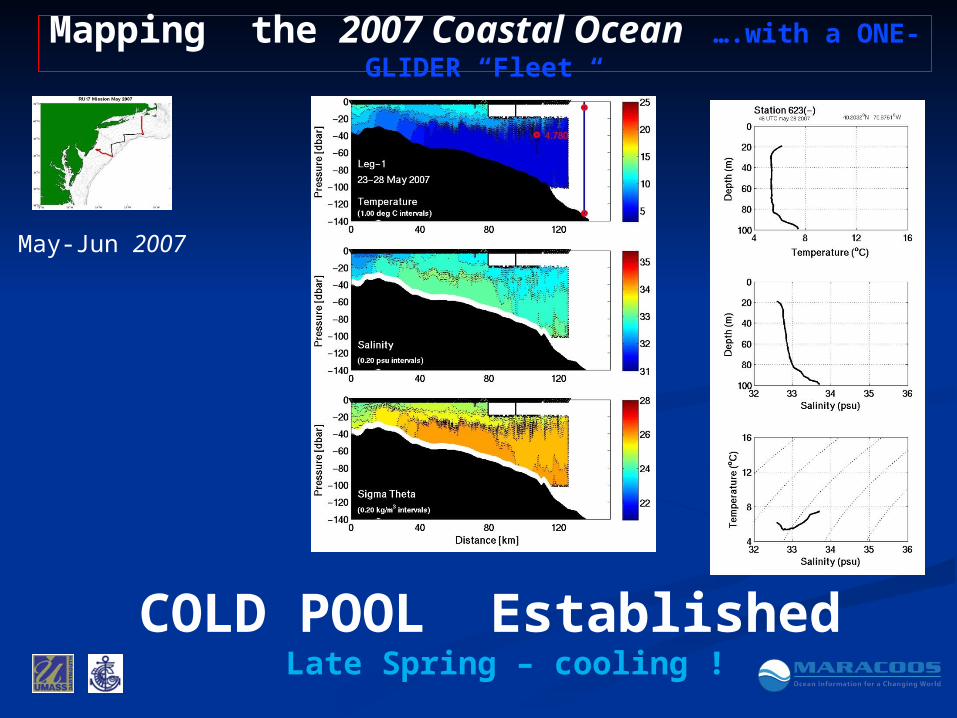
Mapping the 2007 Coastal Ocean ….with a ONE-GLIDER “Fleet “
May-Jun 2007
COLD POOL Established Late Spring – cooling !
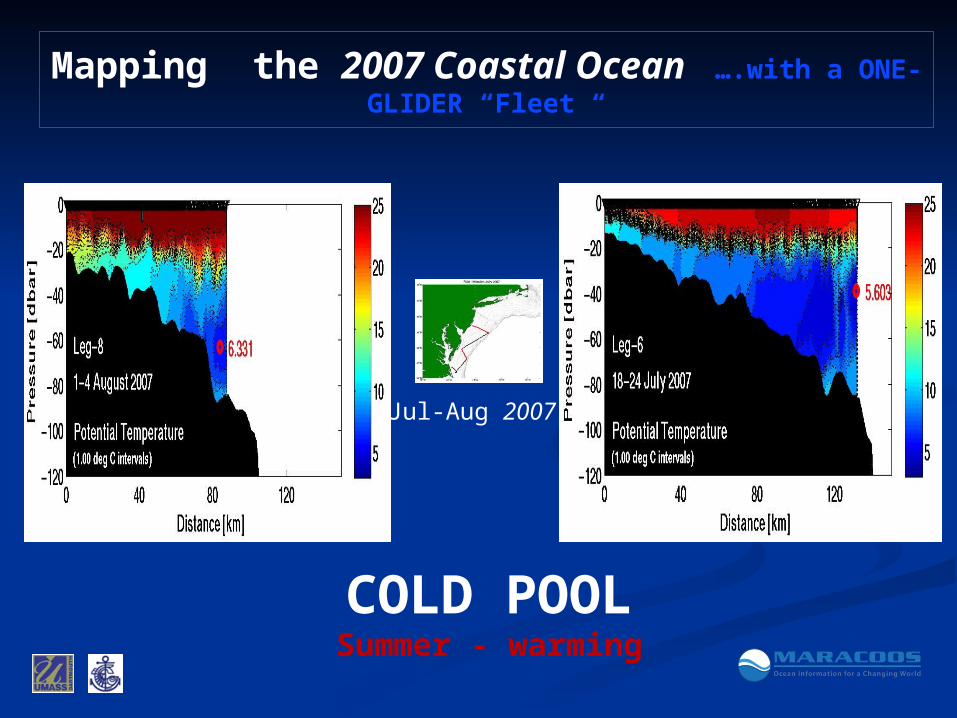
Mapping the 2007 Coastal Ocean ….with a ONE-GLIDER “Fleet “
Jul-Aug 2007
COLD POOLSummer - warming
Mapping the 2007 Coastal Ocean ….with a ONE-GLIDER “Fleet “
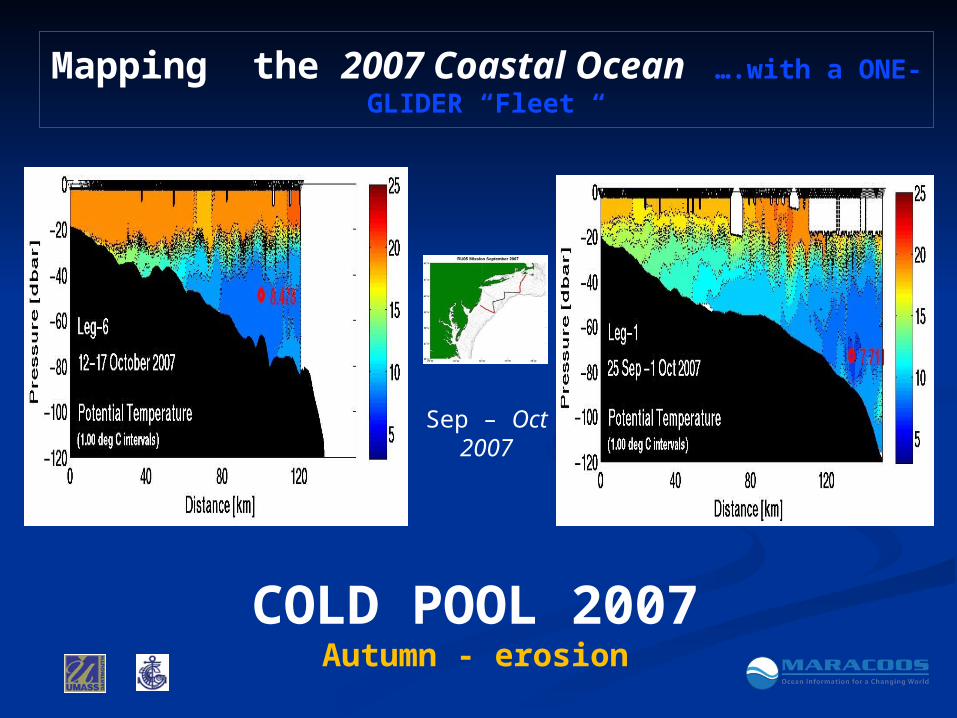
Sep – Oct 2007
COLD POOL 2007Autumn - erosion
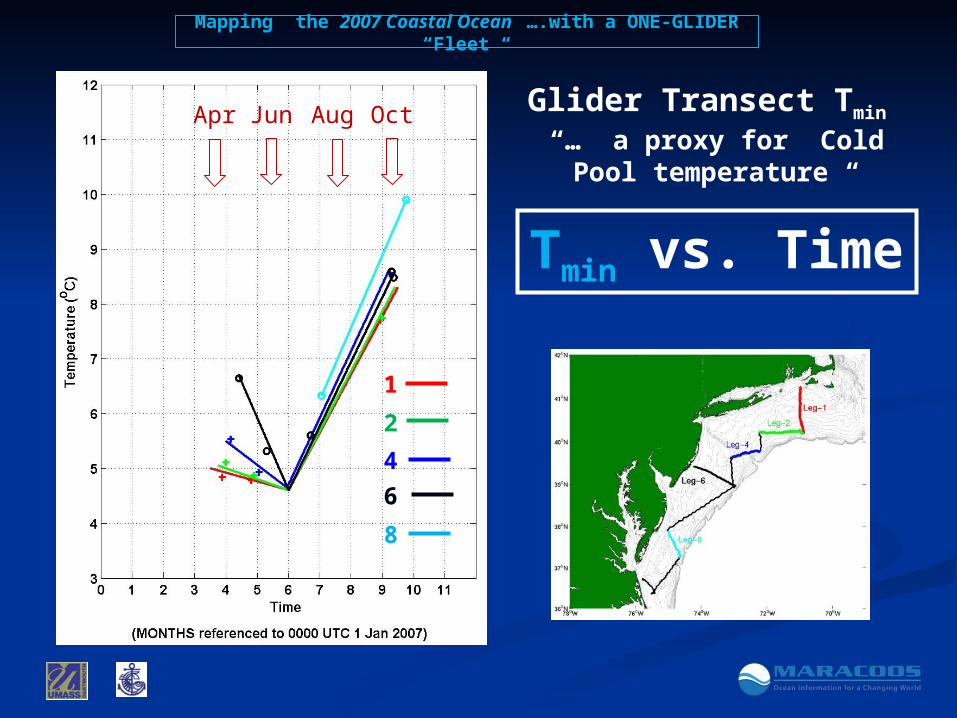
Mapping the 2007 Coastal Ocean ….with a ONE-GLIDER “Fleet “
Tmin vs. Time
Glider Transect Tmin “… a proxy for Cold Pool
temperature “
Apr Jun Aug Oct
1
2
6
8
4

with TEMPERATURE DEPARTURES
TD = T – Tmin
TD statistics suggest
TD < 4.3oC (1 σ)
DEFINING COLD POOL WATER – 2007
Tmin vs Smin Diagram

DEFINING COLD POOL WATER – 2007
Cold Pool Water 2007
TD = T – Tmin < 4.3oC
0.6 < S < 0.8 psu
MAY-JUN
0.8
4.3 oC
0.6 psu
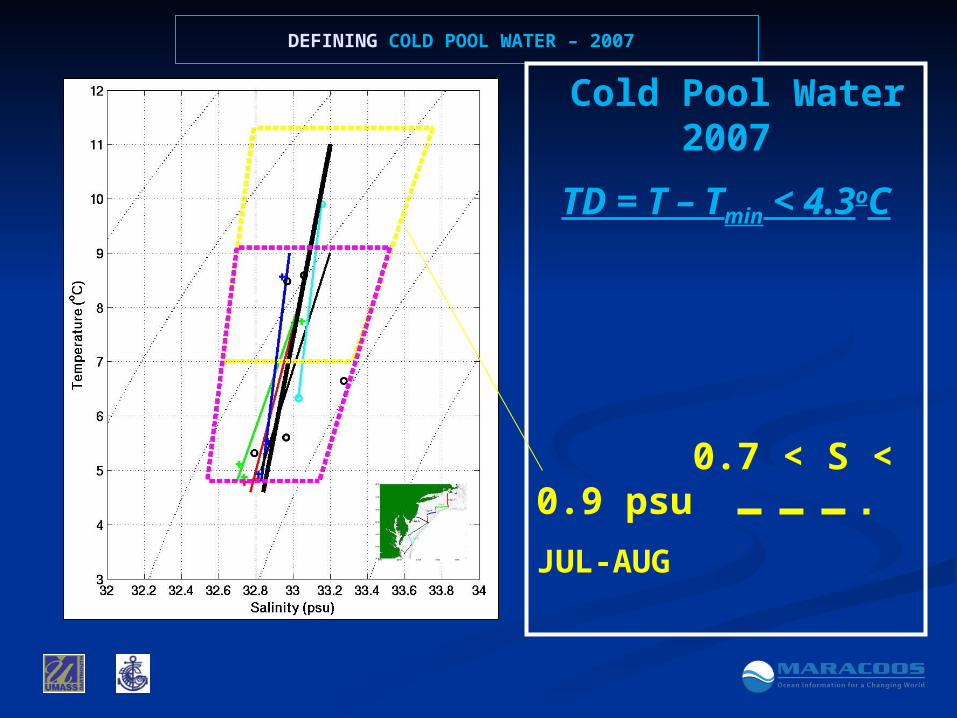
DEFINING COLD POOL WATER – 2007
Cold Pool Water 2007
TD = T – Tmin < 4.3oC
0.7 < S < 0.9 psu
JUL-AUG
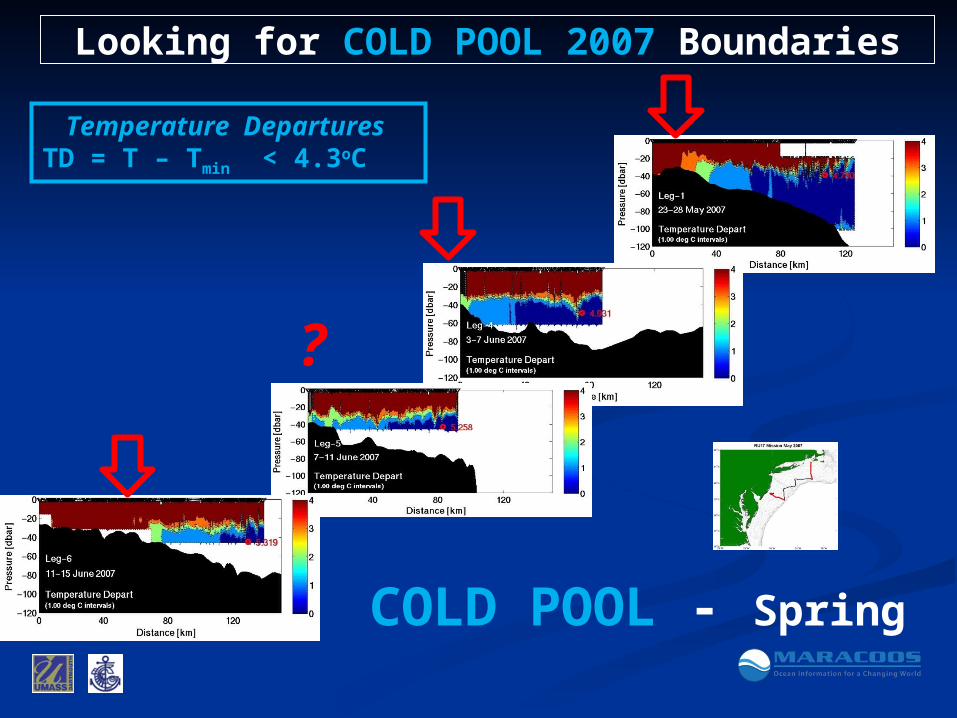
Looking for COLD POOL 2007 Boundaries
May-Jun2007 COLD POOL - Spring
?
Temperature Departures TD = T – Tmin < 4.3oC

COLD POOL May-Jun 2007
COLD POOL Jul-Aug 2007
Mapping the 2007 Coastal Ocean ….with a ONE-GLIDER “Fleet “
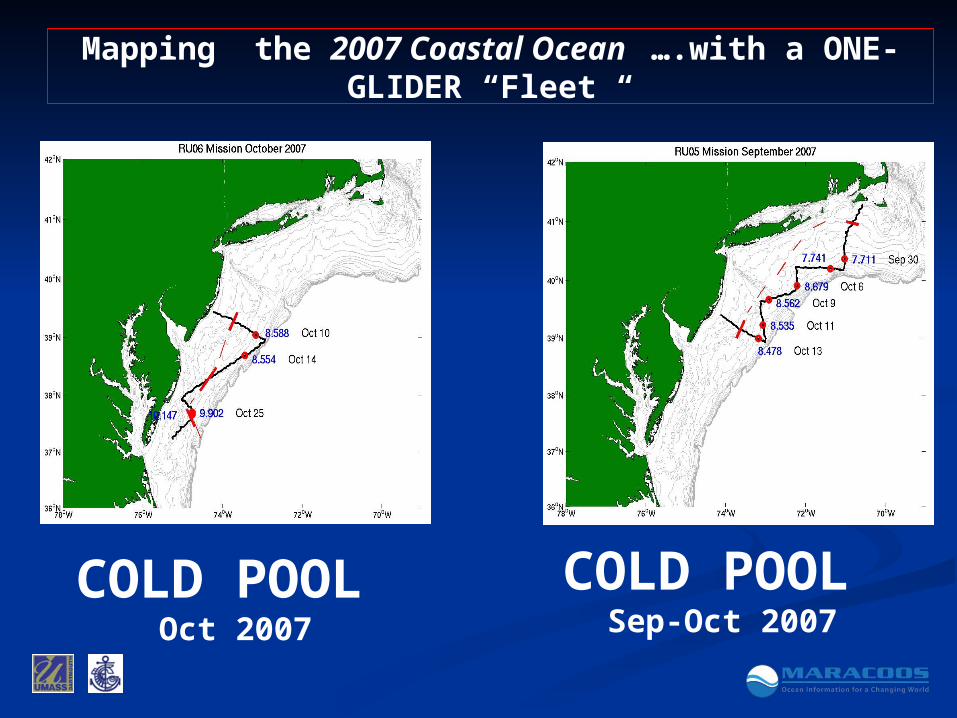
COLD POOL Sep-Oct 2007
COLD POOL Oct 2007
Mapping the 2007 Coastal Ocean ….with a ONE-GLIDER “Fleet “
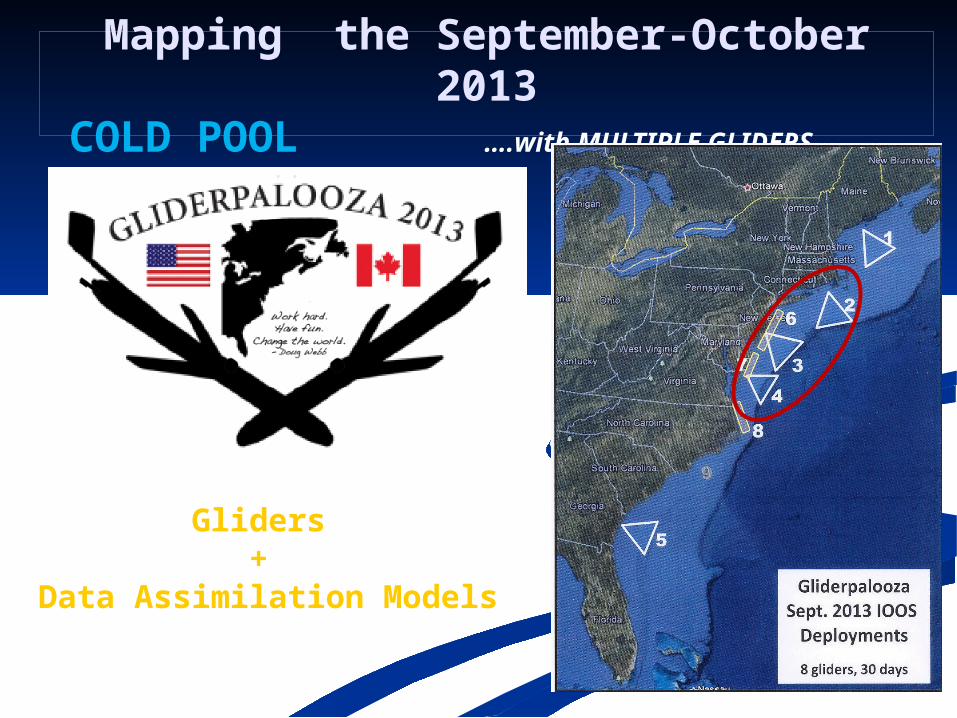
Mapping the September-October 2013COLD POOL ….with MULTIPLE GLIDERS …….
Gliders +
Data Assimilation Models
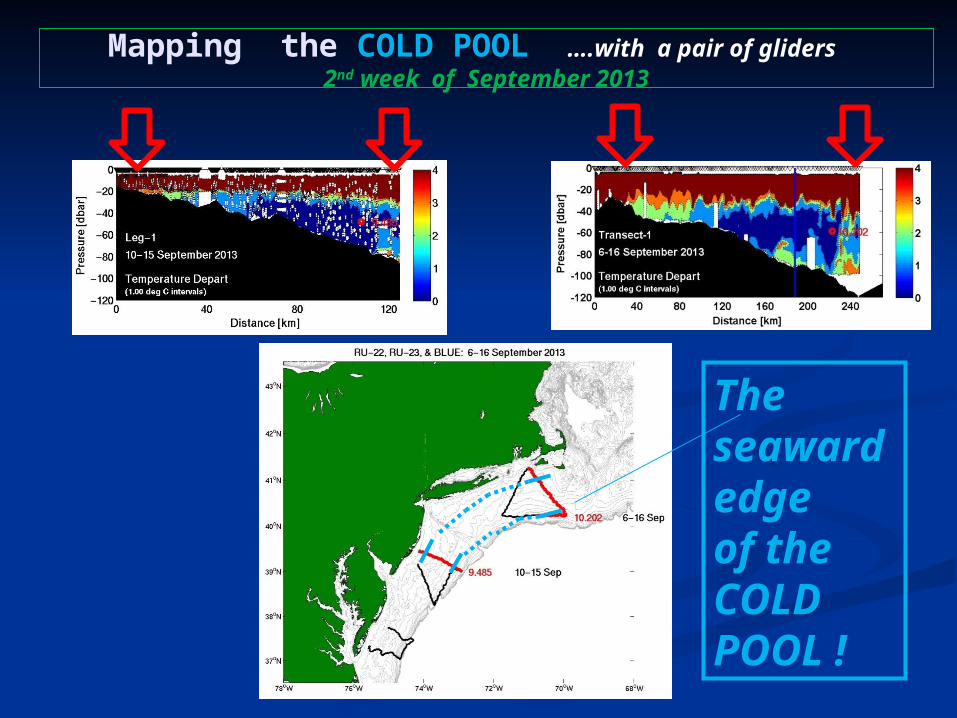
Mapping the COLD POOL ….with a pair of gliders 2nd week of September 2013
The seaward edge of the COLD POOL !

ESPRESSOBottom Temperature
27 May 2013
Wilkin et al., 2013
NEW DIRECTIONS: Glider Data Assimilation Modeling

SW
CPW
ALTERNATIVES ?
(A)Local Mixing with SW
(B)Remote Mixing with SW
+
Long Shelf Advection
(C)Both
FUTURE DIRECTIONS: CPW Origins ?
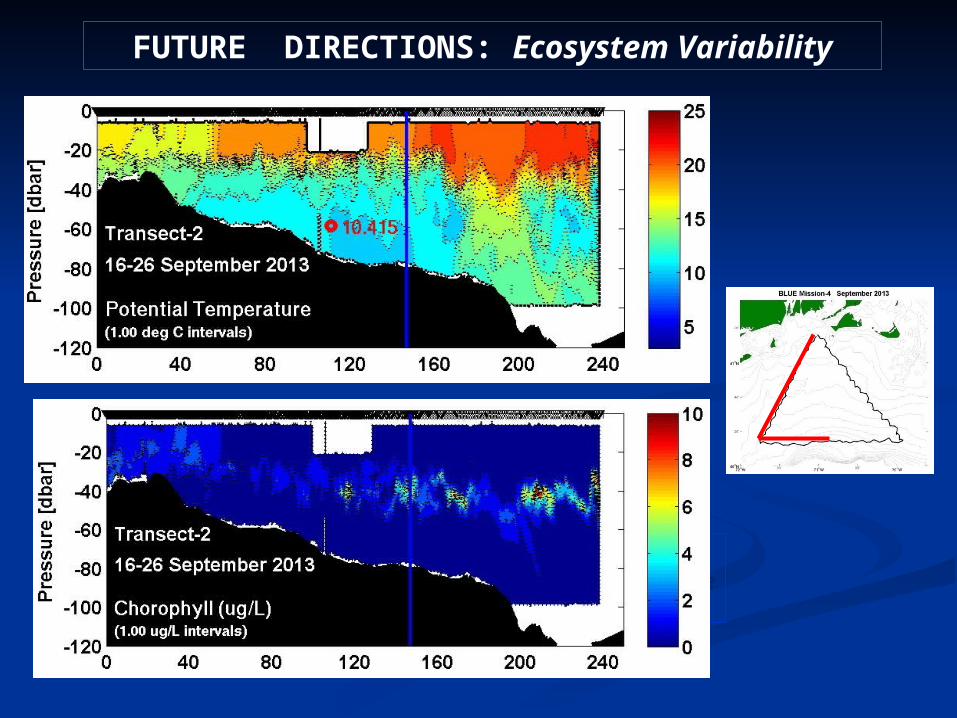
FUTURE DIRECTIONS: Ecosystem Variability
ESPRESSOBottom Temperature
27 May 2013

Summary
Ocean Glider Fleet Measurements …. a cost-effective technology for REAL-TIME Cold Pool observation
Real-time (“timely”) Maps of the Cold Pool .… require glider data –assimilation ocean modeling
Forecasting MAB Cold Pool Disposition …. within reach

Mapping the 2007 Coastal Ocean ….with a ONE-GLIDER “Fleet “
2007 Survey
LEG Tmin (oC)
STmin
(psu) Time (UTC)
Date No.
Terms
TD (oC)
Mean SD
SD (psu)
Mean SD MAY Leg-1 4.780 32.739 1207 May 27 15333 3.28 2.26 0.08 0.26
Leg-6 5.319 33.006 1130 Jun 11 12619 4.77 4.35 -0.07 0.35 Leg-1-6 57551 4.53 3.72 -0.01 0.35
JUL Leg-6 5.603 32.961 0008 Jul 24 24715 7.99 6.62 -0.21 0.71 Leg-9 6.806 33.033 0248 Aug 4 21814 12.62 6.75 0.58 0.71 Leg-6-10 95742 11.83 7.22 0.01 0.82
SEP Leg-1 7.711 33.006 10 47 Sep 30 15703 6.04 3.67 -0.34 0.40 Leg-6 8.478 32.967 0456 Oct 13 16223 6.22 4.64 -0.33 0.53 Leg-1-6 65870 6.20 4.57 -0.18 0.46
OCT Leg-6 8.588 33.057 1801 Oct 10 16083 7.84 5.16 -0.22 0.54 Leg-7 8.554 33.201 0525 Oct 14 28071 8.01 4.89 0.03 0.50 Leg-6-9 56595 8.66 4.79 0.06 0.53
TD = T – Tmin SD = S – Smin
T and S Departure Statistics

How do ocean gliders work?How do ocean gliders work?Move laterally thru “change in buoyancy” “Saw-tooth” motion => 1 km per hour - Glide downward - Detect bottom ……….glide upward - Detect surface ……… glide downward
• Surface every 3 hours - GPS located - 2-way “conversations” with command center “via satellite”
- Real-time data transmissions
• Measure Ocean Properties T, C(S), O2, backscatter, fluorescence + …
- 20-25 day alkaline battery lifetime => 600 km.
1 km | | 100 m

Cold Water INFLOW
to the
Mid Atlantic Bight
early summer
Ramp et al. (1989)Gangopadhyay & Schmidt – model
Mapping the 2007 Coastal Ocean ….with a ONE-GLIDER “Fleet “
Mar -Apr 2007
PRE-COLD POOL Late Winter
Mapping the 2007 Coastal Ocean ….with a ONE-GLIDER “Fleet “
Apr-May 2007
PROTO-COLD POOL Early Spring - warming
Mapping the 2007 Coastal Ocean ….with a ONE-GLIDER “Fleet “
May-Jun 2007
COLD POOL Established Late Spring – cooling !

Mapping the 2007 Coastal Ocean ….with a ONE-GLIDER “Fleet “
Sep – Oct 2007
COLD POOL 2007Autumn - erosion

Mapping the 2007 Coastal Ocean ….with a ONE-GLIDER “Fleet “
Nov – Dec 2007
COLD POOL GONE! Winter
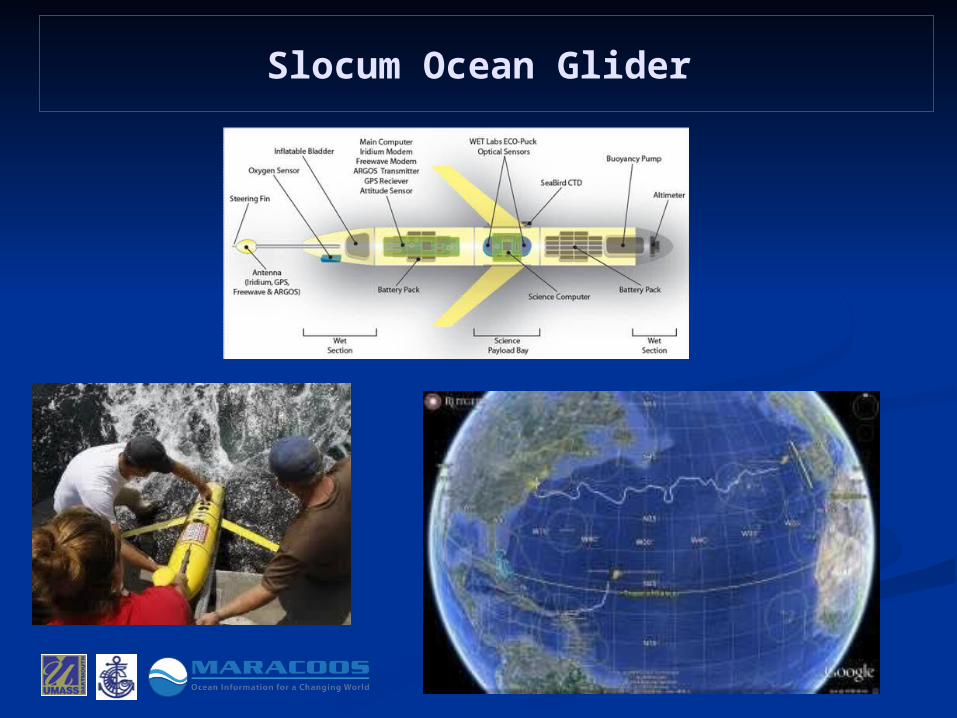
Slocum Ocean Glider
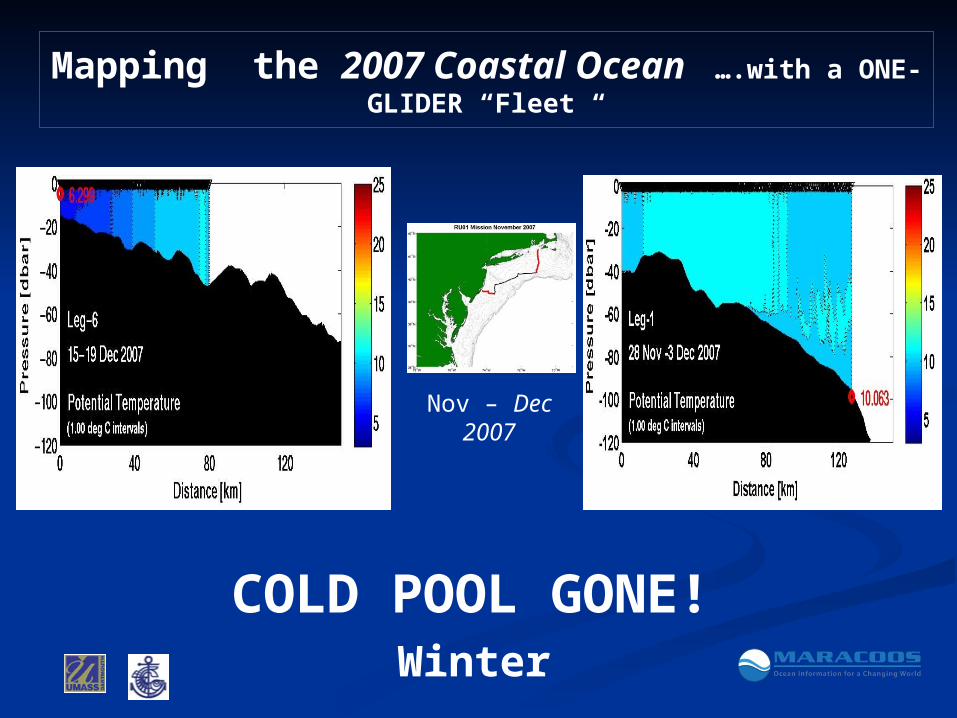
Mapping the 2007 Coastal Ocean ….with a ONE-GLIDER “Fleet “
Nov – Dec 2007
COLD POOL GONE! Winter

Mapping the 2007 Coastal Ocean ….with a ONE-GLIDER “Fleet “
Mar -Apr 2007
PRE-COLD POOL Late Winter

Mapping the 2007 Coastal Ocean ….with a ONE-GLIDER “Fleet “
Apr-May 2007
PROTO-COLD POOL Early Spring - warming

Mapping the Autumn COLD POOL 2013….with gliders RU-22 RU-23 BLUE
BLUE
RU-23
RU-22

Mapping the 2007 Coastal Ocean ….with a ONE-GLIDER “Fleet “
Tmin - Smin Diagram

Mapping the Autumn 2013 COLD POOL ….with a glider pair
2nd week September 3rd week
BLUEBLUE
RU-23
RU-23
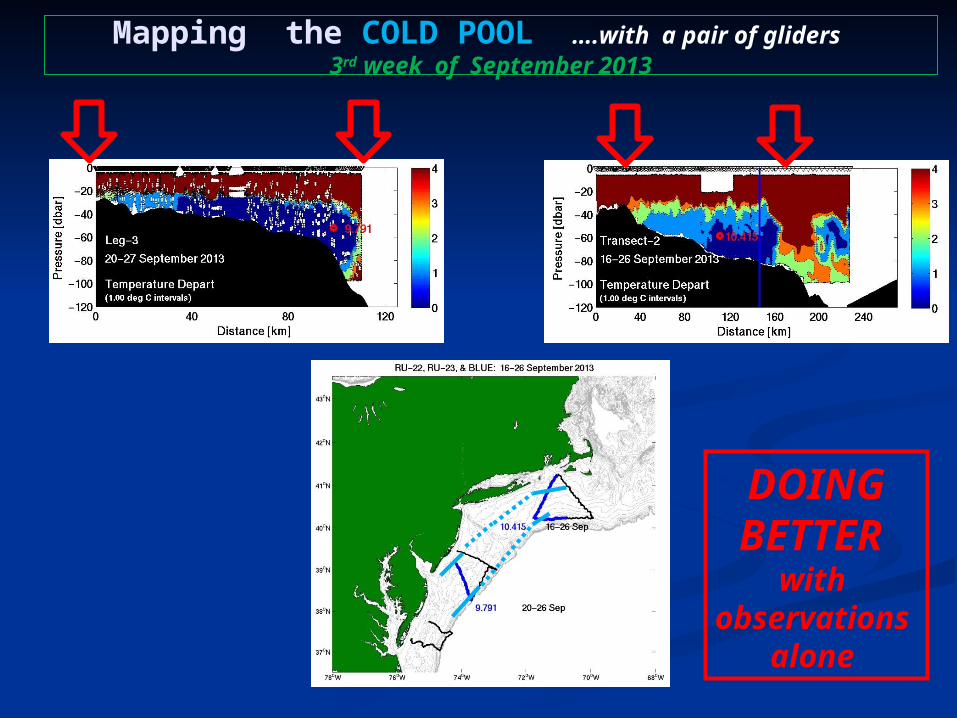
DOINGBETTER
with observations
alone
Mapping the COLD POOL ….with a pair of gliders 3rd week of September 2013