IMPACT OF OCEAN OBSERVATIONS ON HURRICANE IRENE INTENSITY FORECASTS
IMPACT OF
OCEAN OBSERVATIONS
ON HURRICANE IRENE
INTENSITY FORECASTS
S. Glenn, O. Schofield,
J. Kohut, H. Roarty, J. Kerfoot,
M. Oliver, H. Seim, G. Seroka,
L. Palamara, L. Bowers,
R. Dunk, M. Crowley,
W. Boicourt, W. Brown,
L. Atkinson
U..
Cape Cod
Cape Hatteras
NJ
MA CT
VA
DE
NY
NC
RI
MD
PA 10 States
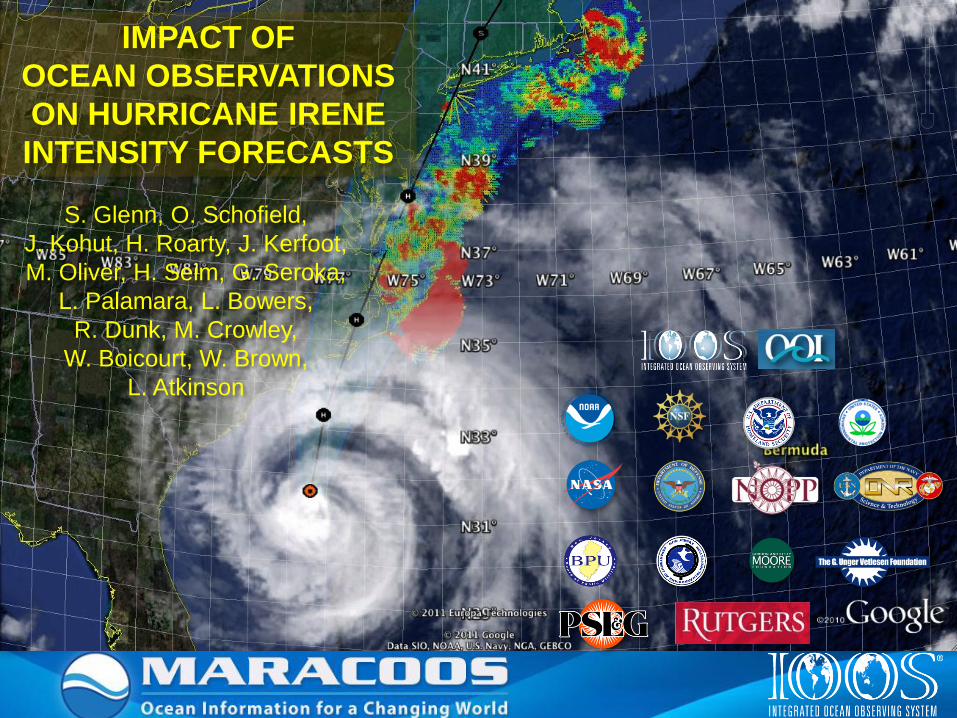
MIDDLE
ATLANTIC
REGIONAL
ASSOCIATION
COASTAL
OCEAN
OBSERVING
SYSTEM
1000 km Cape to Cape
Gliders Forecasts L-Band X-Band CODAR
Regional Association –
2004
Regional Coastal Ocean
Observing System – 2007
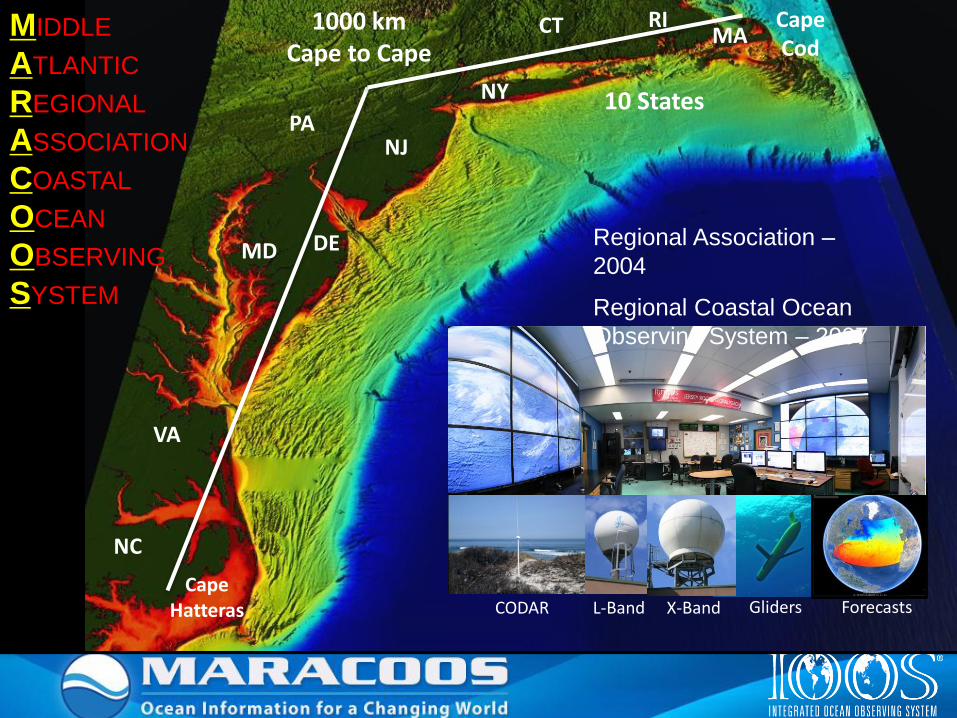
Satellite SST Products • Real-Time Global (RTG)
– 1/12 degree (~9.25 km)
– Most recent 24 hrs of in situ (buoys, ships) and satellite (AVHRR and METOP) data
Gemmill et al. (2007)
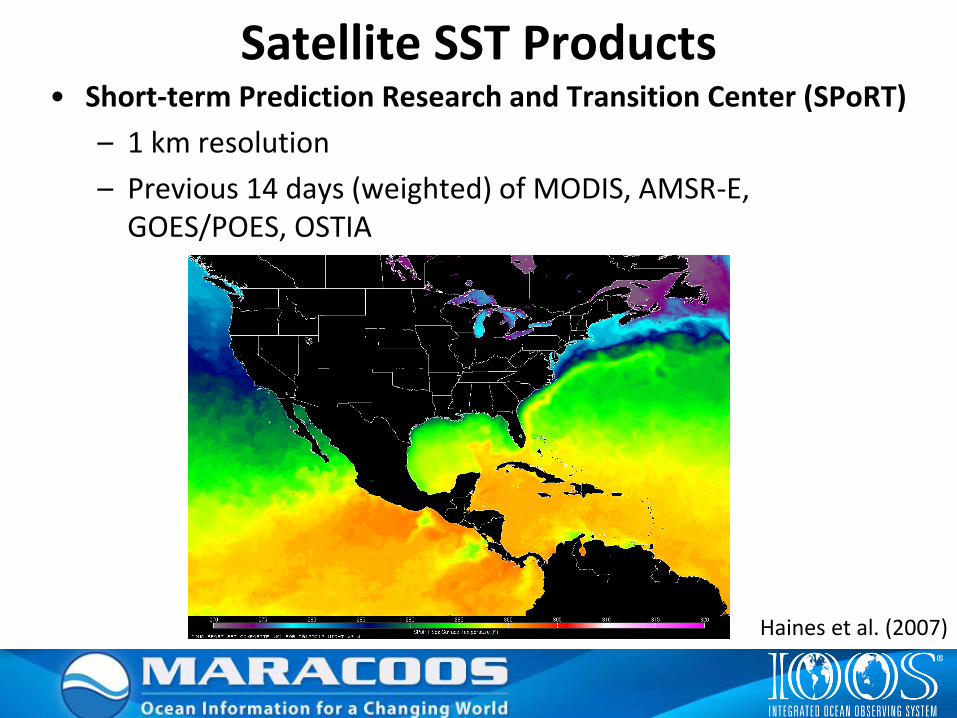
Satellite SST Products • Short-term Prediction Research and Transition Center (SPoRT)
– 1 km resolution
– Previous 14 days (weighted) of MODIS, AMSR-E, GOES/POES, OSTIA
Haines et al. (2007)
AVHRR+SPoRT Composite
• AVHRR declouding algorithm specific to Mid-Atlantic Bight, summer (for now)
– <10°C removed (cloud)
– near IR albedo >2.3% removed (clouds)
– Other tests on changes (within ~3km X 3km grid boxes) of SST (1°C) and near IR albedo (0.15%)
• 3-day AVHRR coldest pixel composite
• Then, coldest pixel composite with SPoRT
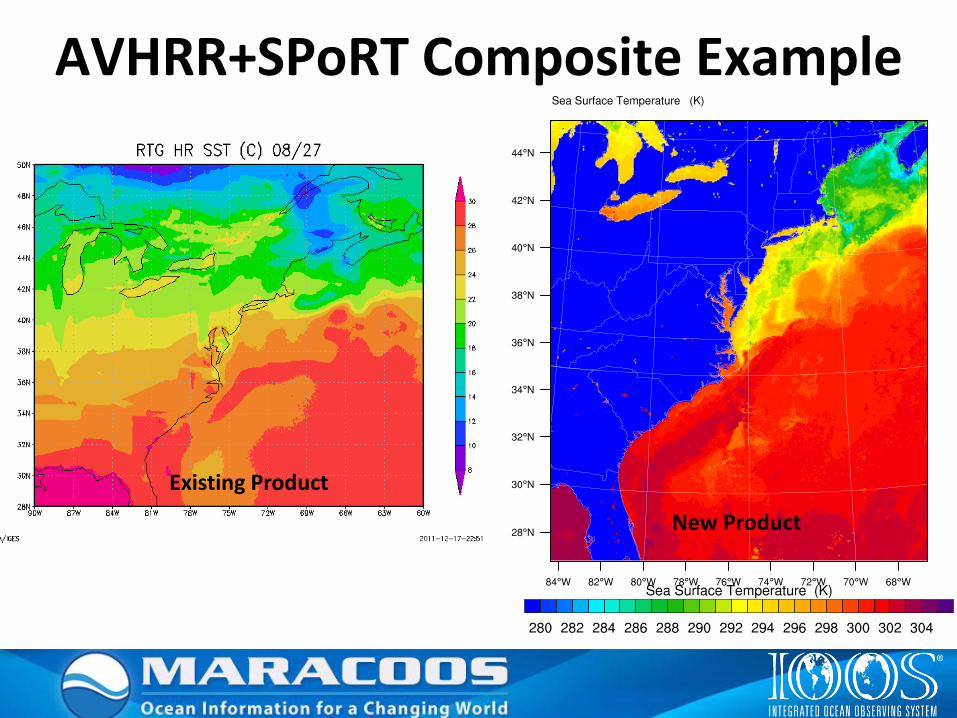
AVHRR+SPoRT Composite Example
Existing Product
New Product
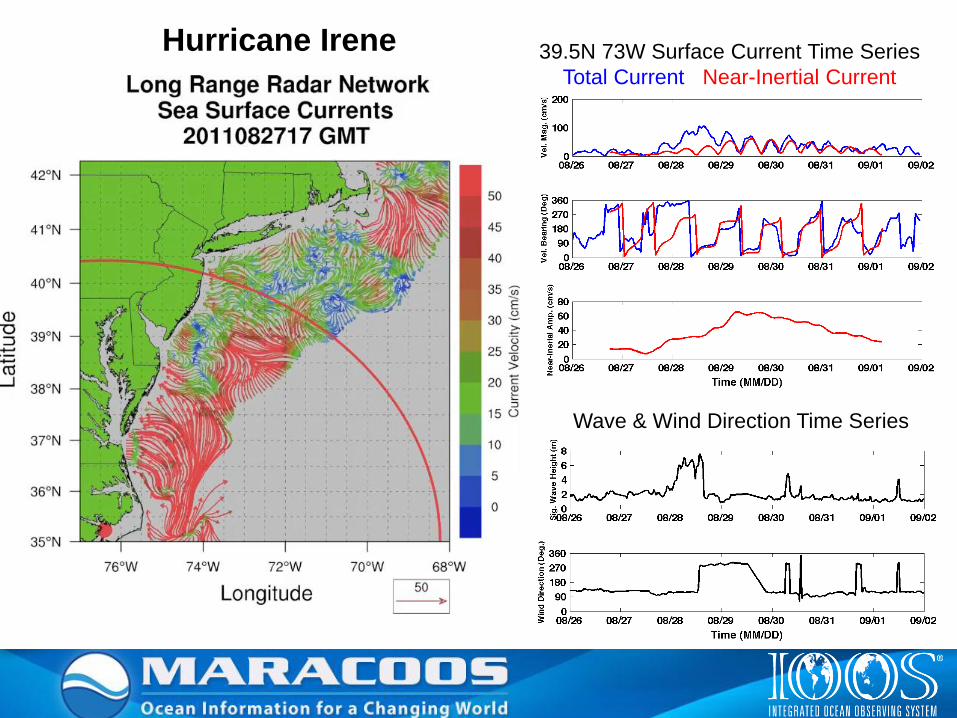
39.5N 73W Surface Current Time Series
Total Current Near-Inertial Current
Wave & Wind Direction Time Series
Hurricane Irene
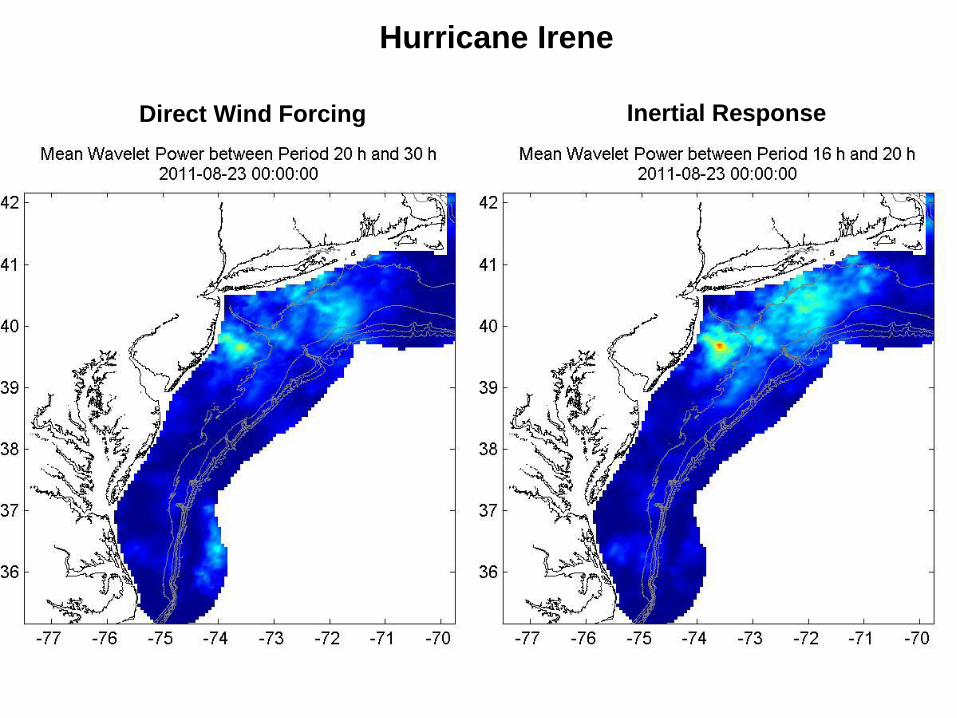
Hurricane Irene
Direct Wind Forcing Inertial Response
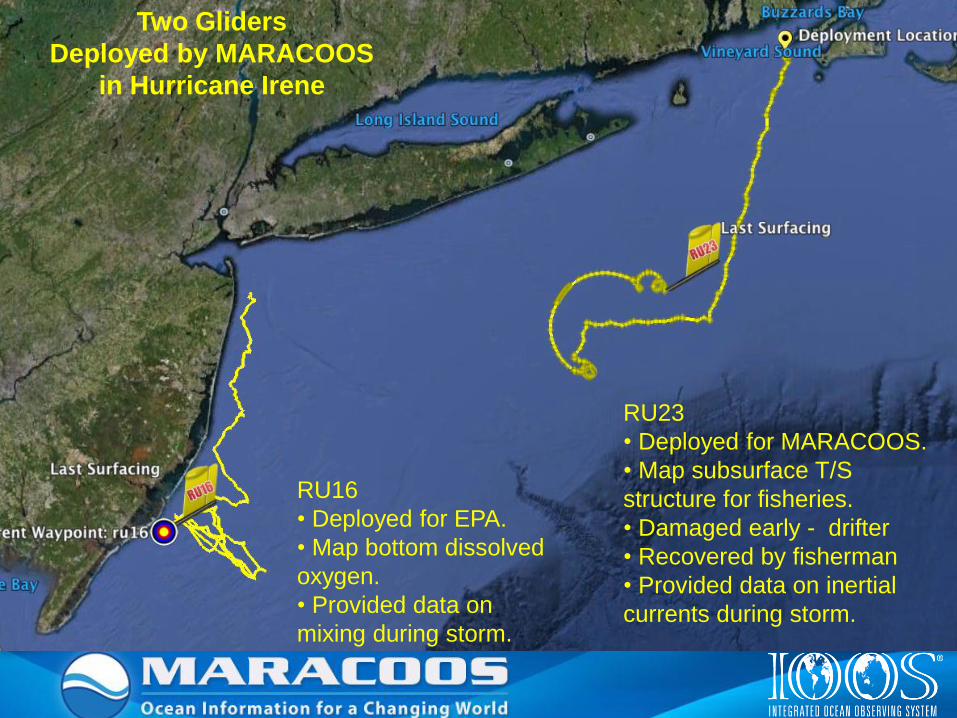
Two Gliders
Deployed by MARACOOS
in Hurricane Irene
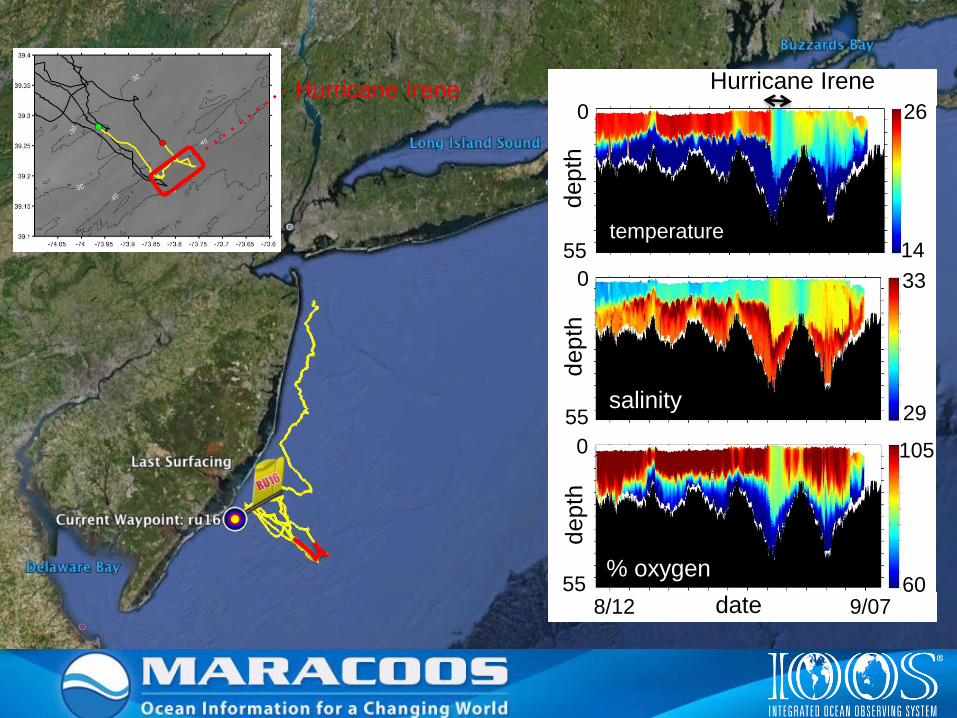
RU16
• Deployed for EPA.
• Map bottom dissolved
oxygen.
• Provided data on
mixing during storm.
RU23
• Deployed for MARACOOS.
• Map subsurface T/S
structure for fisheries.
• Damaged early - drifter
• Recovered by fisherman
• Provided data on inertial
currents during storm.
14
33
29
105
60
salinity
% oxygen
temperature 55
55
0
0
55 depth
depth
depth
8/12 9/07 date
26 0
Hurricane Irene Hurricane Irene
Temp. Vert. Vel. Temp. Vert. Vel. Temp. Vert. Vel.
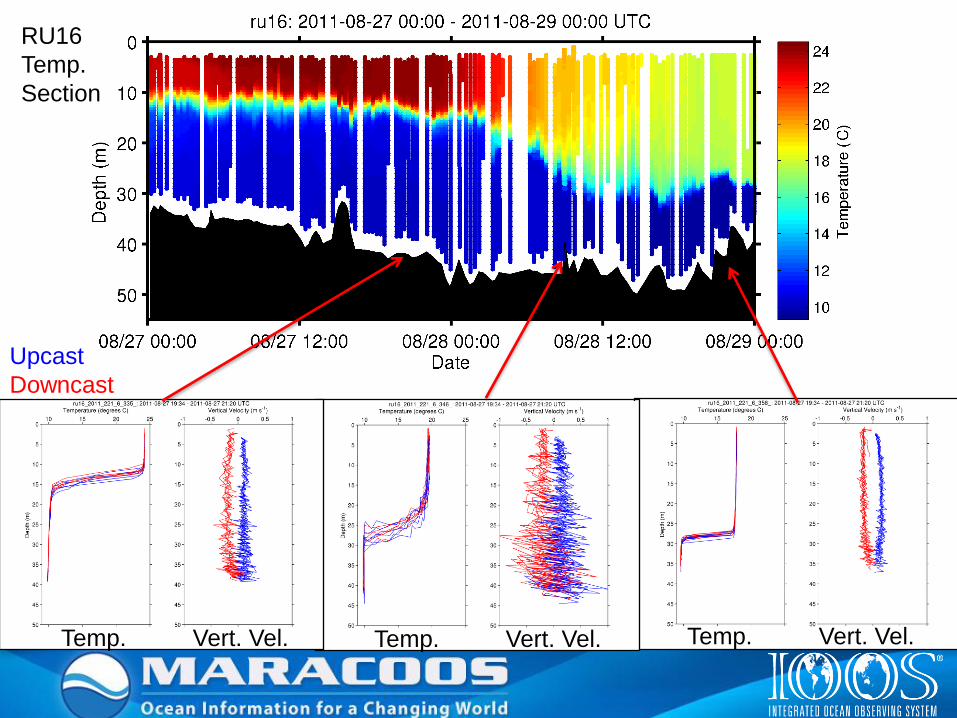
RU16
Temp.
Section
Upcast
Downcast
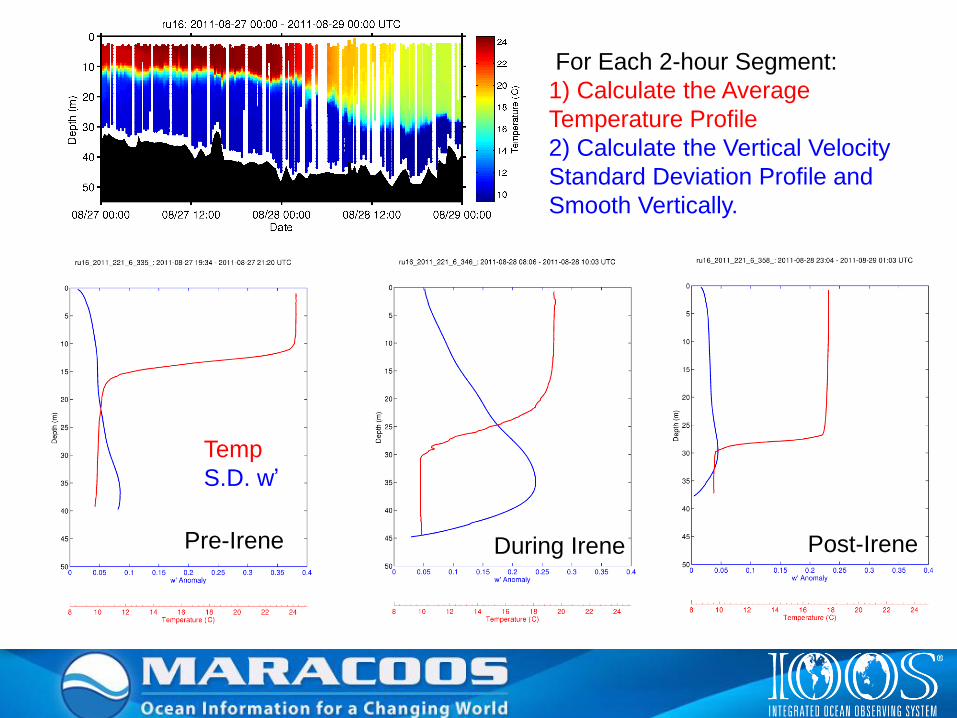
For Each 2-hour Segment:
1) Calculate the Average
Temperature Profile
2) Calculate the Vertical Velocity
Standard Deviation Profile and
Smooth Vertically.
Pre-Irene During Irene Post-Irene
Temp
S.D. w’
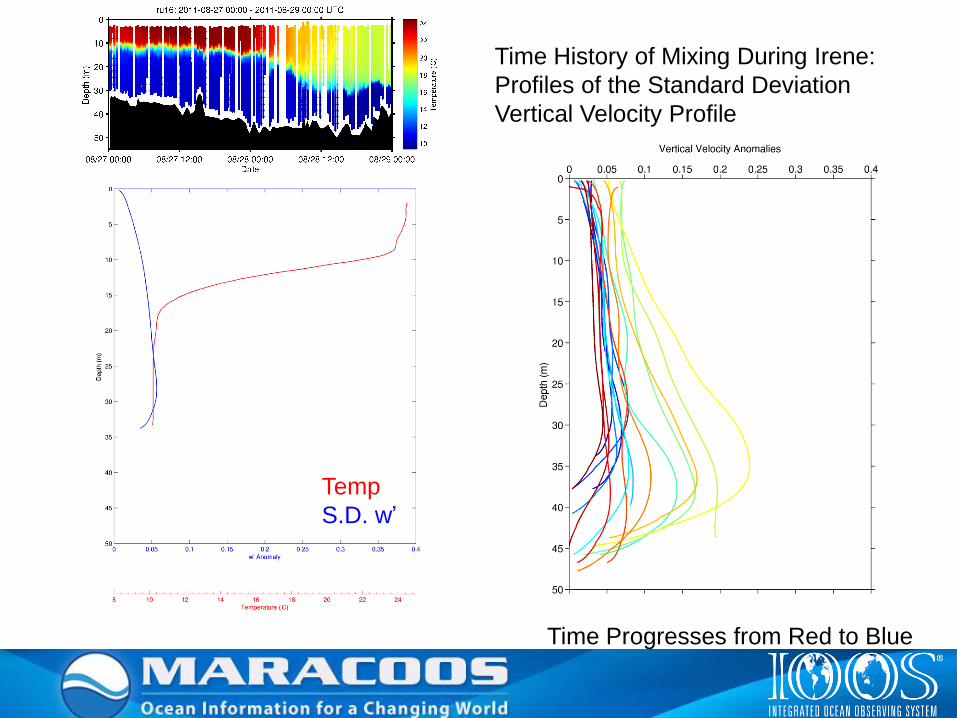
Time History of Mixing During Irene:
Profiles of the Standard Deviation
Vertical Velocity Profile
Time Progresses from Red to Blue
Temp
S.D. w’

Time History of Mixing During Irene:
Profiles of the Standard Deviation
Vertical Velocity Profile
Time Progresses from Red to Blue
Eddy viscosity
Linear
Linear * Exponential Decay
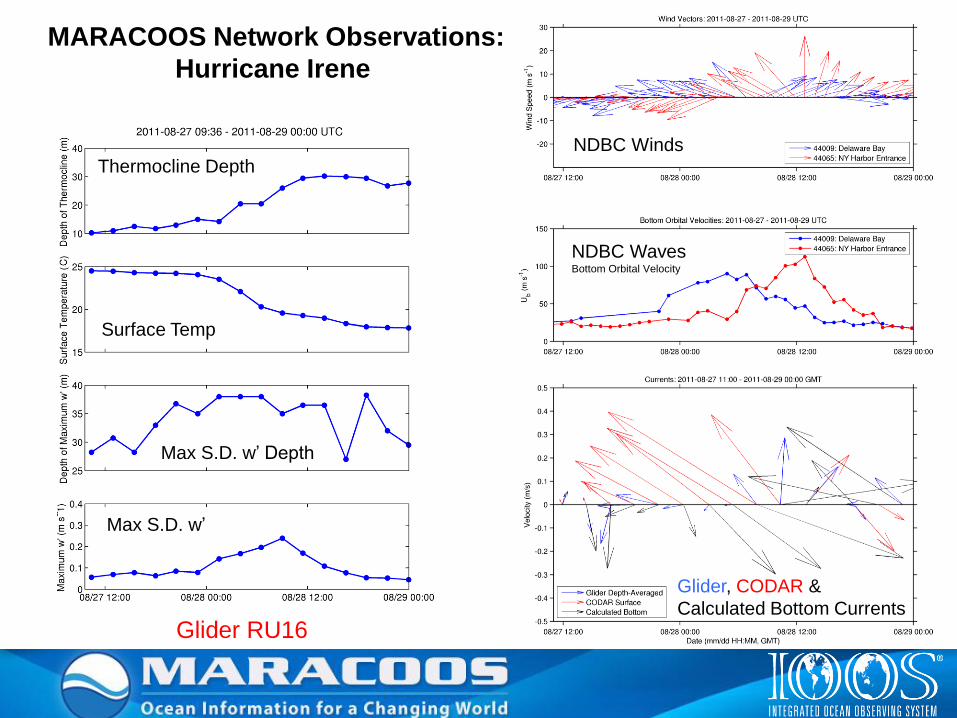
Glider RU16
Thermocline Depth
Surface Temp
Max S.D. w’
Max S.D. w’ Depth
Glider, CODAR &
Calculated Bottom Currents
NDBC Waves Bottom Orbital Velocity
NDBC Winds
MARACOOS Network Observations:
Hurricane Irene
3540455055606570758085
Win
d S
peed
(kts
)
Date
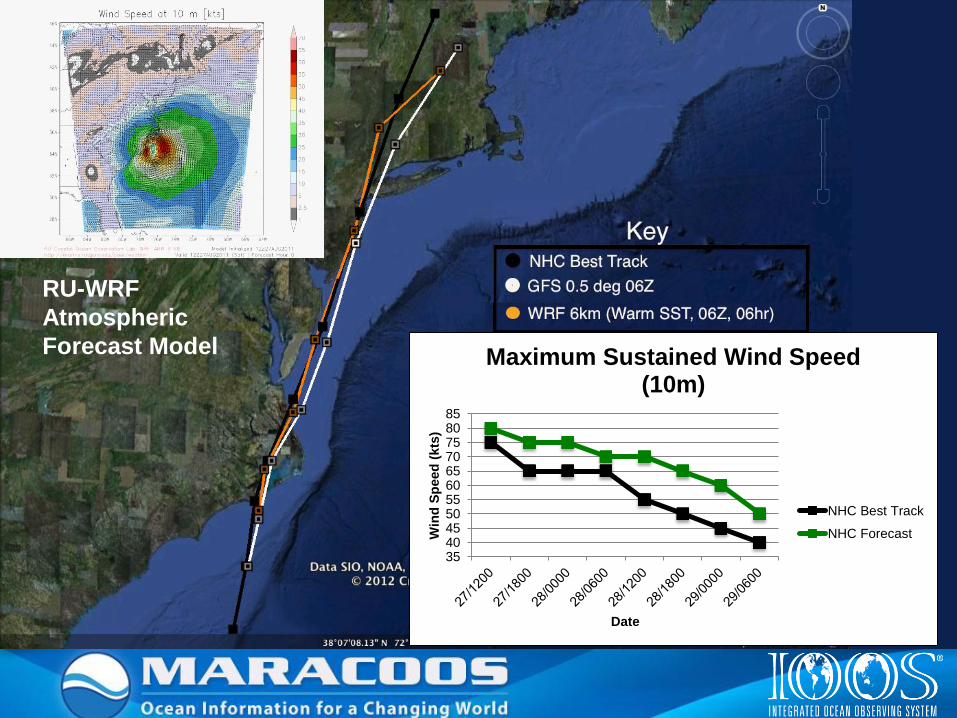
Maximum Sustained Wind Speed (10m)
NHC Best Track
NHC Forecast
RU-WRF
Atmospheric
Forecast Model
NHC Best Track
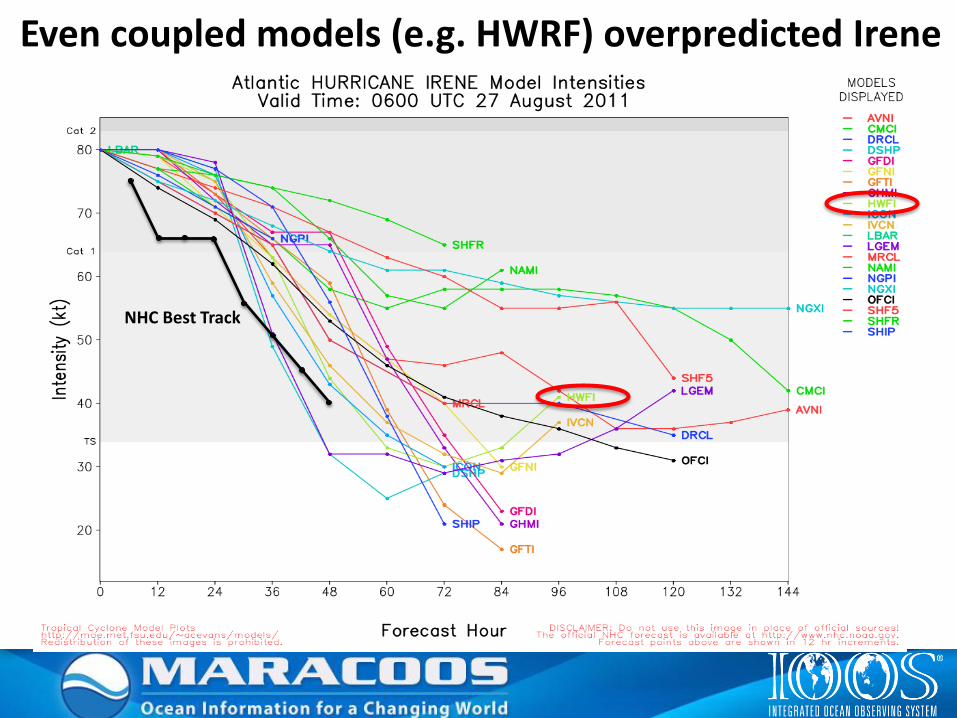
Even coupled models (e.g. HWRF) overpredicted Irene

27/120028/0600 28/060029/0600
WRF Model Run: SST Update
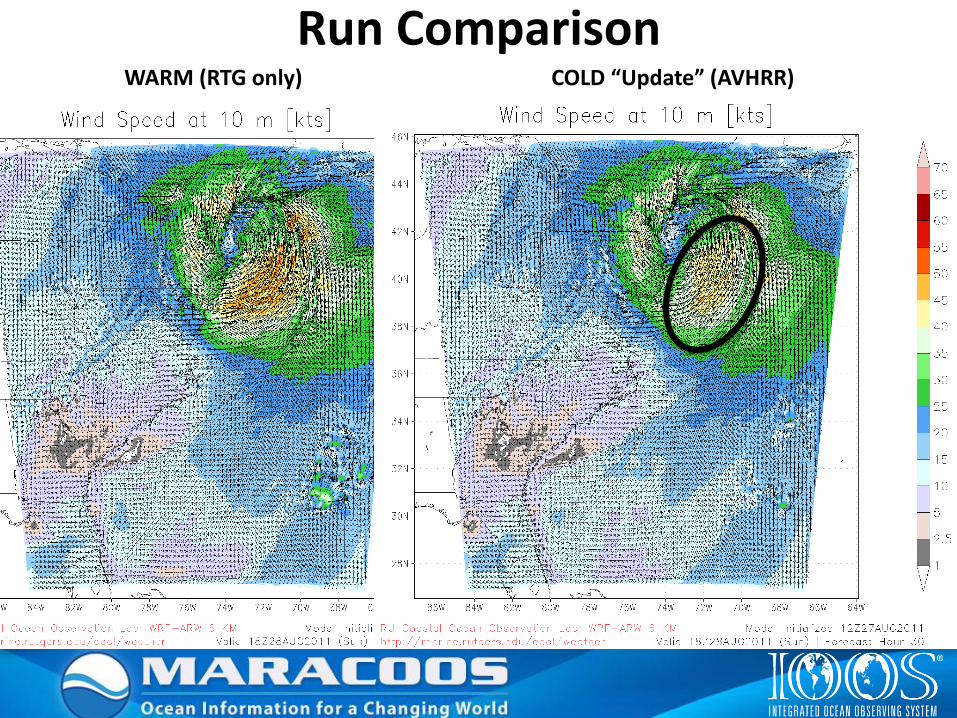
WARM (RTG only) COLD “Update” (AVHRR)
Run Comparison
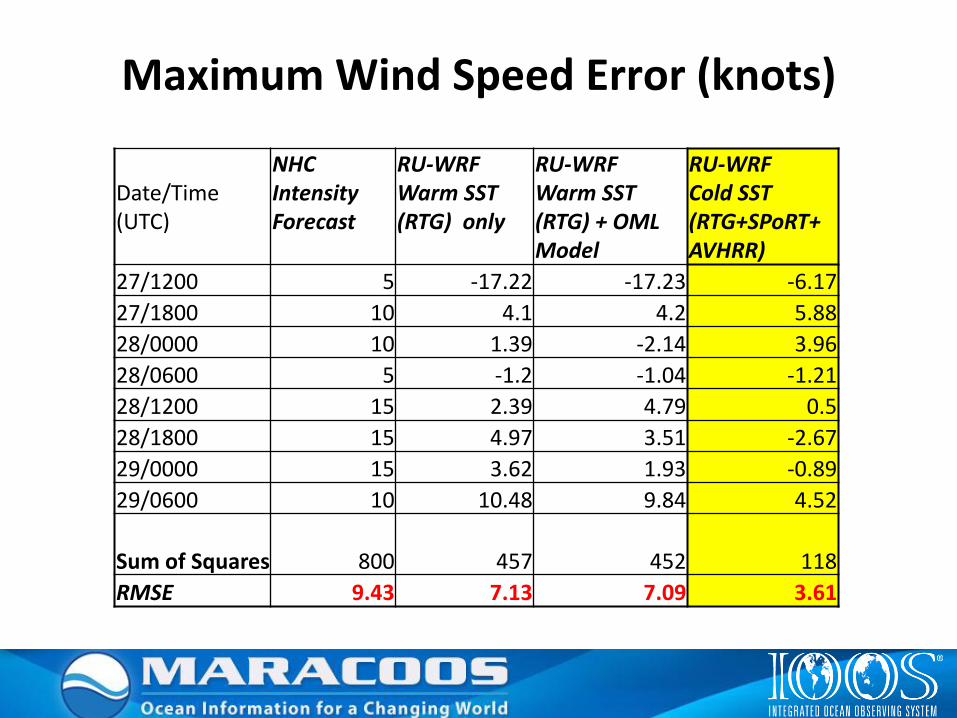
Maximum Wind Speed Error (knots)
Date/Time (UTC)
NHC Intensity Forecast
RU-WRF Warm SST (RTG) only
RU-WRF Warm SST (RTG) + OML Model
RU-WRF Cold SST (RTG+SPoRT+ AVHRR)
27/1200 5 -17.22 -17.23 -6.17
27/1800 10 4.1 4.2 5.88
28/0000 10 1.39 -2.14 3.96
28/0600 5 -1.2 -1.04 -1.21
28/1200 15 2.39 4.79 0.5
28/1800 15 4.97 3.51 -2.67
29/0000 15 3.62 1.93 -0.89
29/0600 10 10.48 9.84 4.52
Sum of Squares 800 457 452 118
RMSE 9.43 7.13 7.09 3.61
Wind Speed Error
Date/Time (UTC)
NHC Forecast
Warm (RTG only)
Warm (RTG only, OML Model)
Cold “Update” (AVHRR)
27/1200 5 -17.22 -17.23 -6.17
27/1800 10 4.1 4.2 5.88
28/0000 10 1.39 -2.14 3.96
28/0600 5 -1.2 -1.04 -1.21
28/1200 15 2.39 4.79 0.5
28/1800 15 4.97 3.51 -2.67
29/0000 15 3.62 1.93 -0.89
29/0600 10 10.48 9.84 4.52
Sum of Squares 800 457 452 118
RMSE 9.43 7.13 7.09 3.61
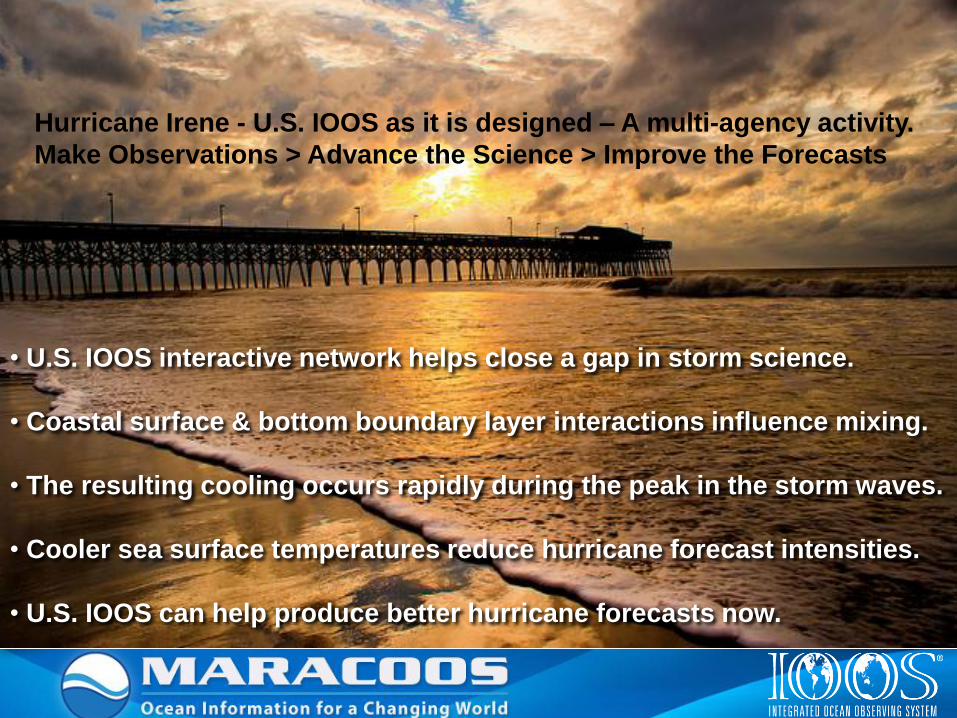
• U.S. IOOS interactive network helps close a gap in storm science.
• Coastal surface & bottom boundary layer interactions influence mixing.
• The resulting cooling occurs rapidly during the peak in the storm waves.
• Cooler sea surface temperatures reduce hurricane forecast intensities.
• U.S. IOOS can help produce better hurricane forecasts now.
Hurricane Irene - U.S. IOOS as it is designed – A multi-agency activity.
Make Observations > Advance the Science > Improve the Forecasts