The Evolution of Emergency Management Networks: A · PDF file · 2011-05-25The...
26
The Evolution of Emergency Management Networks: A Multi-Modal Assessment of Two Evacuation Hosting Networks from 2000-2009 Scott E. Robinson - Bush School, Texas A&M University Warren S. Eller - University of North Carolina - Pembroke Melanie Gall - Louisiana State University Brian J. Gerber - University of Colorado - Denver DRAFT: PLEASE DO NOT QUOTE WITHOUT THE AUTHOR’S PERMISSION May 19, 2011 1
Transcript of The Evolution of Emergency Management Networks: A · PDF file · 2011-05-25The...
The Evolution of Emergency ManagementNetworks: A Multi-Modal Assessment of TwoEvacuation Hosting Networks from 2000-2009
Scott E. Robinson - Bush School, Texas A&M UniversityWarren S. Eller - University of North Carolina - Pembroke
Melanie Gall - Louisiana State UniversityBrian J. Gerber - University of Colorado - Denver
DRAFT: PLEASE DO NOT QUOTEWITHOUT THE AUTHOR’S PERMISSION
May 19, 2011
1
Abstract
Emergency management is a field in which collaborative activi-ties are inescapable. Emergency planning and response increasinglyinvolves a diverse array of actors across fields (emergency manage-ment,public health, law enforcement, etc.), sector (government, non-profit,and for-profit), and level of government (local, state, and fed-eral). The necessity of collaboration is built into the logic of escalationin the Stafford Act and the nature of emergency events as boundaryspanning threats. While the necessity of collaboration is clear, thedynamics of this collaboration are less well understood.
This paper assesses the temporal dynamics of emergency man-agement networks in two moderately sized communities that haveserved as evacuation hosting sites in the past decade. The paperuses two strategies for tracking the evolution of these networks acrosstime. First, we develop an annual network map using newspaper andnewswire data sources. Second, we develop a view of the evolution byanalyzing emergency operations plans for each community.
Analysis of data from these two strategies reveals biases built intoeach method. The media data include a wide variety of actors, manyof whom do not persist through the time period. The formal plan datainclude only a small number of actors who largely persist throughoutthe time period. What is not clear is which of these images of thenetworks is more accurate. The paper concludes with a discussion ofthe difficulty of mixed methods network research.
2
1 Introduction
Public administration and political science are currently focusing quite abit of attention on issues related to political and administrative networks.1
The Public Administration Review devoted an entire special issue to thesubject in 2005 and the American Political Science Association created aspecialized organized section on the subject of political networks. Whileattention to collaborative public management and policy networks is highright now, this is by no means a new subject. The classic argument of thedominance of iron triangles or policy whirlpools is a network argument -albeit of a small network (Redford 1969). The counterargument that policytends to involve broad and fluid participation in issue networks is also ratherobviously a network construct (Heclo 1978). More recent integrations of theliterature positing changing levels of participation over time and across policyareas suggest that these networks can evolve over time as characteristics ofindividual policy domains change (McCool 1998, Sabatier & Jenkins-Smith1993).
While attention to issues of administrative and policy networks has been acomponent of the policy literature for decades, the dynamics of the networksacross time has proven to be a difficult subject to study. Due to extraordi-nary demands on data and the necessity of novel inferential techniques fordata involving networks, very little work has engaged issues related to net-work change. This paper represents an initial (and tentative) step towardassessing the evolution of emergency management networks across time - inthis case over a decade involving two major events. The next section (Section2)will discuss some of the existing literature on issues related to the incor-poration of new actors into a policy network and the evolution of networkcharacteristics over time. The result will be a series of propositions about thenature of emergency management network change. Section 3 will introducetwo approaches to measuring membership and relationships within policynetworks. Sections 4 and 5 report on the roster of emergency managementnetworks in two communities for each of the two measurements strategiesdiscussed in 3. Finally, Sections 6 and 7 discuss the implications of these re-
1This material is based upon work supported by the National Science Foundation underGrant No. CMMI-0927576. Any opinions, findings, and conclusions or recommendationsexpressed in this material are those of the author and do not necessarily reflect the viewsof the National Science Foundation. We would also like to thank Joseph Reed for hisassistance with this project.
3
sults for the study of emergency management networks and the measurementof administrative networks generally. Section 8 concludes.
2 The Evolution of Emergency Management
Networks
A central question of research into policy and administrative networks is thescope and fluidity of participation. The key characteristic of policy subsystemapproaches to networks was the emphasis on closed and limited participationby predictable actors (e.g. congressional subcommittees, interest groups, andagencies). The principal critique of the argument was that participation inactual policy domains tends to be much more broad and fluid. It was arguedthat a large variety of actors may participate within any policy networkincluding those envisioned by subsystem theories as well as representativesof other levels of government and even public interest groups. Furthermore,the participation level of various actors is thought to change over time withsome actors dropping out of active participation while new actors emerge atdifferent time. An issue network represents an extreme version of this openand fluid network (Heclo 1978). A key question, then, is the scope and fluidityof participation in actual policy networks. The next subsection will discussthe issue of participation in emergency management networks specifically.Following that discussion, I will discuss some specific propositions from theliterature regarding the evolution of emergency management networks.
2.1 Networks and Emergency Management
Over the past two decades, the importance of collaborative networks has be-come clear to scholars specializing in emergency management. Emergencymanagement represents a classic wicked problem (O’Toole Jr 1997). Emer-gencies tend to cross jurisdictional boundaries due to the geographic scopeand the broad range of consequences they present. For example, HurricaneKatrina devastated communities across multiple states and mobilizing reac-tions from a variety of government agencies (emergency management, lawenforcement, transportation, public health, housing and welfare, etc.) andnongovernmental agencies (the American Red Cross, Walmart, local religiousinstitutions, etc.) (Simo & Bies 2007).
4
Among the most prominent voices for research into collaboration and net-working activities in emergency management has been Louise Comfort. Com-fort has argued that emergency management networks are best understoodas self-organizing systems (Comfort 1994). The emphasis in her account isfluidity of participation and the inability to predict mobilizations ex ante.Rather than following documented plans or stable expectations, mobiliza-tion tend to involve an unpredictable set of actors that vary greatly in termsof prior disaster experience, organizational sector, and other characteristics.
Concluding that mobilization is unpredictable is unsatisfying in a numberof ways. First, it suggests that efforts to plan mobilizations are doomed tofailure. If one can not predict who will be involved - at least in terms of somecore players - then one can not know whom to involve in emergency planning.Second, to the extent that exercises and other simulations are key preparatory(and possibly even evaluative) elements of emergency management, if onecan not predict who will mobilize following an emergency event then onewill not know who to include in an exercise. The limited composition ofexercises preceding Hurricane Katrina has been identified as a key cause ofthe eventual problems in evacuating residents of New Orleans with limitedaccess to transportation (Kiefer & Montjoy 2006).
However, the difficulty in predicting which organizations will mobilize inan emergency may have been overstated. In a study of the mobilizationof evacuation hosting activities in the Dallas/Fort Worth, TX area follow-ing Hurricane Katrina, Robinson, Berrett & Stone (2006) found that themobilization of many organizations was predictable given a series of priorrelationships. Relationships that sometimes had little to do with emergencymanagement and evacuation hosting activities served as a basis for the emer-gence of a series of response networks. While there was also evidence ofspontaneous mobilization of organization with no prior membership in emer-gency management networks, a good part of the network - particularly thenetwork leadership - involved prior relationships that could easily escape theattention of emergency management scholars. The case studies collected inthis article provide some hope that relationships can be managed and thatmobilizations can be predicted (within some bounds).
The complexity of the mobilization and management process of emer-gency management networks has raised important questions about the man-agement and leadership of these networks. Waugh & Streib (2006) arguedthat coordination is difficult within emergency management networks despiterecent attempts to provide structure to the networks through such devices
5
as the National Incident Management System (NIMS) and the IntegratedCommand System (ICS). The difficulties in leadership are accentuated giventhe diversity of these networks. Actors from diverse sectors and policy areasbring with them a variety of assumptions about the nature of emergenciesand appropriate forms of coordination and communication(Comfort 2007).
2.2 Propositions for Network Evolution
Given the importance of network collaboration to issues of emergency man-agement, research into the development and evolution of these networks isessential to the improvement of management of emergency preparedness andresponse networks. This paper will focus on expectations surrounding the keycharacteristics that distinguish subsystem models from issue network modelsof policy networks: scope of participation and fluidity of participation.
In terms of scope of participation, there is no bright line distinguishinghigh from low levels of participation. We will instead focus on volatility innetwork rosters with modest attention to network size. As another contrast,while most of the research has been at the federal level of policy makingcomplicating predictions at local levels, we will instead focus on volatility ofnetworks within this sample of small, local jurisdictions.
Proposition 1 Emergency management networks will experience volatilityin membership.
Volatility can take on a number of meanings. One can experience volatil-ity in network roster. However, involving different organizations may not beas important as increasing representation from diverse types of organizations.While we could focus on a number of types, we will focus on representationof policy sectors (e.g. emergency management, law enforcement, education,public health, etc.) and private sector organizations. This focus results intwo specified propositions.
Proposition 2 Emergency management networks will experience volatilityin network membership.
Proposition 3 Emergency management networks will experience volatilityin network diversity (in terms of policy sector representation).
6
3 Data
Testing these propositions requires data with a particular set of characteris-tics. The dataset must record participation within emergency managementnetworks. Furthermore, the observations must be ordered so that a timepath is clear. Ideally, the time path should record participation over a num-ber of years, preferably at least a decade (Sabatier 1993). Hypothetically,one could conduct interviews or surveys annually over a decade but suchefforts are incredibly expensive and are predictably rare. The twin needsof comparable measurement and available data across time are best (or atleast, easiest) served by documentary analysis. This paper will focus on twotypes of documentary sources: media reports of evacuation related activityand formal emergency operations plans related to evacuation.
To collect these data, we located six comparable communities. We wereinterested in evacuation hosting activities so we identified communities thathad recent (within the last decade) experiences with evacuation hosting ac-tivities. We also chose communities that were relatively similar in termsof population size. For this reason we chose moderately sized communitiesrather than the largest cities where the variances in size are large in absoluteterms. The six communities have populations between 200,000 and 1 millionresidents (when not hosting evacuees) and include four communities fromGulf Coast states and two from non-Gulf Coast states. This paper will focuson two Gulf Coast communities: Brazos County, Texas and Caddo/BossierParishes, Louisiana.
3.1 Media Reported Networks
For our first data source, we have selected to use newspaper searches to gen-erate a database of media documents. Our goal was to create a single systemfor collecting journalistic coverage of emergency management networks thatcould be used for a variety of communities across time. For purposes ofthis study, we are focusing attention on evacuation related activities (withinthe entire realm of emergency management). We elected to search withinthe Westlaw database using the substantive search term “evac!”. This willcapture all words that begin with the letters “evac” including evacuation,evacuate, evacuee, and the like. The Westlaw database allowed us to searchall newspapers and news wires - to ensure we captured local as well as nationalmedia sources. We added geographic limiters to the substantive search term
7
including the major cities and the county in which the community resides.For example, we looked for articles that included a term starting with “evac”and also included either “College Station”, “Bryan”, or “Brazos County.”Given the varying roles that county and city official play in emergency man-agement, we felt it was essential to search based on city and county. Thispaper reports the results of document searches related to Brazos County, TX(which includes the cities of College Station and Bryan – about 1.5 hoursnorthwest of Houston) and Caddo and Bossier Parishes, LA (including thecity of Shreveport).The use of media reports to reconstruct networks was in-spired by Comfort’s (2006) study of response networks to Hurricanes Katrinaand Rita.
These searches of the Westlaw database resulted in hundreds of hits foreach year of our sample (2001-2009). For the purpose of this analysis, wewill aggregate the media reports into two periods: 2000-2005 (up to and in-cluding Hurricane Katrina) and 2006-2009 (post-Hurricane Katrina throughHurricanes Gustav and Ike). Each of these articles were then read individ-ually to ensure that the article was germane to issues of evacuation. Thiseliminated many articles. Some articles included references to entertainmentor sporting events in the target community (such as Texas A&M Universitysports teams) and coverage of something having to do with an evacuation ina different community. We only selected articles that involved an evacuationor evacuation hosting activity within the target community. We then readeach of the selected articles to identify all organizations mentioned.
3.2 Plan Based Networks
To complement the media reports, we have also collected formal emergencyoperations plans from each of these communities. The emergency operationsplan serves as a primary coordinating documents for a variety of actors inemergency management within each community. The document lays out thestructure of authority and responsibility as well as providing an assessmentof locally prominent hazards and specific annex documents for a variety ofdetailed functions.
We have coded each formal emergency operation plan to create a rosterof formally included members of the emergency management network withineach community. While the media reported network is a permissive samplethat includes a wide variety of actors, the formal plans tend to have muchsmaller rosters and focus on organizational with legally defined responsibili-
8
ties within emergency management. Where possible, we have collected his-torical plans as well as the currently operations emergency operations plan.Interestingly, few of the emergency management offices within our communi-ties kept historical plans. When a new plan was formally approved, the oldone was discarded without a copy being kept in the office. Where we havefound historical plans, it has been through the use of the web archive service“The Wayback Machine” at web.archive.org.
4 Brazos County, TX Results
Brazos County lies approximately 1.5 hours (by car) Northwest of the Hous-ton metroplex and has been involved in two major evacuation efforts: onein 2005 (including Hurricanes Katrina and Rita) and one in 2008 (includingHurricane Ike). Additionally, there was a notable local evacuation in 2009stemming from a release from a chemical plant. This local evacuation waslimited in duration but resulted in an evacuation order for most of the cityof Bryan.
4.1 Media Reported Networks
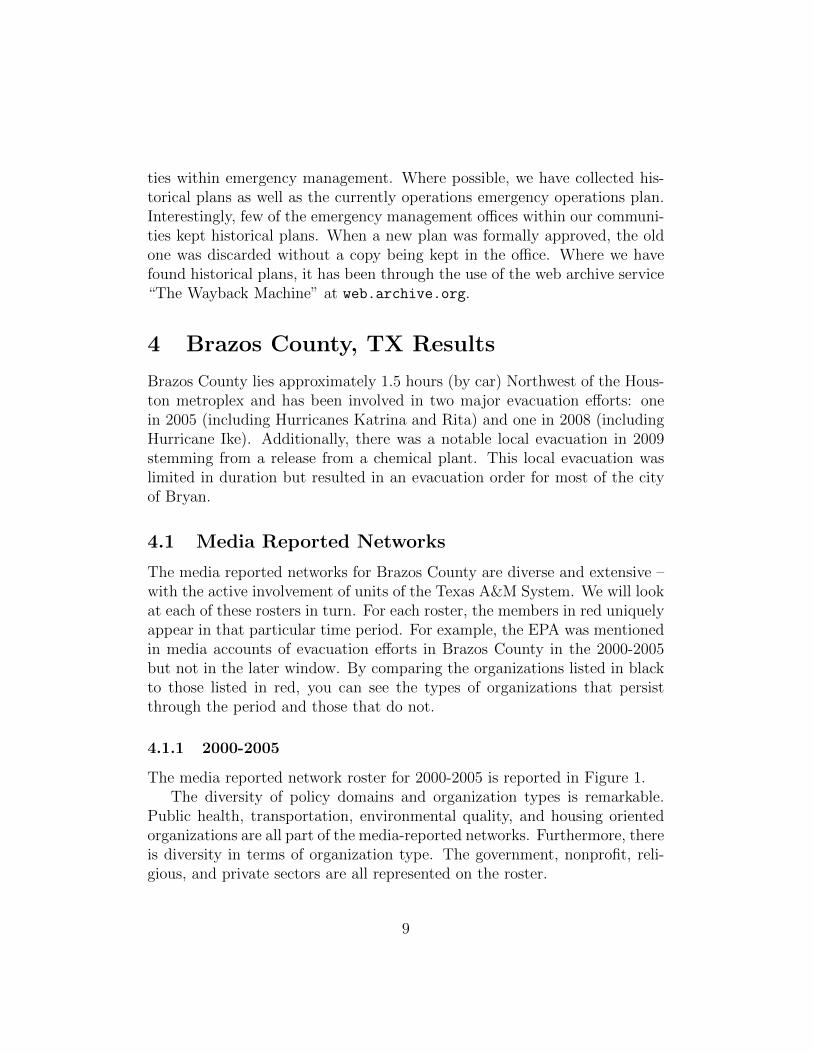
The media reported networks for Brazos County are diverse and extensive –with the active involvement of units of the Texas A&M System. We will lookat each of these rosters in turn. For each roster, the members in red uniquelyappear in that particular time period. For example, the EPA was mentionedin media accounts of evacuation efforts in Brazos County in the 2000-2005but not in the later window. By comparing the organizations listed in blackto those listed in red, you can see the types of organizations that persistthrough the period and those that do not.
4.1.1 2000-2005
The media reported network roster for 2000-2005 is reported in Figure 1.The diversity of policy domains and organization types is remarkable.
Public health, transportation, environmental quality, and housing orientedorganizations are all part of the media-reported networks. Furthermore, thereis diversity in terms of organization type. The government, nonprofit, reli-gious, and private sectors are all represented on the roster.
9
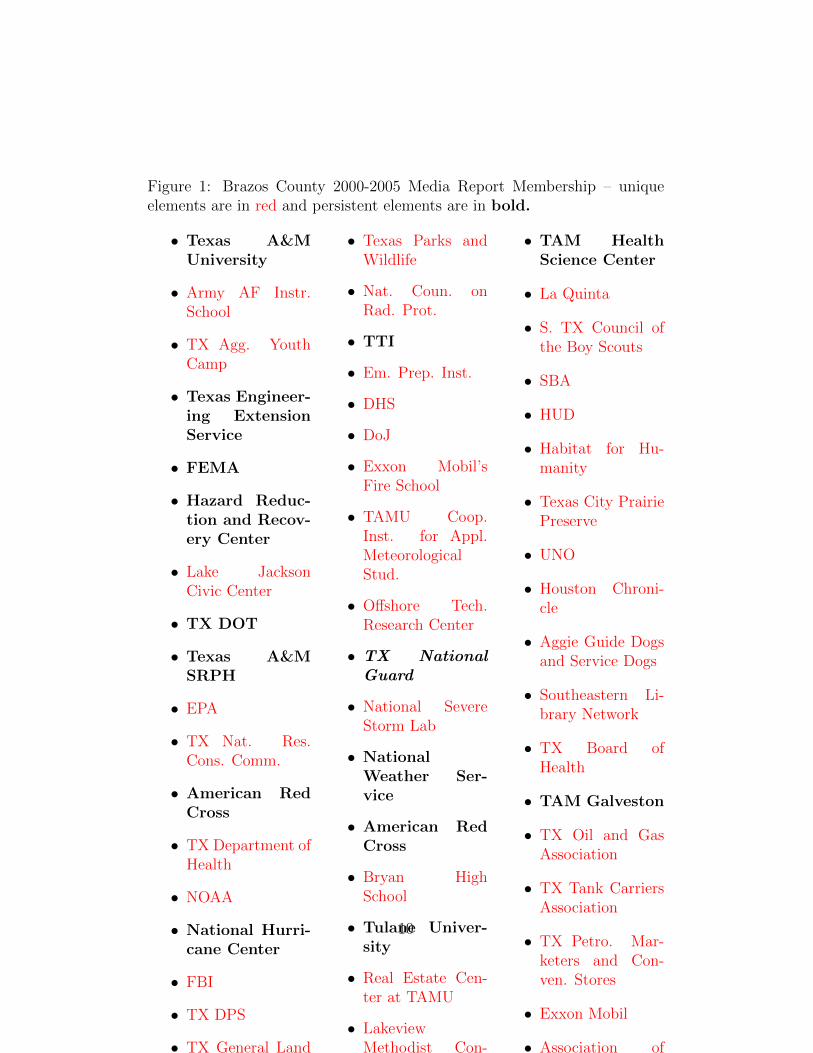
Figure 1: Brazos County 2000-2005 Media Report Membership – uniqueelements are in red and persistent elements are in bold.
• Texas A&MUniversity
• Army AF Instr.School
• TX Agg. YouthCamp
• Texas Engineer-ing ExtensionService
• FEMA
• Hazard Reduc-tion and Recov-ery Center
• Lake JacksonCivic Center
• TX DOT
• Texas A&MSRPH
• EPA
• TX Nat. Res.Cons. Comm.
• American RedCross
• TX Department ofHealth
• NOAA
• National Hurri-cane Center
• FBI
• TX DPS
• TX General LandOffice
• Texas Parks andWildlife
• Nat. Coun. onRad. Prot.
• TTI
• Em. Prep. Inst.
• DHS
• DoJ
• Exxon Mobil’sFire School
• TAMU Coop.Inst. for Appl.MeteorologicalStud.
• Offshore Tech.Research Center
• TX NationalGuard
• National SevereStorm Lab
• NationalWeather Ser-vice
• American RedCross
• Bryan HighSchool
• Tulane Univer-sity
• Real Estate Cen-ter at TAMU
• LakeviewMethodist Con-ference Center
• TAM HealthScience Center
• La Quinta
• S. TX Council ofthe Boy Scouts
• SBA
• HUD
• Habitat for Hu-manity
• Texas City PrairiePreserve
• UNO
• Houston Chroni-cle
• Aggie Guide Dogsand Service Dogs
• Southeastern Li-brary Network
• TX Board ofHealth
• TAM Galveston
• TX Oil and GasAssociation
• TX Tank CarriersAssociation
• TX Petro. Mar-keters and Con-ven. Stores
• Exxon Mobil
• Association ofFormer Students
10
It is also interesting that emergency management organizations, whilepresent, are not particularly prominent on the list. Curiously missing arethe county and city emergency management organizations. State and federalemergency management organizations are present, but not the local offices.It is hasty to conclude from this exclusion that the county and city emergencymanagement offices were not active and important. However, their operationswere missing from media accounts of the activities.
4.1.2 2006-2009
The second time period covers the post-Katrina/Rita period that includedanother major hurricane evacuation (related to Hurricane Ike in the EastTexas area) and a local evacuation related to a chemical release (at the ElDorado Chemical Plant). The media reported network roster is presented inFigure 2.
Again university units are prominent and persistent along with a handfulof other organizations. In this later period, local fire and emergency manage-ment organizations make it into the media reported network. The diversityof policy domains is still remarkable - though, often, the specific representa-tives changes. For example, the EPA drops out during this time period butthe TCEQ (the state equivalent to the EPA) enters. This raises an interest-ing question for studies of policy networks. How important is persistence ofspecific organizations within a network to ensure that a specific perspective(like, say, the importance of environmental issues) to be present within thatnetwork?
There are persistent members for a variety of policy domains includingtransportation (TTI) and health (with a variety of public health and hospitalsrepresented). The specific members of the nonprofit, religious, and privatesectors changed considerably in this period - but the substantial presence ofeach sector did not.
The aggregation of the media networks to 5-6 year increments masksa great deal of annual variation. Within this time period, the number oforganizations varied from 3 (in 2000) to dozens (in 2005 and 2008). Thisrepresents clear variation in network size on an annual basis. In reference toour propositions, the media reported networks provide evidence for variationin network membership and diversity of network participant organizationtype.
11
Figure 2: Brazos County 2006-2009 Media Report Membership – uniqueelements are in red and persistent elements are in bold.
• TAMU
• TX EngineeringExtension Ser-vice
• National Hurri-cane Center
• Tulane Univer-sity
• TAMU Galve-ston
• Center for Retail-ing Studies
• College StationFire Department
• University PoliceDepartment
• Env. Health andSafety Depart-ment
• TAMU PhysicalPlant
• CommunityEOC
• Hazard Reduc-tion and Recov-ery Center
• TAM HSC Of-fice of HS
• Atmos Energy
• TAM Center forHomeland Secu-rity
• Texas Home-land Security
• FEMA
• TX DOT
• American RedCross
• TTI
• TX NationalGuard
• NationalWeather Ser-vice
• TAM HSC
• A&M UnitedMethodist Church
• Plaza Hotel
• Christ UnitedMethodist Church
• Blood Center ofBrazos Valley
• St. Joseph Reg.Health Center
• CS Medical Cen-ter
• Brazos ValleyPhysician’s Orga-nization
• Carter Blood Care
• BCS Conv. Cen-ter
• US Public HealthServices
• Teaching, Learn-ing, and Cul-ture Department- TAMU
• Brazos CountyFood Bank
• Brazos CountyCouncil of Gov-ernment
• Texas Hotel andLodging Associa-tion
• Texas PublicPower Association
• Texas Task Force1
• Bryan HEB
• CS Wal-Mart
• Bryan Fire De-partment
• Roberston CountyEMS
• El Dorado Chemi-cal Company
• Grace BibleChurch
• Bryan Police De-partment
• TCEQ
12
4.2 Plan Based Networks
We also collected rosters for the emergency management and mass care /sheltering from official emergency plans. This data source, while also docu-mentary, provides a quite different view of the relevant policy networks. Theemergency plans include those who are formally responsible for emergencymanagement and a variety of tasks related to evacuee sheltering. For eachplan, we identified all of the actors named as responsible parties in the gen-eral emergency management network within the core emergency operationsplan.
For the Brazos County community, we were able to locate two generalemergency operations plans that covered the sample time period. The firstplan is from 2004 while the second was approved in 2009. These plans pro-vide a pre-Katrina view and an update following the lessons of the varioushurricanes. As in the media reported networks, we have highlighted elementsin red that are unique to that plan (that is, not present in the other plan).
4.2.1 2004
Figure 3 presents the network roster from the perspective of the emergencyplan.
The emergency operations plans provide a starkly different view of thelocal emergency management networks. Most obviously, the roster of thenetwork is much shorter than the media reported network rosters. The rostersare focused almost entirely on governmental organizations (with the notableexception of the Red Cross) and the actors are largely persistent across theplans.
4.2.2 2009
The roster looks largely similar in the more recent emergency plans – asrepresented in Figure 4.
Here again the roster is stable and focused almost exclusively on govern-mental organizations.
From the perspective of the emergency operations plans, the networkincludes little variability over time. The actors stay largely the same. Afew actors drop out (e.g. Radiological Officer) and a couple of actors emerge(notably, the Salvation Army). A diversity of policy domains are represented
13
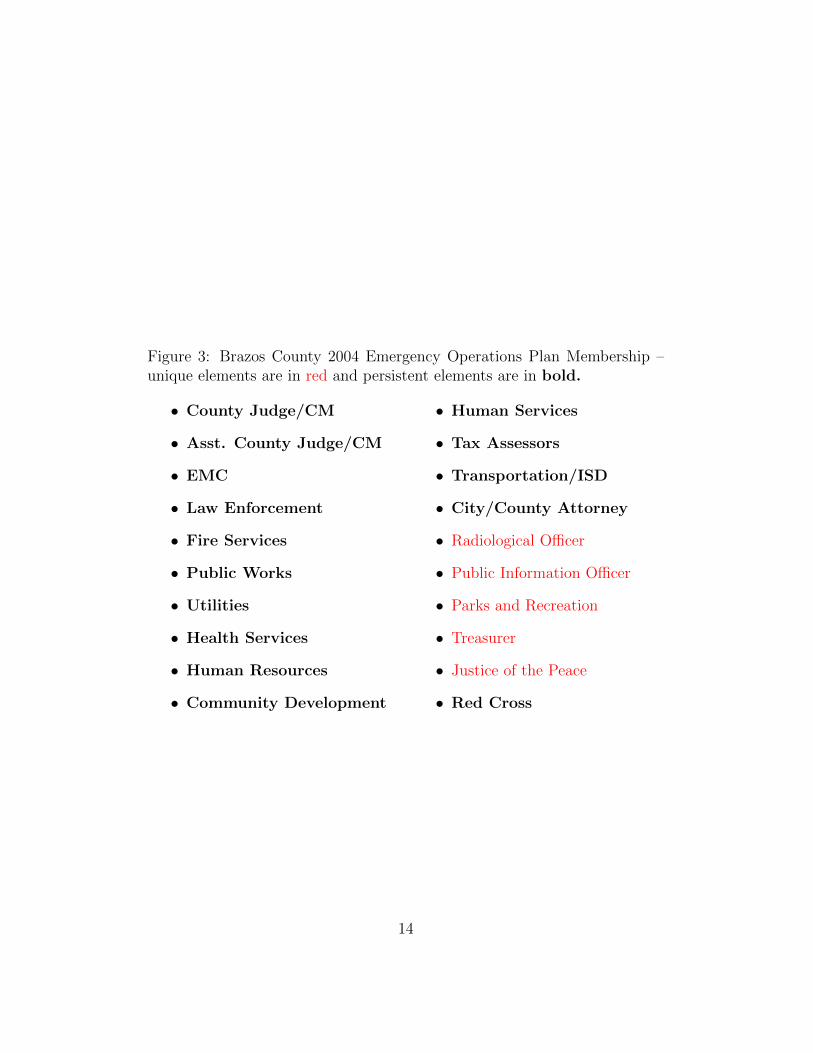
Figure 3: Brazos County 2004 Emergency Operations Plan Membership –unique elements are in red and persistent elements are in bold.
• County Judge/CM
• Asst. County Judge/CM
• EMC
• Law Enforcement
• Fire Services
• Public Works
• Utilities
• Health Services
• Human Resources
• Community Development
• Human Services
• Tax Assessors
• Transportation/ISD
• City/County Attorney
• Radiological Officer
• Public Information Officer
• Parks and Recreation
• Treasurer
• Justice of the Peace
• Red Cross
14
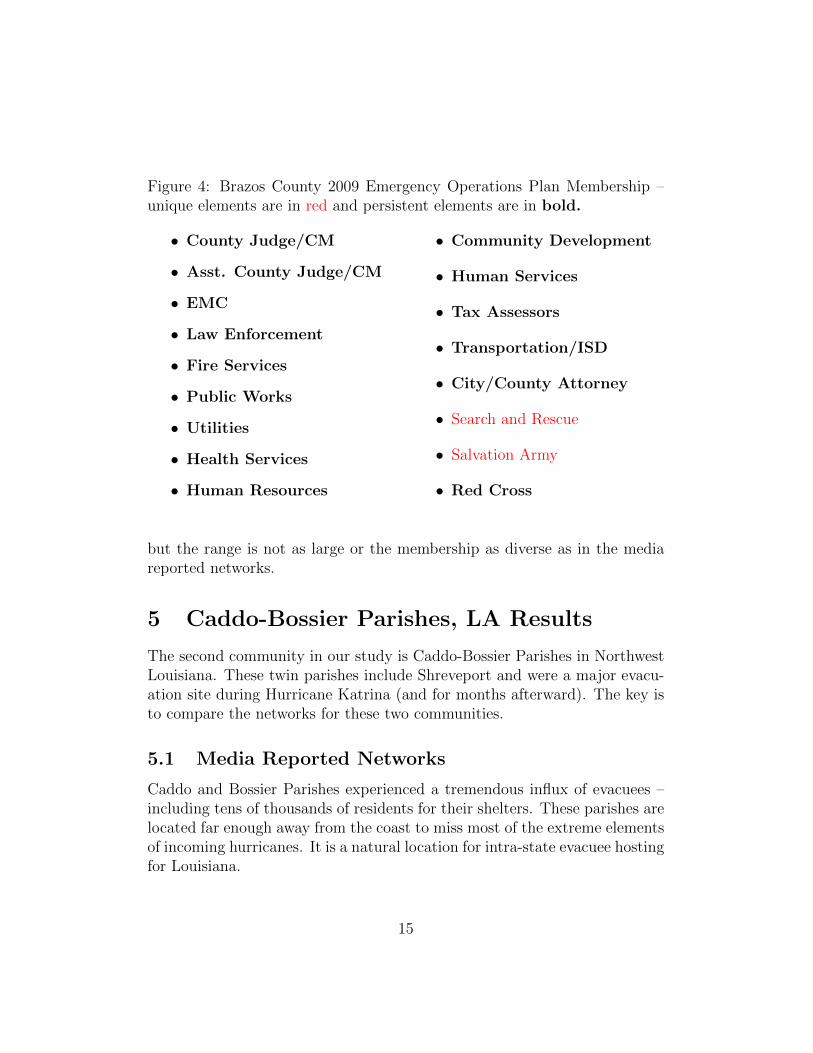
Figure 4: Brazos County 2009 Emergency Operations Plan Membership –unique elements are in red and persistent elements are in bold.
• County Judge/CM
• Asst. County Judge/CM
• EMC
• Law Enforcement
• Fire Services
• Public Works
• Utilities
• Health Services
• Human Resources
• Community Development
• Human Services
• Tax Assessors
• Transportation/ISD
• City/County Attorney
• Search and Rescue
• Salvation Army
• Red Cross
but the range is not as large or the membership as diverse as in the mediareported networks.
5 Caddo-Bossier Parishes, LA Results
The second community in our study is Caddo-Bossier Parishes in NorthwestLouisiana. These twin parishes include Shreveport and were a major evacu-ation site during Hurricane Katrina (and for months afterward). The key isto compare the networks for these two communities.
5.1 Media Reported Networks
Caddo and Bossier Parishes experienced a tremendous influx of evacuees –including tens of thousands of residents for their shelters. These parishes arelocated far enough away from the coast to miss most of the extreme elementsof incoming hurricanes. It is a natural location for intra-state evacuee hostingfor Louisiana.
15
5.1.1 2000-2005
Figure 5 presents the roster of the media reported network for Caddo-BossierParishes from 2000-2005.
As in the case of Brazos County, there is tremendous instability in theparticipants in the media reported network. The persistent components in-clude local fire and law enforcement organizations along with state and fed-eral emergency management organizations. Some nonprofits are persistentwhile there are many intermittent participants from nonprofit and religiousorganizations.
As to policy domain representation, we see a similar array in this commu-nity as in the last. Transportation and health care organizations are presentand persistent. There are other policy areas present (e.g. nutrition support,parks and recreation, and agriculture) but in a more intermittent way.
5.1.2 2006-2009
Figure 6 presents the media reported network for Caddo-Bossier Parishesfrom 2006-2009.
As in the previous community, there is diversity in terms of policy domainand organization sector. The specific members representing the nonprofit,religious, and private sectors change (with, again, the notable exceptionsof the Red Cross and the Salvation Army) but the sectors are present inboth periods to a notable extent. Some of the instability is an artifact ofname changes through the period (the state shifted to the title “Office forHomeland Security and Emergency Preparedness”). However, representationby local and state emergency preparedness offices seems light compared towhat one might expect.
5.2 Plan Based Network
Again we will contrast the media reported network with the official emergencyplan for the jurisdiction. In the case of the Caddo-Bossier Parishes, we werenot able to collect a historical plan. We only have access to the currentplan from 2009. In seeking older versions of the plan, we were assured thatthe previous versions of the plan operative from 2000 were largely the sameas the current plan. When we explained that we were most interested inthe actors present and the relationships between actors within the plan, one
16
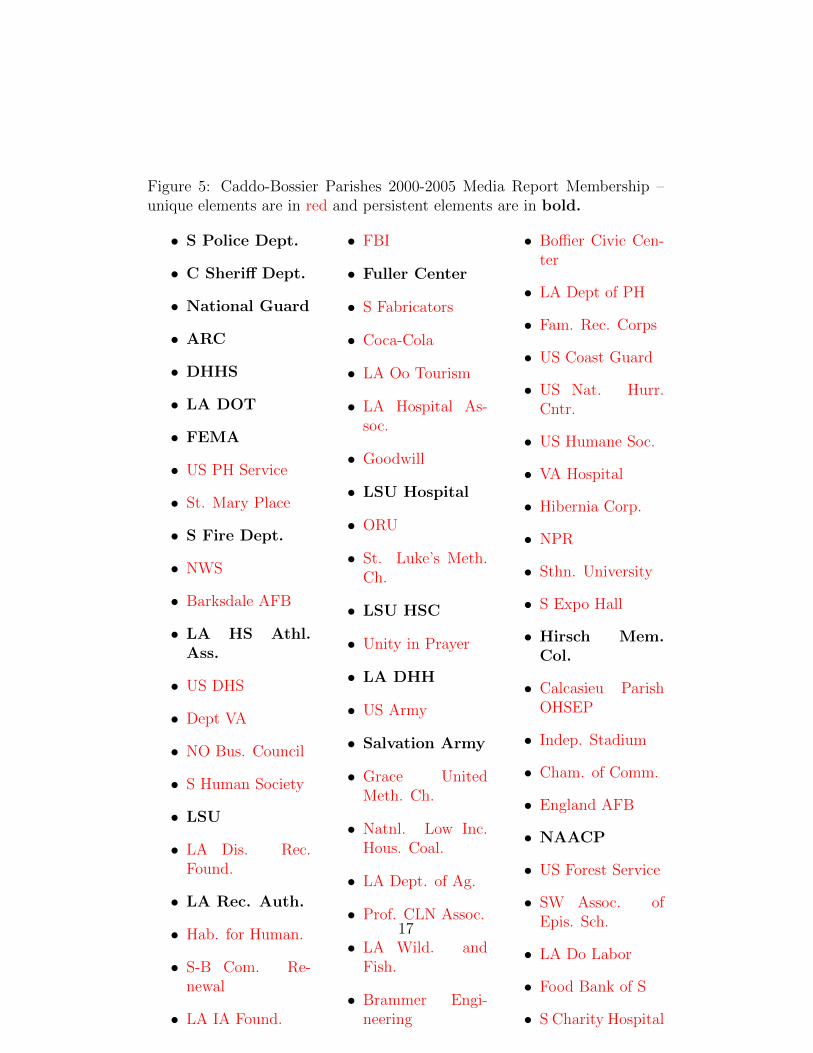
Figure 5: Caddo-Bossier Parishes 2000-2005 Media Report Membership –unique elements are in red and persistent elements are in bold.
• S Police Dept.
• C Sheriff Dept.
• National Guard
• ARC
• DHHS
• LA DOT
• FEMA
• US PH Service
• St. Mary Place
• S Fire Dept.
• NWS
• Barksdale AFB
• LA HS Athl.Ass.
• US DHS
• Dept VA
• NO Bus. Council
• S Human Society
• LSU
• LA Dis. Rec.Found.
• LA Rec. Auth.
• Hab. for Human.
• S-B Com. Re-newal
• LA IA Found.
• FBI
• Fuller Center
• S Fabricators
• Coca-Cola
• LA Oo Tourism
• LA Hospital As-soc.
• Goodwill
• LSU Hospital
• ORU
• St. Luke’s Meth.Ch.
• LSU HSC
• Unity in Prayer
• LA DHH
• US Army
• Salvation Army
• Grace UnitedMeth. Ch.
• Natnl. Low Inc.Hous. Coal.
• LA Dept. of Ag.
• Prof. CLN Assoc.
• LA Wild. andFish.
• Brammer Engi-neering
• Boffier Civic Cen-ter
• LA Dept of PH
• Fam. Rec. Corps
• US Coast Guard
• US Nat. Hurr.Cntr.
• US Humane Soc.
• VA Hospital
• Hibernia Corp.
• NPR
• Sthn. University
• S Expo Hall
• Hirsch Mem.Col.
• Calcasieu ParishOHSEP
• Indep. Stadium
• Cham. of Comm.
• England AFB
• NAACP
• US Forest Service
• SW Assoc. ofEpis. Sch.
• LA Do Labor
• Food Bank of S
• S Charity Hospital
17
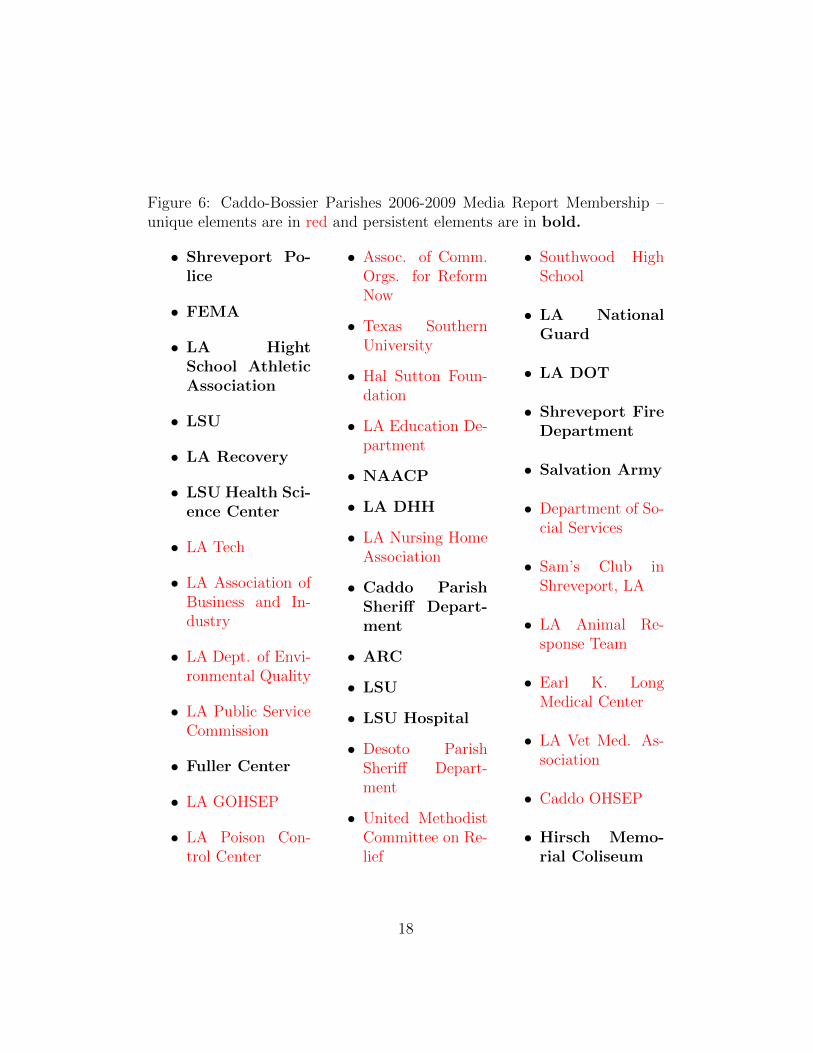
Figure 6: Caddo-Bossier Parishes 2006-2009 Media Report Membership –unique elements are in red and persistent elements are in bold.
• Shreveport Po-lice
• FEMA
• LA HightSchool AthleticAssociation
• LSU
• LA Recovery
• LSU Health Sci-ence Center
• LA Tech
• LA Association ofBusiness and In-dustry
• LA Dept. of Envi-ronmental Quality
• LA Public ServiceCommission
• Fuller Center
• LA GOHSEP
• LA Poison Con-trol Center
• Assoc. of Comm.Orgs. for ReformNow
• Texas SouthernUniversity
• Hal Sutton Foun-dation
• LA Education De-partment
• NAACP
• LA DHH
• LA Nursing HomeAssociation
• Caddo ParishSheriff Depart-ment
• ARC
• LSU
• LSU Hospital
• Desoto ParishSheriff Depart-ment
• United MethodistCommittee on Re-lief
• Southwood HighSchool
• LA NationalGuard
• LA DOT
• Shreveport FireDepartment
• Salvation Army
• Department of So-cial Services
• Sam’s Club inShreveport, LA
• LA Animal Re-sponse Team
• Earl K. LongMedical Center
• LA Vet Med. As-sociation
• Caddo OHSEP
• Hirsch Memo-rial Coliseum
18
representative of the emergency management office said that there wouldbe very few changes. Given the few changes in the Brazos County plansdiscussed previously, this seems credible (though we are continuing to seekhistorical plans).
5.2.1 2009
Figure 7 presents the roster for the Caddo-Bossier Parishes emergency plan.In this figure, we have highlighted (in red) the organizations that are presenthere but have no obvious equivalent in the Brazos County plan rosters.
The roster for this community is larger than the plan-based roster forBrazos County and includes a broader range of organizations. This plan in-cludes a broader range of government actors (including code enforcement andagriculture extension offices). Even with this diversity, though, the diversityof the plan network is still quite limited compared to the media-reportednetworks.
6 Lessons for Network Dynamics
The lessons for network dynamics depend entirely on which approach tonetwork measurement one prefers. The formal plans provide an image ofthe networks as limited in scope and stable over time. The small numberof participants in these networks tend to stay in the network. The networkprovides little evidence of permeability to changes – even in what may beseen as a remarkable challenge to the network. These were not networks thatoperated below the radar of public media attention. Despite the high salience,there is little evidence of change in the participants as viewed through theformal plans.
The media reported networks tell quite a different story. Within thesetwo communities, we see dynamic networks that change size and membership.Each network includes participants from diverse policy domains and sectors.This view suggests participation by the broad civil society in issues of evac-uation hosting. Religious organizations provide a broad range of services aswell as serving as evacuee hosts. Similarly, private sector organizations areinvolved in services ranging from providing supplies and meals (sometimesat a remarkable discount). Government organizations from a broad range ofpolicy domain, including – most obviously, public health and transportation;
19
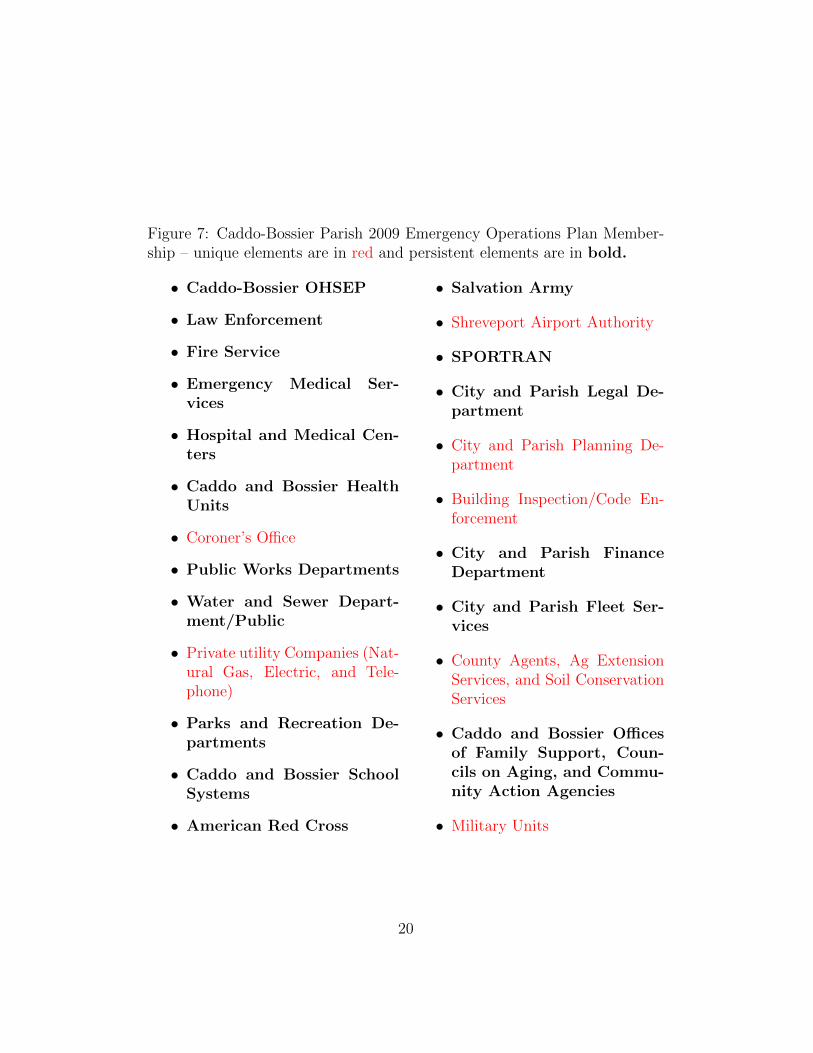
Figure 7: Caddo-Bossier Parish 2009 Emergency Operations Plan Member-ship – unique elements are in red and persistent elements are in bold.
• Caddo-Bossier OHSEP
• Law Enforcement
• Fire Service
• Emergency Medical Ser-vices
• Hospital and Medical Cen-ters
• Caddo and Bossier HealthUnits
• Coroner’s Office
• Public Works Departments
• Water and Sewer Depart-ment/Public
• Private utility Companies (Nat-ural Gas, Electric, and Tele-phone)
• Parks and Recreation De-partments
• Caddo and Bossier SchoolSystems
• American Red Cross
• Salvation Army
• Shreveport Airport Authority
• SPORTRAN
• City and Parish Legal De-partment
• City and Parish Planning De-partment
• Building Inspection/Code En-forcement
• City and Parish FinanceDepartment
• City and Parish Fleet Ser-vices
• County Agents, Ag ExtensionServices, and Soil ConservationServices
• Caddo and Bossier Officesof Family Support, Coun-cils on Aging, and Commu-nity Action Agencies
• Military Units
20
but also social services, education, and environmental quality.This equivocation within the data do not help to resolve the fundamental
question related to policy networks. Whether networks are diverse (as issuenetworks) or limited (as iron triangles) depends to a great extent on the dataone uses to view the network. The formal plans provide an image of limitedparticipation that is larger than the most strict iron triangle models, but stilllimited largely to a steady group of government organizations.
7 Lessons for Network Measurement
The primary lessons from the analysis may be the care that we must take inadopting a strategy for network measurement. The two strategies reportedhere illustrate the divergence of images possible from two different samplingstrategies. Having also conducted interviews within the emergency and shel-ter management communities, we are confident that both strategies reveal apart of the truth. The formal plans include important actors that sometimesevade media attention but fail to include some other active participants – par-ticularly private and nonprofit actors. The media reports are over-inclusiveand equate participation of central and peripheral actors. The truth likelylies somewhere in-between these two images.
One can seek the one best strategy for data collection (including, in addi-tion to the document analysis approaches represented here, situation reports,interviews or surveys). Currently, such a debate is indeterminate. Each focushere clearly has limitations. The formal plans are not representative of diver-sity and difficult to collect across time. What change there is across time alsoseems to understate the changes in the network. The media reported net-works are the easiest to collect across time but may include participants thatwe would not want to include as actual network members. Furthermore, thereare strong biases in the probability of reporting some organizations withinthe media accounts. The most reported member of the Brazos County net-work (by a wide margin) is Texas A&M University. While other methodscorroborate their membership in the network (including the community in-terviews and the formal plans – but only in the plan annexes), there is littlereason to believe they are the most central or most active member of thenetwork. Instead, it is likely that they are the most available actor to localand regional journalists. This availability bias may distort any image basedon media data. Interviews and surveys are not without their problems as
21
well. Sampling local officials is likely to involve the formality bias found inthe emergency operations plans. Given these various biases, there is no clearcontender for best single sampling strategy.
Alternatively, one can pool data from a variety of sources. This is a com-mon practice in emergency management network research as represented bythe work of Kapucu and Comfort (Comfort & Kapucu 2006, Kapucu, Au-gustin & Garayev 2009). The logic behind combining sampling strategies isbased on “triangulation” (Jick 1979). When a variety of research strategies(whether data collection or data analysis strategies) contain biases, one mayimplement different research strategies within the same research project. Ifdifferent research strategies (with different biases) lead to convergent find-ings, one can have greater faith in the results than a study that relies on asingle method. Contemporary calls for “mixed methods” rely (though notexclusively) on this argument (Nesbit 2011).
The case for mixed methods is not entirely clear, however. If we imaginean analogous situation in survey methodology we might see reason to pause.If one conducted a survey with three different sampling methods (e.g. hand-outs at the mall, a telephone sample, and an internet sample), it would notbe enough to simply combine all of the responses into a single dataset foranalysis. One would need to very carefully consider whether some responsesshould be included at all (one may not want to include handouts at a mall atall given the selection biases present). For all of the methods included, theweighting of the responses would be a difficult question to manage. In mostcases, one would either need to control for the sampling method (throughcomplicated dummy variables, possibly) or conduct separate analyses usingeach sample.
The problem is even more complicated in the sense of network data sets.Sampling for any network level statistics (density, centralization, etc.) de-pends on the interaction between sampled units. Omitting or incorrectlyincluding a unit has more than a 1/n marginal effect. The effect will dependon the interaction with each of the other actors and can increase in n – thesize of the network. The plan network is highly centralized with two of theactors (the emergency management office and the county judge/city man-ager) connected with all other actors. The media networks are much lowerdensity with few actors interacting with more than a dozen other actors (andinteractions with more than three are rare). Density measures, though, arehighly sensitive to network size and the accuracy of network sampling.
Combining the datasets creates another complex problem. There is no
22
obvious way to weight the inclusion of network units. Given the interdepen-dence of network units, it is not as simple as the standard tools for weightingunits within complex survey samples. If we combined these community net-work measures, the media network units would overwhelm the plan basedmembers. The resulting network level statistics would be driven by the me-dia network and very little signal from the plan-based networks would makeit through. This makes us quite hesitant to simply pool the units and therelations.
We do not propose a solution to the problem here. At the very least,the result suggest how important it is to consider network studies from mul-tiple measurement strategies. It also draws into question simple pooling ofresults from disparate measures without careful consideration of the propor-tion each method contributes to the pool, the distinctiveness of each meth-ods contributed units, and the potential confounding biases included in eachmethod.
8 Conclusion
Network analysis is an emerging and potentially powerful toolset for the studyof policy implementation generally and emergency management networksspecifically. The results of studies of two emergency and shelter managementnetworks here provide some insight into the dynamics of these networks overtime – but raise substantial questions about the nature of data collection fornetwork analysis.
Two different methods of data collection provide starkly different por-traits of the emergency and shelter management networks. The media re-ported networks provide a vision of a broad issue network including an ever-changing roster representative of various policy domains and organizationalsectors. The plan-based networks are much smaller and focus almost ex-clusively on government partners and a handful of longstanding nonprofitpartners. Which of these images is correct? The answer is not entirely clearfrom data themselves or from corroborating interviews within each commu-nity. Of course the interviews have their own set of biases.
The strongest conclusion from the study is the need to think much morecarefully about the nature of administrative network data. Single sourcenetworks are prone to a variety of biases ranging from availability bias toorganizational and formal biases toward specific sectors. Multi-method stud-
23

ies, however, are also difficulty in the absence of clear rules for pooling datainto coherent aggregate networks.
24
References
Comfort, L.K. 1994. “Self-organization in Complex Systems.” Journal ofPublic Administration Research and Theory 4(3):393–410.
Comfort, L.K. 2007. “Crisis Management in Hindsight: Cognition, Com-munication, Coordination, and Control.” Public Administration Review67(s1):189–197.
Comfort, L.K. & N. Kapucu. 2006. “Inter-organizational Coordination inExtreme events: The World Trade Center Attacks, September 11, 2001.”Natural Hazards 39(2):309–327.
Comfort, Louise K. 2006. “”The Dynamics of Policy Learning: CatastrophicEvents in Real Time.”.” Presented at the 2006 Annual Meeting of theAmerican Political Science Association.
Heclo, Hugh. 1978. ”Issue Networks and the Executive Establishment”. InThe New American Political Establishment, ed. Anthony King. Ameri-can Enterprise Institute pp. 87–124.
Jick, T.D. 1979. “Mixing Qualitative and Quantitative Methods: Triangula-tion in Action.” Administrative science quarterly 24(4):602–611.
Kapucu, N., M.E. Augustin & V. Garayev. 2009. “Interstate Partnerships inEmergency Management: Emergency Management Assistance Compactin Response to Catastrophic Disasters.” Public Administration Review69(2):297–313.
Kiefer, J.J. & R.S. Montjoy. 2006. “Incrementalism Before the Storm: Net-work Performance for the Evacuation of New Orleans.” Public Admin-istration Review 66:122.
McCool, D. 1998. “The Subsystem Family of Concepts: a Critique and aProposal.” Political Research Quarterly 51(2):551.
Nesbit, R., S. Moulton S. Robinson C. Smith L. DeHart-Davis M. Feeney B.Gazley Y. Hou. 2011. “Wrestling with Intellectual Diversity in PublicAdministration: Avoiding Disconnectedness and Fragmentation whileSeeking Rigor, Depth, and Relevance.” Journal of Public AdministrationResearch and Theory 21(suppl 1):i13.
25
O’Toole Jr, L.J. 1997. “Treating Networks Seriously: Practical and Research-Based Agendas in Public Administration.” Public Administration Re-view 57(1):45–42.
Redford, E.S. 1969. Democracy in the administrative state. Oxford UniversityPress, USA.
Robinson, S.E., B. Berrett & K. Stone. 2006. “The Development of Collab-oration of Response to Hurricane Katrina in the Dallas Area.” PublicWorks Management & Policy 10(4):315.
Sabatier, P.A. & H.C. Jenkins-Smith. 1993. Policy Change and Learning:An Advocacy Coalition Approach. Westview Pr.
Sabatier, Paul. 1993. ”Policy Change Over a Decade or More”. In Pol-icy Change and Learning: An Advocacy Coalition Approach, ed. PaulSabatier & Hank Jenkins-Smith. Westview Press pp. 13–40.
Simo, G. & A.L. Bies. 2007. “The Role of Nonprofits in Disaster Response:An Expanded Model of Cross-Sector Collaboration.” Public Adminis-tration Review 67:125–142.
Waugh, W.L. & G. Streib. 2006. “Collaboration and leadership for effectiveemergency management.” Public Administration Review 66(s1):131–140.
26