The European Flood Alert System – Part 1: Concept and .... Thielen et al.: EFAS – Concept and...
16
Hydrol. Earth Syst. Sci., 13, 125–140, 2009 www.hydrol-earth-syst-sci.net/13/125/2009/ © Author(s) 2009. This work is distributed under the Creative Commons Attribution 3.0 License. Hydrology and Earth System Sciences The European Flood Alert System – Part 1: Concept and development J. Thielen 1 , J. Bartholmes 1 , M.-H. Ramos 1,2 , and A. de Roo 1 1 EC, Joint Research Centre, Institute for Environment and Sustainability, Via Fermi 2749, 21027 Ispra (VA), Italy 2 Parc de Tourvoie, BP 4492163 Antony Cedex, France Received: 14 December 2007 – Published in Hydrol. Earth Syst. Sci. Discuss.: 6 February 2008 Revised: 2 December 2008 – Accepted: 14 January 2009 – Published: 5 February 2009 Abstract. This paper presents the development of the Eu- ropean Flood Alert System (EFAS), which aims at increas- ing preparedness for floods in trans-national European river basins by providing local water authorities with medium- range and probabilistic flood forecasting information 3 to 10 days in advance. The EFAS research project started in 2003 with the development of a prototype at the European Commission Joint Research Centre (JRC), in close collab- oration with the national hydrological and meteorological services. The prototype covers the whole of Europe on a 5 km grid. In parallel, different high-resolution data sets have been collected for the Elbe and Danube river basins, allowing the potential of the system under optimum condi- tions and on a higher resolution to be assessed. Flood warn- ing lead-times of 3–10 days are achieved through the incor- poration of medium-range weather forecasts from the Ger- man Weather Service (DWD) and the European Centre for Medium-Range Weather Forecasts (ECMWF), comprising a full set of 51 probabilistic forecasts from the Ensemble Pre- diction System (EPS) provided by ECMWF. The ensemble of different hydrographs is analysed and combined to pro- duce early flood warning information, which is disseminated to the hydrological services that have agreed to participate in the development of the system. In Part 1 of this paper, the scientific approach adopted in the development of the system is presented. The rational of the project, the systems set-up, its underlying components, basic principles and products are described. In Part 2, results of a detailed statistical analysis of the performance of the system are shown, with regard to both probabilistic and deterministic forecasts. Correspondence to: J. Thielen ([email protected]) 1 Introduction Over the last decades severe fluvial floods with a trans- national dimension have taken place in Europe, such as the Rhine-Meuse floods in 1993 and 1995, the Oder floods in 1997, and the Po floods in 1994 and 2000. Historic floods af- fected the Elbe and the Danube river basins in 2002 (Br´ azdil et al., 2005; Yiou et al., 2006; Toothill, 2002). In 2005, widespread and repeated flooding was again observed in several tributaries to the Danube river basin, particularly in Switzerland and Austria (de Roo et al., 2006) and in the lower Danube countries (Romania and Bulgaria). Only one year later, record floods hit again the Elbe and the Danube river basins in spring 2006 (ICPDR, 2006). The European Environmental Agency estimated that floods in Europe be- tween 1998 and 2002 caused about 700 deaths, the displace- ment of about half a million people and at least 25 billion Euros in insured economic losses (EEA, 2003). A study by Bakker (2007) suggests that transboundary floods are typi- cally more severe in their magnitude, affect larger areas, re- sult in higher death tolls, and cause more financial damage than non-shared river floods do. The repetitive occurrence of such disastrous floods prompts the investigation of new strategies for flood prevention and protection, with focus on coordinated actions among countries sharing the same river basin. Preventive measures such as the construction of reservoirs, polders or dykes, aimed at reducing the impact of floods, have high priority for the national water authorities. Al- though these measures may attenuate the impact of floods, it is unlikely that floods can ever be totally prevented. Further- more, within a changing climate, precipitation patterns are also likely to change (see, for example, Milly et al., 2002; Palmer and Raisanen, 2002; Lehner et al., 2006; Goubanova and Li, 2007; and references therein) and the preventive mea- sures already in place may need to be revised and adapted to the new hydro-meteorological conditions. Published by Copernicus Publications on behalf of the European Geosciences Union.
Transcript of The European Flood Alert System – Part 1: Concept and .... Thielen et al.: EFAS – Concept and...

Hydrol. Earth Syst. Sci., 13, 125–140, 2009www.hydrol-earth-syst-sci.net/13/125/2009/© Author(s) 2009. This work is distributed underthe Creative Commons Attribution 3.0 License.
Hydrology andEarth System
Sciences
The European Flood Alert System – Part 1: Concept anddevelopment
J. Thielen1, J. Bartholmes1, M.-H. Ramos1,2, and A. de Roo1
1EC, Joint Research Centre, Institute for Environment and Sustainability, Via Fermi 2749, 21027 Ispra (VA), Italy2Parc de Tourvoie, BP 4492163 Antony Cedex, France
Received: 14 December 2007 – Published in Hydrol. Earth Syst. Sci. Discuss.: 6 February 2008Revised: 2 December 2008 – Accepted: 14 January 2009 – Published: 5 February 2009
Abstract. This paper presents the development of the Eu-ropean Flood Alert System (EFAS), which aims at increas-ing preparedness for floods in trans-national European riverbasins by providing local water authorities with medium-range and probabilistic flood forecasting information 3 to10 days in advance. The EFAS research project started in2003 with the development of a prototype at the EuropeanCommission Joint Research Centre (JRC), in close collab-oration with the national hydrological and meteorologicalservices. The prototype covers the whole of Europe on a5 km grid. In parallel, different high-resolution data setshave been collected for the Elbe and Danube river basins,allowing the potential of the system under optimum condi-tions and on a higher resolution to be assessed. Flood warn-ing lead-times of 3–10 days are achieved through the incor-poration of medium-range weather forecasts from the Ger-man Weather Service (DWD) and the European Centre forMedium-Range Weather Forecasts (ECMWF), comprising afull set of 51 probabilistic forecasts from the Ensemble Pre-diction System (EPS) provided by ECMWF. The ensembleof different hydrographs is analysed and combined to pro-duce early flood warning information, which is disseminatedto the hydrological services that have agreed to participate inthe development of the system. In Part 1 of this paper, thescientific approach adopted in the development of the systemis presented. The rational of the project, the systems set-up,its underlying components, basic principles and products aredescribed. In Part 2, results of a detailed statistical analysisof the performance of the system are shown, with regard toboth probabilistic and deterministic forecasts.
Correspondence to:J. Thielen([email protected])
1 Introduction
Over the last decades severe fluvial floods with a trans-national dimension have taken place in Europe, such as theRhine-Meuse floods in 1993 and 1995, the Oder floods in1997, and the Po floods in 1994 and 2000. Historic floods af-fected the Elbe and the Danube river basins in 2002 (Brazdilet al., 2005; Yiou et al., 2006; Toothill, 2002). In 2005,widespread and repeated flooding was again observed inseveral tributaries to the Danube river basin, particularly inSwitzerland and Austria (de Roo et al., 2006) and in thelower Danube countries (Romania and Bulgaria). Only oneyear later, record floods hit again the Elbe and the Danuberiver basins in spring 2006 (ICPDR, 2006). The EuropeanEnvironmental Agency estimated that floods in Europe be-tween 1998 and 2002 caused about 700 deaths, the displace-ment of about half a million people and at least 25 billionEuros in insured economic losses (EEA, 2003). A study byBakker (2007) suggests that transboundary floods are typi-cally more severe in their magnitude, affect larger areas, re-sult in higher death tolls, and cause more financial damagethan non-shared river floods do. The repetitive occurrenceof such disastrous floods prompts the investigation of newstrategies for flood prevention and protection, with focus oncoordinated actions among countries sharing the same riverbasin.
Preventive measures such as the construction of reservoirs,polders or dykes, aimed at reducing the impact of floods,have high priority for the national water authorities. Al-though these measures may attenuate the impact of floods, itis unlikely that floods can ever be totally prevented. Further-more, within a changing climate, precipitation patterns arealso likely to change (see, for example, Milly et al., 2002;Palmer and Raisanen, 2002; Lehner et al., 2006; Goubanovaand Li, 2007; and references therein) and the preventive mea-sures already in place may need to be revised and adapted tothe new hydro-meteorological conditions.
Published by Copernicus Publications on behalf of the European Geosciences Union.

126 J. Thielen et al.: EFAS – Concept and development
When preventive measures are not sufficient, flood dam-age can still be reduced through raised preparedness. Unfor-tunately, precipitation, in most cases the driving factor forfloods, cannot be skilfully forecasted more than 2–3 daysin advance. In a study based on forecasts from the Euro-pean Centre for Medium-Range Weather Forecasts, Buizzaet al. (1999) showed that, although the skill in weather fore-casting has generally increased to 5–6 days, e.g. for temper-ature, it is only of the order of 2–3 days for precipitation.In particular, in the case of extreme rainfalls, which are ofspecial interest to flood forecasters, the lead-time for skilledforecasts decreases even further.
However, this lead-time for skilled precipitation forecast-ing can be extended by exploring ensemble prediction sys-tems (EPS) (e.g. Tracton and Kalnay, 1993; Molteni et al.,1996). Although produced by some meteorological servicesas early as the 1980s (Molteni et al., 1996), it is only recentlythat EPS have been explored for flood forecasting purposes.In Europe, the EFFS1 project (2000–2003) was one of thefirst large European research projects to look into the poten-tial of using medium-range weather forecasts, including EPS,for flood forecasting in large trans-national river basins, withthe aim of extending the early warning time (de Roo et al,2003, Gouweleeuw et al., 2004).
In 2004, an international initiative called HEPEX2 waslaunched. HEPEX is an international effort that brings to-gether meteorological and hydrological communities to de-velop advanced probabilistic hydrological forecasting tech-niques that use weather and climate ensemble forecasts(Hamill et al., 2005; Schaake et al., 2006; Schaake et al.,2007; Franz et al., 2005; Thielen et al., 2008).
Recent research results from HEPEX are encouraging anddemonstrate the potential benefit of probabilistic weatherforecasts over deterministic ones for flood forecasting inlarge river basins (Thielen et al., 2007; Buizza, 2008; Bognerand Kalas, 2008; Gebhardt et al., 2008; Marty et al., 2008;Pappenberger et al., 2008b; Schalk et al., 2008; Tucci et al.,2008; Zappa et al., 2008). Roulin (2007) demonstrated thatEPS-based flood forecasting can also be valuable for smallriver basins, while advances in limited area EPS modellingmay provide even better quantitative precipitation estimatesalso for small basins (Marsigli et al., 2001; Marsigli et al.,2005; Tibaldi et al., 2006).
The benefit of medium-range probabilistic flood forecastsfor hydrological services lies first of all in the earlier knowl-edge that a possibility for a flood event to occur exists. It canfor example lead to the discussion of different flood eventscenarios, as well as possible responses and actions; to there-arrangement of working schedules to have sufficient peo-ple on stand-by; and to enhanced monitoring of the meteoro-logical and hydrological conditions over the coming days.
1European Flood Forecasting System2Hydrological Ensemble Prediction Experiment (see
http://hydis8.eng.uci.edu/hepex)
In case subsequent forecasts do not confirm the previousalert, forecasters can return to business-as-usual. Adverseeffects from earlier warning are therefore minimal. In the op-posite case, if a pre-alert is confirmed as the forecasted eventapproaches the forecast date, flood forecasters will be betterprepared to initiate any necessary emergency procedure andthere will be a gain in time when analysing the short-term –and more precise – forecasts.
Earlier warning can therefore help in reducing the levelof stress in the forecasting centres. Research has shownthat the negative effects of stress on decision-making undertime pressure and fatigue due to overwork in the operationalcentres during a flood event should not be underestimated(Kowalski-Trakofler et al., 2003; Paton and Flin, 1999).
In 2003 the European Commission started the develop-ment of a European Flood Alert System (EFAS), followingthe devastating Elbe and Danube floods in 2002. EFAS aimsto simulate hydrological processes in trans-national riverbasins and to provide harmonized flood information acrossEurope.
This paper is Part 1 of two articles describing the EuropeanFlood Alert System. Part 1 presents the concept of EFAS, itsunderlying structure, development and forecasting products.In Part 2 (Bartholmes et al., 2009) the performance of thepre-operational EFAS system is analysed for a two-year pe-riod.
2 General framework
EFAS is part of a strategy for improved disaster manage-ment in Europe to reduce the impact of transnational floodsthrough early warning. This can be achieved by first com-plementing Member States activities on flood preparedness,which means by providing National hydrological serviceswith early flood information in addition to their own localand, mostly often, short-range forecasting information. Suchcomplementary data can be catchment-based information be-yond administrative boundaries, probabilistic flood informa-tion with lead-times up to 15 days, as well as results from adifferent hydrological model for comparison with the localsimulations. Secondly, by providing the European Commis-sion with an overview of ongoing and expected floods in Eu-rope, an early-warning flood forecasting system can be use-ful for crisis management in the case of large trans-nationalflood events that might need intervention on an internationallevel.
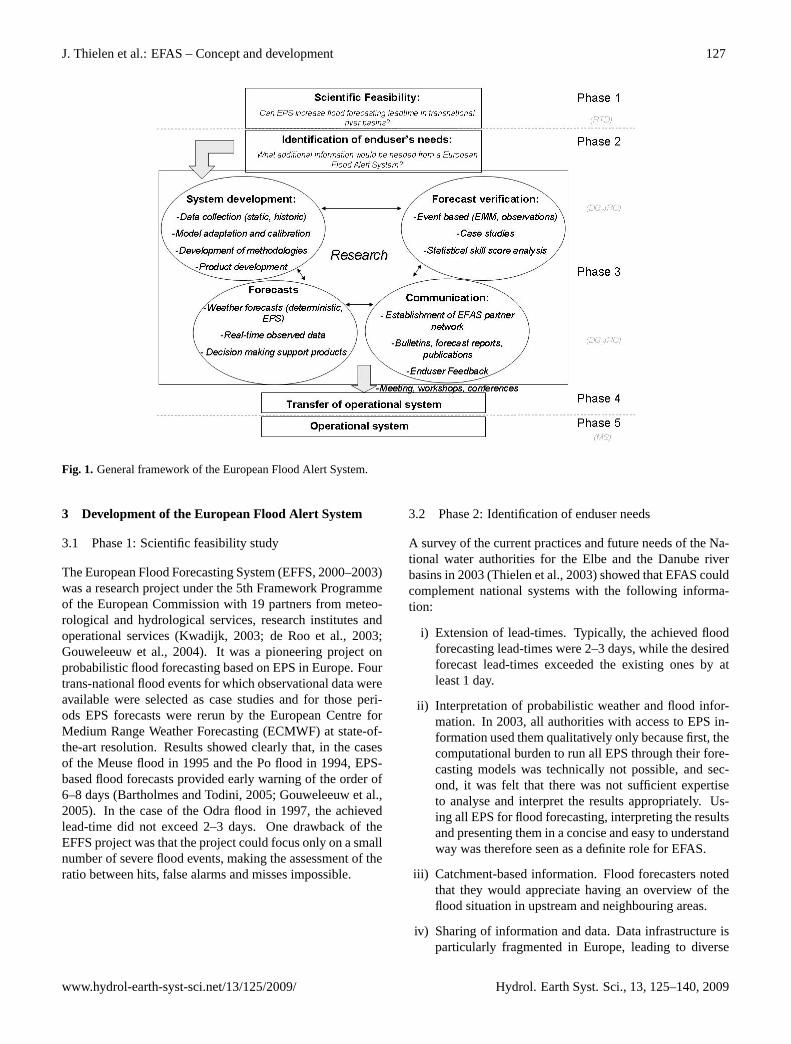
During its development stage, EFAS focused on provid-ing additional information to the national hydrological ser-vices. As illustrated in Fig. 1, this stage was divided into fivephases: (1) Assessment of scientific feasibility; (2) Identifi-cation of operational end-user needs; (3) Prototype develop-ment and research; (4) Preparation for transfer of operationalsystem; (5) Running of operational system. These phases aredescribed in the next Sections.
Hydrol. Earth Syst. Sci., 13, 125–140, 2009 www.hydrol-earth-syst-sci.net/13/125/2009/
J. Thielen et al.: EFAS – Concept and development 127
1
Figure 1: General framework of the European Flood Alert System
Fig. 1. General framework of the European Flood Alert System.
3 Development of the European Flood Alert System
3.1 Phase 1: Scientific feasibility study
The European Flood Forecasting System (EFFS, 2000–2003)was a research project under the 5th Framework Programmeof the European Commission with 19 partners from meteo-rological and hydrological services, research institutes andoperational services (Kwadijk, 2003; de Roo et al., 2003;Gouweleeuw et al., 2004). It was a pioneering project onprobabilistic flood forecasting based on EPS in Europe. Fourtrans-national flood events for which observational data wereavailable were selected as case studies and for those peri-ods EPS forecasts were rerun by the European Centre forMedium Range Weather Forecasting (ECMWF) at state-of-the-art resolution. Results showed clearly that, in the casesof the Meuse flood in 1995 and the Po flood in 1994, EPS-based flood forecasts provided early warning of the order of6–8 days (Bartholmes and Todini, 2005; Gouweleeuw et al.,2005). In the case of the Odra flood in 1997, the achievedlead-time did not exceed 2–3 days. One drawback of theEFFS project was that the project could focus only on a smallnumber of severe flood events, making the assessment of theratio between hits, false alarms and misses impossible.
3.2 Phase 2: Identification of enduser needs
A survey of the current practices and future needs of the Na-tional water authorities for the Elbe and the Danube riverbasins in 2003 (Thielen et al., 2003) showed that EFAS couldcomplement national systems with the following informa-tion:
i) Extension of lead-times. Typically, the achieved floodforecasting lead-times were 2–3 days, while the desiredforecast lead-times exceeded the existing ones by atleast 1 day.
ii) Interpretation of probabilistic weather and flood infor-mation. In 2003, all authorities with access to EPS in-formation used them qualitatively only because first, thecomputational burden to run all EPS through their fore-casting models was technically not possible, and sec-ond, it was felt that there was not sufficient expertiseto analyse and interpret the results appropriately. Us-ing all EPS for flood forecasting, interpreting the resultsand presenting them in a concise and easy to understandway was therefore seen as a definite role for EFAS.
iii) Catchment-based information. Flood forecasters notedthat they would appreciate having an overview of theflood situation in upstream and neighbouring areas.
iv) Sharing of information and data. Data infrastructure isparticularly fragmented in Europe, leading to diverse
www.hydrol-earth-syst-sci.net/13/125/2009/ Hydrol. Earth Syst. Sci., 13, 125–140, 2009

128 J. Thielen et al.: EFAS – Concept and development
Table 1. EFAS input data in the period 2005/2006 where P stands for precipitation, T for mean daily temperature,E0 for potential evaporationover bare soil,ET0 potential evapotranspiration, andES0 potential evaporation over vegetated surfaces.
DWD ECMWF –deterministic
ECMWF – EPS Observedmeteorologicaldata (JRC MARS)
Temporal resolution Staggered, 1 h (1–3 days),3 h (4–7 days)
Staggered, 3 h (1–3 days),6 h (4–10 days)
6 h (1–10 days) Daily
Spatial resolution Staggered,7 km (1–3 days) and 40 km
TL511L60(∼40 km)
TL255L40 (∼80 km)* Gridded,50×50 km
Times provided 12:00; 00:00 12:00; 00:00 12:00; 00:00 Irregular, typically at 23:00Input fields 1 (P, T , E) 1 (P, T , E) 50+1 (P, T , E) P , T , E0, ES0, ET0Bias removal None None None NoneDown-scaling Dynamic None None None
data access rights and a variety of formats and refer-ence systems. EFAS was seen as a possibility to bridgegaps between the different communities for improvedinformation exchange on European level.
Following these needs, a prototype for EFAS was designedand tested in pre-operational mode, with regular requests forfeedback from end-users. The involvement of the end-usersin the design and content of the products ensured that theEFAS products were readily understood and accepted by thedifferent hydrological partner institutions, as well as moreeasily integrated into their forecasting practices.
3.3 Phase 3: Prototype development
3.3.1 Data input and collection
Observed input data
It was essential for EFAS to establish which data would cur-rently be available on a European scale for setting up, cal-ibrating and validating the hydrological model, as well aswhich real-time data would be available for daily calcula-tions of the initial conditions at the onset of the forecasts.
Thematic layers describing soil, land use, topography andthe river channel network are available at the European Com-mission Joint Research Centre (JRC). The JRC also holdsa meteorological database, hereafter referred to as JRC-MARS, with data from 1975 onwards, which is updateddaily. Through this database3 EFAS has access to meteoro-logical observations from about 2000 stations across Europe,either as station data or as data interpolated onto 50×50 kmgrids (Table 1). The station density varies greatly from coun-try to country, which can affect the quality of the model re-sults. Currently, the data are collected, quality-checked andtransformed into daily values for a 24-h period (6 a.m. to6 a.m.) before they are provided to users at the JRC, which
3Seehttp://mars.jrc.it/mars/About-us/AGRI4CAST
is usually with a 1–2 days delay. Until these data can be col-lected in real-time, in EFAS the 1–2 days gap between theavailability of observed meteorological data and the start ofthe flood simulations is filled using the most recent meteoro-logical forecast data.
Hydrological observations are currently available only ashistoric, not real-time, discharge time series. There is ahigher spatial coverage for the pilot river basins Elbe andDanube since data collection has focused on these areas. De-pending on the river basin and the authority concerned, 70%to 95% of the requested data could be collected for the setupof EFAS. Additional data was collected through the data-bank of the Global Data Runoff Centre4, direct contacts withthe water authorities, or public websites. In total, data fromabout 800 stations are now available for the time span 1990–2006, although not all stations have complete records for thefull 16 years.
Weather forecasting data
Weather forecasts are provided by the European Centre forMedium-Range Weather Forecasts (ECMWF, 10-day fore-casts, deterministic and ensemble prediction system) and bythe Deutsche Wetterdienst (DWD, 7-day forecasts, determin-istic only). They correspond to forecasted values of precip-itation, temperature and evaporation. Temporal and spatialresolutions of the different data sets are listed in Table 1.
3.3.2 The hydrological model
General description
The hydrological model used for EFAS is LISFLOOD. Themodel is a hybrid between a conceptual and a physicalrainfall-runoff model combined with a routing module in theriver channel. LISFLOOD has been specifically designed forlarge river catchments (de Roo, 1999; van der Knijff and de
4Seehttp://grdc.bafg.de
Hydrol. Earth Syst. Sci., 13, 125–140, 2009 www.hydrol-earth-syst-sci.net/13/125/2009/

J. Thielen et al.: EFAS – Concept and development 129
Roo, 2006). In particular, it makes use of data layers thatare available for the JRC at European scale, such as land use,soil type and texture, river network. These features make themodel particularly suited for EFAS and supported its imple-mentation in the forecasting system.
LISFLOOD simulates canopy and surface processes, soiland groundwater system processes and flow in the river chan-nel. In the following paragraphs only the key processes arebriefly described. A full description of LISFLOOD can befound in van der Knijff et al. (2008).
Canopy and surface:Snowmelt is simulated using a sim-ple degree-day factor method, also accounting for acceler-ated snowmelt when it rains (WMO, 1986; Speers and Ver-steeg, 1979). For the simulation of fast sub-surface flowthrough macro-pores (preferential flow), it is assumed thatthe fraction of the water on the soil surface contributing topreferential flow is a non-linear function of the relative satu-ration of the topsoil, and that the importance of preferentialflow increases as the topsoil gets wetter. For the remainingwater that falls on the soil surface, infiltration and surfacerunoff are simulated using the Xinanjiang approach (Zhaoand Liu, 1995; Todini, 1996).
Soil and groundwater system:The moisture fluxes out ofthe top- and subsoil are calculated assuming that the flow isentirely gravity-driven. The groundwater system is describedusing two parallel interconnected linear reservoirs, similar tothe HBV-96 model (Lindstrom et al., 1997). The upper zonerepresents a mix of fast groundwater and sub-surface flow,including flow through macro-pores. The lower zone has amuch slower response and generates the base-flow.
River channel:Routing of water through the river chan-nel can be simulated with the kinematic or the dynamic wavedescriptions (Chow, 1988). Special structures such as wa-ter reservoirs and retention areas or polders can be simulatedby giving their location, size and in- and outflow boundaryconditions.
Setup in EFAS
For EFAS, LISFLOOD is set up on a 5-km grid, and a 1-kmgrid for the Elbe and Danube pilot catchments. The 5-kmPan-European setup runs on a pre-operational basis twice aday, while the 1-km setup is used for research only. The tem-poral resolution used for the model simulations is variable.The calculation of the initial conditions is performed on adaily time step, while the forecasts based on the determinis-tic weather forecasts are run with a 1-h time-step, and thosebased on EPS with a 24-h time-step. Model parameters, oncedefined through optimisation procedures during calibration,remain fixed for each catchment throughout the simulationsperformed during forecasting. Model parameter uncertaintyand its impact on the simulated discharges is the topic of re-cent studies conducted under the EFAS project (Feyen et al.,2007, 2008). An automatic Bayesian parameter inference al-gorithm, based on Markov chain Monte Carlo methods, was
applied to calibrate the LISFLOOD model for the case-studyof the Meuse catchment. It was shown that parameter uncer-tainty bounds are relatively narrow and that uncertainty as-sessment could be improved by accounting for more accurateinput data errors. In EFAS, as the focus is on medium-rangeforecasting for early warning, the main part of uncertaintyin flood predictions at long lead times is assessed with theuse of EPS probabilistic forecasts. Future research aims atcontributing for a better knowledge of the total flood predic-tion limits, by assessing both uncertainties coming from thehydrologic model and from the weather predictions. In thispaper, when speaking about uncertainty and probabilities, theauthors refer mostly to the uncertainty arising from the inputdata, and EPS in particular.
Until now EFAS has had to work with limited amount ofhydrological data for calibration and validation, and entirelywithout information for reservoirs and lakes. Although thecollection of these data has increased with the increased par-ticipation of national water authorities to the EFAS project,detailed information is still not sufficient to serve as inputto the hydrological model. Consequently, the calibration ofthe LISFLOOD model in those river basins where the flowis highly influenced by hydropower or irrigation reservoirspresents some limitations. Model performance is thereforeexpected to be variable among the European river basins.
Overview on the performance of the hydrological model
In order to illustrate the influence of observed input data andmodel calibration in the quality of the hydrological modelsimulations, we show in Fig. 2 simulated and observed hy-drographs for eight river stations in Europe and for different2-year periods within the time period 1999–2007. The cur-rent parameter setup of the LISFLOOD model used in EFASis at the basis of these simulations. The hydrographs in Fig. 2show stations where the model performs well, together withstations where problems in reproducing discharge time seriesare encountered. For instance, it can be seen that dischargessimulated for the Danube river are too low comparatively toobserved discharges, which can be directly attributed to thelow density of rainfall stations in the Alps, resulting in toolow annual rainfalls. When comparing the annual total rain-falls from the available JRC-MARS station data with otherhigh resolution data sources, it was observed that the annualrainfall is underestimated with the JRC-MARS database byabout 20% in the Alps. The performance of EFAS at riverbasins located in the Alpine region is therefore expected tobe lower, at least until data collection, currently ongoing,and new parameter calibration will be able to partially cor-rect this bias. We note that although the simulations are notsatisfactory in terms of flow volume, the flood dynamics arewell captured by the model. Good results both in terms ofdynamics and quantity are achieved for most rivers acrossmid-latitude Europe, e.g. Loire, Seine (not shown), Meuse,Elbe, Weser and Odra (not shown).
www.hydrol-earth-syst-sci.net/13/125/2009/ Hydrol. Earth Syst. Sci., 13, 125–140, 2009

130 J. Thielen et al.: EFAS – Concept and development
1
Danube-Inn (Schaerding)
0500
10001500200025003000
12/31/99 6/30/00 12/31/00 6/30/01 12/31/01Date
m3/
s
Danube (Bratislava)
0
2000
4000
6000
8000
1/1/97 7/1/97 1/1/98 7/1/98 1/1/99Date
m3/
s
Rhine-Mosel (Cochem)
0500
1000150020002500
1/1/99 7/1/99 1/1/00 7/1/00 1/1/01Date
m3/
s
Rhine (Rees)
02000400060008000
1000012000
7/1/98 1/1/99 7/1/99 1/1/00 7/1/00Date
m3/
s
Meuse (Maaseik)
0500
10001500200025003000
1/1/94 7/1/94 1/1/95 7/1/95 1/1/96Date
m3/
s
Elbe(Usti nad Labem)
010002000300040005000
1/1/02 4/1/02 7/1/02 10/1/02 1/1/03Date
m3/
s
Ebro (Zaragoza)
0
500
1000
1500
2000
1/1/05 7/1/05 1/1/06 7/1/06 1/1/07Date
m3/
s
Loire (Nantes)
0100020003000400050006000
1/1/99 7/1/99 1/1/00 7/1/00 1/1/01Date
m3/
s
Figure 2. Simulated (grey lines) and observed (black lines) discharges in m3/s for
different river basins and different 2 year periods.
Fig. 2. Simulated (grey lines) and observed (black lines) discharges in m3/s for different river basins and different 2 year periods.
The variable performance of the hydrological model usedin EFAS in reproducing observed discharges is illustrated inFig. 3. It shows the Nash-Sutcliffe coefficient calculated for188 selected stations from different river basins across Eu-rope and different upstream areas for all periods where ob-servations were available at the station. The calculation ofthe Nash-Sutcliffe coefficients includes both validation andcalibration periods. The comparison between observed andsimulated hydrographs was done for the time period 1990–2006. More than half of the Nash-Sutcliff values are greaterthan 0.33, and 30% are greater than 0.66. Clearly, as couldbe expected from Fig. 2, those river basins strongly affected
by the Alps perform less well than those in flatter areas, asis also the case of those stations strongly affected by lakes,reservoirs and hydropower, e.g. in Scandinavia.
Case studies in the pilot river basins, for which detailedand higher resolution data was made available, have clearlydemonstrated the link between good quality input data andskill in model performance. Figure 4 shows an example forthe Elbe river basin at Dresden. It illustrates the differencein performance when using high resolution national data ascompared to low resolution data currently available in real-time for EFAS. One can see that LISFLOOD simulationsbased on high-resolution data compare quantitatively better
Hydrol. Earth Syst. Sci., 13, 125–140, 2009 www.hydrol-earth-syst-sci.net/13/125/2009/

J. Thielen et al.: EFAS – Concept and development 131
1
Figure 3: Nash-Sutcliffe calculated for 188 stations in trans-national river basins
(shaded) across Europe Fig. 3. Nash-Sutcliffe calculated for 188 stations in trans-nationalriver basins (shaded) across Europe.
with the observed discharges than the ones simulated withthe coarse rainfall network,. Considering that the maximumaverage uncertainty for river discharge measurements is of-ten assumed to be on the order of 8.5% (Pappenberger et al.,2006), and correspondingly more in the peak discharges, thesimulations can be considered very good in this flood eventcase-study. From Fig. 4, it can be seen that the timing of thepeak and the overall dynamics of the hydrographs are alsovery well represented.
In EFAS, special attention has been devoted to the qual-ity of the hydrological simulations, which is considered toplay an important role in the quality of the forecasts issuedin real-time flood forecasting. However, to assure the goodquality of all data necessary to perform hydrological simu-lations on a European scale is not an easy task. The clearrelationship between input data and model performance hasprompted the launch of two pan-European data collectionprojects in support of EFAS, called EU-FLOOD-GIS and theETN-R project. Both projects collect high-density historicand real-time meteorological and hydrological data neces-sary for flood forecasting and will become active by the be-ginning of 2009.
1
Figure 4. Hydrographs of observed discharge (solid, grey), simulated discharges
with JRC MARS data (dotted) and simulated discharges with National high-
resolution data (solid blue) at Dresden during the Elbe 2002 floods on a 5 km grid
(top) and a 1 km grid (bottom).
Fig. 4. Hydrographs of observed discharge (solid, grey),simulateddischarges with JRC MARS observed data (dotted) and simulateddischarges with National high-resolution data (solid blue) at Dres-den during the Elbe 2002 floods on a 5 km grid (top) and a 1 kmgrid (bottom).
3.3.3 Methodologies
Flood threshold exceedances
Simulated hydrographs, per se, do not constitute a flood fore-cast. In order to make a flood forecast, a decision-makingelement needs to be incorporated: is the discharge going toexceed a critical threshold or not? For the development of theEFAS prototype, the determination of the critical thresholdscould not be derived directly from observations.
This is firstly because information on steering rules forlakes, reservoirs, polders or any other measures are not yetavailable on European scale, and are unlikely to be availablein sufficient detail in the future. Thus EFAS treats the riverbasins as quasi-natural and observed critical thresholds maynot be compatible with simulated discharges. Furthermore,results have shown that the limited number of meteorolog-ical observations available for EFAS over Europe can leadto large discrepancies between model results and dischargeobservations, making quantitative comparison between sim-ulated discharges and observed thresholds problematic.
Secondly, EFAS uses the LISFLOOD model with a regulargrid structure, and critical values need to be determined atevery model grid point. As local critical values are generally
www.hydrol-earth-syst-sci.net/13/125/2009/ Hydrol. Earth Syst. Sci., 13, 125–140, 2009
132 J. Thielen et al.: EFAS – Concept and development
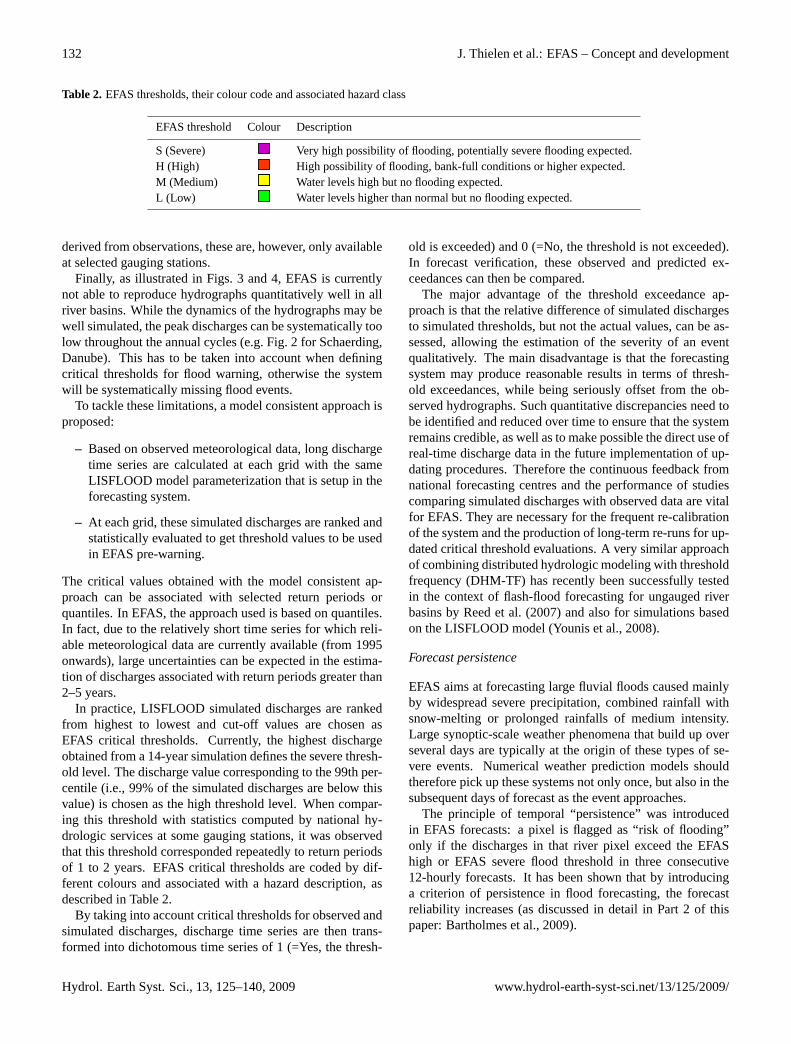
Table 2. EFAS thresholds, their colour code and associated hazard class
EFAS threshold Colour Description
S (Severe)
Table 2: EFAS thresholds, their colour code and associated hazard class
EFAS threshold
Colour Description
S (Severe)
Very high possibility of flooding, potentially
severe flooding expected.
H (High)
High possibility of flooding, bank-full conditions
or higher expected.
M (Medium)
Water levels high but no flooding expected.
L (Low)
Water levels higher than normal but no flooding
expected.
31
Very high possibility of flooding, potentially severe flooding expected.H (High)
Table 2: EFAS thresholds, their colour code and associated hazard class
EFAS threshold
Colour Description
S (Severe)
Very high possibility of flooding, potentially
severe flooding expected.
H (High)
High possibility of flooding, bank-full conditions
or higher expected.
M (Medium)
Water levels high but no flooding expected.
L (Low)
Water levels higher than normal but no flooding
expected.
31
High possibility of flooding, bank-full conditions or higher expected.M (Medium)
Table 2: EFAS thresholds, their colour code and associated hazard class
EFAS threshold
Colour Description
S (Severe)
Very high possibility of flooding, potentially
severe flooding expected.
H (High)
High possibility of flooding, bank-full conditions
or higher expected.
M (Medium)
Water levels high but no flooding expected.
L (Low)
Water levels higher than normal but no flooding
expected.
31
Water levels high but no flooding expected.L (Low)
Table 2: EFAS thresholds, their colour code and associated hazard class
EFAS threshold
Colour Description
S (Severe)
Very high possibility of flooding, potentially
severe flooding expected.
H (High)
High possibility of flooding, bank-full conditions
or higher expected.
M (Medium)
Water levels high but no flooding expected.
L (Low)
Water levels higher than normal but no flooding
expected.
31
Water levels higher than normal but no flooding expected.
derived from observations, these are, however, only availableat selected gauging stations.
Finally, as illustrated in Figs. 3 and 4, EFAS is currentlynot able to reproduce hydrographs quantitatively well in allriver basins. While the dynamics of the hydrographs may bewell simulated, the peak discharges can be systematically toolow throughout the annual cycles (e.g. Fig. 2 for Schaerding,Danube). This has to be taken into account when definingcritical thresholds for flood warning, otherwise the systemwill be systematically missing flood events.
To tackle these limitations, a model consistent approach isproposed:
– Based on observed meteorological data, long dischargetime series are calculated at each grid with the sameLISFLOOD model parameterization that is setup in theforecasting system.
– At each grid, these simulated discharges are ranked andstatistically evaluated to get threshold values to be usedin EFAS pre-warning.
The critical values obtained with the model consistent ap-proach can be associated with selected return periods orquantiles. In EFAS, the approach used is based on quantiles.In fact, due to the relatively short time series for which reli-able meteorological data are currently available (from 1995onwards), large uncertainties can be expected in the estima-tion of discharges associated with return periods greater than2–5 years.
In practice, LISFLOOD simulated discharges are rankedfrom highest to lowest and cut-off values are chosen asEFAS critical thresholds. Currently, the highest dischargeobtained from a 14-year simulation defines the severe thresh-old level. The discharge value corresponding to the 99th per-centile (i.e., 99% of the simulated discharges are below thisvalue) is chosen as the high threshold level. When compar-ing this threshold with statistics computed by national hy-drologic services at some gauging stations, it was observedthat this threshold corresponded repeatedly to return periodsof 1 to 2 years. EFAS critical thresholds are coded by dif-ferent colours and associated with a hazard description, asdescribed in Table 2.
By taking into account critical thresholds for observed andsimulated discharges, discharge time series are then trans-formed into dichotomous time series of 1 (=Yes, the thresh-
old is exceeded) and 0 (=No, the threshold is not exceeded).In forecast verification, these observed and predicted ex-ceedances can then be compared.
The major advantage of the threshold exceedance ap-proach is that the relative difference of simulated dischargesto simulated thresholds, but not the actual values, can be as-sessed, allowing the estimation of the severity of an eventqualitatively. The main disadvantage is that the forecastingsystem may produce reasonable results in terms of thresh-old exceedances, while being seriously offset from the ob-served hydrographs. Such quantitative discrepancies need tobe identified and reduced over time to ensure that the systemremains credible, as well as to make possible the direct use ofreal-time discharge data in the future implementation of up-dating procedures. Therefore the continuous feedback fromnational forecasting centres and the performance of studiescomparing simulated discharges with observed data are vitalfor EFAS. They are necessary for the frequent re-calibrationof the system and the production of long-term re-runs for up-dated critical threshold evaluations. A very similar approachof combining distributed hydrologic modeling with thresholdfrequency (DHM-TF) has recently been successfully testedin the context of flash-flood forecasting for ungauged riverbasins by Reed et al. (2007) and also for simulations basedon the LISFLOOD model (Younis et al., 2008).
Forecast persistence
EFAS aims at forecasting large fluvial floods caused mainlyby widespread severe precipitation, combined rainfall withsnow-melting or prolonged rainfalls of medium intensity.Large synoptic-scale weather phenomena that build up overseveral days are typically at the origin of these types of se-vere events. Numerical weather prediction models shouldtherefore pick up these systems not only once, but also in thesubsequent days of forecast as the event approaches.
The principle of temporal “persistence” was introducedin EFAS forecasts: a pixel is flagged as “risk of flooding”only if the discharges in that river pixel exceed the EFAShigh or EFAS severe flood threshold in three consecutive12-hourly forecasts. It has been shown that by introducinga criterion of persistence in flood forecasting, the forecastreliability increases (as discussed in detail in Part 2 of thispaper: Bartholmes et al., 2009).
Hydrol. Earth Syst. Sci., 13, 125–140, 2009 www.hydrol-earth-syst-sci.net/13/125/2009/
J. Thielen et al.: EFAS – Concept and development 133
1
Figure 5: Example of an EFAS threshold exceedance map based on deterministic forecasts
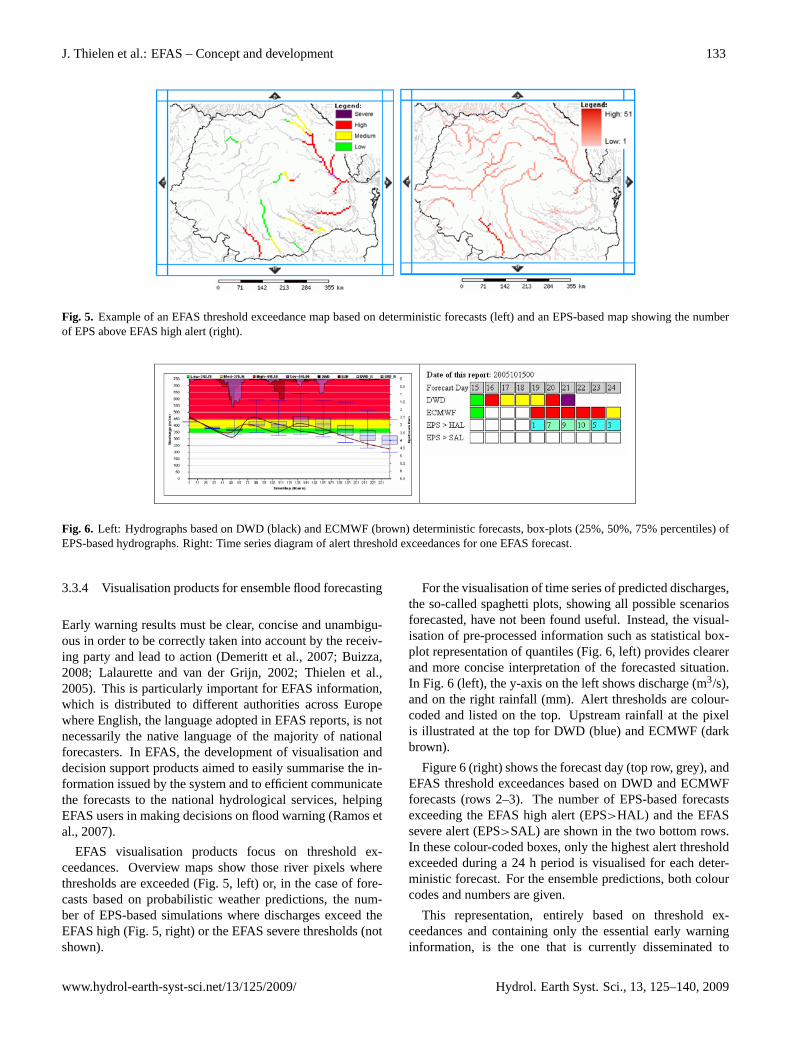
(left) and an EPS-based map showing the number of EPS above EFAS high alert (right). Fig. 5. Example of an EFAS threshold exceedance map based on deterministic forecasts (left) and an EPS-based map showing the numberof EPS above EFAS high alert (right).
1
Figure 6: Left: Hydrographs based on DWD (black) and ECMWF (brown)
deterministic forecasts, box-plots (25%, 50%, 75% percentiles) of EPS-based
hydrographs. Right: Time series diagram of alert threshold exceedances for one
EFAS forecast.
Fig. 6. Left: Hydrographs based on DWD (black) and ECMWF (brown) deterministic forecasts, box-plots (25%, 50%, 75% percentiles) ofEPS-based hydrographs. Right: Time series diagram of alert threshold exceedances for one EFAS forecast.
3.3.4 Visualisation products for ensemble flood forecasting
Early warning results must be clear, concise and unambigu-ous in order to be correctly taken into account by the receiv-ing party and lead to action (Demeritt et al., 2007; Buizza,2008; Lalaurette and van der Grijn, 2002; Thielen et al.,2005). This is particularly important for EFAS information,which is distributed to different authorities across Europewhere English, the language adopted in EFAS reports, is notnecessarily the native language of the majority of nationalforecasters. In EFAS, the development of visualisation anddecision support products aimed to easily summarise the in-formation issued by the system and to efficient communicatethe forecasts to the national hydrological services, helpingEFAS users in making decisions on flood warning (Ramos etal., 2007).
EFAS visualisation products focus on threshold ex-ceedances. Overview maps show those river pixels wherethresholds are exceeded (Fig. 5, left) or, in the case of fore-casts based on probabilistic weather predictions, the num-ber of EPS-based simulations where discharges exceed theEFAS high (Fig. 5, right) or the EFAS severe thresholds (notshown).
For the visualisation of time series of predicted discharges,the so-called spaghetti plots, showing all possible scenariosforecasted, have not been found useful. Instead, the visual-isation of pre-processed information such as statistical box-plot representation of quantiles (Fig. 6, left) provides clearerand more concise interpretation of the forecasted situation.In Fig. 6 (left), the y-axis on the left shows discharge (m3/s),and on the right rainfall (mm). Alert thresholds are colour-coded and listed on the top. Upstream rainfall at the pixelis illustrated at the top for DWD (blue) and ECMWF (darkbrown).
Figure 6 (right) shows the forecast day (top row, grey), andEFAS threshold exceedances based on DWD and ECMWFforecasts (rows 2–3). The number of EPS-based forecastsexceeding the EFAS high alert (EPS>HAL) and the EFASsevere alert (EPS>SAL) are shown in the two bottom rows.In these colour-coded boxes, only the highest alert thresholdexceeded during a 24 h period is visualised for each deter-ministic forecast. For the ensemble predictions, both colourcodes and numbers are given.
This representation, entirely based on threshold ex-ceedances and containing only the essential early warninginformation, is the one that is currently disseminated to
www.hydrol-earth-syst-sci.net/13/125/2009/ Hydrol. Earth Syst. Sci., 13, 125–140, 2009

134 J. Thielen et al.: EFAS – Concept and development
1
Figure 7: Persistence of EFAS threshold exceedances based on ECMWF
deterministic (top) and persistence of the number of EPS-based forecasts exceeding
the EFAS high threshold (bottom).
Fig. 7. Persistence of EFAS threshold exceedances based on ECMWF deterministic (top) and persistence of the number of EPS-basedforecasts exceeding the EFAS high threshold (bottom).
national forecasting centres. The quantification of uncer-tainty is intuitively represented (e.g., from Fig. 6, 10 out of51 EPS reach the EFAS high alert level on the forecast ap-plying to day 22), although, strictly speaking, not yet ex-pressed as probabilities, as all sources of errors in the cou-pled hydro-meteorological forecasting system are not fullyevaluated. Additionally, Gigerenzer (2002) argues that thecommunication of frequencies is generally easier understoodand less misleading than percentages.
Another advantage of the simplified colour-coded box rep-resentation is the easy visualisation of persistence of the fore-casts. This is illustrated in Fig. 7 for a case study of the2005 Danube floods in the Isar river (de Roo et al., 2006). Itshows EFAS forecasts from 14 August 2005 onwards basedon the 12:00 UTC weather forecasts from the deterministicECMWF forecasts (top) and the probabilistic EPS forecasts(bottom). At this station, threshold exceedances did takeplace on 22–24 August.
The forecasts based on ECMWF indicate a possibility offlooding for the first time on the 16th August, but the sig-nal becomes intermittent in the subsequent forecasts. The
forecasts based on the EPS, however, indicate that there is achance of flooding in this river quite early on (already fromthe 14th August) and with relatively good persistence.
Diagrams showing persistence in EFAS forecasts are oneof the most frequently used representations that the EFASforecasters consider in their analyses of the forecasting sit-uation. The have also been considered as very useful andinformative by the users of EFAS forecasts at the nationalforecasting centres.
3.4 Flood forecasts
EFAS forecasts run in real-time in order to: (a) test the ro-bustness of the system, and (b) enable decision-making inreal-time without the “a priori” knowledge of what has hap-pened. In particular in the context of probabilistic earlywarning information, it is important to know how much un-certainty is acceptable to practitioners in order to trigger ac-tions, even though the actions may only be of preparatory na-ture. In the development of EFAS, we considered that onlywhen exposed to EFAS forecasts in real-time and without a
Hydrol. Earth Syst. Sci., 13, 125–140, 2009 www.hydrol-earth-syst-sci.net/13/125/2009/
J. Thielen et al.: EFAS – Concept and development 135
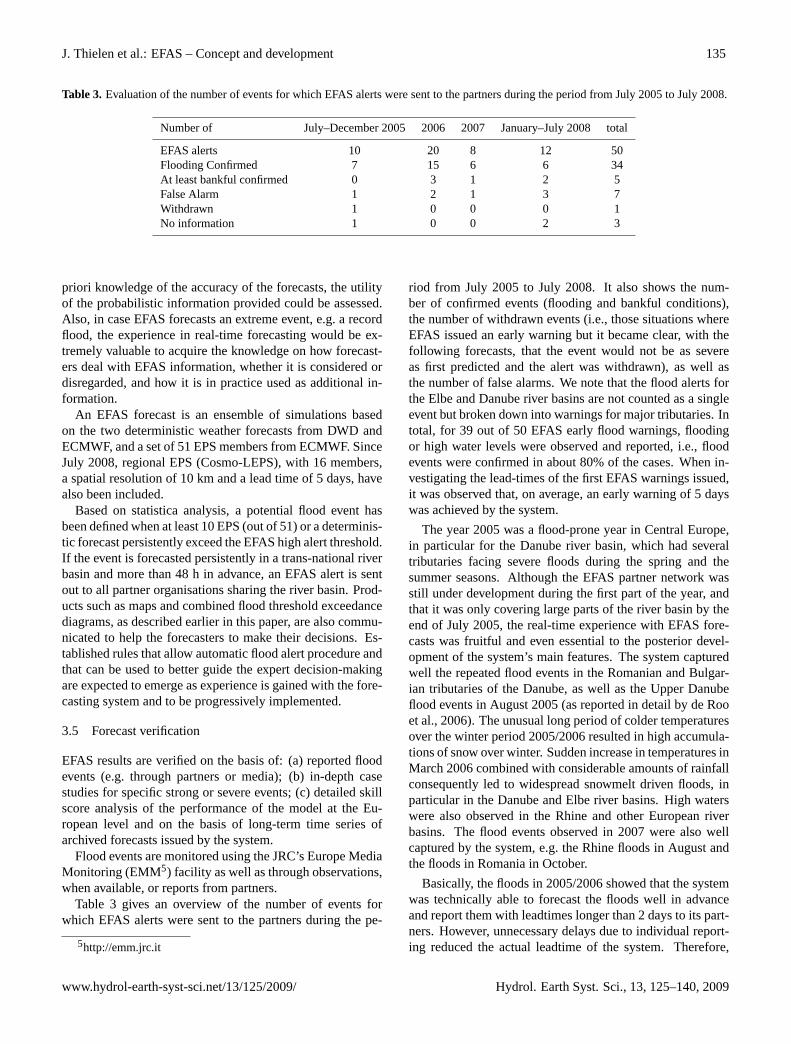
Table 3. Evaluation of the number of events for which EFAS alerts were sent to the partners during the period from July 2005 to July 2008.
Number of July–December 2005 2006 2007 January–July 2008 total
EFAS alerts 10 20 8 12 50Flooding Confirmed 7 15 6 6 34At least bankful confirmed 0 3 1 2 5False Alarm 1 2 1 3 7Withdrawn 1 0 0 0 1No information 1 0 0 2 3
priori knowledge of the accuracy of the forecasts, the utilityof the probabilistic information provided could be assessed.Also, in case EFAS forecasts an extreme event, e.g. a recordflood, the experience in real-time forecasting would be ex-tremely valuable to acquire the knowledge on how forecast-ers deal with EFAS information, whether it is considered ordisregarded, and how it is in practice used as additional in-formation.
An EFAS forecast is an ensemble of simulations basedon the two deterministic weather forecasts from DWD andECMWF, and a set of 51 EPS members from ECMWF. SinceJuly 2008, regional EPS (Cosmo-LEPS), with 16 members,a spatial resolution of 10 km and a lead time of 5 days, havealso been included.
Based on statistica analysis, a potential flood event hasbeen defined when at least 10 EPS (out of 51) or a determinis-tic forecast persistently exceed the EFAS high alert threshold.If the event is forecasted persistently in a trans-national riverbasin and more than 48 h in advance, an EFAS alert is sentout to all partner organisations sharing the river basin. Prod-ucts such as maps and combined flood threshold exceedancediagrams, as described earlier in this paper, are also commu-nicated to help the forecasters to make their decisions. Es-tablished rules that allow automatic flood alert procedure andthat can be used to better guide the expert decision-makingare expected to emerge as experience is gained with the fore-casting system and to be progressively implemented.
3.5 Forecast verification
EFAS results are verified on the basis of: (a) reported floodevents (e.g. through partners or media); (b) in-depth casestudies for specific strong or severe events; (c) detailed skillscore analysis of the performance of the model at the Eu-ropean level and on the basis of long-term time series ofarchived forecasts issued by the system.
Flood events are monitored using the JRC’s Europe MediaMonitoring (EMM5) facility as well as through observations,when available, or reports from partners.
Table 3 gives an overview of the number of events forwhich EFAS alerts were sent to the partners during the pe-
5http://emm.jrc.it
riod from July 2005 to July 2008. It also shows the num-ber of confirmed events (flooding and bankful conditions),the number of withdrawn events (i.e., those situations whereEFAS issued an early warning but it became clear, with thefollowing forecasts, that the event would not be as severeas first predicted and the alert was withdrawn), as well asthe number of false alarms. We note that the flood alerts forthe Elbe and Danube river basins are not counted as a singleevent but broken down into warnings for major tributaries. Intotal, for 39 out of 50 EFAS early flood warnings, floodingor high water levels were observed and reported, i.e., floodevents were confirmed in about 80% of the cases. When in-vestigating the lead-times of the first EFAS warnings issued,it was observed that, on average, an early warning of 5 dayswas achieved by the system.
The year 2005 was a flood-prone year in Central Europe,in particular for the Danube river basin, which had severaltributaries facing severe floods during the spring and thesummer seasons. Although the EFAS partner network wasstill under development during the first part of the year, andthat it was only covering large parts of the river basin by theend of July 2005, the real-time experience with EFAS fore-casts was fruitful and even essential to the posterior devel-opment of the system’s main features. The system capturedwell the repeated flood events in the Romanian and Bulgar-ian tributaries of the Danube, as well as the Upper Danubeflood events in August 2005 (as reported in detail by de Rooet al., 2006). The unusual long period of colder temperaturesover the winter period 2005/2006 resulted in high accumula-tions of snow over winter. Sudden increase in temperatures inMarch 2006 combined with considerable amounts of rainfallconsequently led to widespread snowmelt driven floods, inparticular in the Danube and Elbe river basins. High waterswere also observed in the Rhine and other European riverbasins. The flood events observed in 2007 were also wellcaptured by the system, e.g. the Rhine floods in August andthe floods in Romania in October.
Basically, the floods in 2005/2006 showed that the systemwas technically able to forecast the floods well in advanceand report them with leadtimes longer than 2 days to its part-ners. However, unnecessary delays due to individual report-ing reduced the actual leadtime of the system. Therefore,
www.hydrol-earth-syst-sci.net/13/125/2009/ Hydrol. Earth Syst. Sci., 13, 125–140, 2009
136 J. Thielen et al.: EFAS – Concept and development
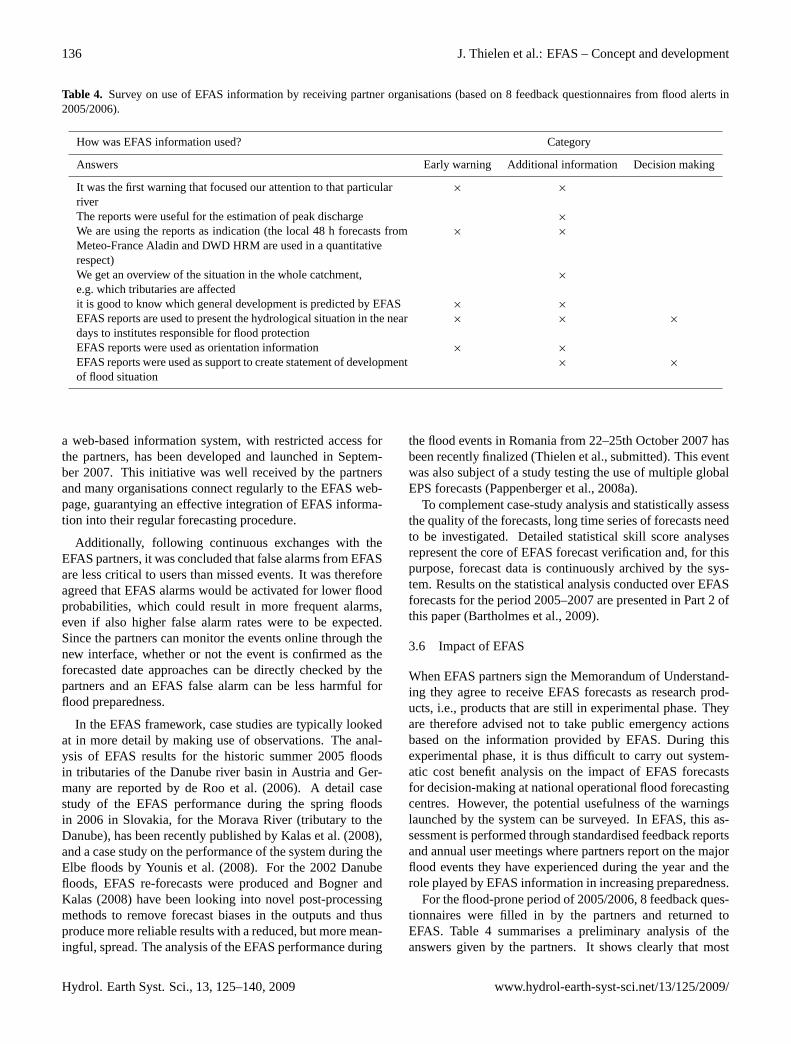
Table 4. Survey on use of EFAS information by receiving partner organisations (based on 8 feedback questionnaires from flood alerts in2005/2006).
How was EFAS information used? Category
Answers Early warning Additional information Decision making
It was the first warning that focused our attention to that particularriver
× ×
The reports were useful for the estimation of peak discharge ×
We are using the reports as indication (the local 48 h forecasts fromMeteo-France Aladin and DWD HRM are used in a quantitativerespect)
× ×
We get an overview of the situation in the whole catchment,e.g. which tributaries are affected
×
it is good to know which general development is predicted by EFAS × ×
EFAS reports are used to present the hydrological situation in the neardays to institutes responsible for flood protection
× × ×
EFAS reports were used as orientation information × ×
EFAS reports were used as support to create statement of developmentof flood situation
× ×
a web-based information system, with restricted access forthe partners, has been developed and launched in Septem-ber 2007. This initiative was well received by the partnersand many organisations connect regularly to the EFAS web-page, guarantying an effective integration of EFAS informa-tion into their regular forecasting procedure.
Additionally, following continuous exchanges with theEFAS partners, it was concluded that false alarms from EFASare less critical to users than missed events. It was thereforeagreed that EFAS alarms would be activated for lower floodprobabilities, which could result in more frequent alarms,even if also higher false alarm rates were to be expected.Since the partners can monitor the events online through thenew interface, whether or not the event is confirmed as theforecasted date approaches can be directly checked by thepartners and an EFAS false alarm can be less harmful forflood preparedness.
In the EFAS framework, case studies are typically lookedat in more detail by making use of observations. The anal-ysis of EFAS results for the historic summer 2005 floodsin tributaries of the Danube river basin in Austria and Ger-many are reported by de Roo et al. (2006). A detail casestudy of the EFAS performance during the spring floodsin 2006 in Slovakia, for the Morava River (tributary to theDanube), has been recently published by Kalas et al. (2008),and a case study on the performance of the system during theElbe floods by Younis et al. (2008). For the 2002 Danubefloods, EFAS re-forecasts were produced and Bogner andKalas (2008) have been looking into novel post-processingmethods to remove forecast biases in the outputs and thusproduce more reliable results with a reduced, but more mean-ingful, spread. The analysis of the EFAS performance during
the flood events in Romania from 22–25th October 2007 hasbeen recently finalized (Thielen et al., submitted). This eventwas also subject of a study testing the use of multiple globalEPS forecasts (Pappenberger et al., 2008a).
To complement case-study analysis and statistically assessthe quality of the forecasts, long time series of forecasts needto be investigated. Detailed statistical skill score analysesrepresent the core of EFAS forecast verification and, for thispurpose, forecast data is continuously archived by the sys-tem. Results on the statistical analysis conducted over EFASforecasts for the period 2005–2007 are presented in Part 2 ofthis paper (Bartholmes et al., 2009).
3.6 Impact of EFAS
When EFAS partners sign the Memorandum of Understand-ing they agree to receive EFAS forecasts as research prod-ucts, i.e., products that are still in experimental phase. Theyare therefore advised not to take public emergency actionsbased on the information provided by EFAS. During thisexperimental phase, it is thus difficult to carry out system-atic cost benefit analysis on the impact of EFAS forecastsfor decision-making at national operational flood forecastingcentres. However, the potential usefulness of the warningslaunched by the system can be surveyed. In EFAS, this as-sessment is performed through standardised feedback reportsand annual user meetings where partners report on the majorflood events they have experienced during the year and therole played by EFAS information in increasing preparedness.
For the flood-prone period of 2005/2006, 8 feedback ques-tionnaires were filled in by the partners and returned toEFAS. Table 4 summarises a preliminary analysis of theanswers given by the partners. It shows clearly that most
Hydrol. Earth Syst. Sci., 13, 125–140, 2009 www.hydrol-earth-syst-sci.net/13/125/2009/

J. Thielen et al.: EFAS – Concept and development 137
partners find EFAS information useful, which was also con-firmed by discussions during the annual meetings. Answerson how the EFAS information reports were used in practicewere interpreted according to three categories: early warn-ing, additional information and decision making. In gen-eral, EFAS results are well perceived by all partners as addi-tional information, contributing to early warning of upcom-ing floods. A few partners stated that the information wasused for actual decision making. In one reported case, anational flood warning was even issued earlier on the basisof EFAS results. In most cases, however, the informationis used to discuss and evaluate the current situation, checkother data sources and to reschedule working shifts, for ex-ample, during weekends. In some cases, EFAS informationwas also incorporated into communications with local civilprotection agencies. Not all partners have access to the sameweather forecasts incorporated into EFAS and therefore ben-efit from the additional information for comparison with theirlocal source information. Many partners reported that it isparticularly useful to have information on potential floodingin neighbouring catchments and countries. The feedback re-ceived from partners is in general very encouraging for thedevelopment of EFAS and has helped in improving the sys-tem towards its main goals (Thielen, 2006).
3.7 Communication platform
A well established communication platform is crucial for aforecasting system operating on river basins shared by differ-ent autonomous administrations. The EFAS communicationplatform is designed to disseminate results on different lev-els to EFAS partners and to the public and, equally, to receivefeedback from the partners on products and actions taken.
– EFAS partners consist of experts from national hydro-logical and meteorological services that have agreedto join the EFAS network through the ratification ofa Memorandum of Understanding (MoU). MoU’s en-sure that EFAS results are understood as preliminary re-search results by the forecasting experts and not as of-ficial warnings. Figure 8 shows the trans-national riverbasins for which at least one EFAS partner organisationcurrently exists or a MoU is being drafted.
– Except for real-time flood forecasting reports, which aredistributed only to EFAS partners, EFAS information ismade public in the form of bulletins, scientific commu-nications, publications and reports, which are availableathttp://efas.jrc.it.
– Feedback from partners to EFAS is captured during an-nual meetings, feedback forms, and general email ex-change. In certain occasions a particular form of feed-back engages when EFAS has issued an early floodwarning and is contacted directly by the receiving part-ner for more information or an exchange of information.
1
Figure 8: River basins for which a designated EFAS partner organisation exists or is under
negotiation. (Status: December 2007)
Fig. 8. River basins for which a designated EFAS partner organisa-tion exists or is under negotiation. (Status: December 2007).
4 Summary and way forward (Phases 4 and 5)
This paper presented the development of the European FloodAlert System (EFAS). EFAS aims at providing early warn-ing information for floods in Europe with lead-times up to10 days on the basis of combined deterministic and proba-bilistic weather information. The development of EFAS fol-lowed several stages, starting at a scientific feasibility study,followed by the exploration of the needs of end-users, andfinally the development of the system, its products and com-munication platform. Continuous verification of the modelresults is an essential part of the system and intense researchefforts have been put into it. A detailed analysis of theskill of EFAS forecasts is described in Part 2 of this paper(Bartholmes et al., 2009).
The core of EFAS consists of a grid-based distributed hy-drological rainfall-runoff model with a routing componentthat is capable of simulating hydrological processes in largeriver basins. This model is fed with several medium-rangeweather forecasts, including full sets of Ensemble PredictionSystem (EPS). The multi-streamflow output is analysed andvisualised through concise and easy to understand productsdeveloped together with users to be complementary to in-formation already produced by local water authorities. Acommunication strategy and platform was also developed.
www.hydrol-earth-syst-sci.net/13/125/2009/ Hydrol. Earth Syst. Sci., 13, 125–140, 2009
138 J. Thielen et al.: EFAS – Concept and development
It allows interactive exchange with different EFAS part-ners and national stakeholders, including meteorological dataproviders and national water authorities.
Through the creation of the communication network, an-other important component of the system could be more eas-ily approached: the streamflow data collection and storage.This is a necessary step to calibrate the hydrological modeland to determine the initial conditions at the start of the floodforecasts. Since the implementation of the first prototype ofthe system, new projects have been launched to collect moredata and contribute to progress in the development of the sys-tem.
In the future, the system will also incorporate new weatherforecast data, particularly ensemble predictions with higherresolutions and longer leadtimes (see for example Tibaldi etal., 2006 and Buizza et al., 2007). The aim is to continu-ously test, together with EFAS partners, the additional valueof these state-of-the-art meteorology products for operationalflood forecasting.
The first EFAS prototype has been running pre-operationally since 2005 and its results have been analyzedin order to assess the average performance of the system indetecting potential flood events and its capabilities to com-plement Member States’ activities. The transfer from a re-search pre-operational tool to a fully operational system willbe explored in the near future.
Once fully developed and tested, EFAS will not only pro-vide early flood alert information to the national hydrologicalforecasting services, but it will also represent a powerful toolfor the European Commission and the Member States’ au-thorities for monitoring hydrological conditions across Eu-rope, analysing climatology and trends over the past yearsbased on a consistent and homogeneous platform, as wellas for forecasting possible future trends when coupled withseasonal forecasts and climate change model outputs. Fur-thermore, because of the trans-boundary nature of the EFASsimulations, it could be anticipated that exchange of floodforecasting experiences, data and research practices wouldbe favoured within the platform.
It is expected that by 2010 EFAS has matured to a fullyoperational system that can be transferred to an operationalentity. An important part of this process will be the establish-ment of unique European databases for hydrological and me-teorological data relevant for flood forecasting (EU-FLOOD-GIS and ETN-R).
EFAS is currently one of the few (pre)operational floodwarning systems worldwide making use of ensemble predic-tion systems to increase the predictability of floods. There isevidence that the project has contributed on a whole to ac-celerate the adoption of an ensemble hydrological predictionapproach also in national and regional flood forecasting sys-tems in Europe.
Acknowledgements.The authors gratefully acknowledge thesupport of all staff of the DG JRC’s Institute for Environment andSustainability (IES) – FLOODS action, and the IT support of theInstitute’s Land Management and Natural Hazard Unit. Particularthanks are expressed to the authorities of those countries that pro-vided detached national experts to the DG JRC for the developmentof the EFAS prototype (i.e. Austria, Czech Republic, Germany,Hungary and Slovakia). The authors also wish to thank the GermanWeather Service, the European Centre for Medium-Range WeatherForecasts, and the JRC’s Institute for Protection and Security ofthe Citizen (IPSC) for providing data. Finally all EFAS partnerorganizations must be thanked for their interest, active supportand feed-back without which the development of the systemwould not have been successful. J. Younis and B. Pannemans arethanked for for providing material for this paper, F. Pappenbergerand N. McCormick for reviewing this manuscript. For theirfinancial support the authors thank the European Parliament, DGEnvironment and DG Enterprise.
Edited by: L. Pfister
References
Bakker, M. H. N.: Transboundary river floods: vulnerability ofcontinents, international river basins and countries. Ph.D Disser-tation, Oregon State University, 276http://hdl.handle.net/1957/3821, 2007.
Bartholmes, J. and Todini, E.: Coupling meteorological and hydro-logical models for flood forecasting, Hydrol. Earth Syst. Sci., 9,333–346, 2005,http://www.hydrol-earth-syst-sci.net/9/333/2005/.
Bartholmes, J. C., Thielen, J., Ramos, M. H., and Gentilini, S.: TheEuropean Flood Alert System EFAS - Part 2: Statistical skill as-sessment of probabilistic and deterministic operational forecasts,Hydrol. Earth Syst. Sci., 13, 141–153, 2009,http://www.hydrol-earth-syst-sci.net/13/141/2009/.
Bogner, K. and Kalas, M.: Error correction methods and evaluationof an ensemble based hydrological forecasting system for the Up-per Danube catchment, Atmos. Sci. Lett., 9, 95–102, 2008.
Brazdil, R., Pfister, C., Wanner, H., von Storch, H., and Luterbacher,J.: Historical climatology in Europe – The state of the art, Clim.Change, 70, 363–430, 2005.
Buizza, R., Bidlot, J.-R., Wedi, N., Fuentes, M., Hamrud, M., Holt,G., and Vitart, F.: The new ECMWF VAREPS, Q. J. Roy. Mete-orol. Soc., 133, 681–695, 2007.
Buizza, R.: The value of probabilistic prediction, Atmos. Sci. Lett.,9, 36–42, 2008.
Buizza, R., Hollingsworth, A., Lalaurette F., and Ghelli, A.: Proba-bilistic Predictions of Precipitation Using the ECMWF EnsemblePrediction System, Weather and Forecasting, 14, 168–189, 1999.
Chow, V. T., Maidment, D. R., and Mays, L. M.: Applied Hydrol-ogy, McGraw-Hill, Singapore, p. 572, 1988.
De Roo, A., Gouweleeuw, B., Thielen, J., Bates, P., Hollingsworth,A., et al.: Development of a European Flood Forecasting System,International Journal of River Basin Management, 1(1), 49–59,2003.
De Roo, A.: LISFLOOD: a rainfall-runoff model for large riverbasins to assess the influence of land use changes on flood risk,in: Ribamod: river basin modelling, management and flood mit-
Hydrol. Earth Syst. Sci., 13, 125–140, 2009 www.hydrol-earth-syst-sci.net/13/125/2009/
J. Thielen et al.: EFAS – Concept and development 139
igation, edited by: Balabanis, P., Concerted action, EuropeanCommission, EUR 18287 EN, 349–357, 1999.
De Roo, A., Ramos, M. H., Thielen, J., Franchello, G., Bartholmes,J., Wachter, K., Niemeyer, S., Kalas, M., Laguardia, G., and vander Kniff, J.: The Alpine floods of August 2005, What did EFASforecast, what was observed, which feedback was received fromend-users? EFAS Post-event summary report, European Com-mission, EUR 22154 EN, p. 94, 2006.
Demeritt, D., Cloke, H., Pappenberger, F., Thielen, J., Bartholmes,J., and Ramos, M. H.: Ensemble Prediction and perception ofrisk, uncertainty and error in flood forecasting, EnvironmentalHazards, 7, 115–127, 2007.
EEA, European Environment Agency: Mapping the impacts of re-cent natural disasters and technological accidents in Europe, En-vironmental issue report No. 35, European Environment Agency,Copenhagen, p. 47, 2003.
Feyen, L., Vrugt, J. A.,O Nuallainc, B., van der Knijff, J., and deRoo, A.: Parameter optimisation and uncertainty assessment forlarge-scale streamflow simulation with the LISFLOOD model, J.Hydrol., 332(3–4), 276–289, 2007.
Feyen, L., Kalas, M., and Vrugt, J. A.: Semi-distributed parameteroptimization and uncertainty assessment for large-scale stream-flow simulation using global optimization, Hydrol. Sci. J., 53(2),293–308, 2008.
Franz, K., Ajami, N., Schaake, J., and Buizza, R.: HydrologicEnsemble Prediction Experiment Focuses on Reliable Forecasts,Eos, 86(25), AGU, 2005.
Gigerenzer, G.: Calculated risk. How to know when numbers de-ceive you, Simon and Schuster, New York, p. 310, 2002.
Goubanova, K. and Li, L.: Extremes in temperature and precipi-tation around the Mediterranean basin in an ensemble of futureclimate scenarios simulations, Global Planet. Change, 57, 27–42,2007.
Gouweleeuw, B., Reggiani, P., and De Roo, A.: A European FloodForecasting System EFFS. Full Report, European Report EUR21208, EC DG JRC & WL Delft Hydraulics, p. 304, 2004.
Gouweleeuw, B. T., Thielen, J., Franchello, G., De Roo, A. P. J., andBuizza, R.: Flood forecasting using medium-range probabilisticweather prediction, Hydrol. Earth Syst. Sci., 9, 365–380, 2005,http://www.hydrol-earth-syst-sci.net/9/365/2005/.
Hamill, T., Clark, M., Schaake, J., and Buizza, R.: 2nd HEPEXWorkshop Summary Report, Boulder, Colorado.http://hydis8.eng.uci.edu/hepex/scndwksp/HEPEX05-Summary.pdf, 2005.
ICPDR, International Commission for the Protection of the DanubeRiver Basin: Flooding fears return to the Danube, Danube Watch,2, 14–15, 2006.
Kalas, M., Ramos, M. H., Thielen J., and Babiakova, G.: Evaluationof the medium-range European flood forecasts for the March–April 2006 flood in the Morava River, Journal of Hydrology andHydromechanics, 56(2), 116–132, 2008.
Kowalski-Trakofler, K. M., Vaught, C., and Scharf, T.: Judgmentand decision making under stress: an overview for emergencymanagers, Int. J. Emergency Management, 1(3), 278–289, 2003.
Kwadijk, J.: EFFS - European Flood Forecasting System, Finalreport of Contract EVG1-CT-1999-00011 (http://effs.wldelft.nl),2003.
Lalaurette, F. and van der Grijn, G.: Ensemble forecasts: can theyprovide useful early warnings? ECMWF Newsletter 96, 10–18,Winter 2002/2003, 2002.
Lehner, B., Doll, P., Alcamo, J., Henrichs, T., and Kaspar, F.: Es-timating the impact of global change on flood and drought risksin Europe: a continental, integrated analysis, Clim. Change, 75,273–299, 2006.
Lindstrom, G., Johansson, B., Persson, M., Gardelin, M., andBergstrom, S.: Development and test of the distributed HBV-96hydrological model, J. Hydrol., 201, 272–288, 1997.
Marsigli, C., Montani, A., Nerozzi, F., Paccagnella, T., Tibaldi, S.,Molteni, F., and Buizza, R.: A strategy for high-resolution en-semble prediction, II: Limited-area experiments in four Alpineflood events, Q. J. Roy. Meteorol. Soc., 127, 2095–2115, 2001.
Marsigli, C., Boccanera, F., Montani, A., and Paccagnella, T.: TheCOSMO-LEPS mesoscale ensemble system: validation of themethodology and verification, Nonlin. Processes Geophys., 12,527–536, 2005,http://www.nonlin-processes-geophys.net/12/527/2005/.
Milly, P. C. D., Wetherald, R. T., Dunne, K. A., and Delworth, T.L.: Increasing risk of great floods in a changing climate, Nature,415, 514–517, 2002.
Molteni, F., Buizza, R., Palmer, T. N., and Petroliagis, T.: TheECMWF ensemble prediction system: methodology and valida-tion, Q. J. Roy. Meteorol. Soc., 122, 73–119, 1996.
Palmer, T. N. and Raisanen, J.: Quantifying the risk of extremeseasonal precipitation events in a changing climate, Nature, 415,512–514, 2002.Pappenberger, F., Matgen, P., Beven, K. J., Henry, J.-B., Pfister,L., and Fraipont, P.: Influence of uncertain boundary conditionsand model structure on flood inundation predictions, Adv. WaterResour., 29(10), 1430–1449, 2006.
Pappenberger, F., Bartholmes, J., Thielen, J., Cloke, H., Buizza, R.,and de Roo, A.: New dimensions in early flood warning acrossthe globe using grand-ensemble weather predictions, Geophys.Res. Lett., 35, L10404, doi:10.1029/2008GL033837, 2008a.
Pappenberger F., Scipal, K., and Buizza, R.: Hydrological as-pects of meteorological verification, Atmos. Sci. Lett., 9, 43–52,2008b.
Paton, D. and Flin, R.: Disaster Stress: an emergency managementperspective, Disaster Prevention and Management, 8(4), 261–267, 1999.
Reed, S., Schaake, J., and Zhang, Z.: A distributed hydrologicmodel and threshold frequency based method for flash flood fore-casting at ungauged locations, J. Hydrol., 337(3–4), 402–420,2007.
Ramos, M. H., Bartholmes, J., and Thielen-del Pozo, J.: Develop-ment of decision support products based on ensemble weatherforecasts in the European Flood Alert System, Atmos. Sci. Lett.,8, 113–119, 2007.
Roulin, E.: Skill and relative economic value of medium-range hy-drological ensemble predictions, Hydrol. Earth Syst. Sci., 11,725–737, 2007,http://www.hydrol-earth-syst-sci.net/11/725/2007/.
Schaake, J., Franz, K., Bradley, A., and Buizza, R.: The HydrologicEnsemble Prediction EXperiment (HEPEX), Hydrol. Earth Syst.Sci. Discuss., 3, 3321–3332, 2006,http://www.hydrol-earth-syst-sci-discuss.net/3/3321/2006/.
Schaake, J. C., Hamill, T. M. , Buizza, R., and Clark, M.: HEPEX,the Hydrological Ensemble Prediction Experiment, B. Am. Me-teor. Soc., 88(10), 1541–1547, 2007.
Speers, D. D. and Versteeg, J. D.: Runoff forecasting for reservoir
www.hydrol-earth-syst-sci.net/13/125/2009/ Hydrol. Earth Syst. Sci., 13, 125–140, 2009

140 J. Thielen et al.: EFAS – Concept and development
operations – the past and the future. In Proceedings 52nd WesternSnow Conference, 149–156, 1979.
Tibaldi, S., Paccagnella, T., Marsigli, C., Montani, A., and Nerozzi,F.: Limited-Area Ensemble Forecasting: the COSMO-LEPSSystem, Predictabilty of Weather and Climate, CAMBRIDGEUniversity Press, 2006.
Thielen, J., de Roo, A., and Schmuck, G.: First LIS-FLOOD ALERT workshop – practical benefit from Eu-ropean research, http://efas.jrc.it/workshop2003/reports/Summary-Report-1stEFAS-ws.pdf, 2003.
Thielen, J., Ramos, M. H., Bartholmes, J., De Roo, A., Cloke,H., Pappenberger, F., and Demeritt, D.: Summary report of the1st EFAS workshop on the use of Ensemble Prediction Sys-tem in flood forecasting, 21–22nd November 2005, Ispra. Eu-ropean Commission, Report, EUR 22118 EN (http://efas.jrc.it/workshop2005/index.html), p. 23, 2005.
Thielen, J.: The benefit of probabilistic flood forecasting on Eu-ropean scale – Results of the European Flood Alert System for2005/2006; European Commission, EUR 22560 EN, (http://efas.jrc.ec.europa.eu/downloads/efas2005-2006EUR22560EN.pdf),2006.
Thielen, J., Bartholmes, J., and Schaake, J.: 3rf HEPEXworkshop, Book of Abstracts, European Commission, Re-port, EUR22861 EN,http://hydis8.eng.uci.edu/hepex/thrdwksp/thrdwksp.html, 2007.
Thielen, J., Schaake, J., Hartman, R., and Buizza, R.: Aims, chal-lenges and progress of the Hydrological Ensemble Prediction Ex-periment (HEPEX) following the third HEPEX workshop held inStresa 27 to 29 June 2007, Atmos. Sci. Lett., 9, 29-35, 2008.
Tracton, M. S. and Kalnay E.: Operational ensemble prediction atthe National Meteorological Center: Practical aspects, WeatherForecasting, 8, 379–398, 1993.
Todini, E.: The ARNO rainfall-runoff model, J. Hydrol., 175, 339–382. 1996
Toothill, J.: Central European Flooding August 2002, Technical Re-port EQECAT, ABS Consulting, 2002, 21 pp., 2002.
Van Der Knijff, J. and De Roo, A.: LISFLOOD – distributed waterbalance and flood simulation model, User manual (version De-cember 2005), European Commission, EN22166, p. 80, 2006.
Van der Knijff, J. M., Younis, J., and de Roo, A. P. J.: LISFLOOD:a GIS-based distributed model for river basin scale water balanceand flood simulation, Int. J. Geographical Information Science,1–24 November, 2008.
World Meteorological Organization: Intercomparison of models ofsnowmelt runoff, Operational Hydrology Report No. 23, 1986
Yiou, P., Ribereau, P., Naveau, P., Nogaj, M., and Brazdil, R.: Sta-tistical analysis of floods in Bohemia (Czech Republic) since1825, Hydrol. Sci. J., 51(5), 930–945, 2006.
Younis, J., Ramos, M.-H., and Thielen J.: EFAS forecasts for theMarch–April 2006 flood in the Czech part of the Elbe RiverBasin – a case study, Atmos. Sci. Lett., 9, 88–94, 2008.
Younis, J., Anquetin, S., and Thielen, J.: The benefit of high-resolution operational weather forecasts for flash flood warning,Hydrol. Earth Syst. Sci., 12, 1039–1051, 2008,http://www.hydrol-earth-syst-sci.net/12/1039/2008/.
Zhao, R. J. and Liu, X. R.: The Xinanjiang model, in: ComputerModels of Watershed Hydrology, edited by: Singh, V. P., 215–232, 1995.
Hydrol. Earth Syst. Sci., 13, 125–140, 2009 www.hydrol-earth-syst-sci.net/13/125/2009/