Subsurface Characterization Using Electrical Resistivity ...
The electrical resistivity structure of the The electrical resistivity structure of the Southern Main Ethiopian Rift (around Southern Main Ethiopian Rift (around the Lake Abaya geothermal prospect) the Lake Abaya geothermal prospect) revealed by magnetorevealed by magneto--telluric imagingtelluric imaging
MohammednurMohammednur DesissaDesissa and and YohanesYohanes LemaLemaGeological Survey of Ethiopia, P.O.Box 2302, Addis Ababa, EthioGeological Survey of Ethiopia, P.O.Box 2302, Addis Ababa, Ethiopiapia
EE--mail mail [email protected]@yahoo.comSlide 1

ContentsAcknowledgement1. Introduction2. Geological and tectonic settings3. Statement of the problem4. Survey objectives5. Methodology7. Data processing and presentation8. Modeling and interpretation9. Discussion10. Conclusions 11. Recommendations
Slide 2

Acknowledgements
We thank the National Environment Research Council (NERC) geophysical
equipment facility of the University of Edinburgh (UK), for permission to use the
MT equipment. Our thanks also goes to Prof. Kathy A. Whaler and Dr. Sophie
Hautot for their help all the way through.
At last but not least, our heart felt thanks goes to Ato Alemayehu Tegenu, minister
of Mines and Energy and Dr. Meseret Teklemariam for facilitating the field work.
Slide 3

.
.1. INTRODUCTION
BackgroundThe Ethiopian Rift (ER), which is part of the East African Rift System
(EARS), covers about 150,000 sq.km (i.e, nearly 15% of the country). In
the Ethiopian rift geothermal explorations have been carried out since
1969 involving national and international survey organizations. Previous
studies delineated more than 16 geothermal potential areas with an
estimated energy potential of around 1000MWe.
The present study area is located at the southern part of the Main
Ethiopian Rift (MER), bounded between 37053’-38015’ longitudes and
6035’- 7000’ latitudes (about 500km south of Addis Ababa). The field study
was done between 4th – 25th April 2006. Slide 4
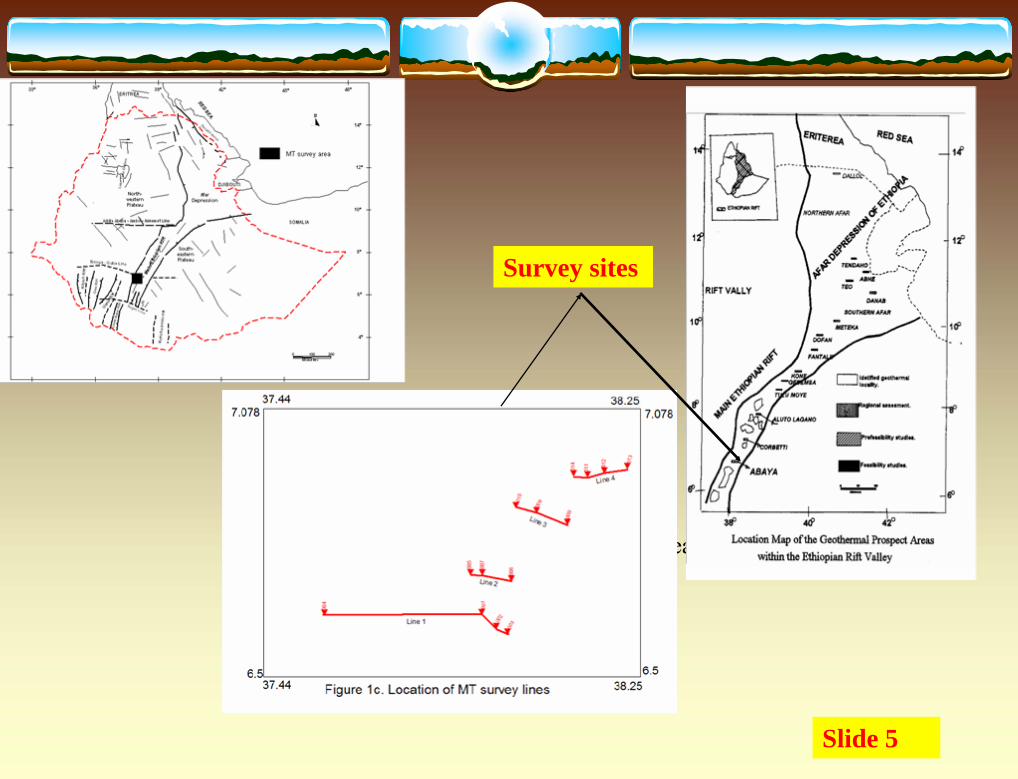
Figure 2 . Location MT survey area
Survey sites
Slide 5
Previous studiesPreviously geological, geochemical and infrared surveys were carried out in
the area. The results revealed the occurrence of several hot springs and
fumaroles while geothermal gas studies have indicated that the temperature
of spring water is around 1770C.
Geophysical studies, including gravity, magnetics and DC resistivity, were
conducted in the northern part of the present area. Strong thermal
manifestations were noted to associate with low gravity, magnetic and
resistivity zones.
Slide 6

2. Geological tectonic and settingsThe collision between east and west Gondwanaland has defined the major geological and structural features of East Africa. The late Protrozoic Mozambique belt, representing Himalayan-scale orogeny, abuts the Archaen complexes of western Ethiopia. In Ethiopia, the belt is transected by numerous predominantly N-S to NNE-SSW suture zones and associated ophiolitic slivers and NW-SE trending shear zones.
The pre-rift basaltic rocks unconformably overlie the Precambrian basement. The prominent units in the area are: Volcanic rocks: these include the pre-rift basalt, ignimbrites, trachytes, pumiceouspyroclastics, rhyolites, and rhyo-obsidian flows; Sedimentary succession: is represented by Pleistocene volcano-sedimentary rocks, Holocene lake sediments and recent alluvium and fluvial deposits.
Figure 3. Geological map of northern Lake Abaya area with MT survey lines.
Slide 7

Structure:A series of intense normal faults and quaternary volcanicsobserved in the area (Duguna-Fango volcanic complex) are believed to represent the southern sector of Wonji Fault Belt (WFB), which is the active spreading axis in the Main Ethiopian Rift (MER). The centers of this belt are considered to be the heat sources.
Slide 8
3. Statement of the problem
Previously DC resistivity survey was conducted over limited area that covers only the
northern part of the current area (i.e around lines 3 & 4). Deep subsurface information related
to thermal sources could not be acquired due to the following reasons:• to achieve great depth penetration it requires a long electrode separation, which is difficult under such terrain conditions.
•It needs equipment capable of generating high power.
• depth penetration of the DC method is highly affected by the upper resistive and/or
conductive layers. However, the above stated problems could be alleviated or minimized by applying the MT method. Geothermal resources are genetically related by water and heat. Since the electrical resistivity is affected by changes in temperature and permeability, electromagnetic and electrical methods can provide a model of subsurface resistivity variation. Of all EM methods MT seems to be the appropriate due to several km of penetration and the upper resistive volcanic rocks (as Ethiopian case) couldn’t mask the EM field propagation
Slide 9

4. Survey ObjectivesHaving in mind what has been discussed in section 4
above, the MT survey was intended to:
• Map the geo-electrical structure of the area;
• Determine the lateral and vertical extents of active
hydrothermal zones
• Delineate prominent geologic structures associated with
WFB and volcanic centers.
Slide 10

5. Methodology
Ddata acquisition
Fifteen (15) MT soundings were carried out along four profiles with the Short
Period Automatic Magnetotelluric (SPAM mark III) data acquisition system (Ritter
et al., 1998). The horizontal electric and magnetic field time series were recorded in
3 and 7 period bands (for high frequency and low frequency modes respectively)
in the magnetic north (x) and east (y) directions. The electric potentials were
measured between two non-polarizable Cl2–PbCl2 electrodes, with separations of
50 m using cross configuration. Four geo-electric sections along lines oriented
nearly perpendiculars to the rift axis are presented. The station spacing varies
between 2.5 and 8 km, while the line spacing varying between 12 and 25 km..
Slide 11

6. Data processing and presentationThe electric and magnetic field time series were transformed into frequency domain.The 2 * 2 MT impedance tensor Z relating the horizontal electric (Ex, Ey) to the horizontal magnetic (Bx, By) fields was determined using the robust remote reference method of Chave and Thompson (1989). In a 2-D Earth, the electromagnetic induction equation separate into two modes, the transverse electric (TE) mode, (i.e, currents parallel to structure and in the direction of constant conductivity, the geo-electrical strike) and the transverse magnetic (TM) mode (currents perpendicular to geo-electrical strike). Currents parallel to structure only induce magnetic fields perpendicular to it, and vice versa for the TM mode. Thus the diagonal elements of the impedance tensor vanish. The MT impedance tensor at each site was rotated to the direction that best-fits an off-diagonal tensor. The geo-electrical strike direction was determined by rotating the impedance tensor into the complex direction minimizing its diagonal elements. This was done choosing the rotation angle of the real axis of the electric or magnetic field that either maximizes or minimizes the impedance tensor. This angle defines, for each period, a maximum electric field direction (MED) or a minimum magnetic field direction (Counil et al., 1986). In 2-D geometry the MED corresponds to the strike of the 2-D structure.
Slide 12

At most sites, the rotation angle was well defined and constant with period and indicates
a structural direction. This is illustrated in Figures 4 where the MED are shown for
periods of 0.5 and 8s respectively. At 0.5 s period, representative of approximately the
first kilometer below the surface, there are four directions, 120-170N, 90–120_N ,40-
80_N and 10–40_N of which the two main directions, 90–120_N and 10–40_N are
dominant. The 90–120_N direction corresponds to the NW–SE that well agrees with the
older tectonic structures while the 10–40_N direction corresponds to the NNE–SSW
active WFB.
At a longer period , (8 s) or at deeper depth the NE–SW direction dominates, indicating
that deeper structures are more influenced by the active Wonji fault direction.
A correlation made between resistivity and geo-electric strike (MED) at each site
revealed that low resistivity is associated with NE-SW direction, which indicates that
thermal activity is controlled by this structure. Slide 13
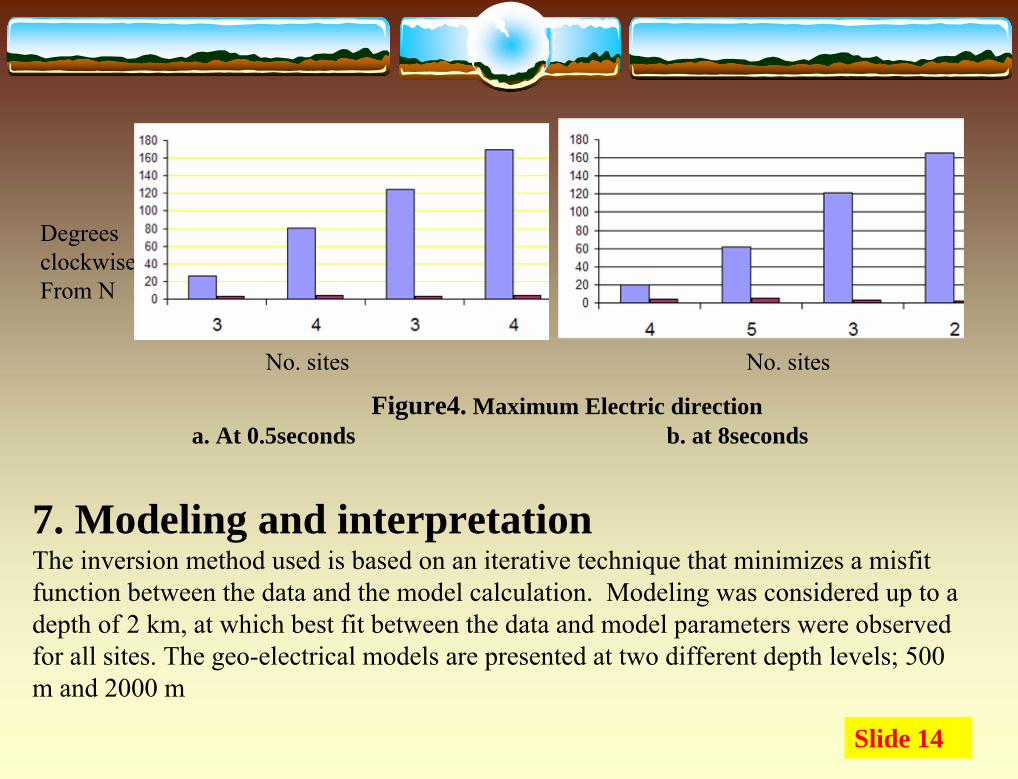
Figure4. Maximum Electric directiona. At 0.5seconds b. at 8seconds
Degrees clockwiseFrom N
7. Modeling and interpretationThe inversion method used is based on an iterative technique that minimizes a misfit function between the data and the model calculation. Modeling was considered up to a depth of 2 km, at which best fit between the data and model parameters were observed for all sites. The geo-electrical models are presented at two different depth levels; 500 m and 2000 m
Slide 14
No. sites No. sites

Figure5. Geo-electric section along line 1
a
b
•Site 001 is characterized by very low resistivity at surface and getting wider around 1.2km depth. The site was observed between fumaroles and hot springs which are favored by structurally weak zone (low resistivity). •Site 002 shows similar characteristic to that of site 001 except that the resistivity value at shallower portion is a bit higher at this site•Sites 003 and 004 are characterized by high resistivity at the surface which could be due to volcanic rocks (rhyolite) and low at depth which is attributed to hydro-thermal alteration. The thickness of the resistive body is estimated about 600 m.
Slide 15

Figure6. Geo-electric section along line2
a
b
Resistivity signature along line 2 shows a different characteristics compared to line1. The shallower part is mapped by relatively high resistivity except at site 005, where low resistivity is observed up to 100 m. The conductive anomalous zone is mapped at central part of the line below 1 km depth, which could be related to the deep seated heat source. It is noted that that site 007 was located at a foot of mount Selwa ; one of the volcanic centers in the area with hot crater lake on top .
Slide 16

Figure7. Geo-electric section along line3.
Line 3 is characterized by very low resistivity below 200 m and 800 m depth under sites 015 and 009 respectively, while high resistivity is observed below site 008 up to 1.7km depth, which could be attributed to the presence of thick volcanic rocks . Site 009 is close to BilateRiver where massive ignimbrite is observed. The MT survey result revealed that the thickness of ignimbrite is about 1km at site 009 and 1.9 km at site 008.
a
b
Slide 17

Line 4 is characterized by low resistivity zone (western part), at site 011 (similar to site 001) while resistive in the eastern side. The high resistivity under site 012 continues up to the depth of about 1 km and replaced by very low resistivity below this depth. The conductive zone observed at site 011 may serve as conduit through which geothermal heat flows to the surface. The hot spring observed close to this site (Dimtuvillage) could be a manifestation of the presence of this deep seated heat source.
a
b
Figure8. Geo-electric section along line4
Slide 18

8. DiscussionExperiments have proved that resistivity and temperature are inversely related (ρ
α1/T). Temperature parameter influences the resistivity of rocks. During
geodynamic activity, the crustal materials melt at high temperature and pressure
conditions and thereby increasing the conductivity of crustal materials. In such
conditions, high temperature values are associated with low resistivity (high
conductivity) regions. In volcanic and geothermal areas, the causes of high
conductivity (low resistivity) at depth may indicate the presence of hot magma
chamber.
In the present survey area, the presence of high temperature was revealed by
previous studies. There are a number of hot springs and fumaroles smoking all the
time. The conductive zones delineated by MT survey and the above facts together
may confirm the occurrence of hot magma chamber at shallow depths as indicated
by MT imaging. Slide 19

9. ConclusionsThe result of MT survey in Abaya geothermal prospect area allowed to characterize the electrical structure of the area. The result shows lateral and vertical variations of electrical resistivity. It can be concluded that: • Surface manifestations of thermal features are related to low resistivity (high conductivity)
zones• Low resistivity zones are wide and open towards depth, which could indicate that the area is potentially promising for geothermal energy resource•The hydrothermal alteration zones (associated with probable heat sources) are situated below 2km depth•The foot of volcanic centers (magmatic centers) observed on the surface are no more deeper than 2km•The dominant controlling structure is associated with NE-SW oriented structure which could be activated by Wonji fault .
Slide 20

10. RecommendationsThe current survey has delineated low resistivity zones in depth range of 1-2 km. To have a more comprehensive view of resistivity structure at deeper depth levels, we need closely spaced long period MT data. Moreover, the MT method is not masked by overlying resistive rocks, its application in countries like Ethiopia with vast volcanic cover is very important. The method is also one of the best tools for:• Energy and mineral resources investigation (coal & petroleum)• Environmental studies, • observation of Lithosphere- mantel processes, • the study of Volcanology, Therefore, a purchase of a pair of the MT instrument is highly recommended so as to
promote and advance the geo-scientific research and utility of the Earth resources, which could play an important role in poverty eradication.
Slide 21

Thank you
Slide 22