Labor Market Reforms in Latin America: Consequences and Costs

1
The Effects of Labor and Product Market Reforms: The Role of Macroeconomic
Conditions and Policies
Romain Duval and Davide Furceri1
International Monetary Fund
Abstract
The paper estimates the dynamic macroeconomic effects of labor and product market
reforms on output, employment and productivity, and explores how these vary with
prevailing macreconomic conditions and policies. We apply a local projection method to a
new dataset of major country- and country-sector-level reform shocks in various areas of
labor market institutions and product market regulation covering 26 advanced economies
over the past four decades. Product market reforms are found to raise productivity and
output, but gains materialize only slowly. The impact of labor market reforms is primarily
on employment, but it varies across types of reforms and depends on overall business
cycle conditions—unlike that of product market reforms. Reductions in labor tax wedges
and increases in public spending on active labor market policies have larger effects during
periods of slack, in part because they usually entail some degree of fiscal stimulus. In
contrast, reforms to employment protection arrangements and unemployment benefit
systems have positive effects in good times, but can become contractionary in periods of
slack. The economy’s response to such reforms is significantly improved when they are
accompanied by fiscal or monetary stimulus.
JEL Classification Numbers: E32; E52; E62; H30; H53;J21; J65; L43; L51; O43; O47
Keywords: Structural reforms, Labor Market, Product Market, Deregulation, Employment
Protection; Unemployment Benefits; Labor tax; Active Labor Market Policy; Growth,
Productivity, Employment, Monetary Policy, Fiscal Policy.
1 International Monetary Fund, 700 19th St NW, Washington D.C 20431. The views expressed in this paper are
those of the authors and do not necessarily reflect those of the IMF, its Executive Board, or IMF management.
We would like to thank two anonymous referees as well as participants to various seminars and conferences at
Banca d’Italia, Banco de Espana, Banco de Portugal, Bank of England, Bank of Korea, Banque de France,
European Central Bank, European Commission, ILO and OECD for valuable comments. All remaining errors
are ours.

I. INTRODUCTION
Deepening worries over the persistent sluggishness of growth in the advanced
economies since the Great Recession have increasingly led policymakers to emphasize
structural reforms. The hope is that such reforms could lift potential output over the medium
term while also strengthening aggregate demand in the near term by raising consumer and
business confidence. In emerging and low-income economies, agricultural, trade and
domestic financial and capital account liberalization, as well as strengthening the rule of law,
property rights and governance more broadly, often feature among reform priorities although
important progress has been achieved in recent decades (Prati et al., 2013). In most advanced
economies, which are the focus of this paper, the scope for reform in these areas is much less,
and higher on the agenda are reforms designed to strengthen the functioning of product and
labor markets (OECD, 2016). Although the specifics vary widely for individual countries,
these reforms broadly involve: deregulating retail trade, professional services, and certain
segments of network industries, primarily by reducing barriers to entry; easing hiring and
dismissal regulations for regular workers; increasing the ability of and incentives for the
nonemployed to find jobs by reducing the level or duration of unemployment benefits and/or
by increasing the resources for and the efficiency of active labor market policies (ALMPs);
cutting labor tax wedges; targeted policies to boost participation of underrepresented groups
in the labor market, including youth, women, and older workers. Depending on the type of
reform, the goal is to lift productivity, increase employment and/or strengthen resilience to
macroeconomic shocks.
The theoretical case for labor and product market reforms has been laid out by an
extensive literature that has highlighted the long-term gains from structural reforms (e.g.
Blanchard and Giavazzi, 2003), but far less is known about their dynamic impact, and
virtually nothing about whether that short-term impact varies depending on the economy’s
business cycle position or the ability of macroeconomic policies to respond to a reform-
driven supply shock. Yet these issues have gained prominence in recent policy debates as
many advanced economies in need of reform, including individual euro area countries and
Japan, also happened to be experiencing a persistent shortfall in aggregate demand and
shrinking monetary and fiscal policy space. Is the impact of reforms smaller, or instead
greater, under such circumstances? Does the answer to this question vary across different
types of reforms? Theory is limited and so far unsettled (see e.g. Cacciatore et al., 2016;
Eggertsson et al., 2014), while comprehensive empirical evidence is still missing.
This paper aims to fill this gap. Building on a new “narrative” database of major
reform shocks in a wide range of product and labor market areas for 26 advanced over the
past four decades, we estimate the dynamic response of macroeconomic outcomes—real
output, but also employment and labor productivity, given that transmission channels may
differ—to each type of reform, and how this response varies depending on business cycle
conditions and the stance of macroeconomic policies. To this end, we rely on the local
projection method (Jordà, 2005), which has been used recently to study the dynamic impact

of macroeconomic shocks such as financial crises (Romer and Romer, 2015) or fiscal shocks
(Jordà and Taylor, 2013). The role of macroeconomic conditions is explored using the
smooth transition function proposed by Auerbach and Gorodnichenko (2012) to estimate
fiscal multipliers in expansions and recessions; here we essentially use this approach to
estimate the response to reform shocks instead of fiscal shocks.
The analysis yields four main findings. First, labor and product market reforms
generally raise output over the medium term—by boosting employment and/or labor
productivity. Past product market deregulation shocks increased GDP by about 1.5 percent
on average after five years, similar to that of major unemployment benefit cuts although the
latter have statically significant effects only on employment. A one percentage point cut in
labor tax wedges and a 10 percent shock to public spending on ALMPs raised GDP by about
0.6 and 0.3 percent, respectively, while no significant average impact of major reforms of
employment protection legislation for regular workers could be identified. Second, reforms
typically take time to pay off. For example, the positive impact of product market reform
becomes statistically significant only after three years, and fully materializes after about
seven years. Third, the effects of labor market reforms depend significantly on business cycle
conditions—unlike those of product market reforms. Cuts in labor tax wedges and increased
public spending on ALMPs have larger effects during periods of economic slack, consistent
with the fact that they usually entail some degree of fiscal stimulus and fiscal multipliers are
typically larger in recessions (Auerbach and Gorodnichenko 2012; Blanchard and Leigh
2013; Jordà and Taylor 2013; Abiad, Furceri, and Topalova 2015). In contrast, deregulating
employment protection legislation—and to a lesser extent reducing the generosity of
unemployment benefit systems—can become contractionary in periods of slack, while such
measures are expansionary when carried out during expansions. Fourth, and finally, there are
complementarities between macroeconomic policies and reforms. Fiscal and monetary policy
stimulus improve the short-term response of the economy to job protection and
unemployment benefit reforms, over and above its direct impact on aggregate demand.
This paper relates to an extensive empirical literature on the macroeconomic effects
of labor and/or product market reforms in advanced economies, which has relied on country-
or country-sector-level data (Aghion et al., 2009; Alesina et al., 2005; Barone and Cingano,
2011; Bassanini and Duval, 2009; Bassanini et al., 2009; Blanchard and Wolfers, 2000;
Bouis and Duval (2011); Bourlès et al., 2013; Fiori et al., 2012; Inklaar et al., 2008; Nickell
et al., 2005; Nicoletti and Scarpetta, 2003). These studies typically focus on the long-term
impact of reform, or capture their dynamic effects in a crude way through simple
autoregressive-distributed lag specifications. None explores the dynamic response of
outcomes to reform shocks, which is the focus of our paper. While their approaches and
results vary widely, and are inherently difficult to compare to those implied by our narrative
approach, they seem to be reasonably consistent with our medium-term estimates on
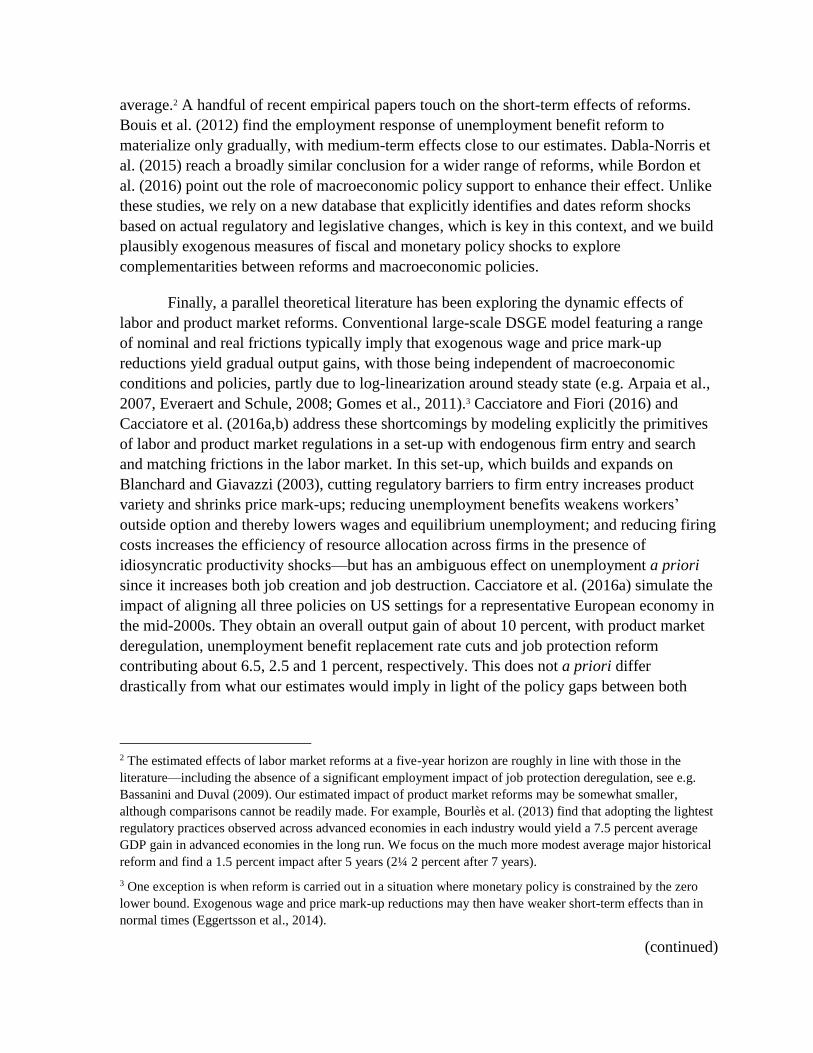
average.2 A handful of recent empirical papers touch on the short-term effects of reforms.
Bouis et al. (2012) find the employment response of unemployment benefit reform to
materialize only gradually, with medium-term effects close to our estimates. Dabla-Norris et
al. (2015) reach a broadly similar conclusion for a wider range of reforms, while Bordon et
al. (2016) point out the role of macroeconomic policy support to enhance their effect. Unlike
these studies, we rely on a new database that explicitly identifies and dates reform shocks
based on actual regulatory and legislative changes, which is key in this context, and we build
plausibly exogenous measures of fiscal and monetary policy shocks to explore
complementarities between reforms and macroeconomic policies.
Finally, a parallel theoretical literature has been exploring the dynamic effects of
labor and product market reforms. Conventional large-scale DSGE model featuring a range
of nominal and real frictions typically imply that exogenous wage and price mark-up
reductions yield gradual output gains, with those being independent of macroeconomic
conditions and policies, partly due to log-linearization around steady state (e.g. Arpaia et al.,
2007, Everaert and Schule, 2008; Gomes et al., 2011).3 Cacciatore and Fiori (2016) and
Cacciatore et al. (2016a,b) address these shortcomings by modeling explicitly the primitives
of labor and product market regulations in a set-up with endogenous firm entry and search
and matching frictions in the labor market. In this set-up, which builds and expands on
Blanchard and Giavazzi (2003), cutting regulatory barriers to firm entry increases product
variety and shrinks price mark-ups; reducing unemployment benefits weakens workers’
outside option and thereby lowers wages and equilibrium unemployment; and reducing firing
costs increases the efficiency of resource allocation across firms in the presence of
idiosyncratic productivity shocks—but has an ambiguous effect on unemployment a priori
since it increases both job creation and job destruction. Cacciatore et al. (2016a) simulate the
impact of aligning all three policies on US settings for a representative European economy in
the mid-2000s. They obtain an overall output gain of about 10 percent, with product market
deregulation, unemployment benefit replacement rate cuts and job protection reform
contributing about 6.5, 2.5 and 1 percent, respectively. This does not a priori differ
drastically from what our estimates would imply in light of the policy gaps between both
2 The estimated effects of labor market reforms at a five-year horizon are roughly in line with those in the
literature—including the absence of a significant employment impact of job protection deregulation, see e.g.
Bassanini and Duval (2009). Our estimated impact of product market reforms may be somewhat smaller,
although comparisons cannot be readily made. For example, Bourlès et al. (2013) find that adopting the lightest
regulatory practices observed across advanced economies in each industry would yield a 7.5 percent average
GDP gain in advanced economies in the long run. We focus on the much more modest average major historical
reform and find a 1.5 percent impact after 5 years (2¼ 2 percent after 7 years).
3 One exception is when reform is carried out in a situation where monetary policy is constrained by the zero
lower bound. Exogenous wage and price mark-up reductions may then have weaker short-term effects than in
normal times (Eggertsson et al., 2014).
(continued)

sides of the Atlantic—especially in the mid-2000s, i.e. before the recent wave of product
market deregulation in Europe (Koske et al., 2015).4
Cacciatore et al. (2016b) show that labor market reforms have different effects in
recessions compared to normal times. In particular, easing regular job protection has
contractionary effects in the short term: since more job matches are unprofitable during
recessions, firms respond to reform by destroying these matches, and in turn the larger job
destruction further weakens aggregate demand and output. Our paper finds supportive
empirical evidence for this prediction, and more broadly for the notion that macroeconomic
conditions and policies can shape the response of an economy to reform.
The remainder of this paper is structured as follows. Section II describes the dataset
and the methodology used for the construction of reform shocks. Section III describes the
empirical setup. Section IV presents the econometric results. Section V concludes.
II. DATASET ON MAJOR STRUCTURAL REFORMS
A. Product market regulation, employment protection legislation and
unemployment benefits
Our analysis focuses on major policy changes in product market regulation and four
key labor market policies and institutions, namely employment protection legislation for
regular workers, unemployment benefits, ALMPs, and labor tax wedges.
Major reforms of product market regulation, employment protection legislation, and
unemployment benefit systems are identified by Duval et al. (2016), who examine
documented legislative and regulatory actions reported in all available OECD Economic
Surveys for 26 individual advanced economies since 1970, as well as additional country-
specific sources.5 In this respect, the methodology is related to the “narrative approach” used
by Romer and Romer (1989, 2004, 2010, and 2015) and Devries and others (2011) to identify
monetary and fiscal shocks and periods of high financial distress.
In a first step, Duval et al. (2016) identify all legislative and regulatory actions related
to product market regulation, employment protection legislation and unemployment benefits
mentioned in any OECD Economic Survey for any of the 26 countries over the entire sample.
Over 1000 such actions are identified overall. In a second step, for any of these actions to
qualify as a major reform or “counter-reform”—namely a major policy change in the
4 Using a calibrated euro area model with similar theoretical foundations, but using information on more recent
(2013) regulatory settings, Cacciatore et al (2016b) find a much smaller steady-state GDP gain of about 2.2
percent for the euro area from converging to US product market regulation.
5 The 26 countries covered are Australia, Austria, Belgium, Canada, Czech Republic, Denmark, Finland,
France, Germany, Greece, Iceland, Ireland, Italy, Japan, Korea, Luxembourg, Netherlands, New Zealand,
Norway, Portugal, Slovak Republic, Spain, Sweden, Switzerland, United Kingdom and United States.

opposite direction—one of the following three alternative criteria has to be met: (1) the
OECD Economic Survey uses strong normative language to define the action, suggestive of
an important measure (for example, “major reform”); (2) the policy action is mentioned
repeatedly across different editions of the OECD Economic Survey for the country
considered, and/or in the retrospective summaries of key past reforms that are featured in
some editions, which is also indicative of a major action; or (3) the existing OECD indicator
of the regulatory stance in the area considered displays a very large change (in the 5th
percentile of the distribution of the change in the indicator). The OECD indicators used for
this purpose are the seven indicators of product market regulation in seven key non-
manufacturing industries (telecoms, electricity, gas, post, rail, air passenger transport, and
road freight), the employment protection legislation index for regular workers, and the
average unemployment benefit replacement rate over a five-year unemployment spell across
a set of hypothetical workers with different income and family statuses (see e.g. OECD,
2016). When only the third condition is met, an extensive search through other available
domestic and national sources, including through the internet, is performed to identify the
precise policy action underpinning the change in the indicator.
Table 1 provides an illustrative example on how these criteria guide the identification
of major reforms and “counter-reforms” in the area of product market regulation,
employment protection legislation, and unemployment benefits (for details, see Duval and
others 2016). In some cases, the major action goes beyond the scope of available indicators
(e.g. telecoms deregulation in the United States as a result of the antitrust lawsuit against
AT&T, which was not a government measure and as such is not captured by the existing
OECD indicator), or pre-dates the period over which the OECD indicator is available (Italy’s
1970 “Workers’ Statute”), but language used to describe it in the Country Survey makes its
importance clear. In other cases, the available OECD indicator does not capture the full scope
of the measure (1994 overhaul of the unemployment benefit system in Denmark). In other
cases, the qualitative information drawn from the Country Surveys coincides, and is fully
consistent with, the observed change in the value of the corresponding OECD indicator (1995
employment protection legislation reform in Spain).
More broadly, in a context where our goal is to identify and trace out economies’
responses to major reform shocks, this approach has several strengths compared to indirect
methods used in other papers that rely exclusively on changes in OECD policy indicators.
Specifically, the reform database: identifies the exact timing of major legislative and
regulatory actions; identifies the precise reforms that underpin what otherwise looks like a
gradual decline in OECD policy indicators without any obvious break (for example, the
series of reforms that took place in the telecommunications industry in many countries in the
mid-late 1990s); captures reforms in areas for which OECD indicators exist but do not cover
all relevant policy dimensions; covers a longer time period in some policy areas, such as
regarding employment protection legislation; documents and describes the precise legislative
and regulatory actions that underpin observed large changes in OECD indicators.

Finally, compared with yet other existing databases on policy actions in the area of
labor market institutions, such as the European Commission’s Labref, the Fondazione
Rodolfo de Benedetti-IZA database, and the ILO’s EPLex database, the approach taken here
allows identifying a rather limited set of major legislative and regulatory reforms, as opposed
to just a long list of actions that in some cases would be expected to have little or no bearing
on macroeconomic outcomes.
Overall, an important advantage of this database is to identify the precise nature and
timing of major legislative and regulatory actions taken by advanced economies since the
early 1970s in key labor and product market policy areas. Specifically, compared with
existing databases on policy actions in the area of labor market institutions (such as the
European commission Labref, the Fondazione Rodolfo de Benedetti-IZA, and the ILO-
EPLex database), the approach allows identifying major legislative and regulatory reforms as
opposed to just actions. This is particularly useful for empirical analysis that seeks to
identify, and then estimate, the effects or the drivers of reform shocks.
The major strengths of this narrative reform database come with one limitation;
because two large reforms in a given area (for example, employment protection legislation)
can involve different specific actions (for example, a major simplification of the procedures
for individual and collective dismissals, respectively), only the average impact across major
historical reforms can be estimated. As a robustness check, we re-run our regressions using
instead as reform shocks large changes in OECD indicator values, and show that while our
main results are robust to using this methodology, the effects of reforms are weaker and less
precisely estimated compared with the narrative approach. This suggests that the latter indeed
better identifies major reform events and thereby reduces measurement error. It should also
be highlighted that the reform database provides no information regarding the stance of
current (or past) product and labor market regulations, which is not the purpose of this paper.
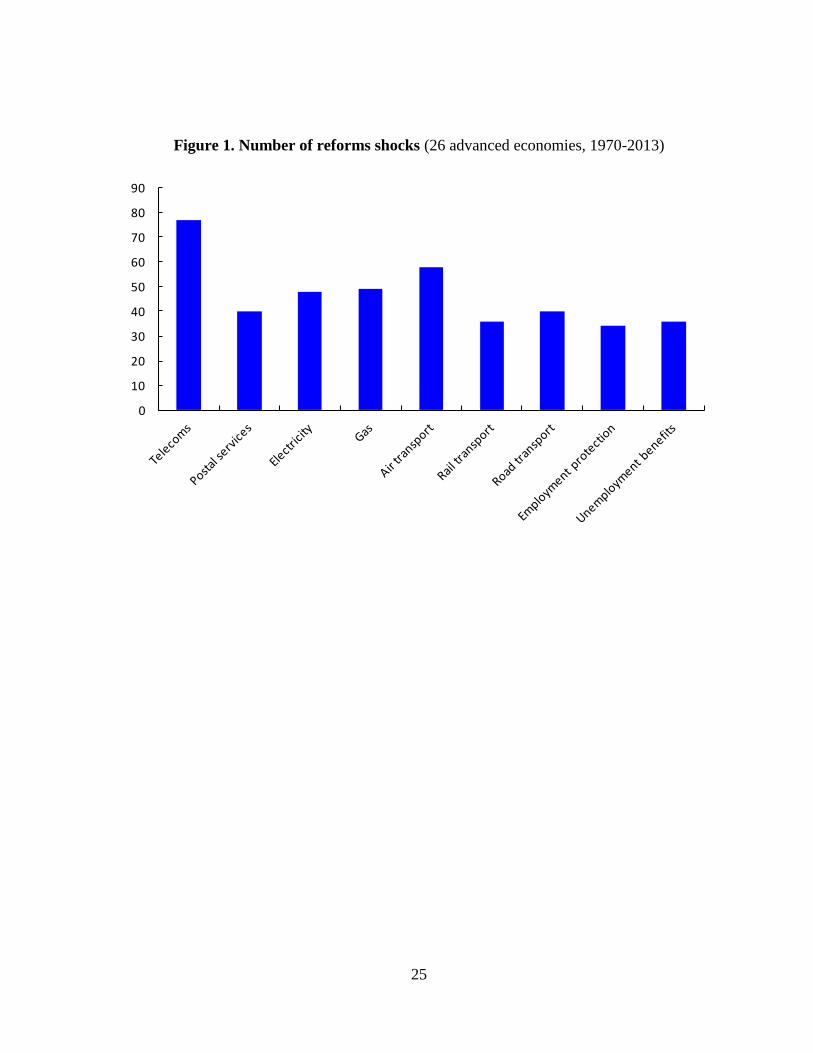
Figure 1 provides the number of reforms identified in the sample, and illustrates the
heterogeneity of reforms efforts across regulatory areas. Product market reforms have been
most frequently implemented, in particular in telecommunications and air transport that
underwent major deregulation in many countries between the early 1980s and early 2000s. In
general, fewer major reforms have been implemented in the areas of employment protection
legislation for regular workers and unemployment benefit systems (replacement rate and/or
duration)—about 35 or so in each area.
B. Labor tax wedges and ALMP spending
For policy changes in the areas of labor tax wedges and public spending on ALMPs,
there is no need to follow the approach described above, since these are simple tax and
spending—as opposed to harder-to-quantify regulatory—measures that can be computed
readily from available OECD data.

Labor tax wedge shocks are identified as the annual change in the measure of tax
wedges published in OECD Taxing Wages, which is derived from tax models. The measure
is defined as the wedge between the labor cost to the employer and the corresponding net
take-home pay of the employee for an average single-earner couple with two children, and it
expresses the sum of personal income tax and all social security contributions as a percentage
of total labor cost.
Data for public spending on active labor market policies are taken from the OECD
Social Expenditure database. In order to isolate discretionary spending shocks from
automatic changes in spending driven by business cycle fluctuations, we follow an approach
inspired by Perotti (1999) and Corsetti, Meier, and Müller (2012). Specifically, spending
shocks are identified as innovations to past spending and economic activity as well as to
expectations about current economic activity, that is as the residuals from the following
regression:
∆𝑠𝑖𝑡 = 𝛼𝑖 + 𝛾𝑡 + 𝛽𝑖∆𝑦𝑖𝑡 + 𝛿𝑖∆𝑦𝑖𝑡−1𝐸 + 휀𝑖𝑡,
in which ∆𝑠 denotes the growth rate of public spending on active labor market policies; ∆𝑦 is
GDP growth; ∆𝑦𝐸denotes the OECD forecast for GDP growth at time t, made at t–1; 𝛼𝑖and
𝛾𝑡 are country and time fixed effects, respectively.
C. Macroeconomic policy shocks
In order to study interactions between reforms and macroeconomic policies, we build
plausibly exogenous measures of fiscal and monetary policy shocks.
Fiscal policy shocks are identified as the forecast error of government consumption
expenditure to GDP, following the approach used by Auerbach and Gorodnichenko (2012).
The forecasts of government consumption used in the analysis are those reported in the fall
issue of the OECD’s Economic Outlook for the same year.6 This procedure overcomes the
problem of fiscal foresight (Forni and Gambetti 2010; Leeper, Richter, and Walker 2012,
2013; Ben Zeev and Pappa 2014), because it aligns the economic agents’ and the
econometrician’s information sets.
The approach we follow to construct monetary policy shocks is similar in spirit.
Specifically, monetary policy shocks are computed as the forecast error in monetary policy
rates that is orthogonal to unexpected changes in output growth and inflation. The forecasts
6 Results are robust to using instead the forecasts of the spring issue of the same year or the fall issue of the
previous year. These are available upon request.
(continued)

of policy rates used in the analysis are those reported in Consensus Economics in October of
the same year. 7
These shocks are orthogonal to reform shocks, as well as to macroeconomic
conditions (Table 2). In particular, the correlation between fiscal and monetary shocks on the
one hand, and reforms of employment protection legislation or unemployment benefits
systems—the two types of reform shocks for which we find significant complementarities
with macroeconomic policy stimulus below—on the other hand, is found to be close to zero.
Likewise, the correlation between fiscal and monetary shocks on the one hand, and the
variable capturing macroeconomic conditions—which we define below—or its change on the
other hand, is also close to zero.
Finally, the macroeconomic series for GDP, employment and productivity used in the
analysis come from the OECD’s Statistics and Projections database, which covers an
unbalanced sample of 26 OECD economies over the period 1970–2014. The sectoral series
used in the sector-level analysis of the impact of product market deregulation (see below)
come from the EU KLEMS and World KLEMS databases, which provide annual information
on sectoral input, output, and prices over the period 1970–2007.
III. EMPIRICAL METHODOLOGY
A. Country-level analysis
In order to estimate the dynamic response of output, employment and labor
productivity to reform shocks, we follow the local projection method proposed by Jordà
(2005) to estimate impulse-response functions. This approach has been advocated by Stock
and Watson (2007) and Auerbach and Gorodnichencko (2012), among others, as a flexible
alternative to vector autoregression (autoregressive distributed lag) specifications since it
does not impose dynamic restrictions. It is also particularly suited to estimating nonlinearities
in the dynamic response—such as, in our context, interactions between reform shocks and
macroeconomic conditions and policies. The baseline specification is:
𝑦𝑡+𝑘,𝑖 − 𝑦𝑡−1,𝑖 = 𝛼𝑖 + 𝛾𝑡 + β𝑘𝑅𝑖,𝑡 + 𝜃𝑋𝑖,𝑡 + ε𝑖,𝑡 (1)
7 In particular, we first compute the forecast error of the policy rates (𝐹𝐸𝑡
𝑖)—defined as the difference between
the actual policy rates (𝑆𝑇𝑡𝑖) and the rate expected by analysts as of October of the same year (𝐶𝑇𝑡−1,𝑡
𝑖 ): 𝐹𝐸𝑖,𝑡𝑖 =
𝑆𝑇𝑖,𝑡𝑖 − 𝐶𝑇𝑖,𝑡−1,𝑡
𝑖 — and then regress for each country the forecast errors of the policy rates (𝑆𝑇𝑡𝑖) on similarly
computed forecast errors of inflation (𝐹𝐸𝑖𝑛𝑓) and output growth (𝐹𝐸𝑔): 𝐹𝐸𝑖,𝑡𝑖 = 𝛼 + 𝛽𝐹𝐸𝑖,𝑡
𝑖𝑛𝑓+ 𝛾𝐹𝐸𝑖,𝑡
𝑔+ 𝜖𝑖,𝑡
where the residual series—𝜖𝑖,𝑡— captures exogenous monetary policy shocks (MP). We use Consensus
Economics forecasts rather than the OECD’s Economic Outlook because of the greater country and time coverage
of the former.
(continued)

in which y is the variable of interest, namely the log of GDP, employment or labor
productivity (defined as the ratio of GDP to employment); 𝛽𝑘 denotes the (cumulative)
response of the variable of interest in each k year after the reform;𝛼𝑖 are country fixed
effects, included to take account of differences in countries’ average growth rates; 𝛾𝑡 are time
fixed effects, included to take account of global shocks; Rit denotes the reform shock in the area
considered;8 and Xit is a set a of control variables including two lags of reform shocks, as well
as lags of GDP growth and recession dummies—to control for the fact that economic
conditions may shape the likelihood of reform, as is the case for example according to the
“crisis-induces-reform” hypothesis (Drazen and Easterly, 2001; Velasco, 1996).9
Reverse causality and omitted variable bias are two common issues involved in cross-
country time-series estimation of the impact of policies and institutions on macroeconomic
outcomes. The risk of reverse causality stems from the fact that the probability of reform may
depend not only on past growth and the occurrence of recessions—which are controlled
for—but also on current and expected future growth. We address this concern by also
controlling for the expected values in t-1 of future GDP growth rates over periods t to t+k.
These are sourced from the fall issue of the OECD’s Economic Outlook for year t-1. Omitted
variable bias may arise from the fact that reforms may be implemented across different areas at
the same time. In practice, however, as shown by robustness checks further below, including
all reform shocks in all areas simultaneously in the estimated equation does not materially
affect the magnitude and statistical significance of the results.10
This baseline specification is then extended to allow the response to vary with the
state of the economy (output or credit growth conditions) or the stance of
macroeconomic policy as follows:
𝑦𝑖,𝑡+𝑘 − 𝑦𝑖,𝑡−1 = 𝛼𝑖 + 𝛾𝑡 + β𝑘𝐿 𝐹(𝑧𝑖,𝑡)𝑅𝑖,𝑡+β𝑘
𝐻(1 − 𝐹(𝑧𝑖,𝑡))𝑅𝑖,𝑡 + 𝜃𝑍𝑖,𝑡 + ε𝑖,𝑡 (2)
with
8 All reform shocks featured in our database are country-wide shocks, with the exception of product market
reform shocks which are constructed at the country-sector level for seven different network industries. For the
country-level analysis, the latter are converted into country-wide product market reform shocks as follows. A
major reform is considered to take place in country i in year t when at least two out of the seven network
industries experience a reform, which in practice corresponds to the 90th percentile of the distribution of the sum
of all seven reform dummy variables. Similar results—not reported below but available upon request—are
obtained when using the distribution of the weighted sum of the reform dummies instead, with weights equal to
the (country-sector specific time-varying) share of value added of each sector in GDP.
9 The results are robust to different number of lags.
10 Estimates could be biased in the event of reform reversals. In practice, however, this bias is negligible, as
there are only very few such cases. Furthermore, the results are robust to controlling for future reform shocks.
𝐹(𝑧𝑖𝑡) =exp (−𝛾𝑧𝑖𝑡)
1+exp (−𝛾𝑧𝑖𝑡), 𝛾 > 0
in which zit is an indicator of the state of the economy (or the stance of monetary or fiscal
policy) normalized to have zero mean and unit variance, and Zit is the same set of control
variables used in the baseline specification but now also including F(zit). The indicator of the
state of the economy is GDP growth (credit growth), while the indicator of the stance of
fiscal (monetary) policy is the fiscal (monetary) shock variable computed above.
Fit is a smooth transition function used by Auerbach and Gorodichencko (2012) to
estimate the macroeconomic impact of fiscal policy shocks in expansions versus recessions.
Similar to them, we use 𝛾 = 1.5 for our analysis of the impact of reform shocks in recessions
versus expansions. This approach is equivalent to the smooth transition autoregressive model
developed by Granger and Terävistra (1993). The advantage of this approach is twofold.
First, compared with a model in which each dependent variable would be interacted with a
measure of the business cycle position, it allows to directly test whether the effect of reforms
varies across different regimes such as recessions and expansions. Second, compared with
estimating structural vector autoregressions for each regime it allows the effect of reforms to
change smoothly between recessions and expansions by considering a continuum of states to
compute the impulse response functions, thus making the response more stable and
precise.
Equations (1) and (2) are estimated for each k = 0, . . . , 4. Impulse response functions
are computed using the estimated coefficients β𝑘, and the confidence bands associated with
the estimated impulse-response functions are obtained using the estimated standard errors
of the coefficients β𝑘, based on clustered robust standard errors.
B. Sector-level analysis
For product market reforms, we supplement the country-level estimates with country
sector-level analysis. These enable us further minimize endogeneity issues, and to explore the
channels through which reform affects macroeconomic outcomes. There are three potential
channels: 1) a direct effect, under which reform can affect output, productivity and/or
employment in the deregulated industry itself; 2) a forward spillover, under which reform in
“upstream” industries—such as network industries—can reduce the price and improve the
quality and variety of the intermediate inputs used by downstream sectors, thereby boosting
their productivity (Barone and Cingano, 2011; Bourles et al., 2013); 3) a backward spillover,
under which an increase in output in the deregulated industry increases its demand for
intermediate inputs from upstream sectors. For example, deregulation in the electricity sector
may positively affect other sectors by both reducing their costs of production (backward
linkage) and requiring more inputs from these sectors (forward linkage).
Bouis et al. (2016) find strong evidence for a direct effect on output and
productivity—but not on employment—using OECD STAN data. Here we focus on the

backward and forward spillovers from reform. These two indirect effects of product market
reforms on sectoral output are estimated using an identification assumption similar in spirit to
Rajan and Zingales (1998), that is the fact that spillovers should be larger in industries that
are more exposed to the deregulated industry via input-output linkages. Specifically, we
estimate the following specification:
𝑦𝑗,𝑖,𝑡+𝑘 − 𝑦𝑗,𝑖,𝑡−1 = 𝛼𝑖𝑗 + 𝛾𝑖𝑡 + 𝑡𝑟𝑒𝑛𝑑𝑗 + 𝛽𝑘 ∑ 𝜔𝑗𝑠,𝑖,𝑡𝐼/𝑂
𝑠≠𝑗 𝑅𝑗,𝑖,𝑡 + 휀𝑗,𝑖,𝑡 (3)
in which 𝜔𝑗𝑠,𝑖,𝑡𝐼 is the share of intermediate inputs provided by each network industry s in
country i to downstream industry j, and 𝜔𝑗𝑠,𝑖,𝑡𝑂 the share of intermediate inputs provided by
each industry j in country i to downstream network industry s. Separate regressions are run to
estimate backward and forward spillovers. Country-year fixed effects 𝛼𝑖𝑡 allow us to control
for any variation that is common to all sectors of a country’s economy, such as country-wide
macroeconomic shocks and reforms in other areas, including labor market reforms. Country-
industry fixed effects 𝛾𝑖𝑗 control for industry-specific factors, such as cross-country
differences in the growth of certain sectors that could arise from differences in comparative
advantage. The industry-specific time trend (𝑡𝑟𝑒𝑛𝑑𝑗) is meant to control for the different
trend growth rates of different industries at the global level, partly reflecting different rates of
technological progress—for example, the boom of the telecommunications industry observed
over the sample period.11 To minimize endogeneity issues and measurement errors, the
weights 𝜔𝑗𝑠,𝑖,𝑡𝐼/𝑂
are based on input-output data for the year 2000.12
IV. RESULTS
A. Product market reforms
Cross-country analysis
Figure 2 (Panel A) shows the estimated dynamic response of GDP, employment and
productivity to product market reform shocks over the five-year period following reform
implementation, together with the 90% confidence interval around the point estimate. Major
deregulation episodes have a positive and statistically significant output effect over the
medium term, of about 1½ percent four years after the reform, which however materializes
only gradually. The effect eventually levels off, after seven years, at about 2¼ percent. While
11 As reforms in some sectors have been clustered around particular years, we use an industry-specific time
trend rather than industry-year fixed effects, as the latter would unduly absorb some of the impact of product
market deregulation.
12 Similar results are obtained using 1996 input-output data instead.

the point estimates suggest that both employment and labor productivity rise, none of these
effects is individually statistically significant.
The GDP impact of product market deregulation does not appear to vary with
prevailing business conditions: we find no statistically significant difference in the impact of
reform between expansion and recession regimes for any of the four years after the reform.
This finding is consistent with recent theoretical work by Cacciatore et al. (2016b). In a two-
country DSGE model with endogenous producer entry and labor market frictions, they find
that deregulating barriers to entry has broadly similar effects on firm entry, and therefore on
the dynamics of the economy, in recessions and normal times. This is because two offsetting
effects roughly cancel out. On the one hand, compared with normal times, expected profits
among prospective entrants are smaller during recessions, which discourages firm entry. On
the other hand, the number of competing firms shrinks during recessions, leading to higher
profit margins and stimulating firm entry, all else equal.
In contrast, we do find that the response of output to product market reforms varies
significantly with the credit cycle (Figure 2, Panel B). In particular, while the output response
is statistically larger and positive during periods of favorable credit conditions (high and
positive credit growth), it is negative and not statistically significant during periods of tight
credit conditions (highly negative credit growth). Interestingly, this differential effect seems
mainly driven by a stronger response of employment in credit booms than in credit
downturns. These results are consistent with a role of favorable credit conditions in fostering
entry of new firms in the aftermath of deregulation.13
Sectoral analysis
The sector-level analysis of the backward and forward spillovers from product market
reform broadly confirms the results country-level results and highlights that both
transmission channels matter. Product market reforms in network sectors have a statistically
significant indirect medium-term impact on output in both downstream and upstream
industries, of about 0.3 percent on average four years after the reform (Figure 3). In both
cases the output effect is mostly driven by an increase in labor productivity, while the
response of employment is not statistically significant.
B. Labor market reforms
Employment Protection Legislation
13 These results are qualitatively robust to several financial indicators such as private credit to GDP, overall
credit to GDP, stock market capitalization and money growth.

Major reforms of employment protection legislation for regular workers are not found
to have, on average, a statistically significant short to medium-term impact on output,
employment or productivity (Figure 4, Panel A), but this masks widely different effects
according to overall business conditions (Panel B). In an expansion, reforms have a sizable
positive and statistically significant impact on output and employment, whereas they have a
negative and statistically significant impact in a recession—the difference in the response
across the two economic regimes is statistically significant.
As shown in Cacciatore et al. (2016), the theoretical rationale for this asymmetric
effect across different economic regimes stems is that reform affects differently firms’ hiring
versus firing incentives in good and bad times. In a recession, firms seek to dismiss more and
hire less than in a boom, but stringent job protection partly discourages them from laying off;
relaxing that constraint triggers a wave of layoffs, increasing unemployment, weakening
aggregate demand and delaying the recovery.
Unemployment benefits
Major unemployment benefit reforms are found to have statistically significant effects
on employment that materialize gradually, increasing employment by over 2 percent four
years after the reform (Figure 5, Panel A).14 These reforms tend to have larger effects during
periods of expansion than during periods of slack, even though the difference is not
statistically significant (Figure 5, Panel B).15
Labor tax wedges
Shocks to labor tax wedges have statistically significant short- and medium-term
effects on output and employment but, as would be expected, not on productivity (Figure 6).
A reduction of 1 percent in labor tax wedges increases the level of output (employment) by
about 0.15 (0.2) percent the year of the shock and by about 0.6 (0.7) percent after four years.
14 Similar results—albeit somewhat stronger and more statistically significant—are found for the effect of these
reforms on unemployment.
15 There are three possible, non-mutually exclusive explanations for an asymmetric impact of unemployment
benefits. First, fiscal multipliers tend to be larger in general during recessions (Auerbach and Gorodnichenko
2012; Blanchard and Leigh 2013; Jordà and Taylor 2013; Abiad, Furceri, and Topalova 2015). This may hold
particularly for changes in unemployment benefits, because households also become more credit constrained in
downturns (Mian and Sufi 2010). Second, benefit cuts may increase income uncertainty, and therefore
precautionary saving, more in recessions than in normal times. Using a heterogeneous-agents model that
combines matching frictions in the labor market with incomplete asset markets and nominal rigidities, Ravn and
Sterk (2013) show that a reduction in consumption in favor of precautionary saving decreases aggregate
demand and firms' hiring, thereby further weakening demand. Third, recessions may be periods when the
number of available jobs tends to be rationed (Landais, Michaillat, and Saez, 2015), or periods when hiring is
less responsive to benefit policy changes more broadly (Jung and Kuester, 2015), although this remains the
subject of an intense theoretical and empirical debate.

The output effect levels off seven years after the tax cut at about 0.8 percent. In addition, cuts
in labor tax wedges have statistically significantly larger effects during periods of slack. In
such periods, a 1 percent reduction in labor tax wedges increases output (employment) by 0.7
(0.4) percent in the year of the reform and by 1.2 (1.3) percent after four years, whereas in
expansions, the impact is not statistically significant. This finding is again consistent with the
growing literature that points to larger fiscal multiplier effects during recessions.
Public spending on active labor market policies
Discretionary increases in public spending on active labor market policies are also
found to raise output and employment gradually (Figure 7). A 10 percent increase in
spending increases output and employment by about 0.3 percent four years after the shock,
and stabilizes afterward. In addition, the effect on output materializes quickly, reaching 0.2
percent one year after the shock. Given that average spending on active labor market policies
across the sample is about 1 percent of GDP, this implies a one-year-ahead multiplier of
about 1.2, consistent with other estimates reported in the literature (see Coenen and others
2012 and literature cited therein). Positive shocks to spending on active labor market policies
tend to have bigger effects in bad times, even though the difference is not statistically
significant.
C. The role of macroeconomic policies
We now study complementarities between structural and macroeconomic policies by
assessing whether the impulse response to a reform shock is shaped by the macroeconomic
policy stance—expansionary or contractionary—at the time of reform. This is done by re-
estimating equation (2) above but now computing zit as the indicator of fiscal or monetary
policy shocks. We focus on job protection and unemployment benefit reforms which the
previous section showed could entail short-term costs if carried out under slack.16
We find that expansionary fiscal or monetary policy stimulus (contraction) enhances
(weakens) the impact of both types of reforms on output and employment, over and above its
direct impact (Figure 8 and 9).17 Specifically, while employment protection legislation and
16 For product market reforms, no statistically significant difference in impulse responses for output,
employment or productivity is found across different macroeconomic policy regimes. For labor tax wedge cuts
and increases in public spending on active labor market policies, which often involve a fiscal shock in
themselves, there is no case for carrying out this exercise.
17 A potential concern regarding the analysis is that fiscal shocks may respond to output growth surprises.
However, as discussed above, these shocks are only weakly correlated with growth surprises. Moreover,
(continued)

unemployment benefit reforms increase output when accompanied by fiscal or monetary
stimulus, they have contractionary effects when carried during periods of fiscal or monetary
contraction—the difference in the response is statistically significant.18 These results are
consistent with the weaker impact of these reforms in recessions compared with expansions,
since fiscal and monetary stimulus, by boosting demand and output, contribute to shift away
from recession and toward expansion (Table A1).19
D. Robustness checks
We perform two important robustness checks on the results. First, as discussed in the previous
section, a possible concern regarding the analysis is that the results may suffer from omitted
variable bias, as reforms may be carried out across different areas at the same time. In order to
control for this source of endogeneity, equation (1) is re-estimated by including all reform
shocks in all areas simultaneously. The results obtained with this analysis are very similar to,
and not statistically different from, those obtained in the baseline specification, suggesting
that omitted bias is likely to be negligible (Figure 10).20
Second, we noted that, for all its strengths, the narrative dataset cannot be directly used to
quantify the intensity of reforms, and as a result only the average impact across major
historical reforms can be estimated. As a robustness check, we re-run our regressions using
as reform shocks the interaction between the reform dummy identified in our narrative
approach and changes in the corresponding OECD policy indicators in areas where the latter
exist.21 The point estimates from this analysis are qualitatively consistent with, but weaker
purifying our measure of fiscal shocks by purging it from the portion explained by growth surprises delivers
results that are similar to those reported here.
18 Similar results are found for employment, and also when repeating the analysis using public investment
shocks—computed similarly to government consumption shocks as the forecast error of government investment
to GDP (see Figure A1 in Appendix).
19 Table A1 reports the response of output and the smooth transition function to fiscal and monetary policy
shocks. It shows that an unexpected 1 percent of GDP increase in government consumption raises output by
0.35 percent and decreases the smooth transition function—which is bounded between 0 (extreme expansion)
and 1 (extreme recession)—by 0.04 (that is, 4 percentage points). Likewise, an expansionary monetary policy
shock of 100 basis points is found to increase output by 0.30 percent and decrease the smooth transition
function by 0.03—that is, 3 percentage points.
20 Similar results are also obtained for productivity and employment.
21 In order to compare these results with those obtained in the baseline, we scale the estimated effect by the
average change in the OECD indicator corresponding to our major reform event. For example, in the case of
product market regulation we multiply the estimated effect by 0.42, which is the average change in the OECD
indicator (of product market regulation in seven non-manufacturing industries, see Koske et al., 2015) when our
reform dummy takes value 1.

and less precisely estimated than those from the narrative approach (Figure 11). Insofar as
the true (unknown) output effect of reform is positive, this suggests that the narrative
approach may indeed better identify major reform events and thereby reduce measurement
error.
V. CONCLUSION
Labor and product market reforms are high on policy makers’ agendas in many
advanced economies. An extensive macro and micro-econometric literature has explored
empirically their impact, but little is known about their dynamic effects, and even less so
about whether these may be shaped by the state of the economy and the stance of
macroeconomic policy at the time of reform—issues that recent theoretical papers have
started to tackle. This paper fills this gap, using a new reform dataset that identifies and dates
carefully the occurrence of major reform in several key labor and product market regulation
areas, and estimate the impulse response of aggregate output, employment and labor
productivity to these reform shocks by means of a local projection method. We find that the
product and labor market reforms considered here generally pay off over the medium term,
but these gains typically materialize only gradually. Labor market reforms that often involve
short-term fiscal stimulus, such as cutting labor taxes or raising public spending on active
labor market policies, have a greater pay-off when economic conditions are weak. By
contrast, easing job protection for existing regular workers or reducing the generosity of
unemployment benefits has a weaker short-term effect, and indeed can entail costs by
lowering aggregate demand, when economic conditions are weak. Macroeconomic policy
stimulus improves the response of the economy to these reforms, over and above its
conventional effect on aggregate demand.
These findings suggest that prioritizing and sequencing reforms can enhance their
short to medium-term impact in an environment of persistent slack. Reforms that entail fiscal
stimulus will be particularly valuable, including reducing labor tax wedges and increasing
public spending on active labor market policies. Productivity-enhancing product market
reforms should also be prioritized under such circumstances, because their impact does not
hinge significantly on prevailing economic conditions—although it materializes only
gradually. Other labor market reforms can be costly in the short term, reducing rather than
increasing employment. Other than postponing them until better times, one way to address
short-term costs is through accompanying macroeconomic policy stimulus. Other options,
that are fruitful avenues for future research, may include credibly announcing today reforms
that will come into force only the future, or grandfathering them, that is applying them only
to new beneficiaries—a design feature of many of the post-global financial crisis reforms of
employment protection legislation in Europe, notably in Italy, Portugal and Spain.

REFERENCES
Abiad, Abdul, Davide Furceri, and Petia Topalova. 2015. “The Macroeconomic Effects of
Public Investment: Evidence from Advanced Economies.” IMF Working Paper
15/95, International Monetary Fund, Washington.
Aghion, P., P. Askenazy, R. Bourlès, G. Cette, and N. Dromel, 2009a, “Education, Market
Rigidities and Growth,” Economics Letters, 102(1), pp. 62-65.
Alesina, A., S. Ardagna, G. Nicoletti, and F. Schiantarelli, 2005, “Regulation and
Investment,” Journal of the European Economic Association, 3(4), pp.791-825.
Arpaia, Alfonso, Werner Roeger, Janos Varga and Jan in’t Veld. 2007. “Quantitative
Assessment of Structural Reforms: Modeling the Lisbon Strategy.” European
Commission Economic Paper No. 282.
Auerbach, Alan, and Youri Gorodnichenko. 2012. “Measuring the Output Responses to
Fiscal Policy.” American Economic Journal: Economic Policy 4 (2): 1–27.
Barone, G. and F. Cingano, 2011, “Service Regulation and Growth: Evidence from OECD
Countries,” Economic Journal, 121(555), pp. 931-957.
Ben Zeev, Nadav, and Evi Pappa. 2014. “Chronicle of a War Foretold: The Macroeconomic
Effects of Anticipated Defense Spending Shocks.” CEPR Discussion Paper 9948,
Centre for Economic Policy Research, London.
Bassanini, Andrea, and Romain Duval. 2009. “Unemployment, Institutions, and Reform
Complementarities: Re-Asessing the Aggregate Evidence for OECD Countries.”
Oxford Review of Economic Policy 25 (1): 40–59.
Bassanini, Andrea, Luca Nunziata, and Danielle Venn. 2009. “Job Protection Legislation and
Productivity Growth in OECD Countries.” Economic Policy 24 (58): 349–402.
Blanchard, Olivier, and Francesco Giavazzi. 2003. “Macroeconomic Effects of Regulation
and Deregulation in Goods and Labour Markets.” Quarterly Journal of Economics
118 (3): 879–907.
Blanchard, Olivier, and Daniel Leigh. 2013. “Growth Forecast Errors and Fiscal Multipliers.”
American Economic Review: Papers and Proceedings 103 (3): 117–20.
Blanchard, Olivier, and Justin Wolfers. 2000. “The Role of Shocks and Institutions in the
Rise of European Unemployment: The Aggregate Evidence.” The Economic Journal
110 (462): 1–33.

Bordon, Anna Rose, Christian Ebeke and Kazuko Shirono. 2016. “When Do Structural
Reforms Work? On the Role of the Business Cycle and Macroeconomic Policies.”
IMF Working Paper 16/62, International Monetary Fund, Washington.
Bouis, Romain, Orsetta Causa, Lilas Demmou and Romain Duval. 2012. “How Quickly
Does Structural Reform Pay Off? An Empirical Analysis of the Short-term Effects of
Unemployment Benefit Reform.” IZA Journal of Labor Policy 1 (1): 1–12.
Bouis, Romain, and Romain Duval. 2011. “Raising Potential Growth after the Crisis: A
Quantitative Assessment of the Potential Gains from Various Structural Reforms in
the OECD Area and Beyond.” OECD Economics Department Working Paper 835,
Paris.
Bouis, Romain, Romain Duval, and Johannes Eugster. 2016. “Product Market Deregulation
and Growth: New Country-Industry-Level Evidence.” IMF Working Paper 16/62,
International Monetary Fund, Washington.
Bourlès, Renaud, Gilbert Cette, Jimmy Lopez, Jacques Mairesse and Giuseppe Nicoletti,
2013, “Do Product Market Regulations In Upstream Sectors Curb Productivity
Growth? Panel Data Evidence for OECD Countries,” The Review of Economics and
Statistics 95 (5): 1750–1768.
Cacciatore, Matteo, Romain Duval, Giuseppe Fiori, and Fabio Ghironi. 2016a. “Short-Term
Pain for Long-Term Gain: Market Deregulation and Monetary Policy in Small Open
Economies.” Journal of International Money and Finance 68 (November): 358–385.
Cacciatore, Matteo, Romain Duval, Giuseppe Fiori, and Fabio Ghironi. 2016b. “Market
Reforms in the Time of Imbalance.” Journal of Economic Dynamics and Control.
Cacciatore, Matteo, and Giuseppe Fiori. 2016. “The Macroeconomic Effects of Goods and
Labor Market Deregulation.” Review of Economic Dynamics 20 (1): 1–24.
Chetty, Raj. 2008. “Moral Hazard versus Liquidity and Optimal Unemployment Insurance.”
Journal of Political Economy 116 (2): 173–234.
Coenen, Günter, Christopher J. Erceg, Charles Freedman, Davide Furceri, Michael Kumhof,
René Lalonde, Douglas Laxton, and others. 2012. “Effects of Fiscal Stimulus in
Structural Models.” American Economic Journal: Macroeconomics 4 (1): 22–68.
Corsetti, Giancarlo, Andre Meier, and Gernot J. Müller. 2012. “What Determines
Government Spending Multipliers?” IMF Working Paper 12/150, International
Monetary Fund, Washington.

Dabla-Norris, E., S. Guo, V. Haksar, K. Kochhar, K. Wiseman and A. Zdzienicka. 2015.
“The New Normal: A Sector-Level Perspective on Productivity Trends in Advanced
Economies.” IMF Staff Discussion Note No. 15/03.
Devries, Pete, Daniel Leigh, Jaime Guajardo, and Andrea Pescatori. 2011. “A New Action-
Based Dataset of Fiscal Consolidation.” IMF Working Paper 11/128, International
Monetary Fund, Washington.
Drazen, Allan, and William Easterly. 2001. “Do Crises Induce Reform? Simple Empirical
Tests of Conventional Wisdom.” Economics and Politics, 13 (2), 129–157.
Duval, Romain, Davide Furceri, Joao Jalles, and Huy Nguyen. Forthcoming. “A New
Narrative Database of Product and Labor Market Reforms in Advanced Economies.”
IMF Working Paper, International Monetary Fund, Washington.
Eggertsson, Gauti, Andrea Ferrero, and Andrea Raffo. 2014. “Can Structural Reforms Help
Europe?” Journal of Monetary Economics 61 (C): 2–22.
Everaert, Luc and Werner Schule. 2008. “Why it Pays to Synchronize Structural Reforms in
the Euro Area across Markets and Countries.” IMF Staff Papers 55 (2), 356–66.
Fiori, G., G. Nicoletti, S. Scarpetta, and F. Schiantarelli, 2012, “Employment Outcomes and
the Interaction between Product and Labor Market Deregulation: Are They
Substitutes or Complements?” Economic Journal, 122 (558), pp. 79-104.
Forni, Mario, and Luca Gambetti. 2010. “Fiscal Foresight and the Effects of Government
Spending.” CEPR Discussion Paper 7840, Centre for Economic Policy Research,
London.
Gomes, Sandra, Pierre Jacquinot, Matthias Mohr and Massimiliano Pisani. 2011. “Structural
Reforms and Macroeconomic Performance in the Euro Area Countries: A Model-
based Assessment.” ECB Working Paper No. 1323.
Granger, Clive W. J., and Timo Teräsvirta. 1993. Modelling Nonlinear Economic
Relationships. New York: Oxford University Press.
Inklaar, R., M. Timmer, and B. Van Ark. 2008. “Market Services Productivity Growth across
Europe and the US.” Economic Policy 23 (53): 139–94.
Jordà, Òscar. 2005. “Estimation and Inference of Impulse Responses by Local Projections.”
American Economic Review 95 (1): 161–82.
Jordà, Òscar, and Alan Taylor. 2013. “The Time for Austerity: Estimating the Average
Treatment Effect of Fiscal Policy.” NBER Working Paper, National Bureau of
Economic Research, Cambridge, Massachusetts.

Jung, Philip, and Keith Kuester. 2015. “Optimal Labor-Market Policy in Recessions.”
American Economic Journal: Macroeconomics 7 (2): 124–56.
Koske, I., I.Wanner, R. Bitetti, and O. Barbiero (2015). ‘The 2013 Update of the OECD Product
Market Regulation Indicators: Policy Insights for OECD and Non- OECD Countries’, OECD
Economics Department Working Papers, No. 1200.
Landais, Camille, Pascal Michaillat, and Emmanuel Saez. 2015. “A Theory of Optimal
Unemployment Benefit Insurance over the Business Cycle.” NBER Working Paper
16526, National Bureau of Economic Research, Cambridge, Massachusetts.
Leeper, Eric M., Alexander W. Richter, and Todd B. Walker. 2012. “Quantitative Effects of
Fiscal Foresight.” American Economic Journal: Economic Policy 4 (2): 115–44.
Leeper, Eric M., Todd B. Walker, and Shu-Chun S. Yang. 2013. “Fiscal Foresight and
Information Flows.” Econometrica 81 (3): 1115–45.
Mian, Atif R., and Amir Sufi. 2010. “Household Leverage and the Recession of 2007 to
2009”, NBER Working Paper 15896, National Bureau of Economic Research,
Cambridge, Massachusetts.
Hagedorn, Marcus, Fatih Karahan, Iourii Manovskii, and Kurt Mitman. 2013.
“Unemployment Benefits and Unemployment in the Great Recession: The Role of
Macro Effects.” NBER Working Paper 19499, National Bureau of Economic
Research, Cambridge, Massachusetts.
Nickell, Steven, Luca Nunziata and Wolfgang Ochel. 2005. “Unemployment in the OECD
since the 1960s: What Do We Know?” The Economic Journal 115 (500): 1–27.
Nicoletti, G. and S.Scarpetta, 2003, “Regulation, Productivity and Growth: OECD
Evidence,” Economic Policy, 18 (36), pp. 9-72.
Organisation for Economic Co-operation and Development (OECD). 2016. “Economic
Policy Reforms: Going for Growth,” Paris.
Prati, Alessandro, Massimiliano Gaetano Onorato, and Chris Papageorgiou. 2013. “Which
Structural Reforms Work and Under What Institutional Environment? Evidence from
a New Data Set on Structural Reforms.” Review of Economics and Statistics 95 (3):
946–68.
Perotti, Roberto. 1999. “Fiscal Policy in Good Times and Bad.” Quarterly Journal of
Economics 114 (4): 1399–436.
Rajan, Raghuram G., and Luigi Zingales. 1998. “Financial Dependence and Growth.”
American Economic Review 88 (3): 559–86.

Ravn, Morten O., and Vincent Sterk. 2013. “Job Uncertainty and Deep Recessions.” Meeting
Paper 921, Society for Economic Dynamics, Stonybrook, New York.
Romer, Christina D., and David H. Romer. 1989. “Does Monetary Policy Matter? A New
Test in the Spirit of Friedman and Schwartz.” In NBER Macroeconomics Annual
1989, edited by Olivier J. Blanchard and Stanley Fischer, 121–70. Cambridge,
Massachusetts: MIT Press.
Romer, Christina D., and David H. Romer. 2004. “A New Measure of Monetary Shocks:
Derivation and Implications.” American Economic Review 94 (4): 1055–84.
Romer, Christina D., and David H. Romer. 2010. “The Macroeconomic Effects of Tax
Changes: Estimates Based on a New Measure of Fiscal Shocks.” American Economic
Review 100 (3): 763–801.
Romer, Christina D., and David H. Romer. 2015. “New Evidence on the Impact of Financial
Crises in Advanced Countries.” NBER Working Paper 21021, National Bureau of
Economic Research, Cambridge, Massachusetts.
Tommasi, Mariano, and Andres Velasco. 1996. “Where Are We in the Political Economy of
Reform?” Journal of Policy Reform, 1 (2), 187–238.
Stock, James H., and Mark W. Watson. 2007. “Why Has U.S. Inflation Become Harder to
Forecast?” Journal of Money, Credit and Banking 39 (S1): 3–33.

Table 1. Examples of reforms identified
Reform (+)
or Counter-
reform (–)
Implementation
Year Area Country Content
Normative Language featured in
OECD Country Survey
Mention
in later
Surveys
Large
Change in
OECD
Indicator
+ 1984
Product
market
(telecommun-
ications)
United
States
Antitrust suit against
AT&T
The most important deregulatory move
in telecommunications came with the
antitrust suit against AT&T by the
United States. Competition for long-
distance voice services entered a new
phase in 1984.
1986,
1989,
2004
No
+ Late-1994 /1995
Employment
protection
legislation
Spain
Draft law modifying the
current law regulating
employment. It introduces
dismissals of permanent
workers.
... far-reaching labor market reforms
aimed at lifting barriers to job creation.
A decree was passed at the end of
December 1993, and a draft has been
presented to Parliament and is
expected to become law by the middle
of 1994.
No Yes for 1995
– 1970
Employment
protection
legislation
ItalyAct of 1970, referred as
the "workers' statute"
The Act of 1970 referred to as the
"workers' statute" laid the basis for
employer-employee relations and
regulations concerning hiring. The two
main sources of rigidity seem to be the
regulations governing hiring and firing.
The conditions and procedures for
hiring workers are extremely stringent,
particularly for large firms.
1986
+ 1994Unemployment
benefitsDenmark
Labor market reforms of
1994: activation of the
unemployed, limiting the
duration of unemployment
benefits, enforcing job
availability criteria,
compulsory full-time
activation, stricter
eligibility criteria.
The measures taken ...are steps in the
right direction. Training and education
offers are fully operational, a foundation
has been established for reducing the
duration of unemployment benefits on
a sustainable basis.
2000
Yes for 1994
(replacement
rate); other
aspects
(duration,
eligibility,
active
policies) not
captured

24
Table 2. Matrix of correlations between reform shocks and other key variables
Product market reform EPL reform Unemployment benefits
reform
ALMP shocks Labor tax
wedge shocks
Fiscal policy
shocks
Monetary policy
shocks
State business
cycle
Change of state
business cycle
Product market reform 1
EPL reform -0.011 1
Unemployment benefits reform -0.045 -0.023 1
ALMP shocks -0.065 -0.086 -0.046 1
Labor tax wedge shocks -0.045 -0.118 0.110 0.153 1
Fiscal policy shocks 0.096 0.138 0.025 0.065 -0.033 1
Monetary policy shocks 0.152 0.094 0.019 0.029 -0.061 0.068 1
State business cycle -0.102 0.096 -0.135 0.135 -0.005 -0.028 -0.186 1
Change of state business cycle -0.090 0.034 -0.044 0.039 0.108 0.056 -0.156 0.549 1
25
Figure 1. Number of reforms shocks (26 advanced economies, 1970-2013)
0
10
20
30
40
50
60
70
80
90

Figure 2. Impulse responses to product market deregulation: country-level results
Panel A. Baseline
Note: t=0 is the year of the reform; dotted lines denote 90 percent confidence bands. Estimates based on
equation (1).
Figure 3.1. Effect of Product Market Reforms
-0.5
0
0.5
1
1.5
2
2.5
3
3.5
-1 0 1 2 3 4
-1.5
-1
-0.5
0
0.5
1
1.5
2
2.5
-1 0 1 2 3 4
-1
-0.5
0
0.5
1
1.5
2
2.5
-1 0 1 2 3 4
1. Output(percent)
2. Employment(percent ge)
3. Productivity(percent )

Figure 2. Impulse responses to product market deregulation: country-level results
Panel B. Low vs. high credit growth
Note: t=0 is the year of the reform Solid blue lines denote the response to reform and dashed lines denote 90
percent confidence bands. Solid yellow lines denote the unconditional (baseline) response presented in Panel A.
Estimates based on equation (2).
-6
-4
-2
0
2
-1 0 1 2 3 4
-5
0
5
10
-1 0 1 2 3 4
-4
-2
0
2
-1 0 1 2 3 4
-5
0
5
-1 0 1 2 3 4
-4
-2
0
2
4
-1 0 1 2 3 4
-2
0
2
4
-1 0 1 2 3 4
Output, percent1. Low Credit Growth 2. High Credit Growth
Employment, percent
3. Low Credit Growth 4. High Credit Growth
Producitivity, percent
5. Low Credit Growth 6. High Credit Growth

Figure 3. Impulse responses to product market deregulation: sector-level results
Panel A. Backward linkages
Note: t=0 is the year of the reform; dotted lines denote 90 percent confidence bands. Estimates based on
equation (1).
Figure 3.1. Effect of Product Market Reforms-Backward Linkages
-0.1
0
0.1
0.2
0.3
0.4
0.5
0.6
0.7
-1 0 1 2 3 4
-0.15
-0.1
-0.05
0
0.05
0.1
0.15
0.2
0.25
0.3
-1 0 1 2 3 4
-0.2
-0.1
0
0.1
0.2
0.3
0.4
0.5
0.6
0.7
-1 0 1 2 3 4
1. Output(percent)
2. Employment(percent)
3. Productivity(percent )

Figure 3. Impulse responses to product market deregulation: sector-level results
Panel B. Forward linkages
Note: t=0 is the year of the reform; dotted lines denote 90 percent confidence bands. Estimates based on
equation (1).
Figure 3.2. Effect of Product Market Reforms-Forward Linkages
-0.1
0
0.1
0.2
0.3
0.4
0.5
0.6
-1 0 1 2 3 4
-0.15
-0.1
-0.05
0
0.05
0.1
0.15
0.2
-1 0 1 2 3 4
-0.1
0
0.1
0.2
0.3
0.4
0.5
0.6
-1 0 1 2 3 4
1. Output(percent)
2. Employment(percent)
3. Productivity(percent )

Figure 4. Impulse responses to regular employment protection legislation reform
Panel A. Baseline
Note: t=0 is the year of the reform Solid blue lines denote the response to reform and dashed lines denote 90
percent confidence bands. Estimates based on equation (1).
Figure 3.3. Effect of EPL Reforms
-2
-1.5
-1
-0.5
0
0.5
1
1.5
2
2.5
3
-1 0 1 2 3 4
-2
-1.5
-1
-0.5
0
0.5
1
1.5
2
2.5
3
3.5
-1 0 1 2 3 4
-2
-1.5
-1
-0.5
0
0.5
1
1.5
2
-1 0 1 2 3 4
1. Output(percent)
2. Employment(percent)
3. Productivity(percent )

Figure 4. Impulse responses to regular employment protection legislation reform
Panel B. Low vs. High Growth
Note: t=0 is the year of the reform Solid blue lines denote the response to reform and dashed lines denote 90
percent confidence bands. Solid yellow lines denote the unconditional (baseline) response presented in Panel A.
Estimates based on equation (2).
-5
-3
-1
1
-1 0 1 2 3 4
-1
4
9
-1 0 1 2 3 4
-9
-4
1
-1 0 1 2 3 4
-1
4
9
-1 0 1 2 3 4
-5
0
5
10
-1 0 1 2 3 4
-10
-5
0
5
-1 0 1 2 3 4
Output, percent1. Low Growth 2. High Growth
Employment, percent
3. Low Growth 4. High Growth
Producitivity, percent
5. Low Growth 6. High Growth

Figure 5. Impulse responses to unemployment benefit reform
Panel A. Baseline
Note: t= is the year of the reform Solid blue lines denote the response to a reform and dashed lines denote 90
percent confidence bands. Estimates based on equation (1).
Figure 3.5. Effect Unemployment Benefits Refoms
-2
-1
0
1
2
3
4
5
-1 0 1 2 3 4
-1
0
1
2
3
4
5
-1 0 1 2 3 4
-2.5
-2
-1.5
-1
-0.5
0
0.5
1
1.5
-1 0 1 2 3 4
1. Output(percent)
2. Eemployment(percent)
3. Productivity(percent )

Figure 5. Impulse responses to unemployment benefit reform
Panel B. Low vs. High Growth
Note: t=0 is the year of the reform Solid blue lines denote the response to a reform and dashed lines denote 90
percent confidence bands. Solid yellow lines denote the unconditional (baseline) response presented in Panel A.
Estimates based on equation (2).
Conditions
-10
-5
0
5
-1 0 1 2 3 4
-5
0
5
10
15
-1 0 1 2 3 4
-5
0
5
-1 0 1 2 3 4
-5
0
5
10
-1 0 1 2 3 4
-4
-2
0
2
4
-1 0 1 2 3 4
-10
-5
0
5
-1 0 1 2 3 4
Output, percent1. Low Growth 2. High Growth
Employment, percent
3. Low Growth 4. High Growth
Producitivity, percent
5. Low Growth 6. High Growth

Figure 6. Impulse responses to a one percentage point reduction in the labor tax wedge
Panel A. Baseline
Note: t=0 is the year of the reform Solid blue lines denote the response to a 1 percentage point reduction in
labor tax wedges and dashed lines denote 90 percent confidence bands. Estimates based on equation (1).
Figure 3.9. Effect of Labor Tax Wedge Cuts
0
0.1
0.2
0.3
0.4
0.5
0.6
0.7
0.8
0.9
1
-1 0 1 2 3 4
0
0.2
0.4
0.6
0.8
1
1.2
-1 0 1 2 3 4
-0.5
-0.4
-0.3
-0.2
-0.1
0
0.1
0.2
-1 0 1 2 3 4
1. Output(percent)
2. Employment(percent)
3. Productivity(percent )

Figure 6. Impulse responses to a one percentage point reduction in the labor tax wedge
Panel B. Low vs. High Growth
Note: t=0 is the year of the reform Solid blue lines denote the response to a 1 percentage point reduction in
labor tax wedges and dashed lines denote 90 percent confidence bands. Solid yellow lines denote the
unconditional (baseline) response presented in Panel A. Estimates based on equation (2).
0
1
2
-1 0 1 2 3 4
-1
0
1
2
-1 0 1 2 3 4
0
1
2
3
-1 0 1 2 3 4
-1
0
1
2
-1 0 1 2 3 4
-1
0
1
-1 0 1 2 3 4
-1
-0.5
0
0.5
1
-1 0 1 2 3 4
Output, percent1. Low Growth 2. High Growth
Employment, percent
3. Low Growth 4. High Growth
Producitivity, percent
5. Low Growth 6. High Growth

Figure 7. Impulse responses to a 10 percent increase in ALMP spending
Panel A. Baseline
Note: t=0 is the year of the reform Solid blue lines denote the response to a 1o percent increase in ALMP
spending and dashed lines denote 90 percent confidence bands. Estimates based on equation (1).
Figure 3.7. Effect of Active Labor Market Policies
-0.2
-0.1
0
0.1
0.2
0.3
0.4
0.5
0.6
-1 0 1 2 3 4
-0.2
-0.1
0
0.1
0.2
0.3
0.4
0.5
0.6
0.7
-1 0 1 2 3 4
-0.3
-0.2
-0.1
0
0.1
0.2
0.3
-1 0 1 2 3 4
1. Output(percent)
2. Employment(percent)
3. Productivity(percent )

Figure 7. Impulse responses to a 10 percent increase in ALMP spending
Panel B. Low vs. High Growth
-0.5
0
0.5
1
1.5
-1 0 1 2 3 4
-2
-1
0
1
-1 0 1 2 3 4
-1
-0.5
0
0.5
1
-1 0 1 2 3 4
-1
0
1
2
-1 0 1 2 3 4
-0.5
0
0.5
1
1.5
-1 0 1 2 3 4
-2
-1
0
1
-1 0 1 2 3 4
Output, percent1. Low Growth 2. High Growth
Employment, percent
3. Low Growth 4. High Growth
Producitivity, percent
5. Low Growth 6. High Growth

Figure 8. Impulse responses to reforms under alternative fiscal policy stances
Panel A. Employment protection legislation reforms
Panel B. Unemployment benefit reforms
Note: t=0 is the year of the EPL (UB) reform. Solid blue lines denote the response to reform in periods of fiscal
expansion (contraction) and dashed lines denote 90 percent confidence bands. Solid yellow lines denote the
unconditional (baseline) response presented in Figure 3 (4). Estimates based on equation (2).
-3
-1
1
-1 0 1 2 3 4
-1
4
-1 0 1 2 3 4
Output, percent1. Fiscal Contraction 2. Fiscal Expansion
Conditions
-10
-5
0
5
-1 0 1 2 3 4
-10
0
10
20
-1 0 1 2 3 4
Output, percent1. Low Growth 2. High Growth

Figure 9. Impulse responses to reforms under alternative monetary policy stances
Panel A. Employment protection legislation reforms
Panel A. Unemployment benefit reforms
Note: t=0 is the year of the EPL (UB) reform. Solid blue lines denote the response to reform in periods of fiscal
expansion (contraction) and dashed lines denote 90 percent confidence bands. Solid yellow lines denote the
unconditional (baseline) response presented in Figure 3 (4). Estimates based on equation (2).
-5
0
5
10
-1 0 1 2 3 4
-5
0
5
-1 0 1 2 3 4
Output, percent1. Contractionary Monetary Policy 2. Expansionary Monetary Policy
Panel A. EPL
-10
-5
0
5
-1 0 1 2 3 4
0
5
10
-1 0 1 2 3 4
Output, percent1. Contractionary Monetary Policy 2. Expansionary Monetary Policy
Panel B. UB

40
Figure 10. Robustness check—Estimated effect on output when controlling for all types of reforms
Product market reforms Employment protection legislation reforms Unemployment benefit reforms
Labor tax wedge cuts Increases in ALMP spending
Note: t=0 is the year of the reform Solid blue lines denote the response to reform and dashed lines denote 90 percent confidence bands. Dashed red lines denote
the response to reform when all reforms are considered simultaneously in the estimated equation. Estimates based on equation (1).
-1.5
-1
-0.5
0
0.5
1
1.5
2
2.5
3
-1 0 1 2 3 4
-2
-1
0
1
2
3
-1 0 1 2 3 4
-2
-1
0
1
2
3
4
5
-1 0 1 2 3 4
0
0.2
0.4
0.6
0.8
1
1.2
-1 0 1 2 3 4 -0.2
0
0.2
0.4
0.6
0.8
-1 0 1 2 3 4

41
Figure 11. Robustness check—Estimated effect of reforms on output when accounting
for the intensity of reforms
Panel A. Product market reforms
Note: t=0 is the year of the reform. Solid blue lines denote the output response to a reform with a magnitude
equivalent to a change of 0.41 in the OECD indicator, and dashed lines denote 90 percent confidence bands.
Estimates based on equation (1).
Panel B. Employment protection legislation reforms
Note: t=0 is the year of the reform. Solid blue lines denote the output response to a reform with a magnitude
equivalent to a change of 0.12 in the OECD indicator, and dashed lines denote 90 percent confidence bands.
Estimates based on equation (1).
-1
-0.5
0
0.5
1
1.5
2
2.5
-1 0 1 2 3 4
-2
-1.5
-1
-0.5
0
0.5
1
1.5
2
2.5
3
-1 0 1 2 3 4

Appendix
Figure A1. Impulse responses to reforms under alternative fiscal policy stances—with
fiscal stance measured using public investment shocks
Panel A. Employment protection legislation reforms
Panel A. Unemployment benefit reforms
Note: t=0 is the year of the EPL (UB) reform. Solid blue lines denote the response to reform in periods of fiscal
expansion (contraction) and dashed lines denote 90 percent confidence bands. Solid yellow lines denote the
unconditional (baseline) response presented in Figure 3 (4). Estimates based on equation (2), using public
investment shocks to compute the fiscal policy regime variable.
-5
0
5
-1 0 1 2 3 4
-5
0
5
-1 0 1 2 3 4
Output, percent1. Fiscal Contraction 2. Fiscal Expansion
Conditions
-10
-5
0
5
-1 0 1 2 3 4
-10
0
10
20
-1 0 1 2 3 4
Output, percent1. Low Growth 2. High Growth

Table A1. The effect of fiscal and monetary shocks on output and state of the economy
Output (%) 𝐹(𝑧𝑖𝑡)
Fiscal shock (t) 0.352***
(3.37)
-0.043***
(-3.58)
Monetary shock (t) 0.302**
(2.08)
-0.029**
(2.06)
Country FE Yes Yes Yes Yes
Year FE Yes Yes Yes Yes
N 434 350 434 350
R2 0.54 0.67 0.52 0.66
Note: fiscal (monetary) policy shocks are identified as the forecast error of the ratio of government consumption
expenditure to GDP (of the policy rate, orthogonal to news to output and inflation). The table reports the
response of output and the state of the economy—identified by the smooth transition function 𝐹(𝑧𝑖𝑡)—to an unexpected increase (decrease) in government spending (in the policy rate) of 1 percent of GDP
(100 basis points). T-statistics based on clustered-robust standard errors in parenthesis. *** and ** denote
significance at 1 and 5 percent, respectively.