Diversification Strategies and Firm Performance: A Sample ...
MSc. in Finance and International Business Author: Selen Gül
Department of Business Administration Advisor: Valerie Smeets
The Effects of Integration Strategies on Firm Performance
An Empirical Study on Danish Manufacturing Firms
Abstract:
The firms’ diversification strategy choices and their impact on corporate performance have been the center of attention both empirically and theoretically in the fields of strategy and finance for more than 30 years. However in general, previous studies have analyzed the integration-performance relationship without differentiating the industries that the firms were operating in, but rather the samples were pooled across industries. The aim of this paper is to investigate the performance effects of vertical, horizontal, unrelated integration and un-diversification strategies, by using a sample of 147 Danish manufacturing companies distinguished among 5 large industries, through the years 2009 to 2005. Empirical evidence shows that horizontal (related) integrated companies are outperforming the corporate performance of unrelated diversified firms, and the structure of the market, the level of concentration have varying effects on performance for each type of industry. Out of 5 industries, the manufacture of food products has the highest average performance measure, and the empirical results underline the significant and positive effect of the horizontal integration strategy for the manufacture of food products and manufacture of machinery and equipment industries that were subject to be tested.
August 2011
Aarhus School of Business, Aarhus University

Selen Gül The Effects of Integration Strategies on Firm Performance
1
Table of Contents
1. Introduction ................................................................................................................ 3
1.1.Research Questions............................................................................................ 4
1.2.Structure of the Thesis ....................................................................................... 5
2. Literature Review ........................................................................................................ 6
2.1.Theories of Vertical Integration ........................................................................ 6
2.1.1. Make or Buy Decision ..................................................................... 6
2.1.2. The Transaction Cost Theory .......................................................... 7
2.1.3. The Property Rights Theory ............................................................ 8
2.1.3.1.Benefits and Costs of Contracts........................................... 9
2.1.4. The Theory of Relational Contracts ................................................ 10
2.1.5. Is Vertical Integration Beneficial for the Firm? .............................. 10
2.1.6. Empirical Evidence on Vertical Mergers ........................................ 11
2.2.Horizontal Integration ........................................................................................ 12
2.2.1. Economies of Scale and Scope ........................................................ 13
2.2.2. The Learning Economy ................................................................... 14
2.2.3. Empirical Evidence on Horizontal Mergers .................................... 15
2.3.Diversification ................................................................................................... 16
2.3.1. Product Diversification .................................................................... 17
2.3.2. Geographic Diversification .............................................................. 17
2.3.3. The Determinants and Motives for Diversification ......................... 18
2.3.4. The Resource-Based View .............................................................. 19
2.3.5. Diversification and Firm Performance ............................................ 20
2.3.6. Empirical Evidence on Diversification and Firm Performance ...... 22
3. Development of Hypotheses ........................................................................................ 24
4. Methodology ................................................................................................................. 26
5. Data Construction........................................................................................................ 28
5.1.Sample Selection ............................................................................................... 28
5.2.Variables Measurement ..................................................................................... 30
5.2.1. Performance Measures (Dependent Variables) .............................. 30
5.2.2. Independent Variables ..................................................................... 31
5.2.3. Control Variables ............................................................................. 32

Selen Gül The Effects of Integration Strategies on Firm Performance
2
5.3.Limitations ......................................................................................................... 36
6. General Descriptive Analysis of Each Industry ........................................................ 37
6.1.Manufacture of Basic Pharmaceuticals and Pharmaceutical Preparations ........ 37
6.2.Manufacture of Food Products .......................................................................... 41
6.3.Manufacture of Chemicals and Chemical Products .......................................... 44
6.4.Manufacture of Furniture ................................................................................... 46
6.5.Manufacture of Machinery and Equipment ....................................................... 48
7. Industry Comparisons ................................................................................................. 51
8. Empirical Findings and Discussion of Results .......................................................... 53
8.1.Manufacture of Food Industry ........................................................................... 53
8.2.Manufacture of Machinery and Equipment Industry ........................................ 57
8.3.Discussion of Results......................................................................................... 60
9. Conclusion .................................................................................................................... 63
References ........................................................................................................................... 65
Appendices ......................................................................................................................... 72

Selen Gül The Effects of Integration Strategies on Firm Performance
3
1. INTRODUCTION
In this new era, where technological innovations are growing at a fast pace leading to
a more globalized world, corporations are facing a change in their form, structure and scope.
These new technologies engendered goods to be produced at lower costs, compared to what
organizations could achieve using older technologies. In order to benefit from these
production opportunities, firms require reliable supplies of inputs, access to widespread
distribution and retail outlets. Based on these necessities, the relationships among
manufacturers, their suppliers, and their distributors have been affected by this product line
and volume expansion.
In relation to this phenomenon, the question of the diversification-performance
relation, has been generally the most studied in the literature. The scholars’ main focus has
been on the value enhancing or destructive effects of diversification, and the conclusions vary
based on the perspectives of the studies that are conducted. Santalo & Becerra (2008)
underline that, while several authors have found strong evidence of trading at a discount for
diversified firms, supporters indicate that diversified firms are more productive compared to
stand-alone businesses. Moreover, the early contributions of Rumelt (1974) and Penrose
(1995) indicate that, as firms diversify into more unrelated areas, a lower performance
outcome is more likely.
Besides the effects of unrelated diversification and firm value, the companies may
initially choose to either vertically or horizontally integrate. Manufacturing firms increasingly
choose to vertically integrate; meaning that, rather than relying on independent suppliers,
factors and agents, they choose to produce the raw materials themselves and even distribute
finished goods. Moreover, new production technologies have given firms the opportunity to
exert scope economies by producing a wider range of products at a lower cost, compared to
be produced separately, leading them to horizontally integrate. (Besanko et. al, 2007)
Through diversification within their areas of business, the companies desire to reduce costs
and improve market effectiveness by utilizing economies of scale and scope.
Besides these integration strategies, geographic diversification plays a key role in the
strategic behavior of the large companies and their corporate performance. The company’s
expansion to different geographic locations as to different global regions and countries would
define international diversification (Hitt et. al, 1997) Its importance comes from the utilization
of the foreign market opportunities.
The research on diversification and firm value has focused primarily on US and
European based companies, without taking the performance effects of vertical and horizontal

Selen Gül The Effects of Integration Strategies on Firm Performance
4
integration into consideration. In addition, there are few studies that have focused on a single
country, as Kahloul & Hallara (2010) evaluated the performance effects of the French firms.
This paper will evaluate the performance measures by combining the impacts of unrelated
diversification and as well as vertical, horizontal integration strategies and remaining
undiversified. Moreover, in order to specify the results and overcome the socio-cultural
differences among countries, the main focus will be on Danish manufacturing companies and
the outcomes are to be evaluated based on five different industries.
1.1. Research Questions
Based on the definitions mentioned above, it is crucial to highlight the relationship
between firm performance and its level of integration strategies. By extending the study of
diversification-firm performance analyzers (Penrose, 1995; Rumelt, 1974; Bettis, 1981), the
aim of this paper is to question whether firms with an unrelated diversification, horizontal
integration, vertical integration or un-diversification strategy perform better or worse
compared to each other, and how these choices affect the firm performance. Prior studies
generally have taken the effect of integration strategies homogenous across the industries,
whereas this study investigates the effect of the strategies on performance by differentiating
the industries. This homogenous approach is neglected since different industries bear different
structural characteristics, which will lead to various average profits in each industry (Bettis &
Hall, 1982), and the type of concentration and competition within an industry are the leading
factors that orientate the companies to integrate or not (Penrose, 1995). The questions to be
addressed are as follows:
• What is the dominant integration strategy that each industry embraces and
which one has the highest affect on performance?
• How does the level of concentration change among the industries and does it
have a relation with the strategies chosen?
• Does the integration strategies have an impact on corporate performance and
do these effects differ based on the industries?
• Does the number of countries the firm is operating in, have an impact on firm
operating performance?

Selen Gül The Effects of Integration Strategies on Firm Performance
5
1.2.Structure of the Thesis
The next section will highlight the theoretical and empirical findings on the topic.
Section 3 develops the hypothesis based on the theoretical and empirical arguments
mentioned in the literature review. Section 4 gives in depth information of the methodology
used, and Section 5 describes the data collection procedure. Section 6 presents the summary
statistics for the industries involved in the study. Section 7 illustrates the comparisons among
these industries based on their summary statistics. Section 8 presents the empirical findings
and the discussion of the results, and finally, Section 9 makes concluding remarks regarding
the study.

Selen Gül The Effects of Integration Strategies on Firm Performance
6
2. LITERATURE REVIEW 2.1.Theories of Vertical Integration
Coase (1937) suggests that the introduction of the firm is initially based on the
existence of the marketing costs. The number of transactions or the activities of the firm
within its boundaries is the determining component in assessing the size of the firm, rather
than its output. These boundaries are defined as the vertical boundaries since these activities
are related at the various levels of the supply chain. Sudarsanam (2010) defines vertical
integration as “the combination of successive activities in a vertical chain under common
coordination and control of a single firm.” (p. 153) Vertical integration defines the activities
that the company performs within its boundaries, compared to the purchases from
independent firms in the market (Besanko et.al, 2007). In other words, vertical merger
replaces two or more independent firms with a single firm, and rather than relying on arm’s
length market-based transactions or contractual dealings, it internalizes the coordination of the
successive activities of the firm. Fan & Goyal (2006) indicate that vertical mergers procure
acquiring companies with ownership and control over contiguous stages of production. These
mergers allow firms to substitute internal exchanges within the boundaries of the firm for
contractual or market exchanges. Although vast amounts of theoretical studies on vertical
integration exist, there is inadequate number of empirical work on vertical mergers, and the
ones conducted are based on small samples.
2.1.1. Make-or-Buy Decision
Make-or-Buy decisions address the questions of: Why do some firms prefer a
vertically integrated structure, while others specialize in one stage of production and
outsource the remaining stages to other companies? In other words, should a firm produce its
own inputs, buy them in the spot market or preserve the relationship with a specific supplier.
This decision determines the firm's level of vertical integration, since every decision identifies
which operations the firm will engage in and which it will outsource from the suppliers
(Walker & Weber, 1984). This notion is concerned with the decision whether to integrate
backwards, which is “to internalize production of an input rather than source it from an
external supplier.” (Sudarsanam, 2010, p. 158) Therefore the ‘make’ part of the decision
emphasizes that ownership is joint and control rights are integrated, whereas under the latter,
they are separate. Moreover, the costs and benefits of either alternative have to be taken into
consideration. For instance, this choice may depend on a range of factors such as; “the current
and future availability of spot markets for arm’s length transactions, the cost of sourcing from

Selen Gül The Effects of Integration Strategies on Firm Performance
7
the spot market, the direct and indirect costs of contracts and informal arrangements,
uncertainty and information asymmetry between buyer and seller and indirect costs of
internalizing production.” (p.158)
Based on these factors, the company can choose to perform the activities in-house or
buy them from the specialists in the market that are called market firms (Besanko et. al,
2007). There are many advantages and disadvantages of using the market firms to source the
upstream activities in the vertical change. The benefits would be achieving scale and learning
economies, as well as efficient division of labor and specialization from the supplier’s side.
On the other hand, the downsides would be the issue in coordinating the production process,
the leak of private information, agency and influence costs, moral hazard and disincentives for
innovation.
2.1.2. The Transaction-Cost Theory
The transaction costs theory (TC) can be traced back to Coase (1937) who indicated
that the production will take place within the firm when the cost of organizing the production
through the market exchange is larger than within the firm. In other words, the firms may
avoid the costs of transacting with the market firms by carrying out the activity in-house. This
cost of transacting with independent market firms is defined by Coase (1937) as the cost of
using the price mechanism. The size of the firm will be based on the cost of using the price
mechanism, in which “a firm will tend to expand until the costs of organizing an extra
transaction within the firm become equal to the costs of carrying out the same transaction by
means of exchange on the open market or the costs of organizing in another firm.” (p. 395)
Leiblein & Miller (2003) argue that, although the applicants of the theory generally assume
that markets ensure a more efficient mechanism for exchange compared to the hierarchy, in
certain situations the costs of the market exchange may be too high and surpass these
efficiencies procured by the market. Therefore, the theory focuses on determining the features
of exchanges that are best suited to the firms and the market. Williamson (1975) indicates that
these inefficiencies originate from small numbers of bargaining situations. “Due to the
bounded rationality of decision-makers, the asymmetric distribution of relevant information,
and the inability to completely specify behavior in the presence of multiple contingencies, the
theory maintains that all contracts are incomplete and therefore subject to renegotiation and
the possibility of opportunistic behavior.” (Leiblein & Miller, 2003, p. 842) Opportunistic
behavior is more apparent, when an exchange demands one or more parties to get involved in

Selen Gül The Effects of Integration Strategies on Firm Performance
8
significant transaction-specific investments, which in turn create quasi-rents1 that, may lead to
hold-up2. Such relation-specific investment creates difficulty in switching to a new customer
due to the increases in costs, thus locking the supplier into that relationship (Sudarsanam,
2010). Besanko et al. (2007) and Sudarsanam (2010) are underlining the types of specificities
as; site, physical characteristics, dedicated assets and human assets specific.
Therefore, based on these downsides of contracts, vertical integration is thought to be
beneficial, where hold-up concerns are severe. Firms are expected to depend on in-house
production when the transactions are complex, specific investments are included, those
specific assets are unceasing, the quality of those assets are hard to be verified, the
environment is uncertain and when the quasi-rents based on the relationship are large.
2.1.3. The Property-Rights Theory
The property-rights theory, which has been developed by Grossman & Hart (1986),
emphasizes how asset ownership can change investment incentives. They propose two types
of contractual rights as; the specific rights and residual rights of control. “When it is too
costly for one party to specify a long list of the particular rights it desires over another’s
party’s assets, it may be optimal for that party to purchase all the rights except for those
specified in the contract.” (p. 692) The purchase of the residual rights of control is called
ownership. All the residual control rights of the physical assets in question are held by the
entity under integration, whereas under non-integration, the assets are owned individually
(Hubbard, 2008). Moreover, Grossman & Hart (1986) present that the allocation of residual
control rights to one party strengthens the investment incentives of that party, while
weakening the counter party’s investment incentives. “Integration shifts the incentives for
opportunistic and distortionary behavior, but it does not remove these incentives.” (p. 716)
Therefore, both costs and benefits from integration will exist. One of the concluding remarks
of Grossman & Hart (1986) is that, integration is suggested when one party’s investment
incentives is relatively more important to the other firm’s incentives. On the other hand, when
both investment decisions are equally and somewhat crucial, non-integration is preferable.
Compared to the TC literature, the PR literature does not underline the ex post
haggling, renegotiation and opportunistic behavior. “Instead it stresses contractual
incompleteness and develops formal models that show how ex post bargaining affects ex ante
investment in non-contractible assets.” (Lafontaine & Slade, 2007, p. 650) Kim & Mahoney 1 Quasi-rent would be “the extra profit that you get if the deal goes ahead as planned, versus the profit you would get if you had to turn to your next-best alternative.” (Besanko et. Al, 2007, p. 126) 2 The term hold-up will be explained more in detail under section 2.1.3.1.

Selen Gül The Effects of Integration Strategies on Firm Performance
9
(2005) further indicate the importance of property rights theory, as that various specifications
of property rights arise in response to the economic problem of allocating scarce resources,
and how it affects the economic behavior and economic outcomes in return.
2.1.3.1. Benefits and Costs of Contracts
According to the theories mentioned above, the existence of market failures may lead
the firms to source its inputs from suppliers by negotiating contracts. The duration of these
contracts may be short or long-term in nature. Williamson (1971) introduces three alternatives
to be considered: a life time contract, a series of short-term contracts, and vertical integration.
The once-for-all type of contracts are facing the dilemma of the redesign issues due to
changing technology, in which sequential decision process is needed. “If, however,
contractual revisions or amendments are regarded as an occasion to bargain opportunistically,
which predictably they will be, the purchaser will defer and accumulate adaptations, if by
packaging them in complex combinations their true value can better be disguised; some
adaptations may be forgone altogether.” (Williamson, 1971, p. 116) Therefore, short-term
contracts may be more preferable due to sequential decision making and adaptation. However,
the downsides would be the necessity of relation-specific investments and the existence of a
first-mover advantage for one of the parties (Williamson, 1971). These downsides would
generate the hold-up problem or behaving opportunistically, in which it occurs when one of
the parties would attempt to renegotiate the terms of the contract. The party that has been
held-up could be either the buyer or the supplier, but most likely the one that has engaged in a
relation-specific investment (Besanko et. al, 2007). In order to eliminate this hold-up problem,
Williamson (1971) suggests the firms to vertically integrate, in which the disadvantages of
long and short term contracts would be avoided. “Sequential adaptations become an occasion
for cooperative adjustment rather than opportunistic bargaining; risks may be attenuated;
differences between successive stages can be resolved more easily by the internal control
machinery.” (Williamson, 1971, p. 116)
Besides the solution of vertical integration, only a complete contract can eliminate
opportunistic behavior. Besanko et al. (2007) argue the applicability of complete contracts,
and underline that this type of contracts would be feasible only if the parties are able to
specify each contingency to be occurred and the set of actions to be taken. Therefore,
contracts in the real-world are incomplete, which involve some degree of open-endedness or
ambiguity. The literature on transactions costs highlights that incomplete contracts can cause
a non-integrated relationship to yield outcomes that is inferior compared to complete

Selen Gül The Effects of Integration Strategies on Firm Performance
10
contracts. The three fundamental factors preventing to achieve complete contracting are;
bounded rationality, difficulties specifying or measuring performance and asymmetric
information.
2.1.4. The Theory of Relational Contracts
In relation to this phenomenon of contracts, the third insight is formed by Baker et al.
(2002) indicating that “relational contracts are informal agreements and unwritten codes of
conduct that powerfully affect the behaviors of individuals within firms.” (p. 39) These
relational contracts affect the behaviors of firms in their business relations with other firms,
whether vertical or horizontal. Baker et al. (2002) underline in their study the ease of
relational contracts between and within the firms, compared to the difficulties encountered in
formal contracting. “For example, a formal contract must be specified ex ante in terms that
can be verified ex post by the third party, whereas a relational contract can be based on
outcomes that are observed by only the contracting parties ex post, and also on outcomes that
are prohibitively costly to specify ex ante.” (p. 40) Therefore, a relational contract empowers
the parties to exploit their detailed knowledge to their particular situation and to adapt this
situation to new information as it becomes available. Based on these advantages of relational
contracts, the authors are adding dynamics to the previous models and illustrate how these
dynamics will affect the vertical integration decisions by introducing game theory models
such as; trust games, repeated trust games and trigger strategies.
2.1.5. Is Vertical Integration Beneficial for the Firm?
According to Sudarsanam (2010), vertical integration increases technical efficiencies
in some ways; however arises inefficiencies in some other ways. The author describes these
technical efficiencies as coordinating, monitoring, and enforcement in the process of
production. On the other hand, interdivisional rivalry may lead to opportunism and an
increase in influence costs. Moreover, information asymmetry in integrated firms may exist
between various levels of management and divisions. “In particular, a firm that purchases its
supplier, thereby removing residual rights of control from the manager of the supplying
company, can distort the manager's incentives sufficiently to make common ownership
harmful.” (Grossman & Hart, 1986, p. 692) When the residual rights are captured by one
party, they are lost for the contrary party that may lead to distortions. On the other side, by
vertically integrating no alternative use of the good will exists, leading to a value of zero
quasi-rent and no hold-up problems (Williamson, 1971).

Selen Gül The Effects of Integration Strategies on Firm Performance
11
2.1.6. Empirical Evidence on Vertical Mergers
The efficiencies of vertical integration have been subject to be tested by several
scholars in order to illustrate why firms take parts production in-house and what types of
specificities are affecting vertical integration (Monteverde & Teece, 1982; Masten, 1984) ,
and how the duration of the contracts are affecting the choice to vertically integrate (Joskow,
1985). Monteverde & Teece (1982) have explained vertical integration by examining the U.S.
automobile industry for the two firms, GM and Ford. The study observed a significant and a
positive effect on the engineering effort and specificity coefficients, meaning that a high level
of engineering effort and the specificity of the component will more likely lead the
component to be produced in-house. “GM and Ford are more likely to bring component
design and manufacturing in-house if relying on suppliers for preproduction development
service will provide suppliers with an exploitable first-mover advantage.” (p. 212) Moreover
Masten (1984) has followed a similar approach by analyzing the variables on vertical
integration by using a sample from the U.S. aerospace industry of 1,887 aerospace
components. The author has found a significant positive effect for specialization and
complexity coefficients, in which the higher the complexity and specialization of the inputs,
the higher the probability to vertically integrate. In addition, Joskow (1985) has conducted a
study by examining the U.S. coal-burning electric generating plants in order to identify the
role of contract duration on vertical integration decisions. The author points out that the
variation in the contract duration is based on the level of relation-specific investments, in
which longer commitments are engaged where relation-specific investments are more
important. Moreover, in the studies of Fan & Goyal (2006), the authors give the basic idea of
a vertical merger as, the two industries are vertically related if one of the firms uses the
other’s output for its own production or if the firm can supply its product or services as the
other’s input. This measure can be captured by Input-Output tables and is applicable to
measure the vertical relations in large samples. Therefore, where merging firms are from the
same Input-Output industries, the merger is categorized as vertical.
Moreover Sudarsanam (2010) specifies that the empirical evidence on vertical mergers
and their value effects is rare, compared to the ones that have analyzed horizontal and
diversifying mergers. Colangelo (1995) has studied the effect of pre-emptive merging for
vertical vs. horizontal integration and underlined that the overall gain from a vertical
integration is generally greater than that from a horizontal integration. “In our context vertical
integration gives rise to three different gains: (a) it eliminates double marginalization; (b) it
Selen Gül The Effects of Integration Strategies on Firm Performance
12
enables price discrimination against non-integrated rivals; (c) it avoids the loss coming from
being non-integrated after a horizontal merger.” (p. 324) In addition, the findings of Leiblein
& Miller (2003) regarding the semiconductor industry point out that, the vertical boundary
choices are affected significantly depending on the firm-level competences and strategies. For
instance, the companies with greater experience in a specific type of technology have the
tendency to internalize the manufacturing activities than firms without such production know-
how. “Similarly, firms with high levels of sourcing experience are more likely to outsource
their production than firms that do not have such experience.” (p. 854) To sum up, firms
internalize transactions when it is expected that they will need to renegotiate supplier
contracts due to high asset specificity.
2.2.Horizontal Integration
Besanko et al. (2007) indicate that a firm’s horizontal boundaries determine the
quantities and varieties of products and services that it produces. It refers to a merger of two
or more firms producing the same good under one consolidated firm (Chakravarty, 1998).
Horizontal boundaries vary obviously across industries and across the firms within them. The
optimal horizontal boundaries of the firms are appertaining crucially to economies of scale
and scope. Economies of scale and scope exist whenever large-scale production, distribution,
or retail operations have a cost advantage over smaller operations. “Economies of scale and
scope not only affect the sizes of the firms and the structure of markets, but they are also
central to many issues in business strategy.” (Besanko et al., 2007, p. 75) Economies of scale
and scope are the essence for merger and diversification strategies. They have an effect on
entry and exit, pricing, and the capability of the firm to protect its long-term sustainable
advantage.
Sudarsanam (2010) underlines that, a number of firms in wide-ranging sectors such as
utility, electricity, banking, pharmaceuticals, insurance, oil and gas, automobiles, food and
drinks, steel and healthcare have merged with one another, in the recent years. Such mergers
are defined as horizontally related mergers. Where the firms selling the identical product
merge, it is described as a pure horizontal merger. “Where firms selling products that are not
identical in terms of end use but nevertheless share certain commonalities, such as
technology, markets, marketing channels, branding or knowledge base, merge, we refer to
such mergers as related mergers.” (p.123) For simplicity, Sudarsanam (2010) refers to the
Selen Gül The Effects of Integration Strategies on Firm Performance
13
term horizontal merger as to both pure horizontal mergers and related mergers3 of firms
selling a range of similar products. Horizontal mergers often qualify industries and markets
whose products are generally in the mature or declining stages of the production life cycle.
These markets have a low overall growth rate, and firms have accumulated production
capacity that far exceeds the demand. This combination of low market growth and excess
capacity engenders difficulties on firms to attain cost efficiencies through consolidating
mergers. Such efficiencies may be achieved from scale, scope and learning economies.
2.2.1. Economies of Scale and Scope
The origin of costs may have crucial inferences for industry structure and the behavior
of the companies. Besanko et al. (2007) denote that “the production process for specific good
or service exhibits economies of scale over a range of output when average cost declines over
that range.” (p.75) Moreover, economies of scale exist if the firm attains unit-cost savings as
it raises the production of a given good or service. In order to achieve these scale economies,
the associated costs, risks and the extent of cost savings have to be taken into notice
(Sudarsanam, 2010). Therefore, firms should be conscious about diseconomies of scale,
which arise from complexities of monitoring, diffusion of control, ineffectiveness of
communication, and numerous layers of management. In addition to these disadvantages,
Besanko et al. (2007) also underline the limits to economies of scale, in which beyond a
certain size, bigger is no longer better and may even lead to worse outcomes. The most
important reasons for these limits are; labor cost and firm size, conflicting out, spreading
specialized resources too thin, and incentive and bureaucracy effects. Moreover, economies of
scale may be more crucial for the manufacturing organizations, “since the high capital costs of
plant need to be recovered over a high volume of output.” (Johnson et al. 2008, p. 99) The
manufacturing sectors that have been generally important have been motor vehicles,
chemicals and metals. In terms of distribution and marketing other industries such as drinks,
tobacco and food, the scale economies would be crucial (Johnson et al. 2008).
Economies of scope exist, if an increase of production in the variety of goods and
services saves the firm from the costs it bears. “Whereas economies of scale are usually
defined in terms of declining average cost functions, economies of scope are usually defined
in terms of the relative total cost of producing a variety of goods and services together in one
firm versus separately in two or more firms.” (Besanko et al., 2007, p. 76) In other words,
Panzar & Willig (1981) point out to the existence of economies of scope where it is less
3 This paper will handle related diversification under the term ‘horizontal integration’.

Selen Gül The Effects of Integration Strategies on Firm Performance
14
costly to merge two or more product lines in one firm compared to supplying them separately.
Based on the definitions above, scope economies are available only for multi-product firms.
Certainly, both economies may be recognized by the increase of the output of individual
products as well as the total output of all the firm’s products. The research on the extent of
scope economies is scarce, in contrast to the literature on scale economies. One possible
explanation is that until recently product costing did not allocate costs to the different
products correctly, based on the related activities. Activity-based costing (ABC) mitigates this
issue; however the problem of how to compare these product costs in the merged firm with
the costs on the similar products produced separately by different companies still exists
(Sudarsanam, 2010).
2.2.2. The Learning Economy
Experience is an important determinant to fulfill the tasks faster and attain the output.
The magnitude lies under the idea of the learning curve. Besanko et al. (2007) determine that
economies of scale points out to the advantages that flow from increase in production to a
larger output at a given point in time. “The learning curve refers to advantages that flow from
accumulating experience and know-how.” (p. 94) Sudarsanam (2010) specifies that the
economy of learning comes to light when workers and managers become more experienced
and effective over time in using the available resources of the firm, and help decrease the cost
of production. “The time required to do a job will decrease each time the job is done, that the
time per unit will decrease at a decreasing rate, and that the time reduction will be
predictable.” (Lindsey & Neeley, 2010, p. 73) It is a function of cumulative output over
several periods, and increasing cumulative output raises the motivation to learn more efficient
and effective ways of producing each unit of the output for the managers and workers.
Employees learn not only from their personal experience but also from that of their
colleagues. The limit to learning and its affect on cost reduction is designated by the minimum
efficient learning scale (MELS). At this level, maximum learning has been procured (Besanko
et al., 2007).
Based on the studies conducted, the semiconductors and aircraft production are some
of the industries that the learning economy may be more crucial. The learning rates averaged
about 20 to 40 percent respectively. Learning curve efficiency entails that the firms have a
large sales quantity and therefore a relatively large market share. “Therefore, the cost of
acquisition of the increased market share needs to be balanced against the subsequent cost
savings from increased learning efficiency.” (Sudarsanam, 2010, p. 138) Moreover, Besanko

Selen Gül The Effects of Integration Strategies on Firm Performance
15
et al. (2007) emphasize that learning occurs at different rates for different organizations and
processes, according to the variation in slopes across firms and products. Although
organizational learning is highlighted as the essence of the process, primarily it is individuals
who learn. While individuals do the learning, the firms can take the steps to enhance learning
and the maintenance of knowledge in the organization.
Horizontal mergers lead to the consequence of a sudden increase in the quantity of
output when the output of each merging firm is combined. While each firm has the
opportunity to learn from the experience of the other firm, this learning may not engender the
cumulative output of the merged entity to increase more. In the period subsequent the merger
this output may increase, hence creating opportunity for further learning. However, if the
output of the merged company is already large, it is expected to have passed the minimum
efficient learning scale (MELS) of cumulative output (Sudarsanam, 2010). For instance,
“mergers involving complex technological processes such as drug discovery may yield
potentially valuable learning opportunities, but they are also problematic because of the
coordination and management problems.” (p. 139)
2.2.3. Empirical Evidence on Horizontal Mergers
Lipczynski et al. (2005) signify that the empirical evidence on the increased
profitability through increased market power or cost savings of horizontal mergers is rather
conflicting and inconclusive. For instance, Cosh et al. (1980) examine 211 mergers in the UK
between the years 1967 and 1969, comparing profitability during a five-year period before the
merger, with profitability during the five years subsequent the merger. The merged firms are
observed to have experienced an increase in average profitability. On the contrary, Meeks
(1977) detects a fall on average profitability during the seven-year period following the
merger in a study of mergers in the UK between 1964 and 1972. In addition to these studies,
Ravenscraft & Scherer (1987) examine the pre-merger profitability of 634 US target firms in
the late 1960s and early 1970s. The target firms’ profitability (the ratio of operating income to
assets) was observed to be 20 percent, which is much greater than the average profitability of
all firms of 11 percent.
Moreover, Weiss (1965) inspects the impacts of horizontal mergers on seller
concentration for six manufacturing industries for the period 1926-1959. “Changes in
concentration ratios over approximate 10-year intervals are decomposed into effects arising
from the internal growth of firms, the exit of incumbent firms, mergers, and turnover or
changes in the identity of the largest firms in each industry.” (Lipczynski et al., 2005, p. 263)

Selen Gül The Effects of Integration Strategies on Firm Performance
16
Therefore, internal growth and exit seem to have a more crucial role than mergers in affecting
the changes in concentration.
Finally, Colangelo (1995) underlines the gains from horizontal integration as: it leads
to an increase in the market power due to the internalization of the cross-price effect on
demand, and it prevents the loss coming from being non-integrated after a vertical integration.
2.3.Diversification
The incentive and consequences of diversification on firms has been committed to a
vast amount of studies by both economists and business researchers. However, these two
groups approached the phenomenon from different perspectives. “Economists have treated the
extent of a firm’s diversification as determined by structural variables in the industries in
which the firm operated and the economics of the organization of activity within the firm
operated and the economics of the organization of activity within the firm compared to via the
market.” (Lecraw, 1984, p. 179) On the other hand, business researchers have paid attention
on the human and physical assets of the firm, by taking its internal strengths and weaknesses
into consideration in determining its diversification strategy. This paper will have the focus of
the economists’ perspective in identifying the companies’ diversification strategies, in which
the structural variables of the industry and the activity of the firm within this industry will be
highlighted.
Lipczynski et al. (2005) define a diversified firm or a conglomerate as; to being
involved in the production of a number of various goods and services, making it a multi-
product firm. According to the authors, the types of diversification can take the forms as
product extension, market extension and pure diversification. Product extension would be
achieved if a firm can diversify by producing a new product that is strongly related to its
existing products. Market extension involves diversifying into a new geographic market with
the same line of products, and a pure diversification strategy involves a transition into
unrelated areas of business activity. Rumelt (1982) depicts the first and the last components of
the strategies respectively as related4 and unrelated business companies.
Lipczynski et al. (2005) further indicate two ways in which a diversification strategy
can be performed; either through internally generated expansion, or through mergers and
acquisitions. “Conglomerate merger involves the integration of firms that operate in different
product markets, or in the same product market but in different geographic markets, whereas
internally generated expansion is likely to require the simultaneous extension of the firm’s
4 Recall that this paper takes “related diversification” strategy under the name of horizontal integration.

Selen Gül The Effects of Integration Strategies on Firm Performance
17
plant and equipment, workforce and skills base, supplies and raw materials, and the technical
and managerial expertise of its staff.” (p. 593) Diversifying through a conglomerate merger
may be less demanding in this matter.
2.3.1. Product Diversification
As indicated above, the strategies of related and unrelated integration are defined
under product diversification. Although this paper will refer to the concepts as horizontal
integration and unrelated integration strategies, it is worth mentioning this broad definition
and its performance effects. Ravichandran et al. (2009) notes that, product diversification
which illustrates the scope of the multiple and distinct product markets that the firm is
operating in, has been lately under the focus of strategic management researchers. Geringer et
al. (2000) indicate “the relationship of performance and the product mode of diversity is well
established by studies in two related directions — type of diversification and degree of
diversity.” (p. 54) Rumelt (1974) found differences across his “relatedness” categories, in the
seminal study of qualitative types of diversification. The author divided the integration
strategies into 7 categories; which were single business, dominant vertical, dominant
constrained, dominant linked-unrelated, related constrained, related linked and unrelated
business. In order to specify the strategy that a company possesses, Rumelt (1974)
constructed intervals of ratio specification. Based on these intervals of ratios (specialization
ratio, related-core ratio, related ratio and vertical ratio) the companies’ strategies were
specified. Following studies using his methodology have generally underlined that related
diversification generated higher performance levels than unrelated diversification, although
industry effects and other firm-level variables tend to eliminate much of the effect of the
diversification type. Therefore, the general outcome of the studies is that related
diversification is associated with a profitability advantage (Geringer et al., 2000).
2.3.2. Geographic Diversification
Geographic diversification is identified as the firm’s expansion into various
geographic locations or markets across the borders of regions and countries (Hitt et al., 1997).
“Thus, a firm's level of international diversification is reflected by the number of different
markets in which it operates and their importance to the firm (as measured, for instance, by
the percentage of total sales represented by each market).” (p. 767) This type of
diversification strategy has its motivations as well as downsides. Denis et al. (2002) identify
several motivations as; global diversification is a mechanism that combines the information-

Selen Gül The Effects of Integration Strategies on Firm Performance
18
based assets of buyers and sellers within the same firm. It generates value by creating
flexibility within the firm, by giving the ability to respond to changes in relative prices. In
addition, investors’ diversification choices can result as the benefit of geographic
diversification. Ravichandran et al. (2009) adds the scope and scale economies, enhanced
market power, and the ability to supply lower-cost factor inputs to the benefits of global
diversification. Moreover, “increased operational flexibility by global diversification reduces
the risks across the markets.” (Kim & Mathur, 2008, p. 749) However as from the downside
perspective, a globally diversified entity is more complex compared to a purely domestic
firm. The costs of information asymmetry between corporate headquarters and the difficulty
of monitoring managerial decision-making may give rise (Denis et al., 2002).
Based on the empirical studies conducted, Ravichandran (2009) and his colleagues
specify that, “multinational corporations (MNCs) experienced a positive valuation effect
relative to purely domestic firms because of their role as financial intermediaries.” (p. 210)
Moreover, Lepetit et al. (2004) illustrate that the announcements of the mergers and
acquisitions beyond regions and countries have a positive effect on the market. On the other
hand, the effect on firm performance may be negative due to high transaction costs and
managerial-information processing demands. Moreover, Delios & Beamish (1999) have
found a positive relationship between the geographic scope and firm’s performance by
collecting a data of 399 Japanese manufacturing firms. Their findings illustrate that expanding
into new geographic markets is an effective strategy for developing the performance of
Japanese companies. However, in the study of Kim & Mathur (2008) where a sample of
28,050 firm year observations from 1990 to 1998 was used, a firm value decrease was
associated for both industrial and geographic diversification. “We find that geographically
diversified firms have higher R&D expenditures, advertising expenses, operating income,
ROE and ROA than those of industrially diversified firms.” (p. 764)
2.3.3. The Determinants and Motives for Diversification
In exploring the determinants of diversification, Rondi et al. (1996) focuses on three
theories of diversification. The first, attributed to Marris (1964) and Penrose (1995), propose
that the managers seek to maximize the growth of the firm. The operation of specific assets
such as marketing skills and technical enterprise in other industries offers a convenient
vehicle in order to achieve the growth objective. The second theory attributed to Bain (1959),
puts emphasis on the conditions that yield entry possible or attractive. These incorporate
industry-level characteristics such as growth and concentration, average profitability, as well

Selen Gül The Effects of Integration Strategies on Firm Performance
19
as barriers to entry. The third theory, attributed to Rumelt (1974) and Williamson (1975),
focuses on relatedness between industries that makes diversification attractive, in which
relatedness refers to the similarities between markets, technologies, and organizational
structures (Lipczynski et al., 2005). The scope of this paper generally refers to the third theory
where relatedness is the underlying concept.
As mentioned above under the heading of horizontal boundaries, related
diversification represents the horizontally integrated mergers. Therefore, this part will
consider the value creation for the acquisitions of unrelated businesses. Sudarsanam (2010)
underlines the motives of value creation as having an increased market power or operating an
efficient internal capital market. “Market power is the ability of a firm in a market to pursue
anticompetitive behavior against its current rivals or potential entrants.” (p. 184) This power
is not obtained from the monopoly position in that market, but from the range of the firm’s
activities and its size. Based on this market power, the conglomerates assign investment funds
to a wide range of individual entities. If these entities were stand-alone, independent firms,
their funds would be supplied directly from the capital markets. Thus, the conglomerate firm
serves the role of capital markets. The firm will create value, in case it possesses an effective
performance compared to the external capital market. Moreover, Lipczynski et al. (2005)
add more motives such as; saving costs, reduction of transaction costs and the managerial
motives for diversification.
2.3.4. The Resource-Based View
A vast amount of the management literature on diversification follows the resource-
based view of the firm. “The resource view argues that rent-seeking firms diversify in
response to excess capacity in productive factors, here called resources.” (Montgomery, 1994,
p. 167) Under this perspective, firms acquire companies to keep the balance among the
required competitive profile and competences, and their current endowments of resources.
However, the amount of resources available are limited, therefore firms are not limitless in
their ability to pursue new investment opportunities (Wiersema & Bowen, 2008). Apart from
this limitation, conglomerate acquisition may be undertaken by the same motives for
acquiring competitive profile and competences. Other reasons may be the need for growth,
and to utilize the excess capacity the firm possesses. These idle resources should be reused in
more productive and profitable areas. Therefore the question to be answered is, how best the
firm can exploit these resources outside of its current operations. In the book of Silverman
(2002), three sets of factors are pointed out as the firm’s diversification behavior. Initially is

Selen Gül The Effects of Integration Strategies on Firm Performance
20
the specific range of applications to which the firm’s current resources may be useful. These
depict the possible set of businesses in which the firm’s resource base will provide
competitive advantage. The second is the scope of transaction costs in the relevant markets
for the firms existing resources. These determine the firm’s ability to exploit its resources
through contractual arrangements, which can prevent the need for expansion of the firm’s
boundaries. The third set of factors deal with the sustainability of the competitive advantage
furnished by the firm’s resources. For the reason of prioritization, a firm will decide on to
focus first on the exploitation of those resources that offer the most sustainable competitive
position, since it cannot use all of its resources at once. Finally, “in order to generate
sustainable competitive advantage, it has been argued that firms’ resources and capabilities
should be rare, valuable, difficult to imitate, non-substitutable and non-transferable in that
they cannot be easily purchased in resource markets.” (Matraves & Rondi, 2007, p. 38)
2.3.5. Diversification and Firm Performance
Firm diversification has been extensively researched both empirically and
theoretically in the fields of strategy and finance for more than 30 years. The literature on
diversification generally focuses on the economic rationale behind the diversification-
performance relationship, and the main common objective of this work has been to verify the
effect of diversification on the creation or destruction of firm value. Thus, the researches’
center of attention has been on the performance of the diversified firms compared to
specialized firms (Santalo & Becerra, 2008).
Many researchers have studied the effects of operating performance on diversified
firms compared to undiversified, which is measured by accounting profits or productivity.
They have found the relationship between performance and corporate diversity to be
ambiguous. “Profits were more likely to be determined by industry profitability, coupled with
how the firm related new businesses to old ones, rather than diversification per se.”(Besanko
et al., 2007, p. 180)
Ravichandran et al. (2009) specify that firms may choose to diversify into related or
unrelated markets, based on the similarity or relatedness of the new business. “Related
diversification is believed to lead to better performance than unrelated diversification because
the former leverages significant business synergies while the latter suffers from agency costs
and inefficient resource allocation.” (p. 206) This belief has been widely studied by many
scholars. Prahalad & Bettis (1986) explain this logic more in depth, by indicating the four
major and nine minor categories that Rumelt (1982) has used to identify the diversification

Selen Gül The Effects of Integration Strategies on Firm Performance
21
strategies of the firms. The major categories are to be single business, dominant business,
related business and unrelated business. Rumelt (1982) has used statistical models to relate
diversification strategy to performance and pointed out that capital productivity is greater in
moderately diversified firms. However the firms in between moderate and high levels of
unrelated diversification acquired moderate or poor productivity. In other words, on the
average related diversification strategies outperformed the other diversification strategies. On
the other side, the unrelated business strategy was observed to be the lowest performing
(Prahalad & Bettis, 1986, p. 486). Moreover, “Noel Capon (1988) and his colleagues found
that firms that restricted their diversification to narrow markets performed better than did
broader firms, presumably because of their learning particular market demands.” (Besanko et
al., 2007, p. 180) Although the theoretical and empirical findings on the area of diversification
are quite rich, the results have not been consistent. Despite the inconclusive results,
diversification has been an effective firm strategy for growth (Ravichandran et al., 2009).
Lately, Nathanson & Cassano (1982) conducted a statistical study of diversity and
performance with a sample of 206 firms through years 1973 and 1978. They utilized two
factors which are market and product diversity to distinguish the diversification strategy that
improves Rumelt’s categories. The findings illustrated that, an increase in product diversity
decreased the average returns, whereas the returns remained rather stable for an increase in
market diversity. Also, they discovered that size plays a crucial role on the relationships. “For
both the market and product diversity, smaller firms did well relative to larger firms in
categories marked by no diversification and in categories of extremely high diversification,
and larger firms did significantly better than smaller firms in the in-between categories—
those characterized by intermediate levels of diversification.” (Prahalad & Bettis, 1986, p.
486) In both these studies of Rumelt (1982) and Nathanson & Cassano (1982), the key point
is to decide on the generic strategy of diversification (the level of relatedness) in order to
achieve performance (Prahalad & Bettis, 1986). According to this phenomenon Kiker &
Banning (2008) support that, diversification is an issue of creating fit with the most
significant contingencies and an effective fit will improve the overall performance of the firm.
According to this view, diversification does not necessarily lead to increased overall firm
performance; rather it relies upon how effective the diversification fits the particular
contingencies of the firm. “Research from this perspective has generally found that this occurs
to the extent that firms diversify only in a direction which is related to their core
competencies.” (Kiker & Banning, 2008, p. 20)
Selen Gül The Effects of Integration Strategies on Firm Performance
22
2.3.6. Empirical Evidence on Diversification and Firm Performance
A vast number of researches have been conducted in order to examine the relationship
between diversification and firm performance, by utilizing industry structure variables like
concentration, scale, industry growth, etc. In these studies, accounting indices, such as return
on equity or return on invested capital have been generally used to measure performance. The
common measure for diversification has been the Herfindahl index; for instance, one minus
the sum of the squared percentages of a firm's total revenues in each of its markets. “These
studies nearly always find a neutral or negative, not a positive, relationship between
diversification and firm performance.” (Montgomery, 1994, p. 169) Montgomery &
Wernerfelt (1988) and Lang & Stulz (1994) presented a similar analysis using Tobin's q, from
the perspective of the stock price performance (the capital market value of the firm divided by
the replacement value of its assets) to measure performance. Their findings illustrated a
reduction on the firms’ profitability as the level of diversification increased (Montgomery,
1994). In other words, “highly diversified firms are consistently valued less than specialized
firms.” (Lang & Stulz, 1994, p. 1278)
Schoar (2002) has examined the effect of productivity on firm performance and found
that diversification has caused to a destructive ‘new toy’ effect. “While the newly acquired
plants increase their productivity by three percent, incumbent plants show productivity
declines of almost two percent.” (p. 2380) This study is also supported by Lichtenberg (1992)
who underlines the fall of the productivity of plants as the level of diversification increases
(Schoar, 2002).
Ravichandran et al. (2009) focused on the effects of IT technology spending to
product and geographic diversification and firm performance. They have defined the firm
profitability by using the accounting-based measure of return on assets (ROA) and the
measure of Tobin’s q for firm valuation. The authors’ concluding remarks were; IT needs to
be viewed as a valuable asset by the managers in highly diversified firms, based on the
performance critical role when implemented with diversification. However, they must be
attentive that the impacts on performance are dependent on types of diversification. “In firms
with unrelated product diversification or with high geographic diversification, IT may not
contribute to performance as much as in related diversifiers and in low geographic
diversification contexts.” (p. 233) These findings are also supporting the work of Miller
(2006), which specifies the greater value creation from technological diversity of the multi-
business firms compared to single-segment firms, and the greater performance of diversified
as technological diversity increases.
Selen Gül The Effects of Integration Strategies on Firm Performance
23
Another perspective in assessing the performance-diversification linkage is
highlighted in the study of Santalo & Becerra (2008), in which this linkage is examined by
differentiating the industries. Their evidence illustrates that the effect of diversification on
performance is not homogenous across industries. “Diversified firms observe a diversification
discount if and only if they compete in industries with a large number of single-segment
companies or, equivalently, when specialists hold a considerable market share.” (p. 851) On
the other hand, industries that bear only a few non-diversified firms competing, leads the
diversified firms enjoy a premium in those industries in which specialists acquire a small
market share.
In addition, Bettis (1981) has conducted a study using a sample of 80 firms, in order to
investigate the performance differences between related and unrelated diversified firms. By
regressing the return on assets to advertising, R&D, plant investment, size, risk and
diversification strategy, the author concluded that, on average related diversified firms
perform better than unrelated diversified firms by about one to three percentage points of
return on assets.
Moreover, Denis (2002) and his colleagues examined the effects of global and
industrial diversification on the firm value, by using a sample of 44,288 firms through years
1984 and 1997. The findings highlight an increase in global diversification over time, whereas
a reduction for industrial diversification. However both global and industrial diversification is
associated with valuation discounts, which are statistically significant compared to purely-
domestic firms. Moreover, the authors have found no evidence of tendency to replace the
global diversification strategy for industrial diversification by the individual firms.
Finally, Capar (2009) examined a sample of 196 firms through years 1995-2000,
based on the effects of international and product diversification on innovation assets and firm
performance. The results are found to be significant for the effects of international
diversification on innovation assets and a negative effect for an increase of product
diversification. Therefore, “the present study provided strong evidence that innovation assets
lead to higher performance.” (p. 6)

Selen Gül The Effects of Integration Strategies on Firm Performance
24
3. DEVELOPMENT OF HYPOTHESES
Based on the prior research on the effects of the integration strategies on firm’s
performance, this section outlines the hypotheses that are subject to be tested. This paper will
focus on the two industries (manufacture of food products and manufacture of machinery and
equipment) out of the 5 industries in computing the regression models, due to the
adequateness of the amount of data. In order to examine if the results obtained will be related
to the previous studies, two separate hypotheses have been developed for manufacture of food
products and manufacture of machinery and equipment industries respectively.
Bettis & Hall (1982) underline the importance of the differences among industries.
Since this paper is analyzing the effects of the integration strategies by differentiating the
industries that the firms compete in, it is crucial to note that “the different industries have
different structural characteristics (in the industrial organization economics sense), and these
different structural characteristics result in different average (and potential) profits in each
industry.” (Bettis & Hall, 1982, p. 255) In relation to this phenomenon, it is expected that the
effects of the integration strategies on firm’s profitability may vary among the industries.
Moreover, Besanko et al. (2007) ask the question of whether they will encounter considerable
differences in profitability of business units within industries and a modest variation in
profitability across the industries. “If so, the effect of the market environment on profitability
is unimportant, but the effect of a firm’s competitive position in the industry is important.” (p.
349) The question can be asked vice versa, and the authors conclude that both the market and
the firm’s competitive position in the industry can explain profitability. McGahan & Porter
(1997) indicate that the industry is responsible for about 19 percent of the variation in profit
across industries, whereas the percentage is 32 for the business-specific effects.
In relation to these differences, the effects of the integration strategies can be tested
based on the theories presented above. Prior research indicates that, in order to prevent the
hold-up problem, firms tend to vertically integrate when their investment incentives are more
crucial compared to the counter party’s incentives (Grossman & Hart, 1986). Since the firms
tend to internalize their transactions in order to avoid the renegotiations of contracts and
investing huge amounts on the relation-specific assets, the following hypothesis is formed:
H1: Vertical integration strategies have a positive effect on firm’s performance.
The findings of the early studies of Rumelt (1982) designate that firms were different
not only in terms of their product diversity but also in the patterns of relationships they
created among various lines of businesses. Moreover, the different types of strategies of

Selen Gül The Effects of Integration Strategies on Firm Performance
25
diversification were associated with differing corporate profitability based on the strategy
chosen. “The highest levels of profitability were exhibited by those having a strategy of
diversifying primarily into those areas that drew on some common core skill or resource.” (p.
359) On the other hand, the lowest levels were those of vertically integrated businesses and
firms following strategies of diversification into unrelated businesses (Rumelt, 1982).
Besides the findings of Rumelt, the general empirical evidence has a strong support in
highlighting the related diversified firms are outperforming the unrelated diversified
companies (Montgomery, 1994; Lang & Stulz, 1994; Bettis, 1981). For instance, Chang &
Wang (2007) have examined a sample of 2,402 U.S. firms through years 1996 to 2002, and
found strong support that related product diversification leads to positive performance effects.
“Conversely, unrelated product diversification not only has a weaker influence than related
product diversification, it actually damages the performance of multinational firms” (p. 77)
Since this paper takes the related diversification strategy under the definition of ‘horizontal
integration’ the second hypothesis will be:
H2: Horizontal integration strategies outperform unrelated diversification strategies.
Based on the value-reducing and enhancing effects of global diversification, the prior
studies indicate conflicting evidence of geographic diversification on the firm’s value.
Researchers found that wide-ranging multinational operations were associated with higher
performance (Delios & Beamish, 1999; Hitt et al., 1997) and lower levels of risk. “However,
given that international operations encumber a firm because of the increased difficulty and
costs found in operating in foreign markets, it remained a question whether the higher
performance of multinational firms was attributable to a firm’s possession of superior
resources (i.e. proprietary assets5), or to other benefits of international operations.” (Delios &
Beamish, 1999, p. 723) The third hypothesis will test the positive aspect of geographic
diversification, taking into account that the geographically diversified firms have higher
values of performance measures such as operating income and ROA, compared to industrially
diversified firms ( Kim & Mathur, 2007).
H3: Geographic diversification has positive effects on firm’s performance.
5 Proprietary asset, usually, is any asset that is considered in the realm of intellectual property that should not be disclosed. These assets may include trade secrets and undisclosed inventions (VentureLine).

Selen Gül The Effects of Integration Strategies on Firm Performance
26
4. METHODOLOGY The study involves the analysis of 147 Danish firms between the years 2005-2009,
based on the 5-year average values. The recent empirical studies mostly focus on market share
prices and event studies in analyzing the diversification-performance linkage, whereas this
paper will focus on the operating performance perspective. Performance is measured as
operating revenue per employee (ORPE) and net income per employee (NIPE), which are
used as the dependent variables. The independent variables would be horizontal integration
(HI), vertical integration (VI), unrelated diversification (UR) and un-diversification (UD)
strategies which were explained with binary (dummy) variables that take on the values 1 and
0 depending on the type of strategy. Moreover, the analysis will examine the effects of global
diversification (COUNTRY) by focusing on the number of subsidiaries. Control variables
involve the firm specific characteristics such as: risk (RISK), size (SIZE), capital intensity
(CINT), market share (MARS), cost per employee (CPE) and the ratio of the cost of
employee to operating revenue (RATIO). Apart from these measures, this study has
conducted the Herfindahl index, entropy measure, concentration ratio and the relative measure
for the four largest firms in order to illustrate how concentrated and diversified the industries
are. These measures will not be included in the regression analysis, since the concentration
indices are calculated for all the years (2009-2005) rather than computing averages.
The analysis will begin by distinguishing each of the 5 industries and presenting their
descriptive statistics. This separation is crucial, since a computation of the summary statistics
of the whole sample would be misleading based on the differences among the industries.
In addition to these summary statistics, the study will present two regression models
with the inclusion and exclusion of the interaction effects (Bettis, 1981). The data for the
regression analysis will be conducted for only two industries separately, due to having
sufficient number of companies. These industries would be the manufacture of food and the
manufacture of machinery and equipment industries, with 54 and 48 companies respectively.
It will be designed to explore the performance differences between vertically integrated,
horizontal integrated, unrelated diversified and un-diversified firms. The models will be
estimated with the simple OLS regression, by conducting for ORPE and NIPE performance
measures separately. Below the models are briefly identified:
Model without the interaction effects: ORPE = β0 + β1 (SIZE) + β2 (RISK) + β3 (CINT) + β4 (MARS) + β5 (CPE) + β6 ( RATIO) + β7 (COUNTRY) + β8 (VI) + β9 (HI) + β10 (UR) + e

Selen Gül The Effects of Integration Strategies on Firm Performance
27
NIPE = β0 + β1 (SIZE) + β2 (RISK) + β3 (CINT) + β4 (MARS) + β5 (CPE) + β6 ( RATIO) + β7 (COUNTRY) + β8 (VI) + β9 (HI) + β10 (UR) + e In this model VI, HI and UR are dummy variables, in which the un-diversification
variable is excluded from the model. "This was done since if all the binary variables are
included, the normal regression equations are not independent and thus not have a unique
solution." (Bettis, 1981, p. 384) Therefore, β0 embraces the effects of the un-diversification
strategy (Bettis, 1981).
The second model includes the interactive terms in order to explore more the reasons
for differences in performance effects between different diversification strategies. In this type
of model the forward stepwise regression procedure was used (Bettis, 1981), in order to
“include every potentially useful predictor in the model and then delete those terms not
making significant partial contributions at some pre-assigned significance level.” (Agresti &
Finlay, 1997, p. 528) The forward selection begins with none of the variables and adds one
variable at a time to the model until it reaches a point where an inclusion of the remaining
variable does not make a significant contribution in predicting Y. In order to further modify
the forward selection, stepwise regression leaves the variables out from the model, in case
they lose their significance as other variables are added. Therefore, a variable previously
entered into the model at some point may be eliminated due to the overlap with other
variables that have entered at later stages (Agresti & Finlay, 1997). The interactive regression
model to be tested under this forward stepwise procedure is constructed as follows6:
Model with the interaction effects: ORPE = β0 + β1 (SIZE) + β2 (RISK) + β3 (CINT) + β4 (MARS) + β5 (CPE) + β6 (RATIO) + β7 (COUNTRY) + β8 (VI) + β9 (HI) + β10 (UR) + β11 (SIZE) (VI) + β12 (RISK) (VI) + β13 (CINT) (VI) + β14 (MARS) (VI) + β15 (CPE) (VI) + β16 (RATIO) (VI) + β17 (COUNTRY) (VI) + β18 (SIZE) (HI) + β19 (RISK) (HI) + β20 (CINT) (HI) + β21 (MARS) (HI) + β22 (CPE) (HI) + β23 (RATIO) (HI) + β24 (COUNTRY) (HI) + β25 (SIZE) (UR) + β26 (RISK) (UR) + β27 (CINT) (UR) + β28 (MARS) (UR) + β29 (CPE) (UR) + β30 (RATIO) (UR) + β31 (COUNTRY) (UR) + e
The same model will be conducted for net income per employee performance measure
(NIPE). Here, the inclusion of the interaction terms between diversification strategy and the
other variables were of major interest. These terms would strongly suggest reasons for
performance differences. For instance, the inclusion of β21 would suggest that one reason for
the high performance of horizontally integrated firms was the market share (Bettis, 1981) 6 Forward stepwise regression procedure is conducted using the Stata11 Statistics software program. The forward stepwise regression model is used by Bettis (1982) as well, in which the study involved a sample of 58 companies to identify the performance differences among related and unrelated firms.

Selen Gül The Effects of Integration Strategies on Firm Performance
28
5. DATA CONSTRUCTION 5.1. Sample Selection
This paper investigates the performance effects chosen among vertical, horizontal,
unrelated and undiversified strategies, using a sample that embraces the operating
performance measures’ of the Danish companies that are distinguished among 5 large
industries, through years 2009-2005. The decision to use a 5-year time period was based on
the motivation of having a long time period for the study, as well as preventing excessive
missing data by keeping the time frame limited (Capar, 2009).7 The company selection
process has been conducted in the Orbis Database, which covers 80 million companies around
the world, including 395,183 companies operating in Denmark (Appendix 1). Moreover, some
companies have been double checked in the WebDirect Database. The selection criterion was
restricted to Danish companies at the industry-level data that are operating in the manufacture
of food products (NACE Rev. 2, core code 10), manufacture of chemicals and chemical
products (NACE Rev. 2, core code 20), manufacture of basic pharmaceutical products and
pharmaceutical preparations (NACE Rev. 2, core code 21), manufacture of machinery and
equipment (NACE Rev. 2, core code 28) and manufacture of furniture (NACE Rev. 2, core
code 31) industries8. The service firms are excluded in order to diminish the confusing effects
of the differences between manufacturing and service firms (Ravichandran et al. 2009).
“Moreover, there are significant differences between manufacturing and service firms in their
disaggregation of financial data by business activities.” (Ravichandran et al. 2009, p. 218)
Therefore only manufacturing firms are to be chosen from the 2-digit NACE industry
classification, and meeting the following criteria: (1) years with available accounts: 2009-
2005. (2) Number of employees having a minimum value of 10, for all the years. (3)
Operating revenue (turnover) with a known value for all the years.
According to the sampling criteria defined above, an initial sample of 158 companies
was obtained. Out of these firms, 11 of them are eliminated due to being holding companies.
These holding companies generally had more than one primary NACE code, which could not
be distinguished among the industries the company is operating in. Based on the industries; 1
firm from the manufacture of food products, 3 firms from the manufacture of chemical, 3
firms from the manufacture of pharmaceuticals, 1 firm from the manufacture of furniture, and
7 The diversification strategies (VI, HI, Unrelated and Undiversified) are stable and the same over the defined time. 8 Industries are chosen based on the research of the most crucial industries in Denmark.

Selen Gül The Effects of Integration Strategies on Firm Performance
29
finally 3 firms from the manufacture of machinery industries are eliminated. The final sample,
which is a balanced panel, is composed of 147 companies with 1911 firm average year
observations (Appendix 2).
Table 1: Final number of companies by industry
Industries Number of Companies Pharmaceutical Industry 11 Food Industry 54 Chemical Industry 19 Furniture Industry 15 Machinery Industry
48
Total 147 Although the analysis will be based upon 5-year average values of the variables, the
sample is under the category of a panel data, since it contains time series observations of a
number of individuals (Hsiao, 2005). This type is combining both the time-series and cross-
sectional data analysis and “looks at multiple subjects and how they change over the course of
time.”(Wikipedia) Several advantages that the panel data has over cross-sectional and time-
series data could be classified as: (1) More correct assumptions of model parameters. (2)
Greater capacity for confining the complexity of human behavior compared to a single cross-
section or time-series data. (3) Simplifying computation and statistical analysis (Hsiao, 2005).
Besides using the Orbis Database in collecting the data, the Input-Output tables are
gathered in order to analyze the presence of vertical integration. “With the IO data, we can
capture the vertical relationship between a pair of merging firms from the dollar amount of
input transfer between the industries in which the merging firms operate.” (Fan & Goyal,
2006, p. 878) If a company uses the other’s products or services as input or vice versa, the
two industries are categorized to be vertically related. The IO tables are obtained from
statbank.dk, where detailed statistical information on the Danish society exists (Appendix 3).
The majority of the studies that have been conducted in the field of diversification are
classifying the firm’s integration strategies with the use of the SIC codes (Santalo & Becerra,
2008; Miller, 2006; Ravichandran et al. 2009). Primarily in this study, the firms’ integration
strategies are classified according to the first 2-digit NACE Rev. 2 codes. Different from the
world level SIC codes, NACE codes are on the EU level. In addition, “NACE is derived from
ISIC, in the sense that it is more detailed than ISIC.” (NACE Rev. 2 Guide, p. 14) They have
exactly the same items at the highest levels, where NACE is more detailed at lower levels.
Based on the primary and secondary 2-digit NACE codes, the procedure used to categorize
the companies according to their choice of integration strategy is as follows:

Selen Gül The Effects of Integration Strategies on Firm Performance
30
• Firms with one NACE code (primary only): Undiversified firm9
• Firms with the same primary and secondary 2-digit NACE codes: Horizontally
integrated
• Firms with different primary and secondary 2-digit NACE codes:
o Checked the IO table to trace vertical integration, if the supplying industry
exceeds the 1% average threshold10, the company is vertically integrated.
o If the supplying industry falls below the 1% threshold, the company is
unrelated diversified.
• Firms with more than one secondary 2-digit NACE codes are classified based on the
importance level of the NACE codes. The first code to be reported has been regarded
as the most crucial. (Appendix 4)
Table 2 illustrates the number of companies that fall under each type of integration strategy
out of the 147 companies.
Table 2: Number of companies based on integration strategies
Strategies Number of Companies Vertical Integration 27 Horizontal Integration 35 Unrelated Diversification 31 Undiversified
54
Total 147
5.2.Variables Measurement
5.2.1. Performance Measures (Dependent Variables)
Prior studies have put a large emphasis on return on assets (ROA) and return on sales
(ROS) in taking these variables as performance measures (Kahloul & Hallara, 2010; Capar,
2009; Ravichandran, 2009; Bettis, 1981). This study will analyze the management
effectiveness of the Danish companies with operating revenue per employee and net income
per employee measures (Appendix 5).11 The operating revenue per employee simply measures
the amount of the currency sales, or revenue, generated per employee and high levels of this
9 Double checked the company products and activities from their websites; based on the activities 6 of the companies have been changed from undiversified to either HI or unrelated. 10 1% index has been computed looking at the first 10-15 supplying industries’ average percentages through years 2005-2007. 11 In Denmark, the companies’ assets may be misrepresentative. This conclusion is reached by examining the ROA ratios of Novo Nordisk A/S (See Appendix 5).

Selen Gül The Effects of Integration Strategies on Firm Performance
31
indicator is preferable. However compared to a high-tech industry, the labor-intensive
industries may be less productive and generate low levels of the indicator (Investopedia).
Operating revenue per employee (ORPE) = Operating Revenue (Turnover) / Number of employees The other performance measure, net income per employee is taken as an indicator of
management efficiency. Net income per employee measures the ratio of operating income to
the number of employees that is required to produce that level of income.
Net income per employee (NIPE) = Net Income /Number of employees Therefore, net income per employee determines the management's ability to utilize
their employee resources effectively in order to generate profits for the company.
Comparisons of income per employee should only be made between companies in similar
industries. When comparing two companies, the company with a higher value for income per
employee is to be more efficient (Money-Zine)
5.2.2. Independent Variables
The integration strategies of vertical, horizontal, unrelated and undiversified strategies
are defined as mentioned above. These variables will be binary (dummy) variables that take
on the values 1 and 0 depending on the integration strategy of the firm (Bettis, 1981). A value
of 1 will represent the existence of the strategy, whereas a value of 0 indicates that the firm
has not undertaken that particular integration strategy. For simplicity, it is crucial to note that
the choices of strategies are assumed to be mutually exclusive, in which a company cannot
undertake more than one integration strategy.12 In the real world, it is most likely to have a
company with more than one integration strategy; however this assumption will help to assign
the effects of a specific integration choice on performance measures more explicitly.
Apart from the strategies defined above, geographic diversification has been taken into
consideration in the past research. Several measures for this type of diversification that have
been used would be, (1) the measure of international sales as a percentage of total sales, (2)
the number of overseas subsidiaries, (3) the Herfindahl index, (4) the entropy measure, (5)
and the number of countries in which a firm has overseas subsidiaries (Ravichandran et al.
2009). Ravichandran et al. (2009) underlines that, each measure has its own advantages and
12 One particular strategy among the four choices has to be identified for each firm.

Selen Gül The Effects of Integration Strategies on Firm Performance
32
limitations. This study will use the number of countries in which a firm has foreign
subsidiaries, in order to reflect the dispersal of the company’s functions across countries.
Moreover, this paper will present some measures of the concentration indices, in order
to give an understanding on how concentrated and diversified the industries are. The measure
of the diversification of the firm has been valued from two continuous measures which are the
Herfindahl index and the entropy measure (Kahloul & Hallara, 2010). The Herfindahl index is
a measure of market concentration, where “the ratio of the firm’s sales within the firm’s
primary industry to the firm’s total sales” (Jacquemin & Berry, 1979, p. 359) is computed.
In the formula, “n is the number of firm’s activities and Pi is the relative weight of each
activity evaluated as the proportion of the sale xi of the activity i of a firm.” (Kahloul &
Hallara, 2010, p. 152) A rise in the Herfindahl index usually depicts a decrease in competition
and an increase of market power, whereas reductions indicate the opposite. The higher the
value of the index, the less likely a given industry will reveal competitive behavior
(Lipczynski & Wilson, 2001). Moreover, the Horizontal Merger Guidelines of U.S. Federal
Trade Commission has presented ranges in specifying three types of concentration:
• Un-concentrated Markets: HHI below 0.15
• Moderately Concentrated Markets: HHI between 0.15 and 0.25
• Highly Concentrated Markets: HHI above 0.25 (part 5.3)
On the other side, the entropy measure is the inverse of the Herfindahl index that weighs each
market share (Pi) by the logarithm of Pi.
It is a measure that enumerates the degree of uncertainty in a given industry, and the lower
value of the index would expose greater certainty of the established firms’ future relationships
with the buyers in the market. “The entropy measure is also more sensitive than the
Herfindahl index to very small firms.” (Jacquemin & Berry, 1979, p. 360) Since E is an
inverse concentration measure, the value is small for highly concentrated industries, whereas
large for a low concentrated industry (Lipczynski et al. 2005). Moreover, by dividing the
entropy measure by the number of companies, relative measure (RE) could be obtained,
which provides convenience in making comparisons among industries. “The minimum
Selen Gül The Effects of Integration Strategies on Firm Performance
33
possible value is RE=0 for a monopoly, and the maximum possible value is RE=1 for an
industry comprising N equal-sized firms.” (Lipczynski et al. 2005, p. 203)
In addition to these indices, concentration ratio (CR4) for the four largest companies
can be calculated, in order to illustrate the scope of market control of the largest firms in the
industry and to present the degree to which an industry is oligopolistic (Wikipedia). However,
“the concentration ratio measure suffers from the problem that it only focuses on the top firms
in the industry and takes no account of the distribution of remaining firms.” (Lipczynski &
Wilson, 2001, p. 109)
CRm= Σmi=1 si
Where, m is the number of firms taken into account (which is 4 in this study) and si is the
market share of the firm i.
Based on these measurements, the market shares in this study are computed by
summing the operating revenues of all the firms in one particular industry for that year, and
dividing each company’s individual operating revenues to this total industry turnover. This
industry turnover is taken to be a representative value for the whole industry, since the Orbis
Database could not identify applicable operating revenue values for all the companies. In
addition; the measures that are obtained from Orbis were not adequate enough to distinguish
the firm’s activities within its operating sales. Moreover, the analysis for the concentration
indices is conducted for 4 years, due to the missing values of 2005 for the pharmaceutical
company Novo Nordisk A/S.13
5.2.3. Control Variables
The study involves several control variables in order to determine the effect of
integration strategies on the firm performance by eliminating the other affects on firm
variables. Based on the theories developed to enlighten the integration strategies, empirical
studies have commonly used the factors of size, risk, and capital intensity as control variables
(Bettis, 1981; Ravichandran et al. 2009) In addition to these variables average market share,
average cost per employee and the ratio of average cost per employee to average operating
revenue per employee will be included in the analysis14.
13 Novo Nordisk A/S did not have an applicable operating revenue value for the year 2005. In order to have an accurate representation of the indices the analysis of concentration indices is limited through years 2009-2006. The analysis of average market shares is to be taken for 5 years, besides Novo Nordisk A/S. 14 Other common control variables such as R&D expenditure and Added Value were not applicable in Orbis Database.

Selen Gül The Effects of Integration Strategies on Firm Performance
34
SIZE– Kumar et al. (1999) has conducted a study of cross-country analysis in which
they have found “that institutional factors such as the efficiency of the judicial system and the
development of financial markets as well as technological factors such as capital intensity and
market size seem to influence the size of firms.” (p. 30) The managerial literature has covered
a number of variables to measure firm size including number of employees, average assets,
and average sales (Leiblein & Miller, 2003). The firm size in this study is measured as the
average natural logarithm of total employees over the past 5-year period, 2009-2005.
RISK – Bettis (1981) points out to the limitation of the empirical work conducted on
the relationship between profits and risk. However, the importance of risk as an economic
variable has been accepted for many years. The term risk is commonly used to define some
degree of hazard, which could be financial as bankruptcy or solvency. “Such risk can result
from a variety of sources such as short-term fluctuations in profits, changes in consumer
tastes, changes in technology, changes in government policy and strategic moves of
competitors.” (Bettis, 1981, p. 383) For instance, in the studies of Fisher & Hall (1969) that
included 11 different industries, observed a positive relationship among risk and profit within
the industries. Moreover Bettis & Hall (1982) observed in a study of 80 large diversified firms
through years 1973-1977 that unrelated diversified firms illustrated a positive relationship
between return on assets and the standard deviation of the return on assets, whereas no
relationship or negative one was detected for related diversified companies. Although most
studies of risk has been conducted at the degree of the securities markets, this paper will
include the variable of risk as the measure of standard deviation of return on assets over the
average period of 2009 to 2005.
CINT –A company would be capital intensive if a business process demands large
amounts of money and other financial resources to produce a good or service. Capital
intensity will be based on the ratio of the capital required to the number of labor that is
required. Oil production and refining, telecommunications and transports such as railways and
airlines industries could be given as examples of having high capital intensity. “Companies in
capital-intensive industries are thus often marked by high levels of depreciation and fixed
assets on the balance sheet.” (Investopedia) Therefore, it could be underlined that the capital
intensity of industries varies widely and some industries could be more capital intensive based
on the nature of the technology (Bettis, 1981). Moreover Porter (1976) has indicated that
capital intensity may act as a barrier to exit if taken as an industry specific asset. “In general,
capital intensity imposes a greater degree of risk because assets are frozen in long-lived forms
that may not be easy to sell.” (Bettis, 1981, p. 382) In this study, capital intensity is measured

Selen Gül The Effects of Integration Strategies on Firm Performance
35
by taking the ratio of average fixed assets to the average number of employees over the years
2009-2005.
MARS –The companies’ market shares are computed by dividing the company’s sales
in a particular period by the total sales of the industry at that same period. This variable will
be giving a general idea of the size of a company regarding its markets and competitors. The
rise and fall of the market share would be an indicator of the relative competitiveness of the
company's products or services. Therefore, a company that is increasing its market share will
observe a growth in its revenues, which would be faster compared to its competitors.
Economies of scale and improvement in profitability could be achieved based on the increases
of market share (Investopedia). Based on this phenomenon, the average value of the 5-year
market shares for each firm is computed, and taken as a control variable in analyzing the
effects on performance.
CPE –Average cost per employee is used in this study, in order to take the effect of
how much each employee would cost based on the total costs of the firm. The total costs
would be the sum of fixed costs, variable costs and semi-variable costs (InvestorWords) The
Orbis database had this measure calculated.
RATIO – The average of cost of employee to operating revenue ratio will represent if
the costs of the employees are exceeding the company’s operating revenue. In other words, it
is to observe how many times the costs are exceeding the revenues. This control variable will
help to examine the effect of this ratio on the firm’s performance measurement.
Based on these definitions, Table 3 summarizes the calculations of the variables
presented above.
Table 3: Variable Definitions
Variable Definitions Formulas Average Operating Revenue per Employee Avg. Operating Revenue / Avg. Number of
Employees Average Net Income per Employee Avg. Net Income / Avg. Number of Employees Size SIZE=1/ln(Number of Employees) Risk RISK= Standard deviation of ROA for 2009-
2005 Capital Intensity CINT=Avg. Fixed Assets / Avg. Number of
Employees Average Market Shares MARS=Total Market Share (for 5 years) /5 Average Cost per Employee CPE=Total Cost per Employee (for 5 years) /5 Ratio of Cost & Revenue RATIO=(Average) Cost of Employee /
Operating Revenue

Selen Gül The Effects of Integration Strategies on Firm Performance
36
Although the study’s aim is to differentiate the values among the industries, it is worth
to summarize the whole data as illustrated in Table 4. The sample of the 147 firms has
average operating revenue per employee (ORPE) of 2,622 and a net income per employee
(NIPE) of 116. Due to the differences in industries; the performance measures, capital
intensity, and market share variables have high volatility, standard deviation. This volatility
could also be observed by the huge differences of the minimum and maximum values
presented. Therefore, the separate analysis of the industries aims to reduce this volatility and
attain more accurate representations of how the integration choices affect firm performance.
Table 4: Summary statistics
Variable Observations Mean Std. Dev. Min. Max. ORPE 147 2,621.8 3,753.5 403.3 40,836 NIPE 147 116.2 299.9 -514.9 2,114.1 RISK 147 7.80 7.06 0.18 43.37 SIZE 147 0.21 0.07 0.10 0.40 CINT 147 951.5 1,713 14.5 18,134 MARS 147 0.03 0.09 0.0001 .65 CPE 147 406.28 101.86 110.56 919.3 RATIO 147 24.41 13.57 1.27 93.65 COUNTRY 147 4.36 9.20 0 64
5.3.Limitations
Due to the scope of this study, limited number of industries and firms may not
represent the whole Danish economy. The number of industries is to be taken as the 5 biggest
industries, based on the highest number of firms involved in those industries. Restricting the
number of industries leads to the restriction of the sample size as well. A longer time period
would be recommended to more effectively capture the effects of the sample. The data had to
be restricted to include the firms with available sales figures and the other variable
measurements, therefore the descriptive statistics had to be computed with small number of
firms within each industry. Moreover, only manufacturing firms are taken into consideration,
which may confine the generalizability of the findings. In addition, a crucial limitation would
be the lack of identifying the relative shares of the various activities within the firm-level.

Selen Gül The Effects of Integration Strategies on Firm Performance
37
6. GENERAL DESCRIPTIVE ANALYSIS OF EACH INDUSTRY
As mentioned above, it is crucial to differentiate the industries in order to investigate
how the effect of the integration strategies on performance vary based on the industry. Santalo
& Becerra (2008) are avoiding taking the effect of diversification on performance as
homogenous across industries, but rather illustrating that “diversified firms observe a
diversification discount if and only if they compete in industries with a large number of
single-segment companies, or enjoy a premium in those industries in which only a few non-
diversified firms compete.” (p. 851) Moreover, Montgomery & Christensen (1981) have
examined significant performance differences among Rumelt’s categories of diversification
and the market structure variables (market share, market concentration, market growth and
firm size). The market structure-performance linkage has suggested that “firms located in
markets which constrain their growth or profitability is the most likely candidates for
diversification.” (p. 338) Therefore, firms in low opportunity markets have the tendency to
pursue unrelated diversification.
This section will illustrate the summary statistics output15 for the industries;
manufacture of basic pharmaceutical products and pharmaceutical preparations (NACE 21),
manufacture of food products (NACE 10), manufacture of chemicals and chemical products
(NACE 20), manufacture of furniture (NACE 31), and finally manufacture of machinery and
equipment respectively (NACE 28). Out of these 5 industries, the manufacture of food
products and the manufacture of machinery and equipment industries will be subject to be
tested under the OLS regression. The remaining industries will be out of the analysis due to
having insufficient number of companies. Moreover, it is crucial to note that the data consists
of firms only having applicable values for the variables, therefore taken to be as the
representatives of the whole industry.
6.1. Manufacture of Basic Pharmaceutical Products and Pharmaceutical Preparations
The data for the pharmaceutical industry that has been obtained from the Orbis
database comprised of an initial sample of 14 companies, which had applicable values for the
variables. 3 of the companies (Origio A/S, Exiqon A/S & Lifecycle Pharma A/S) have been
eliminated due to being holding companies, leaving a sample of 11 companies.
Based on the comparisons of the primary and secondary NACE codes of the firms, the
mutually exclusive integration strategies are differentiated. Out of these 11 companies, 4 are
15 Obtained from the statistics program Stata11.

Selen Gül The Effects of Integration Strategies on Firm Performance
38
vertically integrated, 1 is horizontally integrated, 3 are unrelated diversified and 3 of them are
undiversified (Appendix 6, T. 11) 16.
Table 5: Number of companies based on integration strategies
Strategy VI HI UnRe. UnDiv. Total Num. of Firms 4 1 3 3 11 Although the sample embraces only one horizontally integrated company, it is worth
illustrating for each integration strategy the averages of the profitability measures, market
shares and the numbers of countries the companies are operating in.
Table 6: General analysis based on integration strategies
Analysis VI Std.
Dev. HI Std.
Dev. UnRe. Std.
Dev. UnDiv. Std.
Dev. Avg. ORPE17
1,482.9 573.33 2,247.5 - 2,754 1,262.69 1,662.7 972.97
Avg. NIPE 669 1,100.8 1,053.2 - 450.92 481.66 125.34 442.18 Avg. MARS 0.08 0.17 0.02 - 0.22 0.24 0.04 0.06 Avg. COUNTRY
16 19.24 4 - 31 31.66 9 15.01
Since the VI, unrelated and undiversified strategies have more or less the same number
of firms; among them the unrelated integration strategy has the highest average operating
revenue per employee measure (2,754), whereas the vertically integrated firms have the
lowest (1482.9), as shown in Table 6. Moreover, the companies with an unrelated
diversification strategy are enjoying larger market shares on the average (22%) and they are
more dispersed in foreign countries (31). As it will be mentioned below, this could be due to
the low competition within the industry, where the companies observe an advantage in
seeking other profitable industries in which to participate. These seek will in return permit a
wider range of areas to work in for the companies (Bettis & Hall, 1982). From the net income
per employee (NIPE) point of view, it is observed that vertically integrated companies tend to
have the highest value on the average (without taking into account the HI strategy). However
it is important to note that, there is high volatility in the value of NIPE for all the integration
strategies, where some companies have reported negative values of NIPE whereas others
reported positive.
In order to have an understanding of the competition within the industry, and the big
players’ market shares, it is crucial to examine the concentration indices of the industry. The 16 T.11 stands for Table 11 under Appendix 6. 17 The variables are defined in detail under subsection 5.2 Variables Measurement.

Selen Gül The Effects of Integration Strategies on Firm Performance
39
indices have been conducted for a 4 year period (2009-2006) instead of a 5 year for all the
industries, due to the missing values for the year 2005 for Novo Nordisk /AS.
Table 7: Concentration indices
Concentration Indices
2009 2008 2007 2006
Entropy Measure 1.505 1.518 1.526 1.406 Herfindahl Index 0.287 0.290 0.294 0.333 Relative Measure 0.137 0.138 0.139 0.128 CR4 0.916 0.905 0.906 0.939 According to Table 7, it is observed that the Herfindahl index has been slightly
decreasing through the years, indicating an increase of competition and a decrease in market
power. The average HHI would be 0.301 which is above the 0.25 threshold (Horizontal
Merger Guidelines) therefore highlighting high concentration, meaning that this industry is
not competitive and has dominant players. Moreover, the concentration ratio (CR4), which is
the sum of the 4 biggest players in the industry, is illustrating a slight decrease in their market
shares due to this increasing competition. However, the overall level of competition is low in
the industry and CR4 is supporting this with the high level of market shares. The entropy
measure is varying oppositely to the Herfindahl index, since the sum of the products of
market shares to its natural logarithm are taken. The relative measure is the value of the
entropy measure divided by the number of firms, in order to be able to make comparisons
among the industries18. Moreover, the descriptive statistics below indicates a high standard
deviation for the average market shares (MARS), which is greater than the mean. This is
specifying a wide range of market shares, and if examined individually it is observed that for
the year 2009 Novo Nordisk A/S has 22.97% more market share than H. Lundbeck A/S, the
company with the second highest market share.
Table 8: Descriptive statistics of pharmaceutical products and pharmaceutical preparations industry
18 RE will be analyzed further when comparing the industries.
Variable Obs. Mean Std. Dev. Min. Max. ORPE 11 1,948.1 960.02 636.68 4,110.3 NIPE 11 496.13 730.66 -514.92 2114.07 RISK 11 9.60 8.62 0.58 29.47 SIZE 11 0.17 0.07 0.11 0.33 CINT 11 3,465.02 5,158.11 577.56 18,133.7 MARS 11 0.10 0.15 0.0005 0.48 CPE 11 562.42 129.47 447.33 919.30 RATIO 11 38.49 21.95 15.37 93.65 COUNTRY 11 16.91 21.23 0 64

Selen Gül The Effects of Integration Strategies on Firm Performance
40
Table 8 contains the summary statistics for the manufacture of pharmaceutical
products industry by taking the average values for the period 2009-2005 (Appendix 6, Output
1). The firms have average operating revenue per employee of 1,948 and an average net
income per employee of 496. This difference could be due to the two companies (Bavarian
Nordic A/S and Mekos Laboratories ApS) that have reported negative average values of net
income through the 5 year period. The effect of these negative values could be observed by
the high standard deviation which is 730.66. Apart from this, high volatility could be detected
for the average capital intensity, market share and the number of countries, which could be
due to the small number of sample size. Moreover, examining the values of kurtosis and
skewness for the variables would indicate whether the data is peaked or flat respectively
compared to the normal distribution and if the data is lack of symmetry (Engineering
Statistics Handbook). “A distribution that is not symmetric, but rather has most of its values
either to the right or to the left of the mode, is said to be skewed.” (Harnett & Soni, 1991, p.
34) The value of kurtosis being near the value of 3 and 0 for skewness would indicate a
normal distribution. Based on these definitions, the values for capital intensity (CINT),
market share (MARS), cost per employee (CPE) and the ratio of cost of employee to
operating revenue (RATIO) measures have moderate and positive kurtosis and skewness
(Appendix 6, Output 2). For these data sets, there is a peaked and right skewed distribution
meaning that few companies exist with a value greater than the mean of the measurement
(Appendix 6, Output 4).
Table 9: Correlations The correlations presented at Table 9,
are indicating a positive correlation for
operating revenue per employee with the
variables net income per employee, size,
market share, cost per employee, horizontal
integration, unrelated diversified and the
number of countries. Moreover, the net
income per employee measure is positively
correlated with capital intensity, market share,
vertical integration, horizontal integration and
the number of countries. Therefore, for both of the performance measures the risk, ratio (cost
of employee to operating revenue) and un-diversification strategies are not favorable in which
negative correlation exists. Among the integration strategies, unrelated diversification strategy
Correlation ORPE NIPE ORPE 1.00 NIPE 0.17 1.00 RISK -0.30 -0.13 SIZE 0.04 -0.43 CINT -0.05 0.78 MARS 0.16 0.20 CPE 0.38 -0.04 RATIO -0.74 -0.45 VI -0.38 0.19 HI 0.10 0.25 UR 0.54 -0.04 UD -0.19 -0.33 COUNTRY 0.10 0.20

Selen Gül The Effects of Integration Strategies on Firm Performance
41
has the highest correlation with ORPE (0.539) which supports the high average value of the
companies under this category. In addition, this industry favors geographic diversification by
indicating a positive correlation with the performance measures and the unrelated integration
strategy (Appendix 6, Output 3).
6.2.Manufacture of Food Products
Following the manufacture of pharmaceuticals industry, data for the food industry has
been obtained, with an initial sample of 55 companies. East Asiatic Co. LTD A/S has been
eliminated due to being a holding company, leaving a sample of 54 companies.
Out of the 54 firms, it is identified that 6 of them are vertically integrated, 16 are
horizontally integrated, 9 are unrelated diversified and 23 companies are undiversified. By
looking at these numbers, one could say that this industry dominates the un-diversification
strategy (Appendix 7, T. 12).
Table 10: Number of companies based on integration strategies
Strategy VI HI UnRe. UnDiv. Total Num. of Firms 6 16 9 23 54 According to the analysis presented below in Table 11, the profitability measure of
operating revenue per employee (ORPE) is the highest for horizontally integrated companies
(5,016) followed by vertical integration (4,182.7), unrelated diversified (3,540) and
undiversified strategies (2,724). Although the unrelated companies are not observed to be the
lowest performing, the horizontally integrated companies are outperforming the unrelated
diversified companies based on the average ORPE performance measure, as this
outperformance has been supported by previous studies (Bettis, 1981; Miller, 2006 & Rumelt,
1974). From the NIPE point of view, the unrelated diversified companies tend to have the
highest on average, however representing high volatility due to the number of employees that
each company embraces and positive or negative values of net income announced.
Table 11: General analysis based on integration strategies
Analysis VI Std. Dev.
HI Std. Dev.
UnRe. Std. Dev.
UnDiv. Std. Dev.
Avg. ORPE 4,182.7 3,117.4 5,016 9,679.9 3,540 3,552.30 2,724 2,096.7 Avg. NIPE 22.63 159.93 78.82 121.95 194.05 329.07 36.55 82.23 Avg.MARS 0.01 0.007 0.04 0.12 0.03 0.06 0.005 0.005 Avg.COUNTRY 3 3.50 2 3.24 7 12.83 2 4.58

Selen Gül The Effects of Integration Strategies on Firm Performance
42
By having a high number of undiversified companies, which represents 42% of the whole
industry, it is crucial to examine the level of concentration within the industry. Table 12
illustrates the indices computed through the years 2009 to 2006.
Table 12: Concentration indices
Concentration Indices 2009 2008 2007 2006
Entropy Measure 2.120 2.153 2.125 2.017 Herfindahl Index 0.252 0.243 0.248 0.278 Relative Measure 0.040 0.041 0.040 0.038 CR4 0.659 0.684 0.700 0.731 Until the year 2009, a slight decrease in Herfindahl index is observed, indicating an
increase in competition. According to the Horizontal Merger Guidelines, in the years 2006
and 2009 the industry was highly concentrated (0.278 and 0.252 respectively) since the HH
index is exceeding the 0.25 threshold. Between the years 2008 and 2007, moderate
concentration existed, due to having a value in between 0.15 to 0.25 thresholds. Moreover a
slight decrease of the concentration ratio of the 4 biggest players is observed. The increase in
competition could be due effect of the dominant undiversified companies, since they are
aiming to protect and increase the market shares within the industry, without integrating.
Moreover, as Jacquemin & Berry (1979) has highlighted, the entropy measure reveals the
degree of uncertainty in a given industry and the lower values would indicate greater certainty
of the firms’ relationships with the buyers in the market. Therefore, compared to the
pharmaceutical industry, the food industry reveals greater uncertainty.
The summary statistics for the manufacture of food industry, presented in Table 13,
depicts average operating revenue per employee of 3701.21 and a net income per employee
measure of 73.78. Both of these measures present high volatility (5668.6, and 170.69
respectively). The other variables having high variability are the risk (6.59), market share
(0.06), and the number of countries the firm is operating in (6.35). The variability in market
share could be due to the low competition with dominant players in the industry, in which the
Leverandorselskabet Danish Crown Amba Company has a market share of 47.54% (more
than 30% of the second company with the highest market share). The volatility of the number
of countries is also understandable, since there are 9 companies that are unrelated diversified
in an industry where 23 undiversified firms are operating. Moreover, apart from the variables
size and cost per employee, the remaining values are positively skewed with high kurtosis
(Appendix 7, Output 5-6).

Selen Gül The Effects of Integration Strategies on Firm Performance
43
Table 13: Descriptive statistics of food industry
Besides the analysis presented above, the coefficient correlations are demonstrated in
Table 14. The results show that risk, market share, cost of employee to operating revenue
ratio, unrelated integration, un-diversification strategy, and the number of countries are
negatively correlated with the operating revenue per employee measure. The positive
correlation of horizontal and vertical integration strategies are reasonable, taking into account
the highest values of ORPE to be presented above. The other performance measure, net
income per employee, is negatively correlated with market share, vertical integration, un-
diversification strategy and the number of countries. This would be explained as; any rise in
of these coefficients or attempt to undertake the integration strategies would result in a
decrease in the performance measures.
Moreover a positive correlation exists with
risk, size, capital intensity, cost per employee,
and cost of employee to operating revenue
ratio, horizontal and unrelated integration;
meaning that a rise or decrease in one of the
variables will affect the performance measure
of NIPE in the same direction. The food
industry is not favoring geographic
diversification, due to the negative correlation
Table 14: Correlations of both performance measures with the number of countries
(Appendix 7, Output 7).
Variable Obs. Mean Std. Dev. Min. Max. ORPE 54 3,701.2 5,668.6 783.47 40,836 NIPE 54 73.78 170.69 -385.58 820.71 RISK 54 5.99 6.60 0.18 33.81 SIZE 54 0.21 0.06 0.10 0.37 CINT 54 1,055.7 939.09 79.44 4,692.9 MARS 54 0.02 0.07 0.0002 0.48 CPE 54 392.79 95.34 188.35 707.62 RATIO 54 17.86 10.50 1.27 58.58 COUNTRY 54 3.28 6.36 0 40
Correlation ORPE NIPE ORPE 1.00 NIPE 0.25 1.00 RISK -0.17 0.22 SIZE 0.47 0.41 CINT 0.63 0.21 MARS -0.05 -0.03 CPE 0.36 0.47 RATIO -0.45 0.18 VI 0.03 -0.11 HI 0.15 0.02 UR -0.01 0.32 UD -0.14 -0.19 COUNTRY -0.08 -0.09

Selen Gül The Effects of Integration Strategies on Firm Performance
44
6.3.Manufacture of Chemicals and Chemical Products
The manufacture of chemicals and chemical products industry comprised of 22
companies initially, in which 3 of them (Auriga Industries A/S, Flugger A/S and SP Group
A/S) have been eliminated due to being holding companies, leaving a sample of 19 firms.
These 19 companies are distinguished in Table 15 as 2 vertically integrated, 6
horizontally integrated, 5 unrelated diversified and 6 of them are undiversified. This
distribution does not highlight a specific dominant strategy that is undertaken within this
industry (Appendix 8, T. 13).
Table 15: Number of companies based on integration strategies
Strategy VI HI UnRe. UnDiv. Total Num. of Firms 2 6 5 6 19 According to the integration strategies, it is illustrated in Table 16 that horizontally
integrated companies have been outperforming the remaining strategies with an average value
of 4132.93 operating revenue per employee and an average market share of 13%. It is
followed by undiversified companies (3046.18), vertically integrated firms (2432.6) and the
lowest being the unrelated diversified companies (2174.22). These values are supporting the
findings of Rumelt (1982) where on the average related diversification strategies
outperformed the other integration strategies, whereas the unrelated business strategy was the
lowest performing. From the perspective of net operating income per employee, high
volatility exists for the companies that have undertaken horizontal integration, unrelated
diversification and un-diversification strategies. Moreover, the unrelated diversified
companies have the highest amount of countries that are operating in.
Table 16: General analysis based on integration strategies
Analysis VI Std. Dev.
HI Std. Dev.
UnRe. Std.Dev. UnDiv. Std. Dev.
Avg. ORPE 2,432 317.62 4,132.9 2,636.8 2,174.2 822.27 3,046.2 3,254.5 Avg. NIPE 297.63 188.76 222.02 290.20 87.89 138.32 3.47 87.65 Avg. MARS 0.005 0.001 0.13 0.26 0.02 0.03 0.005 0.005 Avg. COUNTRY
2 0.71 6 8.94 11 21.74 4 8.09
The concentration indices presented below in Table 17 are indicating high values of
concentration and low competition, since the values for the Herfindahl index is above the 0.25
threshold. Moreover through the years 2009 to 2006 first an increase and then a fall of the HH

Selen Gül The Effects of Integration Strategies on Firm Performance
45
index is observed, specifying an increase in competition. Due to this increase, the first 4
biggest players in the market have experienced a slight fall in their market shares. In addition,
the entropy measure reveals greater certainty about the future relationships of the companies
due to its lower value compared to the previous industries.
Table 17: Concentration indices
Concentration Indices
2009 2008 2007 2006
Entropy Measure 1.222 1.085 1.066 1.098 Herfindahl Index 0.368 0.452 0.479 0.451 Relative Measure 0.064 0.057 0.056 0.058 CR4 0.792 0.815 0.823 0.801 The summary statistics for the manufacture of chemicals industry is presented in Table
18, highlighting average operating revenue per employee to be 3095.31 and net income per
employee 125.67. The values with high volatilities would be the net income per employee,
market share and the number of country measures. The effects of these high deviations are
observed from the values of skewness and kurtosis as well. For instance, the values for market
share are demonstrated as 3.89 and 16.43 respectively, which are beyond the values of 0 and 3
for a normal distribution. Since there is low competition with dominant players in the market,
it is reasonable to observe a massive difference between minimum and maximum values of
market shares (0.0001 and 0.65 respectively) (Appendix 8, Output 8-9).
Table 18: Descriptive statistics of chemicals industry
Variable Obs. Mean Std. Dev. Min. Max. ORPE 19 3,095.3 2,381.9 601.7 9,517.2 NIPE 19 125.67 208.60 -144.19 708.35 RISK 19 7.24 6.93 1.12 24.24 SIZE 19 0.21 0.07 0.11 0.40 CINT 19 952.8 908.43 14.52 4,292.2 MARS 19 0.05 0.15 0.0001 0.65 CPE 19 442.5 93.13 293.88 640.90 RATIO 19 20.47 11.89 5.47 51.26 COUNTRY 19 5.95 12.55 0 50
Correlation ORPE NIPE ORPE 1.00 NIPE 0.45 1.00 RISK -0.09 -0.06 SIZE 0.13 -0.02 CINT 0.55 0.46 MARS 0.53 0.32 CPE 0.47 0.43 RATIO -0.69 -0.35

Selen Gül The Effects of Integration Strategies on Firm Performance
46
In order to give a deeper understanding
of the values presented above, Table 19
illustrates the correlation coefficients for the
chemicals industry. Based on the table, the
Table 19: Correlations operating revenue per employee performance measure is negatively
correlated with risk, cost of employee to operating revenue ratio, vertical integration,
unrelated diversification, un-diversification strategies and the number of countries. A rise in
one of these values will lead a fall in the value of ORPE. On the other side, net income per
employee performance measure is negatively correlated with risk, size, ratio, unrelated
diversification, un-diversification strategies and the number of countries. Therefore, it could
be said that either the performance measures or the strategies/control variables are not
favoring each other, in terms of being risky, unrelated, undiversified, geographically
diversified, and having high cost of employee to operating revenue ratio (Appendix 8, Output
10).
6.4.Manufacture of Furniture
The third industry, the manufacture of furniture, involved 16 companies with one
holding company (Boconcept Holding A/S). After the elimination the sample is left with 15
companies, with 4 vertically integrated, 2 horizontally integrated 2 unrelated diversified and 7
undiversified firms. This sample is dominated by undiversified companies by 47% of the
industry (Appendix 9, T. 14).
Table 20: Number of companies based on integration strategies
Strategy VI HI UnRe. UnDiv. Total Num. of Firms 4 2 2 7 15 As it has been generally analyzed, Table 21 indicates the highest value of the
operating revenue per employee as 1603.82 and the market share as 19%, being under the
horizontal integration strategy. This is followed by the unrelated diversification, vertical
integration and un-diversification strategies. On the other side, the average net operating
income values are highest for the undiversified companies, followed by horizontal integration,
vertical integration and a negative value for unrelated diversification. It is again crucial to
note that the sample size is small in order to be able to demonstrate a very accurate
representation for the whole industry. However, these values can indicate that within this
industry, the average operating revenue per employee figures are not volatile among the
strategies to be chosen. The differentiation is more explicit with the net income per employee
VI -0.10 0.29 HI 0.30 0.32 UR -0.24 -0.11 UD -0.01 -0.41 COUNTRY -0.11 -0.07

Selen Gül The Effects of Integration Strategies on Firm Performance
47
performance measurement, where the undiversified companies are benefiting most and the
unrelated diversifiers the least.
Table 21: General analysis based on integration strategies
Analysis VI Std. Dev.
HI Std. Dev.
UnRe. Std. Dev.
UnDiv. Std. Dev.
Avg. ORPE 1,372.4 134.89 1,603.8 49.11 1,537.2 317.13 1,362.9 1136.7 Avg. NIPE 32.41 28.31 60.02 33.83 -124.85 116.64 258.41 460.07 Avg. MARS 0.04 0.02 0.19 0.24 0.05 0.007 0.03 0.06 Avg. COUNTRY
3 2.38 1 0 2 0 3 6.69
Apart from the previous industries that are mentioned above, Table 22 illustrates the
Herfindahl indices to be measured as moderately concentrated through the years 2009 to
2006. This reasoning is due to the threshold of having a value in between 0.15 to 0.25
(Horizontal Merger Guidelines), meaning that competition would not be as low as in the
industries mentioned above. The manufacture of furniture industry is more competitive with
less dominant players. This could also be observed from the value of the concentration index,
which on average is 63.67% and is less than the average of the previous industries where
dominant players existed. Moreover apart from the manufacture of food products industry, the
entropy index is higher compared to other industries, which reveals greater uncertainty within
the industry.
Table 22: Concentration indices
Concentration Indices
2009 2008 2007 2006
Entropy Measure 1.702 1.755 1.729 1.736 Herfindahl Index 0.156 0.148 0.173 0.180 Relative Measure 0.114 0.117 0.115 0.116 CR4 0.623 0.616 0.658 0.649 The descriptive statistics for the manufacture of furniture industry in Table 23 depicts
the average operating revenue per employee to be 1,420.78 and the net income per employee
120.59. High standard deviation is present for the variables net income per employee, risk,
capital intensity, market share and the number of countries. According to the industry average
of operating revenue per employee, the horizontal and unrelated companies are above this
value although each strategy embraces only 2 companies (Appendix 9, Output 11-12).
Table 23: Descriptive statistics of furniture industry
Variable Obs. Mean Std. Dev. Min. Max. ORPE 15 1,420.78 757.68 403.27 3,536.95

Selen Gül The Effects of Integration Strategies on Firm Performance
48
Table 24: Correlations
According to Table 24, operating
revenue per employee is negatively correlated
with size, ratio, vertical integration and un-
diversification strategies. On the other side,
net income per employee performance
measure is negatively correlated with risk,
size, ratio, vertical integration, horizontal
integration, unrelated diversified strategies.
These correlations are consistent with the
analysis of Table 21 above, in which ORPE is
positively correlated with HI strategy, therefore having the highest value for this type of
strategy. NIPE is positively correlated with UD strategy and therefore has the highest value
under this strategy. Moreover for both of the performance measures the firm’s size, ratio, and
the vertical integration strategies are negatively correlated (Appendix 9, Output 13).
6.5.Manufacture of Machinery and Equipment
Finally, the manufacture of machinery and equipment industry has initially a sample
of 51 companies, in which 3 of them (Skako A/S, Svejsemaskinefabrikken Migatronic A/S
and Roblon A/S) have been eliminated due to being holding companies. The final sample
embraces 48 companies, with 11 vertically integrated, 10 horizontally integrated, 12 unrelated
diversified and 15 undiversified firms. It is observed that this industry involves the integration
strategies more evenly dispersed (Appendix 10, T. 15).
Table 25: Number of companies based on integration strategies Strategy VI HI UnRe. UnDiv. Total Num. of Firms 11 10 12 15 48 Based on the average analysis computed for the each integration strategy in Table 26,
the undiversified companies indicate the highest operating revenue per employee (2,619) and
NIPE 15 120.59 335.84 -207.32 1,240.93 RISK 15 9.49 10.05 0.62 43.37 SIZE 15 0.24 0.08 0.14 0.38 CINT 15 427.72 460.77 40.65 2,020.22 MARS 15 0.06 0.94 0.001 0.36 CPE 15 353.03 41.02 252.12 417.85 RATIO 15 30.99 14.14 10.50 63.67 COUNTRY 15 2.4 4.56 0 18
Correlation ORPE NIPE ORPE 1.00 NIPE 0.83 1.00 RISK 0.28 -0.08 SIZE -0.53 -0.14 CINT 0.73 0.85 MARS 0.42 0.27 CPE 0.35 0.05 RATIO -0.85 -0.49 VI -0.04 -0.16 HI 0.10 -0.07 UR 0.06 -0.30 UD -0.07 0.40 COUNTRY 0.75 0.84

Selen Gül The Effects of Integration Strategies on Firm Performance
49
the market share (0.047) on average; followed by unrelated diversified, vertically integrated
and horizontally integrated. The average ORPE for the whole sample is 1,749 and based on
this the only strategy above this mean is the un-diversification strategy. However, in terms of
net income per employee the unrelated companies are outperforming, and still the
undiversified companies are above the average NIPE of the whole sample (71.62). Moreover
the average countries that the companies are operating in is the same and highest for the
horizontally integrated and un-diversified companies (4). In general it could be underlined
that this industry is favoring the undiversified companies more in terms of operating revenue
per employee, compared to the other industries.
Table 26: General analysis based on integration strategies
Analysis VI Std. Dev.
HI Std. Dev.
UnRe. Std. Dev.
UnDiv. Std. Dev.
Avg. ORPE 1,489.9 777.5 1,002.55 147.9 1,527.3 376.11 2,619. 2363.46 Avg. NIPE 20.22 56.84 -43.26 99.54 157.97 371.71 116.8 111.51 Avg. MARS 0.01 0.02 0.006 0.006 0.009 0.009 0.05 0.07 Avg. COUNTRY
1 1.30 4 3.76 2 1.30 4 4.67
The concentration indices presented in Table 27, indicate an un-concentrated industry
since the values for the Herfindahl index are generally below the threshold of 0.15. Therefore,
the industry embraces high competition with no dominant players. However, by observing the
trend of the HH index throughout the years, an increase would be noticed. Although the index
is still low and moderate concentration exists for the year 2009, competition has slightly
declined over time. Moreover, the concentration ratios for the 4 biggest companies indicate a
rise throughout the years, which could be due to the fall of competition. As mentioned before,
since the industry is favoring the undiversified companies and dominating the industry with
the highest number of firms (15) this high competition maybe the presence of these
undiversified companies.
Table 27: Concentration indices
Concentration Indices
2009 2008 2007 2006
Entropy Measure 2.472 2.752 2.950 2.944 Herfindahl Index 0.174 0.115 0.084 0.083 Relative Measure 0.053 0.059 0.063 0.063 CR4 0.662 0.551 0.458 0.464 In Table 28, the summary statistics of the machinery industry is presented with an
average operating revenue per employee of 1749.7 and net income per employee of 71.62.

Selen Gül The Effects of Integration Strategies on Firm Performance
50
The variables that have high volatility are the measures of net income per employee, capital
intensity, market share and the number of countries. According to the previous industry
descriptive statistics, all of the industries presented high volatility for the average net income
per employee, market share and number of countries. Since the operating revenue per
employee illustrated high volatility only in the manufacture of food industry, this performance
measure could be considered to be more representative and reliable compared to NIPE
(Appendix 10, Output 14-15).
Table 28: Descriptive statistics of machinery and equipment industry
As mentioned above, this industry has the highest performance measurement values
for the undiversified companies on average. This is supported by the correlation outputs
illustrated in Table 29. The operating revenue per employee value is positively correlated with
net income per employee, capital intensity,
market share, cost per employee, un-
diversification strategy and the number of
countries. The only difference for the net
operating per employee value is that; it is
positively correlated with the unrelated
diversification strategy as well. Since the level
of correlation with the unrelated
diversification (0.2385) is greater than the un-
diversification strategy (0.1458), the average
Table 29: Correlations net income per employee value is greater for the unrelated
diversification strategy (157.97) (Appendix 10, Output 16).
Variable Obs. Mean Std. Dev. Min. Max. ORPE 48 1749.71 1489.56 774.10 10297.62 NIPE 48 71.62 211.21 -243.94 1254.11 RISK 48 9.13 5.83 1.88 29.13 SIZE 48 0.20 0.05 0.12 0.39 CINT 48 421.30 475.98 50.79 2833.54 MARS 48 0.02 0.04 0.0002 0.26 CPE 48 387.96 83.05 110.56 617.50 RATIO 48 28.07 10.09 4.27 54.10 COUNTRY 48 2.69 3.40 0 18
Correlation ORPE NIPE ORPE 1.00 NIPE 0.32 1.00 RISK -0.08 -0.16 SIZE -0.23 -0.07 CINT 0.32 0.82 MARS 0.82 0.19 CPE 0.25 0.04 RATIO -0.65 -0.44 VI -0.10 -0.13 HI -0.26 -0.28 UR -0.09 0.24 UD 0.40 0.15 COUNTRY 0.10 0.13

Selen Gül The Effects of Integration Strategies on Firm Performance
51
7. INDUSTRY COMPARISONS
The analysis of the summary statistics of the 5 industries has given an insight on how
the industries could differ in terms of the strategies undertaken and their effects on corporate
performance. This section will aggregate the findings above, in order to designate the
differences by conducting a comparison among the industries (Appendix 11).
According to the number of firms in each industry, the dominant industries in the
sample are the manufacture of food products (37%) and the manufacture of machinery and
equipment industries (33%). Among the 5 industries, the food industry has the highest
average value of operating revenue per employee (3,701), which is followed by the chemicals
industry (3,095), pharmaceutical industry (1,948), machinery industry (1,749) and the
furniture industry (1,421). On the other hand, the pharmaceutical industry has the highest net
income per employee (496.13) on the average, which has a huge difference from the other
industries. However, recall that for all the industries the values of NIPE are highly volatile.
Moreover, the pharmaceutical industry preserves its leadership in having the highest average
values of number of countries the firms are operating in (17) and the market share (9.04%)
(Appendix 11, Graphs 1-5). In addition, the Appendix 11-Table 8 illustrates a summary of the
signs of positive and negative correlations between the performance measures and the
variables. According to this, almost all the industry average performance measures have a
positive correlation with the capital intensity, market share, cost per employee and horizontal
integration variables.
Since this study is differentiating the integration strategies for each of the industries
and analyzing the effects on performance measures, it is crucial to indicate which industry is
outperforming the others based on each strategy. Initially, the manufacture of food industry
preserves its highest value of operating revenue per employee in the vertical, horizontal and
unrelated integration strategies. This industry maybe more efficient in the sense of
coordinating, monitoring and enforcing the process of production more effectively and has
greater achievements from the scale, scope and learning economies from the perspectives of
vertical and horizontal integration (Sudarsanam, 2010). Moreover, the unrelated diversified
firms could be benefiting more from the reductions in transaction costs and the efficient use
of internal capital markets. On the other hand, the leader for the undiversified companies is
the highly concentrated manufacture of chemicals and chemical products industry. In
addition, from the perspective of net income per employee measure the manufacture of

Selen Gül The Effects of Integration Strategies on Firm Performance
52
pharmaceutical industry is having the highest values for vertical, horizontal, and unrelated
integration strategies, which indicates that compared to other firms under each type of
strategy the pharmaceutical industry can more efficiently utilize their employee resources in
order to generate profits for the company. However, recall that effective comparison of NIPE
should only be made between companies in similar industries (Money-Zine) and this analysis
with 11 companies may not be an effective representation for the whole pharmaceuticals
industry (Appendix 12).
In addition to these comparisons, it is worth to underline the differences of the average
concentration indices in order to have an overall understanding of the industries’ competition.
Although there is a huge difference of total average market shares between the pharmaceutical
industry and the remaining industries, the average concentration ratio of the 4 biggest players
in the markets do not present high variability among them. The highest CR4 is held by the
pharmaceutical industry (92%) and is followed by the chemicals industry (81%) the food
industry (69%), the furniture industry (64%) and the machinery industry (54%). This values
indicate the low competition in pharmaceuticals and chemicals industries were dominant
players have high market shares, whereas the decrease in this ratio indicates an increase in
competition and a reduction in market shares are observed. Moreover, based on the
Herfindahl index the chemicals industry is highly concentrated (0.4373), which indicates low
competition involving dominant players. This indication is also supported by the entropy
measure, which has the lowest value for the chemicals industry (1.1176). Since the entropy
measure is the inverse measure of HH index, it depicts that the lower values of this index will
reveal more certainty in the relationships of the firms with the buyers in the market (due to
lower competition). On the other side, the machinery industry’s HH index indicates a
competitive industry relative to the other industries, since it has the lowest value (0.1141).
Therefore, this industry has less dominant players compared to the others and the total market
shares of the first 4 companies (CR4) are the lowest. Finally, in order to make comparisons
among the industries, the entropy can be divided by the number of firms in the industry. In
that case, the food industry has the lowest value of RE (0.0397) and the pharmaceutical
industry has the highest (0.1353). This highlights that the firms in the food industry are
exposed to low competition (on a per company basis), while the pharmaceutical companies
are exposed to a high competitive environment (Appendix 13).
Finally, a general analysis of the whole sample can be demonstrated in order to
differentiate the highest performing strategies without taking the differences of industries into
account. Out of the 4 strategies, the horizontally integrated firms are attaining the highest

Selen Gül The Effects of Integration Strategies on Firm Performance
53
value for operating revenue per employee (3,444) and the unrelated companies with the net
income per employee (167) figures. Therefore the choice of integration strategy may be a
trade-off for the companies in the sense that different strategies may favor different effects on
performance outcomes. The highest market share is preserved by horizontally integrated
firms, and the number of countries that the firms operate in is greatly undertaken by the
unrelated diversifiers (Appendix 14).
8. EMPIRICAL FINDINGS AND THE DISCUSSION OF RESULTS
This section will introduce the findings of the regression models conducted separately
for the manufacture of food products and the manufacture of machinery and equipment
industries. The remaining industries do not have adequate number of companies to perform a
statistical analysis. The regression analysis will be based on the OLS regression model with
inclusion and exclusion of the interaction effects19. For each of the two industries the
dependent variables of operating revenue per employee (ORPE) and the net income per
employee (NIPE) performance measures will be used.
8.1.Manufacture of Food Industry
Table 30 summarizes the estimation of the non-interactive regression model for the
food products industry. Initially, the performance measure of operating revenue per employee
(ORPE) is taken as the dependent variable. For the hypotheses H1 and H3 (positive
moderating effect), the coefficients of VI and COUNTRY should be positive and significant,
and by H2 the coefficient of HI should be greater than UR’s and significant. This model
indicates that the vertical integration strategy has a negative effect on ORPE (-510.7), and is
not statistically significant at the 0.10 significance level. Therefore the hypothesis H1 is
rejected, in which the positive effect of vertical integration was to be tested. The dummy
variables of horizontal integration (HI) and unrelated diversification (UR) are statistically
significant at the 0.10 level, where the HI strategy is outperforming the UR diversification
strategy by 6408.24 units on the ORPE. Based on this analysis, the second hypothesis H2 is
not rejected. However, it is crucial to note that it cannot be determined whether this
significant and positive effect on performance leads firms to horizontally integrate or if
horizontal integration causes this high operating revenue per employee. Finally, the third
hypothesis H3 is tested if geographic diversification had a positive effect on firm performance.
The model indicates a positive coefficient for the variable COUNTRY, however statistically
19 Detailed explanation under section 4, Methodology.

Selen Gül The Effects of Integration Strategies on Firm Performance
54
insignificant. Therefore, H3 is rejected. The constant having a high significance is difficult to
interpret “but can be viewed roughly as a pure competitive equilibrium rate of return that
would be earned in the economist’s model of pure competition.” (Bettis, 1981, p. 388) In a
pure competitive industry the ‘economic profit’ in equilibrium would be zero, therefore here
the ‘economic profit’ can be taken as the minimum return necessary for a company to stay in
the business. Hence, the constant can be taken as the equilibrium profit for a purely
competitive firm, in an accounting sense. “The returns above this embodied in the other
coefficients indicate some degree of monopoly power.” (Bettis, 1981, p. 388). Moreover, the
other statistically significant variables are the size and the capital intensity (CINT). The size,
which is the natural logarithm of the average number of employees, has a significant and
positive effect on ORPE, meaning that a one unit increase in the natural logarithm of number
of employees will increase the operating revenue per employee by 31,113 DKK. The capital
intensity, which is the ratio of fixed assets to number of employees, depicts a significant
effect, in which a 10% increase of this ratio may increase the ORPE by 249. Finally, the entire
regression was highly significant based on the F-statistics, and R2 is 61% in which illustrates
the total variation of the sample Y-values that has been explained by the linear relationship
with the independent variables X (Appendix 15, Output 17).
Table 30: Manufacture of food products industry regression model (ORPE-dependent variable)
ORPE Coefficient Std. Err. T-statistic Significance (Constant) -9,084.94 3,480.5 -2.61 0.012* RISK -68.54 95.98 -0.71 0.479 SIZE 31,113.2 12,066.6 2.58 0.013* CINT 2.49 0.82 3.03 0.004* MARS -704.4 9796.3 -0.07 0.943 CPE 12.12 8.13 1.49 0.143 RATIO -83.71 64.60 -1.30 0.202 VI -510.8 1,867.3 -0.27 0.786 HI 3,025.9 1,372.9 2.20 0.033* UR -3,382.3 1,881.8 -1.80 0.079* COUNTRY 128.71 124.55 1.03 0.307 Number of Obs.= 54, F-statistics= 6.82 (significance= 0.000) R2= 0.61, adjusted R2= 0.52 *Significant at the 0.10 level.
Moreover, the model has been tested with the inclusion of the interaction terms, in
which it “was designed to investigate more fully the reasons for differences in performance
among different diversification strategies.” (Bettis, 1981, p. 384) This model is constructed
with the forward stepwise procedure, in which suitable subsets of independent variables are

Selen Gül The Effects of Integration Strategies on Firm Performance
55
chosen from the total regression model. In addition to this, the Appendix 16-Output 20
encloses the simple OLS regression model with the interaction effects; however since the
sample size is small with 48 companies, having 33 regression variables will be
misrepresentative of the estimations.
Table 31 presents the significant interaction terms of the final model. These
interaction terms can be interpreted as; the reasons of high performance for horizontally
integrated firms were the size of the firm (SIZE), and their capital intensity (CINT). The low
performance of the HI companies would be due to the cost per employee, which an increase
of this average would lead to a decline in operating revenue per employee. This negative
correlation is observed in the correlation matrix of the food industry in Appendix 7, where all
the integration strategies apart from the unrelated diversification have negative correlations
with the cost per employee measure. Therefore the significant and positive effect of CPE
(14.42) could be due to this correlation with the unrelated diversification strategy, although
this model does not represent UR as significant. Moreover, the cost of employee to operating
revenue ratio (RATIO) has a negative significant effect on performance. This could be
expected since the correlation matrix is depicting a negative relationship between the RATIO
and ORPE, and an increase in RATIO will indicate that the costs are greater than the
revenues. The F-statistic for the entire regression is highly significant, with a R2 value of 90%
(Appendix 16, Output 19).
Table 31: Interactive regression model (ORPE) for manufacture of food products industry ORPE Coefficient Std. Err. T-statistic Significance (Constant) 189.74 1,209.9 0.16 0.876 (CINT)(HI) 7.85 0.75 10.42 0.000* (CPE)(HI) -36.54 7.22 -5.06 0.000* (SIZE)(HI) 44,390.4 15,424.4 2.88 0.006* RATIO -151.05 25.68 -5.88 0.000* CPE 14.42 2.81 5.12 0.000* Number of Obs.= 54, F-statistics= 88.34 (significance= 0.000) R2= 0.90, adjusted R2= 0.89 *Significant at the 0.10 level. In terms of average net operating income per employee (NIPE) as the dependent
variable, Table 32 presents the non-interactive regression model. Here, the only significant
values to be observed are the constant and the size. The decrease in the number of significant
variables could be due to the reason that operating revenue per employee is more reliable and
explanatory as a performance measurement compared to the net income per employee value.

Selen Gül The Effects of Integration Strategies on Firm Performance
56
Therefore, all the three hypotheses are rejected since the variables are not statistically
significant, although the coefficients have a positive value for VI, HI, UR and COUNTRY.
Moreover the horizontal integration strategy has a higher coefficient compared to the
unrelated diversification strategy. The entire regression is significant based on the F-
statistics, however the R2 is lower compared to the previous model (35%) (Appendix 15,
Output 18).
Table 32: Manufacture of food products industry regression model (NIPE-dependent
variable)
NIPE Coefficient Std. Err. T-statistic Significance (Constant) -390.66 135.38 -2.89 0.006* RISK 2.82 3.73 0.76 0.454 SIZE 819.82 469.36 1.75 0.088* CINT 0.02 0.03 0.73 0.472 MARS 217.24 381.05 0.57 0.572 CPE 0.38 0.32 1.19 0.239 RATIO 3.59 2.51 1.43 0.160 VI 9.42 72.63 0.13 0.897 HI 72.07 53.40 1.35 0.184 UR 53.50 73.20 0.73 0.469 COUNTRY 0.31 4.84 0.06 0.949 Number of Obs.= 54, F-statistics= 2.36 (significance= 0.0250) R2= 0.35, adjusted R2= 0.20 *Significant at the 0.10 level.
Table 33 demonstrates the forward stepwise interactive regression model. Compared
to the simple OLS regression presented above, this model has specified more significant
variables by adding and removing the variables based on their significance level. Here, the
high performance of the unrelated diversified firms is dependent upon their capital intensity
(CINT), cost of employee to operating revenue ratio (RATIO) and their market share
(MARS). The firms may be keen on diversifying into unrelated areas when their fixed assets,
costs and market shares are high or initially being UR diversified may be the outcome of these
positive interaction affects. The causality of the impacts cannot be determined strictly. For
horizontally integrated companies, their low performance will be due to an increase in the
variable RATIO. Moreover, the low performance of an increase in the number of countries
(increasing geographic diversification) may depend on the effect of capital intensity (CINT).
Compared to other industries such as oil production, telecommunications etc., the food
industry could be considered as having a low capital intensity. Based on this determination, an
increase in the number of countries may increase the number of employees being hired more
than the need of capital, which overall decreases capital intensity. Besides the effects of the

Selen Gül The Effects of Integration Strategies on Firm Performance
57
interactive variables, this model underlines the significance of unrelated and horizontally
diversified variables. Here, horizontal integration is outperforming the unrelated diversified
companies by having a large and positive effect on the net income per employee performance
measure (287.11> (-702.44)). This significance is supporting the hypothesis H2. The model is
significant with a high value of F-statistics and an R2 of 69%, lower than the interactive
model for ORPE (Appendix 16, Output 21).
Table 33: Interactive regression model (NIPE) for manufacture of food products
industry
NIPE Coefficient Std. Err. T-statistic Significance (Constant) 56.03 21.16 2.65 0.011* UR -702.44 120.82 -5.81 0.000* HI 287.11 69.66 4.12 0.000* (CINT)(UR) 0.20 0.04 5.75 0.000* (RATIO)(HI) -16.37 4.03 -4.07 0.000* (CINT)(COUNTRY) -0.007 0.003 -2.36 0.023* (RATIO)(UR) 24.79 3.13 7.92 0.000* (MARS)(UR) 2,585.81 1,490.91 1.73 0.090* Number of Obs.= 54, F-statistics= 14.69 (significance= 0.0250) R2= 0.69, adjusted R2= 0.64 *Significant at the 0.10 level.
8.2.Manufacture of Machinery and Equipment Industry
The second industry, the manufacture of machinery and equipment is illustrated in the
non-interactive regression model in Table 34. The average operating revenue per employee
(ORPE) is taken as the dependent variable initially, and based on the output the size (SIZE),
market share (MARS), cost per employee (CPE), the ratio of cost of employee to operating
revenue (RATIO) and the horizontal integration (HI) variables are statistically significant at
the 0.10 level. The variables of size have been significant and positive for both the food and
the machinery industry. Among the significant variables, the market share (MARS) stands out
with its high positive significance (t-value, 10.84) and this is supported by the high correlation
with the dependent variable ORPE (0.53). The reason of this significance could be due to the
high competition within the industry (average HH index, 0.1141), where increasing a
company’s share in the market may result in an effective increase in performance. The model
statistically indicates that a 1% increase in market share will lead an increase of 25,497 DKK
in operating revenue per employee. In addition, H1 and H2 are rejected, since the vertical
integration (VI) and the COUNTRY variables are not statistically significant, although they
embrace a positive coefficient. On the other side, the horizontal integration strategy is
statistically significant at the 0.10 level with a greater coefficient than the unrelated

Selen Gül The Effects of Integration Strategies on Firm Performance
58
diversification strategy. However, the UR variable is statistically insignificant. To sum up,
this model is highly significant with a high value of F-statistics and with a 90% value of R2
(Appendix 17, Output 22).
Table 34: Manufacture of machinery and equipment industry regression model (ORPE
dependent variable)
ORPE Coefficient Std. Err. T-statistic Significance (Constant) -181.74 538.06 -0.34 0.737 RISK -3.45 16.83 -0.21 0.839 SIZE 6,992.5 1,949.1 3.59 0.001* CINT -0.27 0.21 -1.31 0.195 MARS 25,497.6 2,353.2 10.84 0.000* CPE 5.85 1.07 5.49 0.000* RATIO -82.14 11.90 -6.90 0.000* VI 190.43 252.60 0.75 0.456 HI 510.76 291.89 1.75 0.088* UR 216.24 254.75 0.85 0.401 COUNTRY 9.91 31.66 0.31 0.756 Number of Obs.= 48, F-statistics= 32.07 (significance= 0.000) R2= 0.90, adjusted R2= 0.87 *Significant at the 0.10 level.
The same model is tested with the inclusion of the interaction terms and the significant
variables are presented in Table 35, which are the outputs of the forward stepwise regression
model. The cost per employee (CPE), the cost of employee to operating revenue ratio
(RATIO), and the size (SIZE) are statistically significant and positive as the previous model
presented above. The number of countries has an interactive positive effect with the market
share and a negative effect with the capital intensity. It can be interpreted as the high
performance of geographically diversified companies can be due to high market shares and
the low performance would be attributable to capital intensity. And finally, the horizontal
integration strategy’s high performance depends on the cost per employee, however with a
relatively lower significance (0.087) compared to other variables significance levels (0.000).
This model is highly significant with an F-statistics of 75.13 and a R2 of 92% (Appendix 18,
Output 24).
Table 35: Interactive regression model (ORPE) for manufacture of machinery and
equipment industry regression model
ORPE Coefficient Std. Err. T-statistic Significance (Constant) 713.72 419.07 1.70 0.096* (MARS)(COUNTRY) 4,437.4 338.46 13.11 0.000* RATIO 82.99 9.68 -8.58 0.000* CPE 5.84 0.87 6.73 0.000* SIZE 4,153.1 1,435.4 2.89 0.006*

Selen Gül The Effects of Integration Strategies on Firm Performance
59
(CPE)(HI) 0.94 0.54 1.75 0.087* (CINT)(COUNTRY) -0.09 0.02 4.89 0.000* Number of Obs.= 48, F-statistics= 75.13 (significance= 0.000) R2= 0.92, adjusted R2= 0.90 *Significant at the 0.10 level. Finally, the average net income per employee (NIPE) performance measure is taken as
the dependent variable in estimating the regression model of the machinery industry. In Table
36, the significant values that are observed to be are the capital intensity (CINT) and the
vertical integration strategy (VI). However the vertical integration strategy (-89.9) has a
negative impact on the firms’ performance in terms of NIPE, which is not supporting the first
hypothesis H1. This negative impact could be due to the decreases of the net income figures of
the companies over the 5 year period20. Moreover, the downsides of vertical integration could
be another reason for the negative effect which are the opportunism due to interdivisional
rivalry and the increase in influence costs (Sudarsanam, 2010), whereas the significance could
be due to having greater experience in a specific type of technology (Leiblein & Miller, 2003)
since machinery and equipments industry is based on more technological know-how
compared to the food industry. The remaining hypotheses are not supported as well, since the
HI, UR and COUNTRY variables are not significant and apart from the unrelated diversified
strategy, their coefficients are negative. And, this last non-interactive regression model has
high significance in terms of its F-statistics and a high value of R2 which is 76% (Appendix
17, Output 23).
Table 36: Manufacture of machinery and equipment industry regression model (NIPE-
dependent variable)
NIPE Coefficient Std. Err. T-statistic Significance (Constant) 73.15 112.42 0.65 0.519 RISK -2.93 3.52 -0.83 0.410 SIZE 468.45 407.24 1.15 0.257 CINT 0.37 0.04 8.59 0.000* MARS -305.96 491.66 -0.62 0.538 CPE -0.24 0.22 -1.08 0.288 RATIO -2.55 2.49 -1.03 0.311 VI -89.90 52.78 -1.70 0.097* HI -50.38 60.99 -0.83 0.414 UR 18.19 53.23 0.34 0.734 COUNTRY -9.55 6.61 -1.44 0.157 Number of Obs.= 48, F-statistics= 12.78 (significance= 0.000) R2= 0.76, adjusted R2= 0.71 *Significant at the 0.10 level.
20 In general vertically integrated companies have reported negative net income values in the last years, while number of employees were not highly volatile and somewhat stable.

Selen Gül The Effects of Integration Strategies on Firm Performance
60
The last interactive regression model is illustrated in Table 37, where the output is
obtained by regressing the net income per employee performance measure to its individual
variables and interactive terms. Based on the outcome, the capital intensity, ratio, and the
constant are statistically significant at the 0.10 level. The reasons of the high performance of
the unrelated diversified firms are the capital intensity and the market share. Moreover, the
performance of the horizontally integrated companies is dependent significantly upon the
market share that the firm holds. Therefore, this model is consistent with the ORPE regression
models presented above, in the sense that the machinery industry gives more emphasis on the
market share due to being a competitive industry. As in the previous interactive regression
models, this model has a significant value of F-statistic, with an R2 of 84% (Appendix 18,
Output 26).
Table 37: Interactive regression model (NIPE) for manufacture of machinery and
equipment industry
NIPE Coefficient Std. Err. T-statistic Significance (Constant) 145.22 52.82 2.75 0.009* CINT 0.13 0.05 2.71 0.010* (CINT)(UR) 0.29 0.05 5.50 0.000* RATIO -5.04 1.46 -3.45 0.001* (MARS)(UR) -7,295.8 2,730.5 -2.67 0.011* (MARS)(HI) -7,234 3,690.6 -1.96 0.057* Number of Obs.= 48, F-statistics= 42.99 (significance= 0.000) R2= 0.84, adjusted R2= 0.82 *Significant at the 0.10 level.
8.3.Discussion of Results
The empirical outcomes illustrate that the effects of the variables on the performance
measurements are varying based on the type of industry. These differences “are related to the
firm’s environment, and specifically to the characteristics of the markets in which they
participate.” (Montgomery & Christensen, 1981, p. 328) Initially, in order to see the
similarities of the regression models’ outcomes between the two industries, the same
significant non-interactive and interactive terms are highlighted.
• Non-interactive model
o ORPE as dependent variable: Horizontal integration (HI) and the firm size
(SIZE)
o NIPE as dependent variable: None
• Interactive model

Selen Gül The Effects of Integration Strategies on Firm Performance
61
o ORPE as dependent variable: (Cost per employee)(Horizontal integration),
cost per employee and cost of employee to operating revenue ratio
o NIPE as dependent variable: (Capital intensity)(Unrelated diversification) and
(Market share)(Unrelated diversification)
From the perspective of the operating revenue per employee, the positive and
significant integration strategy for the two industries is horizontal integration, in which it is
outperforming the unrelated diversification strategy. This result is consistent with the findings
of Rumelt (1982), Bettis (1981) who indicate that the related diversified companies are
outperforming the unrelated diversified firms in terms of corporate performance. In the non-
interactive model, the two industries did not have a common variable that has been significant
at the 0.10 level for the net income per employee performance measure. This could highlight
that operating revenue per employee is more explanatory and relevant in explaining the
relations with integration strategies and the control variables. In addition, in the interactive
regression models, the interactions with the horizontal and un-diversification strategies were
capturing more significance for the two industries and in general the control variables of cost
per employee, capital intensity, and the firms’ size were of major interest in explaining the
corporate performance.
Besides these significant variables, it is crucial to note that the findings do not
underline significant effects for the vertical integration (VI) and geographical diversification
(COUNTRY) strategies. Previous findings indicated that vertical integration occurred when
the investment involved high specificity in knowledge, assets and know-how (Monteverde &
Teece, 1982). A rise of complexity and specialization of the inputs would increase the
probability to vertically integrate (Masten, 1984). According to these classifications, the
inputs that the firms’ are internalizing may not be specific and critical enough to capture a
significant impact on the performance measures. The only significant and negative effect of
vertical integration has been observed on the net income per employee measure, which was
for the manufacture of machinery and equipment industry. On the other side, the reason of the
inability to capture a significant effect could be due to the small sample size. For instance, the
number of vertically integrated companies is 6 and 11 for manufacture of food and machinery
industries respectively.

Selen Gül The Effects of Integration Strategies on Firm Performance
62
Based on the summary statistics presented above, these two industries’ average
performances could be analyzed more in detail, in accordance with the empirical results.21
The manufacture of machinery and equipment industry has the highest average operating
revenue per employee figure for undiversified companies (2,619). Since it is an un-
concentrated industry with no or few dominant players, the presence of many undiversified
companies is reasonable. Moreover, when the size (natural log of number of employees) of
the undiversified firms was compared to the remaining companies within the industry, they
were smaller. This may support the findings of Nathanson & Cassano (1982) which indicated
that smaller firms were performing better compared to larger firms in the categories of no
diversification or extremely high diversification. Moreover, the food industry has the highest
operating revenue per employee (5,016) and market share (0.04) for its horizontally integrated
companies, within a highly concentrated market. The related diversifiers “appear to be more
profitable in part because they operated in very profitable, highly concentrated markets, and
were able to acquire large shares in those markets.” (Montgomery & Christensen, 1981, p.
339) The ownership of sufficient level of skills and resources are crucial in these high
opportunity markets in explaining the companies’ above-average market shares, due to
expanding into related areas. Therefore, the combination of the market opportunity and the
ability to take advantage of that opportunity leads to successful performance outcomes
(Montgomery & Christensen, 1981).
In addition to operating revenue per employee measures, the net income per employee
values indicate the highest values to be attributed to the unrelated diversified firms for both of
the industries. Since net income (in its general form) is the revenues minus expenses, the
unrelated firms may have the ability to cover their costs more efficiently, by creating value by
maintaining an effective performance compared to the external capital markets. This
efficiency can lead the diversified companies to realize economies of scope, reduce risks and
uncertainty, and reduce transaction costs with the means of internal capital markets. However,
the profitability of the primary business has an important role on the decision to diversify
(Lipczynski et al., 2005). “A conglomerate that reallocates capital from a less profitable core
activity to a more profitable non-core activity contributes to an improvement in the efficiency
of capital allocation.” (p. 577)
21 Recall that these two industries have a sample size greater than the remaining industries, indicating a more accurate comparison.

Selen Gül The Effects of Integration Strategies on Firm Performance
63
9. CONCLUSION
Both the summary statistics and the empirical results tried to underline the differences
between the 5 industries, in terms of the companies’ choices of integration strategies and the
effects on their corporate performance. According to the descriptive statistics, the choice and
the dominance of strategies are varying based on the industry that the firms are operating in.
The manufacture of food products industry is favoring the vertical, horizontal and unrelated
integration strategies in terms of average operating revenue per employee performance
measure. This outperformance could suggest that the food industry is encouraging the
vertically integrated firms in having the efficiencies of coordinating, monitoring and the
enforcement in the process of production (Sudarsanam, 2010). Moreover, the companies in
this sector could be reaching the efficiencies of scale, scope and learning economies more
favorably for horizontally integrating. Within this industry, the horizontally integrated firms
are outperforming the unrelated diversified companies; however the reason of having the
highest ORPE out of the remaining industries for this type of diversification could be the
effective reductions of transaction costs and making efficient use of internal capital markets.
On the other hand, the undiversified companies in the highly concentrated manufacture of
chemicals industry have on average highest value of ORPE performance. Apart from the
chemicals, food and pharmaceuticals industry; the manufacture of machinery and furniture
industries are subject to higher competition and lower values of performance measures are
observed for the integration strategies chosen.
The general empirical evidence suggested that high levels of asset specificity and
know-how may lead the firms to vertically integrate (Monteverde & Teece, 1982) in order to
prevent the hold-up problem and extensive quasi-rents (Grossman & Hart, 1986; Williamson,
1971). However, the manufacture of food and the manufacture of machinery and equipment
industries did not underline a significant positive effect of vertical integration strategy, which
could be due to not having critical relation-specific assets that would significantly affect the
performance of the companies. On the other side, both of the industries have illustrated high
significant positive effect for the horizontal integration strategy, which has been consistent
with the findings of Rumelt (1982), Bettis (1981), and Montgomery (1994). However, based
on the differences of market structures the effects of horizontal integration is not the same, in
which higher significance is observed for the food industry. Finally, the empirical evidence on
the effect of geographic diversification generally indicated a positive relationship between the
Selen Gül The Effects of Integration Strategies on Firm Performance
64
geographic scope and firm’s performance (Delios & Beamish, 1999; Lepetit et al., 2004;
Ravichandran, 2009). This study could not observe any significant outcomes for the number
of countries that the firms are operating in, although the coefficients were positive for the
ORPE measure.
Therefore, the effects of the strategy of vertical integration and geographic
diversification could not reach a specific conclusion, which may be attributed to the limited
observation sample used in the study. The main reason has been the difficulty of finding
applicable values for the variables used in the analysis. Future studies could increase the
number of industries with different measures of profitability and diversification strategies and
the inclusion of more control variables such as R&D intensity and advertising. “As the
separate research traditions that study corporate economic performance become integrated,
both research and managerial practice will be enriched.” (Montgomery & Christensen, 1981,
p. 340)

Selen Gül The Effects of Integration Strategies on Firm Performance
65
REFERENCES
Articles
Baker, George; Gibbons, Robert & Murphy, Kevin J. (2002). Relational Contracts and the
Theory of the Firm. In: Quarterly Journal of Economics. Vol. 117, Iss. 1, p. 39-84.
Bettis, Richard A. (1981). Performance Differences in Related and Unrelated Diversified
Firms. In.: Strategic Management Journal. Vol. 2, Iss. 4, p. 379-393.
Bettis, Richard A. & Hall, William.K. (1982). Diversification Strategy, Accounting
Determined Risk and Accounting Determined Return. In: Academy of Management Journal.
Vol, 25, Iss. 2, p. 254-264.
Capar, Nejat. (2009). An Analysis of the Relationship Between International Diversification,
Product Diversification, Firm Resources and Performance. In: Academy of Management
Annual Meeting Proceedings. P. 1-6.
Capon, N.; Hulbert, J. M.; Farley, J.U.; Martin, L.E. (1988). Corporate Diversity and
Economic Performance: The Impact of Market Specialization. In: Strategic Management
Journal, Vol. 9, Iss. 1, p. 61-74.
Chakravarty, Satya R. (1998). Efficient Horizontal Mergers. In: Journal of Economic Theory.
Vol. 82, Iss. 1, p. 277-289.
Chang, Shao-Chi & Wang, Chi-Feng. (2007). The Effect of Product Diversification Strategies
on the Relationship Between International Diversification and Firm Performance. In: Journal
of World Business. Vol. 42, Iss. 1, p. 61-79.
Coase, R. H. (1937). The Nature of the Firm. In: Economica. Vol. 4, Iss. 16, p. 386-405.
Colangelo, Giuseppe. (1995). Vertical vs. Horizontal Integration: Pre-emptive Merging. In:
The Journal of Industrial Economics. Vol. 43, Iss. 3, p. 323-337.
Delios, Andrew & Beamish, Paul W. (1999). Geographic Scope, Product Diversification and
the Corporate Performance of Japanese Firms. In: Strategic Management Journal. Vol. 20, Iss.
8, p. 711-727.
Denis, David J.; Denis, Diane K. & Yost, Keven. (2002). Global Diversification, Industrial
Diversification, and Firm Value. In: The Journal of Finance. Vol. 57, Iss. 5, p. 1951-1979.
Selen Gül The Effects of Integration Strategies on Firm Performance
66
Fan, Joseph P.H., & Goyal, Vidk an K. (2006). On the Patterns and Wealth Effects of
Vertical Mergers. In: Journal of Business. Vol. 79, Iss. 2, p. 877-902.
Fisher, N. & Hall, G.R. (1969). Risk and Corporate Rates of Return. In: Quarterly Journal of
Economics. Vol. 83, Iss. 1, p. 79-92.
Geringer, Michael J.; Tallman, Stephen & Olsen, David M. (2000). Product and International
Diversification among Japanese Multinational Firms. In: Strategic Management Journal. Vol.
21, Iss. 1, p. 51-80.
Grossman, Sanford J. & Hart, Oliver D. (1986). The Costs and Benefits of Ownership: A
Theory of Vertical and Lateral Integration. In: Journal of Political Economy. Vol. 94, Iss. 4, p.
691-719.
Hitt, Micheal A.; Hoskisson, Robert E. & Kim, Hicheon. (1997). International
Diversification: Effects on Innovation and Firm Performance in Product-Diversified Firms.
In: Academy of Management Journal. Vol. 40, Iss. 4, p. 767-798.
Hubbard, Thomas N. (2008). Viewpoint: Empirical Research on Firms’ Boundaries. In:
Canadian Journal of Economics. Vol. 41, Iss. 2, p. 341-359.
Hsiao, Cheng. (2005). Why Panel Data? In: Singapore Economic Review. Vol. 50, Iss. 2, p.
143-154.
Jacquemin, Alexis P. & Berry, Charles H. (1979). Entropy Measure of Diversification and
Corporate Growth. In: The Journal of Industrial Economics. Vol. 27, Iss. 4, p. 359-369.
Joskow, Paul, L. (1985). Vertical Integration and Long Term Contracts: The Case of Coal-
burning Electric Generating Plants. In: Journal of law, Economics & Organization. Vol. 1, Iss.
1, p. 33-81.
Kahloul, Ines & Hallara, Slaheddine. (2010). The Impact of Diversification on Firm
Performance and Risk: An Empirical Evidence. In: International Research Journal of Finance
and Economics. Iss. 35, p. 150-162.
Kim, Young Sang & Mathur, Ike. (2008). The Impact of Geographic Diversification on Firm
Performance. In: International Review of Financial Analysis. Vol. 17, Iss. 4, p. 747-766.

Selen Gül The Effects of Integration Strategies on Firm Performance
67
Kim, Jongwook & Mahoney, Joseph T. (2005). Property Rights Theory, Transaction Cost
Theory, and Agency Theory: an Organizational Economics Approach to Strategic
Management. In: Managerial and Decision Economics. Vol 26. Iss. 4, p. 223-242.
Kiker, Scott D. & Banning, Kevin C. (2008). How Important is Diversification? A Meta-
Analytic Review of the Diversification/Firm Performance Relationship. In: Southern Business
& Economic Journal. Vol. 31, Iss. 1/2, p. 19-26.
Kumar, Krishna B.; Rajan, Raghuram G.; Zingales, Luigi. (1999). What Determines Firm
Size? In: Working Papers-Yale School of Management’s Economic Research Network, p. 1-
54.
Lafontaine, Francine & Slade, Margaret. (2007). Vertical Integration and Firm Boundaries:
The Evidence. In: Journal of Economic Literature. Vol. 45, Iss. 3, p. 629-685.
Lang, Larry H. P. & Stulz, Rene M. (1994). Tobin’s q, Corporate Diversification, and Firm
Performance. In: Journal of Political Economy. Vol. 102, Iss. 6, p. 1248-1279.
Lecraw, Donald J. (1984). Diversification strategy and Performance. In: Journal of Industrial
Economics. Vol. 33, Iss. 2, p. 179-198.
Leiblein, Michael J. & Miller, Douglas J. (2003). An Empirical Examination of Transaction
and Firm-Level Influences on the Vertical Boundaries of the Firm. In: Strategic Management
Journal. Vol. 24, Iss. 9, p. 839-859.
Lepetit, Laetitia; Patry, Stephanie & Rous, Philippe. (2004). Diversification versus
Specialization: An event study of M&A’s in the European banking industry. In: Applied
Financial Economics. Vol. 14, Iss. 9, p. 663-669.
Lindsey, Matthew D. & Neeley, Concha R. (2010). Building Learning Curve and Script
Theory Knowledge with Lego. In: Marketing Education Review. Vol. 20, Iss. 1, p. 71-75.
McGahan, Anita M. & Porter, Micheal E. (1997). How Much Does Industry Matter, Really?
In: Strategic Management Journal. Vol. 8, p. 15-30.
Matraves, Catherine & Rondi, Laura. (2007). Product Differentiation, Industry Concentration
and Market Share Turbulunce. In: International Journal of the Economics of Business. Vol.
14, Iss. 1, p. 37-57.

Selen Gül The Effects of Integration Strategies on Firm Performance
68
Masten, Scott, E. (1984). The Organization of Production: Evidence from the Aerospace
Industry. In: Journal of Law and Economics. Vol. 27, Iss. 2, p. 403-418.
Miller, D.J. (2006). Technological Diversity, Related Diversification, and Performance. In:
Strategic Management Journal. Vol. 27, Iss. 7, p. 601-619.
Montgomery, Cynthia A. (1994). Corporate Diversification. In: Journal of Economic
Perspectives. Vol. 8, Iss. 3, p. 163-178.
Montgomery, Cynthia A. & Wernerfelt, Birger. (1988). Diversification, Ricardian Rents, and
Tobin’s q. In: Journal of Economics. Vol. 19, p 623-632.
Montgomery, Cynthia A. & Christensen, Kurt H. (1981). Corporate Economic Performance:
Diversification Strategy Versus Market Structure. In: Strategic Management Journal. Vol. 2,
Iss. 4, p. 327-343.
Monteverde, Kirk & Teece, David J. (1982). Supplier Switching Costs and Vertical
Integration in the Automobile Industry. In: Bell Journal of Economics. Vol. 13, Iss, 1, p. 206-
213.
Nathanson, Daniel & Cassano, James. (1982). Organization, diversity and Performance. In:
Wharton Magazine, p. 19-26.
Panzar, John C. & Willig, Robert D. (1981). Economies of Scope. In: American Economic
Review. Vol. 71, Iss. 2, p. 268-272.
Porter, Michael E. (1976). Please Note Location of Nearest Exit: Exit Barriers and Planning.
In: California Management Review. Vol. 19, Iss. 2, p. 21-33.
Prahalad, C. K. & Bettis, Richard A. (1986). The Dominant Logic: A New Linkage Between
Diversity and Performance. In: Strategic Management Journal. Vol. 7, Iss. 6, p. 485-501.
Ravichandran, T.; Liu, Yu; Han, Shu & Hasan, Iftekhar. (2009). Diversification and Firm
Performance: Exploring the Moderating Effects of Information Technology Spending. In:
Journal of Management Information Systems. Vol. 25, Iss. 4, p. 205-240.
Rumelt, Richard P. (1982). Diversification Strategy and Profitability. In: Strategic
Management Journal. Vol. 3, Iss. 4, p. 359-369.

Selen Gül The Effects of Integration Strategies on Firm Performance
69
Santalo, Juan & Becerra, Manuel. (2008). Competition from Specialized Firms and the
Diversification-Performance Linkage. In: The Journal of Finance. Vol. 63, Iss. 2, p. 851-883.
Schoar, Antoinette. (2002). Effects of Corporate Diversification on Productivity. In: The
Journal of Finance. Vol. 57, Iss. 6, p. 2379-2403.
Walker, Gordon & Weber, David. (1984). A Transaction Cost Approach to Make-or-Buy
Decisions. In: Administrative Science Quarterly. Vol. 29, Iss. 3, p. 373-391.
Weiss, L.W. (1963). Factors in Changing Concentration. In: Review of Economics and
Statistics. Vol. 45, p. 70-77.
Wiersema, Margarethe F. & Bowen, Harry P. (2008). Corporate Diversification: The Impact
of Foreign Competition, Industry Globalization, and Product Diversification. In: Strategic
Management Journal. Vol. 29. Iss. 2, p. 115-132.
Williamson, Oliver E. (1971). The Vertical Integration of Production: Market Failure
Considerations. In: American Economic Review. Vol. 61, Iss. 2, p. 112-123.
Books
Agresti, Alan & Finlay, Barbara. (1997). Statistical Methods for the Social Sciences. 3rd
Edition. Prentice Hall.
Bain, J.S. (1959). Industrial Organization. Publisher: New York, John Wiley.
Besanko, David; Dranove, David; Shanley, Mark & Schaefer, Scott. (2007). Economics of
Strategy. 4th Edition. p. 75-186.
Cosh, A.; Hughes, A. & Singh, A. (1980). The Determinants and Effects of Mergers: an
International Comparison. Cambridge, MA: Oelgeschlager, Gun & Hanin.
Harnett, Donald L. & Soni, Ashok K. (1991). Statistical Methods for Business and
Economics. 4th Edition, Publisher: Addison-Wesley Publishing Company
Johnson, Gerry; Scholes, Kevan & Whittington, Richard. (2008). Exploring Corporate
Strategy: Text & Cases. 8th Edition. Prentice Hall.
Lichtenberg, Frank R. (1992). Corporate Takeovers and Productivity. Publisher: Cambridge,
MIT Press.
Selen Gül The Effects of Integration Strategies on Firm Performance
70
Lipczynski, John; Wilson, John & Goddard, John. (2005). Industrial Organization:
Competition, Strategy, Policy. 2nd Edition. Publisher: Pearson Education, p. 210-619.
Lipczynski, John & Wilson, John. (2001). Industrial Organization: An Analysis of
Competitive Markets. 1st Edition. Publisher: Pearson Education, p. 103-133.
Marris, R. (1964). The Economic Theory of Managerial Capitalism. Publisher: London,
Macmillan (1920).
Meeks, G. (1977). Disappointing Marriage: A Study of the Gains from Merger. Publisher:
Cambridge University Press.
Penrose, E. (1995). The Theory of the Growth of the Firm. 3rd Edition . Publisher: Oxford,
Oxford University Press.
Ravenscraft, D.J. & Scherer, F. (1987). Mergers, Sell Offs and Economic Efficiency.
Publisher: Washington, DC, The Brookings Institution.
Rondi, L.; Sembenelli, A. & Ragazzi, E. (1996). Determinants of diversification patterns, in
Davies, S. and Lyons, B. (eds) Industrial Organization in the European Union. Publisher:
Oxford, Oxford University Press, Ch. 10.
Rumelt, Richard P. (1974). Strategy, Structure, and Economic Performance. Division of
Research, Graduate School of Business Administration, Harvard University.
Silverman, Brian S. (2002). Technological Resources & the Logic of Corporate
Diversification. Publisher: London, New York. E-book.
Sudarsanam, Sudi. (2010). Creating Value from Mergers and Acquisitions: The Challenges.
2nd Edition. p. 124-216.
Williamson, Oliver E. (1975). Markets and Hierarchies. Publisher: New York, Free Press.
Web Sites
Engineering Statistics Handbook, “Measures of Skewness and Kurtosis”,
http://www.itl.nist.gov/div898/handbook/eda/section3/eda35b.htm, Retrieved: 5 June 2011.
Horizontal Merger Guidelines. (2010). U.S. Department of Justice and the Federal Trade
Commission, http://www.justice.gov/atr/public/guidelines/hmg-2010.html part 5.3

Selen Gül The Effects of Integration Strategies on Firm Performance
71
Investopedia (2011), “Operating Performance Ratios”
http://www.investopedia.com/university/ratios/operating-performance/ratio2.asp, Retrieved: 5
June 2011
Investopedia (2011), “Market Share”, http://www.investopedia.com/terms/m/marketshare.asp,
Retrieved: 5 June 2011
InvestorWords: Glossary, “Total Cost”, http://www.investorwords.com/5006/total_cost.html,
Retrieved : 5 June 2011
Money-Zine, “Income per Employee”, http://www.money-zine.com/Definitions/Investing-
Dictionary/Income-per-Employee/, Retrieved: 5 June 2011
VentureLine: Accounting Dictionary, “Proprietary Asset Definition”
http://www.ventureline.com/accounting-glossary/P/proprietary-asset-definition/, Retrieved: 5
June 2011
Wikipedia: The Free Encyclopedia, “Cross-Sectional Data”, Wikipedia Foundation,
http://en.wikipedia.org/wiki/Cross-sectional_data, Retrieved: 6 June 2011
Wikipedia: The Free Encyclopedia, “Concentration Ratio”, Wikipedia Foundation,
http://en.wikipedia.org/wiki/Concentration_ratio#cite_note-amos-0, Retrieved: 7 June 2011

Selen Gül The Effects of Integration Strategies on Firm Performance
72
List of Appendices
Appendix 1. Orbis snapshot and the search strategy .......................................................... 72
Appendix 2. List of companies based on industries .......................................................... 73
Appendix 3. The IO table from statbank.dk for the food industry ..................................... 76
Appendix 4. A representation on how the industries have been identified ....................... 81
Appendix 5. The ROA value for Novo Nordisk A/S through 2005-2009 ......................... 82
Appendix 6. The summary statistics for the manufacture of basic pharmaceuticals and
pharmaceutical preparations industry ................................................................................. 83
Appendix 7. The summary statistics for the manufacture of food products ind. ............... 87
Appendix 8. The summary statistics of the manufacture of chemicals and chemical products
industry ............................................................................................................................... 91
Appendix 9. The summary statistics for the manufacture of furniture industry ................ 95
Appendix 10. The summary statistics of the manufacture of machinery and equipment
industry ............................................................................................................................... 98
Appendix 11. Industry comparisons of the 5 industries .................................................... 102
Appendix 12. Differentiating the integration strategies for the whole sample ................. 107
Appendix 13. Concentration indices .................................................................................. 109
Appendix 14. Integration strategy comparison for the whole data .................................... 111
Appendix 15. Stata outputs for the manufacture of food industry by simple OLS ........... 113
Appendix 16. Stata output for the manufacture of food products industry by forward stepwise
regression with interactive terms ........................................................................................ 114
Appendix 17. Stata outputs for the manufacture of machinery and equipment industry by
simple OLS ......................................................................................................................... 118
Appendix 18. Stata output for the manufacture of machinery and equipment industry by
forward stepwise regression with interactive terms ........................................................... 119
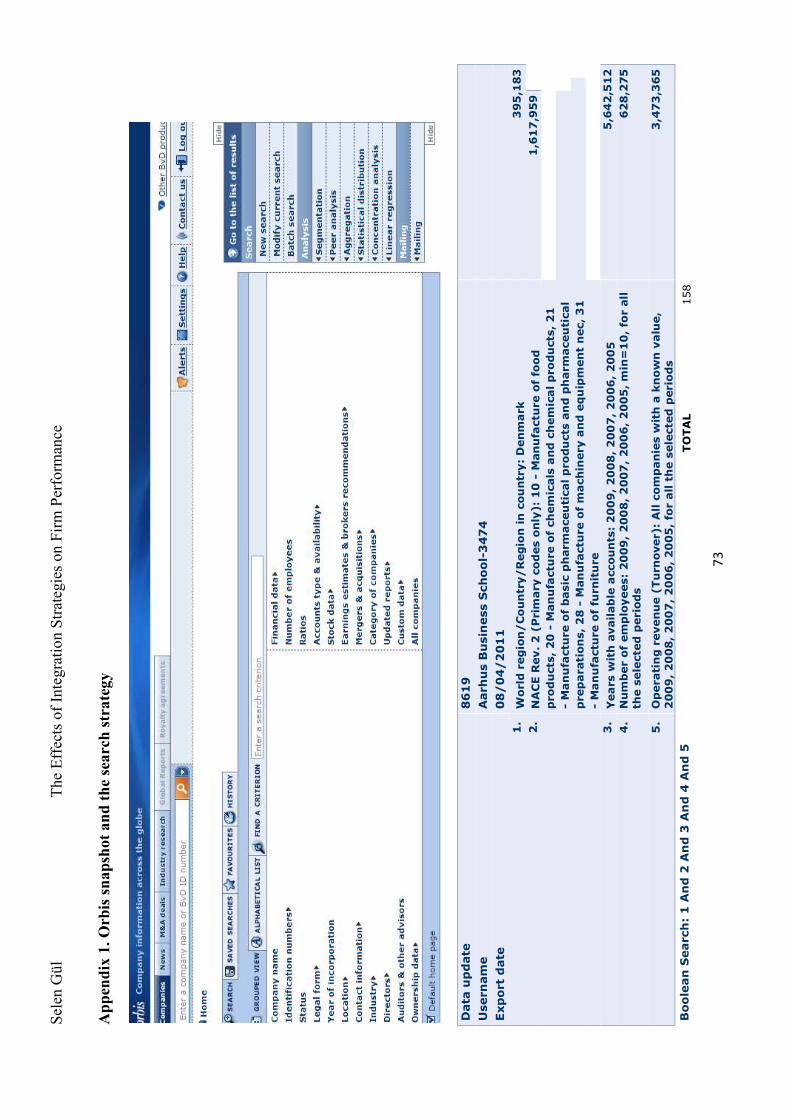
Sele
n G
ül
The
Eff
ects
of I
nteg
ratio
n St
rate
gies
on
Firm
Per
form
ance
73
Appendix 1. Orbis snapshot and the search strategy
Data update
8619
Username
Aarhus Business School-3474
Export date
08/04/2011
1. World region/Country/Region in country: Denmark
395,183
2. NACE Rev. 2 (Primary codes only): 10 - Manufacture of food
1,617,959
products, 20 - Manufacture of chemicals and chemical products, 21
- Manufacture of basic pharm
aceutical products and pharm
aceutical
preparations, 28 - Manufacture of machinery and equipment nec, 31
- Manufacture of furniture
3. Years with available accounts: 2009, 2008, 2007, 2006, 2005
5,642,512
4. Number of employees: 2009, 2008, 2007, 2006, 2005, min=10, for all
the selected periods
628,275
5. Operating revenue (Turnover): All companies with a known value,
2009, 2008, 2007, 2006, 2005, for all the selected periods
3,473,365
Boolean Search: 1 And 2 And 3 And 4 And 5
TOTAL
158

Selen Gül The Effects of Integration Strategies on Firm Performance
74
Appendix 2. List of companies based on the industries.
Table 1: Manufacture of Basic Pharmaceuticals and Pharmaceutical Preparations
Pharmaceutical Industry- Companies 1. Novo Nordisk A/S 7. Xelia Pharmaceuticals ApS 2. H. Lundbeck A/S 8. Basf A/S 3. Novozymes A/S 9. Bavarian Nordic A/S 4. Leo Pharma A/S 10. Contura International A/S 5. Alk Abello A/S 11. Mekos Laboratories ApS 6. Nycomed Danmark ApS
Table 2: Manufacture of Chemicals and Chemical Products
Chemical Industry-Companies 1. Borealis Group 11. Aga A/S 2. Cheminova A/S 12. Trevira Neckelman ApS 3. Hempel A/S 13. Sun Chemical A/S 4. Dako Denmark A/S 14. Yara Praxair A/S 5. FiberVisions A/S 15. Flint Group Denmark A/S 6. Brenntag Nordic A/S 16. Syntese A/S 7. Koppers Denmark A/S 17. Basf Construction Chemicals Denmark A/S 8. Teknos A/S 18. Nordalim A/S 9. Danlind A/S 19. GK Pharma ApS 10. Air Liquide Danmark A/S
Table 3: Manufacture of Furniture
Furniture Industry-Companies 1. Tvilum ApS 9. Fredericia Furniture A/S 2. Dan-Foam ApS 10. Ropox A/S 3. Expedit A/S 11. Kvik Production A/S 4. Invita Kokkener A/S 12. P.P. Mobler ApS 5. Dansani A/S 13. Lystrup Rustfri Stal ApS 6. Labflex A/S 14. Solrod Mobel A/S 7. Duba-B8 A/S 15. Aktielskabet J.L. Mollers Mobelfabrik 8. JKE Design A/S

Selen Gül The Effects of Integration Strategies on Firm Performance
75
Table 4: Manufacture of Machinery and Equipment
Machinery Industry-Companies 1. Vestas Nacelles A/S 27. Tetra Pak Hoyer A/S 2. Vestas Blades A/S 28. Glunz & Jensen A/S 3. Vestas Towers A/S 29. CFS Slagelse A/S 4. Grundfos A/S 30. Epoke A/S 5. Vestas Control Systems A/S 31. HOH Water Technology A/S 6. LM Wind Power A/S 32. Kroll Cranes A/S 7. Sauer-Danfoss ApS 33. Dantherm Filtration AS 8. Gea Process Engineering A/S 34. Westrup A/S 9. Alfa Laval Copenhagen A/S 35. Vola A/S 10. Alfa Laval Kolding A/S 36. Soco System A/S 11. SPX Flow Technology Denmark A/S 37. Egholm Maskiner A/S 12. Kongskilde Industries A/S 38. Alfa Laval Nakskov A/S 13. Desmi A/S 39. Scanomat A/S 14. Sondex A/S 40. KJ Industries A/S 15. Hojbjerg Maskinfabrik A/S 41. Skako Lift A/S 16. Andritz Feed & Biofuel A/S 42. Serman & Tipsmark A/S 17. Disa Industries A/S 43. KSM Kragelund ApS 18. Wittenborg ApS 44. Heta A/S 19. Kverneland Group Kerteminde A/S 45. Acta A/S 20. Struers A/S 46. Boe-Therm A/S 21. Caljan Rite-Hite ApS 47. Abeto-Teknik A/S 22. SFK Systems A/S 48. Magnus Jensen A/S 23. Jensen Denmark A/S 24. Exhausto A/S 25. Gram Commercial A/S 26. Haas-Meincke A/S
Table 5: Manufacture of Food Products
Food Industry- Companies 1. Leverandorselskabet Danish Crown
Amba 28. Dan Cake A/S
2. Danisco A/S 29. Pharma Nord ApS 3. Royal Greenland Seafood A/S 30. Thorfisk A/S 4. Aarhuskarlshamn Denmark A/S 31. Valsemollen af 1899 A/S 5. Arovit Petfood A/S 32. Rahbekfisk A/S 6. Lantmannen Danpo A/S 33. Aktieselskabet Saby Fiske Industri 7. Toms Gruppen A/S 34. Cremo Ingredients A/S 8. Fiskernes Fiskeindustri Amba
Skagen 35. Daloon A/S
9. Ferrosan A/S 36. Odense Marcipan A/S 10. Lantmannen Schulstad A/S 37. Hanstholm Fiskemelsfabrik A/S 11. Rynkeby Foods A/S 38. Hjalmar Nielsen A/S 12. Lantmannen Cerealia A/S 39. Hamlet Protein A/S 13. Kohberg Brod A/S 40. Sydvestjydsk Pelsdyrfoder Amba 14. Kelsen Group A/S 41. Norager Mejeri A/S

Selen Gül The Effects of Integration Strategies on Firm Performance
76
15. Dragsbak A/S 42. Fodercentralen for Holstebro og Omegn Amba
16. Aktieselskabet Beauvais 43. Easyfood A/S 17. Bisca A/S 44. Credin A/S 18. Palsgaard A/S 45. Dangront Products A/S 19. CO-RO Food A/S 46. Agrana Juice Denmark A/S 20. Protein og Oliefabrikken Scanola
A/S 47. P/F Fiskavirkid
21. Haribo Lakrids, Aktieselskab 48. PK Chemicals A/S 22. Scandic Food A/S 49. Samso Konservesfabrik A/S 23. Rieber & Son Danmark A/S 50. European Freeze Dry ApS 24. Stryhns A/S 51. Sjallands Pelsdyrfoder Amba 25. Vital Petfood Group A/S 52. Aarhus Slagtehus A/S 26. Gumlink A/S 53. CP Kelco Services ApS 27. P/F Havsbrun 54. P/F Kosin

Sele
n G
ül
The
Eff
ects
of I
nteg
ratio
n St
rate
gies
on
Firm
Per
form
ance
77
Appendix 3. The Input-Output table from statbank.dk for the manufacture of food products industry
2005 2006 2007 2005
(perc.)
2006
(perc.)
2007
(perc.)
Avera
ge
Agr
icul
ture
-(Su
pply
ing)
34
54 6 35
22 1 36
30 6 0,
47
0,47
0,
48
0,47
Mfr
. of d
airy
pro
duct
s-(S
uppl
ying
) 39
08
4098
38
03
0,05
0,
05
0,05
0,
05
Who
lesa
le e
xcep
t of m
otor
veh
icle
s-(S
uppl
ying
) 32
00
3749
40
04
0,04
0,
05
0,05
0,
05
Prod
uctio
n et
c. o
f mea
t and
mea
t pro
duct
s-(S
uppl
ying
) 33
78
3207
29
47
0,05
0,
04
0,04
0,
04
Frei
ght t
rans
port
by
road
and
via
pip
elin
es-(
Supp
lyin
g)
2443
24
50
2312
0,
03
0,03
0,
03
0,03
A
dver
tisin
g-(S
uppl
ying
) 17
96
1692
20
48
0,02
0,
02
0,03
0,
02
Mfr
. of s
tarc
h, c
hoco
late
and
sug
ar p
rodu
cts-
(Sup
plyi
ng)
1524
16
73
1947
0,
02
0,02
0,
03
0,02
O
ther
bus
ines
s ac
tiviti
es-(
Supp
lyin
g)
1568
15
52
1439
0,
02
0,02
0,
02
0,02
M
fr. o
f veg
etab
le a
nd a
nim
al o
ils a
nd fa
ts-(
Supp
lyin
g)
1037
10
25
1320
0,
01
0,01
0,
02
0,01
Fi
shin
g-(S
uppl
ying
) 10
61
1097
11
49
0,01
0,
01
0,02
0,
01
Prod
uctio
n an
d di
stri
butio
n of
ele
ctri
city
-(Su
pply
ing)
93
6 10
78
1109
0,
01
0,01
0,
01
0,01
Pr
oces
sing
and
pre
serv
ing
of fi
sh a
nd fi
sh p
rodu
cts-
(Sup
plyi
ng)
951
1078
98
9 0,
01
0,01
0,
01
0,01
M
fr. o
f pul
p, p
aper
and
pap
er p
rodu
cts-
(Sup
plyi
ng)
1038
95
9 89
7 0,
01
0,01
0,
01
0,01
C
onsu
lting
eng
inee
rs, a
rchi
tect
s -(
Supp
lyin
g)
1016
95
8 90
5 0,
01
0,01
0,
01
0,01
M
anuf
actu
re o
f sug
ar-(
Supp
lyin
g)
1021
86
4 88
8 0,
01
0,01
0,
01
0,01
M
fr. o
f rub
ber p
rodu
cts
and
plas
tic p
acki
ng g
oods
etc
.-(Su
pply
ing)
82
6 85
8 88
6 0,
01
0,01
0,
01
0,01
Fi
nanc
ial i
nstit
utio
ns-(
Supp
lyin
g)
899
816
831
0,01
0,
01
0,01
0,
01
Man
ufac
ture
and
dis
trib
utio
n of
gas
-(Su
pply
ing)
75
7 84
6 74
2 0,
01
0,01
0,
01
0,01
Pr
oces
sing
and
pre
serv
ing
of fr
uit a
nd v
eget
able
s-(S
uppl
ying
) 74
6 73
3 64
3 0,
01
0,01
0,
01
0,01
B
uild
ing-
clea
ning
act
iviti
es-(
Supp
lyin
g)
646
553
586
0,01
0,
01
0,01
0,
01
Let
ting
of n
on-r
esid
entia
l bui
ldin
gs-(
Supp
lyin
g)
560
580
613
0,01
0,
01
0,01
0,
01
Post
and
tele
com
mun
icat
ions
-(Su
pply
ing)
58
0 60
6 53
1 0,
01
0,01
0,
01
0,01
M
fr. o
f var
ious
met
al p
rodu
cts-
(Sup
plyi
ng)
582
542
549
0,01
0,
01
0,01
0,
01
Man
ufac
ture
of b
ever
ages
-(Su
pply
ing)
50
8 57
6 52
4 0,
01
0,01
0,
01
0,01

Sele
n G
ül
The
Eff
ects
of I
nteg
ratio
n St
rate
gies
on
Firm
Per
form
ance
78
Act
iviti
es o
f oth
er tr
ansp
ort a
genc
ies-
(Sup
plyi
ng)
657
525
409
0,01
0,
01
0,01
0,
01
Mfr
. of p
harm
aceu
tical
s et
c.-(
Supp
lyin
g)
348
328
380
0,00
0,
00
0,00
0,
00
Sew
age
rem
oval
and
pur
ifyi
ng p
lant
s-(S
uppl
ying
) 37
3 33
7 34
0 0,
01
0,00
0,
00
0,00
M
fr. o
f bui
ldin
g m
ater
ials
of m
etal
-(Su
pply
ing)
32
2 31
2 34
4 0,
00
0,00
0,
00
0,00
R
epai
r and
mai
nten
ance
of b
uild
ings
-(Su
pply
ing)
32
4 27
3 30
9 0,
00
0,00
0,
00
0,00
M
fr. o
f det
erge
nts
and
othe
r che
mic
al p
rodu
cts-
(Sup
plyi
ng)
224
296
368
0,00
0,
00
0,00
0,
00
Soft
war
e co
nsul
tanc
y an
d su
pply
-(Su
pply
ing)
32
7 26
8 25
7 0,
00
0,00
0,
00
0,00
R
ecre
atio
nal,
cultu
ral,
spor
ting
activ
ities
(mar
ket)
-(Su
pply
ing)
27
2 30
2 24
4 0,
00
0,00
0,
00
0,00
N
on-l
ife
insu
ranc
e-(S
uppl
ying
) 26
9 27
4 20
1 0,
00
0,00
0,
00
0,00
M
fr. o
f ove
ns a
nd c
old-
stor
age
plan
ts-(
Supp
lyin
g)
232
247
265
0,00
0,
00
0,00
0,
00
Man
ufac
ture
of t
obac
co p
rodu
cts-
(Sup
plyi
ng)
243
258
225
0,00
0,
00
0,00
0,
00
Mfr
. of o
ther
ele
ctri
cal m
achi
nery
and
app
arat
us-(
Supp
lyin
g)
232
215
218
0,00
0,
00
0,00
0,
00
Com
pute
r act
iviti
es e
xc. s
oftw
are
cons
ulta
ncy
and
supp
ly-(
Supp
lyin
g)
229
208
216
0,00
0,
00
0,00
0,
00
Mor
tgag
e cr
edit
inst
itutio
ns-(
Supp
lyin
g)
283
192
173
0,00
0,
00
0,00
0,
00
Hor
ticul
ture
, orc
hard
s et
c.-(
Supp
lyin
g)
180
210
228
0,00
0,
00
0,00
0,
00
Con
stru
ctio
n m
ater
ials
for o
wn-
acco
unt r
epai
r-(S
uppl
ying
) 23
9 18
0 18
7 0,
00
0,00
0,
00
0,00
A
ctiv
ities
of m
embe
rshi
p or
gani
zatio
ns-(
Supp
lyin
g)
215
209
175
0,00
0,
00
0,00
0,
00
Ren
ting
of tr
ansp
ort e
quip
men
t and
mac
hine
ry-(
Supp
lyin
g)
218
202
174
0,00
0,
00
0,00
0,
00
Mfr
. of b
read
, cak
es a
nd b
iscu
its-(
Supp
lyin
g)
163
215
201
0,00
0,
00
0,00
0,
00
Mfr
. of m
achi
nery
for i
ndus
trie
s-(S
uppl
ying
) 16
4 16
8 20
4 0,
00
0,00
0,
00
0,00
R
esta
uran
ts -(
Supp
lyin
g)
172
181
172
0,00
0,
00
0,00
0,
00
Ref
use
colle
ctio
n an
d sa
nita
tion-
(Sup
plyi
ng)
173
181
137
0,00
0,
00
0,00
0,
00
Mfr
. of r
efin
ed p
etro
leum
pro
duct
s et
c.-(
Supp
lyin
g)
103
116
183
0,00
0,
00
0,00
0,
00
Col
lect
ion
and
dist
ribu
tion
of w
ater
-(Su
pply
ing)
12
7 12
4 13
7 0,
00
0,00
0,
00
0,00
A
ccou
ntin
g, b
ook-
keep
ing,
aud
iting
-(Su
pply
ing)
12
9 12
7 12
7 0,
00
0,00
0,
00
0,00
M
fr. o
f agr
icul
tura
l m
achi
nery
-(Su
pply
ing)
13
7 11
6 12
2 0,
00
0,00
0,
00
0,00
C
argo
han
dlin
g, h
arbo
urs
etc.
, tra
vel a
genc
ies-
(Sup
plyi
ng)
130
115
107
0,00
0,
00
0,00
0,
00
Mfr
. of t
rans
port
equ
ipm
ent e
xcl.
ship
s, m
otor
veh
icle
s et
c.-(
Supp
lyin
g)
103
128
118
0,00
0,
00
0,00
0,
00
Civ
il en
gine
erin
g-(S
uppl
ying
) 11
7 88
99
0,
00
0,00
0,
00
0,00

Sele
n G
ül
The
Eff
ects
of I
nteg
ratio
n St
rate
gies
on
Firm
Per
form
ance
79
Tra
nspo
rt v
ia ra
ilway
s-(S
uppl
ying
) 13
1 93
79
0,
00
0,00
0,
00
0,00
H
otel
s-(S
uppl
ying
) 10
1 10
3 87
0,
00
0,00
0,
00
0,00
M
aint
enan
ce a
nd re
pair
of m
otor
veh
icle
s-(S
uppl
ying
) 92
97
10
0 0,
00
0,00
0,
00
0,00
R
eal e
stat
e ag
ents
etc
.-(Su
pply
ing)
89
84
76
0,
00
0,00
0,
00
0,00
Pu
blis
hing
act
iviti
es, e
xclu
ding
new
spap
ers-
(Sup
plyi
ng)
94
78
65
0,00
0,
00
0,00
0,
00
Stea
m a
nd h
ot w
ater
sup
ply-
(Sup
plyi
ng)
92
93
49
0,00
0,
00
0,00
0,
00
Man
ufac
ture
of o
ther
pla
stic
pro
duct
s n.
e.c.
-(Su
pply
ing)
77
75
80
0,
00
0,00
0,
00
0,00
O
ther
ser
vice
act
iviti
es-(
Supp
lyin
g)
77
71
80
0,00
0,
00
0,00
0,
00
Prin
ting
activ
ities
-(Su
pply
ing)
76
68
78
0,
00
0,00
0,
00
0,00
R
efus
e du
mps
and
refu
se d
ispo
sal p
lant
s-(S
uppl
ying
) 82
78
60
0,
00
0,00
0,
00
0,00
O
ther
reta
il sa
le, r
epai
r wor
k-(S
uppl
ying
) 66
67
74
0,
00
0,00
0,
00
0,00
M
fr. o
f woo
d an
d w
ood
prod
ucts
-(Su
pply
ing)
59
61
65
0,
00
0,00
0,
00
0,00
R
etai
l tra
de o
f foo
d -(
Supp
lyin
g)
57
62
64
0,00
0,
00
0,00
0,
00
Leg
al a
ctiv
ities
-(Su
pply
ing)
62
65
54
0,
00
0,00
0,
00
0,00
M
fr. o
f bas
ic n
on-f
erro
us m
etal
s-(S
uppl
ying
) 59
59
54
0,
00
0,00
0,
00
0,00
Pu
blis
hing
of n
ewsp
aper
s-(S
uppl
ying
) 47
57
57
0,
00
0,00
0,
00
0,00
M
fr. o
f rad
io a
nd c
omm
unic
atio
n eq
uipm
ent-
(Sup
plyi
ng)
40
35
69
0,00
0,
00
0,00
0,
00
Gen
eral
(ove
rall)
pub
lic s
ervi
ce a
ctiv
ities
-(Su
pply
ing)
56
42
35
0,
00
0,00
0,
00
0,00
M
fr. o
f ind
ustr
ial g
ases
and
inor
gani
c ba
cis
chem
ical
s-(S
uppl
ying
) 42
44
40
0,
00
0,00
0,
00
0,00
M
fr. o
f off
ice
mac
hine
ry a
nd c
ompu
ters
-(Su
pply
ing)
55
36
35
0,
00
0,00
0,
00
0,00
A
ctiv
ities
aux
iliar
y to
fina
nce-
(Sup
plyi
ng)
40
46
39
0,00
0,
00
0,00
0,
00
Mfr
. of m
arin
e en
gine
s an
d co
mpr
esso
rs -(
Supp
lyin
g)
33
41
30
0,00
0,
00
0,00
0,
00
Ext
r. of
gra
vel a
nd c
lay
etc.
-(Su
pply
ing)
31
41
24
0,
00
0,00
0,
00
0,00
T
axi o
pera
tion
and
coac
h se
rvic
es-(
Supp
lyin
g)
34
31
29
0,00
0,
00
0,00
0,
00
Adm
inis
trat
ion
of p
ublic
sec
tors
exc
. for
bis
ines
s-(S
uppl
ying
) 31
34
26
0,
00
0,00
0,
00
0,00
M
fr. o
f med
ical
and
opt
ical
inst
rum
ents
-(Su
pply
ing)
28
33
28
0,
00
0,00
0,
00
0,00
R
ecyc
ling
of w
aste
and
scr
ap-(
Supp
lyin
g)
24
31
25
0,00
0,
00
0,00
0,
00
Def
ence
, pol
ice
and
adm
inis
trat
ion
of ju
stic
e-(S
uppl
ying
) 17
18
44
0,
00
0,00
0,
00
0,00
A
ir tr
ansp
ort-
(Sup
plyi
ng)
24
21
26
0,00
0,
00
0,00
0,
00

Sele
n G
ül
The
Eff
ects
of I
nteg
ratio
n St
rate
gies
on
Firm
Per
form
ance
80
Man
ufac
ture
of m
otor
veh
icle
s et
c.-(
Supp
lyin
g)
18
23
27
0,00
0,
00
0,00
0,
00
Sale
of m
otor
veh
icle
s an
d m
otor
cycl
es-(
Supp
lyin
g)
19
22
26
0,00
0,
00
0,00
0,
00
Ret
ail s
ale
of a
utom
otiv
e fu
el-(
Supp
lyin
g)
16
20
19
0,00
0,
00
0,00
0,
00
Dep
artm
ent s
tore
s-(S
uppl
ying
) 15
16
18
0,
00
0,00
0,
00
0,00
O
ther
sch
edul
ed p
asse
nger
land
tran
spor
t-(S
uppl
ying
) 17
16
15
0,
00
0,00
0,
00
0,00
M
fr. o
f tex
tiles
-(Su
pply
ing)
18
13
15
0,
00
0,00
0,
00
0,00
M
anuf
actu
re o
f pes
ticid
es a
nd o
ther
agr
o-ch
emic
al p
rodu
cts-
(Sup
plyi
ng)
13
16
16
0,00
0,
00
0,00
0,
00
Mfr
. of c
oncr
ete,
cem
ent,
asph
alt a
nd ro
ckw
ool p
rodu
cts-
(Sup
plyi
ng)
14
14
17
0,00
0,
00
0,00
0,
00
Mfr
. of d
yes,
pig
men
ts a
nd o
rgan
ic b
acis
che
mic
als-
(Sup
plyi
ng)
23
14
6 0,
00
0,00
0,
00
0,00
M
fr. o
f gla
ss a
nd c
eram
ic g
oods
etc
.-(Su
pply
ing)
8
9 25
0,
00
0,00
0,
00
0,00
W
ater
tran
spor
t-(S
uppl
ying
) 12
13
14
0,
00
0,00
0,
00
0,00
M
fr. o
f cem
ent,
bric
ks, t
iles,
flag
s et
c.-(
Supp
lyin
g)
14
15
7 0,
00
0,00
0,
00
0,00
A
dult
and
othe
r edu
catio
n (m
arke
t)-(
Supp
lyin
g)
14
13
10
0,00
0,
00
0,00
0,
00
Reg
ulat
ion
of a
nd c
ontr
ibut
ion
to m
ore
effi
cien
t ope
ratio
n of
bus
ines
s-(S
uppl
ying
) 15
11
11
0,
00
0,00
0,
00
0,00
Mfr
. of t
oys,
gol
d an
d si
lver
art
icle
s et
c.-(
Supp
lyin
g)
12
13
10
0,00
0,
00
0,00
0,
00
Adu
lt an
d ot
her e
duca
tion
(oth
er n
on-m
arke
t)-(
Supp
lyin
g)
13
13
7 0,
00
0,00
0,
00
0,00
M
fr. o
f bui
lder
s w
are
of p
last
ic-(
Supp
lyin
g)
10
8 10
0,
00
0,00
0,
00
0,00
R
e. s
ale
of p
har.
good
s, c
osm
etic
art
.-(Su
pply
ing)
10
8
8 0,
00
0,00
0,
00
0,00
M
fr. o
f fur
nitu
re-(
Supp
lyin
g)
8 10
7
0,00
0,
00
0,00
0,
00
Res
earc
h an
d de
velo
pmen
t (m
arke
t)-(
Supp
lyin
g)
8 8
9 0,
00
0,00
0,
00
0,00
M
fr. o
f pai
nts,
var
nish
es a
nd s
imila
r coa
tings
, pri
ntin
g in
k an
d m
astic
s-(S
uppl
ying
) 8
5 6
0,00
0,
00
0,00
0,
00
Mfr
. of d
omes
tic a
pplia
nces
-(Su
pply
ing)
6
6 5
0,00
0,
00
0,00
0,
00
Firs
t pro
cess
ing
of ir
on a
nd s
teel
-(Su
pply
ing)
3
5 8
0,00
0,
00
0,00
0,
00
Mfr
. of p
last
ics
and
synt
hetic
rubb
er-(
Supp
lyin
g)
10
4 3
0,00
0,
00
0,00
0,
00
Mfr
. of w
eari
ng a
ppar
el-(
Supp
lyin
g)
5 5
3 0,
00
0,00
0,
00
0,00
C
astin
g of
met
al p
rodu
cts-
(Sup
plyi
ng)
2 2
4 0,
00
0,00
0,
00
0,00
H
ighe
r edu
catio
n-(S
uppl
ying
) 2
2 1
0,00
0,
00
0,00
0,
00
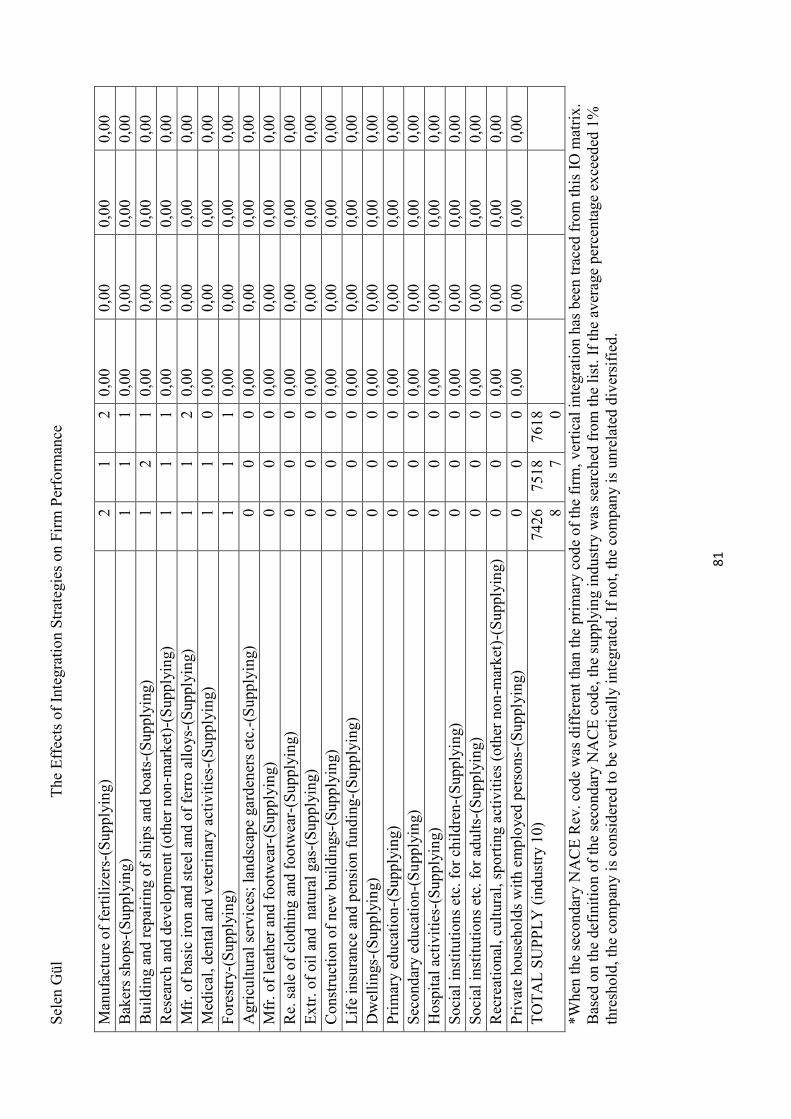
Sele
n G
ül
The
Eff
ects
of I
nteg
ratio
n St
rate
gies
on
Firm
Per
form
ance
81
*Whe
n th
e se
cond
ary
NA
CE
Rev
. cod
e w
as d
iffe
rent
than
the
prim
ary
code
of t
he fi
rm, v
ertic
al in
tegr
atio
n ha
s be
en tr
aced
from
this
IO m
atri
x.
Bas
ed o
n th
e de
fini
tion
of th
e se
cond
ary
NA
CE
cod
e, th
e su
pply
ing
indu
stry
was
sea
rche
d fr
om th
e lis
t. If
the
aver
age
perc
enta
ge e
xcee
ded
1%
thre
shol
d, th
e co
mpa
ny is
con
side
red
to b
e ve
rtic
ally
inte
grat
ed. I
f not
, the
com
pany
is u
nrel
ated
div
ersi
fied
.
Man
ufac
ture
of f
ertil
izer
s-(S
uppl
ying
) 2
1 2
0,00
0,
00
0,00
0,
00
Bak
ers
shop
s-(S
uppl
ying
) 1
1 1
0,00
0,
00
0,00
0,
00
Bui
ldin
g an
d re
pair
ing
of s
hips
and
boa
ts-(
Supp
lyin
g)
1 2
1 0,
00
0,00
0,
00
0,00
R
esea
rch
and
deve
lopm
ent (
othe
r non
-mar
ket)
-(Su
pply
ing)
1
1 1
0,00
0,
00
0,00
0,
00
Mfr
. of b
asic
iron
and
ste
el a
nd o
f fer
ro a
lloys
-(Su
pply
ing)
1
1 2
0,00
0,
00
0,00
0,
00
Med
ical
, den
tal a
nd v
eter
inar
y ac
tiviti
es-(
Supp
lyin
g)
1 1
0 0,
00
0,00
0,
00
0,00
Fo
rest
ry-(
Supp
lyin
g)
1 1
1 0,
00
0,00
0,
00
0,00
A
gric
ultu
ral s
ervi
ces;
land
scap
e ga
rden
ers
etc.
-(Su
pply
ing)
0
0 0
0,00
0,
00
0,00
0,
00
Mfr
. of l
eath
er a
nd fo
otw
ear-
(Sup
plyi
ng)
0 0
0 0,
00
0,00
0,
00
0,00
R
e. s
ale
of c
loth
ing
and
foot
wea
r-(S
uppl
ying
) 0
0 0
0,00
0,
00
0,00
0,
00
Ext
r. of
oil
and
nat
ural
gas
-(Su
pply
ing)
0
0 0
0,00
0,
00
0,00
0,
00
Con
stru
ctio
n of
new
bui
ldin
gs-(
Supp
lyin
g)
0 0
0 0,
00
0,00
0,
00
0,00
L
ife
insu
ranc
e an
d pe
nsio
n fu
ndin
g-(S
uppl
ying
) 0
0 0
0,00
0,
00
0,00
0,
00
Dw
ellin
gs-(
Supp
lyin
g)
0 0
0 0,
00
0,00
0,
00
0,00
Pr
imar
y ed
ucat
ion-
(Sup
plyi
ng)
0 0
0 0,
00
0,00
0,
00
0,00
Se
cond
ary
educ
atio
n-(S
uppl
ying
) 0
0 0
0,00
0,
00
0,00
0,
00
Hos
pita
l act
iviti
es-(
Supp
lyin
g)
0 0
0 0,
00
0,00
0,
00
0,00
So
cial
inst
itutio
ns e
tc. f
or c
hild
ren-
(Sup
plyi
ng)
0 0
0 0,
00
0,00
0,
00
0,00
So
cial
inst
itutio
ns e
tc. f
or a
dults
-(Su
pply
ing)
0
0 0
0,00
0,
00
0,00
0,
00
Rec
reat
iona
l, cu
ltura
l, sp
ortin
g ac
tiviti
es (o
ther
non
-mar
ket)
-(Su
pply
ing)
0
0 0
0,00
0,
00
0,00
0,
00
Priv
ate
hous
ehol
ds w
ith e
mpl
oyed
per
sons
-(Su
pply
ing)
0
0 0
0,00
0,
00
0,00
0,
00
TO
TA
L S
UPP
LY (i
ndus
try
10)
7426 8
7518 7
7618 0

81
Appendix 4. A representation on how the integration strategies have been identified (Example from the chemicals industry)
Table 6: Manufacture of Chemicals and Chemical Products Industry
*As seen in the table above, if the company has revealed only its primary code as in Hempel A/S, the firm is regarded as being un-diversified. **If the first two digit primary & secondary codes are the same, we will take them as horizontally integrated (HI=1). ***If not, as in the third case, we will investigate vertical integration with the use of the IO matrix based on the definition of the secondary NACE code (23). The percentage level where the two industries are intercepting will give an idea of VI. For this, a minimum percentage index has to identified and based on common sense and 10 first biggest suppliers, an index of 1% is to be chosen. If NACE 23 is not a supplying industry (below 1%) for the chemicals industry, then the company is regarded as unrelated diversified. Here, the analysis is based on the priority level of the first secondary NACE code that is presented; therefore the code 4676 is not taken into consideration when identifying FiberVision A/S’s integration strategy. This assumption is to preserve the mutual exclusivity of the integration strategies.
Company Core Code Secondary Code Hempel A/S* 2030 -- BOREALIS Group** 2016 2059 FiberVisions A/S*** 2060 2365
4676
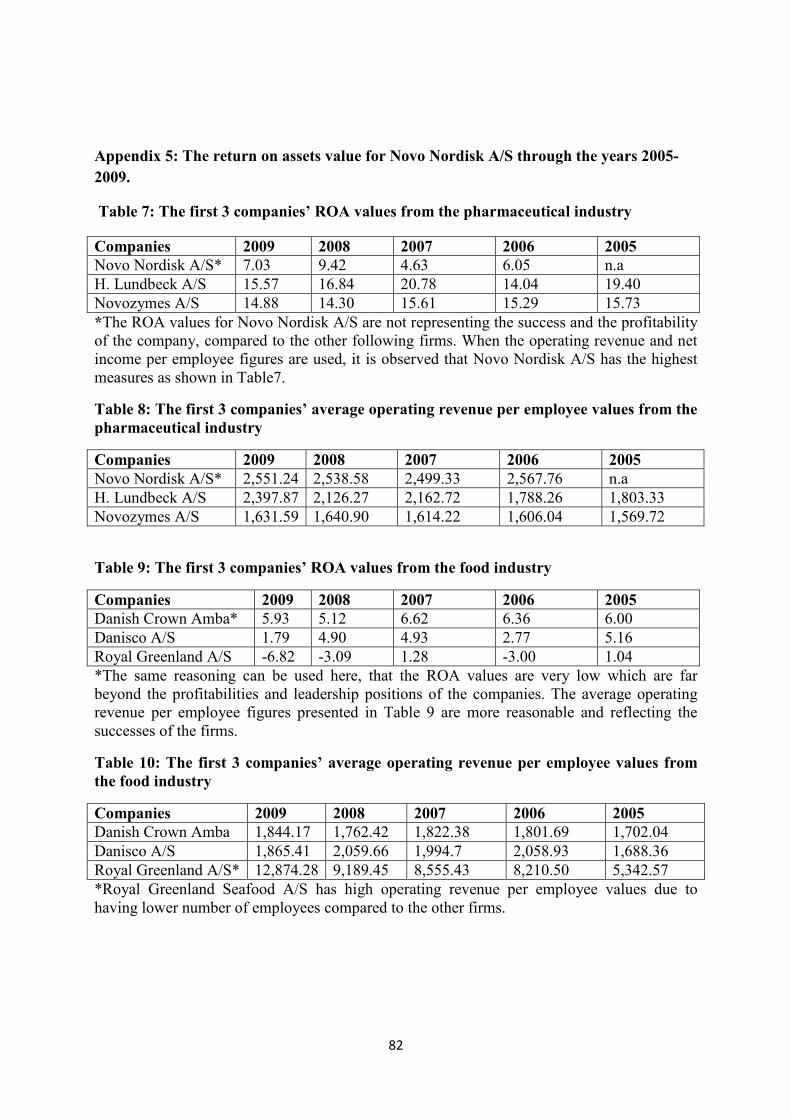
82
Appendix 5: The return on assets value for Novo Nordisk A/S through the years 2005-2009.
Table 7: The first 3 companies’ ROA values from the pharmaceutical industry
Companies 2009 2008 2007 2006 2005 Novo Nordisk A/S* 7.03 9.42 4.63 6.05 n.a H. Lundbeck A/S 15.57 16.84 20.78 14.04 19.40 Novozymes A/S 14.88 14.30 15.61 15.29 15.73 *The ROA values for Novo Nordisk A/S are not representing the success and the profitability of the company, compared to the other following firms. When the operating revenue and net income per employee figures are used, it is observed that Novo Nordisk A/S has the highest measures as shown in Table7.
Table 8: The first 3 companies’ average operating revenue per employee values from the pharmaceutical industry
Companies 2009 2008 2007 2006 2005 Novo Nordisk A/S* 2,551.24 2,538.58 2,499.33 2,567.76 n.a H. Lundbeck A/S 2,397.87 2,126.27 2,162.72 1,788.26 1,803.33 Novozymes A/S 1,631.59 1,640.90 1,614.22 1,606.04 1,569.72
Table 9: The first 3 companies’ ROA values from the food industry
Companies 2009 2008 2007 2006 2005 Danish Crown Amba* 5.93 5.12 6.62 6.36 6.00 Danisco A/S 1.79 4.90 4.93 2.77 5.16 Royal Greenland A/S -6.82 -3.09 1.28 -3.00 1.04 *The same reasoning can be used here, that the ROA values are very low which are far beyond the profitabilities and leadership positions of the companies. The average operating revenue per employee figures presented in Table 9 are more reasonable and reflecting the successes of the firms.
Table 10: The first 3 companies’ average operating revenue per employee values from the food industry
Companies 2009 2008 2007 2006 2005 Danish Crown Amba 1,844.17 1,762.42 1,822.38 1,801.69 1,702.04 Danisco A/S 1,865.41 2,059.66 1,994.7 2,058.93 1,688.36 Royal Greenland A/S* 12,874.28 9,189.45 8,555.43 8,210.50 5,342.57 *Royal Greenland Seafood A/S has high operating revenue per employee values due to having lower number of employees compared to the other firms.

83
Appendix 6. The summary statistics of the manufacture of basic pharmaceutical products and pharmaceutical preparations industry
Table 11: The pharmaceutical companies based on integration strategies
Pharmaceutical Industry- Companies’ Integration Strategies 1. Novo Nordisk A/S UR 7. Xelia Pharmaceuticals
ApS HI
2. H. Lundbeck A/S VI 8. Basf A/S UR 3. Novozymes A/S UR 9. Bavarian Nordic A/S VI 4. Leo Pharma A/S UD 10. Contura International A/S UD 5. Alk Abello A/S VI 11. Mekos Laboratories ApS UD 6. Nycomed Danmark ApS VI UR= Unrelated Diversified VI= Vertical Integration HI= Horizontal Integration UD= Undiversified
Output 1. Summary statistics

84
Output 2. Detailed summary statistics
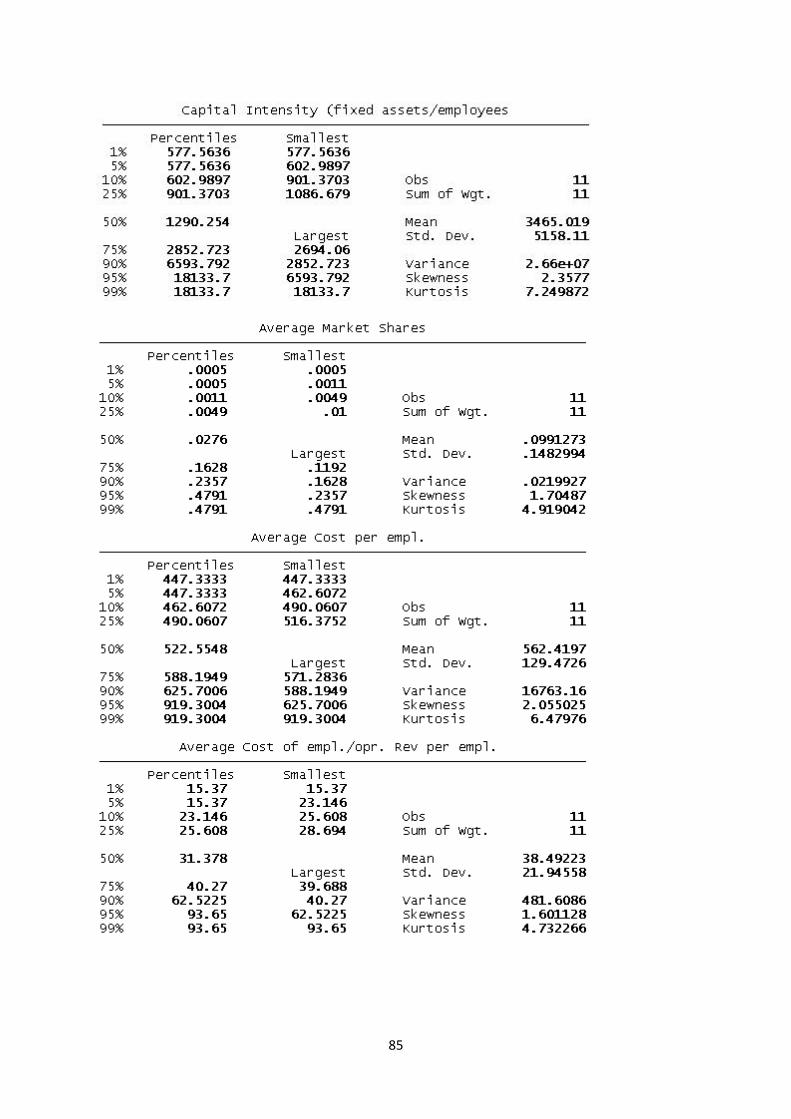
85
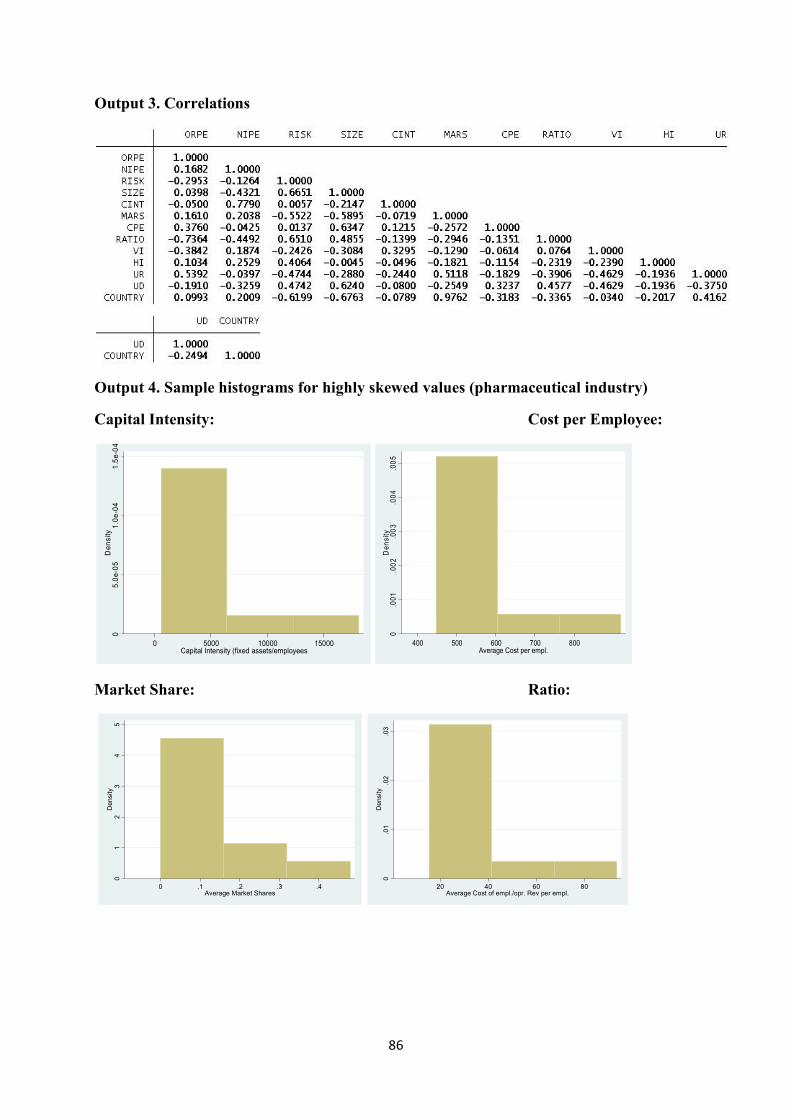
86
Output 3. Correlations
Output 4. Sample histograms for highly skewed values (pharmaceutical industry)
Capital Intensity: Cost per Employee:
Market Share: Ratio:
05.0e-05
1.0e-04
1.5e-04
Density
0 5000 10000 15000Capital Intensity (fixed assets/employees
0.001
.002
.003
.004
.005
Density
400 500 600 700 800Average Cost per empl.
01
23
45
Density
0 .1 .2 .3 .4Average Market Shares
0.01
.02
.03
Density
20 40 60 80Average Cost of empl./opr. Rev per empl.

87
Appendix 7. The summary statistics of the manufacture of food products industry
Table 12: The manufacture of food industry companies based on integration strategies
Food Industry- Companies’ Integration Strategies 1. Leverandorselskabet Danish
Crown Amba HI 28. Dan Cake A/S HI
2. Danisco A/S UR 29. Pharma Nord ApS UD 3. Royal Greenland Seafood A/S VI 30. Thorfisk A/S UD 4. Aarhuskarlshamn Denmark A/S UR 31. Valsemollen af 1899 A/S UD 5. Arovit Petfood A/S UD 32. Rahbekfisk A/S HI 6. Lantmannen Danpo A/S HI 33. Aktieselskabet Saby Fiske
Industri UD
7. Toms Gruppen A/S UD 34. Cremo Ingredients A/S UD 8. Fiskernes Fiskeindustri Amba
Skagen UD 35. Daloon A/S UD
9. Ferrosan A/S UR 36. Odense Marcipan A/S UD 10. Lantmannen Schulstad A/S UD 37. Hanstholm Fiskemelsfabrik
A/S HI
11. Rynkeby Foods A/S HI 38. Hjalmar Nielsen A/S VI 12. Lantmannen Cerealia A/S VI 39. Hamlet Protein A/S UD 13. Kohberg Brod A/S VI 40. Sydvestjydsk Pelsdyrfoder
Amba HI
14. Kelsen Group A/S HI 41. Norager Mejeri A/S UD 15. Dragsbak A/S HI 42. Fodercentralen for Holstebro
og Omegn Amba UD
16. Aktieselskabet Beauvais HI 43. Easyfood A/S UD 17. Bisca A/S HI 44. Credin A/S VI 18. Palsgaard A/S UD 45. Dangront Products A/S HI 19. CO-RO Food A/S UR 46. Agrana Juice Denmark A/S UD 20. Protein og Oliefabrikken Scanola
A/S HI 47. P/F Fiskavirkid UD
21. Haribo Lakrids, Aktieselskab VI 48. PK Chemicals A/S HI 22. Scandic Food A/S HI 49. Samso Konservesfabrik A/S UD 23. Rieber & Son Danmark A/S HI 50. European Freeze Dry ApS UD 24. Stryhns A/S HI 51. Sjallands Pelsdyrfoder Amba UD 25. Vital Petfood Group A/S UD 52. Aarhus Slagtehus A/S UD 26. Gumlink A/S HI 53. CP Kelco Services ApS HI 27. P/F Havsbrun HI 54. P/F Kosin UD

88
Output 5. Summary statistics
Output 6. Detailed summary statistics

89

90
Output 7. Correlations

91
Appendix 8: The summary statistics of the manufacture of chemicals and chemical products industry
Table 13: The manufacture of chemicals and chemical products industry companies based on integration strategies
Chemical Industry-Companies’ Integration Strategies 1. Borealis Group HI 11. Aga A/S VI 2. Cheminova A/S HI 12. Trevira Neckelman ApS UD 3. Hempel A/S UR 13. Sun Chemical A/S UR 4. Dako Denmark A/S UD 14. Yara Praxair A/S VI 5. FiberVisions A/S UR 15. Flint Group Denmark A/S UD 6. Brenntag Nordic A/S HI 16. Syntese A/S UD 7. Koppers Denmark A/S HI 17. Basf Construction Chemicals
Denmark A/S UR
8. Teknos A/S HI 18. Nordalim A/S UD 9. Danlind A/S UR 19. GK Pharma ApS UD 10. Air Liquide Danmark A/S HI
Output 8. Summary statistics

92
Output 9. Detailed summary statistics

93

94
Output 10. Correlations

95
Appendix 9. The summary statistics of the manufacture of furniture industry
Table 14: The manufacture of furniture industry companies based on integration strategies
Furniture Industry-Companies’ Integration Strategies 1. Tvilum ApS HI 9. Fredericia Furniture A/S VI 2. Dan-Foam ApS UD 10. Ropox A/S UD 3. Expedit A/S VI 11. Kvik Production A/S UD 4. Invita Kokkener A/S UR 12. P.P. Mobler ApS UD 5. Dansani A/S VI 13. Lystrup Rustfri Stal ApS UD 6. Labflex A/S UR 14. Solrod Mobel A/S UD 7. Duba-B8 A/S VI 15. Aktielskabet J.L. Mollers
Mobelfabrik UD
8. JKE Design A/S HI UD
Output 11. Summary statistics
Output 12. Detailed summary statistics

96

97
Output 13. Correlations

98
Appendix 10: The summary statistics of the manufacture of machinery and equipment industry
Table 15: The manufacture of machinery and equipment industry companies based on integration strategies
Machinery Industry-Companies’ Integration Strategies 1. Vestas Nacelles A/S UD 27. Tetra Pak Hoyer A/S HI 2. Vestas Blades A/S UD 28. Glunz & Jensen A/S VI 3. Vestas Towers A/S UD 29. CFS Slagelse A/S UR 4. Grundfos A/S UD 30. Epoke A/S VI 5. Vestas Control Systems
A/S UD 31. HOH Water
Technology A/S UR
6. LM Wind Power A/S UD 32. Kroll Cranes A/S VI 7. Sauer-Danfoss ApS VI 33. Dantherm Filtration AS UR 8. Gea Process Engineering
A/S UD 34. Westrup A/S HI
9. Alfa Laval Copenhagen A/S
UD 35. Vola A/S UR
10. Alfa Laval Kolding A/S UR 36. Soco System A/S HI 11. SPX Flow Technology
Denmark A/S UR 37. Egholm Maskiner A/S UR
12. Kongskilde Industries A/S HI 38. Alfa Laval Nakskov A/S
VI
13. Desmi A/S HI 39. Scanomat A/S UR 14. Sondex A/S UD 40. KJ Industries A/S HI 15. Hojbjerg Maskinfabrik
A/S HI 41. Skako Lift A/S UR
16. Andritz Feed & Biofuel A/S
UD 42. Serman & Tipsmark A/S
HI
17. Disa Industries A/S UR 43. KSM Kragelund ApS UR 18. Wittenborg ApS UD 44. Heta A/S VI 19. Kverneland Group
Kerteminde A/S UD 45. Acta A/S VI
20. Struers A/S UR 46. Boe-Therm A/S HI 21. Caljan Rite-Hite ApS UD 47. Abeto-Teknik A/S HI 22. SFK Systems A/S VI 48. Magnus Jensen A/S VI 23. Jensen Denmark A/S VI 24. Exhausto A/S UD 25. Gram Commercial A/S UD 26. Haas-Meincke A/S VI
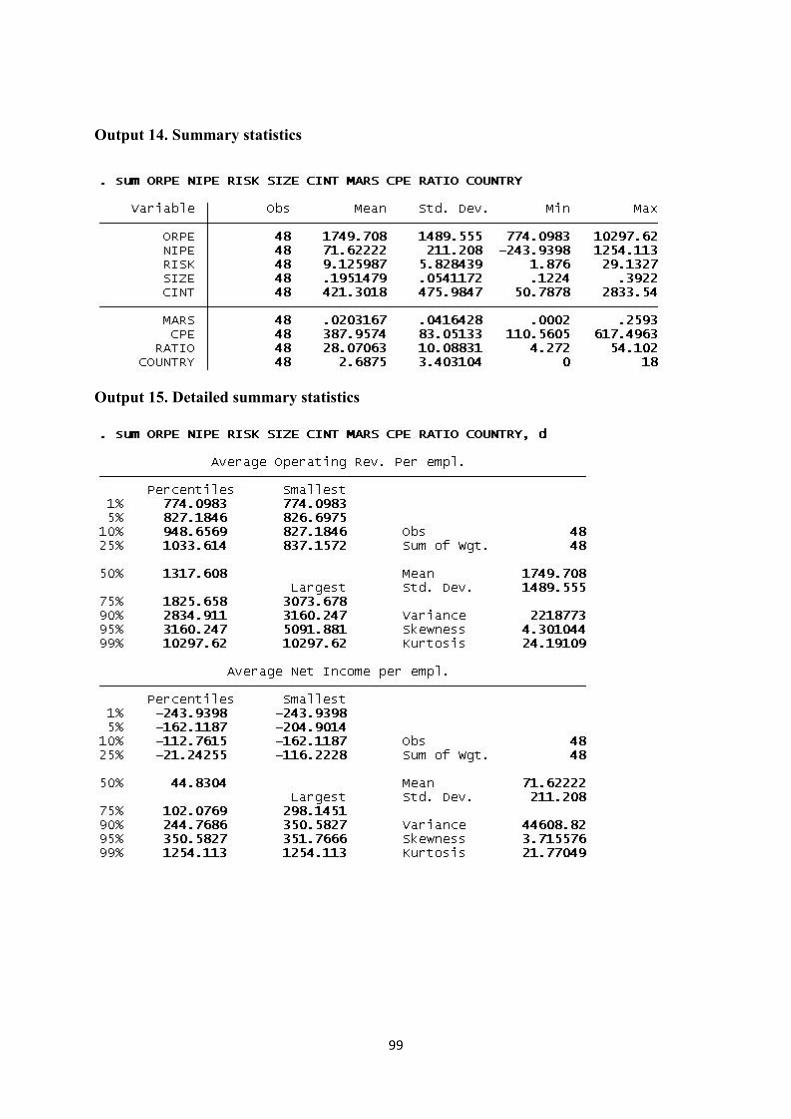
99
Output 14. Summary statistics
Output 15. Detailed summary statistics
100

101
Output 16. Correlations

102
Appendix 11. Industry comparisons of the 5 industries
Graph 1: Companies by industries
Graph 2: Average operating revenue per employee by industries
Graph 3: Average net income per employee by industries
Pharmaceutical Industry
7%
Food Industry
37%
Chemical Industry
13%
Furniture Industry
10%
Machinery Industry
33%
Number of Companies by Industry
Pharmaceutical
Industry
Food Industry
Chemical Industry
Furniture Industry
Machinery Industry
Industries 1,948.10 3,701.22 3,095.31 1,420.78 1,749.71
0.00500.00
1,000.001,500.002,000.002,500.003,000.003,500.004,000.00
Ope
rati
ng R
ev. p
er e
mpl
.
Average Operating Rev. per empl.
Pharmaceutical Industry
Food Industry
Chemical
Industry
Furniture
Industry
Machinery
Industry
Average N.I. per empl. 496.13 73.78 125.67 120.59 71.62
0.00100.00200.00300.00400.00500.00600.00
Net
inco
me
per e
mpl
.
Average Net Income per empl.

103
Graph 4: Average number of countries by industries
Graph 5: Average market shares by industries
Table 8: The sign of correlations among the variables
Corr. Pharma. Ind. Food Ind. Chemicals Ind. Furniture Ind. Machinery Ind. ORPE NIPE ORPE NIPE ORPE NIPE ORPE NIPE ORPE NIPE RISK - - - + - - + - - - SIZE + - + + + - - - - - CINT - + + + + + + + + + MARS + + - - + + + + + + CPE + - + + + + + + + + RATIO - - - + - - - - - - VI - + + - - + - - - - HI + + + + + + + - - - UR + - - + - - + - - + UD - - - - - - - + + + COUNTRY + + - - - - + + + +
Pharmaceutical
Industry
Food Industry
Chemical Industry
Furniture
Industry
Machinery
Industry
Average Num. Of Countries 17 3 6 2 3
0
5
10
15
20
Num
ber o
f Cou
ntri
es
Average Num. of Countries
Pharmaceutical
Industry* (4 years)
Food Industry
Chemical Industry
Furniture Industry
Machinery
Industry
Average Market Share 9.04% 1.77% 4.66% 5.66% 2.03%
0.00%
2.00%4.00%6.00%
8.00%10.00%
Mar
ket S
hare
Average Market Share

104
Graph 6: The pharmaceutical industry- operating revenue per employee and net income per employee comparison
Analysis VI HI UnRe. UnDiv. Average ORPE 1482,92 2247,45 2754,01 1662,66 Average NIPE 668,86 1053,20 450,92 125,34 Average MARS 0,08 0,02 0,22 0,04 Average COUNTRY 16 4 31 9
Graph 7: The food industry- operating revenue per employee and net income per employee comparison
Analysis VI HI UnRe. UnDiv. Average ORPE 4182,67 5016,02 3539,98 2724,06 Average NIPE 22,63 78,82 194,05 36,55 Average MARS 0,01 0,04 0,03 0,005 Average COUNTRY 3 2 7 2
VI HI UnRe. UnDiv.
Average ORPE 1482.92 2247.45 2754.01 1662.66
Average NIPE 668.86 1053.20 450.92 125.34
0.00
500.00
1000.00
1500.00
2000.00
2500.00
3000.00
Perf
orm
ance
Val
ues
Pharmaceutical Industry
VI HI UnRe. UnDiv.
Average ORPE 4182.67 5016.02 3539.98 2724.06
Average NIPE 22.63 78.82 194.05 36.55
0.00
1000.00
2000.00
3000.00
4000.00
5000.00
6000.00
Perf
orm
ance
Val
ues
Food Industry

105
Graph 8: The chemicals industry- operating revenue per employee and net income per employee comparison
Analysis VI HI UnRe. UnDiv. Average ORPE 2432,59 4132,93 2174,22 3046,18 Average NIPE 297,63 222,02 87,89 3,47 Average MARS 0,005 0,13 0,02 0,005 Average COUNTRY 2 6 11 4
Graph 9: The furniture industry- operating revenue per employee and net income per employee comparison
VI HI UnRe. UnDiv.
Average ORPE 2432.59 4132.93 2174.22 3046.18
Average NIPE 297.63 222.02 87.89 3.47
0.00500.00
1000.001500.002000.002500.003000.003500.004000.004500.00
Perf
orm
ance
Val
ues
Chemicals Industry
VI HI UnRe. UnDiv.
Average ORPE 1372.38 1603.82 1537.20 1362.87
Average NIPE 32.41 60.02 -124.85 258.41
-400.00-200.00
0.00200.00400.00600.00800.00
1000.001200.001400.001600.001800.00
Perf
orm
ance
Val
ues
Furniture Industry

106
Analysis VI HI UnRe. UnDiv. Average ORPE 1372,38 1603,82 1537,20 1362,87 Average NIPE 32,41 60,02 -124,85 258,41 Average MARS 0,041 0,19 0,05 0,027 Average COUNTRY 3 1 2 3
Graph 10: The machinery and equipment industry- operating revenue per employee and net income per employee comparison
VI HI UnRe. UnDiv.
Average ORPE 1485.90 1002.55 1527.34 2619.16
Average NIPE 20.22 -43.26 157.97 116.82
-500.00
0.00
500.00
1000.00
1500.00
2000.00
2500.00
3000.00
Perf
orm
ance
Val
ues
Machinery Industry
Analysis VI HI UnRe. UnDiv. Average ORPE 1485,90 1002,55 1527,34 2619,16 Average NIPE 20,22 -43,26 157,97 116,82 Average MARS 0,010 0,006 0,009 0,047 Average COUNTRY 1 4 2 4

107
Appendix 12. Differentiating the integration strategies for the whole sample
Graph 11: Vertical integration
Graph 12: Horizontal integration
Pharmaceutical
Industry
Food Industry
Chemical Industry
Furniture Industry
Machinery Industry
Average ORPE 1,482.92 4,182.67 2,432.59 1,372.38 1,485.90
Average NIPE 668.86 22.63 297.63 32.41 20.22
0.00500.00
1,000.001,500.002,000.002,500.003,000.003,500.004,000.004,500.00
Pref
orm
ance
Val
ues
VI by industry
Pharmaceutical
Industry
Food Industry
Chemical Industry
Furniture Industry
Machinery Industry
Average ORPE 2,247.45 5,016.02 4,132.93 1,603.82 1,002.55
Average NIPE 1,053.20 78.82 222.02 60.02 -43.26
-1,000.000.00
1,000.002,000.003,000.004,000.005,000.006,000.00
Perf
orm
ance
Val
ues
HI by industry
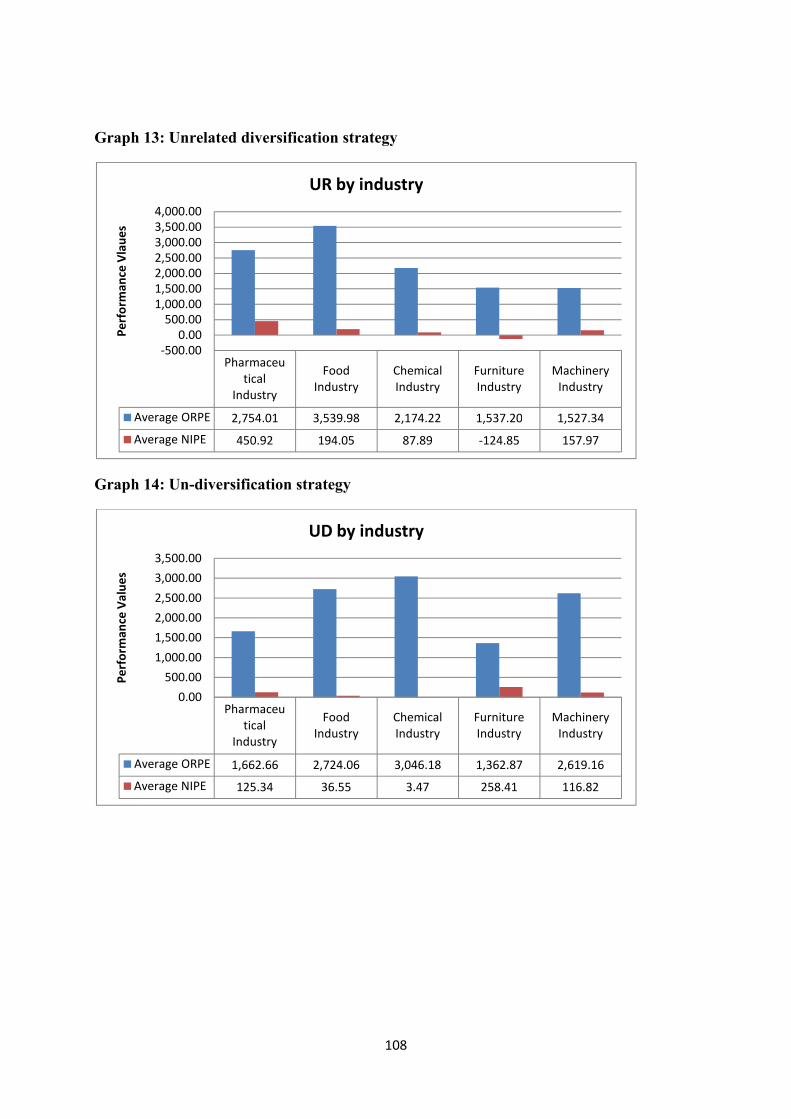
108
Graph 13: Unrelated diversification strategy
Graph 14: Un-diversification strategy
Pharmaceutical
Industry
Food Industry
Chemical Industry
Furniture Industry
Machinery Industry
Average ORPE 2,754.01 3,539.98 2,174.22 1,537.20 1,527.34
Average NIPE 450.92 194.05 87.89 -124.85 157.97
-500.000.00
500.001,000.001,500.002,000.002,500.003,000.003,500.004,000.00
Perf
orm
ance
Vla
ues
UR by industry
Pharmaceutical
Industry
Food Industry
Chemical Industry
Furniture Industry
Machinery Industry
Average ORPE 1,662.66 2,724.06 3,046.18 1,362.87 2,619.16
Average NIPE 125.34 36.55 3.47 258.41 116.82
0.00
500.00
1,000.00
1,500.00
2,000.00
2,500.00
3,000.00
3,500.00
Perf
orm
ance
Val
ues
UD by industry

109
Appendix 13. Concentration indices
Graph 15: Herfindahl index
Graph 16: Entropy measure
Pharmaceutical
Industry
Food Industry
Chemical Industry
Furniture Industry
Machinery Industry
Average HH index 0.3011 0.2552 0.4373 0.1641 0.1141
0.00000.05000.10000.15000.20000.25000.30000.35000.40000.45000.5000
HH
Inde
x
Average HH index
Pharmaceutical
Industry
Food Industry
Chemical Industry
Furniture Industry
Machinery
Industry
Average Entropy Measure 1.4888 2.1037 1.1176 1.7303 2.7795
0.0000
0.5000
1.0000
1.5000
2.0000
2.5000
3.0000
E M
easu
re
Average Entropy Measure

110
Graph 17: Concentration ratio (CR4)
Graph 18: Relative measure
Pharmaceutical Industry
Food Industry
Chemical Industry
Furniture Industry
Machinery Industry
CR4 Ratio 0.92 0.69 0.81 0.64 0.53
0.000.100.200.300.400.500.600.700.800.901.00
CR4
Rati
o
Average CR4 Ratio
Pharmaceutical
Industry
Food Industry
Chemical
Industry
Furniture
Industry
Machinery
Industry
Average Relative Measure 0.1353 0.0397 0.0588 0.1154 0.0591
0.00000.02000.04000.06000.08000.10000.12000.14000.1600
RE M
easu
re
Average Relative Measure

111
Appendix 14. Integration strategy comparison for the whole data
Graph 19: Average operating revenue per employee
Graph 20: Average net income per employee
VI HI UR UD
Average O.R. Per empl. 2,138.05 3,443.85 2,335.34 2,495.30
0.00500.00
1,000.001,500.002,000.002,500.003,000.003,500.004,000.00
Ope
rati
ng R
ev. p
er e
mpl
oyee
Average Operating Revenue per Employee
VI HI UR UD
Average N.I. Per empl. 139.21 95.26 167.25 88.86
0.0020.0040.0060.0080.00
100.00120.00140.00160.00180.00
Net
Inco
me
per e
mpl
oyee
Average Net Income per Employee

112
Graph 21: Average market share
Graph 22: Average number of countries
VI HI UR UD
Average Market Share 2.33% 5.12% 3.82% 2.13%
0.00%
1.00%
2.00%
3.00%
4.00%
5.00%
6.00%
Mar
ket S
hare
Average Market Share
VI HI UR UD
Average Num. Of Countries 4.04 3.31 7.55 3.37
0.001.002.003.004.005.006.007.008.00
Num
ber o
f Cou
ntir
es
Average Num. Of Countries

113
Appendix 15. Stata outputs for the manufacture of food products industry by simple OLS
Output 17. Regression output for ORPE as the dependent variable
Output 18. Regression output for NIPE as the dependent variable

114
Appendix 16. Stata output for the manufacture of food products industry by forward stepwise regression with interactive terms.
Output 19. Regression output for ORPE as the dependent variable

115
Output 20. Regression output with interaction effects by simple OLS (ORPE as the dependent variable)

116
Output 21. Regression output for NIPE as the dependent variable

117
Output 22. Regression output with interaction effects by simple OLS (NIPE as the dependent variable)
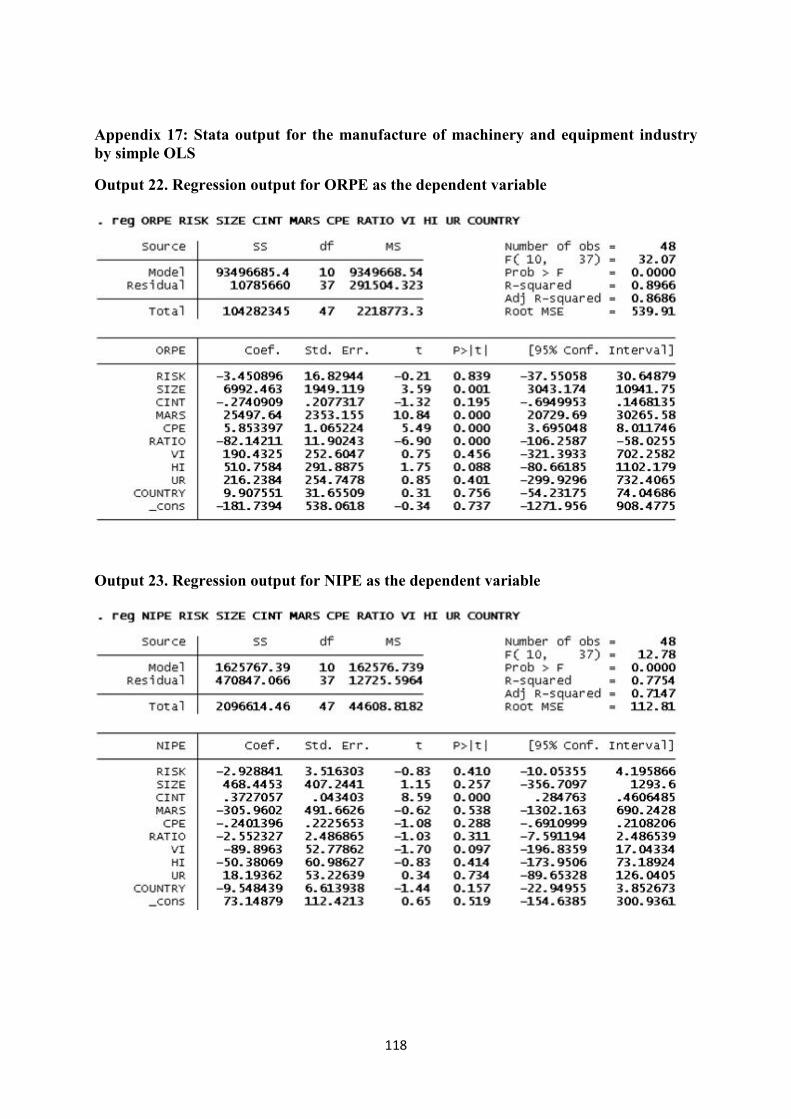
118
Appendix 17: Stata output for the manufacture of machinery and equipment industry by simple OLS
Output 22. Regression output for ORPE as the dependent variable
Output 23. Regression output for NIPE as the dependent variable

119
Appendix 18: Stata output for the manufacture of machinery and equipment industry by forward stepwise regression with interactive terms.
Output 24. Regression output for ORPE as the dependent variable

120
Output 25. Regression output with interaction effects by simple OLS (ORPE as the dependent variable)

121
Output 26. Regression output for NIPE as the dependent variable

122
Output 27. Regression output with interaction effects by simple OLS (ORPE as the dependent variable)