The Effects of Fair Trade Certification: Evidence From ... · The Effects of Fair Trade...
46
The Effects of Fair Trade Certification: Evidence From Coffee Producers in Costa Rica * Raluca Dragusanu † Nathan Nunn ‡ 20 January 2018 Abstract: We examine the effects of Fair Trade (FT) certification of coffee on producers and households in Costa Rica. Examining the production dynamics of the universe of Costa Rican coffee mills from 1999–2014, we find that FT certification is associated with a higher sales price, greater sales, and more revenues. As expected, these effects are greater when global coffee prices are lower and the FT guaranteed minimum price is binding. Looking at households, we find evidence that FT is associated with higher incomes for all families, but especially for those working in the coffee sector. However, we also find that, within this sector, the benefits are not evenly distributed. Farm owners and skilled workers benefit from FT, intermediaries are hurt, and hired unskilled workers are unaffected. Thus, although FT creates sizable benefits (on average), it also results in a redistribution from intermediaries to farmers. Lastly, we also find evidence of positive effects of FT certification on the education of high-school-aged children, which is most likely due to the presence of scholarship programs that are funded by FT premiums. Keywords: Fair Trade, poverty, education. JEL Classification: F14,F63,O13,O54. * We thank Marco Antonio Martinez del Angel and Stephanie Cappa for excellent research assistance, Eduardo Montero for helping to facilitate our field visit in Costa Rica, and ICAFE Costa Rica for sharing their data. We also thank Laura Alfaro, David Atkin, Dave Donaldson, Erica Field, Marc Muendler, Ben Olken, Nina Pavcnik, Andrea Podhorsky, and Christian Volpe, as well as seminar participants at MIT, the IADB, the LACEA-IDB TIGN Annual Conference, and the NBER ITI Summer Institute for valuable comments. † Harvard University, (email: [email protected]) ‡ Harvard University, NBER and BREAD. (email: [email protected])
-
Upload
trankhuong -
Category
Documents
-
view
214 -
download
1
Transcript of The Effects of Fair Trade Certification: Evidence From ... · The Effects of Fair Trade...

The Effects of Fair Trade Certification: Evidence From CoffeeProducers in Costa Rica*
Raluca Dragusanu† Nathan Nunn
‡
20 January 2018
Abstract: We examine the effects of Fair Trade (FT) certificationof coffee on producers and households in Costa Rica. Examiningthe production dynamics of the universe of Costa Rican coffee millsfrom 1999–2014, we find that FT certification is associated with ahigher sales price, greater sales, and more revenues. As expected,these effects are greater when global coffee prices are lower and theFT guaranteed minimum price is binding. Looking at households,we find evidence that FT is associated with higher incomes forall families, but especially for those working in the coffee sector.However, we also find that, within this sector, the benefits arenot evenly distributed. Farm owners and skilled workers benefitfrom FT, intermediaries are hurt, and hired unskilled workers areunaffected. Thus, although FT creates sizable benefits (on average), italso results in a redistribution from intermediaries to farmers. Lastly,we also find evidence of positive effects of FT certification on theeducation of high-school-aged children, which is most likely due tothe presence of scholarship programs that are funded by FT premiums.
Keywords: Fair Trade, poverty, education.
JEL Classification: F14, F63, O13, O54.
*We thank Marco Antonio Martinez del Angel and Stephanie Cappa for excellent research assistance, EduardoMontero for helping to facilitate our field visit in Costa Rica, and ICAFE Costa Rica for sharing their data. We alsothank Laura Alfaro, David Atkin, Dave Donaldson, Erica Field, Marc Muendler, Ben Olken, Nina Pavcnik, AndreaPodhorsky, and Christian Volpe, as well as seminar participants at MIT, the IADB, the LACEA-IDB TIGN AnnualConference, and the NBER ITI Summer Institute for valuable comments.
†Harvard University, (email: [email protected])‡Harvard University, NBER and BREAD. (email: [email protected])

1. Introduction
Fair Trade (FT) certification aims to offer ethically-minded consumers the opportunity to help lift
producers in developing countries out of poverty. The appeal of Fair Trade is reflected in the
impressive growth of Fair Trade certified imports over the past two decades. Since its inception
in 1997, sales of Fair Trade certified products (under Fair Trade Labelling Organization (FLO)
International / Fairtrade International) have grown exponentially. Today, there are over 1,200
FT-certified producer organizations worldwide representing over 1.4 million FT-certified farmers
and workers, located in 74 different countries (Fairtrade International, 2014). Despite the rapid
growth and pervasiveness of FT products, well-identified evidence of the effects of FT certification
remains scarce (Dragusanu, Giovannucci and Nunn, 2014). The question remains: does Fair Trade
really work? This study attempts to help answer this question by estimating the effects of FT
certification within the coffee sector in Costa Rica.
Fair Trade uses two primary mechanisms in an attempt to achieve its goal of improving the
lives of farmers in developing countries. The first is a minimum price that is guaranteed to be paid
if the product is sold as FT. This is meant to cover the average costs of sustainable production
and to provide a guarantee that reduces the risk faced by coffee growers. The second is a price
premium paid to producers. This premium is in addition to the sales price and must be set aside
and invested in projects that improve the quality of life of producers and their communities. The
specifics of how the premium is used must be reached in a democratic manner by the producers
themselves.
The primary issue one faces when attempting to convincingly identify a causal effect is the
fact that certification is endogenous. The primary concern is that mills may become certified
when they also obtain a lucrative long-term contract from a large buyer like Starbucks. To gain
a better understanding of the nature of selection into certification, in August of 2012, we visited
farmers from four FT-certified coffee mills to collect information on the factors that cause mills to
become FT certified. We found four common determinants of certification in our setting. First,
many mills in Costa Rica also operate stores that sell agricultural products, including certain
pesticides that could not be sold if FT certified. Thus, mills that obtain greater revenue from
selling banned chemicals are less likely to certify. Second, mills that forecast lower prices in the
future perceived a greater benefit from Fair Trade’s price floor, and thus were more likely to
1
join. Third, individual farmers who believed in environmental or socially responsible farming
practices were more likely to join. Finally, access to information about the logistics of becoming
certified and managerial ability were also important.
An important insight from our interviews is that all but the last of the determinants of
certification appear to be primarily time-invariant. Admittedly, knowledge about the logistics
of becoming certified could change very quickly. However, the other factors, like a farmer’s
ideology, the nature of his forecasts about the future, or the costs of certification, potentially
change more slowly and may be captured to a large extent by producer fixed effects. This
highlights the importance of estimates, like ours, that do not rely on cross-sectional variation
only. An additional insight is that the nature of selection appears ambiguous. While positive
selection likely arises from the last determinant (being informed), the nature of selection from
the other three is ambiguous. The existing evidence, although scarce, appears to suggest that
selection may, in fact, be negative (Saenz-Segura and Zuniga-Arias, 2009, Ruben and Fort, 2009,
2012).
Our analysis begins with an examination of the universe of coffee mills in Costa Rica, observed
annually over a sixteen year period (1999–2014). We start by examining the determinants of
selection into certification, using specifications that include mill fixed effects and year fixed
effects. We find no evidence that changes (or levels) of observable characteristics – namely, prices,
exports, domestic sales, total sales, or the share of exports in total sales – predict the adoption
of FT certification. This is consistent with the impression from our interviews that time-invariant
producer characteristics might be the primary determinant of selection into certification.
Our analysis then turns to an examination of the effects of FT certification. For part of our
period of analysis, 1999-2014, the guarantee minimum price was binding and for part it was not.
Therefore, we allow the effect of FT to differ depending on the extent to which price floor was
binding. Examining variation across coffee mills and years and using an estimating equation that
includes mill fixed effects and year fixed effects, we find that when the price floor is binding, FT-
certified producers sell their products at higher prices. Although this is found for both domestic
sales and exports, the effect is more precisely estimated for exports. We also find that when the
price floor is binding, the quantity of coffee sold by FT-certified mills is higher, as are their total
2

revenues.1
We then turn to the broader effects of FT certification, using household-level survey data. We
link the certification of cooperatives to households by constructing a measure of the share of
exports in a canton (an administrative region in Costa Rica) and a year that is from FT-certified
producers. This allows us to examine the relationship between this measure and household
incomes. Since one of the explicit goals of FT is to set aside funds for community projects, it is
likely that households not directly involved in coffee production, but living in the same canton,
may also benefit from an increase in Fair Trade certification. Thus, our regressions also allow for
the presence of spatial spillovers by estimating the effects of FT certification on all households
in a region, including those not employed in the coffee sector. All empirical specifications
examine household-level data collected annually from 2001–2009. The regressions, which are
at the household level, include canton fixed effects, year fixed effects, and the following controls
for characteristics of the household head: occupation, industry of employment, age, gender, and
education.
We find evidence of sizable positive spillovers. Those not employed in the coffee sector, but
living in cantons during years with more FT certification, have higher incomes. Although the
spillover effects are smaller in magnitude than the direct effects, they are still sizable. For example,
a one-standard-deviation increase in FT-certification intensity is associated with a 3.5% increase
in the average income of all individuals in the canton. We also find additional benefits for those
who work in the coffee sector, although there is significant heterogeneity. On average, greater FT
certification leads to an increase in income to those in the coffee industry (beyond the spillover
benefits described above). This increase is concentrated among skilled coffee growers, who
account for 43.5% of those employed in the coffee sector. For this group, a one-standard-deviation
increase in FT-certification intensity is associated with a 7.7% increase in average incomes (in
addition to the 3.5% felt by all). The unskilled workers, who comprise 49.8% of those in the
coffee sector, do not receive any additional benefits (beyond the benefits felt by all). Those
working in non-farm occupations in the coffee sector (e.g., intermediaries and others who are
responsible for transportation, storage, and sales), and who account for 6.7% of those in coffee,
are hurt significantly by FT. For this group, a one-standard-deviation increase in FT intensity is
1As we explain in detail, the greater quantity is most likely due to the price floor inducing FT-certified farmers tosell more of their coffee as FT through the FT-certified mill, rather than as conventional through a conventional mill.
3

associated with a 3.9% decrease in average incomes (net of the positive spillover effects). Since
non-farm workers have incomes that are approximately 50% higher than the skilled farmers, a
result of FT is that it decreases income inequality within the coffee sector by transferring rents
from intermediaries to farmers. This is one of the stated goals of Fair Trade in general.
Motivated by the fact that within Costa Rica, cooperatives commonly use FT premiums for the
building of schools, the purchase of materials, and the provision of scholarships, we also examine
the effect of FT certification on education as measured by the enrollment of school-aged children.
Our estimates show that FT certification has no effect on the enrollment of elementary-school
children (aged 7–12), a result that is not surprising given that elementary-school enrollment rates
in Costa Rica are close to 99%. However, we find that FT certification is associated with higher
school enrollment for high-school students (aged 13–17). This is true both for children whose
parents work within coffee and whose parents do not. According to the estimates, a one-standard-
deviation increase in FT-certification intensity is associated with a 2 to 5 percentage-point increase
in the probability of school enrollment. Consistent with the estimated effects of FT on the incomes
of non-farm workers (e.g., intermediaries, etc) in the coffee sector, we find that the enrollment of
their children is adversely affected by FT.
Our findings complement a small number of existing studies that attempt to identify the
causal effects of FT. Most existing studies rely on cross-sectional comparisons from moderately
sized surveys. For example, Mendez, Bacon, Olson, Petchers, Herrador, Carranza, Trujillo,
Guadarrama-Zugasti, Cordon and Mendoza (2011) compare 469 households from 18 different
cooperatives in four Latin American countries, Bacon (2005) compares 228 coffee farmers from
Nicaragua, and Weber (2011) surveys 845 farmers from Southern Mexico. All three studies
observe one cross-section. A number of studies have used matching techniques to obtain more
credible causal estimates from cross-sectional data. These include Beuchelt and Zeller (2011), who
examine 327 farmers in Nicaragua, and Ruben and Fort (2009) and Ruben and Fort (2012), who
study 360 farmers from six coffee cooperatives in Peru.
Our estimates complement and improve upon the existing evidence in a number of ways. First,
rather than relying on cross-sectional comparisons, we provide estimates based on changes over
time. For example, our mill-level analysis is based on an estimating equation that include mill
fixed effects (as well as time period fixed effects). The mill fixed effects absorb average differences
between the mills in our sample. Therefore, unlike existing studies, our estimates are not derived
4

from cross-sectional differences. We also complement the existing evidence by testing for spillover
benefits of FT. Given that an intended goal of FT is to improve the economic conditions of local
communities, these benefits are potentially important. Not accounting for them may significantly
understate the benefits of Fair Trade. It not only leads one to ignore the potentially important
spillover benefits of Fair Trade, but it also causes a downward bias in the estimated effect of FT
certification on producers because the control group also benefits.2
The findings here also complement the recent qualitative analysis of Ronchi (2002) that ex-
plores the effects of FT in Costa Rica. In 1999, Ronchi (2002) conducted interviews of farmers in
FT-certified cooperatives in Costa Rica in an attempt to assess the impacts of FT on the farmers.
She found that while most farmers reported having higher standards of living and being able
to provide more education for their children since the introduction of FT certification ten years
earlier, none of the respondents identified Fair Trade as the source of this improvement. It is
possible that these improvements reflected more general trends among all farmers in the coffee
sector. However, it is also possible that they were due to FT, but that this was not recognized by
the farmers. One does not need to be aware of effects for them to work. Our empirical approach
complements this descriptive analysis by providing quantitative estimates of the effects of FT
certification within the coffee sector in Costa Rica in the period immediately following Ronchi’s
(2002) study.
Lastly, our findings contribute a better understanding of how international trade can affect
income and education in developing countries. Our findings complement previous studies
showing the effects that conventional exports can have in developing countries (e.g., Topalova,
2007, Edmonds, Pavcnik and Topalova, 2010, McCaig, 2011, Brambilla, Porto and Tarozzi, 2012).
Our findings highlight the benefit to producers of labels that provide greater information to
consumers about the nature of the production process. As has been shown by a number of
experiments, consumers are willing to pay significantly more for coffee that was produced in a
manner consistent with FT certification (e.g., Arnot, Boxall and Cash, 2006, Hiscox, Broukhim and
Litwin, 2011, Hainmueller, Hiscox and Sequeira, 2015).
The paper is organized as follows. In the following section, we provide background informa-
tion about Fair Trade certification and coffee production in Costa Rica. In section 3, we examine
2See Miguel and Kremer (2004) for a well-known example of this, although looking at the effect of a large-scalehealth intervention on educational outcomes.
5

effects at the mill-level and test for selection into certification. In section 4, we then examine the
effects of FT certification at the household level, examining effects on adult incomes and school
enrollment of children. Section 5 concludes.
2. Background
A. Fair Trade Certification
Fair Trade has its origins in an initiative started in the Netherlands by a church-based NGO in
1988 in response to low coffee prices. The stated aim of the initiative was to ensure growers were
provided “sufficient wages”. The NGO created a fair trade label for their products called Max
Havelaar, named after a fictional Dutch character who opposed the exploitation of coffee pickers
in Dutch colonies. Over the next half decade, Max Havelaar was replicated in other European
countries and in North America. As well, similar organizations, such as TransFair, emerged. In
1997, various labeling initiatives formed an umbrella association called the Fair Trade Labelling
Organization International (FLO), and in 2002, the FT Certification mark was launched.
The stated goal of Fair Trade is to improve the living conditions of farmers in developing
countries. In practice, this is accomplished through two primary mechanisms. The first is
a guaranteed minimum price for all coffee that is sold as Fair Trade, which is set by the Fair
Trade Labelling Organization (FLO). The minimum price is meant to cover the average costs of
sustainable production and to provide a guarantee that reduces the risk faced by coffee growers.
FT buyers must always pay producers at least the minimum price regardless of what the market
price is at the time. Currently, the minimum price (for conventional Arabica washed coffee) is
set at $1.40 per pound. For organic coffee, it is $0.30 more, and for unwashed coffee it is $0.05
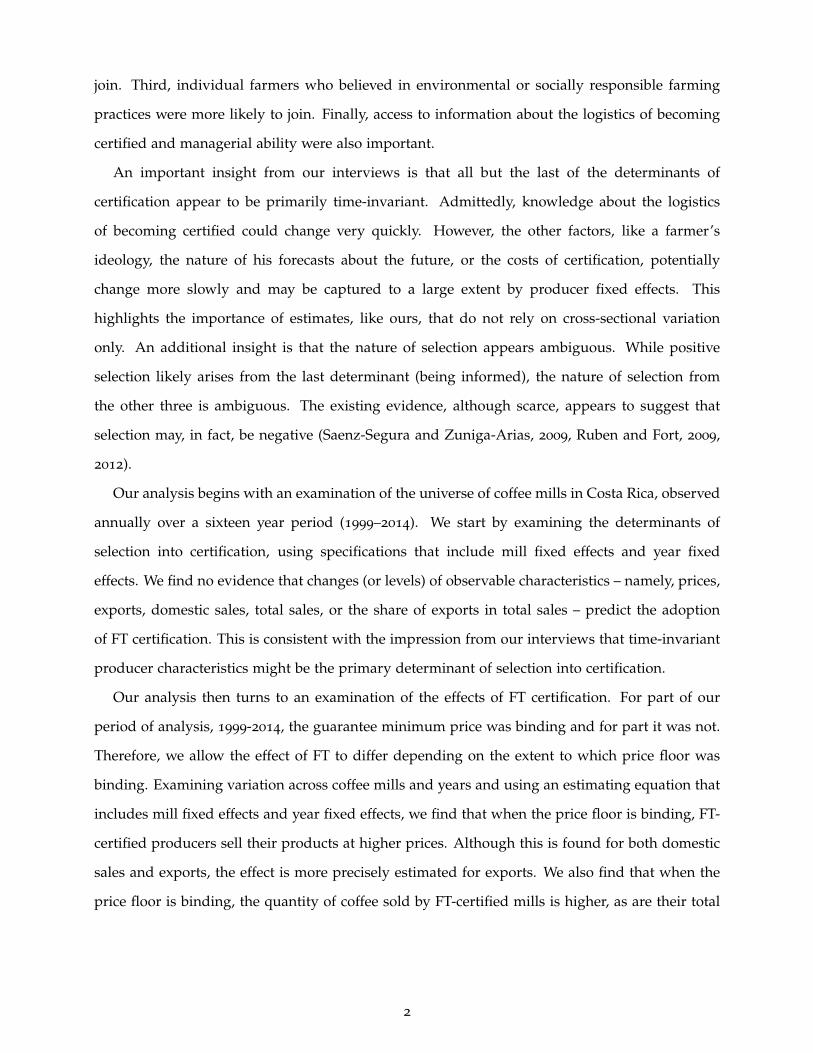
less. The relationship between the minimum FT price and market prices between 1989 and 2014
is shown in Figure 1, which is taken from Dragusanu et al. (2014). As shown, for a significant
portion of the past 25 years the price floor has been binding. In addition, for much of our sample
period, which starts in 1999, the price floor has been binding.
The second component of FT is a price premium that is paid to producers. The premium,
which is currently set at $0.20 per pound, is in addition to the sales price and must be set aside
and invested in projects that improve the quality of life of producers and their communities. The
specifics of how the premium is to be allocated is supposed to be determined in a democratic man-
6

4 Journal of Economic Perspectives
as Fair Trade is indeed sold as such. Just producing and certifying a product does not guarantee that a buyer will purchase it as Fair Trade and provide the associ-ated benefits and price. The relationship between the guaranteed minimum price and the market price between 1989 and 2014 is shown in Figure 1. Although in recent years, the market price of coffee has usually been higher than the Fairtrade minimum price, data from the price crashes of the late 1990s and early 2000s indicate that the price floor can provide significant risk protection to farmers who sell their coffee as Fair Trade certified.
2) Fair Trade premium. Another important characteristic is a price premium, often termed the community development or social premium. This is paid by the buyer to the supplier or cooperative organization in addition to the sales price. Prior to 2008, for coffee, this premium was set at 10 cents per pound but is now 20 cents per pound with 5 cents earmarked for productivity improvement. The premium is designed to foster the associativity and democratic process that are tenets of the Fair Trade philosophy. The specifics of how the premium is to be used must to be decided in a democratic manner by the producers themselves. Projects that are typically funded with the Fair Trade premium include investments made to increase farmer produc-tivity; investments in community infrastructure such as the building of schools, health clinics, and crop storage facilities; offering training for members of the community; the provision of educational scholarships; improvements in water treatment systems; conversion to organic production techniques; and so on.
F1
Figure 1 Comparision of Fairtrade Market Prices for Coffee, 1989–2014
Source: © Fairtrade Foundation, adapted and used with permission.Notes: NB Fairtrade Price = Fairtrade Minimum Price* of 140 cents/lb + 20 cents/lb Fairtrade Premium.** When the New York prices is 140 cents or above, the Fairtrade Price = New York price + 20 cents. The New York Price is the daily settlement price of the 2nd position Coffee C Futures contract at ICE Futures US. * Fairtrade Minimum Price was increased on June 1, 2008, and April 1, 2011. ** Fairtrade Premium was increased on June 1, 2007, and April 1, 2011.
0
40
80
120
160
200
240
280
320
360
US
cen
ts/l
b
1989 Collapse ofInternationalCoffee Agreement
30-year low (2001)
1989 1992 1999 2002 2006 2014 1996
30-year high (2011)
2010
FairtradeNew York Market
j_dragusanu_263.indd 4 5/9/14 2:12 PM
Figure 1: The Fair Trade minimum coffee price, 1989–2014
ner by the producers themselves. Potential projects that could be funded with the FT premium
include the building of schools and health clinics, offering instruction courses to members of
the community, provision of educational scholarships, investments in community infrastructure,
improvements in water treatment systems, improved production practices, including conversion
to organic production and the implementation of environmentally responsible production. For
example, Ronchi (2002, pp. 19–20) documents an example of the Costa Rican cooperative Coope
Llano Bonito using the premiums to hire a full time agricultural technician to help with such
objectives. As of 2011, FLO explicitly mandates that five cents of the premium must be invested
towards improving the quality and/or productivity of coffee.
For coffee to be sold under the FT mark, all actors in the supply chain, including importers and
exporters, must obtain FT certification. On the production side, the certification is open to small
farmer organizations and cooperatives that have a democratic structure, as well as commercial
farms and other companies that employ hired labor (Fair Trade Foundation, 2012). The certifi-
cation entails meeting specific standards that are set and maintained by FLO. An independent
certification company FLO-CERT (which became independent from FLO International in 2004) is
7

in charge of inspecting and certifying producers (Fair Trade Foundation, 2012).
For coffee, the FT compliance criteria focus on the social, economic, and environmental
development of the community. In terms of social development, the producer organization must
have a democratic structure, transparent administration, and must not discriminate against its
members. To satisfy the economic development criteria, organizations need to be able to effec-
tively export their product and administer the premium in a transparent and democratic manner.
The environmental development criteria are meant to ensure that the members work towards
including environmental practices as an integral part of farm management, by minimizing or
eliminating the use of certain fertilizers and pesticides and replacing them with more natural
biological methods that help ensure the health and safety of the cooperative members and their
communities (Fair Trade Foundation, 2012). In the case of commercial plantations that employ a
large number of workers, the FT standards entail that hired workers are not children or forced
workers, and are free to bargain collectively. Hired workers must be paid at least the minimum
wage in their region, and they must also be given a safe, healthy, and equitable environment (Fair
Trade Foundation, 2012).
To obtain FT certification, producer organizations need to submit an application with FLO-
CERT. If the application is accepted, the organization goes through an initial inspection process
carried out by one of the FLO-CERT representatives in the region. If the minimum requirements
are met, the organization is issued a certificate that is usually valid for a year. The certificate can
be renewed following re-inspection. Initially, inspection and certification were free of charge until
2004. Since then, producer organizations have had to pay fees associated with applications, initial
certifications, and certification renewals.
B. Coffee Production in Costa Rica
Costa Rica is the world’s 14th largest producer of coffee, with production totaling 1.49 million 60-
kilogram bags of coffee in 2016-2017 (International Coffee Organization, 2017). The agro-climatic
conditions in this area, and to a large extent in the rest of the country are characterized by volcanic
soils, high elevation, warm temperatures that stay relatively constant throughout the year, and
climates with distinct wet/dry seasons, which have been very favorable for coffee cultivation
(Instituto del Café de Costa Rica, 2017b). Coffee cultivation started to develop after independence
from Spain in 1821 and the first coffee plantations were situated in the Central Valley, which is
8

the area surrounding the capital San Jose. Today, coffee tends to be cultivated on small plots in
family farms: 92 percent of coffee farmers have plots that are less than 5 hectares and 6 percent
have plots that are between 5 and 20 hectares (Instituto del Café de Costa Rica, 2017a).
During the harvest season, which generally lasts from December to April, coffee farmers
deliver the cherries to a collection center belonging to a local mill (called beneficio) for processing.3
The pulp of the cherries is removed and the beans are washed. The resulting product is called
parchment coffee. The mills then sell the parchment coffee to exporters and domestic roasters.
Exporters are specialized domestic firms who aggregate purchases from multiple mills and sell
them to foreign buyers. In many cases, mills and coops have their own export arm. In addition
to coffee processing services, cooperatives also provide a range of services to their members such
as the provision of agricultural supplies, technical assistance, marketing assistance, and credit.
Coffee processing and sales in Costa Rica are regulated through Law no. 2762, which was
adopted in 1961, and is more commonly referred to simply as the ‘Coffee Law’. The purpose of
the law was “to establish an equitable regime to regulate the relations between coffee producers,
mills, and exporters that guarantees a rational and truthful participation of each sector in the
coffee business” (Instituto del Café de Costa Rica, 2017c). The Costa Rican government established
a non-governmental agency called Instituto del Café de Costa Rica (ICAFE) to implement and
enforce the provisions of the Coffee Law.
The process of the sale of coffee is as follows. Farmers deliver their harvested coffee cherries
to the mill. At this point, they receive an advance payment which is determined using the
world coffee prices that are prevailing at the time. Historically, the advance payment has been
approximately two thirds of the total payment that the producer eventually receives. Every 15
days, mills must report the amount of coffee received to ICAFE.
Mills then sell the parchment coffee to exporters and domestic buyers. All coffee sales are
registered and must be approved by ICAFE. The contract price must be equal to or above the
world coffee price, plus a differential which is set in advance by ICAFE based on four different
coffee attributes (five categories, eight types, seven qualities, and six preparations). From January
to October, mills make trimestrial payments to producers. These payments are defined by ICAFE
according to each mill’s sales.
3Cooperative members generally take the cherries to be processed at their cooperative mill, although they are freeto sell their cherries to others mills.
9

At the end of the harvest year, after all coffee has been sold, mills pay producers a final
liquidation payment. The ICAFE Liquidation Board calculates a liquidation price for each mill
which is equal to total mill sales minus each mill’s expenses and profits divided by the amount of
green coffee received. The total payment to a producer is equal to the mill liquidation price times
the amount of coffee received from that producer. Each mill needs to submit detailed expenses
to ICAFE for approval. Historically, mill profits have been approximately 9% of total mill sales.
The final liquidation prices for each mill must be published in Costa Rica’s main newspapers
in November, and the mill must pay producers the balance of their payment within eight days.
Historically, producers have received approximately 80% of the final coffee price.
There are a number of ways that FT could affect the incomes of farmers in this setting. First,
coffee that is sold as FT will have a higher sales price, particularly during periods in which the
price floor is binding. In addition, farmers who belong to an FT-certified cooperative that also
owns its own mill will also obtain a share of the mill’s profits. Furthermore, if the cooperative
also registers as an exporter, then the export mark-up (which is about 2.5% of the coffee price)
will also go to the cooperatives (and its members). Thus, we expect FT to potentially have two
primary effects. It provides a higher final sales price and it helps farmers to capture a larger share
of the final price.
C. Anecdotal Evidence on Selection into Fair Trade Certification
The central issue for the empirical analysis is the nature of selection into certification. Specifically,
a natural question to ask is: if FT has benefits, why aren’t all mills FT certified? To better
understand the source of variation underlying FT certification, we undertook interviews with
four FT-certified cooperatives in August of 2012. The interviews revealed a number of factors that
underlie variation in certification status for Costa Rican coffee producers.4
While FT has benefits it also has costs and mills vary in the effective costs that FT imposes
on them. Several cooperatives mentioned an important cost of FT being the potential loss
that they would suffer due to FT requirements that prevent them from selling certain products
– primarily pesticides – in their stores. Many mills operate a store where they sell various
agricultural supplies to the community. The extent to which a mill earns revenue from the sale
of agricultural chemicals banned by FT affects its costs of certification. If this characteristic is
4For an earlier case study of FT-certified coffee cooperatives in Costa Rica, see Sick (2008) and Ronchi (2002).
10
historically determined and varies little over time, it will be captured by the mill fixed effects in
our empirical analysis.
In addition, the perceived benefits of FT certification also vary by mill. One of the primary
benefits of FT sales is the existence of a guaranteed minimum price. The expected future benefit
of this depends on the farmer’s belief about future prices. Those farmers that expect the future
price of coffee to be above the minimum price perceive lower benefits to FT certification than
farmers who believe future coffee prices may drop below the minimum. We also learned that
the values and beliefs of farmers play an important role. Farmers who a priori believe in the
importance of environmentally sustainable or socially responsible farming practices will be more
willing to undertake the changes in production dictated by FT certification. Both of these factors,
although important determinants of the timing of certification, are most likely time-invariant and
can be accounted for by mill fixed effects in our panel setting.
The final factors that were mentioned were access to information about the certification re-
quirements and the managerial ability that is needed to satisfy the requirements. These factors
potentially vary over time and may be correlated with other factors that also affect our outcomes
of interest. For example, improvements in management or in international sales connections may
affect FT certification, but may also be independently affect the economic outcomes of interest.
A final insight that we gained from our interviews is that the nature of selection appears
ambiguous. While positive selection likely arises from the last determinant (being informed),
the nature of selection from the last three is ambiguous. In addition, participants of the inter-
views typically described FT as a strategy that is often pursued by producers who would have
difficulty selling their coffee otherwise. This suggests, that selection might be negative. The
existing evidence, although scarce, appears to suggest that, on net, selection may be negative.
Saenz-Segura and Zuniga-Arias (2009) examine a sample of 103 coffee producers in Costa Rica
and find a very strong negative relationship between Fair Trade certification and experience,
education, and income. Negative selection was also found by Ruben and Fort (2012) in their
study of 360 Peruvian coffee farmers (also see Ruben and Fort, 2009). In their sample, farmers
that are less educated and own smaller farms are more likely to become certified.
The fact that many of the important determinants of certification are likely time invariant
highlights the importance (and benefit) of estimates that do not rely on cross-sectional variation
only. Thus, it is important that our analysis examines a panel of producers and is able to account
11

for producer fixed effects.
3. Producer-level analysis
To construct the data necessary to examine the effects of FT certification on coffee producers we
combine two types of data. The first is information on coffee prices and quantities sold by mills
and cooperatives. These are provided by ICAFE by aggregating the individual transaction-level
data from the sale contracts between mills and buyers (exporters and domestic roasters). The
data contains information on total production (total coffee received for wet-milling from coffee
growers in that year’s harvest), disaggregated by the quantity sold to exporters and the quantity
sold to domestic buyers. The data also include average prices obtained for the coffee sold to
exporters and domestic buyers.5
Since ICAFE does not collect information on the sales of coffee disaggregated by
FT/conventional status, we are only able to identify which cooperatives are FT certified. This
information is obtained from multiple sources. The main source comes from FLO certification
rosters which are available to us from 2003 until 2011 and which contain the name and date
of certification for all producer-organizations. From these we extract the names of certified
coffee producers in Costa Rica and create an FT-certification indicator variable that equals one
in the years in which a mill is FT certified and zero otherwise. Since official certification rosters
from FLO are not available to us prior to 2003 or after 2011, we have supplemented this with
records from the mills listed by FLO-CERT as being FT certified to determine their initial date of
certification. We link the information on a mill’s certification status with the ICAFE data using
the name of the producer organization, which is reported in both sources of data. The matched
data results in an unbalanced panel of 332 coffee mills that are observed annually from 1999 until
2014.
A. Checking for evidence of selection into certification
Before turning to an examination of the effects of FT certification on producers, we first consider
the issue of selection into certification. To assess the importance and nature of selection, we check
whether, when conditioning on time-invariant producer characteristics, time-varying producer
5The ICAFE data are recorded by harvest years (rather than calendar years), which range from October to October.In our data, an observation in year t corresponds to the harvest which is from October in year t− 1 to October in yeart.
12

characteristics predict the onset of Fair Trade certification. That is, we check whether there is a
significant increase in production, exports, or sales prices just prior to the onset of certification.
If so, then this is evidence that an omitted time-varying factor, like a new contract to supply
an overseas buyer, is causing the producer to become certified. We examine this by estimating
the following equation where the dependent variable is an indicator variable for the onset of FT
certification:
IOnseti,t = αi + αt + β1 Xi,t + εi,t, (1)
where i indexes a coffee mill and t years (1999–2014). IOnseti,t is an indicator variable that equals
one if period t is the first year that producer i is FT certified. αi denotes mill fixed effects and αt
denotes year fixed effects. Mill fixed effects control for time-invariant characteristics, like those
discussed in section 2C, that may affect the timing of FT certification.
The variable Xi,t denotes an observable characteristic that may predict the onset of certification,
either domestic sales, exports, total sales, exports as a share of total sales, domestic prices, or
export prices. We measure each in two ways. The first is with a one year lag (e.g., in period
t− 1), which tests whether the value of the variable in the previous year predicts the onset of
FT certification. The second measure is the growth rate of each variable during the previous two
years (e.g., between periods t− 2 and t). This checks whether the onset of certification is preceded
by exceptionally high rates of growth in sales, exports, or prices.
The estimates are reported in Table 1. Panel A reports the coefficients for the variables
measured as a one-year lag of their levels and panel B reports the coefficients for the variables
measured by their two-year growth rates. For both sets of variables, we are interested in
whether we observe a positive relationship between the independent variables and the onset
of certification. We find no evidence of such an effect. All twelve reported coefficients are not
statistically different from zero, and all twelve have very small point estimates. In addition, the
coefficients are as frequently negative as they are positive. Thus, we find no evidence for positive
selection of producers into FT certification.
B. Effects of FT certification on producers
We now turn to an examination of the estimated effects of FT certification on coffee producers.
Our analysis examines a range outcomes. Since the primary mandate of FT is to ensure higher
and more stable prices to certified farmers (through the premium and price floor), our primary
13

Table 1: Determinants of FT Certification
lndomesticsales lnexports lntotalsales
Exportsasashareoftotal
saleslndomestic
pricelnexportprice
(1) (2) (3) (4) (5) (6)
Oneyearlaggedcharacteristic 0.00023 -0.00118 -0.00114 0.00025 0.00687 -0.00848(0.00105) (0.00151) (0.00144) (0.00501) (0.00759) (0.00806)
YearFE,MillFE Y Y Y Y Y YObservations 1,765 1,742 1,825 1,825 1,765 1,742R-squared 0.082 0.083 0.082 0.082 0.082 0.083
Prior2-yeargrowth(t -2tot ) -0.00078 0.00089 -0.00073 0.00527 0.00130 0.00741(0.00080) (0.00132) (0.00132) (0.00455) (0.00643) (0.01070)
YearFE,MillFE Y Y Y Y Y YObservations 1,410 1,412 1,484 1,484 1,440 1,445R-squared 0.089 0.088 0.088 0.088 0.088 0.089
Dependentvariable:IndicatorfortheonsetofFTcertification
Characteristicforindependentvariable:
PanelA:Certificationonsetandlaggedcharacteristics
PanelB:Certificationonsetand2-yeargrowthofcharacteristics
Notes : Coefficientsarereportedwith standard errorsclusteredat themill level in parantheses. All regressions include year fixed effectsand mill fixed effects. The dependent variable is an indicator variable that equals one in the first year of Fair Trade certification.Theindependent variable reported in Panel A is the lag of the characteristic reported in the column heading. The independent variable inpanel B is the growth of the characteristic from period t -2 to period t . ***, **, and * indicate significance ath the1, 5, and 10 percentlevels.
outcome of interest is the sales price of coffee. In addition, we examine the quantity of coffee
purchased and sold by mills, as well as total revenues.
Although we examine a range of different outcomes, throughout our analysis we place
particular importance on price as an outcome. This is because the interpretation of the effects
on quantities (and therefore revenues) is complicated by the fact that farmers belonging to an
FT-certified cooperative are not obligated to only bring the coffee cherries for processing to the
FT-certified cooperative to which they are a member. They can, and often do, sell to other nearby
mills. (As we explain in more detail below, because coffee cherries spoil very quickly and must
be processed within days, the primary consideration is that the mill must be very close by.) Thus,
it is difficult to interpret estimated effects of FT on the quantity of coffee sold by the mill. By
contrast, sales prices tell us the effect of FT certification on the price of coffee sold by that mill.
We begin with the following equation:
yi,t = αi + αt + β IFTi,t + εi,t, (2)
where i indexes a coffee mill and t years (1999–2014); yi,t denotes an outcome of interest; IFTi,t
is an indicator variable that equals one if mill i is FT certified in year t; and αi and αt denote
14

mill fixed effects and year fixed effects, respectively. Mill fixed effects control for time-invariant
characteristics, like those discussed in section 2C, that may be correlated with the timing of FT
certification. The coefficient β captures the average effect of FT certification on the outcomes of
interest.
Given the nature of FT certification, we do not expect certification to have the same effect in
all years. Through its guarantee minimum price, FT should have a greater effect in periods when
the coffee price is lower than the price floor and the FT minimum price is binding. To capture
this, we also estimate a second specification:
yi,t = µi + µt + γ1 IFTi,t + γ2 I
FTi,t · I
p<pt + εi,t, (3)
where Ip<pt is an indicator variable that equals one if the world coffee price is below the minimum
FT price at any point during the year. During our sample period, 1999–2014, the world price of
coffee was below the FT minimum price for nine years, and thus Ip<pt equals one during these
periods.
We also estimate a third specification, where we replace the indicator variable Ip<pt with a
continuous measure of the size of the price gap, PGapt . The variable is equal to the FT minimum
price minus the world price in years in which the price floor is binding. In years when it is not
binding, the variable takes on the value of zero i.e., PGapt = min{0, p− p}. Thus, the variable
measures the increase in price that the FT minimum price provides if coffee is sold as FT. The
revised estimating equation is:
yi,t = ζi + ζt + φ1 IFTi,t + φ2 I
FTi,t · P
Gapt + νi,t. (4)
In equations (3) and (4), the coefficients γ2 and φ2 capture the insurance benefits of FT certification
that are obtained when the world price of coffee falls below the FT floor. The coefficients γ1 and
φ1 capture the average effect that FT provides, even when the world price is above the price floor.
These should capture the benefits of the FT price premium, which producers receive whether or
not the price floor is binding.
Our primary outcome of interest is the average price that producers receive for their coffee.
Given that the stated intention of FT certification is to provide insurance and higher prices to
certified producers, we expect a positive effect of FT certification on prices. We measure prices
in two ways. The first is to use actual prices but winsorized at the 99th percentile. Due to mea-
15

Table 2: The Effect of FT Certification on Sales Prices
(1) (2) (3) (4) (5) (6) (7) (8) (9) (10) (11) (12)
FairTradeCertified,FTC -0.0244 -0.0393 -0.0310 0.0008 -0.0161 -0.0104 -0.0197 -0.0401 -0.0274 0.0204 0.0095 0.0153(0.0241) (0.0266) (0.0251) (0.0379) (0.0400) (0.0393) (0.0288) (0.0313) (0.0294) (0.0246) (0.0252) (0.0251)
FTCxPriceGapIndicator 0.0535 0.0609 0.0738*** 0.0397**(0.0346) (0.0383) (0.0220) (0.0195)
FTCxPriceGap(USD/lb) 0.1030 0.1750 0.1210* 0.0809(0.0795) (0.1270) (0.0618) (0.1010)
16YearFE Y Y Y Y Y Y Y Y Y Y Y YMillFE Y Y Y Y Y Y Y Y Y Y Y YObservations 2,038 2,038 2,038 2,038 2,038 2,038 2,000 2,000 2,000 2,000 2,000 2,000Numberofclusters/mills 307 307 307 307 307 307 307 307 307 307 307 307
Meanofdep.variable 1.14 1.14 1.14 -0.03 -0.03 -0.03 1.48 1.48 1.48 0.30 0.30 0.30Std.dev.ofdep.variable 0.63 0.63 0.63 0.61 0.61 0.61 0.63 0.63 0.63 0.43 0.43 0.43
Dependentvariable:
Notes : The table reports OLS estimates of equations (1)-(3). An observation is a mill-year. Each specification contains mill and year fixed effects. The dependent variable in columns 1-3 is thedomesticpricecalculated as theaveragepriceobtainedbyamill in a given year for the domesticcoffee sales transactions and expressed inUSD/lb. The domestic pricewas winsorizedat the99thpercentile. The dependent variable in columns 4-6 is the natural logarithm of the non-winsorized domestic price. The dependent variable in columns 7-9 is the export price calculated as theaverage priceobtained bya mill in agiven yearin export coffee sales transactions and expressed inUSD/lb. The export pricewas winsorised at at the 99thpercentile. The dependent variable incolumns 10-12 is the natural logarithm of the non-winsorized export price.The PriceGap Indicator equals 1 in years in whichthe world price forArabica coffee is below the FairTrademinimumprice. The FairTrade minimum price was equal to $1.25/lb from 1999 to 2010 and $1.35/lb starting in 2011. The Price Gap variable equals zero when the Price Gap Indicator is zero and thedifference between the FairTrade minimum price and the world price forArabica coffee in yearswhen thePrice Gap Indicator is equal to1. The Price Gapvariable ranges from 0 to 0.66USD/lb.Coefficientsarereportedwithstandarderrorsclusteredatthemill-levelinparantheses.***,**,and*indicatesignificanceaththe1,5,and10percentlevels.
DomesticPrice(USD/lb) lnDomesticPrice ExportPrice(USD/lb) lnExportPrice
surement error, a small number of observations have high prices and are thus highly influential.
The second is to use the natural log of prices. This facilitates a convenient interpretation of the
coefficients and reduces the effect of extreme observations.
Estimates of equations (2)–(4) are reported in Table 2, where we separately examine the price
of coffee sold domestically and internationally. In columns 1–6, the dependent variable is the
average price of domestic coffee sales and in columns 7–12 it is the average price of coffee exports.
Columns 1–3 and 7–9 report estimates using winsorized prices, while columns 4–6 and 10–12
report estimates using the natural log of prices. Estimates of equation (2), which does not allow
for a differential effect of FT when the price floor is binding, are reported in columns 1, 4, 7,
and 10. In each of the specifications, the estimated coefficient β1 is small in magnitude and is
not statistically different from zero. As is reported in the subsequent columns, this zero effect
masks important heterogeneity. Estimates of equation (3) are reported in columns 2, 5, 8, and 11.
Examining the price of domestic sales (columns 2 and 5), we find no significant additional benefit
to FT certification when the price floor is binding. Although the estimates of γ1 are positive, they
are not statistically different from zero. When we estimate the effect on export prices (columns
8 and 11), we find a positive (and significant) effect of FT certification on prices in years when
the price floor was binding. These findings are consistent with the fact that coffee that is sold
domestically by FT-certified producers are less likely to be sold as FT certified (and receive the
16

benefits of its price support). On the other hand, exported coffee that is sold by FT-certified
producers is more likely to be sold as FT-certified.
We further investigate the price-support effects of FT by estimating equation (4). The estimates
are reported in columns 3, 6, 9, and 12. We find that when the dependent variable is the average
price of domestic sales, the coefficient of the FT interaction, φ2, is positive, sizable in magnitude,
but insignificant (columns 3 and 6). Thus, for domestically sold coffee, there are additional effects
of FT certification when the price floor is binding, but these effects are imprecisely estimated and
not statistically different from zero. The estimated effects of FT on the average price of exports
are similar in magnitude as the estimates for domestic sales, but are more precisely estimated
(columns 9 and 12). The estimate from column 9 is particularly informative. If FT worked
perfectly, and all exported coffee sold by a FT-certified producer could be sold as FT, then we
would expect the estimate of φ2 to be close to one. That is, a one cent increase in the price gap
should result in a one-cent benefit to being FT certified. In reality, it is difficult for FT-certified
producers to sell all of their product as FT, and this becomes even more difficult when FT coffee is
being sold at significantly higher prices than conventional coffee.6 The estimate of φ2 in column
9 suggests that each 1 cent of benefit due to the difference between the FT price floor and world
price of coffee results in 0.12 cents of benefit to FT-certified exporters. That is, if the FT price
insurance mechanism could deliver up to 1 cent of benefit, our estimates indicate that in reality the
benefit is 0.12 cents. However, one caveat is that classical measurement error in the independent
variables will cause this estimate to be biased towards zero. Thus, this estimate is potentially a
worst-case-scenario assessment of the effectiveness of FT price support for producers.
We now turn to an examination of how FT certification affects quantities sold by estimating
equations (2)–(4) with various quantity measures as dependent variables. The estimates are
reported in Table 3. In columns 1–3, we examine the total quantity received by FT-certified
mills from farmers. After receiving the coffee, the mills process the coffee and it is then sold on
domestic or international markets. The estimates show evidence that FT-certified mills receive
more coffee from farmers in years when the price floor is binding (columns 1–3). Because only
FT-certified farmers who are members of a FT cooperative are able to sell to the cooperative,
this likely arises because members find it more attractive to sell their coffee to the cooperative
6For a discussion on over-certification and free entry into Fair Trade and its effects, see de Janvry, McIntosh andSadoulet (2015).
17

Table 3: The Effect of FT Certification on Quantities Received and Sold by Mills
(1) (2) (3) (4) (5) (6) (7) (8) (9)
FairTradeCertified,FTC 0.039 -0.052 -0.007 -0.059 -0.163 -0.099 -0.0012 0.0025 -0.0025(0.124) (0.140) (0.130) (0.140) (0.158) (0.144) (0.0073) (0.0083) (0.0084)
FTCxPriceGapIndicator 0.398** 0.380* -0.016**(0.161) (0.199) (0.007)
FTCxPriceGap(USD/lb) 0.888* 0.636 0.027(0.460) (0.449) (0.097)
16YearFE Y Y Y Y Y Y Y Y YMillFE Y Y Y Y Y Y Y Y YObservations 1,740 1,740 1,740 2,108 2,108 2,108 1,740 1,740 1,740Numberofclusters/mills 307 307 307 307 307 307 307 307 307
Meanofdep.variable 7.93 7.93 7.93 12.85 12.85 12.85 0.97 0.97 0.97Std.dev.ofdep.variable 2.18 2.18 2.18 2.19 2.19 2.19 0.09 0.09 0.09Notes: The table reports OLS estimates of equations (1)-(3). An observation is a mill-year. Each specification contains mill and year fixed effects. Thedependent variable in columns 1-3 is the natural logarithmof the total quantity received by the mill from coffee farmers. This variable is only reported inthe sample years 2003 to 2014. The dependent variable in columns 4-6 is the natural logarithm of the total quantity (expressed in lbs) sold by a mill onthe exportmarket. The dependent variable in columns 7-9 is equal to the ratio of total quantity sold and total quantity received. Note that this variable isonly reported in the sample years 2003 to 2014. The Price Gap Indicator equals one in years in which the world price for Arabica coffee is below theFairTrade minimum price. The FairTrade minimum price was equal to $1.25/lb from 1999 to 2010 and $1.35/lb starting in 2011. The Price Gapvariable equals zero when the Price Gap Indicator is zero and the difference between the FairTrade minimum price and the world price for Arabicacoffee in yearswhen the Price Gap Indicator is equal to one. The Price Gap variable ranges from0 to 0.66 USD/lb. Coefficients are reported with standarderrorsclusteredatthemill-levelinparantheses.***,**,and*indicatesignificanceatthe1,5,and10percentlevels.
Dependentvariable:
lnTotalQuantitySoldlnTotalQuantityReceivedShareofQuantityReceivedthatis
Sold
rather than a conventional mill. (While FT certified member farmers generally sell to their coop,
they often also sell their coffee to other third parties.)7 When world prices are low and the FT
minimum price becomes binding, then FT-certified mills have the potential to pay higher prices
relative to non-FT mills (if the coffee is sold as FT). According to the estimates from column 2,
FT-certified mills receive 0.40− 0.05 = 35% more coffee relative to non-certified mills in years
when the price floor is binding. When it is not binding, similar quantities are received.
Columns 4–6 show that the total quantities sold by the mill (both domestically and interna-
tionally) follow the same pattern as the total quantities received by the mill. Thus, we see that
when the price floor is binding FT-certified mills both receive more coffee (columns 1–3) and sell
more coffee (columns 4–6). Comparing the two sets of coefficients, we see that the interaction
coefficients for the quantity sold regressions are lower than the interaction coefficients for the
quantity received regressions: 0.40 versus 0.38 (column 2 versus column 5); and 0.89 versus 0.64
(column 3 versus column 6). This raises the question of whether FT-certified mills are less able
to sell all coffee received when the price floor is binding. Thus, in columns 7–9, we reported
7Although the policy of FT cooperatives is that members should not sell their products to other mills or third-partyintermediaries, in reality farmers typically do (Ronchi, 2002, p. 16).
18

Table 4: The Effect of FT Certification on Quantity Sold Domestically and Internationally
(1) (2) (3) (4) (5) (6) (7) (8) (9)
FairTradeCertified,FTC -0.125 -0.327 -0.222 -0.0108 -0.0905 -0.0342 0.0356 0.0517 0.0433(0.210) (0.235) (0.219) (0.164) (0.182) (0.169) (0.0320) (0.0355) (0.0334)
FTCxPriceGapIndicator 0.730*** 0.289 -0.058(0.205) (0.198) (0.044)
FTCxPriceGap(USD/lb) 1.518*** 0.370 -0.121(0.445) (0.441) (0.078)
16YearFE Y Y Y Y Y Y Y Y YMillFE Y Y Y Y Y Y Y Y YObservations 2,038 2,038 2,038 2,000 2,000 2,000 2,108 2,108 2,108Numberofclusters/mills 307 307 307 307 307 307 307 307 307
Meanofdep.variable 10.9 10.9 10.9 12.8 12.8 12.8 0.79 0.79 0.79Std.dev.ofdep.variable 2.3 2.3 2.3 2.1 2.1 2.1 0.25 0.25 0.25Notes: The table reports OLS estimates of equations (1)-(3). An observation is a mill-year. Each specification contains mill and year fixed effects. Thedependent variable in columns 1-3 is the natural logarithmof the total quantity (expressed in lbs) sold by a mill on the domesticmarket. The dependentvariable in columns 4-6 is the natural logarithmof the total quantity (expressed in lbs) sold by a mill on the exportmarket. The dependent variable incolumns 7-9 is equal to the ratio of export quantity sold over total quantity sold. The Price Gap Indicator equals one in years in which the world price forArabica coffee is below the FairTrade minimumprice. The FairTrade minimumprice was equal to $1.25/lb from1999 to 2010 and $1.35/lb starting in2011. The Price Gap variable equals zerowhen the Price Gap Indicator is zero and the difference between the FairTrade minimum price and the worldprice for Arabica coffee in years when the Price Gap Indicator is equal to one. The Price Gap variable ranges from 0 to 0.66 USD/lb. Coefficients arereportedwithstandarderrorsclusteredatthemill-levelinparantheses.***,**,and*indicatesignificanceatthe1,5,and10percentlevels.
Dependentvariable:
lnDomesticQuantitySold lnExportQuantitySoldExportQuantityasaShareofTotal
QuantitySold
estimate of equations (2)–(4) with the share of the quantity received that is sold as the dependent
variable. We find mixed evidence of more coffee being unsold by certified mills when the price
floor is binding. In column 8, the coefficient on the interaction term is negative and significant,
but in column 9 it is positive and insignificant. The negative coefficient, although significant, is
small in magnitude and very close to zero. The coefficient suggests that 1.6% less of the coffee
received can be sold by FT-certified mills when the price floor is binding.
We next turn to a closer examination of the quantity of coffee sold and estimate effects sepa-
rately for domestic and international sales. The estimates are reported in Table 4. Columns 1–3
report estimates of equations (2)–(4) with the quantity of domestic coffee sales as the dependent
variable, while columns 4–6 report estimates with the quantity of coffee exports as the dependent
variable. We see that the effects on total sales appear to be mainly due to domestic sales. The
coefficients on the interaction terms for domestic sales are larger in magnitude and more precisely
estimated than for foreign sales. This suggests that at times when the price floor is binding,
although some of the additional coffee received by FT-certified mills is exported, most appears
to be sold domestically. In columns 7–9, we test for a differential effect on domestic sales versus
exports for certified mills when the price floor binds. As reported, while in general FT-certified
19

Table 5: The Effect of FT Certification on Revenues
(1) (2) (3) (4) (5) (6) (7) (8) (9)
FairTradeCertified,FTC -0.080 -0.191 -0.124 -0.124 -0.344 -0.233 0.0097 -0.081 -0.019(0.137) (0.155) (0.141) (0.228) (0.251) (0.236) (0.158) (0.176) (0.163)
FTCxPriceGapIndicator 0.400** 0.791*** 0.329*(0.181) (0.217) (0.198)
FTCxPriceGap(USD/lb) 0.676* 1.693*** 0.451(0.408) (0.481) (0.450)
16YearFE Y Y Y Y Y Y Y Y YMillFE Y Y Y Y Y Y Y Y YObservations 1,928 1,928 1,928 2,038 2,038 2,038 2,000 2,000 2,000Numberofclusters/mills 307 307 307 307 307 307 307 307 307Meanofdep.variable 13.36 13.36 13.36 10.83 10.83 10.83 13.10 13.10 13.10Std.dev.ofdep.variable 1.86 1.86 1.86 2.17 2.17 2.17 1.95 1.95 1.95
Dependentvariable:
Notes : The table reports OLS estimates of equations (1)-(3). An observation is a mill-year. Each specification contains mill and year fixed effects. Thedependent variable in columns 1-3 is the total revenue (expressed in USD) obtained by a mill in a given year and equals the sum of domestic andexport revenue. The dependent variable in columns 4-6 is the natural logarithmof domestic revenue (expressed in USD) obtained by a mill in a givenyear. The dependent variable in columns 7-9 is the natural logarithm of export revenue (expressed in USD) obtained by a mill in a given year. ThePrice Gap Indicator equals one in years in which the world price for Arabica coffee is below the FairTrade minimum price. The FairTrade minimumprice was equal to $1.25/lb from1999-2010 and $1.35/lb starting in 2011. The Price Gap variable equals zerowhen the Price Gap Indicator is zeroand the difference between the FairTrade minimumprice and the world price for Arabica coffee in yearswhen the Price Gap Indicator is equal to one.The Price Gap variable ranges from0 to 0.66 USD/lb. Coefficients are reported with standard errors clustered at the mill level in parantheses. ***, **,and*indicatesignificanceatthe1,5,and10percentlevels.
lnTotalRevenue lnDomesticRevenue: lnExportRevenue:
mills export more, when the price floor binds, the export share of FT-certified mills tends to
decrease, although this estimated effect is not statistically different from zero.
The final outcome that we examine is the total revenue received by mills. Estimates of
equations (2)–(4) with the natural log of total revenues as the dependent variable are reported in
columns 1–3 of Table 5. The estimates show large and significant effects of FT certification on the
revenues of FT-certified mills when the price floor is binding. Disaggregating revenues between
domestic revenues (columns 4–6) and export revenues (columns 7–9), we find that similar effects
are found for both, but that the magnitude of the estimated effect is noticeably larger for domestic
revenues.
A clear picture emerges from the estimates reported in Tables 2–5. When the price floor binds,
FT-certified farmers have potential access to a market that offers significantly higher prices than
the conventional market. We observe the higher prices in the estimates of Table 2. The FT-certified
farmers recognize the benefit of selling their coffee as FT-certified through their local FT-certified
cooperative to which they are a member rather than through other conventional mills. Thus,
the amount of coffee that is sold by farmers to FT-certified cooperatives increases (columns 1–3
of Table 3). The FT cooperative then attempts to sell more coffee on the domestic and export
20

markets. While we see that nearly all of the extra coffee is sold (columns 4–9 of Table 3), more
of the extra coffee ends up being sold on the domestic market than the export market (Table 4).
Because FT-certified mills receive a higher price when the price floor is binding, and they sell
greater quantities, their total revenues are also greater; this is true for both domestic and export
revenues (Table 5).
We conclude by reminding the reader of an important caveat. Because we are unable to observe
whether or not coffee sold is FT-certified, our interpretation of the estimates in Tables 2–5 is with
indirect evidence. Unfortunately, we are not able to observe directly the prices or sales of coffee
that is sold as conventional nor sold as FT.
4. Effects of FT Certification on Households
A. Data and Estimating Equations
Having examined the effects of FT certification on producers, we now turn to an examination of
the effect of FT certification on households. We do this by linking our matched ICAFE-FLO data
(used in the previous section) with household survey data from Encuesta Hogares de Propositos
Multiples (EHPM). The EHPM survey, which has been carried out in July of each year since 1981,
contains information on household members’ age, gender, occupation, industry of employment,
income, and education. Although the mill-level data start in 1999, we begin our individual-level
analysis in 2001 because the survey data does not record the canton of the household prior to
then. Because sufficiently detailed occupation and industry data stop being available after 2009,
our analysis ends in 2009. Thus, the full sample period is 2001–2009.
Looking at the relationship between world prices and the FT price floor shown in Figure
1, we see that for nearly all of the 2001–2009 period, the price floor was binding.8 Thus, our
household-level estimates should be interpreted as the effects of FT certification on households
during a period in which the price floor is binding. Before turning to the household-level analysis,
we first estimate the average effect of FT certification on producers during this more restricted
time period. Estimates of equation (2) are reported in Table 6. During this period, we estimate
large positive effects of FT certification on the price of coffee sold for export (columns 3–4), and
insignificant effects on the price of coffee sold domestically (columns 1–2). The findings are
8More specifically, the price floor was binding from 1999 until February of 2008.
21

Table 6: Price of Coffee Sold by Mills, 2001–2009
(1) (2) (3) (4)
DomesticPrice(USD/lb) lnDomesticPrice
ExportPrice(USD/lb) lnExportPrice
FairTradeCertified,FTC -0.0066 0.0080 0.0623*** 0.0870***(0.0266) (0.0687) (0.0235) (0.0321)
9YearFE Y Y Y YMillFE Y Y Y YObservations 977 977 972 972Numberofclusters/mills 307 307 307 307
Meanofdep.variable 0.80 -0.36 1.08 0.02Std.dev.ofdep.variable 0.37 0.56 0.34 0.34Notes :ThetablereportsOLSestimatesofequation(1).Anobservationisamill-year.Eachspecificationcontainsmillandyearfixed effects. The dependent variable in column 1 is the domestic price calculated as the average price obtained by a mill in agiven year for the domestic coffee sales transactions and expressed in USD/lb. The domestic price was winsorized at the 99thpercentile. The dependent variable in column 2 is the natural logarithm of the non-winsorized domestic price. Thedependent variable in column 3 is the export price calculated as the average price obtained by a mill in a given year inexport coffee sales transactions and expressed in USD/lb. The export price was winsorised at at the 99th percentile. Thedependent variable in column 4 is the natural logarithmof the non-winsorized export price. Coefficients are reported withstandarderrorsclusteredatthemill-levelinparantheses.***,**,and*indicatesignificanceatthe1,5,and10percentlevels.
Dependentvariable:
consistent with the estimates reported in Table 2, which examine a longer time period and allow
for differential effects depending on the extent to which the price floor was binding. The period
from 2001–2009 was a period for which the price floor was binding almost continuously, and so
estimating the average effect for this period yields sizable effects, particularly on export prices.
We link the matched ICAFE-FLO mill-level data to the EHPM household survey data using the
canton of the mill and the canton of the household.9 The canton is the secondary administrative
level in Costa Rica, and there are 81 cantons in total. Because harvested coffee cherries immedi-
ately begin to decompose and ferment, compromising the quality of the coffee, processing must
occur within 24 hours after the cherries have been harvested. Given this, the locations of farms
and the mills will generally be within the same canton.
Our treatment variable is a measure of FT certification intensity in a canton c in year t, which
we denote with FTIc,t. The measure we construct is the fraction of total exports from a canton
that are sold by Fair Trade certified mills.10 More precisely, let Xk,c,t denote total coffee exports in
9We obtain information of the canton of each mill from the address recorded by ICAFE. In the few cases where theaddress of the mill is not available from ICAFE, we obtained the information by contacting the mill directly. We areable to identify the canton of mills for 90% of all exports between 2001-2009.
10It is important to emphasize that our measure is not a measure of the share of exports that are sold as FT certified.Because we do not know sales of FT certified coffee and non-FT certified coffee by mill, we are unable to construct thismeasure. Among the four cooperatives we interviewed in 2012, the share of their total sales in the previous year thatwas sold as FT was 80, 53, 40, and 10%.
22
year t by mill k located in canton c, and let IFTk,c,t be an indicator variable that equals one if mill k
is FT certified in year t. Then, our measure of FT intensity of canton c in year t, FTIc,t, is given by:
FTIc,t = ∑k
Xk,c,t · IFTk,c,t
Xk,c,t. (5)
When there is no coffee production in a county and year, i.e., ∑kXk,c,t = 0, we assign FTIc,t the
value of zero. That is, we assume the populations in the canton experience no treatment. As we
show, our estimates are nearly identical if we restrict our sample to include only cantons that
produce coffee. The benefit of examining a larger sample of households, including those that live
in cantons that do not produce coffee, is that the coefficients for the covariates in the regression,
including industry and occupation fixed effects, are more precisely estimated.
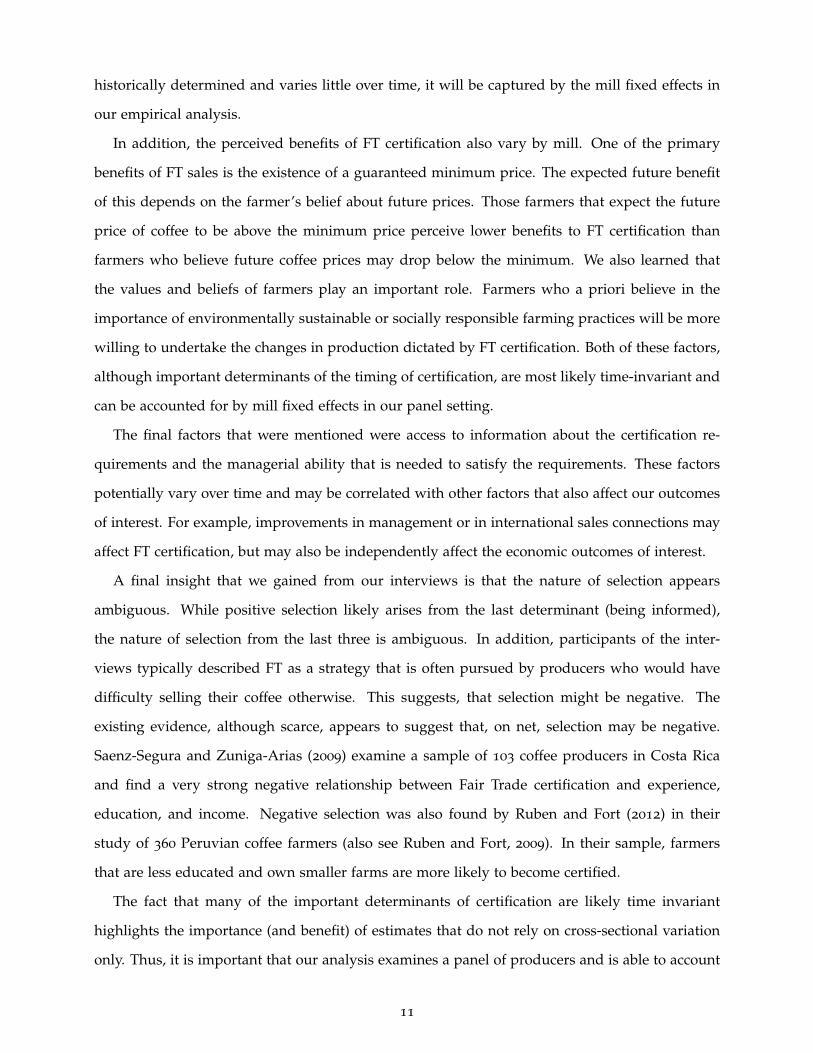
A map showing broad categories of the average Fair Trade intensity of cantons in 2001 and
2009 is provided in Figure 2. Cantons with no coffee production are shown in the lightest shade.
Of the 81 cantons in Costa Rica, 45 did not produce coffee during our sample period.11 For the 36
cantons with coffee production, the value of FTIc,t is represented by shading from light/yellow
(low FT intensity) to dark/brown (high FT intensity).
The first estimating equation that we consider is one where we simply estimate the impact of
FT certification on income. The equation is:
yj,i,c,t = αi + αc + αt + θFTIc,t + X′j,tΓ + εj,i,c,t, (6)
where j denotes individuals, i industries (480), c cantons, and t years (2001–2009). The sample
includes all employed individuals over the age of twelve.12 The dependent variable, yj,i,c,t,
denotes income in the past month, measured in the current local currency (colones). FTIc,t is
our measure of the extent of Fair Trade certification in canton c in year t. X′j,t is a vector of
individual-level covariates: educational-attainment fixed effects,13 age, age2, gender, gender ×
age, and gender × age2. The equation also includes canton fixed effects αc, survey year fixed
effects αt, and industry-of-employment fixed effects αi. The canton fixed effects control for
time-invariant regional characteristics that affect the outcomes; survey-year fixed effects control
11As we explain below, all empirical results are robust to restricting the analysis to only include the 36 coffeeproducing cantons. In addition, results are robust to only examining the rural areas within these cantons.
12To be included in the sample an individual must be employed, and report an income, an occupation, and anindustry of employment. As we show, our estimates are similar if we vary this criterion.
13The categories are: No education, Preparatory, Special Education, Primary Education, High-school (academic),High-school (technical), Parauniversity, University
23

²
LegendFair Trade Intensity, 2001
0.00 (no production)0.00 (with production)0.001-0.03590.0360-0.06490.0650-1.000 0 20 4010 Miles
(a) Fair Trade certification in 2001
²
LegendFair Trade Intensity, 2009
0.00 (no production)0.00 (with production)0.001-0.03590.0360-0.06490.0650-1.000 0 20 4010 Miles
(b) Fair Trade certification in 2009
Figure 2: Share of coffee producers that are Fair Trade certified (weighted by total exports) in thefirst (2001) and last (2009) periods of our panel.
24

for macroeconomic shocks that are common to all industries and cantons; and industry fixed
effects control for time-invariant industry characteristics.
The coefficient θ is an estimate of the effect of FT-certification on all individuals living within a
canton. Although it is possible that some effects of FT are felt by all individuals within a canton,
it is likely that the effects are greatest for individuals working directly within the coffee industry.
We allow for this by estimating the following equation, which allows for a differential effect of FT
certification on those who work in the coffee industry:
yj,i,c,t = αi + αc + αt + µ1FTIc,t + µ2FTIc,t · Ii=coffeej + Xj,tΓ + εj,i,c,t (7)
where Ii=coffeej is an indicator variable that equals one if individual j’s reported primary
industry-of-employment is the “cultivation of coffee”.14 The inclusion of FTIc,t · Ii=coffeej in equa-
tion (7) allows for a differential effect of FT certification for those who work in the coffee sector.
The coefficient µ2 measures the additional effect that FT certification has on these individuals.
The total effect of FT certification for these individuals is given by µ1 + µ2. The coefficient µ1
measures the effect of increasing FT intensity within a region on individuals not working in the
coffee industry. Thus, it can be interpreted as the average spillover effect of FT certification for all
individuals within the region.
It is possible that, even within the coffee industry, workers benefit differentially from FT
certification. For example, farm owners may benefit more than unskilled coffee pickers who
are hired seasonally. In addition, one of the implicit goals of FT is to transfer rents from large
intermediaries to small-scale farmers. Motivated by this, we examine the distribution of benefits
of FT certification with an estimating equation that distinguishes between three different occu-
pations within the coffee industry: skilled agricultural workers, unskilled agricultural workers,
and other non-farm occupations. The latter are likely to be those involved in the sales, storage,
transport and/or processing of coffee (e.g., intermediaries, mills, and their employees). We do
this by augmenting equation (7) with an occupation dimension and allowing for a differential
effect of FT certification on those in the coffee industry depending on their occupation.
The augmented estimating equation is:
ln yj,i,o,c,t = αi,o + αc + αt
+γ1FTIc,t + γ2FTIc,t · Ii=coffee,o=skilledj
14Specifically, the indicator equals one if the observation’s primary employment is in industry 01140.
25

+γ3FTIc,t · Ii=coffee,o=unskilledj + γ4FTIc,t · Ii=coffee,o=nonfarm
j
+Xj,tΓ + εj,i,o,c,t, (8)
where o indexes a worker’s self-reported occupation (413 in total), and αi,o indicate occupation-
industry fixed effects. The variable Ii=coffee,o=skilledj is an indicator variable that equals one if
individual j works in the coffee sector and has a “skilled” occupation (which includes categories
such as “farmers”, “growers”, and “skilled workers”); Ii=coffee,o=unskilledj is an indicator that
equals one if individual j works in the coffee sector and has an unskilled occupation (which
primarily consists of “agricultural laborers” and “coffee pickers”);15 and Ii=coffee,o=nonfarmj is
an indicator variable that equals one if individual j works in the coffee sector, but is in other
non-farm occupations. The residual category primarily consists of individuals involved in the
management, sales, storage, transport and/or processing of coffee. The three interaction terms
allow the effects of FT certification in a canton to be different for those working in coffee in each of
the three different occupation groups. Thus, the coefficients γ2, γ3, and γ4 measure the additional
effect of FT on those working in the coffee industry and in each of the occupational groups.
In equation (8), the spillover effect of FT to those in a canton, which is given by γ1, is assumed to
be the same for all individuals independent of their occupation. An alternative strategy is to allow
these effects to vary depending on an individual’s occupation. This can be done by including the
following double interactions in the estimating equation: FTId,t · Ii=skilledj , FTId,t · Io=unskilled
j ,
and FTId,t · Io=nonfarmj . Doing this results in the following equation:
ln yj,i,o,c,t = αi,o + αc + αt
+β1FTIc,t · Io=skilledj + β2FTIc,t · Io=unskilled
j + β3FTIc,t · Io=nonfarmj
+β4FTIc,t · Ii=coffee,o=skilledj + β5FTIc,t · Ii=coffee,o=unskilled
j
+β6FTIc,t · Ii=coffee,o=nonfarmj + Xj,tΓ + εj,i,o,c,t. (9)
The coefficient β1 measures the spillover effect of FT certification on skilled individuals within a
canton, while β4 measures the additional effect of FT certification on skilled individuals who work
in the coffee industry. Thus, the total effect of FT certification for skilled workers in the coffee
industry is given by β1 + β4. Similarly, the total effect of FT certification for unskilled workers
15Skilled agricultural occupations is category 61 of ‘primary occupational group’ variable in the household survey.The categories are based on the Classification de Ocupaciones de Costa Rica, which was published by the Costa RicaStatistical Institute. Unskilled agricultural occupations are category 92. Non-farm occupations are all other categories.
26
who are not in the coffee industry is given by β2, while the total effect for unskilled workers in
the coffee industry is given by β2 + β5. Analogously, for nonfarm workers, the spillover effect is
given by β3 and the total effect for nonfarm workers in the coffee industry is given by β3 + β6.
B. Estimated Effects of FT on Incomes
Estimates of equations (6)–(9) are reported in Table 7. Column 1 reports an estimate of equation
(6), which allows for an average effect of FT certification for all individuals within a canton in a
year. The estimates show a positive and significant average effect of FT intensity on household
incomes. According to the estimated coefficient, a one-standard-deviation increase in FT intensity
(0.28) is associated with a 3.1% (0.269× 0.114 = 0.031) increase in incomes.16 In column 2, we
report our estimate of equation (7), which allows the effect of FT to differ for those that work
in the coffee sector. We continue to find a sizable general effect, and also estimate an additional
positive effect of FT intensity within the coffee sector. The additional effect, although sizable and
close to the same magnitude as the general effect, is imprecisely estimated and not statistically
different from zero.
The estimated positive general effects of FT, θ and µ1, likely arise for a number of potential
reasons. First, the FT premiums received by the cooperatives are typically used on local public
goods that benefit the whole community, not just the members of the cooperative or those within
the coffee sector. For example, the cooperative COOPELDOS sets aside a specific amount per
unit of coffee for the maintenance of roads in the area, which increases the productivity of many
within the region, not just coffee producers (Ronchi, 2002, pp. 20–21). Another example is from
the cooperative COOPE CERRO AZUL, which sets a minimum wage for any laborers hired by its
members. Given the integrated market for unskilled labor, this, in turn, has had spillover benefits
for all unskilled workers in the region. Other nearby organizations that also hired laborers – and
not necessarily in coffee – have had to match the wages paid by the cooperative (Ronchi, 2002, p.
21).
We next turn to estimates of equation (8), which allow for heterogeneous effects within the
coffee sector. The estimates, which are reported in column 3, show that the average effect for
those within the coffee sector masks significant heterogeneity. The baseline effect for those not
16The mean of the FT intensity measure is 0.090 and the standard deviation is 0.268. Summary statistics for thehousehold-level analysis are reported Appendix Table A2.
27

in the coffee industry remains statistically significant and similar in magnitude to column 2. The
estimate of γ2 shows that there is an additional benefit to skilled coffee growers. The total benefit
of FT certification for this group (γ̂1 + γ̂2) is: 0.128 + 0.285 = 0.413. The estimate of γ3 shows that
unskilled workers in the coffee sector receive no additional benefit from FT certification. For this
group, the combined effect (γ̂1 + γ̂3) is: 0.127− 0.093 = 0.034. Those in non-farm occupations
working in the coffee sector – who are primarily intermediaries and their employees – appear to
lose from FT certification. The additional effect to this group is negative and highly significant.
The total effect of FT certification for this group (γ̂1 + γ̂4) is negative and significant: 0.128 −
0.272 = −0.144.
The finding of a large benefit from FT certification for skilled coffee growers (who are mainly
the farm owners), but not for unskilled workers is confirmed by the estimates of equation (9),
which are reported in column 4. Overall, the estimates of equation (9), which allows the spillover
effects of FT certification to differ depending on an individual’s occupation, confirm the findings
from equation (8). According to the estimates, there are statistically significant positive spillover
effects for those in unskilled occupations (β̂2 = 0.124) and for those in non-farm occupations
(β̂3 = 0.135). For those working in skilled occupations, the spillovers are also positive, although
they are smaller in magnitude and not statistically significant (β̂1 = 0.053). These findings are not
surprising given that the public goods and community projects that result from FT premiums are
typically developed to help rural and lower-income populations.
Overall, the estimates show that while FT significantly increases the incomes of those working
in skilled occupations in the coffee sector (e.g., farm owners), it has a large negative effect on the
incomes of those working in non-farm occupations within the coffee sector.17 Thus, it appears as if
FT redistributes money from intermediaries to the farm owners. Given that this redistribution is a
goal of FT, this result is not surprising.18 In practice, this likely occurs because when cooperatives
obtain the FT certification and are offering higher prices, coffee growers are more likely to take
their coffee cherries for processing at the cooperative mill. Stand-alone mills and exporters (i.e.
intermediaries) will tend to lose as a result. Part of the FT initiative is aimed at helping farmers
17Although we do not know with certainty that intermediaries comprise the majority of workers in the non-farmcategory, as we report below in Table 8, we do observe that their average income is approximately 42% higher thanfor skilled coffee workers and 100% higher than non-skilled workers. In addition, the number of individuals in thissector is very small. While there are 1,388 individuals in skilled occupations in the coffee sector, there are only 214
individuals working in non-farm occupations in the coffee sector.18For a theoretical examination of this consequence of FT see Podhorsky (2015).
28
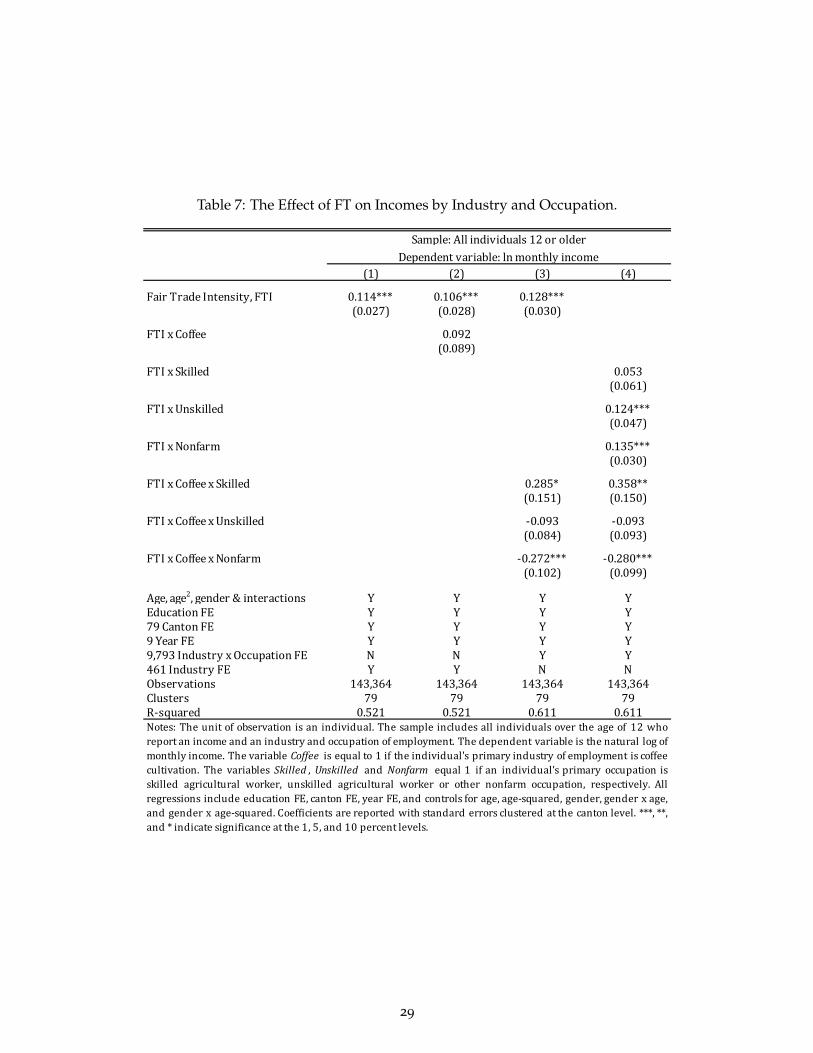
Table 7: The Effect of FT on Incomes by Industry and Occupation.
(1) (2) (3) (4)
FairTradeIntensity,FTI 0.114*** 0.106*** 0.128***(0.027) (0.028) (0.030)
FTIxCoffee 0.092(0.089)
FTIxSkilled 0.053(0.061)
FTIxUnskilled 0.124***(0.047)
FTIxNonfarm 0.135***(0.030)
FTIxCoffeexSkilled 0.285* 0.358**(0.151) (0.150)
FTIxCoffeexUnskilled -0.093 -0.093(0.084) (0.093)
FTIxCoffeexNonfarm -0.272*** -0.280***(0.102) (0.099)
Age,age2,gender&interactions Y Y Y YEducationFE Y Y Y Y79CantonFE Y Y Y Y9YearFE Y Y Y Y9,793IndustryxOccupationFE N N Y Y461IndustryFE Y Y N NObservations 143,364 143,364 143,364 143,364Clusters 79 79 79 79R-squared 0.521 0.521 0.611 0.611Notes: The unit of observation is an individual. The sample includes all individuals over the age of 12 whoreport an income and an industry and occupation of employment. The dependent variable is the natural log ofmonthly income. The variable Coffee is equal to 1 if the individual's primary industry of employment is coffeecultivation. The variables Skilled , Unskilled and Nonfarm equal 1 if an individual's primary occupation isskilled agricultural worker, unskilled agricultural worker or other nonfarm occupation, respectively. Allregressions include education FE, canton FE, year FE, and controls for age, age-squared, gender, gender x age,and gender x age-squared. Coefficients are reported with standard errors clustered at the canton level. ***, **,and*indicatesignificanceatthe1,5,and10percentlevels.
Sample:Allindividuals12orolderDependentvariable:lnmonthlyincome
29

market and sell their own coffee, thus removing the need to use external intermediaries. This is
done by not only requiring that farmers form cooperatives that process and sell the coffee, but
the FT organization also tries to connect farmers to FT certified purchasers of coffee. In addition,
knowledge and technical training is also provided to farmers to help them better understand the
market.
Our findings also show that there is no additional benefit (beyond the general spillover benefit
to all) to unskilled workers in the coffee sector. This is not surprising once one considers the
structure of FT. Unless the members of the cooperative, who will tend to be the ‘skilled workers’
in our sample, decide to allocate some of the premium to increasing the wages of coffee pickers
and other hired workers (unskilled workers in the sample), then we should not expect to see
any income effects for this group of workers from increasing FT production. These findings
are consistent with descriptive evidence from Valkila and Nygren (2009), which shows that
Guatemalan coffee workers do not appear to benefit from Fair Trade.
Given the uneven benefits of FT within the coffee sector, it is important to understand the rela-
tive sizes of the different groups, as well as their relative levels of prosperity. Table 8 provides this
information. It reports average monthly incomes over the sample period (2001–2009), measured
in Costa Rican colones. (The average exchange rate from 2001–2009 was approximately 440 Costa
Rican colones per US dollar.) The first panel of the table looks across all households in the sample
and, for each industry and occupation category, reports the number of households in our sample
and average monthly income. For the full sample, the average monthly income is 185,689 colones
or $422 dollars. For individuals working in the coffee industry, the average is significantly lower
at about 95,061 colones. Within this industry, incomes are higher than average for skilled coffee
workers (107,166), lower than average for unskilled workers (76,831) and significantly higher than
average for non-farm occupations (151,660). In the sample, other occupations account for about
6.7% of all workers in the coffee industry, unskilled occupations account for 49.7%, and skilled
occupations account for 43.5%. The lower panels in 8 show that similar patterns are observed if
we restrict the sample to households that are in coffee-producing cantons or households in the
rural regions of coffee-producing cantons.
These statistics suggest that for the vast majority of workers in the coffee industry (93.3%) FT
either has positive or non-existent effects on incomes (beyond the positive spillover effects felt by
all). The group that is hurt (those in non-farm occupations) comprises a very small proportion
30

Table 8: Average Incomes by Industry and Occupation.
AlloccupationsSkilledagriculture
onlyUnskilled
agricultureonlyNonfarmoccupations
Allindustries 185,689 125,372 95,708 210,330n=143,364 n=11,217 n=15,659 n=102,756
Coffeeindustryonly 95,061 107,166 76,831 151,660n=3,188 n=1,388 n=1,586 n=214
Allindustries 185,406 115,319 85,926 208,491n=71,747 n=5,636 n=6,425 n=52,702
Coffeeindustryonly 95,318 107,220 76,951 156,181n=2,909 n=1,294 n=1,435 n=180
Allindustries 161,851 113,040 84,841 190,986n=42,627 n=5,085 n=5,978 n=27,724
Coffeeindustryonly 92,097 104,502 75,763 139,182n=2,760 n=1,231 n=1,376 n=153
Notes : The table reports average monthly income (in colones) and the number of observations. 500CostaRicancolonesisequaltoapproximatelyoneU.S.dollar.
AllofCostaRica
CoffeeProducingCantonsOnly
RuralPartsofCoffeeProducingCantonsOnly
of all workers in the coffee sector and they have incomes that are almost 100% higher than the
incomes of those in unskilled occupations and 42% higher than the incomes of those in skilled
occupations. Although the group that benefits significantly from FT has higher incomes than
those in unskilled occupations, their incomes are still much lower than the average for all of Costa
Rica. While the average income in the full sample is 185,689 colones, the average income for those
in skilled occupations in the coffee sector is 107,166 colones. Thus, the primary beneficiaries of
FT are economically disadvantaged, even if they are not the very poorest group.
a. Robustness and Sensitivity Checks
We now turn to an examination of the robustness of the estimates of Table 7. In our baseline
specification, the sample includes all individuals 12 or older who are employed and report a
positive income. One potential concern with this is that it omits individuals who are unemployed
and earn zero wages. To check the sensitivity of our estimates to this characteristic of the sample,
31

we include individuals even if they report no income. Given the minimum age of 12, if we include
all individuals who report zero income, we will likely include a large number of children who
are in school and not in the workforce. Therefore, we also restrict the sample to individuals 18
or older. Thus, the sample includes all individuals 18 or older, even if they report no income.19
Estimates of equations (6)–(9) with the alternative sample are reported in Table 9. Comparing
these estimates with those from Table 7, we see that the results are qualitatively identical and
quantitatively very similar.
We next check the robustness of our results to a number of sample restrictions. We first
restrict the sample to only include: (i) cantons that produce coffee (36 in total), and (ii) the rural
areas of these coffee-producing cantons. The argument for including observations that are not
in coffee-producing cantons is that they help to estimate the control variables and fixed effects
that are important for the analysis. On the other hand, one could also argue that the cantons in
the restricted samples are more comparable. Estimates of equation (9) for these two subsamples
are reported in columns 3 and 5 of Table 10. (Column 1 reproduces the baseline estimates for
comparison.) The estimates remain very similar when we use the restricted samples.
We also check the robustness of our estimates to restricting the sample to only include indi-
viduals who are the head of a household. We do this separately for each of the three samples: all
cantons, coffee producing cantons, and rural parts of coffee cantons. The estimates are reported
in columns 2, 4, and 6 of Table 10. Again, we find that the estimates remain very similar, although
the negative impact on non-farm occupations in the coffee industry is smaller in magnitude and
no longer statistically significant.
Lastly, we check the robustness of our estimates to the use of different FT intensity measures.
The estimates are reported in Table 11. Column 1 reproduces the baseline estimate that uses
exports to create an export weighted measure of FT intensity. In column 2, we report estimates
that use production weights. As shown, the estimates are nearly identical. Next, we use time-
invariant export weights. That is, in equation (5), we use Xkc rather than Xkct, where Xkc is
average exports of mill k in canton c from 2001–2009. One may be concerned with the variation
in FT intensity that is due to the year-to-year change in exports across mills. This measure, by
using a time-invariant measure of exports, is purged of this variation. As shown in column 4, the
19Recall that our estimation strategy still requires information on an individual’s occupation and sector of employ-ment. Thus, individuals for which this is unknown still are not in the sample.
32

Table 9: The Effect of FT on Incomes by Industry and Occupation.
(1) (2) (3) (4)
FairTradeIntensity,FTI 0.172* 0.126 0.160(0.098) (0.093) (0.124)
FTIxCoffee 0.506(0.695)
FTIxSkilled 0.051(0.204)
FTIxUnskilled 0.258(0.223)
FTIxNonfarm 0.156(0.126)
FTIxCoffeexSkilled 1.453*** 1.561***(0.394) (0.385)
FTIxCoffeexUnskilled -0.203 -0.299(1.108) (1.109)
FTIxCoffeexNonfarm -0.789 -0.785(1.076) (1.076)
Age,age2,gender&interactions Y Y Y YEducationcontrols Y Y Y Y79CantonFE Y Y Y Y9YearFE Y Y Y Y9,813IndustryxOccupationFE N N Y Y461IndustryFE Y Y N NObservations 163,466 163,466 163,466 163,466Clusters 79 79 79 79R-squared 0.175 0.175 0.254 0.254
Sample:Allindividuals18orolderDependentvariable:lnmonthlyincome
Notes: The unit of observation is an individual. The sample includes all individuals over the age of 12 whoreport an income and an industry and occupation of employment. The dependent variable is the natural log ofmonthly income. The variable Coffee is equal to 1 if the individual's primary industry of employment is coffeecultivation. The variables Skilled , Unskilled and Nonfarm equal 1 if an individual's primary occupation isskilled agricultural worker, unskilled agricultural worker or other nonfarm occupation, respectively. Allregressions include education FE, canton FE, year FE, and controls for age, age-squared, gender, gender x age,and gender x age-squared. Coefficients are reported with standard errors clustered at the canton level. ***, **,and*indicatesignificanceatthe1,5and10percentlevels.
33

Table 10: The Effect of FT on Incomes: Robustness to Subsamples
AllindividualsHouseholdheads
only AllindividualsHouseholdheads
only AllindividualsHouseholdheads
only(1) (2) (3) (4) (5) (6)
FTIxSkilled 0.053 0.028 0.058 0.070 0.017 0.023(0.061) (0.072) (0.070) (0.082) (0.084) (0.094)
FTIxUnskilled 0.124*** 0.116** 0.165** 0.162** 0.166** 0.166**(0.047) (0.055) (0.064) (0.075) (0.068) (0.078)
FTIxNonfarm 0.135*** 0.106*** 0.141*** 0.106** 0.116** 0.086(0.030) (0.039) (0.033) (0.041) (0.045) (0.053)
FTIxCoffeexSkilled 0.358** 0.380** 0.342** 0.328** 0.356** 0.362**(0.150) (0.152) (0.157) (0.159) (0.159) (0.163)
FTIxCoffeexUnskilled -0.093 -0.118 -0.119 -0.159 -0.134 -0.157(0.093) (0.090) (0.107) (0.099) (0.104) (0.097)
FTIxCoffeexNonfarm -0.280*** -0.178 -0.266** -0.106 -0.283** -0.185(0.099) (0.109) (0.118) (0.124) (0.118) (0.127)
Age,age2,gender&interactions Y Y Y Y Y YEducationcontrols Y Y Y Y Y Y79CantonFE Y Y Y Y Y Y9YearFE Y Y Y Y Y Y9,793IndustryxOccupationFE Y Y Y Y Y YObservations 143,364 74,590 71,747 36,914 42,627 22,903Clusters 79 79 36 36 36 36R-squared 0.611 0.620 0.633 0.646 0.627 0.635
AllCantons CoffeeproducingCantonsonlyRuralpartsofcoffeeproducing
Cantons
Notes: The unit of observation is an individual. Coefficients are reported with standard errors clustered at the canton level. The variable Coffee is equal to 1 if theindividual's primary industry of employment is coffee cultivation. The variables Skilled , Unskilled and Nonfarm equal 1 if an individual's primary occupation isskilled agricultural worker, unskilled agricultural worker or other nonfarm occupation, respectively. All regressions include canton FE, industry-occupation fixedeffects, year fixed effects, and controls for age, age-squared, gender, gender x age, and gender x age-squared. ***, **, and * indicate significance at the 1, 5, and 10percentlevels.
34

Table 11: The Effect of FT on Incomes: Robustness to Using Alternative FTI Measures
Baseline:exportweighted
Productionweighted
Timeinvariantexportweights
Initial(2001)exportweights
IndicatorifatleastonemillisFTcertified
(1) (2) (3) (4) (5)
FTIxSkilled 0.053 0.060 0.037 0.038 0.070(0.061) (0.064) (0.058) (0.058) (0.077)
FTIxUnskilled 0.124*** 0.131** 0.098** 0.097** 0.109**(0.047) (0.050) (0.038) (0.037) (0.050)
FTIxNonfarm 0.135*** 0.143*** 0.105*** 0.105*** 0.092***(0.030) (0.035) (0.021) (0.021) (0.035)
FTIxCoffeexSkilled 0.358** 0.354** 0.310** 0.293** 0.142(0.150) (0.155) (0.121) (0.118) (0.102)
FTIxCoffeexUnskilled -0.093 -0.089 -0.074 -0.068 -0.058(0.093) (0.096) (0.088) (0.088) (0.049)
FTIxCoffeexNonfarm -0.280*** -0.283*** -0.210*** -0.199** -0.142**(0.099) (0.101) (0.077) (0.076) (0.061)
Age,age2,gender&interactions Y Y Y Y YEducationcontrols Y Y Y Y Y79CantonFE Y Y Y Y Y9YearFE Y Y Y Y Y9,793IndustryxOccupationFE Y Y Y Y YObservations 143,364 143,364 143,364 143,364 143,364Clusters 79 79 79 79 79R-squared 0.611 0.611 0.611 0.611 0.611
FairTradeIntensityMeasureUsed:
Notes: The unit of observation is an individual. Coefficients are reported with standard errors clustered at the canton level. The variable Coffee isequal to 1 if the individual's primary industry of employment is coffee cultivation. The variables Skilled, Unskilled and Nonfarm equal 1 if anindividual's primary occupation is skilled agricultural worker, unskilled agricultural worker or other nonfarm occupation, respectively. Allregressions include canton fixed effects, industry-occupation fixed effects, year fixed effects, and controls for age, age-squared, gender, gender x age,andgenderxage-squaredandeducation.***,**,and*indicatesignificanceatthe1,5,and10percentlevels.
estimates remain robust. In column 5, we report similar estimates, but using exports in the initial
period, 2001, rather than average exports as weights. Again, the estimates remain robust. In the
last robustness check, we construct an extremely coarse measure of FT intensity that is completely
independent of any variation in production or exports. We use an indicator variable that equals
one if there is at least one FT-certified mill in the canton in that year. As shown, the results are
robust to the use of this coarse measure of FT intensity.
Overall, our sensitivity checks confirm the robustness of the findings from Table 7. The
estimates continue to show the presence of spillover effects to individuals working outside of
the coffee sector. In addition, within the coffee sector, skilled workers (e.g., farm owners)
benefit significantly, while those in non-farm occupations (e.g., intermediaries) are hurt. In
35

all specifications, the estimated magnitudes and statistical significance are very similar to the
baseline estimates.
C. Estimated Effects of FT on School Enrollment
We next turn to an investigation of the effects of FT certification on the education of children.
There are three main channels through which FT production could affect education. First, by
increasing household incomes, FT certification could increase educational attainment. As we
have seen, FT certification is associated with higher payments to skilled occupations in the coffee
industry, as well as positive spillover effects to those residing in the same canton. Second, FT
certification, by making coffee production a more profitable endeavor, may increase the opportu-
nity costs of going to school.20 Third, FT could affect educational attainment through enhanced
provision of public goods in a region. As we have discussed, in Costa Rica, part of the FT
premium is directed towards the building of schools and roads, the provision of books, equipment
and other materials, as well as the provision of scholarships for students to attend school. For
example, since COOCAFE’s creation of the Children of the Field Foundation (Fundación Hijos del
Campo) in 1996, they have provided scholarships to 2,598 students and financial support to 240
schools. COOCAFE estimates that over 5,800 students have been helped by their foundation.21
To examine the effects of FT certification on education, we estimate a version of equation (9)
where the unit of observation is a child and the dependent variable is an indicator variable that
equals one if the child is enrolled in school at the time of the survey. We examine three different
samples: children aged 7–12 years old (potential elementary school students); children aged 13–17
(secondary school students); and children aged 18–25 (university students). Since children do not
have an identified industry and occupation, in these specifications we instead use the industry
and occupation of the household head. Thus, the estimates report how school enrollment of
children varies with FT certification for households in different occupations within and outside
of the coffee sector.
Estimates are reported in Table 12. Column 1 reports estimates for elementary-aged children,
column 2 for secondary-school-aged children, and column 3 for university-aged children. FT
20This is an effect that has been found in Mexico (Atkin, 2016).21For an examination of the impacts of the Foundation in the years immediately following its inception (see Ronchi,
2002). From 1997–1999 alone, the foundation provided funding to 71 elementary schools, donating approximately US$360 per school, benefiting 5,061 students.
36

Table 12: FT Certification and School Attendance
Ages7-12 Ages13-17 Ages18-25(1) (2) (3)
FTIxSkilled 0.001 0.171*** 0.022(0.011) (0.037) (0.047)
FTIxUnskilled 0.004 0.116** -0.050(0.017) (0.048) (0.039)
FTIxNonfarm 0.006 0.082*** 0.004(0.007) (0.029) (0.030)
FTIxCoffeexSkilled -0.008 0.019 -0.059(0.020) (0.069) (0.117)
FTIxCoffeexUnskilled 0.028 -0.120 -0.085(0.035) (0.106) (0.066)
FTIxCoffeexNonfarm -0.014 -0.789*** 0.063(0.009) (0.188) (0.119)
Age,age2,gender&interactions Y Y YCantonFE Y Y YYearFE Y Y YIndustryxOccupationFE(ofhhhead) Y Y YObservations 45,038 38,663 50,973Clusters 79 79 79R-squared 0.107 0.262 0.307
Dependentvariable:Indicatorforschoolenrollment
Notes: The unit of observation is an individual. Coefficients are reported with standard errorsclustered at the canton level. The dependent variable is an indicator variable if a child attends school.The variable Coffee is equal to 1 if an individual belongs to a household where the household headreports coffee production as the main industry of employment. The variables Skilled , Unskilled andNonfarm equal 1 if an individual belongs to a household where the household head reports the mainoccupation as skilled agricultural worker, unskilled agricultural worker or an other nonfarmoccupation, respectively. All regressions include canton fixed effects, year fixed effects, fixed effects forthe household head's industry x occupation, and controls for age, age-squared, gender, gender x age,andgenderxage-squared.***,**,and*indicatesignificanceatthe1,5,and10percentlevels.
37

certification appears to have no effect on enrollment in elementary schools. This is consistent
with the fact that elementary school enrollment rates are very high in Costa Rica and thus there
is little scope for improvement. For example, in our sample 98.9% of children who are aged
8 report being enrolled in school. By contrast, we do find evidence of a positive association
between FT certification in a canton and the level of secondary school enrollment. These effects
are present irrespective of the occupation category of the household head, although the effects
are greatest for children with a household head who is in a skilled occupation. A one-standard-
deviation increase in FT intensity (0.27) is associated with a 5% (0.27× 0.171 = 0.05) increase in
the probability of school enrollment for the children of those in skilled agricultural occupations,
a 3% (0.27 × 0.116 = 0.03) increase for children of those in unskilled occupations, and a 2%
(0.27× 0.091 = 0.02) increase for children of those in non-farm occupations.
The estimates of the additional effects for those working within the coffee sector are very close
to zero for skilled occupations (0.019), negative, sizable, but insignificant for those in unskilled
occupations (−0.120), and negative, large in magnitude, and highly significant for those in other
occupations (−0.789). For unskilled and non-farm occupation parents, the negative additional
effect within the coffee sector is greater than the positive general effects of FT intensity. For
unskilled workers within the coffee sector the net effect is close to zero: 0.116− 0.120 = −0.004.
However, for non-farm occupations within the coffee sector, the net effect is large and negative:
0.082− 0.789 = −0.707. This effect is potentially explained by the large negative effects of FT
on the incomes of this group. Evidence from similar developing-country contexts find that low
incomes can prevent parents from being able to send their children to school, resulting in lower
enrollment rates (Edmonds et al., 2010).
The estimates for school enrollment for those of university age (18–25) suggest that FT intensity
has no effect on university enrollment. All coefficients are small in magnitude and not statistically
different from zero. These findings are consistent with a relatively small proportion of the
premiums being allocated to post-secondary education. In addition, the funds that are allocated
to this tend to be focused on adult education and skills upgrading, which primarily affect those
older than 25.
In an attempt to better understand the reason for the estimated relationship between FT
intensity and enrollment of high-school-aged students, we also examine the relationship between
FT certification and the following alternative activities: being in the labor force, being employed,
38

Table 13: FT Certification, Education, and Employment: Children from Ages 13–17
AttendSchool Inlaborforce Employed Unemployed(1) (2) (3) (4)
FTIxSkilled 0.171*** -0.055*** -0.054*** -0.001(0.037) (0.020) (0.016) (0.009)
FTIxUnskilled 0.116** -0.042* -0.039* -0.003(0.048) (0.021) (0.022) (0.011)
FTIxNonfarm 0.082*** -0.052*** -0.044*** -0.008(0.029) (0.012) (0.010) (0.009)
FTIxCoffeexSkilled 0.019 -0.036 -0.036 0.001(0.069) (0.039) (0.037) (0.007)
FTIxCoffeexUnskilled -0.120 -0.012 -0.008 -0.004(0.106) (0.027) (0.031) (0.011)
FTIxCoffeexNonfarm -0.789*** -0.386 -0.403 0.017(0.188) (0.341) (0.353) (0.014)
Age,age2,gender&interactions Y Y Y Y36CantonFE Y Y Y Y10YearFE Y Y Y Y7,171IndustryxOccupationFE Y Y Y YObservations 38,663 38,670 38,670 38,670R-squared 0.262 0.296 0.263 0.149
Sample:Individuals13-17yearsold
Notes : The unit of observation is an individual. Coefficients are reported with standard errors clustered at the canton level.The variable Coffee is equal to 1 if an individual belongs to a household where the household head reports coffeeproduction as the main industry of employment. The variables Skilled, Unskilled and Nonfarm equal 1 if an individualbelongs to a household where the household head reports the main occupation as skilled agricultural worker, unskilledagricultural worker or a nonfarm occupation, respectively. All regressions include canton fixed effects, industry-occupationfixed effects, year fixed effects, and controls for age, age-squared, gender, gender x age, and gender x age-squared. ***, **, and*indicatesignificanceatthe1,5,and10percentlevels.
39

and being unemployed. Estimates are reported in Table 13 for children aged 13–17. Column
1 reproduces the enrollment estimates from column 2 of Table 12, while columns 2–4 report
estimates of equation (9) where the dependent variables are indicators for each of the following
three categories: in labor force, employed and unemployed.
The estimates show that the increase in school enrollment for children of parents who are in
skilled occupations coincides with a removal of the children from the labor force (column 2) and
in particular from employment (column 3). There is no statistically significant association with
unemployment (column 4). The patterns are also similar for children of parents in unskilled and
other occupations, although the coefficients are less precisely estimated. Overall, the estimates
suggest that FT certification results in children being drawn out of employment and into school.
Given that this effect is felt outside of the coffee sector, a potential explanation is that the
scholarship and bursaries funded through Fair Trade have reduced the costs of schooling and,
therefore, increased enrollment rates. For children of those employed in coffee and in non-farm
occupations, we see no evidence of the decrease in school enrollment coinciding with entry into
the labor force or employment. Thus, it appears as if these children simply become inactive.
5. Conclusions
We have examined the effect of Fair Trade certification on coffee producers in Costa Rica. We
began the analysis by examining the impact of FT certification on the universe of coffee mills
from 1999–2014. We found that FT certification is associated with higher prices and more revenues
when the minimum sales price that is guaranteed by FT is higher than the world price of coffee.
The positive effect on prices is more precisely estimated for exports, but is apparent for domestic
sales as well.
Turning to the impact of FT on households, we found evidence of income benefits to those
living within cantons where there was FT certification, including households outside of the
coffee sector. We also found additional effects of FT for those working within the coffee sector.
FT increases the incomes of skilled coffee growers who are primarily farm owners. We find
no evidence that the hired unskilled workers receive benefits (beyond those that accrue to the
community in general). In addition, non-farm occupations, which are primarily intermediaries,
in the coffee sector are hurt by FT. Since those working in coffee in non-farm occupations have
average incomes that are close to 42% higher than the skilled coffee growers, FT certification
40

results in a decrease in inequality within the coffee sector, as rents are transferred from the
intermediaries to the farm owners. In addition, the skilled coffee farmers who benefit comprise a
much larger proportion of those in the coffee sector (43.5%) than the intermediaries that are hurt
by FT (6.7%).
Motivated by the fact that within Costa Rica, cooperatives commonly use FT premiums to
build schools, purchase school supplies, and provide scholarships, we also examined the effects
of FT certification on education as measured by the enrollment of school-aged children. We found
that FT certification is associated with higher school enrollment for high-school students. This
is true both for children whose parents work within coffee and for those whose parents do not.
Consistent with the estimated effects of FT on the incomes of non-farm occupations in the coffee
sector, we found that the enrollment of their children is adversely affected by FT.
References
Arnot, Chris, Peter C. Boxall, and Sean B. Cash, “Do Ethical Consumers Care About Price? ARevealed Preference Analysis of Fair Trade Coffee Purchases,” Canadian Journal of AgriculturalEconomics, 2006, 54 (4), 555–565.
Atkin, David, “Endogenous Skill Acquisition and Export Manufacturing in Mexico,” AmericanEconomic Review, 2016, 106 (8), 2046–2085.
Bacon, Christopher, “Confronting the Coffee Crisis: Can Fair Trade, Organic, and SpecialtyCofees Reduce Small-Scale Farmer Vulnerability in Northern Nicaragua,” World Development,2005, 33 (3), 497–511.
Beuchelt, Tina D. and Manfred Zeller, “Profits and Poverty: Certification’s Troubled Link forNicaragua’s Organic and Fairtrade Coffee Producers,” Ecological Economics, 2011, 70 (7), 1316–1324.
Brambilla, Irene, Guido Porto, and Alessandro Tarozzi, “Adjusting to Trade Policy: Evidencefrom U.S. Antidumping Duties on Vietnamese Catfish,” Review of Economics and Statistics, 2012,94 (1), 304–319.
de Janvry, Alain, Craig McIntosh, and Elisabeth Sadoulet, “Fair Trade and Free Entry: Can aDisequilibrium Market Serve as a Development Tool?,” Review of Economics and Statistics, 2015,97 (3), 567–573.
Dragusanu, Raluca, Daniele Giovannucci, and Nathan Nunn, “The Economics of Fair Trade,”Journal of Economic Perspectives, 2014, 28 (3), 217–236.
Edmonds, Eric, Nina Pavcnik, and Petia Topalova, “Trade Adjustment and Human CapitalInvestment,” American Economic Journal: Applied Economics, 2010, 2 (4), 42–75.
Fair Trade Foundation, “Fair Trade Certification and the FAIRTRADE Mark,” 2012. OnlineResource.
41

Fairtrade International, “Annual Report, 2013–14: Strong Producers, Strong Future,” 2014.Mimeo.
Hainmueller, Jens, Michael J. Hiscox, and Sandra Sequeira, “Consumer Demand for Fair Trade:Evidence from a Multistore Field Experiment,” Review of Economics and Statistics, May 2015, 97(2), 242–256.
Hiscox, Michael J., Michael Broukhim, and Claire S. Litwin, “Consumer Demand for Fair Trade:New Evidence from a Field Experiment using eBay Auctions of Fresh Roasted Coffee,” 2011.Mimeo, Harvard University.
Instituto del Café de Costa Rica, “Estructura del Sector,” 2017. Online Resource.
, “Historia Del Café en Costa Rica,” 2017. Online Resource.
, “Ley 2762 del 21/06/1961. Régimen Relaciones de Productores, Beneficiadores y ExportadoresCafe,” 2017. Online Resource.
International Coffee Organization, “Historical Data on the Global Coffee Trade,” 2017. OnlineResource.
McCaig, Brian, “Exporting Out of Poverty: Provincial Poverty in Vietnam and U.S. MarketAccess,” Journal of International Economics, 2011, 85 (1), 102–113.
Mendez, V. Ernesto, Christopher M. Bacon, Meryl Olson, Seth Petchers, Doribel Herrador,Cecilia Carranza, Laura Trujillo, Carlos Guadarrama-Zugasti, Antonio Cordon, and AngelMendoza, “Effects of Fair Trade and Organic Certifications on Small-Scale Coffee FarmerHouseholds in Central America and Mexico,” Renewable Agriculture and Food Systems, 2011,25 (3), 236–251.
Miguel, Edward and Michael Kremer, “Worms: Identifying Impacts on Education and Health inthe Presence of Treatment Externalities,” Econometrica, 2004, 72 (1), 159–217.
Podhorsky, Andrea, “A Positive Analysis of Fairtrade Certification,” Journal of Development Eco-nomics, 2015, 116, 169–185.
Ronchi, Loraine, “The Impact of Fair Trade on Producers and Their Organizations: A Case Studywith Coocafe in Costa Rica,” 2002. PRUS Working Paper No 11, University of Sussex.
Ruben, Ruerd and Ricardo Fort, “The Impact of Fair Trade Certification on Coffee Producersin Peru,” in Ruerd Ruben, ed., The Impact of Fair Trade, Wageningen: Wageningen AcademicPublishers, 2009, pp. 75–98.
and , “The Impact of Fair Trade Certfication for Coffee Farmers in Peru,” World Development,2012, 40 (3), 570–682.
Saenz-Segura, Fernando and Guillermo Zuniga-Arias, “Assessment of the Effect of Fair Tradeon Smallholder Producers in Costa Rica: Comparative Study in the Coffee Sector,” in RuerdRuben, ed., The Impact of Fair Trade, Wageningen: Wageningen Academic Publishers, 2009,pp. 117–135.
Sick, Deborah, “Coffee, Farming Families, and Fair Trade in Costa Rica: New Markets, Same OldProblems?,” Latin American Research Review, 2008, 43 (3), 193–208.
Topalova, Petia, “Trade Liberalization, Poverty, and Inequality,” in Ann Harrison, ed., Globaliza-tion and Poverty, Chicago: University of Chicago Press, 2007, pp. 291–335.
42

Valkila, Joni and Anja Nygren, “Impacts of Fair Trade Certification on Coffee Farmers, Cooper-aties, and Laborers in Nicaragua,” Agriculture and Human Values, 2009, 27 (3), 321–333.
Weber, Jeremy, “How Much More Do Growers Receive for Fair Trade-Organic Coffee?,” FoodPolicy, 2011, 36 (5), 678–685.
43

Appendix Tables
Table A1: Summary statistics for mill-level analysis
Variable Observations MeanStandardDeviation
FairTradeCertified(1/0) 2,197 0.10 0.30PriceGapIndicator(1/0) 2,197 0.41 0.49PriceGap(USD/lb) 2,197 0.14 0.22ShareofQuantityReceivedthatisSold(%) 1,740 98.66 9.56DomesticPrice(USD/lb) 2,038 1.13 0.58ExportPrice(USD/lb) 2,000 1.47 0.61DomesticQuantity(lbs) 2,195 278,515 541,605ExportQuantity(lbs) 2,196 1,588,493 2,874,386TotalQuantitySold(lbs) 1,821 15,216 29,747TotalQuantityReceived(lbs) 2,194 1,868,326 3,295,827TotalRevenue(USD) 1,928 2,456,420 4,301,392DomesticRevenue(USD) 2,038 287,257 603,411ExportRevenue(USD) 2,000 2,095,297 3,810,584
44

Table A2: Summary statistics for individual-level analysis
Variable Observations Mean
Standard
Deviation
Individualmontlyincome(Colones) 143,364 185,689 257,087
FairTradeIntensity(FTI)Measures:
Exportweighted(baseline) 143,364 0.09 0.27
Productionweighted 143,364 0.09 0.27
Timeinvariantexportweights 143,364 0.10 0.29
Initial(2001)exportweights 143,364 0.10 0.29
IndicatorifatleastonemillisFTcertified 143,364 0.16 0.37
IndustryofprimaryoccupationisCoffee(1/0) 143,364 0.02 0.14
Primaryoccupationisskilledagriculture(1/0) 143,364 0.06 0.24
Primaryoccupationisunskilledagriculture(1/0) 143,364 0.12 0.32
Primaryoccupationisnonfarmagriculture(1/0) 143,364 0.82 0.38
45