
The Effect of Vandalism on Fibre Composite Structures · 2013-07-08 · This project seeks to...
103
University of Southern Queensland Faculty of Engineering and Surveying The Effect of Vandalism on Fibre Composite Structures A Dissertation submitted by Tristan James Rennie In fulfilment of the requirements of Courses EG4111 and EG4112 Research Project Towards the degree of Bachelor of Engineering (Civil) Submitted: October, 2009
Transcript of The Effect of Vandalism on Fibre Composite Structures · 2013-07-08 · This project seeks to...
University of Southern Queensland
Faculty of Engineering and Surveying
The Effect of Vandalism on Fibre Composite
Structures
A Dissertation submitted by
Tristan James Rennie
In fulfilment of the requirements of
Courses E�G4111 and E�G4112 Research Project
Towards the degree of
Bachelor of Engineering (Civil)
Submitted: October, 2009
Abstract
With the emergence of fibre composite structures in real world civil engineering
structures the effect of damage to these structures needs to be known. This study will
limit to real world tools being used to tamper and damage the fibre composite to desired
levels not just to destruction. The damage to the fibre composites will be from a cutting
implement, a blunt impact implement, a sharp impact implement and small amounts of
fire.
This project seeks to investigate the effect of common types of vandalism on fibre
composite structures, define the typical kinds of vandalism and with what tools they
occur with and whether any of these defects will have a negative effect on the structural
integrity of the beam or structure. Define the amount of damage needed before
noticeable negative effects start to occur in the structure and investigating whether these
effects translate into large scale environments.
The objectives of this research were to research the background information regarding
fibre composites design and the typical usage of the fibre composite materials.
Investigate and document levels of vandalism for testing, analyse and test unaffected
samples to provide a standard. Analyse and test vandalised samples with ranging levels
of vandalism, and investigate the effect of vandalism in integrated fibre composite
structures/elements.
For the sandwich composites the ease of cutting the material has been found and that
has been found to be significant. The panels used also were found to be susceptible to
burning of the skin but the inner core was immune to burning. With the blunt and sharp
impact damage was found to be fairly significant in ultimate load but not very effective
in reducing flexural stiffness. The blunt damage if excessive was very effective.
The pultrusions were found to be extremely resistant to burning where no damage was
found or damage was irrelevant. The pultrusion was also found to be very resistant to
blunt impact where little to no damage was able to be recorded. Like the pultrusions
counterpart the ability to be cut was significant.
Further research is needed in to the fatigue behaviour of damaged fibre composites. The
effect the damage has to the fibre composites needs further refinement and the ability of
the damage to affect large specimen and full scale panels needs to be undertaken.

University of Southern Queensland
Faculty of Engineering and Surveying
E�G4111 Research Project Part 1 &
E�G4112 Research Project Part 2
Limitations of Use
The Council of the University of Southern Queensland, its Faculty of Engineering and
Surveying, and the staff of the University of Southern Queensland, do not accept any
responsibility for the truth, accuracy or completeness of material contained within or
associated with this dissertation.
Persons using all or any part of this material do so at their own risk, and not at the risk of
the Council of the University of Southern Queensland, its Faculty of Engineering and
Surveying or the staff of the University of Southern Queensland.
This dissertation reports an educational exercise and has no purpose or validity beyond this
exercise. The sole purpose of the course "Project and Dissertation" is to contribute to the
overall education within the student’s chosen degree programme. This document, the
associated hardware, software, drawings, and other material set out in the associated
appendices should not be used for any other purpose: if they are so used, it is entirely at the
risk of the user.
Professor Frank Bullen Dean
Faculty of Engineering and Surveying

Certification
I certify that the ideas, designs and experimental work, results, analyses and conclusions
set out in this dissertation are entirely my own effort, except where otherwise indicated
and acknowledged.
I further certify that the work is original and has not been previously submitted for
assessment in any other course or institution, except where specifically stated.
Tristan James Rennie
Student �umber: 0050057235
Signature
Date

Acknowledgements
I would like to acknowledge all those who helped in the preparation of the samples and
the testing of all the samples, particularly:
A/Prof Thiru Aravinthan, for academic assistance and support in the undertaking
of this project.
Dr Mainul Islam, for assistance in the undertaking of this project
Allan Manalo, for assistance in the undertaking of this project
LOC Composites, Pty. Ltd for providing the Sandwich Panels both covered and
non covered samples
Wagners Composite Fibre Technologies (CFT) for providing the 100x100mm
Pultruded Sections
Exel Composites for providing the 50x50mm section and the Wall panel
sections.
Finally, I would like to thank my friends, family and extended family for their support
and time in completing this project.

Contents
Abstract ............................................................................................................................ ii
List of figures and tables ............................................................................................... viii
Figures ....................................................................................................................... viii
Tables ............................................................................................................................. x
Chapter 1 ........................................................................................................................... 1
Introduction ....................................................................................................................... 1
1.1 Introduction .............................................................................................................. 1
1.2 Project Aim .............................................................................................................. 2
1.3 Overview of the Project ........................................................................................... 2
1.4 Dissertation Overview ............................................................................................. 3
Chapter 2 ........................................................................................................................... 4
Literature Review and Fundamentals of Composites ........................................................ 4
2.1 Introduction .............................................................................................................. 4
2.2 Composite Materials ................................................................................................ 4
2.2.1 Fibre Reinforced Composites ............................................................................ 4
2.2.2 Sandwich Composites ....................................................................................... 5
2.2.3 Pultruded Sections ............................................................................................. 5
2.3 Use of Fibre Composite Materials ........................................................................... 6
2.3.1 Use of Pultrusions ............................................................................................. 7
2.3.2 Use of Sandwich panels .................................................................................... 7
2.4 Properties of Sandwich Panels ................................................................................. 7
2.4.1 Properties .......................................................................................................... 8
2.5 Properties of Pultrusions .......................................................................................... 8
2.5.1 Properties .......................................................................................................... 8
2.6 Flexural Testing ....................................................................................................... 9
2.7 Types of Damage ..................................................................................................... 9
2.7.1 Effect of Impact................................................................................................. 9
2.7.2 Effect of Cutting .............................................................................................. 11
2.7.3 Effect of Fire ................................................................................................... 11
2.8 Knowledge Gaps in Previous Research ................................................................. 12
2.9 Summary ................................................................................................................ 13
Chapter 3 ......................................................................................................................... 14
Experimental methodology for the evaluation of damage to fibre composites ............... 14
3.1 Introduction ............................................................................................................ 14
3.2 Sample Description ................................................................................................ 14
3.3 Damage Standard ................................................................................................... 17
3.4 Damage and Sample Preparation ........................................................................... 17
3.4.1 Blunt Impact Test ............................................................................................ 18
3.4.2 Sharp Impact Test ........................................................................................... 19
3.4.3 Cut ................................................................................................................... 20
3.4.4 Fire Damage .................................................................................................... 21
3.4.5 Paint Removal ................................................................................................. 21
3.5 Flexural Test .......................................................................................................... 22
3.6 Summary ................................................................................................................ 23
Chapter 4 ......................................................................................................................... 24
Experimental Investigation into Fibre reinforced Sandwich Panels ............................... 24
4.1 Introduction ............................................................................................................ 24
4.2 Damage .................................................................................................................. 24
4.2.1 Blunt Impact .................................................................................................... 24
4.2.2 Sharp Impact ................................................................................................... 25
4.2.3 Cut Damage ..................................................................................................... 27
4.2.4 Fire Damage .................................................................................................... 27
4.3 Flexure Testing ...................................................................................................... 28
4.4 Control Samples ..................................................................................................... 28
4.5 Blunt Impact Damaged Samples ........................................................................... 31

4.6 Sharp Impact Damaged Samples ........................................................................... 33
4.7 Cut Damaged Samples ........................................................................................... 36
4.8 Fire Damaged Samples .......................................................................................... 39
4.9 Ease of Damage ..................................................................................................... 41
4.10 Paint Remover ..................................................................................................... 41
4.11 Conclusion ........................................................................................................... 41
Chapter 5 ......................................................................................................................... 43
Experimental Investigation into Fibre reinforced Pultruded Sections ............................ 43
5.1 Introduction ............................................................................................................ 43
5.2 Damage .................................................................................................................. 43
5.2.1 Blunt Impact .................................................................................................... 43
5.2.2 Sharp Impact ................................................................................................... 43
5.2.3 Cut Damage ..................................................................................................... 44
5.2.4 Fire Damage .................................................................................................... 45
5.3 Flexure Testing ...................................................................................................... 45
5.4 Control Samples ..................................................................................................... 46
5.5 Blunt Impact Damaged Samples ........................................................................... 47
5.6 Sharp Impact Damaged Samples ........................................................................... 48
5.7 Cut Damaged Samples ........................................................................................... 48
5.8 Fire Damaged Samples .......................................................................................... 49
5.9 Ease of Damage ..................................................................................................... 50
5.10 Paint Remover ..................................................................................................... 51
5.11 Conclusion ........................................................................................................... 51
Chapter 6 ......................................................................................................................... 52
Experimental Investigation into Fibre reinforced Pultruded Sections ............................ 52
6.1 Introduction ............................................................................................................ 52
6.2 Damage .................................................................................................................. 52
6.2.1 Blunt Impact .................................................................................................... 52

6.2.2 Sharp Impact ................................................................................................... 54
6.2.3 Cut Damage ..................................................................................................... 55
6.2.4 Fire Damage .................................................................................................... 56
6.3 Flexure Testing ...................................................................................................... 56
6.4 Control Samples ..................................................................................................... 56
6.5 Blunt Impact Damaged Samples ........................................................................... 58
6.6 Sharp Impact Damaged Samples ........................................................................... 61
6.7 Cut Damaged Samples ........................................................................................... 63
6.8 Fire Damaged Samples .......................................................................................... 66
6.9 Ease of Damage ..................................................................................................... 67
6.10 Paint Remover ..................................................................................................... 67
6.11 Conclusion ........................................................................................................... 68
Chapter 7 ......................................................................................................................... 69
Findings and Conclusions ............................................................................................... 69
7.1 Introduction ............................................................................................................ 69
7.2 Findings ................................................................................................................. 69
7.2.1 Blunt Impact .................................................................................................... 69
7.2.2 Sharp Impact ................................................................................................... 70
7.2.3 Cut Damage ..................................................................................................... 70
7.4 Fire Damage ....................................................................................................... 71
7.3 Conclusion ............................................................................................................. 71
7.4 Future Research ..................................................................................................... 72
References ....................................................................................................................... 73
Appendix ......................................................................................................................... 75
Appendix A – Project Specification ............................................................................ 75
Appendix B – Specimen Measurements ...................................................................... 77
Appendix C – Results Tables ...................................................................................... 82
Appendix D – Flexural Stiffness Results ..................................................................... 87

List of figures and tables
Figures
Figure 1.1 Vandalism on fibre composite bridge .............................................................. 2
Figure 2.1 Typical Cross Section of a Sandwich Panel or Laminate ................................ 5
Figure 2.2 Pultruded Section ............................................................................................. 6
Figure 3.1 Prepared LOC Sandwich Panel ...................................................................... 14
Figure 3.2 Prepared Wagners Pultrusion ......................................................................... 15
Figure 3.3 Exel Composites Square Pultrusion ............................................................... 16
Figure 3.4 Exel Composite Wall Pultrusion .................................................................... 16
Figure 3.5 Blunt Impactor ............................................................................................... 18
Figure 3.6 Sharp Impactor ............................................................................................... 19
Figure 3.7 Layout of cut specimen both sandwich and glass fibre composite ................ 20
Figure 3.8 Cut Damaged Wall Panel ............................................................................... 21
Figure 3.9 BBQ Lighter ................................................................................................... 21
Figure 3.10 Four Point Bending Test .............................................................................. 22
Figure 3.11 MTS testing machine used on the Sandwich Panels .................................... 22
Figure 3.12 MTS testing machine used on the Pultrusions ............................................. 23
Figure 4.1 Blunt Impact Schematic ................................................................................. 25
Figure 4.2 Blunt Impact Damage .................................................................................... 25
Figure 4.3 Sharp Impact Schematic ................................................................................ 26
Figure 4.4 Sharp Impact Damage .................................................................................... 26
Figure 4.5 Cut Damage ................................................................................................... 27
Figure 4.6 Fire Damage ................................................................................................... 28
Figure 4.7 Sandwich Panel Flexure Test ......................................................................... 28
Figure 4.8 Failure of Sandwich Panel with Cover .......................................................... 29
Figure 4.9 Control Specimen with Cover ........................................................................ 30
Figure 4.10 Control Specimen without Cover ................................................................. 31
Figure 4.11 Blunt Damage with Cover ........................................................................... 32
Figure 4.12 Blunt Damage without Cover ...................................................................... 33
Figure 4.13 Failure of Sandwich Composite with Cover Sharp Impact Damage ........... 34
Figure 4.14 Sharp Damage with Cover ........................................................................... 35

Figure 4.15 Sharp Damage without Cover ...................................................................... 36
Figure 4.16 Sandwich Panel With Cover Cut damage .................................................... 37
Figure 4.17 Cut Damage with Cover ............................................................................... 38
Figure 4.18 Cut Damage without Cover ......................................................................... 39
Figure 4.19 Fire Damage with Cover .............................................................................. 40
Figure 4.20 Fire Damage without cover .......................................................................... 40
Figure 5.1 Sharp Impact on 100x100mm section ............................................................ 44
Figure 5.2 Cut Damage to 100x100mm section .............................................................. 45
Figure 5.3 Flexure test on 100x100mm section .............................................................. 46
Figure 5.4 Control Results of 100x100mm section ......................................................... 46
Figure 5.5 Blunt Damaged Results of 100x100mm section ............................................ 47
Figure 5.6 Sharp Damaged Results of 100x100mm section ........................................... 48
Figure 5.7 Cut Damaged Results of 100x100mm section ............................................... 49
Figure 5.8 Fire Damaged Results of 100x100mm section .............................................. 50
Figure 6.1 Blunt Impact Schematic (50x50mm Section) ................................................ 53
Figure 6.2 Blunt Impact Schematic (Wall Panel) ............................................................ 53
Figure 6.3 Blunt Impact Damage to Exel Composite ..................................................... 54
Figure 6.4 Sharp Impact Schematic (50x50mm Section) ................................................ 54
Figure 6.5 Sharp Impact to Exel Composite ................................................................... 55
Figure 6.6 Cut Damage to Exel Composite ..................................................................... 55
Figure 6.7 Flexure Testing of Exel Composites .............................................................. 56
Figure 6.8 Control Results of 50x50mm Samples .......................................................... 57
Figure 6.9 Control Results of Wall Panels ...................................................................... 58
Figure 6.10 Blunt Impact Results of 50x50mm Samples ................................................ 59
Figure 6.11Blunt Impact Failure on Wall Panel .............................................................. 60
Figure 6.12 Blunt Impact Results of Wall Panels ........................................................... 60
Figure 6.13 Sharp Impact Results of 50x50mm Samples ............................................... 61
Figure 6.14 Sharp Impact Failure .................................................................................... 62
Figure 6.15 Sharp Impact Results of Wall Panels ........................................................... 62
Figure 6.16 Cut Failure in 50x50mm section .................................................................. 63
Figure 6.17 Cut Damage Results of 50x50mm Samples ................................................. 64
Figure 6.18 Cut Damage Failure of Wall Panel .............................................................. 65
Figure 6.19 Cut Damage Results of Wall Panels ............................................................ 65
Figure 6.20 Fire Damage Results to 50x50mm Samples ................................................ 66

Tables
Table 3.1 Sample Preparation ......................................................................................... 17
Table 4.1 Ease of Damage to Sandwich Panels .............................................................. 41
Table 5.1 Ease of Damage to 100x100mm section ......................................................... 50
Table 6.1 Ease of Damage to 50x50mm section ............................................................. 67
Table 6.2 Ease of Damage to Wall Panel ........................................................................ 67
Table Appendix B.1 Specimen Measurements Non Covered Sandwich Panels ............. 77
Table Appendix B.2 Specimen Measurement Asphalt Covered Sandwich Panels ......... 78
Table Appendix B.3 Specimen Measurement 100x100mm Section ............................... 79
Table Appendix B.4 Specimen Measurement 50x50mm Section ................................... 80
Table Appendix B.5 Specimen Measurement Wall Panel .............................................. 81
Table Appendix C.1 Covered Sandwich Panel ............................................................... 82
Table Appendix C.2 Non Covered Sandwich Panel Results ........................................... 83
Table Appendix C.3 100x100mm Pultrusion Results ..................................................... 84
Table Appendix C.4 50x50mm Pultrusion Results ......................................................... 85
Table Appendix C.5 Pultruded Wall Panel Results ........................................................ 86
Table Appendix D.1 Flexural Results Non Covered Sandwich Panel ............................ 87
Table Appendix D.2 Flexural Results Asphalt Covered Sandwich Panel ...................... 88
Table Appendix D.3 Flexural Results 100x100mm Section ........................................... 89
Table Appendix D.4 Flexural Results 50x50mm Section ............................................... 90
Table Appendix D.5 Flexural Results Wall Panel .......................................................... 91

Chapter 1
Introduction
1.1 Introduction
Fibre composites as a material have been around since the 19th century as modern
composites. These materials have been used in many forms and applications to date.
The main areas that have been used have been military, aeronautical and marine
applications. In recent years fibre composites have seen increasing use in civil
engineering and civil infrastructure.
Composites and in particular fibre composites are materials that are made by combining
a fibre with a resin. In this study two types of fibre composite will be examined. One of
which is sandwich panels. Sandwich panels also referred to as laminate composites
consist of two fibre reinforced skins bonded to a core material. Both the skin and the
core vary in material and in property. Second of which is glass reinforced polymer
composite. This is a pultruded section and is formed with a polymer resin and fibres,
where both fibres and polymer resin can be varied to produce a wide range of
properties.
Originally the Centre of Excellence in Engineered Fibre Composites was approached by
the Department of Main Roads to investigate the effect of common types of vandalism
on fibre composite structures, define the typical kinds of vandalism and with what tools
they occur with and whether any of these defects will have a negative effect on the
structural integrity of the beam or structure. Define the amount of damage needed
before noticeable negative effects start to occur in the structure.

Figure 1.1 Vandalism on fibre composite bridge
1.2 Project Aim
This project seeks to investigate the effect of common types of vandalism on fibre
composite structures, define the typical kinds of vandalism and with what tools they
occur with and whether any of these defects will have a negative effect on the structural
integrity of the beam or structure. Define the amount of damage needed before
noticeable negative effects start to occur in the structure and investigating whether these
effects translate into large scale environments.
1.3 Overview of the Project
The main objectives of this project are to:
− Research the background information regarding fibre composites design and the
typical usage of the fibre composite materials.
− Investigate and document levels of vandalism for testing.
− Analyse and test unaffected samples to provide a standard.
− Analyse and test vandalised samples.

− Test ranging levels of vandalism.
− Investigate the effect of vandalism in integrated fibre composite
structures/elements.
− Prepare documented vandalism report detailing procedure and results of
vandalism.
1.4 Dissertation Overview
This dissertation covers the aim of the study and covers all the objectives described
above. This dissertation describes the work which was undertaken and discusses the
results and conclusions that where obtained. A literature review was undertaken to
determine a background of knowledge about fibre composites, there usage and
applications and the types of research that had been previously been completed in the
field of damage on fibre composites.
Specimens were prepared of both sandwich composites and three different types and
sizes of pultrusion. These specimens were tested without damage and with a range of
different types of damage and are described along with the results of the tests. Finally
conclusions are drawn from the results of the testing and areas are found that further
research is needed.

Chapter 2
Literature Review and Fundamentals of Composites
2.1 Introduction
With the emergence of fibre composite structures in real world civil engineering
structures the effect of damage to these structures needs to be known. This study will
limit to real world tools being used to tamper and damage the fibre composite to desired
levels not just to destruction. The damage to the fibre composites will be from a cutting
implement, a blunt impact implement, a sharp impact implement and small amounts of
fire. There has been a small amount of previous work done on some of these areas and
these are discussed later.
2.2 Composite Materials
Composites are made from a mixture of a number of different materials. Most
composites can be made from just two components, a matrix or binder which binds or
holds the fibres together. A composite material can be varied to give specific properties
which include strength, bending stiffness, chemical resistance etc. For the purpose of
this study only two types of composite will be studied and these can be classified into
two distinct groups, Sandwich or Laminated panels and Pultrusions. They are described
later.
2.2.1 Fibre Reinforced Composites
Reinforcement in fibre composites come in three basic forms, fibres, particles and
whiskers. Fibres are made of glass, other polymers, ceramics or metals. The
reinforcement is required primarily to increase strength and stiffness of the composite.
These fibres are the primary load carrying components of the fibre composite material.
In today’s market there are many types and forms of reinforcement. Varying from glass
fibres to others forms like carbon and aramid fibres. In these different types of fibres the
composition can change from one type to another also the properties of each type of
glass or carbon fibre changes (Reinhart, 1998).
The use of each type of fibre also influences the resins used and the adhesive agents.
The way the fibres are used differs between sandwich panels or laminate sections and

pultruded sections. The resins are typically an epoxy, vinylester or polyester
thermosetting plastic.
2.2.2 Sandwich Composites
The sandwich panels or laminates that will be used in this study consist of three parts
that are formed together. This consists of two strong composite reinforcement layers
bonded to a core material. The skins are designed to provide the strength and stiffness to
the panel (Van Erp, G., Rogers, D 2008). These skins are made of woven fibres
typically glass fibres layered in directions to provide the best possible strength and
stiffness properties. There are numerous ways the fibres can be placed all with different
and specific final characteristics. These fibre layers are combined in a resin to protect
the fibres and ensure that the fibres remain in the most effective location and direction.
Figure 2.1 Typical Cross Section of a Sandwich Panel or Laminate
These skins that hold the fibre reinforcement are bonded to a core. This core provides
the shear stiffness and the local structural performance (Van Erp, G., Rogers, D 2008).
This core can be made from a number of materials with different properties and
characteristics. This core is bonded to the skin of fibre reinforcing which means that the
resin used in the skin has to not be chemically repelled by the core. The bond between
the core and the skin has a major bearing on the final strength of the laminate.
2.2.3 Pultruded Sections
A pultruded sections differs from sandwich panels as it comes from a fibre composite
manufacturing process producing continuous lengths of fibre reinforced polymer in a
range of structural shapes. The pultrusion is made from a liquid resin and the
reinforcing fibres (Van Herk, H., Rosselli, F. 2008). The liquid resin that is used
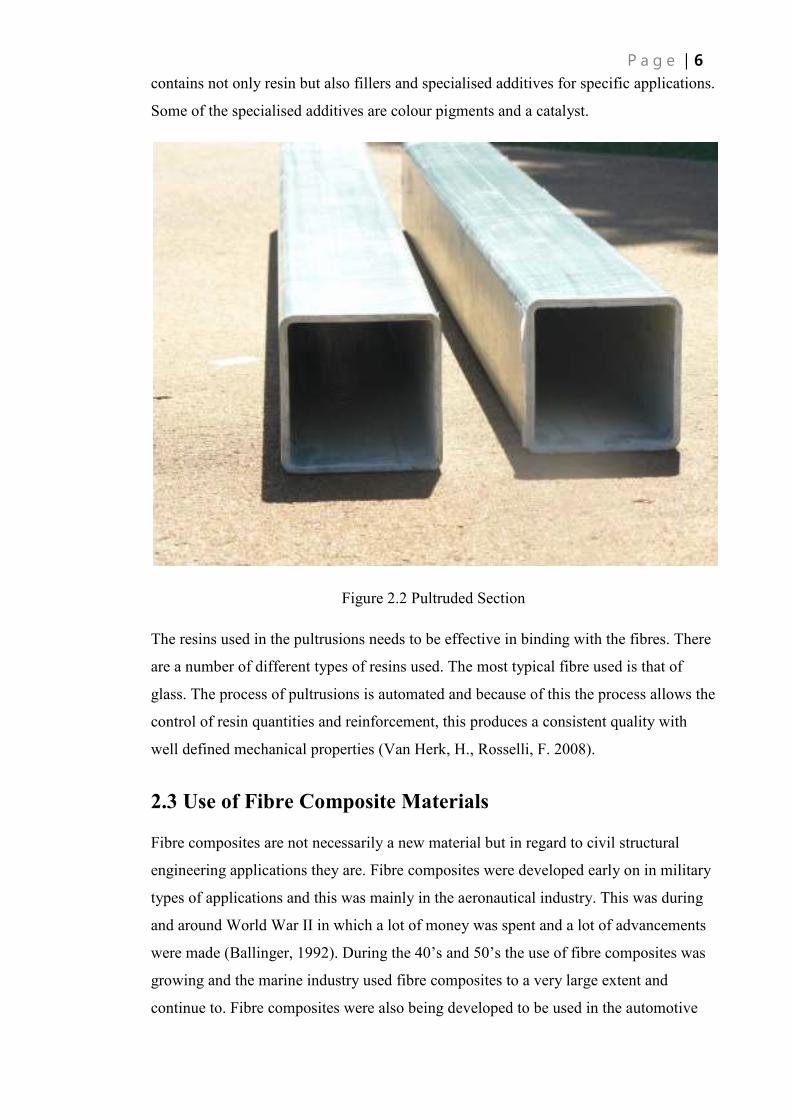
contains not only resin but also fillers and specialised additives for specific applications.
Some of the specialised additives are colour pigments and a catalyst.
Figure 2.2 Pultruded Section
The resins used in the pultrusions needs to be effective in binding with the fibres. There
are a number of different types of resins used. The most typical fibre used is that of
glass. The process of pultrusions is automated and because of this the process allows the
control of resin quantities and reinforcement, this produces a consistent quality with
well defined mechanical properties (Van Herk, H., Rosselli, F. 2008).
2.3 Use of Fibre Composite Materials
Fibre composites are not necessarily a new material but in regard to civil structural
engineering applications they are. Fibre composites were developed early on in military
types of applications and this was mainly in the aeronautical industry. This was during
and around World War II in which a lot of money was spent and a lot of advancements
were made (Ballinger, 1992). During the 40’s and 50’s the use of fibre composites was
growing and the marine industry used fibre composites to a very large extent and
continue to. Fibre composites were also being developed to be used in the automotive

industry during this time and it was found to be feasible (Lubin, 1982). During recent
time’s fibre composites have begun begin used in a structural environment and for the
purpose of this study only pultrusions and sandwich panels will be discussed below.
2.3.1 Use of Pultrusions
Pultrusions have been used in a wide range of applications these include applications
such as cable ladders, stairways and cooling towers (Van Herk, H., Rosselli, F. 2008).
The pultruded section has a widely established and strong niche market in the corrosion
and electricity industry. In more recent times pultrusions have been used in more civil
engineering or civil infrastructure situations. Civil applications that are now becoming
far more common are bridge girders, boardwalks, cross arms and complete road bridges
(Kemp, M. 2008). The bridge girder is going to become an ever increasingly common
application of the pultruded section.
2.3.2 Use of Sandwich panels
Sandwich panels have been used in a wide range of applications. Panels in recent times
have been specifically designed for civil engineering applications these include railway
sleepers, bridge decks, bridge girders and water proof flooring (Van Erp, G., Rogers, D
2008). A composite bridge girder was developed and is replacing existing timber
structures. This application of the sandwich panel is becoming more common and will
increase in the years to come. The sandwich panels are also used in stairways as both
the support to the structure and the walkway. They are beginning to be widely used as
bridge decks in civil infrastructure. The same panels used in civil infrastructure and as
decks in stairways are in recent times being bonded together to create versatile new
bridge girders.
2.4 Properties of Sandwich Panels
The flexural properties of sandwich panels vary with the types, amounts and structure of
the composite. There are numerous types of composite materials and with this
consideration there are no common mechanical properties and the values being quoted
can sometimes lead to a wide range of values for the same property of the same material
(Soden, P, 1998). The direction of the fibres used no matter the type determines many
of the properties.
2.4.1 Properties
A common failure mechanism of sandwich composites during flexure is the fracture or
breakage of the reinforcing fibres. Therefore the main focus for the strength and
properties of the composite are derived from the fibre reinforcement that is present. The
basic types of fibres used in civil engineering field are glass fibres, carbon fibres and
aramid fibre.
Glass fibres are the most common in the industry because of their wide availability
which in turn makes the cost very attractive. There are a number of other factors these
include handling ability, the useful properties and the history of good experience in the
industry (Reinhart, 1998). Glass fibre properties do vary depending on type but have
several characteristics that are common and stand out. One of which is the fibres
possess a high tensile strength; they also possess a high heat resistance and thermal
behaviour. The fibres also hold a good chemical, moisture and fire resistance.
Carbon fibres offer high performance reinforcing, they offer high strength, stiffness and
offer low weight but these properties come at a heavily increased cost. There are other
factors that they fibre stiffness, strength, low density and an increased long-time load
performance. Aramid fibres are not widely used like carbon and glass fibres. Aramid
fibres are used in specialised situations as there major advantage is their toughness and
performance under impact. In the case of this study the sandwich composites are
reinforced with glass fibres.
2.5 Properties of Pultrusions
Much like sandwich composites pultrusions can be varied to serve a particular purpose.
There are a number of different types of fibres used in modern pultrusions and a number
of different resins used. Some properties in pultrusions are determined primarily by the
resins and the others are determined by the reinforcement.
2.5.1 Properties
Much the same as sandwich panels the direction of the fibre reinforcing can determine
the overall strength and many of the properties (Van Herk, H., Rosselli, F. 2008).
Pultruded sections are made in constant cross sections, typically in the shape of existing
steel sections. Pultruded fibre composites commonly have high strength which can be
stronger than structural steel on a kilogram-for-kilogram basis. Another common
property is the light weight in which pultrusions are commonly 20-25% lighter than that

of structural steel. Pultruded sections also hold some properties that sandwich
composites hold like corrosion and rot resistant and also low temperature capabilities.
2.6 Flexural Testing
The main placement of both sandwich panels and pultruded sections for the purpose of
this study in civil engineering and more specifically civil infrastructure applications are
that of a bending environment. In case of the sandwich panels there usually in the form
of bridge decks that are under bending being the main problem and this is also true for
the bridge girders or beams. In the case of the pultruded sections this is also true. They
are placed mainly as bridge girder or beams and this places them under bending or
flexural environment.
The testing procedure for flexural testing in this project will be that of four point
bending, which is a testing procedure like that of three point bending (Tagarielli, VL,
Fleck, NA, Desphande, VS 2004). This test is done by applying two point loads onto the
specimen while the specimen is simply supported. With the specimen situated in this
way the specimen undergoes a flexural loading in the y direction. This allows flexural
stiffness and flexural modulus of elasticity of the specimen to be calculated.
2.7 Types of Damage
The types of damage that this study will be focused on will be the effect of impact,
cutting and fire or burning. The area of impact damage in recent times has been a strong
topic for discussion; this can be attributed to the increase in use in the aerospace and
marine industries. The investigation into impact on composite sandwich structures
remains an active research topic and is receiving much attention (Schubel, P. M, et al,
2004). Cutting has not seen the activity of impact research but is never the less
important; it will be focused on orthogonal cuts along the base of the samples. The
effect of fire has been receiving attention in the form of bush fire protection of
structures.
2.7.1 Effect of Impact
There have been several common failure modes of sandwich panels identified which
include core indentation/cracking, facesheet buckling, delamination within the facesheet
and debonding between the facesheet and core (Schubel, P. M, et al, 2004). The
susceptibility of laminated composite structures to damage resulting from impact for

compression-loaded structures is a well known phenomenon (Kärger, L, Baaran, J et al,
2009).
Shubel et al used woven-carbon/epoxy facesheets and a PVC foam core and studied the
effect of central point impact in a drop mass apparatus. The impact testing consisted of a
drop tower with a free-falling mass which was used to impact the sandwich plates. The
free-falling mass was dropped from a range of heights to induce damage. He found that
the surface damage was not the only form of damage to the sandwich composites there
was also localised delamination around the impact zone that was not apart from the
outside.
Luo et al investigated the effect of damage propagation in composite plates and
evaluated the impact damage initiation. The impact tests were conducted using a drop
mass apparatus. The investigation used low energy impact and the weight and height at
which the mass was dropped was much smaller than that of Shubel et al investigation.
Luo et al found that the main characters of impact damage can be predicted by two
properties, threshold strength and propagation strength for matrix cracking. He found
under the low energy impact there were no matrix failure at the impact centre and also
there were no fibre breakage. The approach using the threshold strength and
propagation strengths can predict whether the composite structure is damaged or by
which extent the damage develops.
The tolerance assessment and damage resistance of composite structures under low-
velocity impact was investigated by Andreas P. Christoforou. He found that for constant
impact energy the nature of the response varied according to the type of impactor and
structural characteristics. These factors influenced the type of damage and the extent of
damage degradation to the fibre composite.
Three critical thresholds for high energy impacts have been investigated by Shyr and
Pan. The investigation found that the three thresholds were; threshold of delamination
failure, major damage threshold and perforation energy threshold. The thresholds were
only apparent for high energy impacts and were not apparent for low energy impacts. It
was found that thicker laminates were governed by fibre fracture were thinner laminates
were more susceptible to delamination.
Chotard and Benzeggagh investigated the effect of low-velocity impacts on pultruded
sections. The pultrusions were glass/polyester pultruded beams. The investigation found
that much like sandwich composites the size of the impactor had a major influence. A

big impactor would produce less delamination than a small-impactor. The study also
found that filler quantities in the members also contributed to damage severity. It was
found that all the samples had internal shear cracking and interfacial delamination and
one sample with low filler quantity had catastrophic failure in the form of great open
longitudinal cracks on the rear face.
Holden et al also investigated the static indentation and impact behaviour of pultruded
sections. The study used three specimens each of a glass reinforced polymer
pultrusions. The investigation found that backface cracking could be predicted by front
face permanent indentation. Also the residual compressive strength of the material could
be determined by the size of the backface crack.
2.7.2 Effect of Cutting
The effect of cutting damage or sharp impact damage in fibre composites is an area of
limit resource. Most areas of interest and attract the most attention is in regard to impact
behaviour of ranging size impactors but does not include point driven or sharp
impactors. Madenci et al investigated the effect of centre-cracked composite laminates
and provided a theory for damage prediction.
The study was centred on two-ply laminates and three-ply laminates of different fibre
orientations with a centre crack. The study found that the damage produced matrix
cracking and fibre breakage and delamination. In this case the damage occurred in the
direction parallel to the fibres was primarily splitting. The study found that the splitting
at the top and bottom of the crack produced delamination.
2.7.3 Effect of Fire
The effect of fire damage on fibre composites is another area that is receiving increasing
discussion. Mathys and Burchill investigated the burning of polyester and vinylester
fibre glass composites. This study focused on analysis of mass loss and damage depth
by the combustion of styrenic resins and their fibre glass compositions. The study found
that mass loss rates at selected heat flux were found to be linearly related to those at
different heat flux. Damage depth was also found to be linearly related to mass loss and
could be predicted as a function of time.
Mouritz and Gardiner investigated the effect fire-induced damage on the edgewise
compression properties of polymer sandwich composites. The study used two types of
sandwich composites, one highly flammable the other had a low flammability rating. It

was found that the compression stiffness and strength of both sandwich composites
decreased rapidly with increasing heat flux and heating time. This was found to be
accredited to decomposition of the faceskin and foam core.
Gardiner et al investigated the tensile and compressive properties of FRP composites
with localised fire damage. The study found that tensile stiffness, tensile strength and
compressive stiffness is determined by the amount of charred damage whereas the
compressive strength is determined by the size and depth of the delamination cracks.
2.8 Knowledge Gaps in Previous Research
There has been previous research conducted into the behaviour and the properties of
both fibre reinforced sandwich panels and fibre reinforced pultruded sections (Chotard,
TJ, Benzeggagh, Rosato, DV and Reinhart, TJ) along with many others. There has been
limited research into the effect damage has had to fibre composites (Burchill, PJ,
Mathys, Z, Gardiner, CP, Luo, B, Agwai, A, Madenci, E).
With the previous research conducted there however is a gap in the previous research in
regard to the effect damage has on fibre composites. Burchill, PJ and Mathys, Z
conducted research into the behaviour of fire damaged composites, this research was
into high levels of fire damage from the likes of bush fires. This is at the extreme end of
the damage spectrum and effect of lower levels of fire damage is needed, so that small
amounts of damage are not ignored until the high levels are achieved.
Luo, B, Agwai, A, and Madenci, E conducted research into the effect of impacts on
composite plates. This however leaves a knowledge gap of smaller impacts on both
plates and structures. The impact damage to the pultrusions and the effect a smaller
impact has on the sandwich panel is not known.
However, there is a knowledge gap in that in the previous research the effect of cutting
damage has not been researched, with the effect the cutting damage has no both
sandwich panels and pultrusions is not known. There is also the knowledge gap in that
the effect a sharp impact has on fibre composites. With the fact the sharp impact is
much like a cross between the blunt impact and the cut damage, the effect his has on
fibre composites is not known.

2.9 Summary
This chapter has provided some background on both sandwich panels and fibre
reinforced pultrusions. For the purpose of this project this chapter has also provided a
brief overview of the usage of fibre composites in civil and structural engineering
applications. Fibre composites have been proven to be capable materials in many fields
and are commonly used in aeronautical and marine situations. They exhibit significant
potential to become mainstream materials for civil applications.
There is increasing research into the use of fibre composites and an ever increasing push
into civil applications. Though most of the research shown in this chapter is from fields
other than civil engineering there is lessons learnt. It is clear from the studies completed
by Gardiner, C.P, Mathys, Z, Mouritz A.P that damage is a serious problem to fibre
composites. These studies hold valuable insight to what is needed for further studies
into civil applications.
There is a lack of research into the flexural behaviour of all types of damage cover in
this chapter. There is increasing research and attention on the impact damage to fibre
composites. There is still a lack of this in the civil sector. The effect of fire damage is
also attracting attention and has shown to be an area of needed research in the fact that
its effect is so severe. There is also a lack of research in the area of cut or sharp damage.

Chapter 3
Experimental methodology for the evaluation of
damage to fibre composites
3.1 Introduction
This study is investigating the effect various types of damage have to fibre composites.
The test will be performed on both sandwich composites and three different types of
glass fibre pultrusions. The types of damage will be of common occurring vandalism.
These will include blunt impact, sharp impact, cutting and painting.
3.2 Sample Description
The sandwich panels used in this project are a commercially available material and
manufactured by LOC composites. They are produced in large panels. The panels that
were used have been surface treated with an asphalt top. These were also compared to
unsurfaced samples. The samples were cut from both panels. The covered samples were
cut to 500 mm x 50 mm. Some prepared samples can be seen in figure 3.1.
Figure 3.1 Prepared LOC Sandwich Panel

The first glass fibre pultrusions that were used in this study are also commercially
available and these sections are manufactured by Wagners Composites. These
pultrusions come in many standard structural sections. The sections used for this project
were a commonly used standard section of 100mm x 100mm. This had a thickness of
5mm. The Wagners composite is made using a poly ester resin and uses glass
reinforcing fibres in 0o, 90
o and 45
o directions.
Figure 3.2 Prepared Wagners Pultrusion
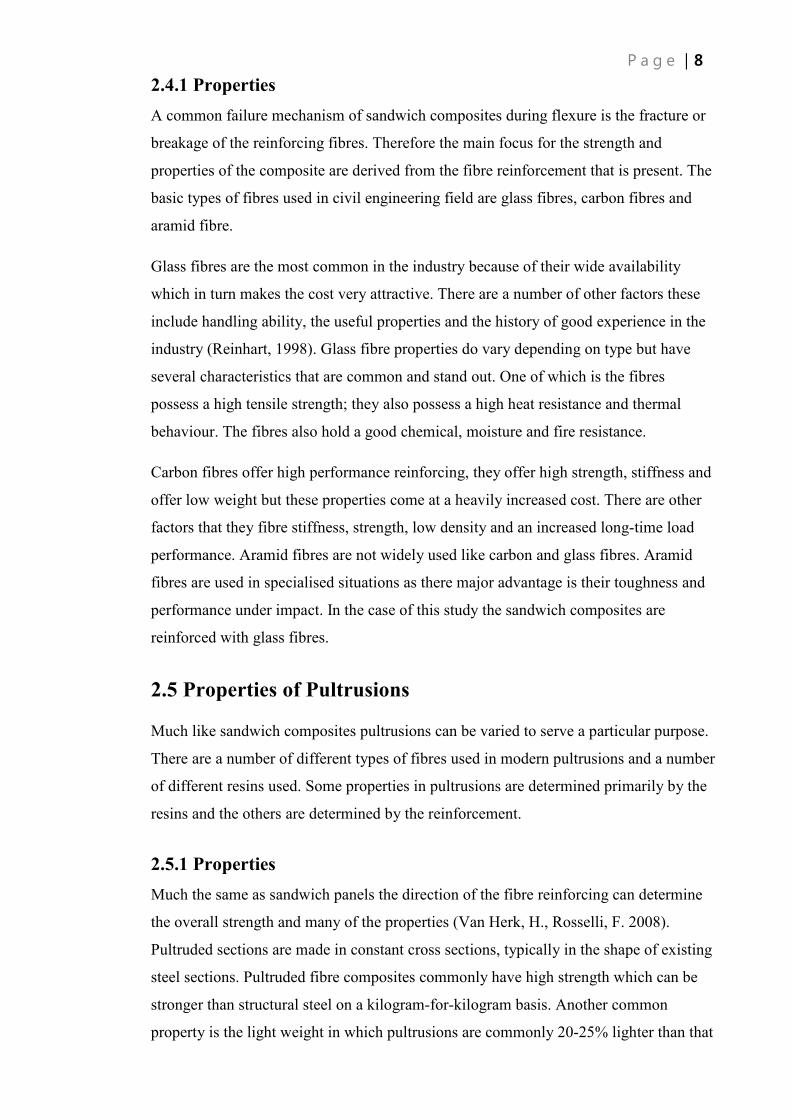
The second glass fibre pultrusion that were used were also commercially available and
these sections were manufactured by Exel Composites. There were two different types
of pultrusion by Exel Composites used in the project. The first product was a 50mm x
50mm section with a 6mm thickness.
These pultrusions differed to the Wagners one in multiple facets. The Exel composite
uses a poly ester resin and glass fibres in both the 0o and 90
o directions. The pultrusion
instead of using 45o fibres as well 0
o and 90
o direction fibres uses a continuous filament
mat to provide the shear strength and rigidness needed.
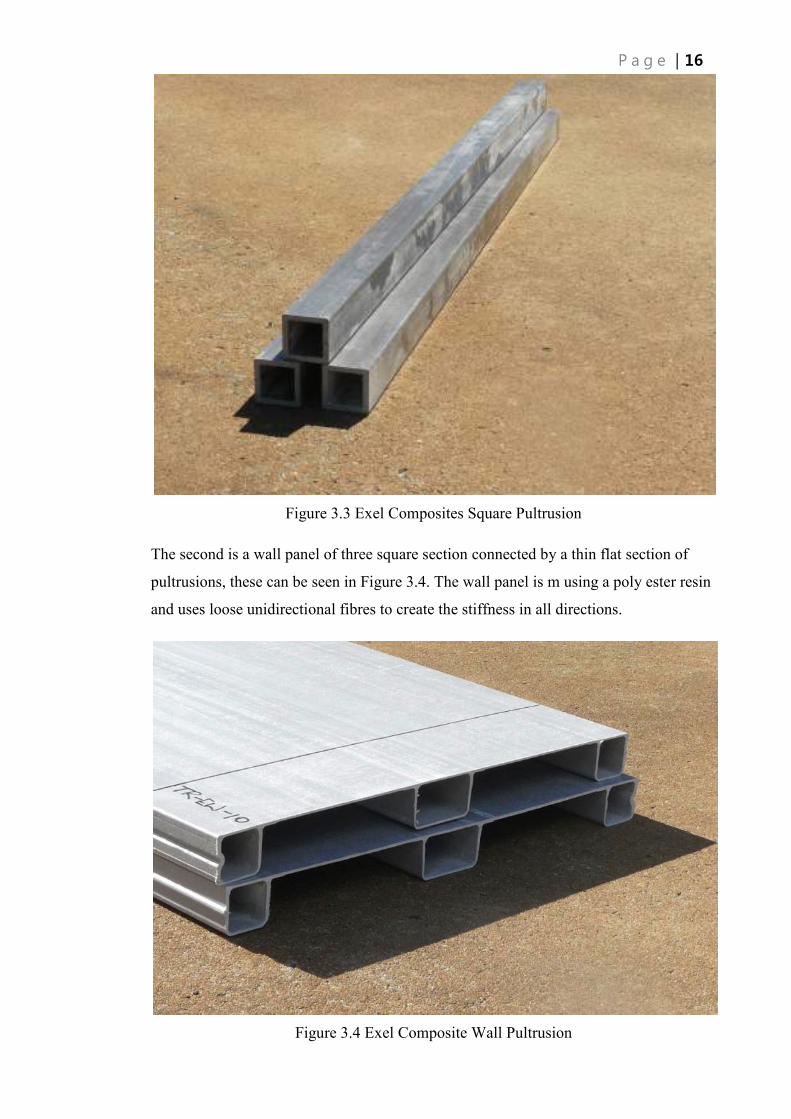
Figure 3.3 Exel Composites Square Pultrusion
The second is a wall panel of three square section connected by a thin flat section of
pultrusions, these can be seen in Figure 3.4. The wall panel is m using a poly ester resin
and uses loose unidirectional fibres to create the stiffness in all directions.
Figure 3.4 Exel Composite Wall Pultrusion
For both the sandwich composite and all the pultrusions undamaged samples were
tested to find original properties and this was compared to damaged samples.
3.3 Damage Standard
Currently there is no standard to conduct damage to as the effect damage has on fibre
composites has not been previously researched. This standard or means of damage
needed to be developed. With no standard the damage needed to be able to be repeated
with a strong level of accuracy and importantly have a high level of consistency. The
damage was made so that it could be potentially reproduced at a later date. The
procedures of each of the damage types are discussed later in this chapter. It is also
discussed in a more detail in each chapter relating to the different fibre composites.
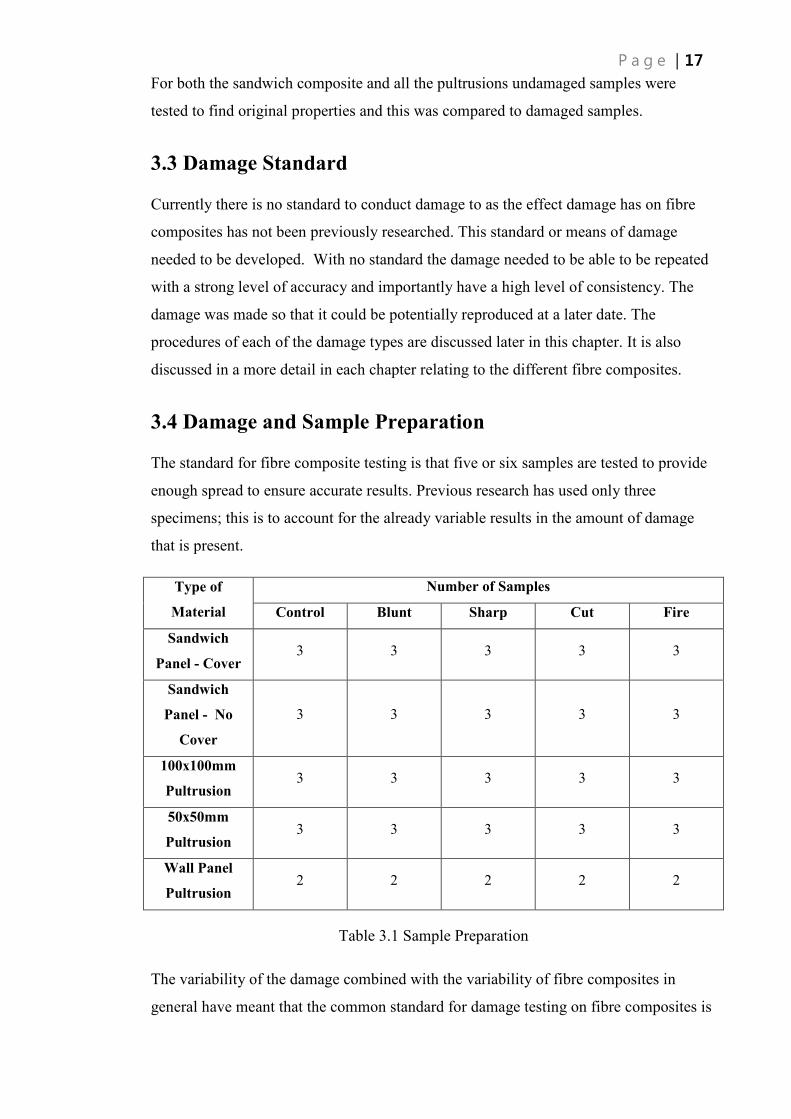
3.4 Damage and Sample Preparation
The standard for fibre composite testing is that five or six samples are tested to provide
enough spread to ensure accurate results. Previous research has used only three
specimens; this is to account for the already variable results in the amount of damage
that is present.
Type of
Material
�umber of Samples
Control Blunt Sharp Cut Fire
Sandwich
Panel - Cover 3 3 3 3 3
Sandwich
Panel - �o
Cover
3 3 3 3 3
100x100mm
Pultrusion 3 3 3 3 3
50x50mm
Pultrusion 3 3 3 3 3
Wall Panel
Pultrusion 2 2 2 2 2
Table 3.1 Sample Preparation
The variability of the damage combined with the variability of fibre composites in
general have meant that the common standard for damage testing on fibre composites is
three specimens for this reason the project used three specimens for each of the damage
types including the control samples. For the size of the wall panel the literature
suggested the use of only two samples per types of damage and control alike. For this
project this was also followed.
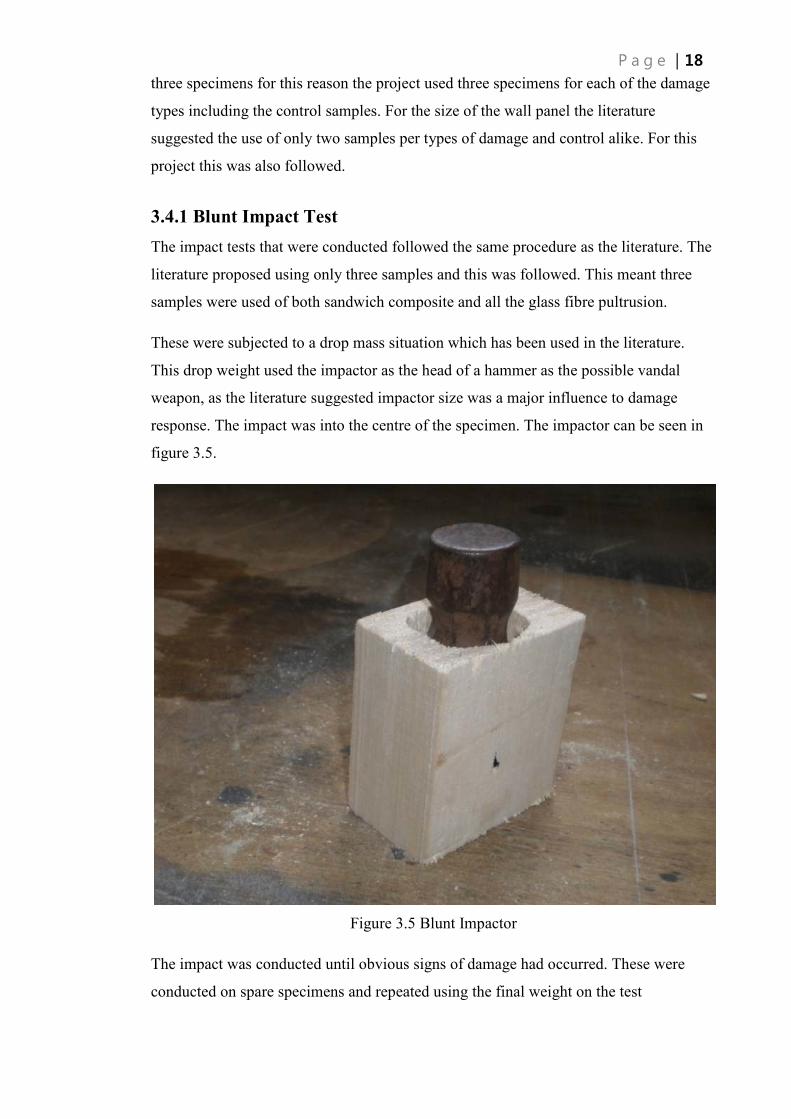
3.4.1 Blunt Impact Test
The impact tests that were conducted followed the same procedure as the literature. The
literature proposed using only three samples and this was followed. This meant three
samples were used of both sandwich composite and all the glass fibre pultrusion.
These were subjected to a drop mass situation which has been used in the literature.
This drop weight used the impactor as the head of a hammer as the possible vandal
weapon, as the literature suggested impactor size was a major influence to damage
response. The impact was into the centre of the specimen. The impactor can be seen in
figure 3.5.
Figure 3.5 Blunt Impactor
The impact was conducted until obvious signs of damage had occurred. These were
conducted on spare specimens and repeated using the final weight on the test

specimens. These impacts were then cross checked by hand to see if the damage could
be reproduced by hand by a potential vandal.
3.4.2 Sharp Impact Test
The literature proposed using three samples and this was followed. Three samples were
used for both sandwich composites and glass fibre reinforced composites.
A drop weight apparatus was used in performing the damage. The impactor used was a
screw driver. The sharp impactor can be seen in figure 3.6.
Figure 3.6 Sharp Impactor
This was again tested on spare samples in which the weight was altered till damage was
apparent and this was then repeated on the test samples. This procedure was used for the
sandwich panels only.
For the two different pultrusions the same screw driver impactor was used and was
hammered into the pultrusion to approximately 2mm depth at the centre line.
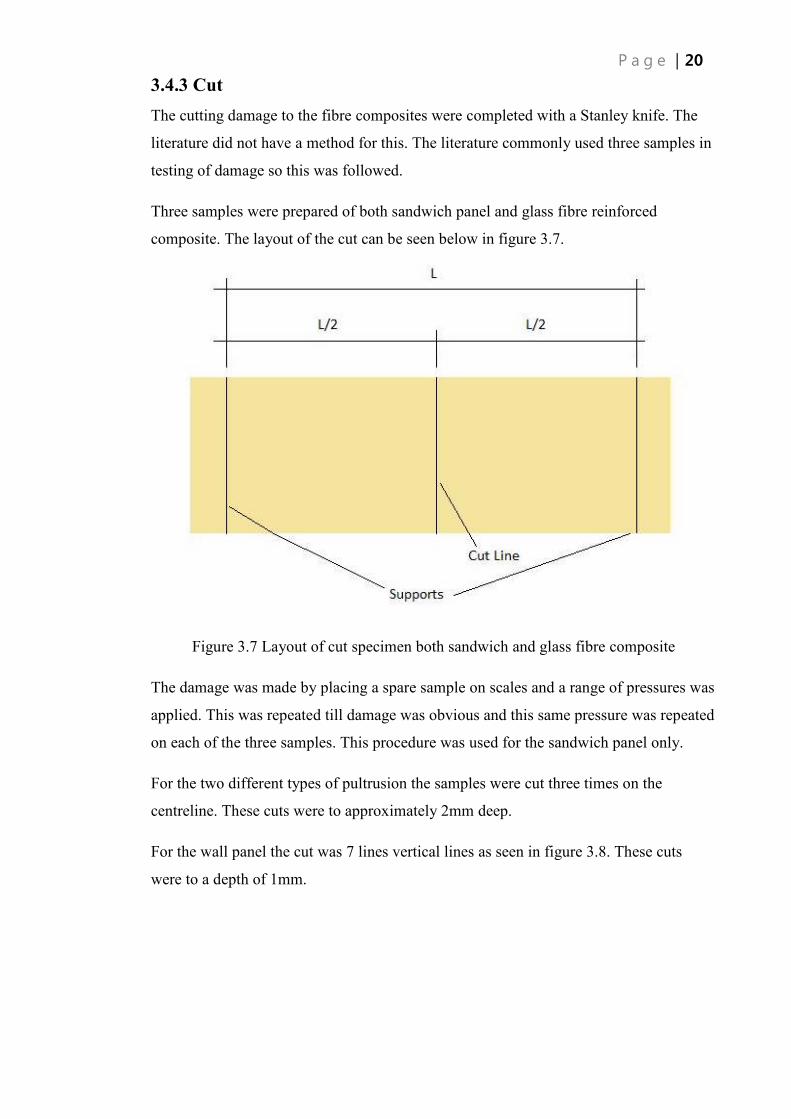
3.4.3 Cut
The cutting damage to the fibre composites were completed with a Stanley knife. The
literature did not have a method for this. The literature commonly used three samples in
testing of damage so this was followed.
Three samples were prepared of both sandwich panel and glass fibre reinforced
composite. The layout of the cut can be seen below in figure 3.7.
Figure 3.7 Layout of cut specimen both sandwich and glass fibre composite
The damage was made by placing a spare sample on scales and a range of pressures was
applied. This was repeated till damage was obvious and this same pressure was repeated
on each of the three samples. This procedure was used for the sandwich panel only.
For the two different types of pultrusion the samples were cut three times on the
centreline. These cuts were to approximately 2mm deep.
For the wall panel the cut was 7 lines vertical lines as seen in figure 3.8. These cuts
were to a depth of 1mm.

Figure 3.8 Cut Damaged Wall Panel
3.4.4 Fire Damage
This test was similar to that of the literature but on a much smaller scale. The literature
was aimed at bush fire and extreme heats. The tests completed were of both sandwich
composites and glass fibre composites. Three samples were again used to follow the
literature. The lighter can be seen in figure 3.9.
Figure 3.9 BBQ Lighter
The fire damage tests were conducted using over the counter bbq lighters. These small
bbq lighters were used on sample pieces to determine the length of flame required to
cause damage this was then repeated for the similar time on the test specimens. The fire
damage was done to the centre of the test specimens.
3.4.5 Paint Removal
This test was not designed to see property change; this test was designed to see the
effect of paint and its attempted removal. This was not covered by literature. A sample
of both sandwich composite and glass fibre reinforced composite were collected. These
samples were painted with typical over the counter black spray paint. The spray was for
a 5 second burst of paint. This was then attempted to be removed after dry by a common
type of paint remover.

3.5 Flexural Test
The flexural tests were completed on the MTS Alliance RT/10 testing machine. The
purpose of the test is to determine the flexural strength of the material before and after
damage. The tests involved failing the specimens using a 4-point bending test. This can
be seen below in figure 3.10.
Figure 3.10 Four Point Bending Test
The test machine records the data during the test and displays many of the properties in
real time. The program also records load and deflection, this can be seen in figure 3.11.
Figure 3.11 MTS testing machine used on the Sandwich Panels
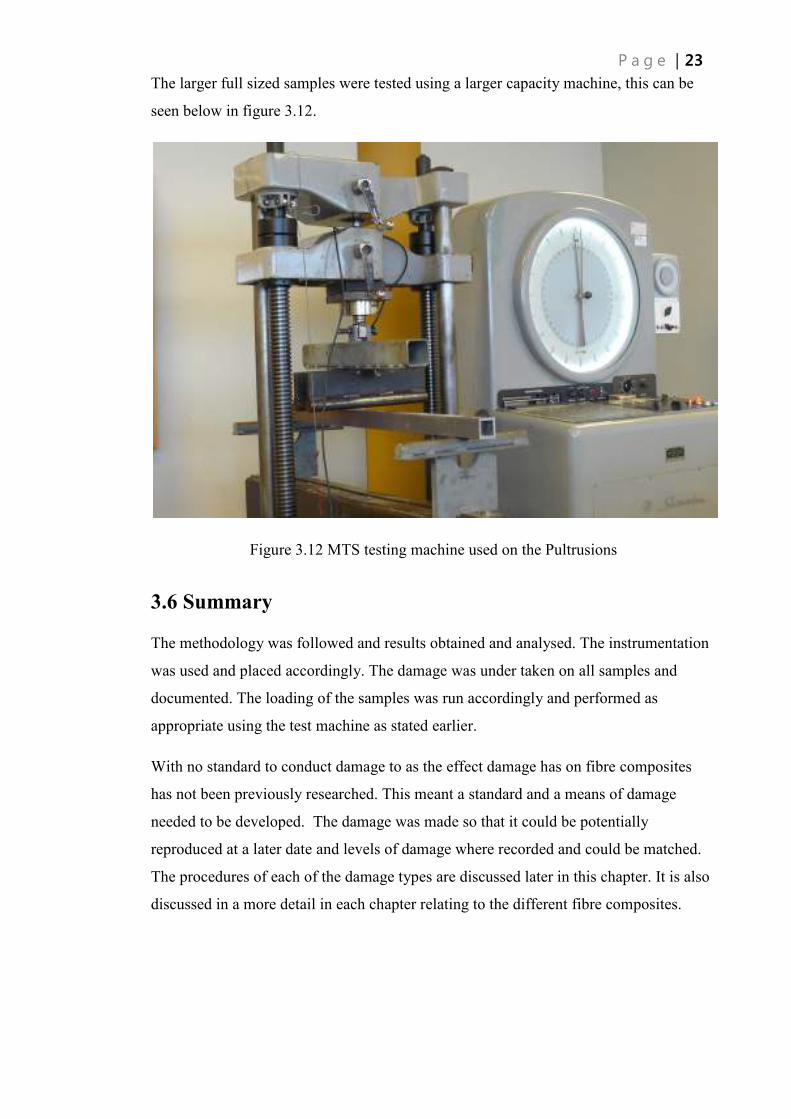
The larger full sized samples were tested using a larger capacity machine, this can be
seen below in figure 3.12.
Figure 3.12 MTS testing machine used on the Pultrusions
3.6 Summary
The methodology was followed and results obtained and analysed. The instrumentation
was used and placed accordingly. The damage was under taken on all samples and
documented. The loading of the samples was run accordingly and performed as
appropriate using the test machine as stated earlier.
With no standard to conduct damage to as the effect damage has on fibre composites
has not been previously researched. This meant a standard and a means of damage
needed to be developed. The damage was made so that it could be potentially
reproduced at a later date and levels of damage where recorded and could be matched.
The procedures of each of the damage types are discussed later in this chapter. It is also
discussed in a more detail in each chapter relating to the different fibre composites.
Chapter 4
Experimental Investigation into Fibre reinforced
Sandwich Panels
4.1 Introduction
The sandwich panels used for this project were from LOC composites and where the
Carbon LOCTM
panel. The samples were prepared to 500mm x 50mm size. The plain
sandwich panel has a thickness of 20 mm. For the sandwich panels, two different types
were used. One set of panels were of a plain sandwich panel. The other set of panels is
the same sandwich composite but an asphalt cover or finish has been added to the top of
the material, this cover was 5mm on top taking the final thickness to 25mm.
4.2 Damage
The samples were all damaged in the centre of the specimen on the tension side of the
product; this was done as the samples would be placed in a flexure environment and the
areas accessible to vandalism would be from beneath. The samples were prepared so
that three samples were used as control un-damaged samples. For each of the damage
type’s three samples were also used.
4.2.1 Blunt Impact
The blunt impact was done by a drop weight of 14.78 kg weight which had a hammer
head attached to the base of the weight. This was dropped to the centre of what would
be the tension side of the specimen. Each specimen was only impacted once. For the
uncovered samples the drop weight was dropped from a height of 685mm above the
showing skin of the sample. For the covered samples the drop weight was dropped from
a height of 680mm above the showing skin of the sample.

Figure 4.1 Blunt Impact Schematic
The damage from the impact left a circle the size of the hammer into the skin of the
specimen for both the asphalt cover and the no cover. The indent was not deep but
provided internal core crushing to some extent and skin ripples where it had impacted.
This can be seen in figure 4.2. This correlated with the previous research done as the
wide impactor was said to achieve this visible damage.
Figure 4.2 Blunt Impact Damage
4.2.2 Sharp Impact
The sharp impact was done by the same drop weight as the blunt impact though a screw
driver head replaced the hammer head. This was dropped to the centre of what would be
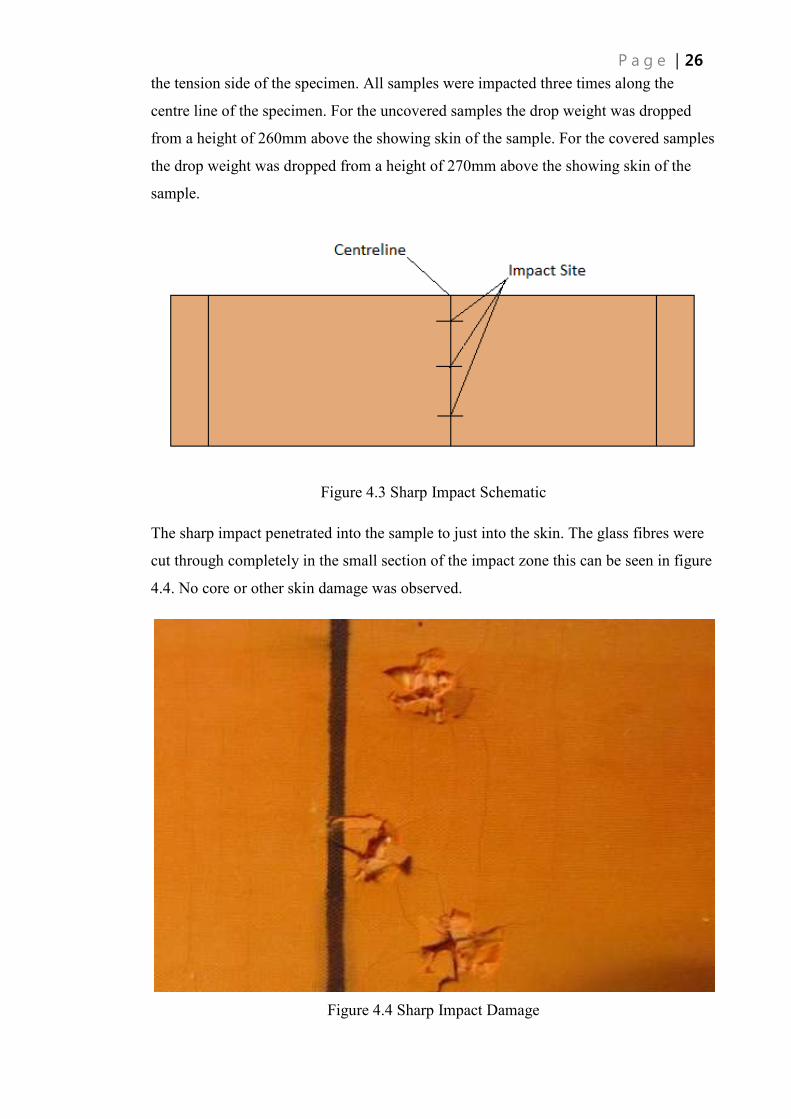
the tension side of the specimen. All samples were impacted three times along the
centre line of the specimen. For the uncovered samples the drop weight was dropped
from a height of 260mm above the showing skin of the sample. For the covered samples
the drop weight was dropped from a height of 270mm above the showing skin of the
sample.
Figure 4.3 Sharp Impact Schematic
The sharp impact penetrated into the sample to just into the skin. The glass fibres were
cut through completely in the small section of the impact zone this can be seen in figure
4.4. No core or other skin damage was observed.
Figure 4.4 Sharp Impact Damage

4.2.3 Cut Damage
The cut damage was produced by placing the sample on a set of scales and applying
approximately 4kg down and cutting across the centre line of the sample. The
specimens were only cut once per specimen. With approximately 4kg of pressure the cut
was approximately 1mm deep. The damage can be seen below in figure 4.5.
Figure 4.5 Cut Damage
4.2.4 Fire Damage
The fire damage was from a BBQ lighter. This lighter was held on the centre of each of
the specimen for 2 min. Each specimen began to have the skin directly under the flame
crack and chip. After a minute the skin chips off and the glass fibres begin to break and
split. This can be seen below in figure 4.6.
This damage was easy to achieve, the effect of just the bbq lighter was immediate and
instantly apparent. The core of the sandwich panel is immune to the effect of the bbq
lighter but the skin of the sample is not immune. The skin of the panel does not itself
catch alight but as long as flame is touching the sample damage is done.

Figure 4.6 Fire Damage
4.3 Flexure Testing
The specimens as explained earlier were tested in flexure only. For both the asphalt
covered and plain specimen they were tested at the same span and load configuration.
This was set at 450 mm span with the load at 40mm from the centre at both sides. This
can be seen in figure 4.7.
Figure 4.7 Sandwich Panel Flexure Test
4.4 Control Samples
Three control samples were tested as explained earlier to provide a control or standard
to measure the effect the damage had on the specimen. The failures of the specimen
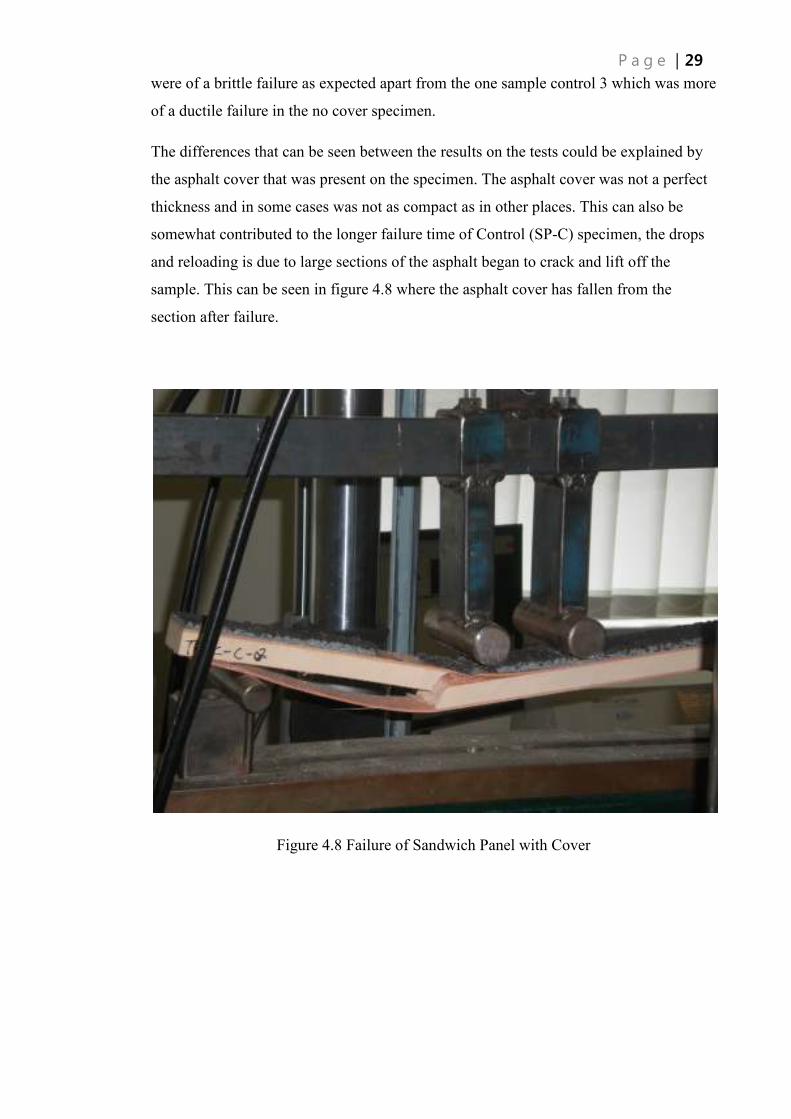
were of a brittle failure as expected apart from the one sample control 3 which was more
of a ductile failure in the no cover specimen.
The differences that can be seen between the results on the tests could be explained by
the asphalt cover that was present on the specimen. The asphalt cover was not a perfect
thickness and in some cases was not as compact as in other places. This can also be
somewhat contributed to the longer failure time of Control (SP-C) specimen, the drops
and reloading is due to large sections of the asphalt began to crack and lift off the
sample. This can be seen in figure 4.8 where the asphalt cover has fallen from the
section after failure.
Figure 4.8 Failure of Sandwich Panel with Cover

Figure 4.9 Control Specimen with Cover
The average ultimate load of the control with cover was 4917N, where the average
ultimate load of the control specimen without cover was 4591N. The asphalt cover
provided an increase of 6.6% in average ultimate load. The flexural stiffness an
indicator of the flexural modulus of the covered specimen was 363N/mm and the non
covered specimen had a flexural stiffness of 210N/mm an indicator of the flexural
modulus, the cover providing an increase of 42%.
The graphs of the control samples can be seen in figure 4.9 and 4.10. The flexural
modulus of the control samples with no cover 7681.01MPa and the flexural modulus of
the control samples with cover was 8703.08MPa, the cover providing an increase of
11.7%.
0
1000
2000
3000
4000
5000
6000
0 5 10 15 20 25 30
Loa
d (
N)
Deflection (mm)
Control - Cover
Control 1 (SP-C)
Control 2 (SP-C)
Control 3 (SP-C)

Figure 4.10 Control Specimen without Cover
4.5 Blunt Impact Damaged Samples
The specimen with the asphalt cover had a different failure to the control specimen as
the samples had more of a ductile failure as the failure originated at the impact site.
Where the samples had delaminated and had a rippling effect in the skin the impact site
the tension cracks occurred. The blunt impact was very hard to reproduce by hand, was
achievable but very difficult, especially if considered in real world the impact would be
done above head and the hammer swung upward.
This can be best seen in figure 4.8 where the samples would fail and re-load as the
cracks or tears would dissipate to the side. One side would typically go as the impacts
were not directly centre and the shortest distance from the impact site to the edge would
fail. It would continue to load until the other side would fail.
The blunt impacted covered samples had an ultimate strength of 4599N, in comparison
to the control the blunt impact damage decreased average ultimate load by 6.5%. The
covered samples had a flexural stiffness of 323N/mm an indicator of the flexural
modulus, in comparison to the control the blunt impacted stiffness was reduced by 11%.
0
1000
2000
3000
4000
5000
6000
0 5 10 15 20 25 30
Loa
d (
N)
Deflection (mm)
Control - No Cover
Control 1 (SP-NC)
Control 2 (SP-NC)
Control 3 (SP-NC)
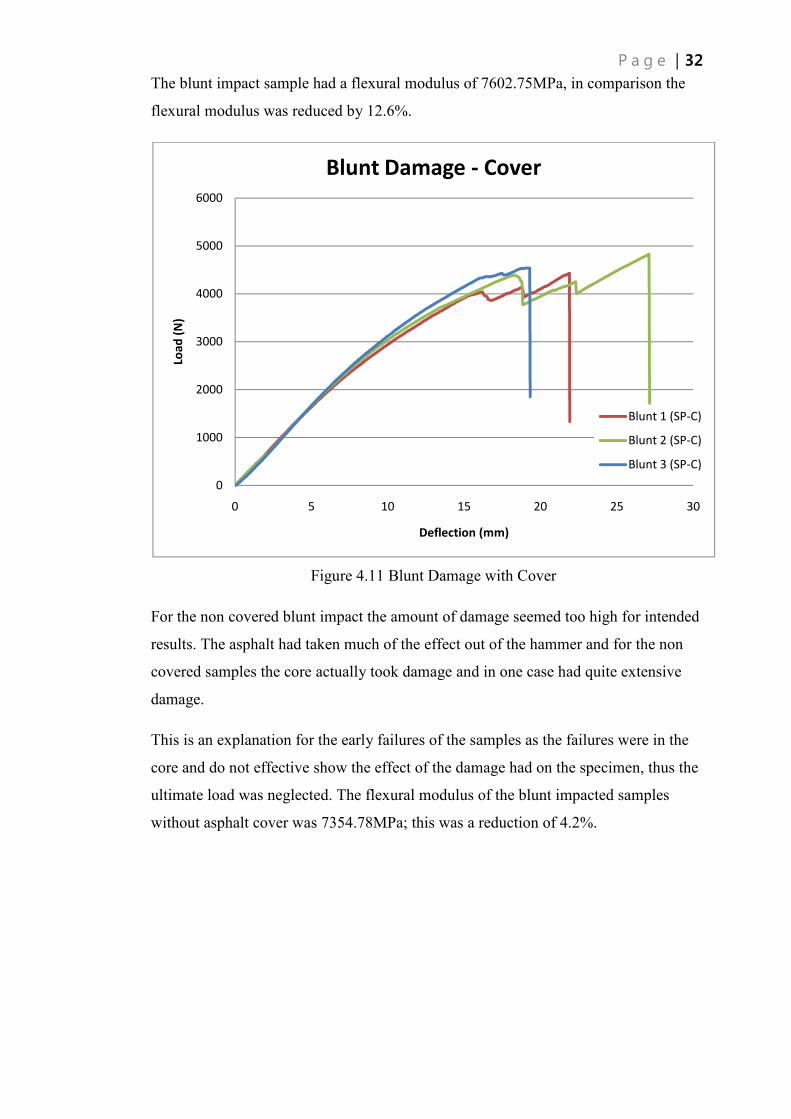
The blunt impact sample had a flexural modulus of 7602.75MPa, in comparison the
flexural modulus was reduced by 12.6%.
Figure 4.11 Blunt Damage with Cover
For the non covered blunt impact the amount of damage seemed too high for intended
results. The asphalt had taken much of the effect out of the hammer and for the non
covered samples the core actually took damage and in one case had quite extensive
damage.
This is an explanation for the early failures of the samples as the failures were in the
core and do not effective show the effect of the damage had on the specimen, thus the
ultimate load was neglected. The flexural modulus of the blunt impacted samples
without asphalt cover was 7354.78MPa; this was a reduction of 4.2%.
0
1000
2000
3000
4000
5000
6000
0 5 10 15 20 25 30
Loa
d (
N)
Deflection (mm)
Blunt Damage - Cover
Blunt 1 (SP-C)
Blunt 2 (SP-C)
Blunt 3 (SP-C)

Figure 4.12 Blunt Damage without Cover
4.6 Sharp Impact Damaged Samples
Much like the blunt impacted specimen the asphalt covered specimen had a different
failure to the control specimen as the samples had more of a ductile failure has the
failure originated at the impact site. The sharp impact was very hard to reproduce by
hand, was achievable but very difficult, especially if considered in real world the impact
would be done above head and the screw driver swung upward. The only real way to
achieve the same impacts as seen in figure 4.4 was to use a hammer as well as the screw
driver. Damage was able to be achieved without the aid of a hammer if impact was
repeated multiple times as the skin would chip away.
This ductile like failure can be best seen in figure 4.14 where the samples would fail and
re-load as the cracks or tears would dissipate up the specimen. The literature reported
that small strips would tear longitudinally up the specimen from the impact site; this can
be seen in figure 4.13. This was what was found to be the case. As the load increased
impact size strips would tear up the specimen which is seen in the multiple failure
reloading spikes in the specimen.
0
1000
2000
3000
4000
5000
6000
0 5 10 15 20 25 30 35
Ax
is T
itle
Deflection (mm)
Blunt Damage - No Cover
Blunt 1 (SP-NC)
Blunt 2 (SP-NC)
Blunt 3 (SP-NC)

Figure 4.13 Failure of Sandwich Composite with Cover Sharp Impact Damage
The sharp impacted covered samples had an ultimate strength of 3959N; this was a
reduction of 19.5%. The covered samples had a flexural stiffness an indicator of the
flexural modulus of 362N/mm; this is a reduction of 0.3%. As the ultimate load may be
reduced the damage the overall flexural stiffness of the material remained unaffected by
the damage.
The flexural modulus of the sharp impacted asphalt covered samples was 8217.30MPa;
this is a reduction of 5.6%. For the flexural modulus Sharp 2 (SP-C) was neglected as
the asphalt cover caused an increased stiffness as the asphalt thickness was larger in the
centre section of the sample.
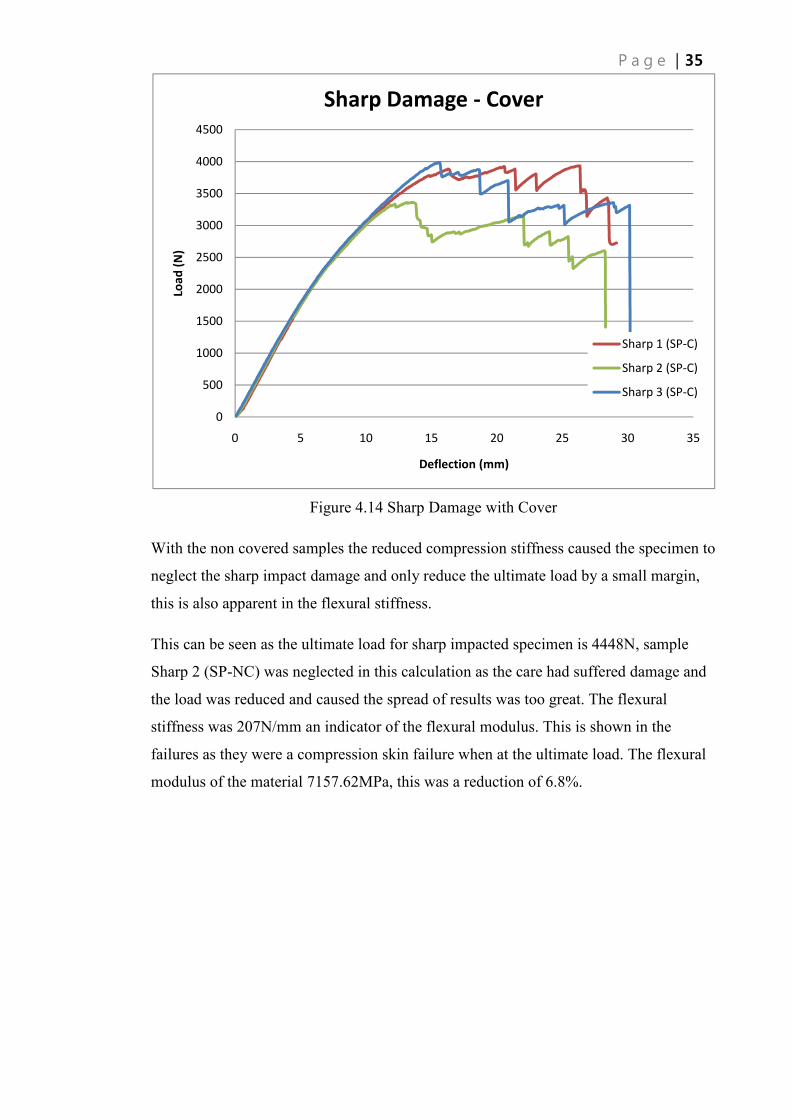
Figure 4.14 Sharp Damage with Cover
With the non covered samples the reduced compression stiffness caused the specimen to
neglect the sharp impact damage and only reduce the ultimate load by a small margin,
this is also apparent in the flexural stiffness.
This can be seen as the ultimate load for sharp impacted specimen is 4448N, sample
Sharp 2 (SP-NC) was neglected in this calculation as the care had suffered damage and
the load was reduced and caused the spread of results was too great. The flexural
stiffness was 207N/mm an indicator of the flexural modulus. This is shown in the
failures as they were a compression skin failure when at the ultimate load. The flexural
modulus of the material 7157.62MPa, this was a reduction of 6.8%.
0
500
1000
1500
2000
2500
3000
3500
4000
4500
0 5 10 15 20 25 30 35
Loa
d (
N)
Deflection (mm)
Sharp Damage - Cover
Sharp 1 (SP-C)
Sharp 2 (SP-C)
Sharp 3 (SP-C)

Figure 4.15 Sharp Damage without Cover
4.7 Cut Damaged Samples
The cut damaged samples had a varying degree in the ductile like failure which has
distinguished earlier styles of damage. Some specimen showed a very ductile failure,
this can be contributed to the varying nature of the damage.
Where the specimen had more depth in the cut and more fibres severed the effect was
more noticeable. The cut had much the same effect as the blunt impact. Visible cracks
were not observed as the crack was already started in the damage and this would be
increased with more fibres breaking with increased load. This can be seen in figure 4.16
with the amount of broken fibres underneath the failed sample.
0
500
1000
1500
2000
2500
3000
3500
4000
4500
5000
0 5 10 15 20 25 30
Loa
d (
N)
Deflection (mm)
Sharp Damage - No Cover
Sharp 1 (SP-NC)
Sharp 2 (SP-NC)
Sharp 3 (SP-NC)

Figure 4.16 Sandwich Panel With Cover Cut damage
The cut damage was easy to achieve with a sharp knife or Stanley style knife. The
damage could be easily increased especially after initial cut is achieved.
The covered samples had an ultimate load of 4609N; this was a reduction of 6.3%. The
flexural stiffness an indicator of the flexural modulus was reduced to 343N/mm; this
reduction was by 5.5%. The covered sandwich panels with cut damage had a flexural
modulus of 7968.29MPa and this was a reduction of 8.4%.
It can be seen that sample Cut 2 (SP-C) failed in a manner like that of the sharp impact
sample. Where the cut had penetrated more fibre sections would strip away causing the
drops in load followed by reloading before ultimate failure.

Figure 4.17 Cut Damage with Cover
The non covered samples had an ultimate load of 3833N, a 16.5% drop. The flexural
stiffness an indicator of the flexural modulus is 205N/mm, a 2.2% drop. So this shows
that the damage again has no effect until ultimate load. The non covered sandwich panel
had a flexural modulus of 7160.28MPa which was a reduction of 6.8%.
The failure in Cut 1 (SP-NC) in figure 4.18 resembles that of the sharp impact samples
as well. This was to a much smaller extent but small sections would strip away but not
extend to far up the specimen.
0
1000
2000
3000
4000
5000
6000
0 5 10 15 20 25 30 35 40
Loa
d (
N)
Deflection (mm)
Cut Damage - Cover
Cut 1 (SP-C)
Cut 2 (SP-C)
Cut 3 (SP-C)
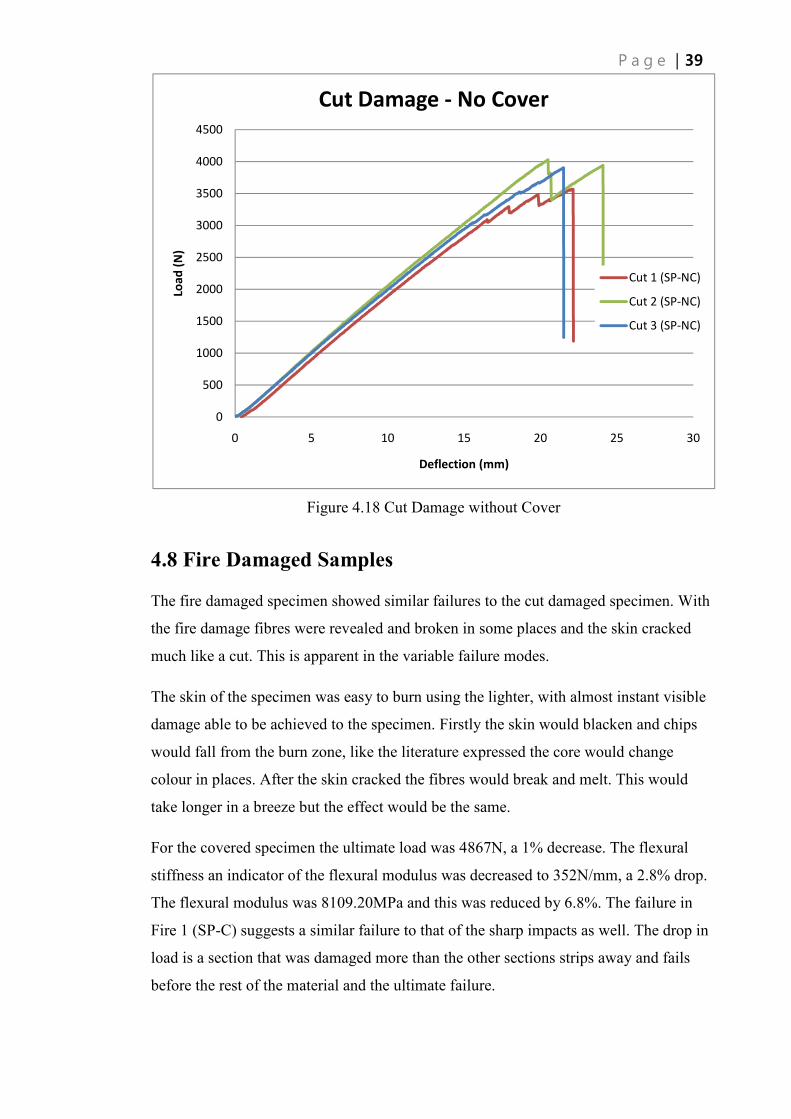
Figure 4.18 Cut Damage without Cover
4.8 Fire Damaged Samples
The fire damaged specimen showed similar failures to the cut damaged specimen. With
the fire damage fibres were revealed and broken in some places and the skin cracked
much like a cut. This is apparent in the variable failure modes.
The skin of the specimen was easy to burn using the lighter, with almost instant visible
damage able to be achieved to the specimen. Firstly the skin would blacken and chips
would fall from the burn zone, like the literature expressed the core would change
colour in places. After the skin cracked the fibres would break and melt. This would
take longer in a breeze but the effect would be the same.
For the covered specimen the ultimate load was 4867N, a 1% decrease. The flexural
stiffness an indicator of the flexural modulus was decreased to 352N/mm, a 2.8% drop.
The flexural modulus was 8109.20MPa and this was reduced by 6.8%. The failure in
Fire 1 (SP-C) suggests a similar failure to that of the sharp impacts as well. The drop in
load is a section that was damaged more than the other sections strips away and fails
before the rest of the material and the ultimate failure.
0
500
1000
1500
2000
2500
3000
3500
4000
4500
0 5 10 15 20 25 30
Loa
d (
N)
Deflection (mm)
Cut Damage - No Cover
Cut 1 (SP-NC)
Cut 2 (SP-NC)
Cut 3 (SP-NC)

Figure 4.19 Fire Damage with Cover
The sandwich panel without cover had a flexural modulus of 7234.91MPa; this is a
reduction of 5.8%. The failure of Fire 1 (SP-C) in figure 4.19 is also apart in a smaller
scale in figure 4.20 in failures in samples Burn 2 (SP-NC) and Burn 3 (SP-NC).
Figure 4.20 Fire Damage without cover
0
1000
2000
3000
4000
5000
6000
0 5 10 15 20 25 30
Loa
d (
N)
Deflection (mm)
Fire Damage - Cover
Fire 1 (SP-C)
Fire 2 (SP-C)
Fire 3 (SP-C)
0
1000
2000
3000
4000
5000
6000
0 5 10 15 20 25 30 35 40
Loa
d (
N)
Deflection (mm)
Burn Damage - No Cover
Burn 1 (SP-NC)
Burn 2 (SP-NC)
Burn 3 (SP-NC)

4.9 Ease of Damage
Damage Type Ease
Blunt Impact Very Hard
Sharp Impact Very Hard
Cutting Damage Easy
Fire Damage Easy
Table 4.1 Ease of Damage to Sandwich Panels
4.10 Paint Remover
Both the asphalt covered and the non asphalt covered sandwich panels were treated to a
thick coating of flat black enamel spray paint, typical off the shelf spray paint. It was
allowed to dry.
Common fast acting paint remover was used for the removal of the spray paint. The
paint remover was an off the counter paint remover and was a Dichloromethane mixture
paint stripper. The instructions for the paint remover were followed and the paint was
removed.
The results of the paint remover were that the majority of the paint was removed with
great ease. With wire brushing during the paint removal the amount of paint removed is
increased. Not all of the paint can be removed as some of the paint is soaked into the
sandwich panel and is left after removal. There was no visible damage done to the
sandwich panel from the paint stripper. There was no visible damage to the skin or core
of the sample.
4.11 Conclusion
A total of 15 non covered and 15 asphalt covered specimen were tested using a range of
different damages. The damages were of a blunt impact, a sharp impact, a Stanley knife
cut and a bbq lighter burn. The effect ranged from very noticeable to visible but not
effective.
The burning was the easiest to achieve visible damage but the actual effect of the
burning was not as effective compared to the visible damage.
The cut was easy to achieve and the effect from a small cut was noticeable on both the
ultimate load and flexural stiffness of the material.

The blunt impact was hard to achieve especially when considered in actual
environment. To achieve the required damage when the vandal is required to do an up-
swing to the product the ability to cause damage is severely hampered. But if achieved
it could be very effective. The damage is very noticeable and the capacity is reduced
heavily because of the damage to the core.
The sharp impact was much like the blunt impact where the effect was hard to achieve.
The damage is achievable when combined with a hammer. The damage is achievable
without the hammer but would take a large amount of impacts to achieve this.
The paint stripper was very effect of removing a large amount of the spray paint. There
was residue of paint left after removal but there was no visible damage done to the
specimen.
To confirm that these damages would cause the same effect to an entire slab element
further research is needed. In case for the blunt and sharp impact to damage a sufficient
amount of the slab to achieve the same results would be extremely hard. The same could
be said about the burning from a bbq lighter. An effect would be achievable but the
ultimate load and stiffness of an entire slab element would take a considerable time. The
cut damage would be the most easiest to achieve especially once the outer layer has
been cut away.

Chapter 5
Experimental Investigation into Fibre reinforced
Pultruded Sections
5.1 Introduction
The first glass fibre reinforced pultruded sections used in this project are commercially
available 100mm x 100mm in size. The pultrusions had a thickness of 5 mm and were
approximately 1.2 m in length. These products were subjected to the same damage types
as the sandwich panels.
5.2 Damage
For the pultruded section the samples were all damaged in the centre of the specimen on
the tension side of the product; this was done as the samples would be placed in a
flexure environment and the areas accessible to vandalism would be from beneath. The
samples were prepared so that three samples were used as control or un-damaged
samples. For each of the damage type’s three samples were also used.
5.2.1 Blunt Impact
For the pultruded section the drop mass was not used. The damage was attempted using
hand tools and human force only. This was done to ensure that if damaged the damage
was real world feasible and also to ensure damage was not excessive.
The damage was done by using a similar hammer to the one used for the blunt impact
damage done to the sandwich panels. The force used on the pultrusion started at a
simple tap to a large impact. During all of the attempts at damage to the pultrusion it
remained undamaged to the eye. It bounced the hammer away making it more
dangerous for the vandal rather than the pultrusion itself.
5.2.2 Sharp Impact
The sharp impact was also done by hand. This was done to ensure the damage was also
feasible in real world situations. The damage was again on the tension side of the
sample.

This time the sharp impact was done using both a screw driver and a hammer. The
hammer was used to impact the screw driver in the sample to a 1-2mm depth. This was
done along the centre line of the sample; this can be seen in figure 5.1.
Figure 5.1 Sharp Impact on 100x100mm section
This damage was easy to achieve using the combined force of the hammer and the
screw driver. Without the hammer the sharp impact was much like the blunt impact and
was very hard to achieve.
5.2.3 Cut Damage
The cut damage was also done using a Stanley knife. The cut was three 1-2mm cuts
along and beside the centre line. This can be seen in figure 5.2. The cut damage was
very easy to achieve using the Stanley knife, especially when the outer skin of the
pultrusion has been cut away in inner white material is easy to get through.

Figure 5.2 Cut Damage to 100x100mm section
5.2.4 Fire Damage
The fire damage was done by using the bbq lighter. The flame was kept on the material
for 10min with no effect other than smoke discolouration on the burn site. The flame
was not able to reach a high enough temperature to cause visible damage especially if
attempted in any wind.
If the pultrusion was subjected to higher temperature the material is not immune and
very susceptible to the flame like all epoxy resins. This was able to be achieved using a
hand oxy torch but this type of damage was not tested as this was not deemed to be a
reasonable or feasible vandal tool.
5.3 Flexure Testing
The specimens as explained earlier were tested in flexure only. This was set at a 1 m
span with the load at 1500 mm from the centre at both sides. This can be seen in figure
5.3.
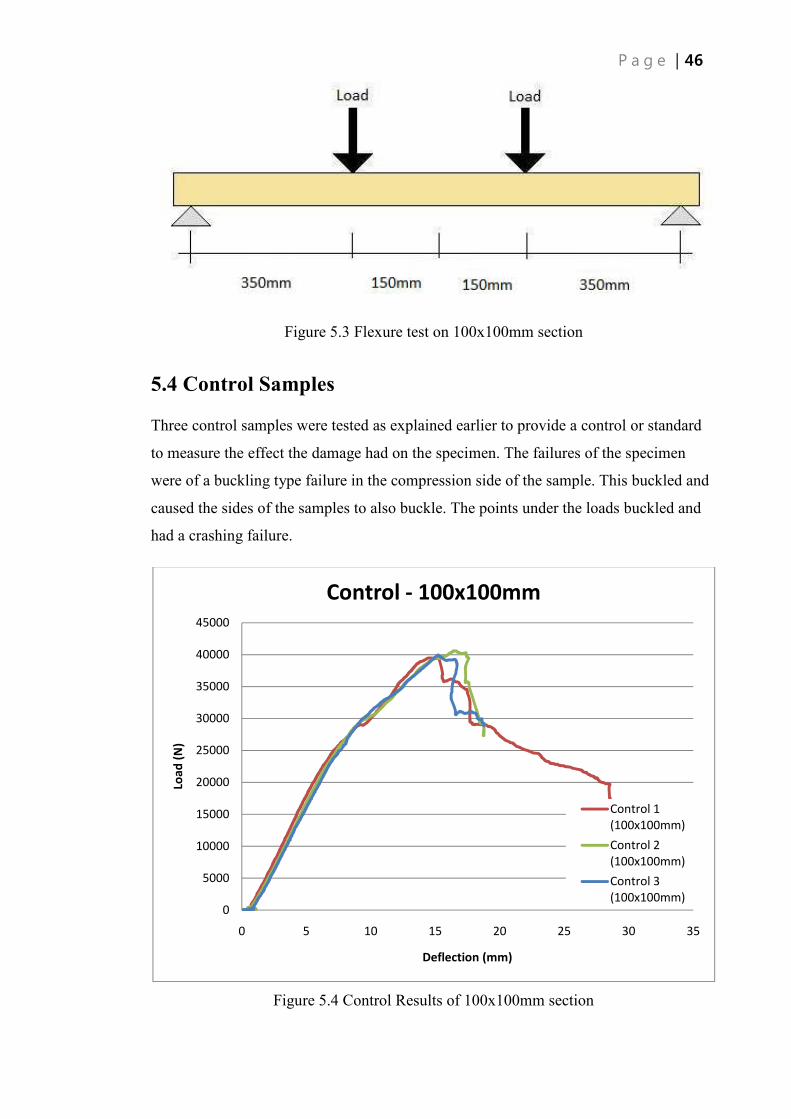
Figure 5.3 Flexure test on 100x100mm section
5.4 Control Samples
Three control samples were tested as explained earlier to provide a control or standard
to measure the effect the damage had on the specimen. The failures of the specimen
were of a buckling type failure in the compression side of the sample. This buckled and
caused the sides of the samples to also buckle. The points under the loads buckled and
had a crashing failure.
Figure 5.4 Control Results of 100x100mm section
0
5000
10000
15000
20000
25000
30000
35000
40000
45000
0 5 10 15 20 25 30 35
Loa
d (
N)
Deflection (mm)
Control - 100x100mm
Control 1
(100x100mm)
Control 2
(100x100mm)
Control 3
(100x100mm)
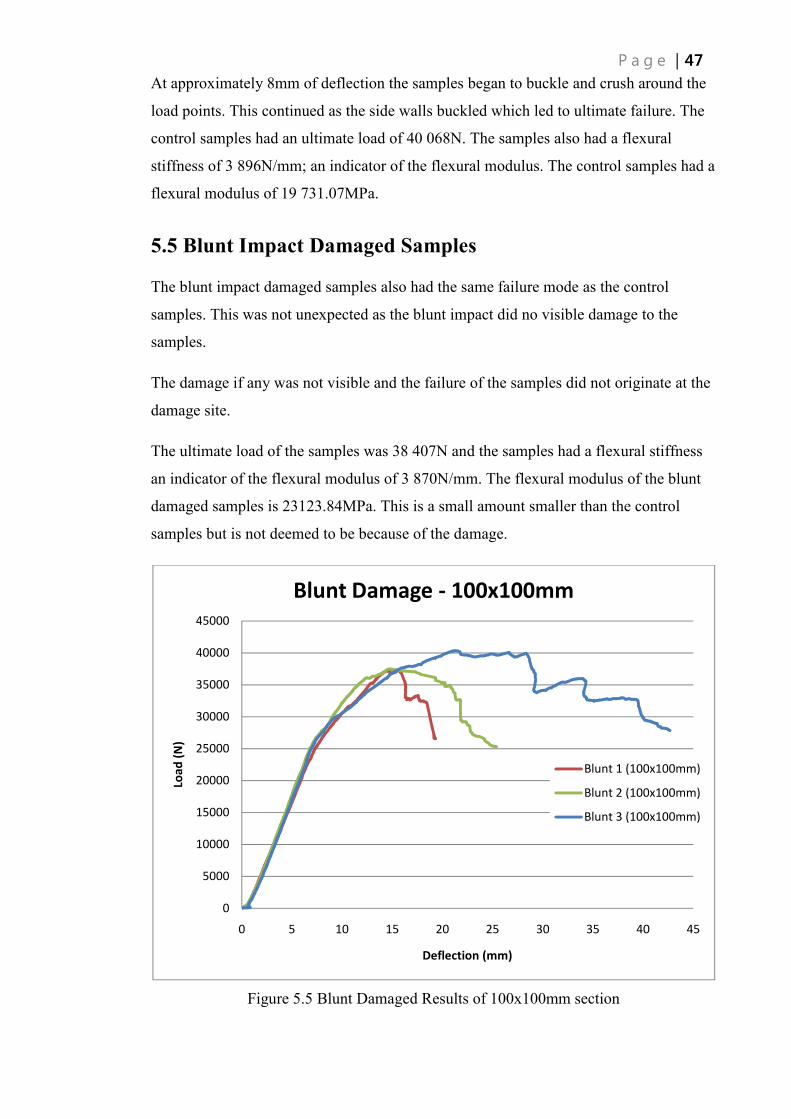
At approximately 8mm of deflection the samples began to buckle and crush around the
load points. This continued as the side walls buckled which led to ultimate failure. The
control samples had an ultimate load of 40 068N. The samples also had a flexural
stiffness of 3 896N/mm; an indicator of the flexural modulus. The control samples had a
flexural modulus of 19 731.07MPa.
5.5 Blunt Impact Damaged Samples
The blunt impact damaged samples also had the same failure mode as the control
samples. This was not unexpected as the blunt impact did no visible damage to the
samples.
The damage if any was not visible and the failure of the samples did not originate at the
damage site.
The ultimate load of the samples was 38 407N and the samples had a flexural stiffness
an indicator of the flexural modulus of 3 870N/mm. The flexural modulus of the blunt
damaged samples is 23123.84MPa. This is a small amount smaller than the control
samples but is not deemed to be because of the damage.
Figure 5.5 Blunt Damaged Results of 100x100mm section
0
5000
10000
15000
20000
25000
30000
35000
40000
45000
0 5 10 15 20 25 30 35 40 45
Loa
d (
N)
Deflection (mm)
Blunt Damage - 100x100mm
Blunt 1 (100x100mm)
Blunt 2 (100x100mm)
Blunt 3 (100x100mm)

5.6 Sharp Impact Damaged Samples
The sharp impacted samples had the same failure as the control and as the blunt
impacted samples. The damage seemed to not contribute to the failure of the samples.
The failures did not originate at the damage site. Once failed the damage site still
remained as if it were only just damaged.
Figure 5.6 Sharp Damaged Results of 100x100mm section
The sharp impacted sample had an ultimate load of 37 850N. The samples had a flexural
stiffness an indicator of the flexural modulus of 3830 N/mm, the flexural modulus of the
material is 22 169.43MPa. This confirms the damage had no effect on ultimate load or
flexural stiffness as the difference is marginal.
5.7 Cut Damaged Samples
With the cut damage the samples also failed in a buckling type mode. With like the
other types of damage the areas of damage did not contribute to the failure of the sample
at any stage of the testing.
0
5000
10000
15000
20000
25000
30000
35000
40000
0 5 10 15 20 25 30
Loa
d (
N)
Deflection (mm)
Sharp Damage - 100x100mm
Sharp 1 (100x100mm)
Sharp 2 (100x100mm)
Sharp 3 (100x100mm)

Figure 5.7 Cut Damaged Results of 100x100mm section
The ultimate load of the cut damaged samples was 38 184N with a flexural stiffness an
indicator of the flexural modulus of 3863N/mm. This damage again had no effect on
either the ultimate load or flexural stiffness as the failure mode is the same and the
difference in ultimate load and flexural stiffness is marginal.
5.8 Fire Damaged Samples
With no visible damage recorded the expectation was the fire samples would fail
identical to the other types of damage and this was the case. The burn site did not
contribute to the failure of the samples.
At approximately 7mm of deflection the samples began to buckle and crush around the
load points. This continued as the side walls buckled which led to ultimate failure.
0
5000
10000
15000
20000
25000
30000
35000
40000
45000
0 5 10 15 20 25
Loa
d (
N)
Deflection (mm)
Cut Damage - 100x100mm
Cut 1 (100x100mm)
Cut 2 (100x100mm)
Cut 3 (100x100mm)

Figure 5.8 Fire Damaged Results of 100x100mm section
The fire damaged samples had an ultimate load of 38 574N and a flexural stiffness an
indicator of the flexural modulus of 3958N/mm, with the flexural Modulus of the fire
damaged samples is 23 535.95MPa. This damage again had no effect on the samples as
the ultimate load; flexural stiffness and failure mode were near identical to the other
specimen.
As the fire damage was immune to low degrees of heat such like the heat from the bbq
lighter, higher temperatures are significantly more dangerous. The heat from a hand
held oxy torch cause great damage and causes the pultrusion to catch alight for short
periods of time.
5.9 Ease of Damage
Damage Type Ease
Blunt Impact Extremely Hard
Sharp Impact Very Hard
Cutting Damage Easy
Fire Damage Extremely Hard
Table 5.1 Ease of Damage to 100x100mm section
0
5000
10000
15000
20000
25000
30000
35000
40000
45000
0 5 10 15 20 25
Loa
d (
N)
Deflection (mm)
Fire Damage - 100x100mm
Fire 1 (100x100mm)
Fire 2 (100x100mm)
Fire 3 (100x100mm)

5.10 Paint Remover
The 100x100mm section was treated to a thick coating of flat black enamel spray paint,
typical off the shelf spray paint. It was allowed to completely dry.
Common fast acting paint remover was used for the removal of the spray paint. The
paint remover was an off the counter paint remover and was a Dichloromethane mixture
paint stripper. The instructions for the paint remover were followed and the paint was
removed.
The results of the paint remover were that the majority of the paint was removed with
great ease. With wire brushing during the paint removal the amount of paint removed is
increased. Only a very small amount of paint is left as it is soaked in, shorter the time
between vandalism and cleaning would limit this. There were no obvious signs of
damage though the sample looked cleaner than original suggesting discolouration and
potential removal of some of the outer layer of specimen. This was marginal and only
small amounts not visible layers.
5.11 Conclusion
A total of 15 specimens were tested using a range of different damages. The damages
were of a blunt impact, a sharp impact, a Stanley knife cut and a bbq lighter burn.
The blunt impact was very hard to achieve especially when considered in actual
environment, could be classified as immune to a normal attack. The sharp impact was
much like the blunt impact where the effect was extremely hard to achieve. The samples
could be classified as immune to burn damage from a bbq lighter or similar product
especially when considered in the actual environment.
The cut however was easy to achieve, this would be the easiest damage type to get a
result with. Especially once the outer skin or cover was cut.
The paint removal was able to easily remove the spray paint. The removal method
looked to not affect the pultrusion.
All samples failed due to buckling and not as a result of the damage. All sample had
ultimate load of around the 38 000 N and a flexural stiffness of 3 900 N/mm. Because
of this common failure mechanism further research with larger specimen is needed to
ensure that there is no effect from the damage.
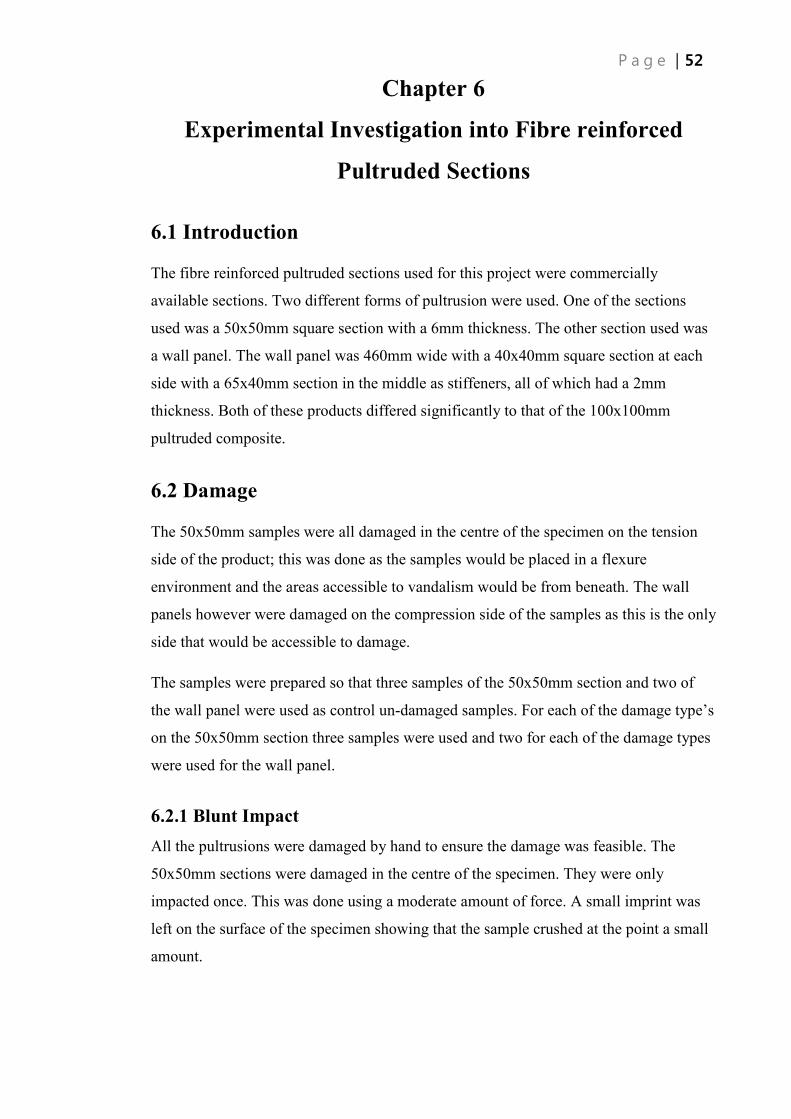
Chapter 6
Experimental Investigation into Fibre reinforced
Pultruded Sections
6.1 Introduction
The fibre reinforced pultruded sections used for this project were commercially
available sections. Two different forms of pultrusion were used. One of the sections
used was a 50x50mm square section with a 6mm thickness. The other section used was
a wall panel. The wall panel was 460mm wide with a 40x40mm square section at each
side with a 65x40mm section in the middle as stiffeners, all of which had a 2mm
thickness. Both of these products differed significantly to that of the 100x100mm
pultruded composite.
6.2 Damage
The 50x50mm samples were all damaged in the centre of the specimen on the tension
side of the product; this was done as the samples would be placed in a flexure
environment and the areas accessible to vandalism would be from beneath. The wall
panels however were damaged on the compression side of the samples as this is the only
side that would be accessible to damage.
The samples were prepared so that three samples of the 50x50mm section and two of
the wall panel were used as control un-damaged samples. For each of the damage type’s
on the 50x50mm section three samples were used and two for each of the damage types
were used for the wall panel.
6.2.1 Blunt Impact
All the pultrusions were damaged by hand to ensure the damage was feasible. The
50x50mm sections were damaged in the centre of the specimen. They were only
impacted once. This was done using a moderate amount of force. A small imprint was
left on the surface of the specimen showing that the sample crushed at the point a small
amount.

Figure 6.1 Blunt Impact Schematic (50x50mm Section)
The wall panel was impacted 9 times, three impacts on each of the stiffeners, on and
around the centre line. This left the same indent as on the 50x50mm section. The area
between the impact sites was unable to be damaged as the section was too flexible for
the hammer to damage. This meant 68% of the specimen was immune to the blunt
impact. The impact on the wall panel can be seen in figure 6.3.
Figure 6.2 Blunt Impact Schematic (Wall Panel)

Figure 6.3 Blunt Impact Damage to Exel Composite
6.2.2 Sharp Impact
The sharp impact was also done by hand. This was done to ensure the damage was also
feasible in real world situations. The damage was again on the tension side of the
sample for the 50x50mm sections and done on the compression side again for the wall
panel.
This time the sharp impact was done using both a screw driver and a hammer. The
hammer was used to impact the screw driver in the sample to a 1-2mm depth. This was
done along the centre line of the sample; this can be seen in figure 6.5 for the wall
panel. For the 50x50mm section four rows of three impacts were done along the centre
line of the specimen. This can be seen below in figure 6.4.
Figure 6.4 Sharp Impact Schematic (50x50mm Section)

Figure 6.5 Sharp Impact to Exel Composite
6.2.3 Cut Damage
The cut damage was also done using a Stanley knife. The cut was three 1-2mm cuts
along and beside the centre line for the 50x50mm section. The wall panel was cut the
same but only to a depth of 1mm, it was also cut 7 times around the centre line, this can
be seen in figure 6.6. The cut damage was very easy to achieve using the Stanley knife,
especially when the outer skin of the pultrusion has been cut away in inner white
material is easy to get through.
Figure 6.6 Cut Damage to Exel Composite
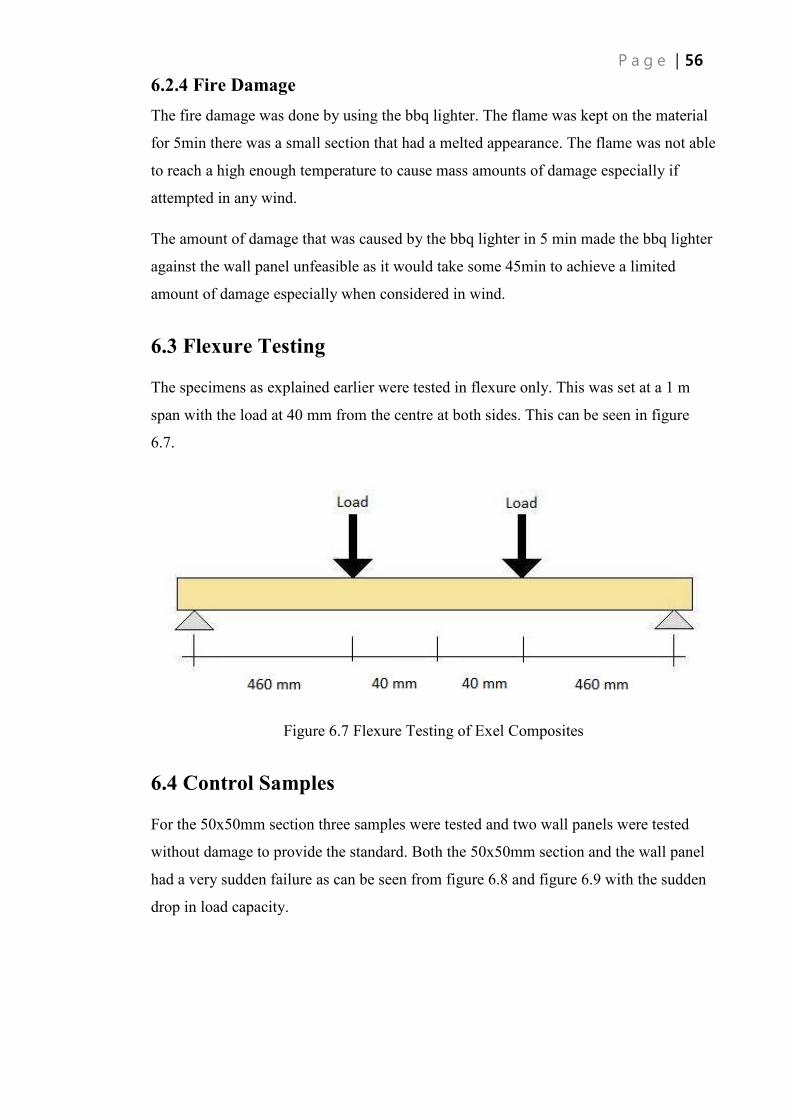
6.2.4 Fire Damage
The fire damage was done by using the bbq lighter. The flame was kept on the material
for 5min there was a small section that had a melted appearance. The flame was not able
to reach a high enough temperature to cause mass amounts of damage especially if
attempted in any wind.
The amount of damage that was caused by the bbq lighter in 5 min made the bbq lighter
against the wall panel unfeasible as it would take some 45min to achieve a limited
amount of damage especially when considered in wind.
6.3 Flexure Testing
The specimens as explained earlier were tested in flexure only. This was set at a 1 m
span with the load at 40 mm from the centre at both sides. This can be seen in figure
6.7.
Figure 6.7 Flexure Testing of Exel Composites
6.4 Control Samples
For the 50x50mm section three samples were tested and two wall panels were tested
without damage to provide the standard. Both the 50x50mm section and the wall panel
had a very sudden failure as can be seen from figure 6.8 and figure 6.9 with the sudden
drop in load capacity.

The 50x50mm section failed due to a tear in the tension side followed by shear cracks
or tears up the side walls of the section. Complete failure when the side tears reached
the top compression section which had a crushing type failure.
Figure 6.8 Control Results of 50x50mm Samples
The 50x50mm sections had an ultimate load of 18 758N and a flexural stiffness an
indicator of the flexural modulus of 432N/mm. The control samples also had a flexural
modulus of 19 731.07MPa. The failure of the sample was very sudden as can be seen in
figure 6.8 by the very sudden decrease in load capacity. There were no signs of failure
before ultimate failure for the control samples.
0
5000
10000
15000
20000
25000
0 10 20 30 40 50 60 70
Loa
d (
N)
Deflection (mm)
Control - 50x50mm
Control 1 (50x50m)
Control 2 (50x50m)
Control 3 (50x50m)
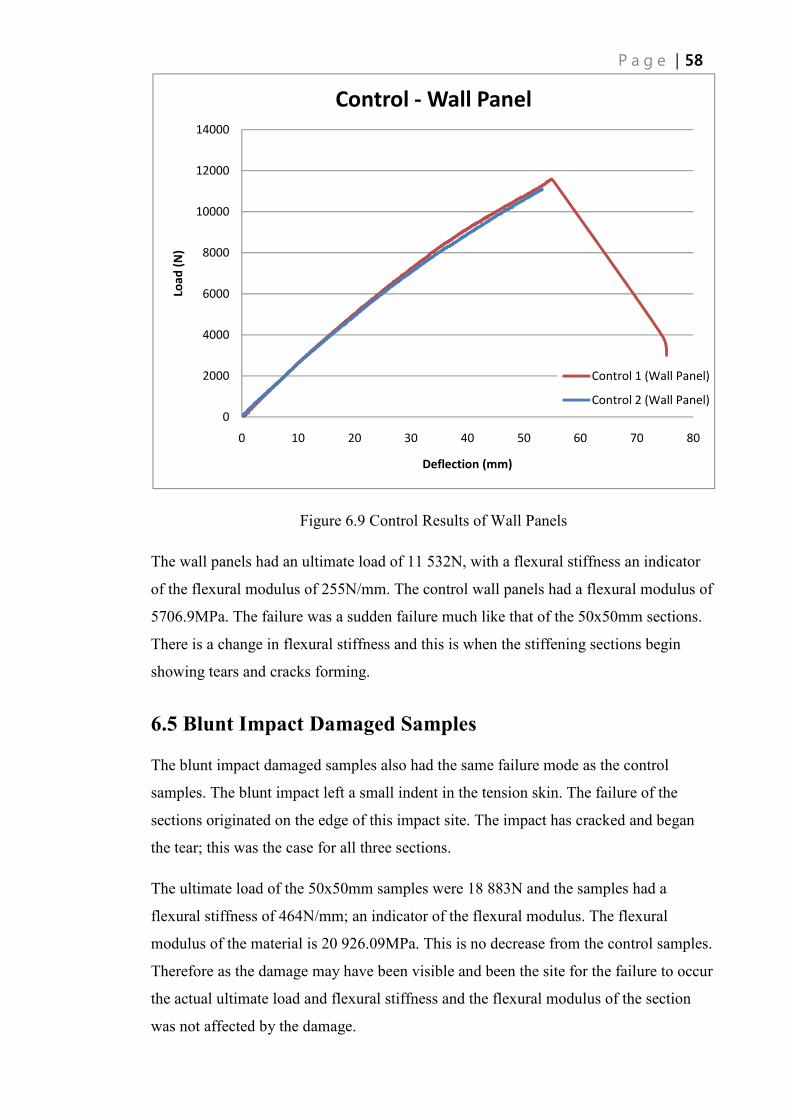
Figure 6.9 Control Results of Wall Panels
The wall panels had an ultimate load of 11 532N, with a flexural stiffness an indicator
of the flexural modulus of 255N/mm. The control wall panels had a flexural modulus of
5706.9MPa. The failure was a sudden failure much like that of the 50x50mm sections.
There is a change in flexural stiffness and this is when the stiffening sections begin
showing tears and cracks forming.
6.5 Blunt Impact Damaged Samples
The blunt impact damaged samples also had the same failure mode as the control
samples. The blunt impact left a small indent in the tension skin. The failure of the
sections originated on the edge of this impact site. The impact has cracked and began
the tear; this was the case for all three sections.
The ultimate load of the 50x50mm samples were 18 883N and the samples had a
flexural stiffness of 464N/mm; an indicator of the flexural modulus. The flexural
modulus of the material is 20 926.09MPa. This is no decrease from the control samples.
Therefore as the damage may have been visible and been the site for the failure to occur
the actual ultimate load and flexural stiffness and the flexural modulus of the section
was not affected by the damage.
0
2000
4000
6000
8000
10000
12000
14000
0 10 20 30 40 50 60 70 80
Loa
d (
N)
Deflection (mm)
Control - Wall Panel
Control 1 (Wall Panel)
Control 2 (Wall Panel)

Figure 6.10 Blunt Impact Results of 50x50mm Samples
The wall panels had an ultimate load of 9 347N, 18.9% decrease in average ultimate
load and a flexural stiffness an indicator of the flexural modulus of 258N/mm, no
decrease. The wall panel also had a flexural modulus of 5783.1MPa. Therefore the wall
panel unlike the 50x50mm section had a significant decrease in ultimate load where as
the flexural stiffness and flexural modulus of the material was not affected. Like the
50x50mm section the wall panel’s damage sites were the originators of the damage. The
failure in the compression side followed the blunt impact edges; this can be seen in
figure 6.11.
0
5000
10000
15000
20000
25000
0 10 20 30 40 50 60 70 80 90
Loa
d (
N)
Deflection (mm)
Blunt Damage - 50x50mm
Blunt 1 (50x50m)
Blunt 2 (50x50m)
Blunt 3 (50x50m)

Figure 6.11Blunt Impact Failure on Wall Panel
Figure 6.12 Blunt Impact Results of Wall Panels
0
2000
4000
6000
8000
10000
12000
0 20 40 60 80 100 120 140 160
Loa
d (
N)
Deflection (mm)
Blunt Damage - Wall Panel
Blunt 1 (Wall Panel)
Blunt 2 (Wall Panel)
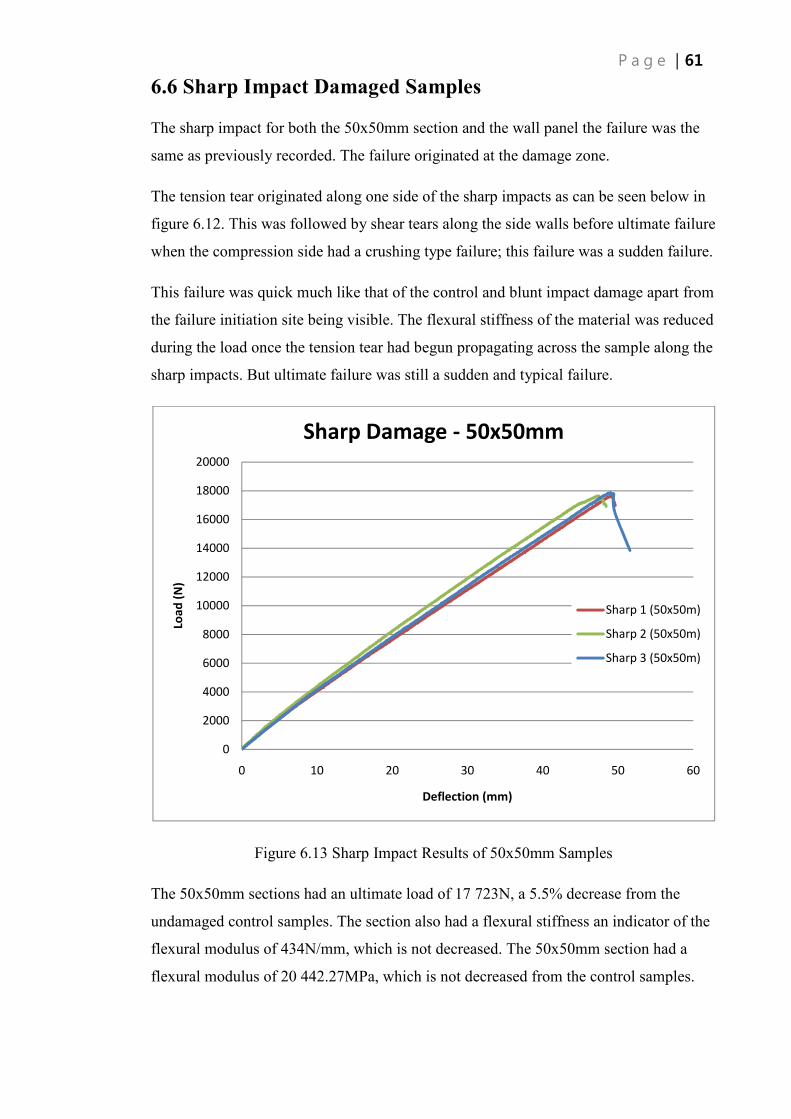
6.6 Sharp Impact Damaged Samples
The sharp impact for both the 50x50mm section and the wall panel the failure was the
same as previously recorded. The failure originated at the damage zone.
The tension tear originated along one side of the sharp impacts as can be seen below in
figure 6.12. This was followed by shear tears along the side walls before ultimate failure
when the compression side had a crushing type failure; this failure was a sudden failure.
This failure was quick much like that of the control and blunt impact damage apart from
the failure initiation site being visible. The flexural stiffness of the material was reduced
during the load once the tension tear had begun propagating across the sample along the
sharp impacts. But ultimate failure was still a sudden and typical failure.
Figure 6.13 Sharp Impact Results of 50x50mm Samples
The 50x50mm sections had an ultimate load of 17 723N, a 5.5% decrease from the
undamaged control samples. The section also had a flexural stiffness an indicator of the
flexural modulus of 434N/mm, which is not decreased. The 50x50mm section had a
flexural modulus of 20 442.27MPa, which is not decreased from the control samples.
0
2000
4000
6000
8000
10000
12000
14000
16000
18000
20000
0 10 20 30 40 50 60
Loa
d (
N)
Deflection (mm)
Sharp Damage - 50x50mm
Sharp 1 (50x50m)
Sharp 2 (50x50m)
Sharp 3 (50x50m)
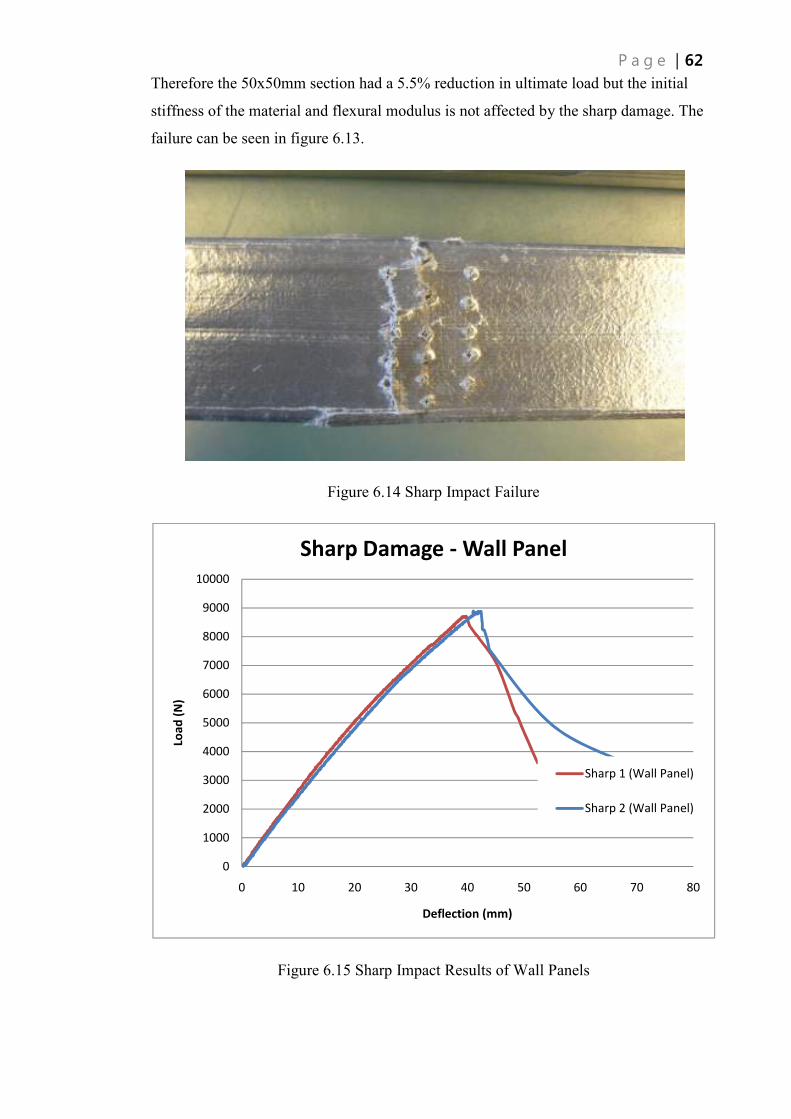
Therefore the 50x50mm section had a 5.5% reduction in ultimate load but the initial
stiffness of the material and flexural modulus is not affected by the sharp damage. The
failure can be seen in figure 6.13.
Figure 6.14 Sharp Impact Failure
Figure 6.15 Sharp Impact Results of Wall Panels
0
1000
2000
3000
4000
5000
6000
7000
8000
9000
10000
0 10 20 30 40 50 60 70 80
Loa
d (
N)
Deflection (mm)
Sharp Damage - Wall Panel
Sharp 1 (Wall Panel)
Sharp 2 (Wall Panel)

The wall panel had an ultimate load of 8 804N, which was a large reduction in average
ultimate load. The section also had a flexural stiffness of 259N/mm, which was not a
reduction and is an indicator of the flexural modulus. The wall panel also had a flexural
modulus of 6201.5MPa, which was also not a reduction. Therefore the wall panel much
the same as the 50x50mm section had a small reduction in ultimate load but the initial
stiffness of the material does not get affected.
The large reduction in ultimate load can be contributed to the large amount of damage
the sharp impact did. Each impact caused indentation and at places tears or punctures
through the section.
6.7 Cut Damaged Samples
For the cut damage the failure again originated at the damage site. This was the case for
not only the 50x50mm section but also the wall panel as well.
For the 50x50mm section the failure originated at the tension side and the tear would be
a continuation of one of the damage cuts, this would then shear up the side wall of the
section in multiple directions. This can be seen in figure 6.12.
Figure 6.16 Cut Failure in 50x50mm section

The 50x50mm section had an ultimate load of 17 366N, a 7.4% reduction in average
ultimate load. The section also had a flexural stiffness of 419N/mm, a reduction of 2.8%
which is an indicator of the flexural modulus. The wall panel also had a flexural
modulus of 19 044.44MPa, a reduction of 3.5 %. The cut damage has had the largest
effect to both ultimate load, flexural stiffness and the flexural modulus of the material.
As the cut has penetrated the outer coating or layer of the sample the inner material
begins to fail earlier in comparison to damage to the inner section like the blunt impact
where the inner material has been damaged but the outer layer still holds the tension
forces. The cut removes this ability with the cuts opening up and causing multiple shear
tears in side walls in comparison to the other types of damage which a single shear tear
is present, this is the cause of the reduction in stiffness and flexural modulus.
Figure 6.17 Cut Damage Results of 50x50mm Samples
The same cannot be said about the effect the cut damage has on the wall panel. The
ultimate load of the wall panel is 10 571N, an 8.3% decrease in average ultimate load.
The section also had a flexural stiffness an indicator of the flexural modulus of
253N/mm and a flexural modulus of 6013.2MPa, both of which are not decreased by
the damage.
0
2000
4000
6000
8000
10000
12000
14000
16000
18000
20000
0 10 20 30 40 50 60
Loa
d (
N)
Deflection (mm)
Cut Damage - 50x50mm
Cut 1 (50x50m)
Cut 2 (50x50m)
Cut 3 (50x50m)

The cut has caused a decrease in ultimate load but this is not as significant as the
50x50mm section. The flexural stiffness and flexural modulus of the material remains
unaffected by the cut damage.
Figure 6.18 Cut Damage Failure of Wall Panel
Figure 6.19 Cut Damage Results of Wall Panels
0
2000
4000
6000
8000
10000
12000
14000
0 10 20 30 40 50 60 70 80
Loa
d (
N)
Deflection (mm)
Control - Wall Panel
Control 1 (Wall Panel)
Control 2 (Wall Panel)

6.8 Fire Damaged Samples
The fire damage was only conducted on the 50x50mm section as this damage was hard
to achieve. The section had a small melted section where the fire had managed to reach
a sufficient temperature to cause damage, once cooled the area returned hard but with an
altered appearance.
With the fire damage to the wall panel the bbq lighter was tested but could not reach a
sufficient temperature to cause damage, any damage that was cause look like the
damage caused by the lighter against the 50x50mm section. This was deemed to be
unreasonable for a vandal or alike to attempt as it would take up wards of 45min to
damage only a small section. For this reason only 50x50mm sections were tested
damaged by the bbq lighter.
Figure 6.20 Fire Damage Results to 50x50mm Samples
The ultimate load of the fire damaged 50x50mm section was 18 837N, which was no
decrease. The sections also had a flexural stiffness an indicator of the flexural modulus
of 425N/mm and a flexural modulus of 19879.16 MPa. The fire damage has not reduced
the ultimate load or the flexural stiffness by any noticeable margin; it has in fact
increased both the average ultimate load and the flexural modulus.
0
5000
10000
15000
20000
25000
0 10 20 30 40 50 60
Loa
d (
N)
Deflection (mm)
Fire Damage - 50x50mm
Fire 1 (50x50m)
Fire 2 (50x50m)
Fire 3 (50x50m)
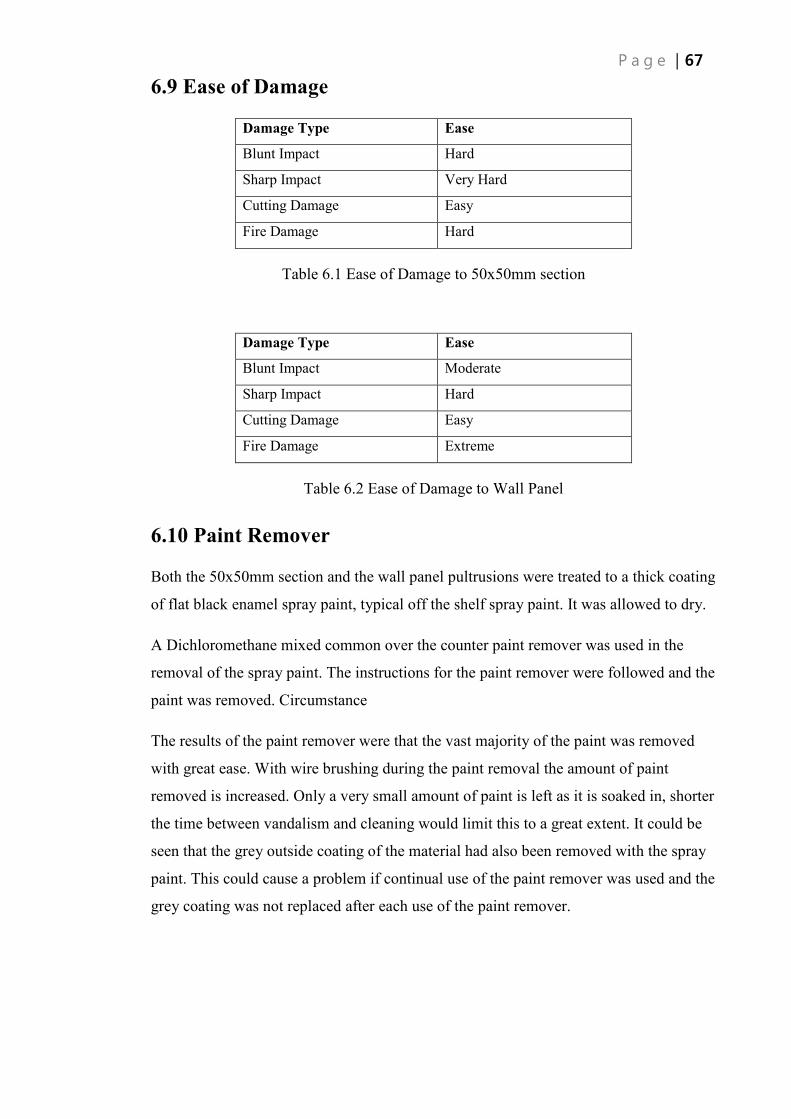
6.9 Ease of Damage
Damage Type Ease
Blunt Impact Hard
Sharp Impact Very Hard
Cutting Damage Easy
Fire Damage Hard
Table 6.1 Ease of Damage to 50x50mm section
Damage Type Ease
Blunt Impact Moderate
Sharp Impact Hard
Cutting Damage Easy
Fire Damage Extreme
Table 6.2 Ease of Damage to Wall Panel
6.10 Paint Remover
Both the 50x50mm section and the wall panel pultrusions were treated to a thick coating
of flat black enamel spray paint, typical off the shelf spray paint. It was allowed to dry.
A Dichloromethane mixed common over the counter paint remover was used in the
removal of the spray paint. The instructions for the paint remover were followed and the
paint was removed. Circumstance
The results of the paint remover were that the vast majority of the paint was removed
with great ease. With wire brushing during the paint removal the amount of paint
removed is increased. Only a very small amount of paint is left as it is soaked in, shorter
the time between vandalism and cleaning would limit this to a great extent. It could be
seen that the grey outside coating of the material had also been removed with the spray
paint. This could cause a problem if continual use of the paint remover was used and the
grey coating was not replaced after each use of the paint remover.
6.11 Conclusion
A total of 15 50x50mm square section glass fibre reinforced pultrusions and 8 glass
fibre reinforced pultruded wall panels were tested using a range of different damages.
The damages were of a blunt impact, a sharp impact, a Stanley knife cut and a bbq
lighter burn. The effect ranged from very noticeable to visible but not effective.
The cut damage was the easiest to achieve in both the 50x50mm section and the wall
panel. The cut damage was the most effective in the 50x50mm section where it not only
decreased the ultimate strength it also decreased the flexural stiffness.
The fire damage was the hardest to achieve, the effect was visible but the effect to the
ultimate strength and flexural stiffness was very negligible, especially when considered
in wind and actual environment.
The blunt and sharp impact were fairly hard to achieve but were not as effective
especially in the sharp impacts case. The sharp impact required a large amount of
impacts to achieve any kind of damage, the only damage that could be easily achieved is
when the sharp impact is combined with a hammer.
The paint remover was very effective against the spray paint. The material was also
very resistant to both the spray paint and the paint remover with only the outside grey
paint coat being also removed with the spray paint.
The wall panel’s most effective damage type was the sharp impact. This was mainly due
to the sharp impact in the 2 mm thickness causing small indents that pushed out the
other side to the damage.

Chapter 7
Findings and Conclusions
7.1 Introduction
For this research project two different types of fibre reinforced sandwich panels and
three different types of fibre reinforced pultruded sections. All of these different types
of fibre composite were subjected to the same types of damage. These types of damage
were blunt impact (a hammer), a sharp impact (a screw driver), a cut (Stanley knife) and
burn damage (a bbq lighter).
For the sandwich panel a plain sandwich panel was used and a sandwich panel with an
asphalt cover was used. For the pultrusion a 50x50mm square section, a 100x100mm
square section and a 460x40mm wall panel.
This project has completed all the specifications that were planned including the extra
work. This project has researched the background to fibre composites, there design and
there typical usage. The project has also investigated different levels of vandalism. It
has also investigated the effect the damage has had on integrated fibre composite
structures and elements and the project has tested full scale vandalised beams.
7.2 Findings
The project has investigated ranging and different types of vandalism on three different
styles of fibre composite. This has shown ranging levels of effectiveness from
completely immune to very effective. The ability to damage the fibre composites has
ranged also from immune to very easy.
7.2.1 Blunt Impact
For the sandwich fibre composite the blunt impact was hard to achieve especially when
considered in actual environment. To achieve the required damage when the vandal is
required to do an up-swing to the product the ability to cause damage is severely
hampered. But if achieved it could be very effective. The damage is very noticeable and
the capacity is reduced heavily because of the damage to the core.
For the 50x50mm pultrusion the blunt impact was fairly hard to achieve but was able to
be achieved. The results of the impact were marginal on the average ultimate load,

flexural stiffness and flexural modulus. For the pultruded wall panel 68% of the width
of each of the wall panels was immune to blunt impact damage, the other regions were
moderately hard to damage. The panel could be potentially destroyed in these regions
but local non destructive damage was able to be implemented.
For the pultruded 100x100mm section the blunt impact was very hard to achieve
especially when considered in actual environment, could be classified as immune to a
normal blunt attack.
7.2.2 Sharp Impact
For the sandwich panel the sharp impact was much like the blunt impact where the
effect was hard to achieve. The damage is achievable when combined with a hammer.
The damage is however achievable without the hammer but would take a large amount
of impacts to achieve this.
For the 50x50mm pultruded section the sharp impact required a large amount of impacts
to achieve any kind of damage, the only damage that could be easily achieved is when
the sharp impact is combined with a hammer.
The pultruded wall panel’s most effective damage type was the sharp impact. This was
mainly due to the sharp impact in the 2 mm thickness causing small indents that pushed
out the other side to the damage; this was again only achievable in combination with a
hammer.
For the 100x100mm pultruded section the sharp impact was much like the blunt impact
where the effect was extremely hard to achieve.
7.2.3 Cut Damage
For the sandwich panels the cut was easy to achieve and the effect from a small cut was
noticeable on both the ultimate load and flexural stiffness and flexural modulus of the
material.
For the 50x50mm pultruded section the cut damage was the easiest this was also true for
the wall panel. The cut damage was the most effective in the 50x50mm section where it
not only decreased the ultimate strength it also decreased the flexural stiffness and
flexural modulus.

For the 100x100mm pultruded section the cut however was easy to achieve, this would
be the easiest damage type to get a result with. Especially once the outer skin or cover
was cut.
7.4 Fire Damage
For the sandwich panel the burning was the easiest to achieve visible damage but the
actual effect of the burning was not as effective compared to the visible damage.
For the 50x50mm pultruded section the fire damage was the hardest to achieve, the
effect was visible but the effect to the ultimate strength and flexural stiffness was very
negligible, especially when considered in wind and actual environment.
For the 100x100mm pultruded section the samples could be classified as immune to
burn damage from a bbq lighter or similar product especially when considered in the
actual environment. When faced against a flame of higher temperature the effect is
extreme.
7.3 Conclusion
In conclusion all the tasks specified to the project specification have been completed.
Three different types of fibre composite were used and subjected to a range of damages
that would likely be carried out by a vandal. The damages were done by using real
world tools that would be available to a common vandal.
A common result to all the fibre composites is the ease of cut damage. This was easy to
achieve on all 4 types of product. For all the products once the outer coating or skin was
cut the inner material was easier to cut and the ability to cause large amounts of damage
increases. This also had at times a large effect to ultimate load and flexural stiffness.
A common immunity for all the fibre composites was that of blunt and sharp impact. In
the case of blunt impact damage the effect was very hard to achieve and at times
completely unreasonable to think a normal vandal would be able to achieve a sufficient
amount of damage to cause problems. With the sharp impact combined with a hammer
could achieve large amounts of damage to all types of fibre composites.
With the composites the effect to flexural stiffness is not apparent until high loads. The
initial flexural stiffness of the fibre composites is not affected by the damage but as the
load increases the flexural stiffness is affected by the damage.

7.4 Future Research
Further research in line with this project would be that of the fatigue behaviour to the
composites with the damage. The effect short term can be seen from this project and the
effect the damage has to the composite. The effect this damage has to the long term
performance of the fibre composites is not known and needs to be researched as one of
the benefits to fibre composites are the longer viability of the products.
Further research is needed into ranging effects of certain types of damage. This would
be ranging degrees of damage of the different types of damage. Further research is also
needed into the effect these damages have on full size slab elements of sandwich panel
as the ability to damage a large section is needed. Research could be carried out with the
specimen in actual environments to investigate the types of restraints the product have
to see if they contribute to the effect of the damage.
Further research could be into the effect of chemicals against the different pultrusions
and whether these had effects on the flexural behaviour of the fibre composites. This
could be accompanied with different common maintenance practices and see if these
have an effects on the fibre composites.

References
BALLINGER, C. A., 1992. Advanced Composites in the Construction Industry. In:
G.C. GRIMES, et al, ed. Proceedings of the 37th International SAMPE Symposium,
Covina: Society for the Advancement of Materials and Process Engineering
Burchill, P.J, Mathys, Z, Gardiner, C.P, 2005. An analysis of the burning of polyester
and vinylester fibre glass composites. In: Fire and Materials 29 (2005) 249-264.
Chotard, T.J, Benzeggagh, M.L, 1997. On the mechanical behaviour of pultruded
sections submitted to low-velocity impact. In: Composites Science and Technology 58
(1998) 839-854.
Christoforou A, P. 2001. Impact dynamics and damage in composite structures. In:
Composite Structures 52 (2001) 181-188.
Found, M.S, Holden, G.J, Swamy, R.N. 1997. Static indentation and impact behaviour
of GRP pultruded sections. In: Composite Structures 39 (1997) 223-228.
Gardiner, C.P, Mathys, Z, Mouritz, A.P, 2002. Tensile and Compressive Properties of
FRP Composites with Loacalised Fire Damage. In: Applied Composite Materials 9
(2002) 353-367.
Kärger, L, Baaran, J, Gunnion, A, Thomson, R, 2009. Evaluation of impact assessment
methodologies. Part I: Applied methods. In: Composites: Part B 40 (2009) 65-70.
Kemp, M. 2008. Use of Pultruded Sections in Civil Infrastructure. In: T, Aravinthan,
Fibre Composites in Civil Engineering Infrastructure Past, Present and Future.
Kilic, B, Agwai, A, Madenci, E. 2009. Peridynamic theory for progressive damage
prediction in centre-cracked composite laminates. In: Composite Structures 90 (2009)
141-151.
Luo, R.K, Green, E.R, Morrison, C.J, 2000. An approach to evaluate the impact damage
initiation and propagation in composite plates. In: Composites Part B:engineering 32
(2001) 513-520.
Mouritz, A.P, Gardiner, C.P, 2002. Compression properties of fire-damaged polymer
sandwich composites. In: Composites: Part A 33 (2002) 609-620.
ROSATO, D. V., 1982. An Overview of Composites. In: G. LUBIN, ed. Handbook of
Composites. New York: Van Nostrand Reinhold.
REINHART, T. J., 1998. Overview of Composite Materials. In: S. T. PETERS, ed.
Handbook of Composites. London: Chapman and Hall
REINHART, T. J., 1998. Overview of Composite Materials. In: S. T. PETERS, ed.
Handbook of Composites. London: Chapman and Hall
Schubel, P.M, Luo, J, Daniel, I.M, 2004. Low velocity impact behaviour of composite
sandwich panels. In: Composites Part A: applied science and manufacturing 36 (2005)
1389-1396.
Shyr, T, Pan, Y, 2003. Impact Resistance and damage characteristics of composite
laminates. In: Composite Structures 62 (2003) 193-203.
Soden, P.D, Hinton, M.J, Kaddour, A.S, 1998. Lamina Properties, Lay-up
Configurations and Loading Conditions for a Range of Fibre-Reinforced Composite
Laminates. In: Composites Science and Technology 58 (1998) 1011-1022.
Tagarielli, VL, Fleck, NA, Desphande, VS, 2004, Collapse of Clamped and Simply
Supported Composite Sandwich Beams in Three-Point Bending, Composite Structure
Part B, vol. 35, pp. 523-534
Van Erp, G., Rogers, D., 2008. A Highly Sustainable Fibre Composite Building Panel.
In: T, Aravinthan, Fibre Composites in Civil Engineering Infrastructure Past, Present
and Future.
Van Herk, H., Rosselli, F., 2008. Pultrusions: Offering Sustainable Solutions for the
minerals Processing &Water Industries. In: T, Aravinthan, Fibre Composites in Civil
Engineering Infrastructure Past, Present and Future.

Appendix
Appendix A – Project Specification

University of Southern Queensland
FACULTY OF ENGINEERING AND SURVEYING
E�G 4111/4112 Research Project
Project Specification
FOR: Tristan Rennie
TOPIC: Effect of Vandalism of Fibre Composite Beams
SUPERVISOR: A/Prof Thiru Aravinthan
SPONSERS: QLD Department of Main Roads
Centre of Excellence in Engineered Fibre Composites
ENROLLMENT: ENG 4111, ONC - SEMESTER 1 2009
ENG 4112, ONC - SEMESTER 2 2009
PROJECT AIM: This project seeks to investigate the effect of common types of
vandalism on fibre composite structures, define the typical kinds
of vandalism and with what tools they occur with and whether
any of these defects will have a negative effect on the structural
integrity of the beam or structure. Define the amount of damage
needed before noticeable negative effects start to occur in the
structure and investigating whether these effects translate into
large scale environments.
PROGRAMME: Issue A; 24th
March 2009
1. Research the background information regarding fibre composites design and the
typical usage of the fibre composite materials.
2. Investigate and document levels of vandalism for testing.
3. Analyse and test unaffected samples to provide a standard.
4. Analyse and test vandalised samples.
5. Test ranging levels of vandalism.
6. Investigate the effect of vandalism in integrated fibre composite
structures/elements.
7. Prepare documented vandalism report detailing procedure and results of
vandalism.
As time permits:
8. Analyse and test full scale vandalised beams.
AGREED:
(Student)
(Supervisor) ___ /___ /2009 ___ / ___ / 2009
Examiner/Co-examiner:
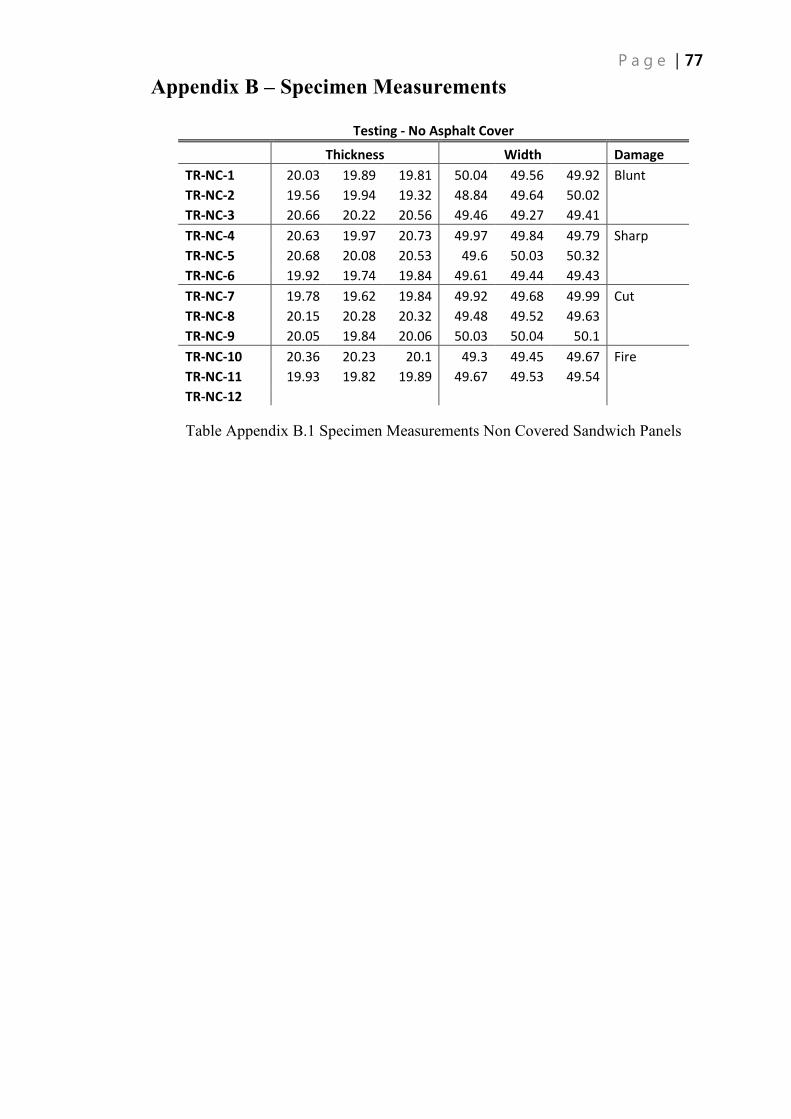
Appendix B – Specimen Measurements
Testing - No Asphalt Cover
Thickness Width Damage
TR-NC-1 20.03 19.89 19.81 50.04 49.56 49.92 Blunt
TR-NC-2 19.56 19.94 19.32 48.84 49.64 50.02
TR-NC-3 20.66 20.22 20.56 49.46 49.27 49.41
TR-NC-4 20.63 19.97 20.73 49.97 49.84 49.79 Sharp
TR-NC-5 20.68 20.08 20.53 49.6 50.03 50.32
TR-NC-6 19.92 19.74 19.84 49.61 49.44 49.43
TR-NC-7 19.78 19.62 19.84 49.92 49.68 49.99 Cut
TR-NC-8 20.15 20.28 20.32 49.48 49.52 49.63
TR-NC-9 20.05 19.84 20.06 50.03 50.04 50.1
TR-NC-10 20.36 20.23 20.1 49.3 49.45 49.67 Fire
TR-NC-11 19.93 19.82 19.89 49.67 49.53 49.54
TR-NC-12
Table Appendix B.1 Specimen Measurements Non Covered Sandwich Panels

Testing - Asphalt Cover
Thickness Width Damage
TR-C-T-1 25.63 25.67 49.46 48.86 49.11 Cut
TR-C-T-2 25.34 25.85 49.04 49.16 48.93
TR-C-T-3 26.25 25.92 49.17 48.19 47.4
TR-C-B-1 25.66 25.36 49.59 49.13 49.41 Blunt
TR-C-B-2 25.4 25.59 48.86 48.91 49.84
TR-C-B-3 25.89 25.55 49.46 49 49.35
TR-C-S-1 25.68 25.61 48.93 48.78 49.27 Sharp
TR-C-S-2 25.58 25.67 49.2 49.63 49.27
TR-C-S-3 25.24 25.46 48.97 49.46 49.41
TR-C-C-1 25.93 24.98 49.2 49.52 49.66 Control
TR-C-C-2 25.61 25.76 48.47 47.92 47.56
TR-C-C-3 24.96 25.16 48.09 47.61 48.96
TR-C-F-1 26.26 26.2 48.34 47.8 47.12 Fire
TR-C-F-2 26.38 25.77 48.78 48.76 48.9
TR-C-F-3 25.14 25.78 48.78 48.76 48.81
Table Appendix B.2 Specimen Measurement Asphalt Covered Sandwich Panels

Testing – 100x100mm Pultrusions
Height Width Thickness Damage
TR-P-1 100.51 100.45 100.5 100.71 100.37 100.35 5.24 5.23 Control
TR-P-2 100.49 100.77 101.2 100.43 100.59 100.32 5.17 4.99
TR-P-3 100.48 100.6 100.36 100.79 100.49 100.64 5.06 4.98
TR-P-4 100.56 100.52 100.55 100.32 100.43 100.33 5.02 5.1 Blunt
TR-P-5 100.33 100.25 100.21 100.53 100.55 100.66 5.33 5.31
TR-P-6 100.68 100.8 100.54 100.67 100.64 100.62 4.97 4.99
TR-P-7 100.49 100.5 100.69 100.38 100.42 100.32 5.13 5.07 Sharp
TR-P-8 100.35 100.46 100.35 100.46 100.45 100.46 5.07 5.24
TR-P-9 100.49 100.58 100.58 100.44 100.34 100.43 4.97 5.14
TR-P-10 100.65 100.56 100.58 100.68 100.58 100.44 5.29 5.27 Cut
TR-P-11 100.68 100.79 100.73 100.6 100.35 100.3 5.18 5.17
TR-P-12 100.39 100.43 100.37 100.41 100.44 100.55 5.12 5.14
TR-P-13 100.5 100.47 100.6 100.36 100.4 100.35 5.05 5.03 Fire
TR-P-14 100.76 100.58 100.53 100.36 100.29 100.51 5.2 5.21
TR-P-15 100.52 100.62 100.5 100.44 100.55 100.56 5.1 5.28
Table Appendix B.3 Specimen Measurement 100x100mm Section

Testing – 50x50mm Pultrusions
Height Width Thickness Damage
TR-XP-1 50.83 51.14 51.38 50.95 6.82 6.88 Control
TR-XP-2 51.06 51.27 50.83 51.17 6.39 6.12
TR-XP-3 51.23 50.99 50.92 51.24 5.97 6.23
TR-XP-4 51.03 50.97 50.95 51.15 6.86 5.79 Blunt
TR-XP-5 51.02 51.06 50.99 51.09 5.84 6.58
TR-XP-6 51.11 50.93 51.38 51.22 6.38 6.09
TR-XP-7 50.95 51.05 51.04 51.01 6.61 5.9 Sharp
TR-XP-8 50.85 51.16 51.13 51.2 5.99 6.12
TR-XP-9 51.06 51.16 50.91 51.29 6.61 6.03
TR-XP-10 51.06 51.04 50.9 51.05 6.54 5.81 Cut
TR-XP-11 51.45 51.01 51 51.16 6.01 6.38
TR-XP-12 50.87 51.2 51.01 51.2 6.32 5.91
TR-XP-13 50.87 50.91 50.96 51.14 6.32 6.13 Fire
TR-XP-14 50.62 50.99 51.01 50.97 6.04 6.29
TR-XP-15 51.15 50.94 51.18 50.98 6.28 6.48
Table Appendix B.4 Specimen Measurement 50x50mm Section

Testing – Wall Panel Pultrusions
Height Width Thickness Damage
TR-WP-1 38.36 38.3 460.12 459.98 2.7 2.59 Control
TR-WP-2 38.3 38.54 459.89 459.96 2.67 2.61
TR-WP-3 38.09 38.01 460.18 460.21 2.59 2.58 Blunt
TR-WP-4 38.02 38.14 459.86 459.98 2.76 2.84
TR-WP-5 39.18 38.36 460.06 460.13 2.34 2.38 Sharp
TR-WP-6 38.41 38.06 459.87 459.96 2.52 2.45
TR-WP-7 38.44 38.15 460.1 459.96 2.62 2.65 Cut
TR-WP-8 38.03 38.04 460.08 460.1 2.39 2.46
Table Appendix B.5 Specimen Measurement Wall Panel

Appendix C – Results Tables
Asphalt Covered Samples
Control Samples Sample
Number
Ultimate Load
(N) Flexural Stiffness (N/mm)
1 5026.826 406.25
2 4696.494 350
3 5028.169 333.33
Avg 4917 363.19
Blunt Impacted Samples Sample
Number
Ultimate Load
(N) Flexural Stiffness (N/mm)
1 4428.098 307.14
2 4827.418 328.57
3 4543.077 333.33
Avg 4599 323.01
Sharp Impacted Samples Sample
Number
Ultimate Load
(N) Flexural Stiffness (N/mm)
1 3931.089 341.67
2 3361.568 300
3 3986.144 381.82
Avg 3958.62 361.745
Cut Damaged Samples Sample
Number
Ultimate Load
(N) Flexural Stiffness (N/mm)
1 5062.41 325
2 4300.363 358.33
3 4464.858 346.15
Avg 4609 343.16
Fire Damaged Samples Sample
Number
Ultimate Load
(N) Flexural Stiffness (N/mm)
1 4822.214 342.86
2 5081.21 369.23
3 4698.508 345.45
Avg 4867.31 352.51
Table Appendix C.1 Covered Sandwich Panel
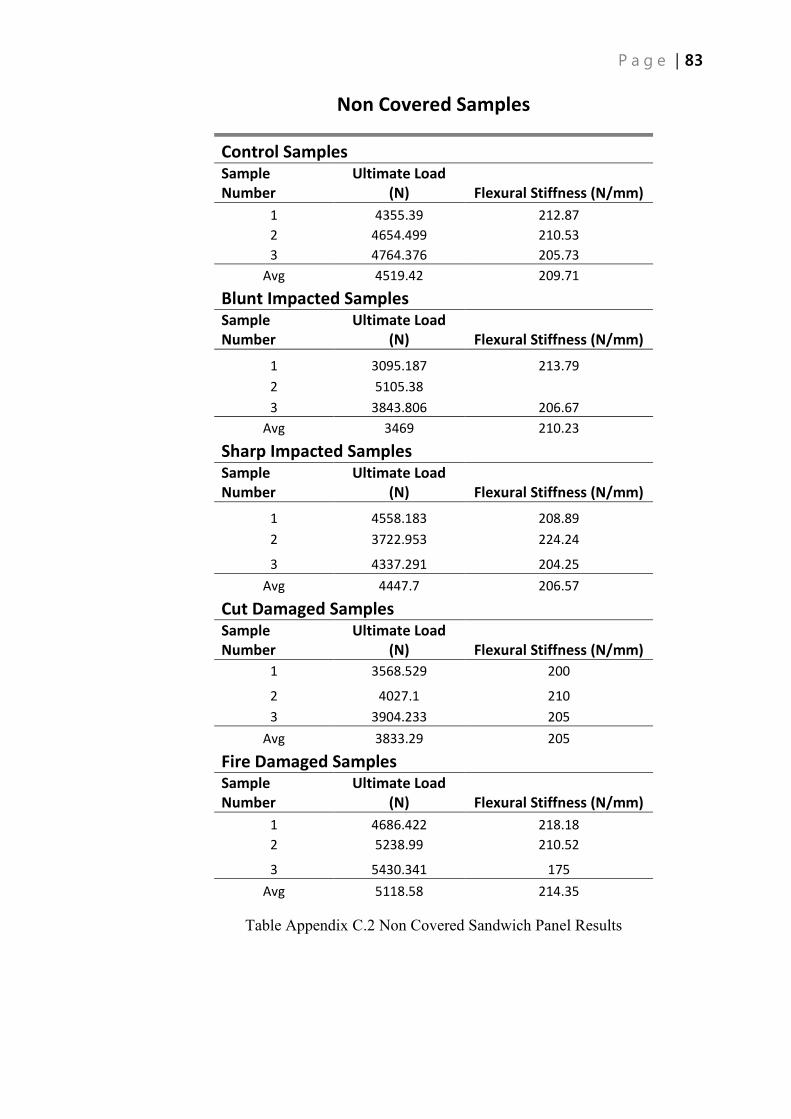
Non Covered Samples
Control Samples Sample
Number
Ultimate Load
(N) Flexural Stiffness (N/mm)
1 4355.39 212.87
2 4654.499 210.53
3 4764.376 205.73
Avg 4519.42 209.71
Blunt Impacted Samples Sample
Number
Ultimate Load
(N) Flexural Stiffness (N/mm)
1 3095.187 213.79
2 5105.38
3 3843.806 206.67
Avg 3469 210.23
Sharp Impacted Samples Sample
Number
Ultimate Load
(N) Flexural Stiffness (N/mm)
1 4558.183 208.89
2 3722.953 224.24
3 4337.291 204.25
Avg 4447.7 206.57
Cut Damaged Samples Sample
Number
Ultimate Load
(N) Flexural Stiffness (N/mm)
1 3568.529 200
2 4027.1 210
3 3904.233 205
Avg 3833.29 205
Fire Damaged Samples Sample
Number
Ultimate Load
(N) Flexural Stiffness (N/mm)
1 4686.422 218.18
2 5238.99 210.52
3 5430.341 175
Avg 5118.58 214.35
Table Appendix C.2 Non Covered Sandwich Panel Results

100x100mm Square Section
Control Samples Sample
Number
Ultimate Load
(N) Flexural Stiffness (N/mm)
1 39613.4 4000
2 40615.5 3883.49
3 39975.3 3804.35
Avg 40068 3895.95
Blunt Impacted Samples Sample
Number
Ultimate Load
(N) Flexural Stiffness (N/mm)
1 37344.6 3714.28
2 37511.6 4000
3 40365 3894.74
Avg 38407 3869.65
Sharp Impacted Samples Sample
Number
Ultimate Load
(N) Flexural Stiffness (N/mm)
1 37943.1 3870.97
2 37623 3789.47
3 38012.7 3434.34
Avg 37860 3698.28
Cut Damaged Samples Sample
Number
Ultimate Load
(N) Flexural Stiffness (N/mm)
1 39905.7 4000
2 37177.5 3855.42
3 37469.8 3734.94
Avg 38184 3863.45
Fire Damaged Samples Sample
Number
Ultimate Load
(N) Flexural Stiffness (N/mm)
1 38277.1 3958.33
2 36398.1 3894.74
3 41047 4021.74
Avg 38574.07 3958.27
Table Appendix C.3 100x100mm Pultrusion Results

50x50mm Square Section
Control Samples
Sample Number Ultimate Load (N) Flexural Stiffness (N/mm)
1 19375.2 431.82
2 18484.4 422.5
3 18414.8 439.26
Avg 18758.13 431.26
Blunt Impacted Samples
Sample Number Ultimate Load (N) Flexural Stiffness (N/mm)
1 18025.1 441.67
2 19027.2 450
3 19597.9 500
Avg 18883.4 463.89
Sharp Impacted Samples
Sample Number Ultimate Load (N) Flexural Stiffness (N/mm)
1 17635.3 407.14
2 17649.2 475
3 17885.9 431.58
Avg 17723.47 437.91
Cut Damaged Samples
Sample Number Ultimate Load (N) Flexural Stiffness (N/mm)
1 18345.2 421.05
2 17663.2 417.39
3 16090.3 383.78
Avg 17366.23 419.2
Fire Damaged Samples
Sample Number Ultimate Load (N) Flexural Stiffness (N/mm)
1 19625.7 458.33
2 17203.8 411.76
3 19681.4 404.76
Avg 18836.97 424.95
Table Appendix C.4 50x50mm Pultrusion Results
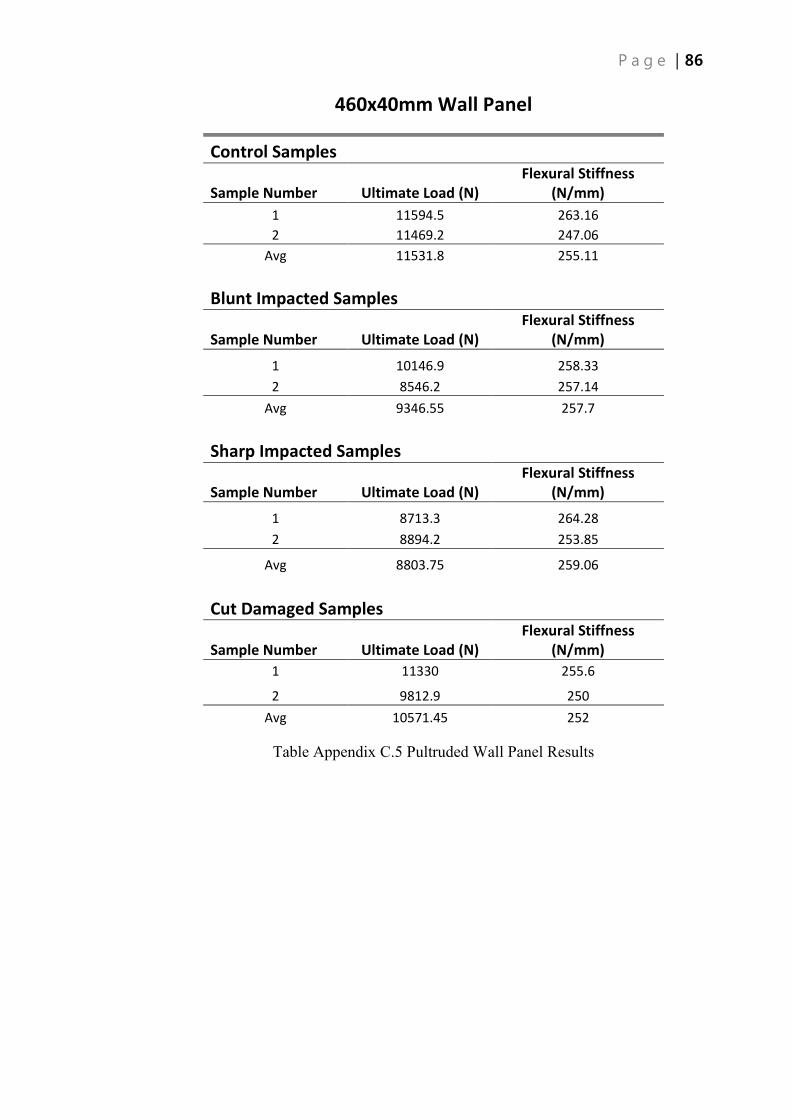
460x40mm Wall Panel
Control Samples
Sample Number Ultimate Load (N)
Flexural Stiffness
(N/mm)
1 11594.5 263.16
2 11469.2 247.06
Avg 11531.8 255.11
Blunt Impacted Samples
Sample Number Ultimate Load (N)
Flexural Stiffness
(N/mm)
1 10146.9 258.33
2 8546.2 257.14
Avg 9346.55 257.7
Sharp Impacted Samples
Sample Number Ultimate Load (N)
Flexural Stiffness
(N/mm)
1 8713.3 264.28
2 8894.2 253.85
Avg 8803.75 259.06
Cut Damaged Samples
Sample Number Ultimate Load (N)
Flexural Stiffness
(N/mm)
1 11330 255.6
2 9812.9 250
Avg 10571.45 252
Table Appendix C.5 Pultruded Wall Panel Results

Appendix D – Flexural Stiffness Results
Testing - �o Asphalt Cover
Specimen �ame Description I (eff) (mm^4) EI (�mm^2) E (eff) Mpa
TR-�C-1 Blunt 32780.122 2.43E+08 7407.7
TR-�C-2 Blunt 31091.040 2.39E+08 7690.8
TR-�C-3 Blunt 35347.581 2.46E+08 6965.8
Blunt mean 33072.91 2.43E+08 7354.78
Std Dev 2143.32 3.55E+06 365.43
COV 6.48 1.46 4.97
TR-�C-4 Sharp 35504.567 2.52E+08 7092.2
TR-�C-5 Sharp 35518.046 2.55E+08 7170.9
TR-�C-6 Sharp 32177.522 2.32E+08 7209.8
Sharp mean 34400.05 2.46E+08 7157.62
Std Dev 1924.77 1.24E+07 59.91
COV 5.60 5.02 0.84
TR-�C-7 Cut 31994.951 2.35E+08 7352.0
TR-�C-8 Cut 34283.019 2.41E+08 7027.6
TR-�C-9 Cut 33287.753 2.36E+08 7101.3
Cut mean 33188.57 2.38E+08 7160.28
Std Dev 1147.25 3.01E+06 170.03
COV 3.46 1.27 2.37
TR-�C-10 Fire 34133.245 2.48E+08 7260.1
TR-�C-11 Fire 32461.936 2.39E+08 7366.1
TR-�C-12 Fire 33780.437 2.39E+08 7078.5
Fire mean 33458.54 2.42E+08 7234.91
Std Dev 880.93 5.02E+06 145.40
COV 2.63 2.07 2.01
TR-�C-13 Control 24716.092 1.91E+08 7742.2
TR-�C-14 Control 24612.759 1.89E+08 7689.1
TR-�C-15 Control 24296.331 1.85E+08 7611.7
Control mean 24541.73 1.89E+08 7681.01
Std Dev 218.71 3.27E+06 65.62
COV 0.89 1.74 0.85
Table Appendix D.1 Flexural Results Non Covered Sandwich Panel
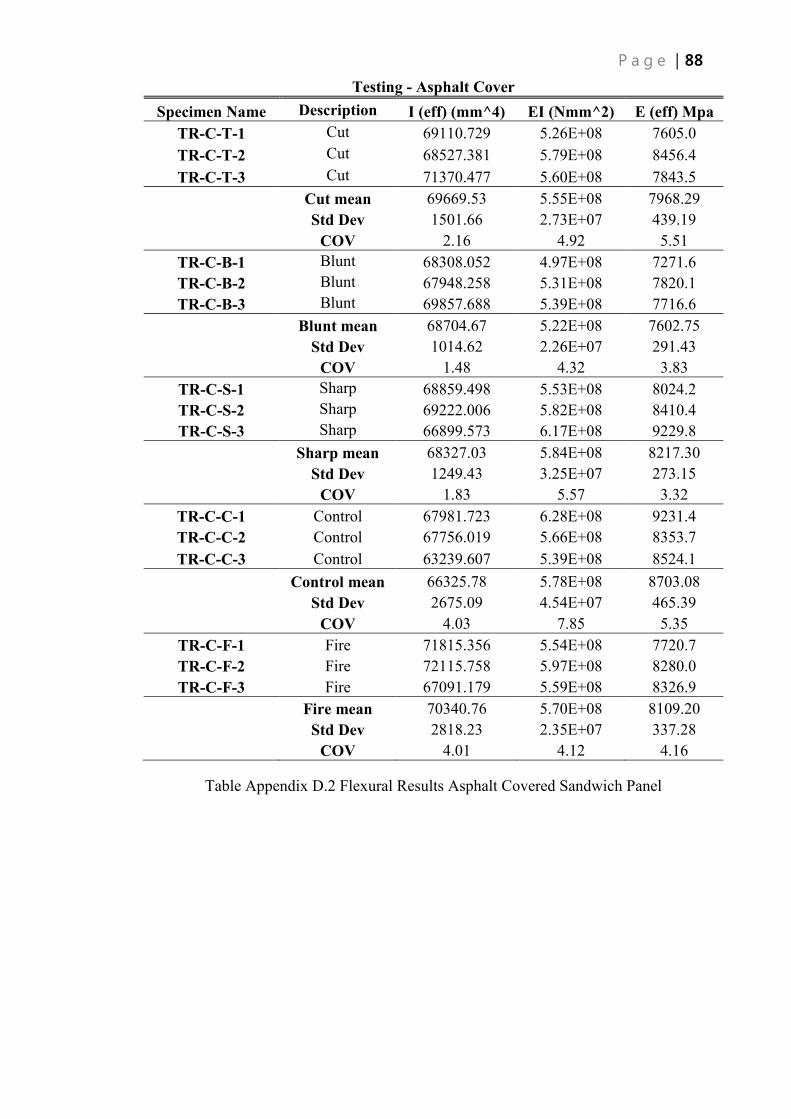
Testing - Asphalt Cover
Specimen �ame Description I (eff) (mm^4) EI (�mm^2) E (eff) Mpa
TR-C-T-1 Cut 69110.729 5.26E+08 7605.0
TR-C-T-2 Cut 68527.381 5.79E+08 8456.4
TR-C-T-3 Cut 71370.477 5.60E+08 7843.5
Cut mean 69669.53 5.55E+08 7968.29
Std Dev 1501.66 2.73E+07 439.19
COV 2.16 4.92 5.51
TR-C-B-1 Blunt 68308.052 4.97E+08 7271.6
TR-C-B-2 Blunt 67948.258 5.31E+08 7820.1
TR-C-B-3 Blunt 69857.688 5.39E+08 7716.6
Blunt mean 68704.67 5.22E+08 7602.75
Std Dev 1014.62 2.26E+07 291.43
COV 1.48 4.32 3.83
TR-C-S-1 Sharp 68859.498 5.53E+08 8024.2
TR-C-S-2 Sharp 69222.006 5.82E+08 8410.4
TR-C-S-3 Sharp 66899.573 6.17E+08 9229.8
Sharp mean 68327.03 5.84E+08 8217.30
Std Dev 1249.43 3.25E+07 273.15
COV 1.83 5.57 3.32
TR-C-C-1 Control 67981.723 6.28E+08 9231.4
TR-C-C-2 Control 67756.019 5.66E+08 8353.7
TR-C-C-3 Control 63239.607 5.39E+08 8524.1
Control mean 66325.78 5.78E+08 8703.08
Std Dev 2675.09 4.54E+07 465.39
COV 4.03 7.85 5.35
TR-C-F-1 Fire 71815.356 5.54E+08 7720.7
TR-C-F-2 Fire 72115.758 5.97E+08 8280.0
TR-C-F-3 Fire 67091.179 5.59E+08 8326.9
Fire mean 70340.76 5.70E+08 8109.20
Std Dev 2818.23 2.35E+07 337.28
COV 4.01 4.12 4.16
Table Appendix D.2 Flexural Results Asphalt Covered Sandwich Panel

Testing - 100x100mm Section
Specimen �ame Description I (eff) (mm^4) EI (�mm^2) E (eff) Mpa
TR-P-1 Control 3.02E+06 7.10E+10 23467.3
TR-P-2 Control 2.97E+06 6.89E+10 23192.2
TR-P-3 Control 2.92E+06 6.75E+10 23098.4
Control mean 2.97E+06 6.91E+10 23252.65
Std Dev 51021.32 1.75E+09 191.75
COV 1.72 2.53 0.82
TR-P-4 Blunt 2.94E+06 6.59E+10 22416.2
TR-P-5 Blunt 3.05E+06 7.10E+10 23255.5
TR-P-6 Blunt 2.92E+06 6.91E+10 23699.8
Blunt mean 2.97E+06 6.87E+10 23123.84
Std Dev 72595.59 2.56E+09 651.83
COV 2.44 3.73 2.82
TR-P-7 Sharp 2.96E+06 6.87E+10 23195.2
TR-P-8 Sharp 2.98E+06 6.73E+10 22579.3
TR-P-9 Sharp 2.94E+06 6.09E+10 20733.8
Sharp mean 2.96E+06 6.56E+10 22169.43
Std Dev 19493.15 4.12E+09 1280.85
COV 0.66 6.28 5.78
TR-P-10 Cut 3.06E+06 7.10E+10 23222.3
TR-P-11 Cut 3.01E+06 6.84E+10 22718.3
TR-P-12 Cut 2.97E+06 6.63E+10 22338.9
Cut mean 3.01E+06 6.86E+10 22759.84
Std Dev 44842.24 2.36E+09 443.18
COV 1.49 3.44 1.95
TR-P-13 Fire 2.93E+06 7.02E+10 23978.8
TR-P-14 Fire 3.02E+06 6.91E+10 22903.0
TR-P-15 Fire 3.01E+06 7.14E+10 23726.0
Fire mean 2.99E+06 7.02E+10 23535.95
Std Dev 48441.12 1.13E+09 562.51
COV 1.62 1.60 2.39
Table Appendix D.3 Flexural Results 100x100mm Section

Testing - 50x50mm Section
Specimen �ame Description I (eff) (mm^4) EI (�mm^2) E (eff) Mpa
TR-XP-1 Control 403266.306 7.66E+09 19003.4
TR-XP-2 Control 383995.456 7.50E+09 19526.5
TR-XP-3 Control 377446.543 7.80E+09 20663.3
Control mean 388236.10 7.65E+09 19731.07
Std Dev 13422.08 1.51E+08 848.66
COV 3.46 1.97 4.30
TR-XP-4 Blunt 383832.397 7.84E+09 20420.9
TR-XP-5 Blunt 380155.397 7.99E+09 21007.5
TR-XP-6 Blunt 382371.974 8.16E+09 21349.8
Blunt mean 382119.92 8.00E+09 20926.09
Std Dev 1851.41 1.63E+08 469.77
COV 0.48 2.04 2.24
TR-XP-7 Sharp 381025.703 7.23E+09 18963.4
TR-XP-8 Sharp 374253.564 8.43E+09 22524.3
TR-XP-9 Sharp 386063.808 7.66E+09 19839.2
Sharp mean 380447.69 7.77E+09 20442.27
Std Dev 5926.30 6.10E+08 1855.47
COV 1.56 7.85 9.08
TR-XP-10 Cut 378588.653 7.47E+09 19737.5
TR-XP-11 Cut 383414.904 7.41E+09 19319.6
TR-XP-12 Cut 376790.631 6.81E+09 18076.3
Cut mean 379598.06 7.23E+09 19044.44
Std Dev 3425.56 3.65E+08 864.09
COV 0.90 5.04 4.54
TR-XP-13 Fire 377968.429 8.13E+09 21520.3
TR-XP-14 Fire 373723.701 7.31E+09 19553.4
TR-XP-15 Fire 386950.291 7.18E+09 18563.8
Fire mean 379547.47 7.54E+09 19879.16
Std Dev 6753.20 5.17E+08 1504.94
COV 1.78 6.85 7.57
Table Appendix D.4 Flexural Results 50x50mm Section

Testing - Wall Panel
Specimen �ame Description I (eff) (mm^4) EI (�mm^2) E (eff) Mpa
TR-WP-1 Control 792087.527 4.67E+09 5896.1
TR-WP-2 Control 794640.599 4.38E+09 5517.6
Control mean 793364.1 4.53E+09 5706.9
Std Dev 1805.3 2.02E+08 267.6
COV 0.2 4.5 4.7
TR-WP-3 Blunt 764761.347 4.58E+09 5994.8
TR-WP-4 Blunt 819106.414 4.56E+09 5571.3
Blunt mean 791933.9 4.57E+09 5783.1
Std Dev 38427.8 1.49E+07 299.5
COV 4.9 0.3 5.2
TR-WP-5 Sharp 736267.922 4.69E+09 6370.3
TR-WP-6 Sharp 746763.270 4.50E+09 6032.7
Sharp mean 741515.6 4.60E+09 6201.5
Std Dev 7421.3 1.31E+08 238.7
COV 1.0 2.8 3.8
TR-WP-7 Cut 787945.984 4.54E+09 5755.9
TR-WP-8 Cut 723269.298 4.54E+09 6270.6
Cut mean 755607.6 4.54E+09 6013.2
Std Dev 45733.3 0.00E+00 364.0
COV 6.1 0.00 6.1
Table Appendix D.5 Flexural Results Wall Panel