THE EFFECT OF SALINE PORE WATER ON THE s3. fileCanadian Young Geotechnical Engineers and...
6
Canadian Young Geotechnical Engineers and Geoscientists Conference Manoir St-Castin, October 27-30, 2004 Québec City, Québec, Canada THE EFFECT OF SALINE PORE WATER ON THE FREEZING OF LOOSE DEVON SILT Lukas U. Arenson, UofA Geotechnical Centre, University of Alberta, Edmonton, Alberta, Canada ABSTRACT Fine-grained soils are known to have a significant amount of unfrozen water even at temperatures below zero centigrade. Water migration in the partially frozen zone close to the freezing front is responsible for the development of ice lenses and hence the change in the structure of the frozen soil. The magnitude of this water migration is a function of the temperature gradient, grain sizes and their distribution, type of minerals and ionic strength (salinity) of the pore fluid. Using dissolved fluorescein in the pore water, it was possible to photograph the unfrozen water and follow the growth of the ice crystals as the freezing front advances during one dimensional freezing of loose silt. Horizontal ice lenses developed for non-saline soils, whereas long vertical ice needles were observed in the saline soils. Depending on temperature and salinity the thickness of the ice lenses and needles changed, as well as the thickness of the zone where unfrozen water could be observed. RÉSUMÉ Les sols fins sont connus pour contenir une quantité non négligeable d'eau non gelée même à des températures situées au- dessous du point de congélation. La migration de l'eau dans la zone partiellement gelée près du front de congélation est responsable du développement de lentilles de glace et par conséquent du changement de la structure du sol congelé. L'importance de cette migration d'eau est une fonction du gradient de température, des tailles des grains et de leur distribution, du type de minéral et de la force ionique (salinité) du fluide contenu dans les pores. En utilisant de la fluorescéine dissoute dans l'eau, il a été possible de prendre des photos et de suivre l'eau non gelée ainsi que la croissance des cristaux de glace avec l'avancement du front de congélation pendant une congélation unidimensionnelle. Des lentilles de glace horizontales se développent pour les sols non-salins, tandis qu'on a observé de longues aiguilles verticales de glace pour les sols salins. Selon la température et la salinité l'épaisseur des lentilles et des aiguilles de glace a changé, de même que l'épaisseur de la zone où l'eau non gelée a pu être observée. 1. INTRODUCTION In countries that experience cold winters, damage due to frost action is common or must be incorporated in the long- time design to minimize its affect. It is well known, that only fine-grained soils are frost susceptible due to their ability to form ice lenses (Konrad and Morgenstern 1980). Ice lenses form due to flow of water through a zone between the ice lens and the unfrozen soil, known as the frozen fringe (Miller 1972). The temperature gradient in the soil evokes a suction gradient within the frozen soil that causes the water to migrate towards the ice lens. Several authors further show that the amount of liquid water within a frozen soil might be quite significant depending on temperature or the salinity of the pore water (Williams 1967; Anderson and Tice 1972; Anderson et al. 1973; Patterson and Smith 1985; Hivon and Sego 1995). The liquid water within a frozen soil can either exist as adsorbed water films on the surface of the soil particles or as free pore water that can migrate. The migration process of the unfrozen water within the frozen fringe, however, is not yet completely understood. A profound understanding is important in order to describe and model the behaviour of frozen soils in terms of strength and deformation under load. The laboratory tests presented here are part of a research program that aims at measuring the distribution of unfrozen water during the freezing process of various soils at different salinities. A first study on a granular soil has recently been published (Arenson and Sego 2004). This paper shows the growth of ice crystals in loose silt under one-dimensional step-freezing. 2. MATERIAL AND METHOD 2.1 Set up During the freezing of the soil, the ice crystal formation and the unfrozen water was followed optically with a digital still camera (Canon PowerShotG1, 3.3 Megapixels). Fluorescein (C 20 H 12 O 5 ) was used to trace the unfrozen water. In ultra violet light, the liquid water with the dissolved fluorescein appeared green. Due to the solute expulsion during freezing, the ice was no longer green and appeared black in the pictures. It was then possible to follow the advancing freezing front and to observe the frozen fringe by taking pictures at frequent time intervals. Figure 1 shows the test apparatus that was built using Perspex. The bottom was placed into the coolant and stainless steel insert guaranteed one-dimensional freezing from the bottom upward. Details of the mould can be found in Arenson and Sego (2004). All experiments were performed in a cold room controlled to an air temperature of about 1ºC. 2.2 Samples Devon Silt was used to carry out the freezing tests. This is a silt with low liquid limit. The grain size distribution of the soil is shown in Figure 2.
Transcript of THE EFFECT OF SALINE PORE WATER ON THE s3. fileCanadian Young Geotechnical Engineers and...
Canadian Young Geotechnical Engineers and Geoscientists Conference Manoir St-Castin, October 27-30, 2004
Québec City, Québec, Canada
THE EFFECT OF SALINE PORE WATER ON THE FREEZING OF LOOSE DEVON SILT Lukas U. Arenson, UofA Geotechnical Centre, University of Alberta, Edmonton, Alberta, Canada ABSTRACT Fine-grained soils are known to have a significant amount of unfrozen water even at temperatures below zero centigrade. Water migration in the partially frozen zone close to the freezing front is responsible for the development of ice lenses and hence the change in the structure of the frozen soil. The magnitude of this water migration is a function of the temperature gradient, grain sizes and their distribution, type of minerals and ionic strength (salinity) of the pore fluid. Using dissolved fluorescein in the pore water, it was possible to photograph the unfrozen water and follow the growth of the ice crystals as the freezing front advances during one dimensional freezing of loose silt. Horizontal ice lenses developed for non-saline soils, whereas long vertical ice needles were observed in the saline soils. Depending on temperature and salinity the thickness of the ice lenses and needles changed, as well as the thickness of the zone where unfrozen water could be observed. RÉSUMÉ Les sols fins sont connus pour contenir une quantité non négligeable d'eau non gelée même à des températures situées au-dessous du point de congélation. La migration de l'eau dans la zone partiellement gelée près du front de congélation est responsable du développement de lentilles de glace et par conséquent du changement de la structure du sol congelé. L'importance de cette migration d'eau est une fonction du gradient de température, des tailles des grains et de leur distribution, du type de minéral et de la force ionique (salinité) du fluide contenu dans les pores. En utilisant de la fluorescéine dissoute dans l'eau, il a été possible de prendre des photos et de suivre l'eau non gelée ainsi que la croissance des cristaux de glace avec l'avancement du front de congélation pendant une congélation unidimensionnelle. Des lentilles de glace horizontales se développent pour les sols non-salins, tandis qu'on a observé de longues aiguilles verticales de glace pour les sols salins. Selon la température et la salinité l'épaisseur des lentilles et des aiguilles de glace a changé, de même que l'épaisseur de la zone où l'eau non gelée a pu être observée. 1. INTRODUCTION In countries that experience cold winters, damage due to frost action is common or must be incorporated in the long-time design to minimize its affect. It is well known, that only fine-grained soils are frost susceptible due to their ability to form ice lenses (Konrad and Morgenstern 1980). Ice lenses form due to flow of water through a zone between the ice lens and the unfrozen soil, known as the frozen fringe (Miller 1972). The temperature gradient in the soil evokes a suction gradient within the frozen soil that causes the water to migrate towards the ice lens. Several authors further show that the amount of liquid water within a frozen soil might be quite significant depending on temperature or the salinity of the pore water (Williams 1967; Anderson and Tice 1972; Anderson et al. 1973; Patterson and Smith 1985; Hivon and Sego 1995). The liquid water within a frozen soil can either exist as adsorbed water films on the surface of the soil particles or as free pore water that can migrate. The migration process of the unfrozen water within the frozen fringe, however, is not yet completely understood. A profound understanding is important in order to describe and model the behaviour of frozen soils in terms of strength and deformation under load. The laboratory tests presented here are part of a research program that aims at measuring the distribution of unfrozen water during the freezing process of various soils at different salinities. A first study on a granular soil has recently been published (Arenson and Sego 2004). This paper shows the
growth of ice crystals in loose silt under one-dimensional step-freezing. 2. MATERIAL AND METHOD 2.1 Set up During the freezing of the soil, the ice crystal formation and the unfrozen water was followed optically with a digital still camera (Canon PowerShotG1, 3.3 Megapixels). Fluorescein (C20H12O5) was used to trace the unfrozen water. In ultra violet light, the liquid water with the dissolved fluorescein appeared green. Due to the solute expulsion during freezing, the ice was no longer green and appeared black in the pictures. It was then possible to follow the advancing freezing front and to observe the frozen fringe by taking pictures at frequent time intervals. Figure 1 shows the test apparatus that was built using Perspex. The bottom was placed into the coolant and stainless steel insert guaranteed one-dimensional freezing from the bottom upward. Details of the mould can be found in Arenson and Sego (2004). All experiments were performed in a cold room controlled to an air temperature of about 1ºC. 2.2 Samples Devon Silt was used to carry out the freezing tests. This is a silt with low liquid limit. The grain size distribution of the soil is shown in Figure 2.

Canadian Young Geotechnical Engineers and Geoscientists Conference Manoir St-Castin, October 27-30, 2004
Québec City, Québec, Canada
2.3 Sample Preparation A slurry was prepared where the dry silt was poured into the brine with the intended salinity and then the whole mixture was deaerated. The mould was filled with the slurry and the silt was allowed to consolidate under self-weight before the mould was put into the cold bath to initiate freezing. This preparation resulted in very loose samples. Some sample even showed additional consolidation as the freezing advanced. In order to study the effect of consolidation a series of sample was performed by letting them consolidate for several hours. 2.4 Test Overview An overview of the various tests is given in Table 1. The temperatures given in this table indicate the setting of the coolant temperature. However, the actual temperatures within the samples are warmer. During a test, the temperatures were recorded about 5 mm (T1) and 35 mm (T2) above the metal plate. Temperature losses occurred within the pumping system of the coolant resulting in the sample temperatures recorded (Table 2).
Figure 1. Test apparatus for one-dimensional freezing experiments in a cold room (* photographed area).
grain size [mm]
0.001 0.01 0.1 1
pe
rce
nt
fin
er
tha
n
0%
20%
40%
60%
80%
100%
Figure 2. Grain size distribution for Devon silt.
Table 1. Overview of the freezing tests performed (incl. test numbers).
Salinity Temperature of coolant, T 0PPT 5PPT 10PPT 30PPT loose samples -10ºC 9 23 25 30 -12ºC 34 21 26 28 -15ºC 19 22 27 29 “dense” samples -10ºC 31 24 32 33
Table 2. Temperatures in ºC at a height of about 5 mm (T1) and 35 mm (T2) into the sample at various times.
0min 30min 60min 90min 120min 150minTest No. T1 T2 T1 T2 T1 T2 T1 T2 T1 T2 T1 T29 4.6 6.7 1.3 5.1 -0.3 5.3 -0.7 4.4 -0.8 4.7 -0.9 4.7 19 1.7 4.5 -1.4 3.8 -2.7 3.4 -3.1 3.5 -3.1 3.3 -3.3 3.3 21 0.5 3.2 -0.1 4.6 -1.4 4.5 -1.8 4.5 -1.9 4.5 -2.0 4.4 22 1.4 2.7 -0.2 3.8 -2.1 3.8 -2.6 3.6 -2.8 3.5 -3.0 3.5 23 1.3 2.3 1.1 4.7 -0.1 4.8 -0.3 4.7 -0.0 4.7 - - 24 2.5 3.3 0. 5.0 -0.0 4.8 -0.7 5.0 -0.9 4.7 -1.1 4.7 25 3.4 6.7 1.8 5.0 -0.2 5.3 -0.8 4.4 -0.7 4.5 -1.2 4.5 26 1.6 6.5 0.9 4.7 -0.8 4.4 -1.4 4.2 -1.3 4.2 -1.7 4.1 27 1.6 5.3 0.2 4.1 -2.1 3.6 -3.1 3.6 -3.2 3.6 -3.2 3.6 28 2.2 1.1 -0.9 3.6 -3.0 3.5 -3.1 3.4 -3.0 3.5 -2.9 3.5 29 3.8 5.9 -2.2 4.3 -3.0 3.4 -3.7 3.5 -3.7 2.6 -3.6 3.2 30 3.8 4.3 0.3 3.7 -0.5 4.3 -0.5 4.2 -0.6 4.7 -0.6 3.9 31 2.1 2.5 0.3 3.9 -0.6 5.0 -0.9 5.0 -1.1 4.9 -1.2 4.8 32 2.0 2.5 -0.2 3.4 -0.9 3.8 -0.9 3.5 -1.1 3.7 -1.1 3.5 33 0.6 1.2 -0.5 2.5 -0.8 3.8 -0.9 4.0 -0.8 3.9 -0.8 3.7 34 1.4 0.8 -0.8 4.6 -1.7 5.3 -2.0 5.3 -2.0 5.0 -2.0 5.1
10cm
10cm
* The gradients through the samples were about constant after 2.5 hours for all tests. Samples that were frozen with colder coolant temperatures showed the longest time to reach steady state. The temperatures gradients reach from 1.73ºC/cm for a coolant temperature T of -10ºC to 2.23 ºC/cm for T = -15ºC. 3. PICTURE SEQUENCES This chapter presents the results of the freezing tests on Devon silt. The figures show pictures at several time steps. 3.1 General freezing of Devon silt Several photographs taken during the freezing processes of loose Devon silt samples are shown in Figure 3. The freezing front is virtually horizontal and is quite distinct for salinities up to 10PPT. Even at a salinity of 30PPT it is possible to estimate the advance in freezing. Detailed analysis of the freezing of non-saline Devon silt can further be found in Konrad (1994) with respect to their frost heave potential. Similar observations were made during the tests presented even though the advance in freezing was reverse. Small horizontal ice lenses formed at the freezing

Canadian Young Geotechnical Engineers and Geoscientists Conference Manoir St-Castin, October 27-30, 2004
Québec City, Québec, Canada
(a)
(c)
(b)
(d)
Figure 3. Freezing tests No. 9(a), 23(b), 25(c) & 30(d). All tests are performed with Devon silts and the coolant temperature was set to -10ºC. The first picture was taken about one hour after the beginning of the experiment. The time intervals between the pictures are 10 (No. 9, 0PPT & No. 23, 5PPT), 15 (No. 25, 10PPT) and 20 minutes (No. 30, 30PPT).

Canadian Young Geotechnical Engineers and Geoscientists Conference Manoir St-Castin, October 27-30, 2004
Québec City, Québec, Canada
front, resulting in heave and compaction of the unfrozen soil above. However, since the soil is very loose, i.e. self-weight consolidation might not have been completed, the void ratio and the water content in the unfrozen zone are high. This results in a reduced formation of large ice lenses. On the other hand, a few small ice needles started to grow in vertical direction. This results in formation of frozen soil peds surrounded by ice on at least two sides (Figure 3). Some unfrozen water can further be found below the freezing front for the non-saline soil. This effect can be explained by the large specific surface of the Devon silt, which has a significant amount of clay size particles (~20%) (Figure 2). 3.2 Effect of saline pore water The freezing regime changes significantly for saline soils, where the ice grows spicular. The size of those ice crystals can be very significant since they grow unhindered through the loose fine soil matrix. Compared to the observations within a granular soil (Arenson and Sego 2004) the ice needles are much longer. The concentration in the brine increases as the ice grows, forming the vertical ice structure. Due to the looseness of the soil matrix, solid particles are moved with the unfrozen water during the ice formation. With advanced freezing, i.e. colder temperatures, the soil freezes in the unfrozen channels, pushing the unfrozen pore liquid upward. The formation of long ice needles is more pronounce in the sample with high salinity, where the freezing point depression is larger. The difference in thermal conductivity between the ice, water, and soil particles facilitates the growth (Figure 3d). A comparison between different salinities after 90 minutes is shown in Figure 4. The coolant temperature was set at -15ºC, which results in the largest thermal gradient under investigation. The non-saline soil (Figure 4a) shows ice lense pattern with soil peds being surrounded by ice. Due to the expansion of the ice filled pores an overconsolidation of those peds occurs. The ice lenses are approximately 0.1 – 0.5 mm in length and their size increase as they approach the freezing front. The samples at 5PPT and 10PPT (Figure 4a, b) are similar. Even though the pictures do not illustrate it well, the zone where unfrozen water can be found is slightly thicker for the higher salinity. Both tests show an increased concentration of fluorescein above the freezing front. This concentration was probably caused by the change in layers between the consolidated silt and the slurry above. In contrast to test No. 19 (0PPT) and No. 29 (30PPT), the thickness of the silt layer was approximately similar to the thickness of the frozen layer. High salinities (Test No. 29) show reduced ice formation and an increased thickness of the layer with unfrozen water. The increase in salinity of local brine pockets during freezing results in a significant freezing point depression. These pockets are then trapped within the frozen matrix and much colder temperatures are required to freeze the water to a solid ice matrix.
(a) (b) (c) (d) Figure 4. Frozen Devon silt after 1.5 hours in the coolant at -15ºC. Tests No. 19 (a, 0PPT), No 22 (b, 5PPT), No. 27 (c, 10PPT) and No. 29 (d, 30PPT).
(a) (b) (c) (d) (e) (f) Figure 5. Comparison between three different freezing gradients and salinities after about 35 minutes. Coolant temperatures are set at -10ºC (a, d), -12ºC (b, e) and -15ºC (c, f). The salinities are 0PPT (a – c) and 10PPT (d – f). 3.3 Effect of freezing gradient There is no significant change in the freezing mechanisms as a result of the applied gradient (Figure 5). The thickness of the frozen layer increases and it seems as if the size of the ice lenses decrease slightly with increasing thermal gradient. In addition, the amount of unfrozen water within the frozen zone increases to some extent. Similar observations can be made for the saline silt, except that no horizontal ice lenses are formed. The length of the vertical ice needles and the thickness of the layer containing traceable unfrozen water also seem to increase. The thickness of the ice needles decrease slightly as the thermal gradient increases.
Canadian Young Geotechnical Engineers and Geoscientists Conference Manoir St-Castin, October 27-30, 2004
Québec City, Québec, Canada
3.4 Effect of consolidation Four tests were performed with Devon silt at a higher particle packing (Table 1). The increase was achieved by allowing more time for the soil to consolidate under self-weight. The samples, however, are still quite loose, i.e. high void ratios. Nevertheless, some minor differences in the ice crystal grow was observed. The non-saline sample shows no identifiable difference (Figure 3 vs. Figure 6a). The thickness of the layer where unfrozen water can be identified, however, is reduced for saline samples. The ice needles seem to grow less vertical in the denser soil. This might be due to increased resistance in denser regions. The ice attempts to grow along the line of least resistance, which might not be vertical in a denser sample. It was further noted that the freezing front advances faster for the denser soil. The freezing front in sample No. 9 (Figure 5a) and No. 25 (Figure 5d) advances between 6 and 7 mm within 30 minutes. About 9 mm are recorded in the dense samples for the same time period (Figure 7). This difference of nearly 50% most probably is the result of an increased overall thermal conductivity in the denser samples.
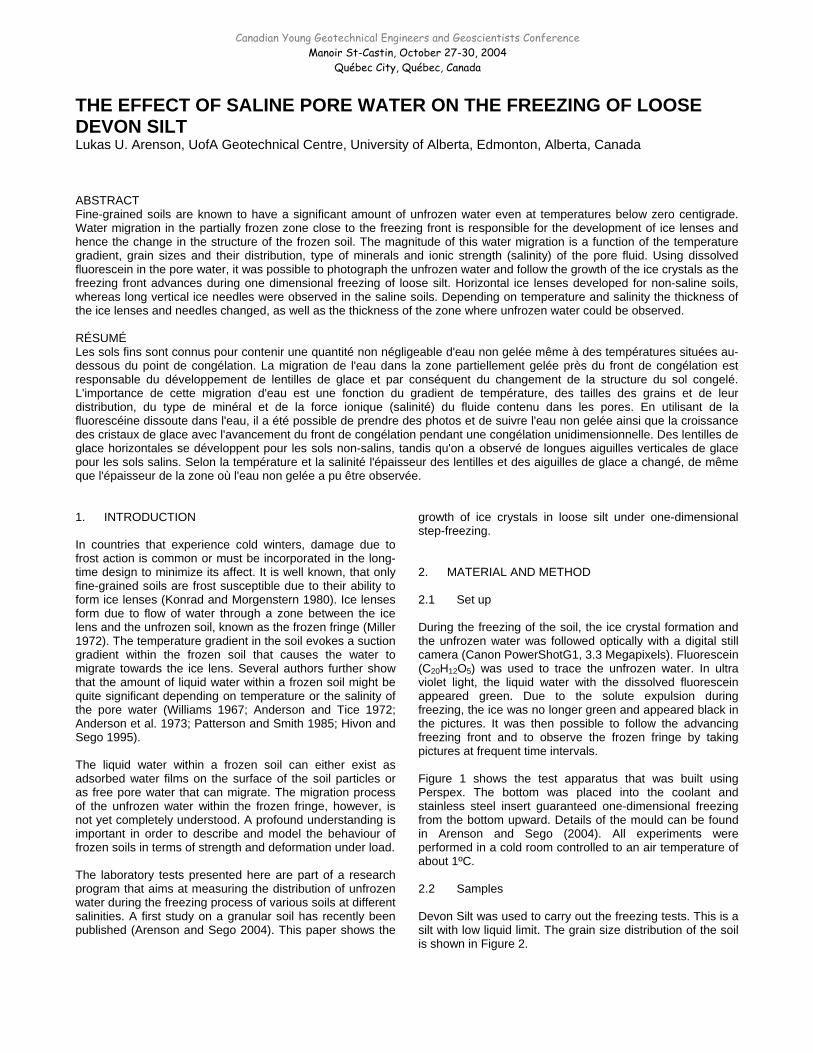
(a) (b) Figure 7. Freezing advance for test No. 31 (a) and 32 (b). Pictures are taken after 36 minutes.
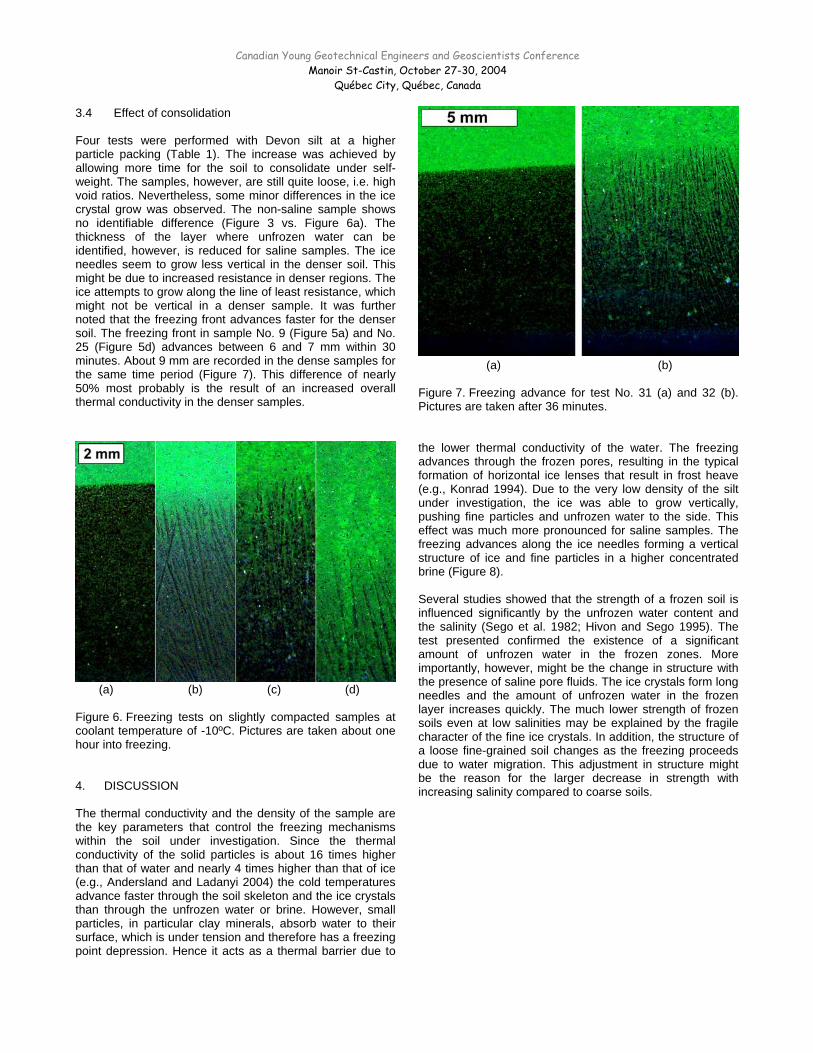
(a) (b) (c) (d) Figure 6. Freezing tests on slightly compacted samples at coolant temperature of -10ºC. Pictures are taken about one hour into freezing. 4. DISCUSSION The thermal conductivity and the density of the sample are the key parameters that control the freezing mechanisms within the soil under investigation. Since the thermal conductivity of the solid particles is about 16 times higher than that of water and nearly 4 times higher than that of ice (e.g., Andersland and Ladanyi 2004) the cold temperatures advance faster through the soil skeleton and the ice crystals than through the unfrozen water or brine. However, small particles, in particular clay minerals, absorb water to their surface, which is under tension and therefore has a freezing point depression. Hence it acts as a thermal barrier due to
the lower thermal conductivity of the water. The freezing advances through the frozen pores, resulting in the typical formation of horizontal ice lenses that result in frost heave (e.g., Konrad 1994). Due to the very low density of the silt under investigation, the ice was able to grow vertically, pushing fine particles and unfrozen water to the side. This effect was much more pronounced for saline samples. The freezing advances along the ice needles forming a vertical structure of ice and fine particles in a higher concentrated brine (Figure 8). Several studies showed that the strength of a frozen soil is influenced significantly by the unfrozen water content and the salinity (Sego et al. 1982; Hivon and Sego 1995). The test presented confirmed the existence of a significant amount of unfrozen water in the frozen zones. More importantly, however, might be the change in structure with the presence of saline pore fluids. The ice crystals form long needles and the amount of unfrozen water in the frozen layer increases quickly. The much lower strength of frozen soils even at low salinities may be explained by the fragile character of the fine ice crystals. In addition, the structure of a loose fine-grained soil changes as the freezing proceeds due to water migration. This adjustment in structure might be the reason for the larger decrease in strength with increasing salinity compared to coarse soils.
Canadian Young Geotechnical Engineers and Geoscientists Conference Manoir St-Castin, October 27-30, 2004
Québec City, Québec, Canada
Free
zing
2
3
4
5
1
Free
zing
2
3
4
5
1
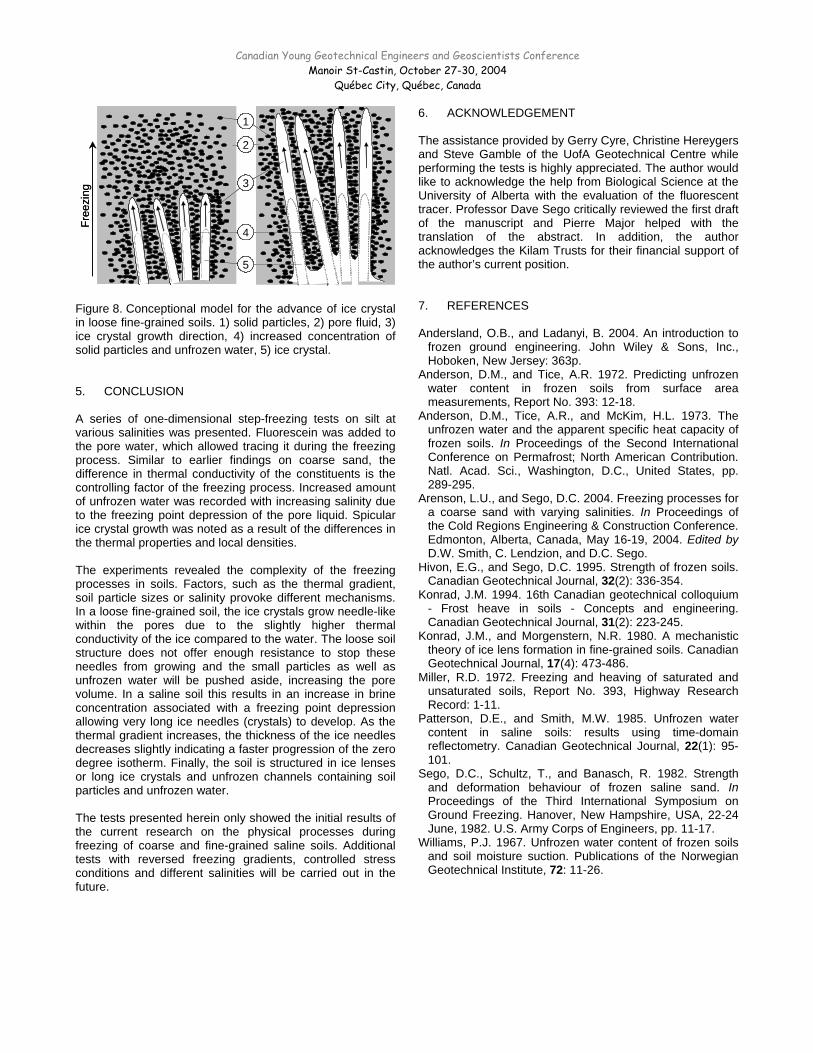
Figure 8. Conceptional model for the advance of ice crystal in loose fine-grained soils. 1) solid particles, 2) pore fluid, 3) ice crystal growth direction, 4) increased concentration of solid particles and unfrozen water, 5) ice crystal. 5. CONCLUSION A series of one-dimensional step-freezing tests on silt at various salinities was presented. Fluorescein was added to the pore water, which allowed tracing it during the freezing process. Similar to earlier findings on coarse sand, the difference in thermal conductivity of the constituents is the controlling factor of the freezing process. Increased amount of unfrozen water was recorded with increasing salinity due to the freezing point depression of the pore liquid. Spicular ice crystal growth was noted as a result of the differences in the thermal properties and local densities. The experiments revealed the complexity of the freezing processes in soils. Factors, such as the thermal gradient, soil particle sizes or salinity provoke different mechanisms. In a loose fine-grained soil, the ice crystals grow needle-like within the pores due to the slightly higher thermal conductivity of the ice compared to the water. The loose soil structure does not offer enough resistance to stop these needles from growing and the small particles as well as unfrozen water will be pushed aside, increasing the pore volume. In a saline soil this results in an increase in brine concentration associated with a freezing point depression allowing very long ice needles (crystals) to develop. As the thermal gradient increases, the thickness of the ice needles decreases slightly indicating a faster progression of the zero degree isotherm. Finally, the soil is structured in ice lenses or long ice crystals and unfrozen channels containing soil particles and unfrozen water. The tests presented herein only showed the initial results of the current research on the physical processes during freezing of coarse and fine-grained saline soils. Additional tests with reversed freezing gradients, controlled stress conditions and different salinities will be carried out in the future.
6. ACKNOWLEDGEMENT The assistance provided by Gerry Cyre, Christine Hereygers and Steve Gamble of the UofA Geotechnical Centre while performing the tests is highly appreciated. The author would like to acknowledge the help from Biological Science at the University of Alberta with the evaluation of the fluorescent tracer. Professor Dave Sego critically reviewed the first draft of the manuscript and Pierre Major helped with the translation of the abstract. In addition, the author acknowledges the Kilam Trusts for their financial support of the author’s current position. 7. REFERENCES Andersland, O.B., and Ladanyi, B. 2004. An introduction to
frozen ground engineering. John Wiley & Sons, Inc., Hoboken, New Jersey: 363p.
Anderson, D.M., and Tice, A.R. 1972. Predicting unfrozen water content in frozen soils from surface area measurements, Report No. 393: 12-18.
Anderson, D.M., Tice, A.R., and McKim, H.L. 1973. The unfrozen water and the apparent specific heat capacity of frozen soils. In Proceedings of the Second International Conference on Permafrost; North American Contribution. Natl. Acad. Sci., Washington, D.C., United States, pp. 289-295.
Arenson, L.U., and Sego, D.C. 2004. Freezing processes for a coarse sand with varying salinities. In Proceedings of the Cold Regions Engineering & Construction Conference. Edmonton, Alberta, Canada, May 16-19, 2004. Edited by D.W. Smith, C. Lendzion, and D.C. Sego.
Hivon, E.G., and Sego, D.C. 1995. Strength of frozen soils. Canadian Geotechnical Journal, 32(2): 336-354.
Konrad, J.M. 1994. 16th Canadian geotechnical colloquium - Frost heave in soils - Concepts and engineering. Canadian Geotechnical Journal, 31(2): 223-245.
Konrad, J.M., and Morgenstern, N.R. 1980. A mechanistic theory of ice lens formation in fine-grained soils. Canadian Geotechnical Journal, 17(4): 473-486.
Miller, R.D. 1972. Freezing and heaving of saturated and unsaturated soils, Report No. 393, Highway Research Record: 1-11.
Patterson, D.E., and Smith, M.W. 1985. Unfrozen water content in saline soils: results using time-domain reflectometry. Canadian Geotechnical Journal, 22(1): 95-101.
Sego, D.C., Schultz, T., and Banasch, R. 1982. Strength and deformation behaviour of frozen saline sand. In Proceedings of the Third International Symposium on Ground Freezing. Hanover, New Hampshire, USA, 22-24 June, 1982. U.S. Army Corps of Engineers, pp. 11-17.
Williams, P.J. 1967. Unfrozen water content of frozen soils and soil moisture suction. Publications of the Norwegian Geotechnical Institute, 72: 11-26.


![CartemotoneigeSagLac2014-15 [Unlocked by ] sentier lac st-jean.pdf · 6.6 trans-quÉbec 83 trans-quÉbec 93 trans-quÉbec 93 trans-quÉbec 93 trans-quÉbec 93 trans-quÉbec 93 trans-quÉbec](https://static.fdocuments.us/doc/165x107/5b2cb5eb7f8b9ac06e8b5a01/cartemotoneigesaglac2014-15-unlocked-by-sentier-lac-st-jeanpdf-66-trans-quebec.jpg)