The Effect of MP3 Compression on the Timbre Space of Sustained Musical Instrument Tones
10
PAPERS The Effect of MP3 Compression on the Timbre Space of Sustained Musical Instrument Tones CHUNG LEE ([email protected]) , ANDREW HORNER, AES Member ([email protected]) , AND BIN WU ([email protected]) Department of Computer Science and Engineering, Hong Kong Universityof Science and Technology, Clear Water Bay, Kowloon, Hong Kong Previous studies related to MP3 compression have investigated the discrimination of com- pressed instrument tones. However, these studies have not considered the effect of MP3 compression on the timbre space. In the current study, in a triadic listening test subjects were asked to rate the dissimilarity of all pairs of eight original instrument tones from various in- strument families. The same process was repeated on MP3-compressed tones using various bit rates (32, 64, and 128 Kbps). The results showed strong correlations between the dissimilarity scores of the original and compressed tones, indicating relatively subtle perceptual changes overall. The 2-D multidimensional scaling solutions for tones compressed with bit rates of 64 and 128 Kbps were very similar to the original but the coordinates changed more dramatically for a bit rate of 32 Kbps (especially in the saxophone), indicating a change in the underlying timbre space for low bit rates. 0 INTRODUCTION MP3 compression is one of the most popular percep- tual encoding methods for audio, especially in peer-to-peer networks. When an instrument tone is encoded using an MP3 codec, due to the lossy nature of MP3 compression, the tone is altered. The perceptual quality of lossy com- pression is a longstanding subject of digital audio research. The pioneering work of Zwicker uncovered a number of characteristics of the human auditory system, such as si- multaneous masking and temporal masking, which are part of the psychoacoustic model of MP3 encoders [1]. Van de Par and Kohlrausch proposed a number of methods for the evaluation of audio compression codecs [2]. Previous studies have subjectively evaluated the percep- tual quality loss in MP3 compression [3]–[6]. A recent study has also evaluated the discrimination of musical instrument tones after MP3 compression using various bit rates [7]. However, to our knowledge, no previous study has com- pared dissimilarity scores for instrument tone pairs after MP3 compression. Do instrument tones sound more or less similar after MP3 compression? For example, do a clarinet and oboe sound more or less similar as a result of MP3 compression or about the same? Does the corresponding timbre space distort or stay about the same? These are the questions we would like to address in the current study. 0.1 Previous Work Done on Discrimination of Spectrally Altered Tones This section reviews various studies that have inves- tigated discrimination of spectrally altered tones. Grey and Moorer investigated three stages of data reduction on 16 instrument tones: (1) piecewise-linear approximation of amplitude envelopes and frequency deviations; (2) at- tack simplifications; and (3) frequency deviations replaced by average constant values [8]. Discrimination between the original and piecewise-linear approximated tones was found to vary between 48 and 81%, depending on the instrument. Although the data reduction rates were not reported, in most cases, higher discrimination scores re- sulted from attack simplifications and constant frequency deviations. McAdams et al. investigated data-reduced tones where spectrotemporal parameters were simplified with different methods [9]. Brass, string, and woodwind tones were tested. Subjects were asked to discriminate the original instrument tones from those simplified in the listening test. These sim- plifications removed micro-variations in the tones. The re- sults showed that instrument tones altered by spectral en- velope smoothing (i.e., lowpass filtering) were easily dis- criminated, while tones altered by using a static spectral en- velope (i.e., removing spectral incoherence) were the most difficult to discriminate. Horner et al. investigated time-invariant spectral alter- ations of musical instrument tones [10]. Alteration was performed by multiplying each harmonic amplitude with a random scalar, which was time-invariant. Frequency- flattened instrument tones were altered using various ran- dom scalars. Results showed that discrimination scores varied from instrument to instrument. Moreover, alter- ations were less detectable in instrument tones with more spectral variations. One measure of spectral variation is J. Audio Eng. Soc., Vol. 61, No. 11, 2013 November 1
-
Upload
callmechung6138 -
Category
Documents
-
view
35 -
download
7
description
The Effect of MP3 Compression on the TimbreSpace of Sustained Musical Instrument Tones
Transcript of The Effect of MP3 Compression on the Timbre Space of Sustained Musical Instrument Tones

PAPERS
The Effect of MP3 Compression on the TimbreSpace of Sustained Musical Instrument Tones
CHUNG LEE([email protected])
, ANDREW HORNER, AES Member([email protected])
, AND BIN WU([email protected])
Department of Computer Science and Engineering, Hong Kong University of Science and Technology,Clear Water Bay, Kowloon, Hong Kong
Previous studies related to MP3 compression have investigated the discrimination of com-pressed instrument tones. However, these studies have not considered the effect of MP3compression on the timbre space. In the current study, in a triadic listening test subjects wereasked to rate the dissimilarity of all pairs of eight original instrument tones from various in-strument families. The same process was repeated on MP3-compressed tones using various bitrates (32, 64, and 128 Kbps). The results showed strong correlations between the dissimilarityscores of the original and compressed tones, indicating relatively subtle perceptual changesoverall. The 2-D multidimensional scaling solutions for tones compressed with bit rates of 64and 128 Kbps were very similar to the original but the coordinates changed more dramaticallyfor a bit rate of 32 Kbps (especially in the saxophone), indicating a change in the underlyingtimbre space for low bit rates.
0 INTRODUCTION
MP3 compression is one of the most popular percep-tual encoding methods for audio, especially in peer-to-peernetworks. When an instrument tone is encoded using anMP3 codec, due to the lossy nature of MP3 compression,the tone is altered. The perceptual quality of lossy com-pression is a longstanding subject of digital audio research.The pioneering work of Zwicker uncovered a number ofcharacteristics of the human auditory system, such as si-multaneous masking and temporal masking, which are partof the psychoacoustic model of MP3 encoders [1]. Van dePar and Kohlrausch proposed a number of methods for theevaluation of audio compression codecs [2].
Previous studies have subjectively evaluated the percep-tual quality loss in MP3 compression [3]–[6]. A recent studyhas also evaluated the discrimination of musical instrumenttones after MP3 compression using various bit rates [7].However, to our knowledge, no previous study has com-pared dissimilarity scores for instrument tone pairs afterMP3 compression. Do instrument tones sound more or lesssimilar after MP3 compression? For example, do a clarinetand oboe sound more or less similar as a result of MP3compression or about the same? Does the correspondingtimbre space distort or stay about the same? These are thequestions we would like to address in the current study.
0.1 Previous Work Done on Discrimination ofSpectrally Altered Tones
This section reviews various studies that have inves-tigated discrimination of spectrally altered tones. Grey
and Moorer investigated three stages of data reduction on16 instrument tones: (1) piecewise-linear approximationof amplitude envelopes and frequency deviations; (2) at-tack simplifications; and (3) frequency deviations replacedby average constant values [8]. Discrimination betweenthe original and piecewise-linear approximated tones wasfound to vary between 48 and 81%, depending on theinstrument. Although the data reduction rates were notreported, in most cases, higher discrimination scores re-sulted from attack simplifications and constant frequencydeviations.
McAdams et al. investigated data-reduced tones wherespectrotemporal parameters were simplified with differentmethods [9]. Brass, string, and woodwind tones were tested.Subjects were asked to discriminate the original instrumenttones from those simplified in the listening test. These sim-plifications removed micro-variations in the tones. The re-sults showed that instrument tones altered by spectral en-velope smoothing (i.e., lowpass filtering) were easily dis-criminated, while tones altered by using a static spectral en-velope (i.e., removing spectral incoherence) were the mostdifficult to discriminate.
Horner et al. investigated time-invariant spectral alter-ations of musical instrument tones [10]. Alteration wasperformed by multiplying each harmonic amplitude witha random scalar, which was time-invariant. Frequency-flattened instrument tones were altered using various ran-dom scalars. Results showed that discrimination scoresvaried from instrument to instrument. Moreover, alter-ations were less detectable in instrument tones with morespectral variations. One measure of spectral variation is
J. Audio Eng. Soc., Vol. 61, No. 11, 2013 November 1

LEE ET AL. PAPERS
spectral incoherence [11], which measures how much thetone spectral varies compared to a static version of thetone (i.e., the spectral variations have been removed). Inthis study spectral incoherence of the original tones wasshown to be negatively correlated with discrimination, in-dicating that spectral variations tended to hide spectral alter-ations. On the other hand, spectral irregularity, a measureof spectral jaggedness [12], showed no correlation withdiscrimination.
Recently, the authors investigated the discrimination ofMP3-compressed sustained musical instrument tones [7].Listening tests were used to evaluate the discrimination ofinstrument tones compressed with various bit rates (from32 to 160 Kbps). Results showed the average discriminationconverged to about 50% for all instruments (i.e., to near-random guessing) when the bit rate was 80 Kbps or more.The horn was judged the least discriminable after MP3compression. Strong correlation was found between dis-crimination and spectral irregularity, indicating that jaggedspectra (e.g., the pronounced odd harmonics of the clarinet)made it easier to detect changes made by MP3 compres-sion. MP3 subbands may explain the correlation of spectralirregularity and MP3 discrimination. Spectral irregularityreflects the “jaggedness” of the spectra, so a more jaggedspectrum will tend to have strong and weak harmonics inthe same frequency subband, which share the same scalingfactor [13]. Encoding strong and weak harmonics with thesame scaling factor induces substantial quantization jitterto the amplitude envelopes, thus making the compressedtones more discriminable. And, while spectral incoherencewas previously shown to be correlated with discriminationin randomly altered spectra [10], the MP3 discriminationscores were not correlated with spectral incoherence. To un-derstand why, recall that the bit allocation process in MP3depends much more on simultaneous masking than tempo-ral masking [13]. This is probably why spectral irregular-ity, which measures harmonic-to-harmonic spectral varia-tion, was strongly correlated with discrimination scores forMP3 compressed tones, while spectral incoherence, whichmeasures time-varying spectral variation, was not stronglycorrelated.
0.2 Previous Work Done on Perceptual Artifactsfrom Low Bit Rate (LBR) Audio Codecs
Other than perceptual evaluation of data-reduced in-strument tones, this section reviews various studies thathave investigated the perceptual artifacts generated by LBRaudio codecs. Liu et al. constructed models of the au-dible artifacts generated by temporal noise shaping andspectral band replication, which are far more difficultto model using existing encoding systems [14]. Marinscarried out a series of experiments aiming to identifythe salient dimensions of the perceptual artifacts gener-ated by low bit rate spatial audio codecs [15]. Erne pro-duced a CD-ROM that demonstrates some of the mostcommon coding artifacts in low bit rate codecs. Theyexplained and presented audio examples for each of
the coding artifacts separately using different degrees ofdistortion [16].
0.3 Previous Work Done on MultidimensionalScaling Analysis of Instrument Tones
Due to the multidimensional nature of timbre, multidi-mensional scaling (MDS) has long been recognized as aneffective tool in the investigation of timbral relationships[17]–[22]. The major advantage of MDS is that we don’thave to construct stimuli that conform to a particular hy-pothesis. Moreover, we don’t need to make assumptionsabout the number or psychophysical nature of the dimen-sions. The goal of MDS is to derive a spatial solution thatcan best represent the perceptual differences between in-strument tones.
In a pioneering study, Grey and Gordon evaluated thesalience of spectral centroid by constructing MDS mod-els for ten different instruments [17]. After that, withoutchanging any other acoustic attributes, they swapped thespectral envelopes of the instruments. A new MDS modelwas deduced using half of the altered tones. Compared withthe original MDS model, all the altered tones changed theirpositions along the dimension of spectral centroid. Thisindicated the salience of spectral centroid.
Iverson and Krumhansl examined the importance of at-tack in timbre perception [20]. Subjects listened to three setsof instrument tones in separate listening tests: (1) the orig-inal tones; (2) tones with the attack removed; and (3) toneswith the attack only. Subjects in each test were asked tojudge the dissimilarity of each pair of instrument tones. Theresulting two-dimensional MDS solutions shared a similarpattern for all three sets. By comparing the MDS solu-tions, they showed that although the attack is relativelyshort compared to the steady-state, the two portions areequally important in timbre perception.
Krimphoff et al. [23] suggested three acoustic parame-ters to represent spectral fluctuation, proposed as the thirdsalient dimension of timbre (along with spectral centroidand attack time) by Grey [18]. The suggested parameterswere: (1) “spectral flux,” defined as the root-mean-squaredvariation of spectral centroid relative to the mean spec-tral centroid; (2) the average correlation between spectrain neighboring spectral snapshots; and (3) the variation ofattack time across all harmonics. Only spectral flux corre-lated strongly with the third salient dimension of the timbrespace.
Recently, Beauchamp et al. used two different multi-dimensional scaling (MDS) experiments to address howmuch spectral detail is required for timbre recognition anddiscrimination [11]. The first examined the relative con-tributions of spectrotemporal variation by obtaining sepa-rate MDS solutions for resynthesized static and dynamicversions of Eb
4 tones from ten instruments. Static tonesmatched the average original spectra without spectral flux,whereas spectral flux was retained in the dynamic tones.Correlations of four spectrotemporal parameters (even/oddharmonic ratio, spectral irregularity, spectral centroid vari-ation, and spectral flux) with MDS coordinates were tested.
2 J. Audio Eng. Soc., Vol. 61, No. 11, 2013 November

PAPERS MP3 EFFECT ON TIMBRE OF SUSTAINED MUSICAL INSTRUMENT TONES
Even/odd harmonic ratio correlated best for 2-D MDS so-lutions for the static tones. For the dynamic tones, onlyspectral centroid variation yielded consistently high corre-lations.
Beauchamp’s second MDS experiment examined the de-gree to which recognition and discrimination were effectedby eliminating some harmonics while retaining spectral fluxof those remaining [11]. Performance was compared for sixA4 instrument tones, where the tones were made up of onlyfour to seven harmonics. Listeners rated the certainty ofwhether pairs of tones were derived from the same instru-ment. The corresponding simplified and original tones weregenerally rated as belonging to the same instrument, oftenwith minimal effect on perceptual distance. Tones that weredegraded by harmonic reduction had more spectral peaksthan could be represented by four harmonics and were con-fused with other instruments of the same type (e.g., doublereeds). Thus, the results suggested that timbre recognitionmay be preserved as long as the original resonances areconveyed. The importance of spectral flux for recognitionwas also confirmed.
These studies have affirmed the importance of spectraldetail in judging timbral similarity, especially even/oddharmonic ratio, spectral irregularity, spectral centroidvariation, spectral flux, and formants. Donnadieu givesmore details on how MDS has been used in timbrestudies [24].
0.4 Other Related WorkBlauert and Jekosch established a layer-based qual-
ity evaluation process depending on the amount of ab-straction involved [25]. The process employs differentsets of references, evaluation, and assessment methodsaccording to the amount of abstraction. Rumsey high-lighted the new research products and licensing oppor-tunities about low bit rate audio encoding, which pri-marily contributed to the revolution in digital musicdistribution [26].
0.5 Scope of the Current StudyIn the current paper triadic listening tests were conducted
to quantify the perceptual dissimilarity between the originalinstrument tones and three sets of tones compressed withdifferent bit rates (32, 64, and 128 Kbps). We constructedMDS models for the original and compressed tones foreach bit rate. The major objective of the current study wasto compare the MDS models for the original and com-pressed tones in order to study the effect of MP3 com-pression on the timbre space. Based on this comparison,we determined which levels of MP3 compression causedsubstantial changes to the timbre space.
Section 1 outlines the stimuli preparation for the originaland compressed tones. Section 2 describes the details of thelistening test. Section 3 describes the results of the test andcompares different MDS solutions. Finally, we discuss theimplications of these results.
1. STIMULUS PREPARATION
1.1 Prototype Instrument TonesEight sustained musical instrument tones were selected
as prototype signals for the listening test. These includedtones from a bassoon, clarinet, flute, horn, oboe, saxophone,trumpet, and violin performed at approximately 311.1 Hz(Eb
4). They represent the wind and the bowed string fami-lies. All eight instrument tones were also used by a numberof timbre studies [9]–[11][27]–[29], especially our previ-ous MP3 discrimination study [7]. Using these samplesmakes it easier to compare previous results with the currentstudies.
1.2 Preparation of Reference TonesFrequency variations, tone duration, and loudness are
potential factors in dissimilarity rating. To avoid this, theywere equalized in all reference tones. The reference toneswere standardized to a two-second duration by interpolat-ing the analysis data. Next, the duration-equalized referencetones were compared and amplitude multipliers were de-termined such that the tones had approximately the sameloudness [30]. Finally, each harmonic’s frequency was setto the exact product of its harmonic number and the fixedanalysis frequency, resulting in flat equally-spaced fre-quency envelopes. The frequency deviations were set tozero in order to restrict listener attention to the amplitudedata.
1.3 Analysis MethodInstrument tones were analyzed using a phase vocoder
algorithm. This phase vocoder is different from most inthat it allows a fixed analysis frequency to be tuned to anestimated fundamental frequency of the input signal. Theanalysis method yields frequency deviations between har-monics of the analysis frequency and the correspondingfrequencies of the input signal, which are assumed to beapproximately harmonic relative to the fundamental. Theharmonic frequency deviations are assumed to be within± 2% of the corresponding harmonics of the analysis fre-quency. Harmonic amplitudes were judged (by visual in-spection of spectra) to be near-zero beyond 35 harmonicsfor the bassoon, oboe, and trumpet tones, with the samplingrate 22,050 Hz. The other tones were sampled at 44,100 Hz(70 harmonics). More details on the analysis process aregiven in Beauchamp [31].
1.4 MP3 CompressionCompressed tones were prepared by encoding and de-
coding the reference tones using the LAME MP3 encoder[32]. Instrument tones were compressed with three differentbit rates (32, 64, and 128 Kbps). These three bit rates gavenear-perfect (for 32 Kbps), intermediate (for 64 Kbps), andnear-random discrimination (for 128 Kbps) in our previousstudy [7].
J. Audio Eng. Soc., Vol. 61, No. 11, 2013 November 3

LEE ET AL. PAPERS
2 EXPERIMENTAL METHOD
2.1 SubjectsTwenty-eight listeners participated in our experiment.
They were undergraduate students at the Hong Kong Uni-versity of Science and Technology, ranging in age from 17to 23 years, who reported no hearing problems. They had 7to 16 years experience playing a musical instrument, with amean of 10.8 years. The listeners were paid to compensatefor their time spent in the experiment.
2.2 Test ProcedureTriadic comparisons were used in the listening test. The
listeners heard three tones (A, B, and C) with the first tone(A) played a second time at the end of the trial (ABCA).Listeners were asked to judge which pair (AB, BC, or CA)was most dissimilar. All possible combinations of triadswere presented in a random order, where the ordering withineach triad was chosen at random. A separate test was alsorun where the subjects were asked which pair was mostsimilar. For each instrument pair, the overall dissimilarityscore is given by number of times that a pair was judged“most dissimilar” minus number of times it was judged“most similar” plus an offset of 7 to make the scores strictlypositive, yielding a possible range of 1 to 13.
Compared to the direct numerical rating to the tone pairsused by previous studies [18]–[20], this triadic paradigmof separately testing dissimilarity and similarity has theadvantage that much less memory is required of the listenersin making a judgment because each trial is independent (i.e.,subjects don’t have to remember their answers in previoustrails unlike the direct numerical rating method). Of course,the disadvantage is that the listening test is longer.
For a test set of eight instruments, a total of ( 83 ) = 56
triads were presented for the original tones as well as foreach of the three compressed tone sets (compressed usingbit rates of 32, 64, and 128 Kbps). This gives a grandtotal of 4 tone sets (1 original and 3 compressed) × 56combinations × 2 questions (similar and dissimilar) = 448triads. With 0.5s of silence between tones, the total test wasabout 80 minutes including 3 three-minute breaks every 20minutes. A custom program written in Java ran on an IntelPC to control the experiment.
Listeners were seated in a “quiet room” with about a40 dB SPL background noise level (mostly from computerfans and air conditioning). Headphones also provided ad-ditional reduction in the noise level. Sound signals wereconverted to analog by a SoundBlaster X-Fi Xtreme Au-dio soundcard and then presented through Sony MDR-7506headphones at a level of approximately 74 dB SPL as mea-sured with a sound-level meter. The X-Fi Xtreme AudioDAC utilizes 24 bits with a maximum sampling rate of96,000 Hz and a 108dB S/N ratio. The sounds were actu-ally stored in 16-bit integer format and played at 22,050 Hzor 44,100 Hz.
At the beginning of the experiment each listener readthe instructions and asked any necessary questions of theexperimenter. Five test trials were presented before the datatrials.
Table 1. Dissimilarity scores averaged over the twenty-eightsubjects, where Bs = bassoon, Cl = clarinet, Fl = flute, Hn =
horn, Ob = oboe, Sx = saxophone, Tp = trumpet, andVn = violin.
Original Tones:Cl 9.50Fl 6.31 8.00Hn 4.54 8.27 6.88Ob 6.00 5.15 7.92 7.12Sx 6.00 6.65 7.69 8.00 7.00Tp 6.69 8.46 7.12 7.04 5.23 6.15Vn 6.23 9.54 6.58 9.42 6.88 6.19 5.42
Bs Cl Fl Hn Ob Sx Tp
Tones Compressed with a Bit Rate of 32 Kbps:Cl 10.19Fl 4.58 6.54Hn 5.58 8.81 7.35Ob 6.85 5.54 7.38 6.42Sx 4.62 7.42 6.42 8.27 6.81Tp 7.00 8.69 7.04 8.27 5.50 6.15Vn 6.46 8.73 7.12 9.54 7.31 6.42 5.00
Bs Cl Fl Hn Ob Sx Tp
Tones Compressed with a Bit Rate of 64 Kbps:Cl 9.62Fl 5.65 7.46Hn 5.23 8.77 7.23Ob 6.00 5.42 8.23 6.23Sx 5.73 7.23 6.42 8.42 7.08Tp 6.77 8.42 7.50 7.81 4.62 6.38Vn 6.58 9.08 6.81 9.27 7.08 5.62 5.35
Bs Cl Fl Hn Ob Sx Tp
Tones Compressed with a Bit Rate of 128 Kbps:Cl 10.04Fl 6.50 7.23Hn 5.31 9.00 7.42Ob 5.88 4.54 7.73 6.62Sx 5.35 7.31 6.92 8.46 7.42Tp 7.31 8.31 7.54 7.19 4.69 6.46Vn 5.96 8.69 6.92 8.96 7.38 5.81 5.04
Bs Cl Fl Hn Ob Sx Tp
3 RESULTS
The major objective of our study is to investigate theeffect of MP3 compression on the timbre space of sustainedmusical instruments. This section compares the listeningtest results for the original and compressed tones, includingdissimilarity scores, the MDS solutions for the original andcompressed tones, and the amount of change in the spectralattributes.
3.1 Dissimilarity ScoresAverage dissimilarity scores for the original and com-
pressed tones are shown in Table 1. Note that the bassoonand clarinet were rated the most dissimilar in three of thefour tone sets. The bassoon and horn were the most sim-ilar of the original tones and among the most similar ofall the compressed tones. It is interesting that the bassoonappeared in pairs judged both most similar and dissimilar,potentially reflecting its dual nature to blend and stand outdepending on the context.
4 J. Audio Eng. Soc., Vol. 61, No. 11, 2013 November
PAPERS MP3 EFFECT ON TIMBRE OF SUSTAINED MUSICAL INSTRUMENT TONES
Table 2. Correlations (parametric and non-parametric) betweenthe compressed and original (uncompressed) dissimilarity
scores.
Pearson(parametric)
Spearman(non-parametric)
Bit Rate Correlation p-value Correlation p-value
128 Kbps 0.924 <0.0001 0.920 <0.000164 Kbps 0.937 <0.0001 0.909 <0.000132 Kbps 0.841 <0.0001 0.809 <0.0001
The visual similarities between the tone sets in Table 1were confirmed by correlation analysis. Strong correlations,both parametric (Pearson correlation) and non-parametric(Spearman correlation), were found between the dissimi-larity scores of the original and compressed tones. Table 2shows the correlations and significance values.
3.2 Multidimensional Scaling of the DataAlthough the correlations in Table 2 are strong for all
three bit rates, the correlations for 32 Kbps are less thanfor 64 and 128 Kbps. To investigate this observation 2-Dmultidimensional scaling solutions were derived from thedissimilarity data.
The Matlab MDS function (mdscale) was used to processthe dissimilarity data. Non-metric MDS solutions were pro-jected on the two and three dimensions which minimizedthe stress.
For all solutions, the coordinates were correlated withspectral centroid (SC) and attack time (AT) (defined as thetime from the onset up to the maximum root-mean-squaredamplitude of the original tone). Spectral irregularity (SIR)and spectral incoherence (SIN), spectral attributes that mea-sure spectral variation [33], were also correlated. Formulasfor SC, SIR, and SIN are given in Beauchamp and Lakatos[33], Beauchamp [31], and Horner et al. [10].
Spectral centroid and attack time were the two mostsalient attributes in the timbre space [17][18][23]. Spec-tral irregularity correlated strongly with the discriminationscores of MP3 compressed tones [7], while spectral inco-herence correlated strongly with the discrimination scoresof random spectral alteration [10]. Spectral irregularity andspectral incoherence are two of the most common attributesfor measuring spectral variations.
The MDS solutions form a geometric configuration thatrepresents dissimilarities between the timbres of the tones.For this reason, the axes have no units. The axes have beennormalized to the range [–1,1] and rotated so that spec-
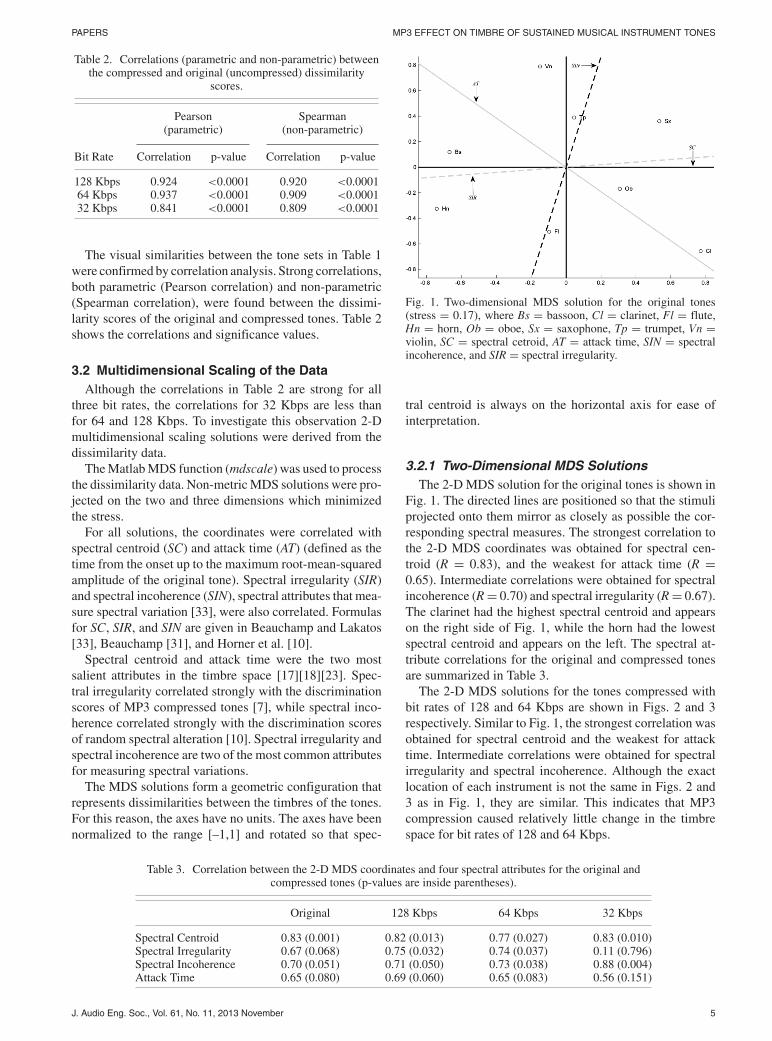
Fig. 1. Two-dimensional MDS solution for the original tones(stress = 0.17), where Bs = bassoon, Cl = clarinet, Fl = flute,Hn = horn, Ob = oboe, Sx = saxophone, Tp = trumpet, Vn =violin, SC = spectral cetroid, AT = attack time, SIN = spectralincoherence, and SIR = spectral irregularity.
tral centroid is always on the horizontal axis for ease ofinterpretation.
3.2.1 Two-Dimensional MDS SolutionsThe 2-D MDS solution for the original tones is shown in
Fig. 1. The directed lines are positioned so that the stimuliprojected onto them mirror as closely as possible the cor-responding spectral measures. The strongest correlation tothe 2-D MDS coordinates was obtained for spectral cen-troid (R = 0.83), and the weakest for attack time (R =0.65). Intermediate correlations were obtained for spectralincoherence (R = 0.70) and spectral irregularity (R = 0.67).The clarinet had the highest spectral centroid and appearson the right side of Fig. 1, while the horn had the lowestspectral centroid and appears on the left. The spectral at-tribute correlations for the original and compressed tonesare summarized in Table 3.
The 2-D MDS solutions for the tones compressed withbit rates of 128 and 64 Kbps are shown in Figs. 2 and 3respectively. Similar to Fig. 1, the strongest correlation wasobtained for spectral centroid and the weakest for attacktime. Intermediate correlations were obtained for spectralirregularity and spectral incoherence. Although the exactlocation of each instrument is not the same in Figs. 2 and3 as in Fig. 1, they are similar. This indicates that MP3compression caused relatively little change in the timbrespace for bit rates of 128 and 64 Kbps.
Table 3. Correlation between the 2-D MDS coordinates and four spectral attributes for the original andcompressed tones (p-values are inside parentheses).
Original 128 Kbps 64 Kbps 32 Kbps
Spectral Centroid 0.83 (0.001) 0.82 (0.013) 0.77 (0.027) 0.83 (0.010)Spectral Irregularity 0.67 (0.068) 0.75 (0.032) 0.74 (0.037) 0.11 (0.796)Spectral Incoherence 0.70 (0.051) 0.71 (0.050) 0.73 (0.038) 0.88 (0.004)Attack Time 0.65 (0.080) 0.69 (0.060) 0.65 (0.083) 0.56 (0.151)
J. Audio Eng. Soc., Vol. 61, No. 11, 2013 November 5

LEE ET AL. PAPERS
Table 4. Absolute change for three spectral attributes averaged over all eight instruments. The last row andcolumn of the table show the average for each spectral attribute and bit rate, respectively.
Spectral Spectral Spectral AverageCentroid (SC) Incoherence (SIN) Irregularity (SIR) (Bit Rate)
128 Kbps 0.03 0.01 <0.01 0.0164 Kbps 0.04 0.04 0.01 0.0332 Kbps 0.06 0.27 0.04 0.12Average 0.04 0.11 0.02 0.06
Fig. 2. Two-dimensional MDS solution for the tones compressedwith a bit rate of 128 Kbps (stress = 0.17).
Fig. 3. Two-dimensional MDS solution for the tones compressedwith a bit rate of 64 Kbps (stress = 0.16).
The 2-D MDS solution for tones compressed with a bitrate of 32 Kbps is shown in Fig. 4. Unlike the solutionfor the original tones in Fig. 1, the strongest correlationwas for spectral incoherence instead of spectral centroid.Moreover, the correlations for attack time and spectral ir-regularity were not significant. Comparing Figs. 1 and 4, thelocation of some of the instruments changed dramatically.In particular, the saxophone shifted from the right side ofFig. 1 to the left of Fig. 4. The shift of the saxophone ismainly due to a change in spectral centroid, indicating thebrightness is much less after MP3 compression. Overall,
Fig. 4. Two-dimensional MDS solution for the tones compressedwith a bit rate of 32 Kbps (stress = 0.13).
this indicates that MP3 compression with a bit rate of 32Kbps caused a substantial change in the timbre space.
3.2.2 Change in Spectral AttributesComparing the original MDS solution (in Fig. 1) and
the three compressed MDS solutions (in Figs. 2, 3, and4), it is clear that Figs. 2 and 3 are similar to the originalwhile Fig. 4 is somewhat different. One possible factormay be the relative change in spectral attributes caused byMP3 compression. Table 4 shows the absolute percentagechange of three spectral attributes averaged over all eightinstruments. The three spectral attributes (SC, SIN, and SIR)were chosen because they had the strongest correlations inTable 3. The average change for tones compressed withbit rates of 128 and 64 Kbps (as shown in last column ofTable 4) are substantially less than the average change for32 Kbps.
Comparing the average change for each spectral attribute(in the last row of Table 4), spectral incoherence is substan-tially larger than the others. Table 5 shows the averagechange in spectral incoherence for each individual instru-ment. MP3 compression increases spectral incoherence inall tones. The average for 32 Kbps is substantially largerthan the others. Recall that spectral incoherence measureshow much a spectrum differs from a coherent version ofitself, and that larger incoherence values indicate a moredynamic spectrum (a perfectly static spectrum has an in-coherence of zero). The increase in spectral incoherence isprobably due to quantization jitter induced in the amplitude
6 J. Audio Eng. Soc., Vol. 61, No. 11, 2013 November

PAPERS MP3 EFFECT ON TIMBRE OF SUSTAINED MUSICAL INSTRUMENT TONES
Table 5. Absolute change for spectral incoherence for each ofthe individual instrument. The last row shows the average over
the eight instruments.
32 Kbps 64 Kbps 128 Kbps
Bs 0.497 0.038 0.002Cl 0.443 0.143 0.019Fl 0.222 0.019 0.015Hn 0.142 0.009 0.001Ob 0.515 0.052 <0.001Sx 0.139 0.027 0.019Tp 0.143 0.010 0.001Vn 0.087 0.026 0.003Average 0.274 0.041 0.008
envelopes by the MP3 compression [7]. We will discussthis point more in the next section.
3.2.3 Three-Dimensional MDS SolutionThe stress of the four 2-D MDS solutions are relatively
high (0.13 or above) indicating that the 2-D models may notprecisely reflect the dissimilarity scores of the instrumentpairs. A third dimension in the MDS solution may helpbetter represent the dissimilarities among the tones.
Table 6 shows the spectral attribute correlations for theoriginal and compressed tones. Strong correlations to the 3-D MDS coordinates were consistently obtained for spectralcentroid on the original and all compressed tones (R >
0.83). Similarly, strong correlations were also observed forspectral incoherence (R > 0.77). Attack time and spectralirregularity correlated significantly only for some bit rates.We will discuss spectral attributes correlation in more detailin the next section.
The 3-D MDS solutions for the original tones and tonescompressed with bit rates of 128, 64, and 32 Kbps areshown in Figs. 5, 6, 7, and 8 respectively. We can find simi-larities between the four 3-D MDS solutions. For example,the clarinet always appears on the extreme of spectral cen-troid (SC), indicating its brightness. The bassoon and hornalways appear on the opposite extreme of spectral centroid(SC). The stress of the 3-D solutions (<0.07) are muchlower than the 2-D solutions (>0.13). However, the 3-Dsolutions don’t have any obvious patterns unlike the 2-Dsolutions, making them difficult to meaningfully interpret.
4 DISCUSSION
The results in the previous section show the effects ofMP3 compression on the timbre space of eight representa-tive sustained musical instruments. The 2-D MDS solutions
Fig. 5. Three-dimensional MDS solution for the original tones(stress = 0.07).
Fig. 6. Three-dimensional MDS solution for the tones compressedwith a bit rate of 128 Kbps (stress = 0.04).
indicate that MP3 compression with a bit rate of 128 Kbpscaused almost no change in the timbre space (as shownin Figs. 1 and 2). This agrees with the results of our dis-crimination study in 2010, which showed that instrumenttones MP3-compressed with a bit rate of 128 Kbps werenearly indistinguishable from the original tones. This is alsoconsistent with the relatively small change in the spectralattributes (as shown in Table 4) when using a bit rate of 128Kbps.
For MP3 compression with a bit rate of 64 Kbps, the2-D solutions also indicate that the timbre space was notchanged very much. Our previous discrimination study [7]found that tones compressed with a bit rate of 64 Kbps were
Table 6. Correlation between the 3-D MDS coordinates and four spectral attributes for the original andcompressed tones (p-values are inside parentheses).
Original 128 Kbps 64 Kbps 32 Kbps
Spectral Centroid 0.83 (0.011) 0.83 (0.011) 0.91 (0.001) 0.85 (0.007)Spectral Irregularity 0.82 (0.013) 0.42 (0.304) 0.64 (0.087) 0.47 (0.243)Spectral Incoherence 0.77 (0.025) 0.87 (0.005) 0.82 (0.014) 0.87 (0.005)Attack Time 0.81 (0.014) 0.53 (0.176) 0.71 (0.049) 0.67 (0.069)
J. Audio Eng. Soc., Vol. 61, No. 11, 2013 November 7

LEE ET AL. PAPERS
Fig. 7. Three-dimensional MDS solution for the tones compressedwith a bit rate of 64 Kbps (stress = 0.04).
Fig. 8. Three-dimensional MDS solution for the tones compressedwith a bit rate of 32 Kbps (stress = 0.05).
only barely distinguishable (they had an average discrimi-nation score of 63%). Here, the relatively small percentagechange in spectral attributes (as shown in Table 4) accordswith the minor changes in the timbre space.
For MP3 compression with a bit rate of 32 Kbps, the 2-Dsolutions indicate that the timbre space was more substan-tially altered. This agrees with our previous discriminationstudy that suggested that tones compressed with a bit rateof 32 Kbps were nearly perfectly discriminated for mostinstruments (except the horn). The relatively large changein spectral attributes, particularly in spectral incoherence, islikely a factor in the substantial change in the timbre space.
The increase in spectral incoherence for 32 Kbps com-pression was caused by quantization jitter induced in theamplitude envelopes by MP3 compression. More jittermakes the spectrum more dynamic, thus increasing spectralincoherence. In our previous study [7] we found that jittercan be used to predict discrimination scores in MP3 com-pressed tones. The degree of jitter is a potential indicator ofthe degree of change in the timbre space.
Other than comparing the MDS solutions for tones com-pressed with various bit rates and the original, significantcorrelation (p < 0.05) between the MDS coordinates and
spectral centroid can be found consistently in all 2-D and3-D MDS solutions. This confirms the salience of spectralcentroid as many other previous timbre studies have found[8][17][18].
This study has investigated the impact to the timbre spacecaused by MP3 compression, which to our knowledge, hasnot been explored in the literature. We believe that, in addi-tion to subjective quality evaluation [3]–[6][34], dissimilar-ity studies for musical instrument tones can help provide anadditional metric of audio codec evaluation. Other than sub-jectively evaluating the quality loss of compressed tones,this study gives another prospective in evaluating the effectof lossy audio compression on the timbre space.
The current study also helps provide the basis for content-based refinements of audio codecs in the future. As a sim-ple example, if we know that the saxophone is particularlychanged in timbre by compression at 32 Kbps, if we havea jazz or popular piece with a prominent saxophone leadthroughout, we may decide to use a higher bit rate to en-code it to allow the saxophone to maintain its brightnessand prominence. Or, future research may indicate how thesaxophone could be compressed at 32 Kbps without sub-stantially changing its timbre.
5 ACKNOWLEDGMENTS
This work was supported by the Hong Kong ResearchGrants Council grants 613111 and 613112.
6 REFERENCES[1] T. Zwicker, “Psychoacoustics as the Basis for Mod-
ern Audio Signal Data Compression,” J. Acoust. Soc. Am.,vol. 107, pp. 2875 (2000 May).
[2] S. van de Par and A. Kohlrausch, “Three Approachesto the Perceptual Evaluation of Audio Compression Meth-ods,” J. Acoust. Soc. Am., vol. 107, pp. 2875 (2000 May).
[3] “EBU Subjective Listening Tests on Low-Bitrate Au-dio Codecs,”Tech. Rep., European Broadcast Union (2003).
[4] H. Fuchs, W. Hoeg, and D. Meares, “ISO/MPEGSubjective Tests on Multichannel Audio Systems: Designand Methodology,” Proc. Broadcasting Convention (IBC,1994).
[5] D. G. Kirby, F. Feige, and U. Wustenhagen,“ISO/MPEG Subjective Tests on Multichannel Audio Cod-ing Systems: Practical Realisation and Test Results,” Proc.Broadcasting Convention (IBC, 1994).
[6] W. H. Schmidt and E. Steffen, “ISO/MPEG Subjec-tive Tests on Multichannel Audio Coding Systems: Sta-tistical Analysis,” IEE Conf. Publ. (CP397) (1994), pp.158–163.
[7] C. Lee and A. B. Horner, “Discrimination of MP3-Compressed Musical Instrument Tones,” J. Audio Eng.Soc., vol. 58, pp. 487–497 (2010 Jun.).
[8] J. Grey and J. Moorer, “Perceptual Evaluation ofSynthesized Musical Instrument Tones,” J. Acoust. Soc.Am., vol. 62, no. 2, pp. 454–462 (1977).
[9] S. McAdams, J. W. Beauchamp, and S.Meneguzzi, “Discrimination of Musical Instrument Sounds
8 J. Audio Eng. Soc., Vol. 61, No. 11, 2013 November

PAPERS MP3 EFFECT ON TIMBRE OF SUSTAINED MUSICAL INSTRUMENT TONES
Resynthesized with Simplified Spectrotemporal Parame-ters,” J. Acoust. Soc. Am., vol. 105, no. 2, pp. 882–897(1999).
[10] A. B. Horner, J. W. Beauchamp, and R. H. Y. So,“Detection of Random Alterations to Time-Varying Musi-cal Instrument Spectra,” J. Acoust. Soc. Am., vol. 116, no.3, pp. 1800–1810 (2004).
[11] J. W. Beauchamp, A. B. Horner, H. Koehn, and M.Bay, “Multidimensional Scaling Analysis of Centroid- andAttack/Decay-Normalized Musical Instrument Sounds,” J.Acoust. Soc. Am., vol. 120, pp. 3276 (2006).
[12] R. A. Kendall and E. C. Carterette, “DifferenceThresholds for Timbre Related to Spectral Centroid,” Proc.of 4th International Conf. of Music, Perception and Cog-nition, Montreal , Faculty of Music, McGill University,91–95, pp. 1996 (1996).
[13] M. Bosi and R. Goldberg, Introduction to DigitalAudio Coding and Standards (Kluwer Academic Publish-ers, 2003).
[14] C. M. Liu, H. W. Hsu, S. H. Tang, K. C. Lee, Y. C.Yang, C. M. Chang, and W. C. Lee, “Compression Arti-facts in Perceptual Audio Coding,” presented at the 121stConvention of the Audio Engineering Society (2006 Oct.),convention paper 6872.
[15] P. Marins, “Characterizing the Perceptual EffectsIntroduced by Low Bit Rate Spatial Audio Codecs,” pre-sented at the 131st Convention of the Audio EngineeringSociety (2011 Oct.), convention paper 8531.
[16] M. Erne, “Perceptual Audio Coders: What to Lis-ten For,” presented at the 111th Convention of the AudioEngineering Society (2001 Nov.), convention paper 5489.
[17] J. M. Grey and J. W. Gordon, “Perceptual Effectsof Spectral Modification on Musical Timbres,” J. Acoust.Soc. Am., vol. 63, pp. 1493–1500 (1978).
[18] J. M. Grey, “Multidimensional Perceptual Scalingof Musical Timbres,” J. Acoust. Soc. Am., vol. 61, pp. 1270–1277 (1977).
[19] S. McAdams, S. Winsberg, S. Donnadieu, G. DeSoete, and J. Krimphoff, “Perceptual Scaling of Synthe-sized Musical Timbres : Common Dimensions, Specifici-ties, and Latent Subject Classes,” Psychological Research,vol. 58, pp. 177–192 (1995).
[20] P. Iverson and C. L. Krumhansl, “Isolating the Dy-namic Attributes of Musical Timbre,” J. Acoust. Soc. Am.,vol. 94, no. 5, pp. 2595–2603 (1993).
[21] D. L. Wessel, “Timbre Space as a Musical ControlStructure,” Computer Music J., vol. 3, pp. 45–52 (1979).
[22] S. Lakatos, “A Common Perceptual Space forHarmonic and Percussive Timbres,” Perception and Psy-chophysics, vol. 62, pp. 1426–1439 (2000).
[23] J. Krimphoff, S. Mcadams, and S. Winsberg,“Caracterisation du Timbre des sons Complexes. II. Anal-yses Acoustiques et Quantification Psycho-physique,” J.Phys. IV France, vol. 4, pp. 625–628 (1994).
[24] S. Donnadieu, “Mental Representation of the Tim-bre of Complex Sounds,” in Analysis, Synthesis, and Per-ception of Musical Sounds: The Sound of Music, James W.Beauchamp, Ed. (University of Illinois at Urbana, USA:Springer, 2007), pp. 272–319.
[25] J. Blauert, U. Jekosch, “A Layer Model of SoundQuality,” J. Audio Eng. Soc., vol. 60, pp. 4–12 (2012Jan./Feb.).
[26] F. Rumsey, “Audio Bit Rates,” J. Audio Eng. Soc.,vol. 60, pp. 729–733 (2012 Sep.).
[27] A. B. Horner, J. W. Beauchamp, and R. H. Y. So,“Detection of Time-Varying Harmonic Amplitude Alter-ations due to Spectral Interpolations between Musical In-strument Tones,” J. Acoust. Soc. Am., vol. 125, pp. 492–502(2009).
[28] A. B. Horner, J. W. Beauchamp, and R. H. Y. So,“Evaluation of Mel-Band and MFCC-Based Error Metricsto Predict Discrimination of Spectrally Altered MusicalInstrument Sounds,” J. Audio Eng. Soc., vol. 59, pp. 290–303 (2011 May).
[29] C. Lee, A. B. Horner, J. W. Beauchamp, “Discrim-ination of Musical Instrument Tones Resynthesized withPiecewise-Linear Approximated Harmonic Amplitude En-velopes,” J. Audio Eng. Soc., vol. 60, pp. 899–912 (2012Nov.).
[30] B. C. J. Moore, B. R. Glasberg, and T. Baer, “AModel for the Prediction of Thresholds, Loudness, and Par-tial Loudness,” J. Audio Eng. Soc., vol. 45, pp. 224–240(1997 Apr.).
[31] J. W. Beauchamp, “Analysis and Synthesis of Mu-sical Instrument Sounds,” in Analysis, Synthesis, and Per-ception of Musical Sounds, J. Beauchamp, ed. (Springer,New York , 2007), pp. 1–89.
[32] LAME Homepage. http://lame.sourceforge.net/.[33] J. W. Beauchamp and S. Lakatos, “New Spec-
troTemporal Measures of Musical Instrument Sounds Usedfor a Study of Timbral Similarity of Rise-Time- andCentroid-Normalized Musical Sounds,” Proc. 7th Int. Conf.on Music Perception & Cognition, Univ. of New SouthWales, Sydney, Australia , pp. 592–595 (2002).
[34] T. Thiede, W. C. Treurniet, R. Bitto, C. Schmid-mer, T. Sporer, J. G. Beerends, C. Colomes, M. Keyhl,G. Stoll, K. Brandenburg, and B. Feiten, “PEAQ—TheITU Standard for Objective Measurement of PerceivedAudio Quality,” J. Audio Eng. Soc., vol. 48, pp. 3–29(2000 Jan./Feb.).
J. Audio Eng. Soc., Vol. 61, No. 11, 2013 November 9

LEE ET AL. PAPERS
THE AUTHORS
Chung Lee Andrew Horner Bin Wu
Chung Lee got his Ph.D. degree in computer scienceat the Hong Kong University of Science and Technologyin 2011. His main research interests are timbre discrim-ination, non-linear spectral alteration, and audio-aid fordisabled people. He is now a post-doctoral fellow in Sin-gapore University of Technology and Design under thesupervision of Prof. Simon Lui.
�
Andrew Horner is a professor in the Department of Com-puter Science at the Hong Kong University of Science andTechnology. His research interests include music analysis
and synthesis, timbre of musical instruments, and spectraldiscrimination. He received his Ph.D. in computer sciencefrom the University of Illinois at Urbana-Champaign.
�
Bin Wu is currently a Ph.D. student in Department ofComputer Science and Engineering, Hong Kong Univer-sity of Science and Technology. He obtained his B.E.of information security and engineering from Shang-hai Jiao Tong University at 2011. His research in-terests include musical timbres and music informationretrieval.
10 J. Audio Eng. Soc., Vol. 61, No. 11, 2013 November