The Effect of Incarceration on Residential Mobility ... · The Effect of Incarceration on...
21
The Effect of Incarceration on Residential Mobility between Poor and Nonpoor Neighborhoods Cody Warner* Montana State University This study examines the impact of incarceration on residential mobility between poor and nonpoor neighborhoods. Formerly incarcerated individuals move at high rates, but little is known about if or how incarceration impacts movement between neighborhoods of varying quality. I ground my approach in traditional accounts of locational attainment that emphasize pathways and barriers between poor and nonpoor neighborhoods. Results show that incarceration leads to downward neigh- borhood mobility from nonpoor into poor neighborhoods. Incarceration does not appear to trap formerly incarcerated individuals in poor neighborhoods. Additional analyses show that the effect of incarceration is initially strongest among formerly in- carcerated whites, but that there is significant racial variation in neighborhood mo- bility across time. My results provide evidence that incarceration should be placed alongside human capital characteristics and structural barriers as an important pre- dictor of mobility between poor and nonpoor neighborhoods. The 1970s saw the beginning of two prominent American social trends. First, areas of con- centrated poverty started to grow and take on an increasingly distinct character (Wilson 1987). Currently, about 9 million Americans live in poor neighborhoods, and these neigh- borhoods contain disproportionate numbers of minority citizens (Ludwig et al. 2012). Second, starting in the late 1970s, the U.S. incarceration rate started to grow by about 6 percent per year, more than quadrupling in size (Wakefield and Uggen 2010). Cur- rently, prisons hold over 1.5 million convicted offenders, and yearly cohorts of released prisoners exceed 600,000 (Carson 2014). Much like concentrated poverty, incarceration has become especially common in the lives of African American families and communi- ties (Western and Wildeman 2009). The incredible growth of America’s felon class has spurred extensive research on the diverse ways that incarceration both reflects and cre- ates social inequalities (Wakefield and Uggen 2010). These two literatures—one on the growth of poor neighborhoods, and the other on the social consequences of incarceration—have only rarely intersected (Hipp et al. 2010b; Massoglia et al. 2013). This is unfortunate because formerly incarcerated citizens are highly mobile (Warner 2015), while also operating within a restricted housing market. ∗ Correspondence should be addressed to Cody Warner, Assistant Professor of Sociology, Department of Soci- ology and Anthropology, Montana State University, P.O. Box 172380, 2–128 Wilson Hall, Bozeman, MT 59717; [email protected]. This research was conducted through the cooperation of the Bureau of Labor Statistics (BLS) with restricted access to BLS data. The views expressed here do not necessarily reflect the views of the BLS. City & Community 15:4 December 2016 doi: 10.1111/cico.12207 C 2016 American Sociological Association, 1430 K Street NW, Washington, DC 20005 423
Transcript of The Effect of Incarceration on Residential Mobility ... · The Effect of Incarceration on...

The Effect of Incarceration on Residential Mobilitybetween Poor and Nonpoor NeighborhoodsCody Warner*Montana State University
This study examines the impact of incarceration on residential mobility betweenpoor and nonpoor neighborhoods. Formerly incarcerated individuals move at highrates, but little is known about if or how incarceration impacts movement betweenneighborhoods of varying quality. I ground my approach in traditional accountsof locational attainment that emphasize pathways and barriers between poor andnonpoor neighborhoods. Results show that incarceration leads to downward neigh-borhood mobility from nonpoor into poor neighborhoods. Incarceration does notappear to trap formerly incarcerated individuals in poor neighborhoods. Additionalanalyses show that the effect of incarceration is initially strongest among formerly in-carcerated whites, but that there is significant racial variation in neighborhood mo-bility across time. My results provide evidence that incarceration should be placedalongside human capital characteristics and structural barriers as an important pre-dictor of mobility between poor and nonpoor neighborhoods.
The 1970s saw the beginning of two prominent American social trends. First, areas of con-centrated poverty started to grow and take on an increasingly distinct character (Wilson1987). Currently, about 9 million Americans live in poor neighborhoods, and these neigh-borhoods contain disproportionate numbers of minority citizens (Ludwig et al. 2012).Second, starting in the late 1970s, the U.S. incarceration rate started to grow by about6 percent per year, more than quadrupling in size (Wakefield and Uggen 2010). Cur-rently, prisons hold over 1.5 million convicted offenders, and yearly cohorts of releasedprisoners exceed 600,000 (Carson 2014). Much like concentrated poverty, incarcerationhas become especially common in the lives of African American families and communi-ties (Western and Wildeman 2009). The incredible growth of America’s felon class hasspurred extensive research on the diverse ways that incarceration both reflects and cre-ates social inequalities (Wakefield and Uggen 2010).
These two literatures—one on the growth of poor neighborhoods, and the other onthe social consequences of incarceration—have only rarely intersected (Hipp et al. 2010b;Massoglia et al. 2013). This is unfortunate because formerly incarcerated citizens arehighly mobile (Warner 2015), while also operating within a restricted housing market.
∗Correspondence should be addressed to Cody Warner, Assistant Professor of Sociology, Department of Soci-ology and Anthropology, Montana State University, P.O. Box 172380, 2–128 Wilson Hall, Bozeman, MT 59717;[email protected] research was conducted through the cooperation of the Bureau of Labor Statistics (BLS) with restrictedaccess to BLS data. The views expressed here do not necessarily reflect the views of the BLS.
City & Community 15:4 December 2016doi: 10.1111/cico.12207C© 2016 American Sociological Association, 1430 K Street NW, Washington, DC 20005
423

CITY & COMMUNITY
This may make it difficult for them to avoid poor neighborhoods. The current study uti-lizes nationally representative longitudinal data to examine the impact of incarcerationon residential mobility into and out of poor neighborhoods. I first discuss theoretical ex-planations of mobility pathways between neighborhoods of varying quality. I then discusshow incarceration may impact this process via housing market barriers faced by releasedprisoners. I call special attention here to the potential dual-stigma encountered by for-merly incarcerated minority citizens. After discussing the data and analytic strategy, Ipresent results for both downward neighborhood mobility into poor neighborhoods and up-ward neighborhood mobility out of poor neighborhoods. I close by noting the implications ofthese findings for research on both concentrated poverty and the collateral consequencesof incarceration.
CONCENTRATED POVERTY AND LOCATIONAL ATTAINMENT
Residential inequality in America has been explained in three ways. The first, stemmingfrom Wilson’s The Truly Disadvantaged, maintains that class-selective outmigration tookmiddle-class blacks with the financial means out of innercity areas and into the sub-urbs. This left behind neighborhoods composed largely of poor minority families (Wilson1987). Quillian (1999) showed that migration of the nonpoor away from the poor playeda key role in the creation of poor neighborhoods in the 1970s and 1980s. Additionally,more recent racial convergence in upward mobility aligns with Wilson’s arguments re-garding race, class, and neighborhood mobility (see Crowder and South 2005: 1757).
A second explanation of concentrated poverty highlights the downward economic mo-bility of people living in poor neighborhoods (Hughes 1990; Jargowsky and Bane 1991).This explanation has received some support (see Quillian 1999), and in particular wasextended by the work of Massey and others with an emphasis on racial residential segre-gation (Gramlich et al. 1992; Massey et al. 1994; South and Crowder 1997). Simply put,and because of high levels of racial residential segregation in the U.S., increases in blackpoverty drive increases in concentrated poverty (Massey et al. 1994). A combination ofblack exclusion from white neighborhoods and white avoidance of black neighborhoodsisolates blacks both economically and socially (Massey and Denton 1993). Minority fam-ilies that left poor areas in the 1990s tended to deconcentrate primarily to other lower-income minority neighborhoods (Dwyer 2012). To date, blacks remain less likely thancomparable whites to leave poor areas, and more likely to leave nonpoor areas (Briggsand Keys 2009; Gramlich et al. 1992; South and Crowder 1997; South et al. 2011).
Finally, it is important to note that racial variation in neighborhood preferences andperceptions can shape residential inequality. When considering a move, whites mostlyconsider white communities, and rarely expand searches into communities that are morediverse (Bader and Krysan 2015). In fact, compared to comparable minority households,white households tend to be less aware of the existence of integrated neighborhoods intheir communities (Krysan and Bader 2009). When presented with hypothetical options,whites generally rate all-white communities as more desirable than diverse communities(Krysan et al. 2009). Neighborhood racial composition least affects the residential pref-erences and perceptions of African Americans.
Behind these larger patterns of concentrated poverty are individual and householdpatterns of residential mobility between neighborhoods of varying quality (South et al.
424

INCARCERATION AND RESIDENTIAL MOBILITY DESTINATIONS
2005). Although both stayers and movers contribute to residential inequality, residentialmobility is key to social mobility (Rossi 1980; Sampson and Sharkey 2008), and exposureto poverty is often the result of repeated moves into poor neighborhoods (as opposedto fewer prolonged spells) (Briggs and Keys 2009). The process of locational attainmentunfolds as individuals and households try to match their human capital and financialresources to that of their neighborhoods. A long line of research on residential mobilityhas shown that mobility decisions are shaped by life events and life-course transitions thatchange housing needs (Clark and Withers 2008; Coulter and van Ham 2013; Landaleand Guest 1985; Rossi 1980; Speare et al. 1975). Individuals and households that becomedissatisfied with their current dwelling, and who have found a suitable alternative, aremore likely to move (Speare 1974).
Researchers draw on two perspectives to explain variation in the landing spots of mo-bile households. First, the spatial assimilation model maintains that individuals use theirhuman capital resources to “purchase” residence in desirable neighborhoods (Massey1985; South and Crowder 1997). Existing research provides general support for this per-spective, as human capital and socioeconomic (SES) characteristics predict residence inbetter neighborhoods for all racial and ethnic groups (Alba and Logan 1993; South andCrowder 1997). However, access to the most desirable neighborhoods is not uniformlyavailable. African American households at all income levels live in less desirable neighbor-hoods than do comparable whites, and they tend to receive smaller returns than whitesfor human capital investments (Logan 1978; Logan and Alba 1993). Indeed, blacks in thehighest SES strata often reside in less desirable neighborhoods than whites in lower SESstrata (Rosenbaum and Friedman 2007). Such discrepancies extend to Hispanic groupsas well, who are less likely than whites (but more likely than blacks) to leave high-povertyneighborhoods (South et al. 2005). These patterns are articulated in the place stratificationmodel, which complements the spatial assimilation model by drawing attention to housingmarket barriers encountered by some groups and not others (Charles 2003; Logan andMolotch 1987).
Studies drawing on these perspectives have created a large literature on neighborhoodsorting and locational attainment. But this research literature has largely neglected therole that incarceration may play on mobility between neighborhoods of varying quality,even though almost 8 percent of the adult population has experienced a felony convic-tion. In the following section I discuss why we should consider adding incarceration tothe list of characteristics known to shape mobility into and out of poor neighborhoods.
INCARCERATION AND LOCATIONAL ATTAINMENT
Incarceration is concentrated in certain geographic areas. In Chicago, for example, theincarceration removal rate in the highest-rate predominantly black community is 40 timeslarger than the removal rate in the highest-rate predominantly white community (Samp-son 2012). Lynch and Sabol (2001, 2004) documented similar trends in Baltimore, wheremale incarceration rates in some neighborhoods are over 20 percent, and just 5 percentof Baltimore neighborhoods account for 25 percent of yearly prison admissions. This pat-tern continues after release. More than half of a sample of parolees followed after prisonsettled in less than 10 percent of Chicago neighborhoods (Visher and Farrell 2005). Simi-larly, in Maryland, almost 40 percent of all men and women released from prison in 2001
425

CITY & COMMUNITY
returned to 6 of the 55 total Baltimore community areas (Visher et al. 2004). In bothcities, the areas that received the highest numbers of returning citizens were typified byhigh rates of poverty, crime, and other indicators of disadvantage.
What these trends cannot tell us, however, is if the confinement experience impactsresidential mobility between different types of neighborhoods. The locational attainmentperspectives outlined above provide some insights on how to conceptualize a potentialincarceration effect. For instance, the spatial assimilation perspective would emphasizethe SES deficiencies of individuals with a history of incarceration. Prisoners average lessthan a high school education, and unemployment at the time of incarceration is common(Western 2006). Spending time in prison creates further difficulties in the labor market,and released citizens often struggle to find employment after prison (Pager 2003, 2008).For many, this results in postprison declines in earnings that last well after release (Pettitand Lyons 2009; Western 2002). As such, those returning citizens who did not alreadyreside in poor neighborhoods might be expected to move there because of postprisonlabor market struggles. I refer to this as downward neighborhood mobility, and expect thatindividuals with a history of incarceration will be more likely than those without to exitnonpoor neighborhoods and enter poor neighborhoods.
Alternatively, the place stratification perspective might conceptualize the incarcera-tion experience as a housing market barrier that funnels or traps formerly incarceratedcitizens in poor neighborhoods. The information that is recorded as individuals movethrough the criminal justice system can be used as a tool of social exclusion (Pager 2008).The stigma of a criminal record has been implicated in a number of the social conse-quences of mass incarceration (Massoglia 2008; Pager 2003; Western 2002). In this case,the stigma could create barriers in the housing market that restrict the types of neigh-borhoods available to returning citizens. Landlords in the private housing market oftenrequire references and background checks, presenting obvious difficulties for recentlyincarcerated citizens (Petersilia 2003). Furthermore, a criminal conviction may directlyeliminate certain types of housing. Convicted sex offenders often cannot reside in ar-eas where children are known to congregate (Zgoba et al. 2009). Furthermore, someconvicted drug offenders are restricted from accessing public housing (Geller and Curtis2011). Finally, many communities also actively restrict any sort of housing that might assistreturning citizens (Beckett and Herbert 2010). For individuals living in poor neighbor-hoods, then, the expectation is that the incarceration experience will serve as a barrierto exiting these neighborhoods. That is, incarceration will inhibit upward neighborhoodmobility.
Two additional issues warrant consideration. First, there is extensive racial variation inboth exposure to incarceration and locational attainment outcomes. Mobility and loca-tional attainment are strongly shaped by race and ethnicity, and these struggles may becompounded for formerly incarcerated minorities. Black incarceration rates are gener-ally six to seven times larger than white incarceration rates (Glaze 2011). For uneducatedblack men especially, incarceration is increasingly being treated as a normative (albeit dis-ruptive) phase in the life course (Pettit and Western 2004). Formerly incarcerated blacksmay encounter compounded housing market barriers that work to trap them in poorneighborhoods, and I expect that incarceration will serve as a larger barrier to upwardneighborhood mobility for minorities than for whites. Of course, it could also be thecase that black offenders already reside in poor neighborhoods before prison, meaningthat postprison residence in poor neighborhoods would reflect a continuation of existing
426

INCARCERATION AND RESIDENTIAL MOBILITY DESTINATIONS
residential inequalities. It is formerly incarcerated whites that see the biggest declines inpostprison neighborhood quality (Massoglia et al. 2013), and it is plausible that mobilityout of nonpoor neighborhoods is driving this trend. As such, I expect that the incarcera-tion experience will be most consequential for whites living in nonpoor neighborhoods.
The second issue is whether we should expect a consistent effect of incarceration onlocational attainment outcomes across time. The mark of a criminal label is a relativelypermanent new social status that can create long-term issues. Earnings and wage growth,for example, are affected by exposure to incarceration well after release (Western 2002).In addition, formerly incarcerated whites have been found to live in increasingly worseneighborhoods across time (Massoglia et al. 2013). However, residential mobility appearsto be most pronounced early in the reentry period (Warner and Sharp 2016). Whilemany parolees are known to move to new neighborhoods after prison, much smallerpercentages make subsequent moves while under parole supervision (Cahill and Landale2008; La Vigne et al. 2004; La Vigne et al. 2005). As such, my final expectation is that anyupward or downward neighborhood mobility will be concentrated early in the reentryperiod.
While incarceration is typically not considered in assessments of mobility and locationalattainment, there are a few recent exceptions. In a study of postprison neighborhood out-comes among Californian parolees, Hipp and colleagues (2010b) found significant varia-tion in neighborhood environment by conviction offense and parolee race. Sex offendersmade postprison moves into more disadvantaged neighborhoods than individuals con-victed of other crimes, and black parolees also entered into and subsequently moved tomore disadvantaged neighborhoods than did white or Hispanic parolees. A second studyextended these findings by examining differences between pre- and postprison neigh-borhood quality. Massoglia et al. (2013) found that formerly incarcerated blacks werenot residing in more disadvantaged neighborhoods after prison than they lived in beforeprison. Only formerly incarcerated whites, who were argued to have “more to lose” inregard to neighborhood quality, experienced significant downward mobility into moredisadvantaged neighborhoods following release from prison.
The current study extends these findings in important ways. Like Hipp and collabora-tors, I stress residential mobility as the impetus to residence in poor or nonpoor neigh-borhoods. However, I build on their work in two respects. First, like Massoglia and collab-orators, I utilize data that contain important demographic and residential informationleading up to confinement. For individuals with a history of incarceration, this meansthat I can compare pre- and postprison neighborhoods. Neighborhood of origin was onlyavailable in the California data for moves made following release from prison. Second,because my data track the same set of respondents for almost 30 years, I am able to extendthe period of analysis past the 2-year follow-up used in the California data.
Furthermore, by focusing more directly on residential mobility patterns, I also makeimportant extensions to the work of Massoglia et al. Their analysis focused on within-person change in neighborhood quality across time, but this approach neglects the strongrole that residential mobility plays in social mobility (Sampson and Sharkey 2008). I focusexplicitly on mobility, providing a clearer picture of the types of neighborhoods return-ing citizens reside in versus the types of neighborhoods they move to. Additionally, myanalytic approach helps to clarify the “more to lose” conclusion offered by the authors.By explicitly examining upward and downward residential mobility, all respondents startin similar neighborhoods. The analyses thus compare formerly incarcerated whites and
427

CITY & COMMUNITY
minorities that have the same amount to lose through incarceration. This eliminates theextensive racial variation in neighborhood of origin.
DATA AND METHODS
Examining mobility between poor and nonpoor neighborhoods requires data on bothindividuals and the neighborhoods in which they reside. Individual data for this study aredrawn from the 1979 National Longitudinal Survey of Youth (NLSY79), a longitudinaldata collection overseen by the Bureau of Labor Statistics that started following a cohortof 12,686 respondents in 1979. The original sample included nationally representativesamples of white, African American, and Hispanic males and females, as well as supple-mentary samples of black and Hispanic males and females, and poor white males andfemales. After 1991, the supplementary poor white sample was no longer interviewed.During the period 1979–1994 interviews took place on a yearly basis, and interviews havebeen conducted in even numbered years since 1994. The present study utilizes interviewsbetween the period 1979 and 2008.
Access to restricted data identifies the state, county, and census tract of residence foreach respondent at each interview. This allows the individual data to be appended withdata from the U.S. Census. Census tract data are drawn from the Neighborhood ChangeDatabase (NCDB), which provides standardized census tract data (standardized to the2000 tract boundaries) for the 1980, 1990, and 2000 census collections. Because tractboundaries are occasionally redrawn, standardized boundaries are useful to ensure thattracts maintain the same geographic area across time. Individual tract identifiers are alsostandardized to the 2000 tract boundaries, meaning that observed mobility represents anactual move as opposed to a shifting boundary. I use linear interpolation to estimate tractcharacteristics in noncensus years.
DEPENDENT VARIABLES
I use tract poverty rates provided by the NCDB to create two measures of intertract mo-bility between poor and nonpoor neighborhoods (see South et al. 2005: 800). At eachwave of data collection I identify respondents who live in poor neighborhoods (povertyrate above 20 percent) and nonpoor neighborhoods (poverty rate below 20 percent). Iuse this information to stratify the sample so that only those eligible to move in eitherdirection have a value on the respective dependent variable. For instance, a respondentwho starts an observation in a poor tract is not eligible to move to a poor tract by the endof the observation. For respondents who live in nonpoor tracts, the dependent variableis coded 1 if they moved to a poor tract by the next interview and 0 otherwise (did notmove or moved to a nonpoor tract). Conversely, for respondents who live in poor tracts,the dependent variable is coded 1 if they moved to a nonpoor tract by the next interviewand 0 if they did not move or moved to a poor tract. Taken together, these two measurescapture downward neighborhood mobility (into poor tracts) and upward neighborhood mobil-ity (out of poor tracts). Although poverty classifications are to some extent arbitrary, the20 percent poverty cut-off is consistent with previous treatments of neighborhood poverty(Jargowsky 1997; Wilson 1987).1
428
INCARCERATION AND RESIDENTIAL MOBILITY DESTINATIONS
INDEPENDENT VARIABLES
Imprisoned NLSY79 respondents are identified through a residence indicator, and areinterviewed at the correctional facility in which they are housed. This survey protocolcaptures longer spells of imprisonment with certainty, but shorter spells in local jails aremore likely to be missed (see Western 2002). I use the residence indicators to create threevariables associated with incarceration and life after release. The first is a time-varying di-chotomous indicator capturing incarceration history. This measure is coded 1 in all wavesfollowing the last in-prison interview and 0 otherwise (i.e., before prison or for all obser-vations among the never-incarcerated respondents). Respondents with a history of in-carceration provide 3,172 observations before incarceration and 3,322 observations afterincarceration. The second incarceration indicator is a time-varying count of the numberof observations since a respondent was last interviewed in prison. This measure is coded0 leading up to confinement (and in all waves for those respondents with no history ofincarceration), and then increases by 1 in each observation a respondent is interviewedfollowing release from prison. Finally, while not an explicit focus of the present study, Ialso account for exposure to incarceration with a measure that captures the total numberof observations a respondent was interviewed in prison.
CONTROL VARIABLES
The current study adds incarceration to the list of characteristics known to impact move-ment between poor and nonpoor neighborhoods. In the empirical models that follow, Iexamine the total effect of incarceration as well as the effect net of other key correlates oflocational attainment. I control for race using dummy variables for white (the referencecategory), African American, and Hispanic respondents. I include three time-varying SESindicators. The first is a measure of the number of years of completed school. The secondis a measure of employment, coded 1 if the respondent reports having a job at the timeof the interview. The third is a dichotomous indicator of family poverty, coded 1 if therespondent’s household income falls below the federal poverty line. I also account fortotal exposure to neighborhood poverty with a time-varying count of the total number ofobservations a respondent resided in a poor neighborhood. I include two time-varyinghousing measures: a dichotomous indicator of homeownership (coded 1 if a respondentreports owning or making payments on a home), and a dichotomous indicator of publichousing residence (coded 1 if a respondent reports receiving public housing assistance).Furthermore, because mobility is strongly tied to age, I include measures of respondentage and age-squared. I also control for marriage (with a dichotomous variable coded 1 ifrespondents report their relationship status as married and 0 otherwise), and family size(with a count of the number of resident children in the household). I control for genderwith a dichotomous variable coded 1 for males and 0 for females. Finally, I account for twotime-stable family background measures taken from the first interview: parent education(the highest educational attainment of either parent) and in-tact family (dichotomousvariable coded 1 if respondents report growing up with both biological parents).
Mobility patterns are also shaped by a combination of neighborhood push and pullfactors, and so I include two census tracts characteristics from the tract of origin. First,because poor places may attract residents from other poor places (Tienda 1991), I control
429

CITY & COMMUNITY
for the neighborhood poverty rate in the tract of origin.2 Second, given that a greaterminority presence in a neighborhood can trigger mobility for some groups, I control forpercent non-Hispanic black in the tract of origin. Like the neighborhood poverty rate,these tract characteristics are taken from the 1980, 1990, and 2000 census collectionsusing the NCDB.3
ANALYTIC STRATEGY
To make maximum use of the longitudinal data, I segment each respondent’s interviewrecord into a series of mobility intervals, with each interval capturing the period betweensuccessive interviews. Initial residence in a poor or nonpoor neighborhood is measuredat the beginning of the mobility interval (or time t). Mobility into poor or nonpoor neigh-borhoods is then measured at the next interview (or time t + 1). I limit my measure ofresidential mobility to those moves that are between tracts, but within county. This is con-sistent with the U.S. Census definition of residential mobility, or what others have labeledinterneighborhood mobility (Crowder et al. 2006; Lee and Hall 2009; Rossi 1980).4 Im-portantly, all independent variables are taken from the beginning of the mobility interval,which helps protect the temporal ordering of the independent and dependent variables.
I use logistic regression to examine the effect of the incarceration and control variableson the odds of moving between poor and nonpoor census tracts. The 12,686 NLSY79respondents provide a total of 103,539 mobility intervals that start in nonpoor tracts,and 42,206 mobility intervals that start in poor tracts. Because the same respondent cancontribute multiple mobility intervals to the analysis, error terms within individuals arelikely correlated. I correct for the nonindependence of observations by computing robuststandard errors that are clustered within individuals. All models were estimated usingStata v.14.
RESULTS
While not displayed, it is useful to start the results with some descriptive informationabout total mobility for the NLSY79 sample. Respondents with no history of incarcera-tion move across census tracts (but within counties), in approximately 16 percent of allmobility intervals. Respondents with a history of incarceration are more mobile both be-fore prison (moves in 22 percent of all preprison intervals) and after prison (moves in28 percent of all postprison intervals). Table 1 displays the distribution of these moves be-tween poor and nonpoor neighborhoods. In each panel of results, the row percentages(which reflect the origin tract) sum to 100, and the diagonals provide a breakdown ofobserved upward and downward mobility. Moves that start in a nonpoor tract and end ina poor tract are least common among respondents with no history of incarceration (lessthan 2 percent of all eligible moves). Respondents who eventually go to prison makedownward neighborhood moves in about 5 percent of all mobility intervals that start ina nonpoor tract. Providing initial support for the expectation outlined above, the fre-quency of downward neighborhood mobility increases to almost 8 percent after prison.
A more complicated picture emerges in Table 1 for upward neighborhood mobility.Never-incarcerated respondents make upward moves in almost 10 percent of all intervals
430

INCARCERATION AND RESIDENTIAL MOBILITY DESTINATIONS
TABLE 1. Upward and Downward Residential Mobility Distributions by Incarceration Status
Never Incarcerated
Destination Tract
Poor Nonpoor N
Origin tract Poor 90.14 9.86 38,977Nonpoor 1.81 98.19 100,274
Before prison
Destination Tract
Poor Nonpoor N
Origin tract Poor 91.64 8.36 1,585Nonpoor 5.16 94.84 1,587
After prison
Destination Tract
Poor Non-poor N
Origin tract Poor 88.18 11.82 1,644Nonpoor 7.84 92.16 1,678
Notes: Row percentages sum to 100 percent, diagonals represent upward and downward mobility. Sample sizes (N)correspond to characteristics of origin tracts. Statistics adjusted for survey weights and design effects.Source: NLSY79.
that start in a poor tract. Those respondents who experience incarceration make up-ward neighborhood moves in approximately 7.5 percent of all preprison mobility inter-vals. After incarceration, however, the frequency of upward neighborhood moves (about12 percent) exceeds the rates for both the never-incarcerated sample and the preincar-ceration observations. These descriptive results do not support the expectation that for-merly incarcerated respondents will be trapped in poor neighborhoods. The reentry pe-riod, at least initially, is often characterized by residential instability, and this descriptiveinformation provides some evidence that returning citizens move fairly regularly betweenneighborhoods of varying quality. After first briefly reviewing additional descriptive infor-mation, I examine these patterns while also controlling for key correlates of mobility andlocational attainment.
Table 2 presents descriptive statistics for all of the predictors of upward and down-ward mobility, again disaggregated by incarceration history (never, pre-, and postprison).Incarceration history, a key independent variable, is omitted from the table because it isnecessarily coded 0 for the never-incarcerated sample, 0 before prison, and 1 after prison.Respondents with a history of incarceration spend, on average, just over two observationsincarcerated, and are observed after prison for an average of approximately four mobil-ity intervals. After adjusting the descriptive statistics for survey weights and design effects,African Americans constitute 13 percent of the never-incarcerated observations, but overone-third of the pre- and postprison observations. Males also make up the vast major-ity of pre- and postprison observations. Individuals who go to prison are also less likelythan never-incarcerated respondents to come from an in-tact family, be married, ownhomes, have a high-school education, or report having a job. They are more likely to live
431

CITY & COMMUNITY
TABLE 2. Descriptive Statistics for Independent Variables Predicting Upward and Downward Mobility; byIncarceration Status
Never-Incarcerated Before Prison After Prison
Mean SD Mean SD Mean SD
Time since release – – – – 4.02 5.46Incarcerated observations – – – – 2.28 2.90African American 0.13 0.34 0.37 0.59 0.39 0.60Hispanic 0.06 0.24 0.12 0.39 0.10 0.37White 0.81 0.39 0.51 0.61 0.51 0.61Age 29.34 8.44 22.76 6.79 33.84 9.13Male (1 = yes) 0.47 0.50 0.84 0.44 0.88 0.40Parental education 12.58 3.02 11.16 3.64 11.12 3.35In-tact family 0.77 0.42 0.58 0.60 0.55 0.61Married (1 = yes) 0.48 0.50 0.16 0.45 0.27 0.54Number of children 0.84 1.11 0.37 0.99 0.54 1.20Homeowner (1 = yes) 0.41 0.49 0.06 0.29 0.16 0.45Education 12.85 2.38 10.70 2.10 11.31 2.18Employed (1 = yes) 0.76 0.43 0.54 0.61 0.62 0.60Family poverty (1 = yes) 0.10 0.30 0.31 0.56 0.31 0.57Public housing assistance (1 = yes) 0.03 0.16 0.08 0.34 0.07 0.32Poverty exposure 1.27 2.94 1.53 3.16 2.73 5.14Tract % poor 12.13 10.43 18.80 16.88 19.22 16.28Tract % African American 12.09 22.77 26.93 41.35 28.12 40.89N of mobility intervals 139,251 3,172 3,322
Note: Means and standard deviations adjusted for survey weights and design effects.
in poverty, reside in public housing, and reside in neighborhoods with higher levels ofpoverty and greater concentrations of African Americans.
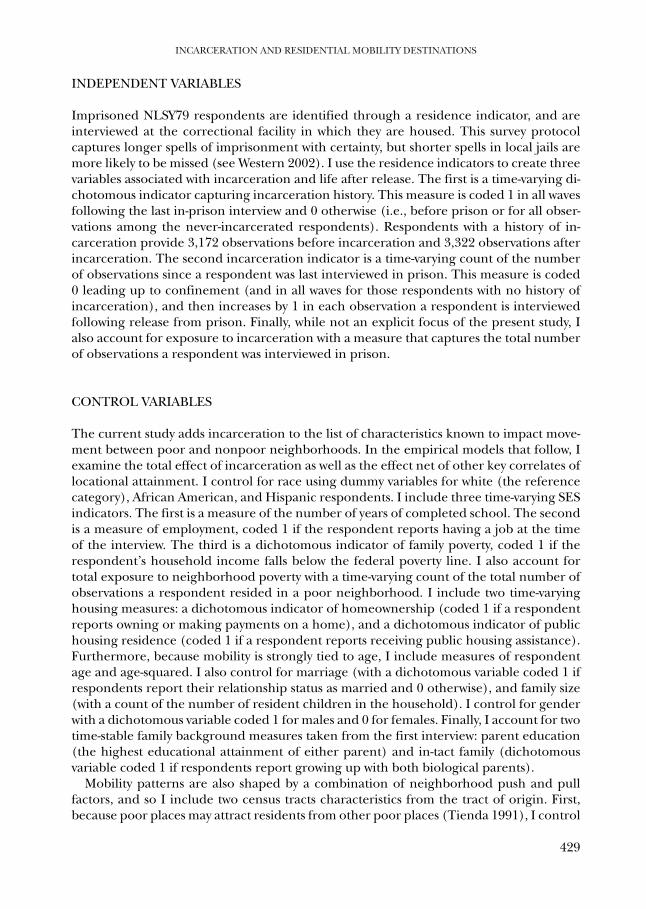
Table 3 presents the results from a series of logistic regression models predicting down-ward neighborhood mobility. I estimate a total effect of incarceration on downward mo-bility by starting with only the measure of incarceration history in model 1. In model 2,I add the other incarceration measures: time since release and total observations incar-cerated. Preliminary analyses suggested that allowing for a nonlinear trend in time sincerelease from prison resulted in a better model fit. As such, all models include both timesince release and the squared term for time since release. In model 3, I build up the loca-tional attainment model by adding individual and tract controls discussed above. Finally,in model 4 I examine if incarceration history and time since release vary by respondentrace and ethnicity through a series of interaction terms. I then present a parallel set ofmodels predicting upward mobility in Table 4.
The results in model 1 of Table 3 suggest that incarceration is a strong predictor ofdownward residential mobility into poor neighborhoods. The likelihood that a respon-dent will leave a nonpoor area for a poor area is nearly quadrupled if that respondenthas a history of incarceration (e1.368 = 3.9). Adding the additional incarceration measuresin model 2 suggests initial stability in the effect of incarceration history, followed by de-clines as a respondent spends more time out of prison (as indicated by the significantcoefficient of the squared term for time since release). Across all the models, there is noindication that greater exposure to incarceration is related to downward neighborhoodmobility.
432

INCARCERATION AND RESIDENTIAL MOBILITY DESTINATIONS
TA
BL
E3.
Dow
nw
ard
Mob
ility
:Log
isti
cR
egre
ssio
nPr
edic
tin
gR
esid
enti
alM
obili
tyfr
oma
Non
poor
toa
Poor
Cen
sus
Trac
t;19
79–2
008
Mod
el1
Mod
el2
Mod
el3
Mod
el4
bse
bse
bse
bse
Inca
rcer
atio
nh
isto
ry1.
368 *
**(0
.094
)1.
511 *
**(0
.169
)0.
475 *
(0.2
11)
1.05
9 ***
(0.2
78)
Tim
esi
nce
rele
ase
0.04
5(0
.063
)0.
063
(0.0
70)
−0.1
10(0
.096
)T
ime
sin
cere
leas
e2−0
.010
*(0
.005
)−0
.009
(0.0
05)
0.00
2(0
.007
)In
carc
erat
edob
serv
atio
ns
0.00
0(0
.043
)−0
.048
(0.0
50)
−0.0
34(0
.051
)A
fric
anA
mer
ican
a0.
843 *
**(0
.062
)0.
860 *
**(0
.063
)H
ispa
nic
a0.
768 *
**(0
.058
)0.
783 *
**(0
.059
)A
ge0.
138 *
**(0
.022
)0.
140 *
**(0
.022
)A
ge2
−0.0
02**
*(0
.000
)−0
.002
***
(0.0
00)
Mal
e−0
.030
(0.0
45)
−0.0
30(0
.045
)Pa
ren
tale
duca
tion
−0.0
11(0
.007
)−0
.011
*(0
.007
)In
-tact
fam
ily−0
.317
***
(0.0
44)
−0.3
15**
*(0
.044
)M
arri
ed−0
.146
**(0
.053
)−0
.147
**(0
.053
)N
umbe
rof
child
ren
0.01
3(0
.023
)0.
013
(0.0
23)
Hom
eow
ner
−1.4
95**
*(0
.072
)−1
.494
***
(0.0
72)
Edu
cati
on−0
.027
*(0
.011
)−0
.027
***
(0.0
11)
Em
ploy
ed−0
.193
***
(0.0
46)
−0.1
93**
*(0
.046
)Fa
mily
pove
rty
stat
us0.
287 *
**(0
.052
)0.
285 *
**(0
.052
)Pu
blic
hou
sin
gas
sist
ance
0.01
2(0
.083
)0.
009
(0.0
83)
Pove
rty
expo
sure
0.09
4 ***
(0.0
06)
0.09
4 ***
(0.0
06)
Trac
tpov
erty
rate
0.05
3 ***
(0.0
04)
0.05
3 ***
(0.0
04)
Trac
t%n
on-H
ispa
nic
blac
k0.
001
(0.0
01)
0.00
1(0
.001
)In
tera
ctio
ns:
Ex-
inm
ate
×A
fric
anA
mer
ican
−0.9
12**
(0.3
56)
Ex-
inm
ate
×H
ispa
nic
−0.7
95(0
.476
)T
ime
sin
cere
leas
e×
Afr
ican
Am
eric
an0.
268 *
(0.1
36)
Tim
esi
nce
rele
ase2
×A
fric
anA
mer
ican
−0.0
17(0
.010
)T
ime
sin
cere
leas
e×
His
pan
ic0.
222
(0.1
88)
Tim
esi
nce
rele
ase2
×H
ispa
nic
−0.0
15(0
.014
)C
onst
ant
−3.5
18**
*(0
.022
)−3
.518
***
(0.0
22)
−5.1
24**
*(0
.308
)−5
.149
***
(0.3
08)
Mod
elch
i-squ
are
212.
4826
8.19
2800
.53
2811
.29
-2lo
glik
elih
ood
2772
0.16
2769
9.83
2447
4.13
2446
6.77
Pers
on-o
bser
vati
ons
103,
539
103,
539
103,
539
103,
539
Pers
ons
10,7
0710
,707
10,7
0710
,707
Not
es:*
p<
0.05
,**p
<0.
01,**
*p
<0.
001.
Rob
ust
stan
dard
erro
rs.a
,-co
mpa
red
tow
hit
ere
spon
den
ts.N
otsh
own
:dum
my
vari
able
for
inte
rvie
ws
con
duct
edaf
ter
1994
,dum
my
vari
able
for
nev
er-in
carc
erat
edre
spon
den
ts.
433
CITY & COMMUNITY
TA
BL
E4.
Upw
ard
Mob
ility
:Log
isti
cR
egre
ssio
nPr
edic
tin
gR
esid
enti
alM
obili
tyfr
oma
Poor
toa
Non
poor
Cen
sus
Trac
t;19
79–2
008
Mod
el1
Mod
el2
Mod
el3
Mod
el4
bse
bse
bse
bse
Inca
rcer
atio
nh
isto
ry.2
51**
(.09
3).2
98(.
157)
.309
(.18
2).6
12(.
339)
Tim
esi
nce
rele
ase
−.04
3(.
062)
−.08
1(.
063)
−.12
3(.
145)
Tim
esi
nce
rele
ase2
−.00
1(.
005)
.000
(.00
6)−.
001
(.01
3)In
carc
erat
edob
serv
atio
ns
.043
(.04
1).0
17(.
042)
.013
(.04
3)A
fric
anA
mer
ican
a−.
610 *
**(.
063)
−.60
7 ***
(.06
4)H
ispa
nic
a−0
.216
***
(0.0
59)
−0.2
07**
*(0
.059
)A
ge0.
191 *
**(0
.021
)0.
192 *
**(0
.021
)A
ge2
−0.0
03**
*(0
.000
)−0
.003
***
(0.0
00)
Mal
e−0
.126
**(0
.042
)−0
.126
**(0
.042
)Pa
ren
tale
duca
tion
0.03
5 ***
(0.0
07)
0.03
5 ***
(0.0
07)
In-ta
ctfa
mily
−0.1
74**
*(0
.041
)−0
.174
***
(0.0
41)
Mar
ried
0.15
0 **
(0.0
49)
0.15
0 **
(0.0
49)
Num
ber
ofch
ildre
n0.
016
(0.0
20)
0.01
7(0
.020
)H
omeo
wn
er−1
.147
***
(0.0
65)
−1.1
46**
*(0
.065
)E
duca
tion
0.04
1 ***
(0.0
10)
0.04
1 ***
(0.0
10)
Em
ploy
ed0.
353 *
**(0
.043
)0.
353 *
**(0
.043
)Fa
mily
pove
rty
stat
us−0
.019
(0.0
45)
−0.0
19(0
.045
)Pu
blic
hou
sin
gas
sist
ance
−0.2
52**
*(0
.072
)−0
.254
***
(0.0
72)
Exp
osur
eto
pove
rty
−0.0
78**
*(0
.006
)−0
.078
***
(0.0
06)
Trac
tpov
erty
rate
−0.0
12**
*(0
.002
)−0
.012
***
(0.0
02)
Trac
t%n
on-H
ispa
nic
blac
k0.
001
(0.0
01)
0.00
1(0
.001
)In
tera
ctio
ns:
Ex-
inm
ate
×A
fric
anA
mer
ican
−0.3
10(0
.346
)E
x-in
mat
e×
His
pan
ic−0
.443
(0.4
09)
Tim
esi
nce
rele
ase
×A
fric
anA
mer
ican
−0.0
05(0
.168
)T
ime
sin
cere
leas
e2×
Afr
ican
Am
eric
an0.
010
(0.0
15)
Tim
esi
nce
rele
ase
×H
ispa
nic
0.23
6(0
.216
)T
ime
sin
cere
leas
e2×
His
pan
ic−0
.030
(0.0
22)
Con
stan
t−2
.366
***
(0.0
21)
−2.3
66**
*(0
.021
)−5
.014
***
(0.2
97)
−5.0
32**
*(0
.297
)M
odel
chi-s
quar
e7.
2914
.49
1194
.33
1205
.34
−2lo
glik
elih
ood
2487
2.80
2486
4.77
2348
7.04
2347
8.57
Pers
on-o
bser
vati
ons
42,2
0642
,206
42,2
0642
,206
Pers
ons
6,23
06,
230
6,23
06,
230
Not
es:*
p<
0.05
,**p
<0.
01,**
*p
<0.
001.
Rob
ust
stan
dard
erro
rs.a
,com
pare
dto
wh
ite
resp
onde
nts
.Not
show
n:d
umm
yva
riab
lefo
rin
terv
iew
sco
ndu
cted
afte
r19
94,d
umm
yva
riab
lefo
rn
ever
-inca
rcer
ated
resp
onde
nts
.
434

INCARCERATION AND RESIDENTIAL MOBILITY DESTINATIONS
The addition of time-stable and time-varying controls in model 3 reflects well-knownpredictors of locational attainment. Both black and Hispanic respondents are morelikely than white respondents to leave nonpoor neighborhoods for poor neighbor-hoods. More educated respondents and employed respondents are less likely to leavenonpoor neighborhoods, while individuals who live in poor households—but nonpoorneighborhoods—are more likely to leave these areas. Because homeownership promotesstability, respondents who own homes in nonpoor neighborhoods are unlikely to leave.Married respondents are less likely than unmarried respondents to leave nonpoor ar-eas. Greater exposure to poverty increases the likelihood of downward neighborhoodmobility, even for those living in nonpoor neighborhoods at the start of a mobility inter-val. The effect of incarceration history is reduced by nearly 70 percent from model 2 tomodel 3. This implies that returning citizens are more likely to move into poor neighbor-hoods, in part, because of preexisting disadvantages and SES disadvantages that emergefollowing incarceration. That said, the odds of downward mobility are still increased byapproximately 60 percent in any given postprison observation (e0.475 = 1.61). The timetrend from model 2 is also observed, although the coefficient for the squared term oftime since release is reduced just under conventional levels of statistical significance(p = 0.08).
In model 4, I examine if incarceration history and time since release interact withrespondent race/ethnicity. The results from the interaction models show significant dif-ferences between African American and white respondents with a history of incarcera-tion. The main effect of incarceration history is positive and significant, which representsthe effect of incarceration history on downward neighborhood mobility for white respon-dents. The odds of downward mobility for whites who experience incarceration are nearlythree times greater than the odds of downward mobility for whites who never go to prison(e1.059 = 2.88). The black*incarceration history interaction term is negative and signifi-cant. The interaction between incarceration history and Hispanic respondents is alsonegative, but not statistically significant (p = 0.09). In supplementary analyses, I shiftedthe race/ethnicity reference category to examine if downward neighborhood mobilitywas more common among formerly incarcerated blacks and Hispanics compared to theirrespective never-incarcerated counterparts. These results showed that, while postprisondownward mobility is more common among all racial subsamples, the difference is onlystatistically significant for formerly incarcerated whites (as displayed by the main effect ofincarceration history in model 4).
In addition to the significant interaction with incarceration history, model 4 also showsthat time since release shapes downward neighborhood mobility differently for whiteand black respondents. The main effects (in this case, the effect for formerly incarcer-ated whites) are not significant, although the negative coefficient for time since releasesuggests a gradual decay of the incarceration effect for whites over time. For blacks, onthe other hand, the likelihood of downward neighborhood mobility increases in the ob-servations following prison, and then starts to level off. The coefficient for the squaredmeasure of time since release nears, but does not reach, conventional levels of statisti-cal significance (p = 0.08). The same trend is observed for Hispanic respondents with ahistory of incarceration, although none of the interaction terms reach statistical signifi-cance. As a whole, the results in model 4 suggest that the effect of incarceration historyon downward neighborhood mobility is initially stronger for whites than it is for African
435

CITY & COMMUNITY
0
0.01
0.02
0.03
0.04
0.05
0.06
0.07
25 26 27 28 29 30
Pred
icte
d Pr
obab
ility
of D
owna
rd M
obili
ty
Age
White, prison Black, prison Hispanic, prison
White, no prison Black, no prison Hispanic, no prison
FIG. 1. Predicted probability of mobility from a non-poor to a poor tract by incarceration history, race, andtime since release.
Notes: All covariates from model 4 of Table 3 (except race, incarceration history, time since release, and age) attheir mean value. Prison release set to age 25 so probability of downward mobility can be estimated for
respondents with no history of incarceration.Source: NLSY79; 1979–2008.
Americans, but that the trends diverge as formerly incarcerated blacks and whites spendmore time released from prison.
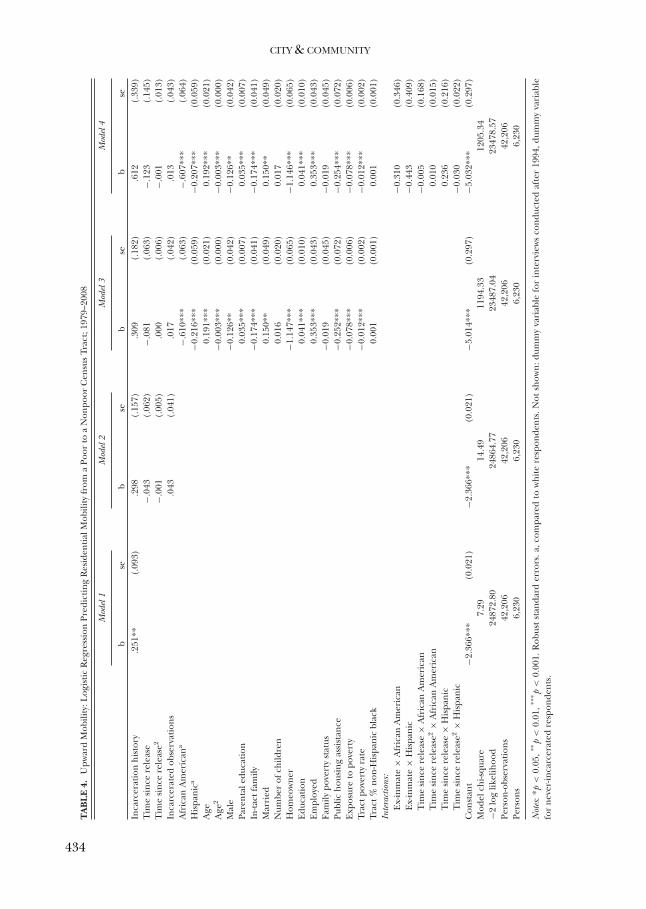
To provide greater context to these interactions, I plot in Figure 1 the predicted prob-abilities of downward neighborhood mobility for white, African American, and Hispanicrespondents with and without a history of incarceration. So that probabilities can be esti-mated regardless of incarceration history, I set the age of release from prison to 25. Thelines for respondents with a history of incarceration mark the first six observations fol-lowing release, while the lines for respondents without a history of incarceration markthe probability of downward mobility from age 25 to 30. All other model covariates frommodel 4 of Table 3 are held at their mean values.
It should be noted that mobility from nonpoor to poor tracts is rare, and the predictedprobabilities here do not exceed 0.10 for any group. That said, the figure illustrates boththe main effects and interactions from model 4. Whites who go to prison are signifi-cantly more likely to make a downward move than whites who do not go to prison. Thisdifference, however, starts to narrow across time. Both formerly incarcerated blacks andHispanics are also more likely to make a downward neighborhood move than their never-incarcerated counterparts, but sensitivity analyses discussed above indicated that the dif-ference between respondents who do and do not go to prison is only statistically signifi-cant among whites. Indeed, at least early in the reentry process, all formerly incarcerated
436

INCARCERATION AND RESIDENTIAL MOBILITY DESTINATIONS
respondents are expected to make downward moves at about the same rate. But while thepostprison trend for whites is a declining probability of downward mobility, there is anupward trend for Hispanics and (especially) African Americans. And even with the morepronounced incarceration effect among formerly incarcerated whites, eventually whiteswith a history of incarceration are less likely than African Americans or Hispanics withouta history of incarceration to move into poor neighborhoods.
In Table 4 I turn my attention to upward neighborhood mobility; or to moves thatbegin in poor neighborhoods and end in nonpoor neighborhoods. I present a parallelseries of models in Table 4 as I did in Table 3.
If the general theme from Table 3 was that incarceration increases the likelihood ofdownward neighborhood mobility, the results from Table 4 show few significant relation-ships between incarceration and upward mobility. The baseline coefficient for incarcer-ation history is significant in model 1, reflecting the descriptive association displayed inTable 1. Across the rest of the model specifications, however, none of the incarcerationmeasures reach conventional levels of statistical significance. Model 4 of Table 4 doessuggest that formerly incarcerated whites might be better equipped than formerly incar-cerated minorities to exit poor neighborhoods, but again these effects fail to reach statis-tical significance. The effects of many of the control variables are consistent with existingresearch on locational attainment. Moves to nonpoor neighborhoods are more commonamong whites than among African Americans or Hispanics. Respondents who are em-ployed and respondents with higher educations are more likely to be upwardly mobile.Married respondents are more likely to escape poor neighborhoods, but homeowners—as with downward mobility—are unlikely to move out of poor neighborhoods. Respon-dents receiving housing assistance and respondents with greater exposure to poverty areless likely to leave poor neighborhoods. The tract poverty rate is also negatively relatedto mobility out of poor neighborhoods, reflecting the difficulties in escaping very poorneighborhoods.
Overall, the results presented here provide mixed support for the research expecta-tions outlined above. I did find that incarceration history is a robust predictor of down-ward neighborhood mobility, but I did not find that incarceration works to trap formerlyindividuals in poor neighborhoods.5 Given that residential mobility is most pronouncedearly in the reentry period, I expected that any upward or downward mobility wouldbe most likely during this period. In support of this expectation, I found that the com-bination of the incarceration history and time since release measures suggest a consis-tent effect early that then starts to decline. Finally, there is evidence of racial/ethnicheterogeneity in especially downward neighborhood mobility. As expected, I found thatformerly incarcerated whites living in nonpoor neighborhoods are most affected by theexperience of incarceration. But I did not find that incarceration is more consequentialfor upward mobility among minorities. However, as shown in Figure 1, the trends overtime vary for formerly incarcerated whites and formerly incarcerated minorities.
DISCUSSION
Individuals who become incarcerated are concentrated in poor and disadvantaged neigh-borhoods before prison, and emerging evidence is shedding light on the role incarcera-tion plays in further channeling these individuals into such neighborhoods. The current
437

CITY & COMMUNITY
study extends this line of research by examining the impact of incarceration on residen-tial mobility between poor and nonpoor neighborhoods. In doing so, I merge researchon the consequences of incarceration with an extensive line of research on mobility, at-tainment, and concentrated poverty. I advance here two main conclusions.
First, going to prison increases the likelihood that an individual will experience down-ward neighborhood mobility from a nonpoor to a poor neighborhood. This effect is ro-bust to a host of individual and neighborhood characteristics known to be associated withresidential mobility and locational attainment. Furthermore, additional analyses showedthat the relationship between incarceration and mobility is initially stable, then starts toslowly decline as individuals spend longer periods of time released from confinement. In-carceration appears to work as a barrier that prohibits continued residence in nonpoorneighborhoods following prison. I did not find evidence of the opposite pathway. That is,the incarceration experience does not trap individuals in poor neighborhoods. Indeed,the residential instability tied to incarceration and reentry seems to result in movementbetween neighborhoods of varying quality, but the downward trend is stronger than theupward trend.
Second, there is significant racial variation in the effect of incarceration on downwardneighborhood mobility, both initially and across time. Previous research has establishedthat minority households encounter barriers limiting their locational attainment. My re-sults show, however, that formerly incarcerated whites lose their housing market advan-tage over minority households. Indeed, only whites with a history of incarceration aresignificantly more likely than their never-incarcerated counterparts to experience down-ward neighborhood mobility. In addition to racial variation in the average effect of in-carceration, the results also show that patterns of downward neighborhood mobility playout differently for formerly incarcerated whites, blacks, and Hispanics across time. ForAfrican Americans with a history of incarceration, the likelihood of downward mobilityincreases as they spend longer periods of time released from incarceration. Thus, whileblacks with a history of incarceration are not significantly more likely than blacks with-out a history of incarceration to initially move to poor neighborhoods, their locationalattainment patterns start to diverge across time.
This pattern of racial variation provides additional evidence that average effects of in-carceration documented in the literature mask important nuances in the ways that incar-ceration reinforces and creates inequality. Because of exiting racial residential inequality,whites are said to have the most to lose through incarceration (Massoglia et al. 2013).That is, the residential trajectories of nonwhites are less affected following incarcerationbecause of preincarceration neighborhood stratification across racial groups. Indeed,and consistent with recent research, my results show that formerly incarcerated whitesare, at least initially, most affected by a spell of incarceration. But over the long-term,however, the mark of incarceration remains a sticky barrier for nonwhites, making it dif-ficult for formerly incarcerated minorities to avoid poor neighborhoods. Ultimately, theracial residential inequality observed before prison is reinforced in the years followingprison as formerly incarcerated whites become less likely and formerly incarcerated non-whites more likely to leave nonpoor neighborhoods.
What are we to make of these trends? Research on incarceration and families has shownthat incarceration is most consequential for those families with the lowest propensity ofexperiencing the event in the first place (Turney 2014; Turney and Wildeman 2013).Perhaps a similar dynamic plays out in terms of neighborhoods. Incarceration rates vary
438

INCARCERATION AND RESIDENTIAL MOBILITY DESTINATIONS
widely by race, and minority neighborhoods experience much more criminal justice con-tact than white neighborhoods (Sampson 2012). A criminal conviction, and the resultingstigma, may make it harder for white residents to avoid neighborhoods that fall outside oftheir typical preferences (Bader and Krysan 2015; Krysan and Bader 2009). It is still thecase, however, that formerly incarcerated whites are not especially disadvantaged com-pared to minority respondents with or without a history of incarceration (see Figure 1).Initial similarities in downward mobility quickly diverge as formerly incarcerated whites,African Americans, and Hispanics spend more time out of prison. Thus, the compoundeddisadvantage of incarceration and race grows across time, as opposed to the gradualdownward trend for whites. Others have noted how incarceration damages attachmentsto stabilizing institutions, ultimately helping to perpetuate residential inequality (Alexan-der 2012; Goffman 2014). Formerly incarcerated blacks are the least likely to see initialincreases in residential mobility decline across time (see Warner 2015), and this appearsto increasingly lead them into poor neighborhoods.
These results add to a growing body of research documenting the link between incar-ceration and residential outcomes. There are, however, some limitations that should beaddressed by additional research. The NLSY79 is commonly used to examine deleteriousoutcomes associated with incarceration, but the data provide only limited criminal jus-tice information. The data lack criminal history or conviction information; an importantshortcoming because some offenses (sex offenses especially) trigger residential restric-tions. Furthermore, because the incarceration measures are derived from residential in-dicators taken at each survey, start dates, end dates, and method of release are unknown.Individuals released on parole supervision often face housing restrictions that includewhere and with whom they may live (Petersilia 2003). Some offenders are also releasedto transitional housing, such as a halfway house. Postrelease restrictions and stipulationscould create upward or downward mobility by default. To have confidence in the re-sults found here, additional research should examine locational attainment with moredetailed criminal justice data.
Even with these limitations, results from this study have important implications forexisting knowledge on mobility, attainment, and life after release from prison. Neigh-borhoods are a core organizing feature of American life, and neighborhood quality istied to a number of important indicators of well-being (Sampson et al. 2002). This ex-tends to the reentry process, as returning citizens who reside in poor and disadvantagedneighborhoods after prison have elevated recidivism rates (Hipp et al. 2010a; Kubrin andStewart 2006). This association should be further examined given the apparent contribu-tion of incarceration to downward mobility. Researchers should also ask if the postprisonresidential context contributes to the later life consequences of incarceration. For ex-ample, incarceration damages both mental and physical health functioning (Massoglia2008; Schnittker and John 2007). Residents of disadvantaged neighborhoods (in whichex-inmates are disproportionately located) also suffer from poor health outcomes (Ross2000; Ross and Mirowsky 2001). Additional research is needed to determine what roleneighborhood quality plays in the well-being of citizens with a history of incarceration.Finally, given the impact of incarceration on families (Massoglia et al. 2011; Turney andWildeman 2013), and to the extent that mobility is a household decision (Rossi 1980;Speare 1974), future research should examine if postprison mobility patterns are a func-tion of shifting family dynamics (such as divorce) during or following incarceration.
439

CITY & COMMUNITY
These results also speak to the potential impact of incarceration on larger patterns ofracial residential inequality. In some cases, such as the labor market, incarceration worksto mask inequality by removing a disproportionate number of low-skill black males fromofficial data sources (Pettit 2012; Western and Pettit 2005). In this case, however, incar-ceration might work to reduce residential inequality by channeling formerly incarceratedwhites into poor and minority neighborhoods. The next logical question, then, is what(if any) impact this pattern has on aggregate residential inequality? The answer to thisquestion depends on a combination of where released prisoners go and in what con-centration. Approximately 600,000 individuals are released from prison each year, wherethey join about 6 million former prisoners already living in neighborhoods and commu-nities (Uggen et al. 2006). Thus, as a share of the total U.S. population, these correctionalflows might not have a large average effect on residential inequality, but may profoundlyimpact those neighborhoods and communities where incarceration and reentry are geo-graphically clustered (Burch 2013).
Finally, to the extent that postprison mobility and neighborhood quality are tied to re-cidivism, these findings could help direct housing-based reentry interventions. Address-ing individual needs for employment or substance abuse treatment can be complicatedwithout a stable residential situation (Bradley et al. 2001). Furthermore, while a resi-dential move after prison can help facilitate successful reentry (Kirk 2009), too muchmobility is a risk factor for recidivism (Steiner et al. 2015). This is especially the case forparolees living in disadvantaged neighborhoods (Kubrin and Stewart 2006), and my find-ings provide further evidence that incarceration makes it difficult to avoid these types ofenvironments. Thus, policymakers and practitioners must navigate a fine line in termsof postprison housing. It is important to help returning citizens find stable housing inneighborhoods that will help them address their distinct and diverse needs.
Notes
1In supplementary models I replicated my results using alternative definitions of poor and nonpoor neigh-
borhoods (including 30 and 40 percent cut-off points). The results were largely consistent with those presented
in Tables 3 and 4, but it should be noted that the interactions between incarceration history and race-ethnicity
are only observed using the 20-percent poverty definition (results available upon request).2Neighborhood of origin poverty rates are restricted by the outcome. It is necessarily less than 20 percent
when examining downward mobility and greater than 20 percent in examining upward mobility.3Two additional controls are included but not presented. First, because the timing of the interviews shifts af-
ter 1994, I include a dummy variable coded 1 for all observations after 1994. Second, because never-incarcerated
respondents remain in the models and contribute to the parameter estimates, I include a dummy variable
coded 1 if the respondent was never interviewed in prison.4Respondents who make moves cross county or state boundaries are omitted from the analyses. This is done
to maintain the focus on local moves, as opposed to internal migration. The treatment of extra-local moves
does not impact the pattern of results, as the effect of incarceration is consistent for both within-county and
between-county moves.5It is important to note that individuals who go to prison may disproportionately select themselves (or are
selected) into poor neighborhoods. However, supplementary analyses suggest that any selection effects are not
biasing the results. I replicated all models using only the “at-risk” sample, or those who experience incarcera-
tion at some point across the nearly 30 years of data collection. While there is some loss of significance with
440

INCARCERATION AND RESIDENTIAL MOBILITY DESTINATIONS
the reduced number of observations, the main effects and interactions are consistent with those plotted in
Figure 1.
REFERENCES
Alba, Richard D., and John R. Logan. 1993. “Minority Proximity to Whites in Suburbs: An Individual-LevelAnalysis of Segregation.” American Journal of Sociology 98(6):1388–427.
Alexander, Michelle. 2012. The New Jim Crow: Mass Incarceration in the Age of Colorblindness. New York, NY: TheNew Press.
Bader, Michael, and Maria Krysan. 2015. “Community Attraction and Avoidance in Chicago: What’s Race Gotto Do with It?” The Annals of the American Academy of Political and Social Science 660(1):261–81.
Beckett, Katherine, and Steve Herbert. 2010. Banished: The New Social Control in Urban America. New York: OxfordUniversity Press.
Bradley, Katharine H., R.B. Michael Oliver, Noel C. Richardson, and Elspeth M. Slayter. 2001. No Place LikeHome: Housing and the Ex-Prisoner. Boston, MA: Community Resources for Justice.
Briggs, Xavier de Souza, and Benjamin J. Keys. 2009. “Has Exposure to Poor Neighborhoods Changed in Amer-ica? Race, Risk and Housing Locations in Two Decades.” Urban Studies 46:429–58.
Burch, Traci. 2013. Trading Democracy for Justice: Criminal Convictions and the Decline of Neighborhood Political Partic-ipation. Chicago: University of Chicago Press.
Cahill, Meagan, and Nancy S. Landale. 2008. “Residential Mobility and Drug Use Among Parolees in San Diego,California and Implications for Policy.” Pp. 85–115 in Geography and Drug Addiction, edited by Yonette F.Thomas, Douglas Richardson, and Ivan Cheung. Amsterdam, the Netherlands: Springer.
Carson, Ann E. 2014. Prisoners in 2013. Washington, DC: Bureau of Justice Statistics.Charles, Camille. 2003. “The Dynamics of Racial Residential Segregation.” Annual Review of Sociology 29:167–207.Clark, William A.V., and Suzanne Davies Withers. 2008. “Family migration and mobility sequences in the United
States: Spatial mobility in the context of the life course.” Demographic Research 17:591–622.Coulter, Rory, and Maarten van Ham. 2013. “Following People Through Time: An Analysis of Individual Resi-
dential Mobility Biographies.” Housing Studies 28(7):1037–55.Crowder, Kyle D., and Scott J. South. 2005. “Race, Class, and Changing Patterns of Migration Between Poor and
Nonpoor Neighborhoods.” American Journal of Sociology 110(6):1715–63.———, ———, and Eric Chavez. 2006. “Wealth, Race, and Inter-neighborhood Migration.” American Sociological
Review 71(1):72–94.Dwyer, Rachel E. 2012. “Contained Dispersal: The Deconcentration of Poverty in US Metropolitan Areas in the
1990s.” City & Community 11(3):309–31.Geller, Amanda, and Marah A. Curtis. 2011. “A Sort of Homecoming: Incarceration and the Housing Security
of Urban Men.” Social Science Research 40(4):1196–213.Glaze, Lauren E. 2011. “Correctional Population in the United States, 2010.” Bureau of Justice Statistics.Goffman, Alice. 2014. On the Run: Fugitive Life in an American City. Chicago: University of Chicago Press.Gramlich, Edward, Deborah Laren, and Naomi Sealand. 1992. “Moving Into and Out of Poor Urban Areas.”
Journal of Policy Analysis and Management 11(2):273–87.Hipp, John R., Joan Petersilia, and Susan Turner. 2010a. “Parolee Recidivism in California: The Effect of Neigh-
borhood Context and Social Service Agency Characteristics.” Criminology 48(4):948–79.———, Susan Turner, and Jesse Jannetta. 2010b. “Are Sex Offenders Moving into Social Disorganization?
Analyzing the Residential Mobility of California Parolees.” Journal of Research in Crime and Delinquency 47(4):558–90.
Hughes, Mark A. 1990. “Formation of the Impacted Ghetto: Evidence From Large Metropolitan Areas: 1970-1980.” Urban Geography 11:265–84.
Jargowsky, Paul A. 1997. Poverty and Place: Ghettos, Barrios, and the American City. New York: Russell SageFoundation.
———, and Mary Jo Bane. 1991. “Ghetto Poverty in the United States, 1970-1980.” In Christopher Jencks andPaul E. Peterson (eds.), The Urban Underclass, pp. 235–73. Washington, DC: Brookings Institution.
Kirk, David S. 2009. “A Natural Experiment of Residential Change and Recidivism: Lessons from HurricaneKatrina.” American Sociological Review 74(3):484–505.
Krysan, Maria, and Michael D.M. Bader. 2009. “Racial Blind Spots: Black-White-Latino Differences in Commu-nity Knowledge.” Social Problems 56(4):677–701.
441

CITY & COMMUNITY
———, Mick P. Couper, Reynolds Farley, and Tyrone A. Forman. 2009. “Does Race Matter in NeighborhoodPreferences? Results from a Video Experiment.” American Journal of Sociology 115(2):527–59.
Kubrin, Charis E., and Eric A. Stewart. 2006. “Predicting Who Reoffends: The Neglected Role of NeighborhoodContext in Recidivism Studies.” Criminology 44(1):165–97.
La Vigne, Nancy G., and Barbara Parthasarathy. 2005. Returning Home Illinois Policy Brief: Prisoner Reentry andResidential Mobility. Washington, DC: Urban Institute.
La Vigne, Nancy G., Christy Visher, and Jennifer Castro. 2004. Chicago Prisoners’ Experiences Returning Home.Washington, DC: Urban Institute.
Landale, Nancy S., and Avery M. Guest. 1985. “Constraints, Satisfaction and Residential Mobility: Speare’s ModelReconsidered.” Demography 22(2):199–222.
Lee, Barrett A., and Matthew S. Hall. 2009. “Residential Mobility, Adulthood.” In Deborah Carr (ed.), Ency-clopedia of the Life Course and Human Development, Volume 2: Adulthood, pp. 371–77. Detroit, MI: MacmillanReference USA.
Logan, John R. 1978. “Growth, Politics, and the Stratification of Places.” American Journal of Sociology 84(2):404–16.
———, and Richard D. Alba. 1993. “Locational Returns to Human Capital: Minority Access to Suburban Com-munity Resources.” Demography 30(2):243.
———, and Harvey L. Molotch. 1987. Urban Fortunes: The Political Economy of Place. Berkeley, CA: University ofCalifornia Press.
Ludwig, Jens, Greg J. Duncan, Lisa A. Gennetian, Lawrence F. Katz, Ronald C. Kessler, Jeffrey R. Kling, and LisaSanbonmatsu. 2012. “Neighborhood Effects on the Long-Term Well-Being of Low-Income Adults.” Science337(6101):1505–10.
Lynch, James P., and William J. Sabol. 2001. Prisoner Reentry in Perspective. Washington, DC: Urban Institute.———, and ———. 2004. “Assessing the Effects of Mass Incarceration on Informal Social Control in Commu-
nities.” Criminology & Public Policy 3:267–94.Massey, Douglas S. 1985. “Ethnic Residential Segregation: A Theoretical Synthesis and Empirical Review.” Soci-
ology and Social Research 69(3):315–50.———, and Nancy A. Denton. 1993. American Apartheid: Segregation and the Making of the Underclass. Cambridge,
MA: Harvard University Press.———, Andrew B. Gross, and Kumiko Shibuya. 1994. “Migration, Segregation, and the Geographic Concentra-
tion of Poverty.” American Sociological Review 59(3):425–45.Massoglia, Michael. 2008. “Incarceration, Health, and Racial Disparities in Health.” Law & Society Review
42(2):275–306.———, Glenn Firebaugh, and Cody Warner. 2013. “Racial Variation in the Effect of Incarceration on Neighbor-
hood Attainment.” American Sociological Review 78(1):142–65.———, Brianna Remster, and Ryan D. King. 2011. “Stigma or Separation? Understanding the Incarceration-
Divorce Relationship.” Social Forces 90(1):133–55.Pager, Devah. 2003. “The Mark of a Criminal Record.” American Journal of Sociology 108(5):937–75.———. 2008. Marked: Race, Crime, and Finding Work in an Era of Mass Incarceration. Chicago: University of Chicago
Press.Petersilia, Joan. 2003. When Prisoners Come Home: Parole and Prisoner Reentry. New York: Oxford University Press
US.Pettit, Becky. 2012. Invisible Men: Mass Incarceration and the Myth of Black Progress. New York: Russell Sage Foun-
dation.———, and Christopher J. Lyons. 2009. “Incarceration and the Legitimate Labor Market: Examining Age-
Graded Effects on Employment and Wages.” Law & Society Review 43(4):725–56.———, and Bruce Western. 2004. “Mass Imprisonment and the Life Course: Race and Class Inequality in U.S.
Incarceration.” American Sociological Review 69:151–69.Quillian, Lincoln. 1999. “Migration Patterns and the Growth of High-Poverty Neighborhoods, 1970-1990.” Amer-
ican Journal of Sociology 105(1):1–37.Rosenbaum, Emily, and Samantha Friedman. 2007. The Housing Divide: How Generations of Immigrants Fare in New
York’s Housing Market. New York: NYU Press.Ross, Catherine E. 2000. “Neighborhood Disadvantage and Adult Depression.” Journal of Health and Social
Behavior 41(2):177–87.———, and John Mirowsky. 2001. “Neighborhood Disadvantage, Disorder, and Health.” Journal of Health and
Social Behavior 42(3):258–76.
442

INCARCERATION AND RESIDENTIAL MOBILITY DESTINATIONS
Rossi, Peter H. 1980. Why Families Move. Beverly Hills, CA: Sage Publications.Sampson, Robert J. 2012. Great American City: Chicago and the Enduring Neighborhood Effect. Chicago: University of
Chicago Press.———, Jeffrey D. Morenoff, and Thomas Gannon-Rowley. 2002. “Assessing ‘Neighborhood Effects’: Social Pro-
cesses and New Directions in Research.” Annual Review of Sociology 28:443–78.———, and Patrick Sharkey. 2008. “Neighborhood Selection and the Social Reproduction of Concentrated
Racial Inequality.” Demography 45(1):1–29.Schnittker, Jason, and Andrea John. 2007. “Enduring Stigma: The Long-Term Effects of Incarceration on
Health.” Journal of Health and Social Behavior 48(2):115–30.South, Scott J., and Kyle D. Crowder. 1997. “Escaping Distressed Neighborhoods: Individual, Community, and
Metropolitan Influences.” American Journal of Sociology 102(4):1040–84.———, Kyle D. Crowder, and Eric Chavez. 2005. “Exiting and Entering High-Poverty Neighborhoods: Latinos,
Blacks and Anglos Compared.” Social Forces 84(2):873–900. doi:10.1353/sof.2006.0037.———, Jeremy Pais, and Kyle Crowder. 2011. “Metropolitan Influences on Migration into Poor and Nonpoor
Neighborhoods.” Social Science Research 40(3):950–64.Speare, Alden. 1974. “Residential Satisfaction as an Intervening Variable in Residential Mobility.” Demography
11(2):173–88.———, Sidney Goldstein, and William H. Frey. 1975. Residential Mobility, Migration, and Metropolitan Change.
Cambridge, MA: Ballinger Pub. Co.Steiner, Benjamin, Matthew D. Makarios, and Lawrence F. Travis III. 2015. “Examining the Effects of Residential
Situations and Residential Mobility on Offender Recidivism.” Crime & Delinquency 61(3):375–401.Tienda, Marta. 1991. “Poor People and Poor Places: Deciphering Neighborhood Effects on Poverty Outcomes.”
Pp. 244–262 in Macro-Micro Linkages in Sociology, edited by Joan Huber. Newbury Park, CA: Sage.Turney, Kristin. 2014. “The Consequences of Paternal Incarceration for Maternal Neglect and Harsh Parent-
ing.” Social Forces 92(4):1607–36.———, and Christopher Wildeman. 2013. “Redefining Relationships Explaining the Countervailing Conse-
quences of Paternal Incarceration for Parenting.” American Sociological Review 78(6):949–79.Uggen, Christopher, Jeff Manza, and Melissa Thompson. 2006. “Citizenship, Democracy, and the Civic Reinte-
gration of Criminal Offenders.” The ANNALS of the American Academy of Political and Social Science 605(1):281–310.
Visher, Christy, and Jill Farrell. 2005. Chicago Communities and Prisoner Reentry. Washington, DC: Urban Institute.———, Vera Kachnowski, Nancy G. La Vigne, and Jeremy Travis. 2004. Baltimore Prisoners’ Experiences Returning
Home. Washington, DC: Urban Institute.Wakefield, Sara, and Christopher Uggen. 2010. “Incarceration and Stratification.” Annual Review of Sociology
36:387–406.Walmsley, Roy. 2007. World Prison Population List. 7th ed. London: UK Home Off. Res.Warner, Cody. 2015. “On the Move: Incarceration, Race, and Residential Mobility.” Social Science Research 52:
451–64.———, and Gregory Sharp. 2016. “The Short- and Long-Term Effects of Life Events on Residential Mobility.”
Advances in Life Course Research 27:1–15.Western, Bruce. 2002. “The Impact of Incarceration on Wage Mobility and Inequality.” American Sociological
Review 67(4):526–46.———. 2006. Punishment and Inequality in America. New York: Russell Sage Foundation.———, and Becky Pettit. 2005. “Black-White Wage Inequality, Employment Rates, and Incarceration.” American
Journal of Sociology 111(2):553–78.———, and Christopher Wildeman. 2009. “The Black Family and Mass Incarceration.” The ANNALS of the Amer-
ican Academy of Political and Social Science 621(1):221–42.Wilson, William Julius. 1987. The Truly Disadvantaged: The Inner City, the Underclass, and Public Policy, Second
Edition. Chicago, IL: University of Chicago Press.Zgoba, Kristen M., Jill Levenson, and Tracy McKee. 2009. “Examining the Impact of Sex Offender Residence
Restrictions on Housing Availability.” Criminal Justice Policy Review 20(1):91–110.
443